pilbara workforce development plan 2013–2016 · a useful reference when engaging on workforce...
TRANSCRIPT
Pilbara Workforce Development Alliance
Pilbara workforce development plan 2013–2016
2
Acknowledgement This plan was prepared by the Pilbara Workforce Development Alliance in collaboration with the Department of Training and Workforce Development. The alliance comprised the following individuals who generously contributed their time and expertise:
Dr Ken King (current alliance chair), Pilbara Development CommissionMr Stephen Webster (former alliance chair), Pilbara Development Commission (now Gascoyne Development Commission)Ms Deidre Willmott and Mr Ford Murray, Fortescue Metals Group LtdMs Jacky Finlayson and Mr Mark South, Small Business Development CorporationMs Lisa Taylor, Department of Regional Development and LandsMs Lyn Farrell, Pilbara InstituteDr Nancy Rees and Mr Steve Del Borrello, Pindan CollegeMs Nicole Roocke, Chamber of Minerals and EnergyMr Nigel Haywood, Resources Industry Training CouncilMr Peter Donovan, Department of Aboriginal AffairsMr Peter Jeffries, Yamatji Marlpa Aboriginal CorporationMr Robin Vandenberg, Chamber of Commerce and IndustryMs Shelley Pike, Pilbara Regional CouncilMr Stedman Ellis and Ms Roma Sharp, Australian Petroleum Production and Exploration AssociationMs Annette Newman, Australian Government Department of Education, Employment and Workplace RelationsMs Sue Cuneo and Ms Sharon McCawley, Department of EducationMr Gordon Duffy and Ms Karen Ho, Department of Training and Workforce Development
This plan and executive summary may be viewed or downloaded from www.dtwd.wa.gov.au
Title: Pilbara workforce development plan 2013–2016 ISBN 978-1-74205-127-7
© Department of Training and Workforce Development 2013
Reproduction of this work in whole or part for educational purposes, within an educational institution and on condition that it is not offered for sale, is permitted by the Department of Training and Workforce Development. This material is available upon request in alternative formats. Published by the Department of Training and Workforce Development Optima Building 16 Parkland Road Osborne Park WA 6017
For further information please contact: State Workforce Planning T: +61 8 6551 5000 Email: [email protected]
Disclaimer: This publication was prepared under the direction of the Pilbara Workforce Development Alliance and published by the Department of Training and Workforce Development. While the information contained in the publication is provided in good faith and believed to be accurate at the time of publication, appropriate professional advice should be obtained in relation to any information in this publication. Members of the alliance, the State Government and the Department of Training and Workforce Development shall in no way be liable for any loss sustained or incurred by anyone relying on the information. While every effort has been made to vet the contents of this report, it may contain references to, or images of, people who are now deceased. The Department regrets any offence this might cause.
The term ‘Aboriginal’ people in this report is inclusive of Torres Strait Islanders. It is noted that the terms ‘Aboriginal’ and ‘Indigenous’ have both been used in this report as a result of the terminology used in sourced information.
2
Pilbara workforce development plan 2013–2016
3
The Pilbara workforce development plan 2013–2016 (the plan) aims to build, attract and retain a skilled workforce to meet the economic needs of the Pilbara. It contains a range of priority actions which were identified by local stakeholders to address local workforce development challenges.
The plan aligns with the State Government’s Skilling WA – A workforce development plan for Western Australia (Skilling WA), which provides a framework for government and industry’s response to Western Australia’s skill and workforce needs.
The Pilbara Workforce Development Alliance, which is made up of industry, community and government representatives from the region, will be responsible for overseeing the implementation of the plan. The alliance will identify those actions within the plan that should be given highest priority and facilitate their implementation. Progress will be reported to stakeholders annually and be included in Skilling WA’s annual progress report.
The plan has been designed as an important reference point for all stakeholders as it identifies the challenges, agreed solutions and organisations that have a key stake in its implementation.
For the Regional Development Council, as the peak advisory body to the Western Australian Government on regional development matters, the plan is used to identify workforce issues and solutions which require policy consideration across regions. This includes guidance on Royalties for Regions initiatives to support regional workforce needs.
For local government bodies the plan identifies workforce issues to be taken into account as part of local government decision making processes.
The plan will be used by industry associations and employer peak bodies as a reference when working directly with employers to implement industry and enterprise solutions to workforce development challenges.
The plan also captures the views and aspirations of the broader community and provides a useful reference when engaging on workforce development issues across the region.
The Department of Training and Workforce Development in conjunction with the Pilbara Workforce Development Alliance will facilitate the coordination of State Government responses outlined in the plan. This will include working with those agencies and training providers designated to take the lead on priority actions in the plan.
Guide to implementation
3
4
Chapter 1: Introduction ......................................................................................................... 7Pilbara workforce development plan ....................................................................................... 7Regional workforce development plans ................................................................................... 7Methodology ............................................................................................................................. 8 Stakeholder and regional consultations ................................................................................ 8Report structure ....................................................................................................................... 9Chapter 2: Strategic context ............................................................................................... 10Skilling WA ............................................................................................................................. 10Pilbara Cities initiative ............................................................................................................ 12Chapter 3: Workforce profile .............................................................................................. 14The Pilbara region .................................................................................................................. 14Regional economy ................................................................................................................. 15 Gross regional product ........................................................................................................ 17 Pilbara industries ................................................................................................................. 18 Enterprise structure ............................................................................................................. 18 Dwelling approvals .............................................................................................................. 18 Income distribution .............................................................................................................. 20 State investment in the Pilbara ........................................................................................... 20Population demographics ...................................................................................................... 22 Age and sex structure ......................................................................................................... 24 Gender structure ................................................................................................................. 26 Household and family composition ..................................................................................... 26Regional labour market .......................................................................................................... 28 Labour force growth ............................................................................................................ 30 Unemployment trends ......................................................................................................... 30 Labour force participation .................................................................................................... 32 Employment by industry sector ........................................................................................... 33 Occupation structure ........................................................................................................... 35 Internal migration ................................................................................................................. 35 International migration ......................................................................................................... 35 Workforce supply projections .............................................................................................. 36
Contents
4
Pilbara workforce development plan 2013–2016
5
Workforce demand projections ........................................................................................... 37 Industry critical/skill shortage occupations .......................................................................... 38Education and training ........................................................................................................... 40 Education participation ........................................................................................................ 42 Highest level of schooling.................................................................................................... 43 Post school qualifications .................................................................................................... 44 Training delivery .................................................................................................................. 45 Partnerships for delivery ...................................................................................................... 45 Challenges for education and training delivery ................................................................... 45Aboriginal participation ........................................................................................................... 46 Age and gender structure .................................................................................................... 48 Labour force participation .................................................................................................... 49 Unemployment .................................................................................................................... 49 Employment by industry ...................................................................................................... 50 Education and training ......................................................................................................... 50Regional infrastructure ........................................................................................................... 50 Utility infrastructure priorities ............................................................................................... 51 Community infrastructure priorities ..................................................................................... 53 Transport infrastructure priorities ........................................................................................ 55 Key infrastructure issues and trends ................................................................................... 56Settlement pattern and land supply ....................................................................................... 59 Resident accommodation .................................................................................................. 60 Transient workforce accommodation ................................................................................ 60 Land sales ......................................................................................................................... 61 Residential land ................................................................................................................. 62
5
Chapter 4: Critical occupation shortages ......................................................................... 63Literature review ..................................................................................................................... 63Consultation findings .............................................................................................................. 66Survey evidence .................................................................................................................... 68 Respondent information ...................................................................................................... 69 Survey findings .................................................................................................................... 69Regional priority occupation list ............................................................................................. 70Chapter 5: Workforce challenges and opportunities ....................................................... 77Workforce participation .......................................................................................................... 78Migration................................................................................................................................. 80Attraction and retention .......................................................................................................... 81Skills development and utilisation .......................................................................................... 83Planning and coordination ..................................................................................................... 84Chapter 6: Strategies for workforce development ........................................................... 85Increasing workforce participation ......................................................................................... 86Skilled migration ..................................................................................................................... 93Workforce attraction and retention ......................................................................................... 94Education and training ........................................................................................................... 97A coordinated response ....................................................................................................... 101References .......................................................................................................................... 103Appendix A: Consultation list .......................................................................................... 105Appendix B: Employer survey ......................................................................................... 107Appendix C: Detailed regional priority occupation list ..................................................110
6
Pilbara workforce development plan 2013–2016

Pilbara workforce development planRecognised as the ‘engine room’ of the Australian economy, the Pilbara is undergoing significant growth and development which has generated significant demand for skilled and semi-skilled labour.
The Pilbara workforce development plan 2013–2016 (the plan) was prepared by the Pilbara Workforce Development Alliance (the alliance), in collaboration with the Department of Training and Workforce Development. Under the Skilling WA workforce planning framework, the plan is a response to the increasing demand for skilled and semi-skilled labour in the Pilbara region of Western Australia.
The key objective of the plan is to identify current and future workforce development and skills needs and develop strategies to ensure that these needs can be addressed. The development of the plan involved:
• an assessment of regional economic and demographic dynamics and the associated implications for the region’s labour market;
• an examination of labour market characteristics; • the development of labour market projections for industries and occupations;• an assessment of the factors affecting the supply of labour; and• the preparation of a workforce development action plan for the region in consultation with
a wide range of stakeholders.
Regional workforce development plansThe plan is one of nine regional workforce development plans being prepared as a key part of the Skilling WA workforce planning framework.
Each of the plans is:• aligned to the five strategic goals of Skilling WA; • used to inform the implementation and updating of Skilling WA; • a whole of government, industry and community sector approach to workforce
development in the nine regions of Western Australia;• overseen by a local workforce development alliance; and • designed to identify specific industry, government and community-sector agencies
recommended as having the ‘lead’ responsibility for coordinating strategies and projects stemming from the plans.
Introduction
7
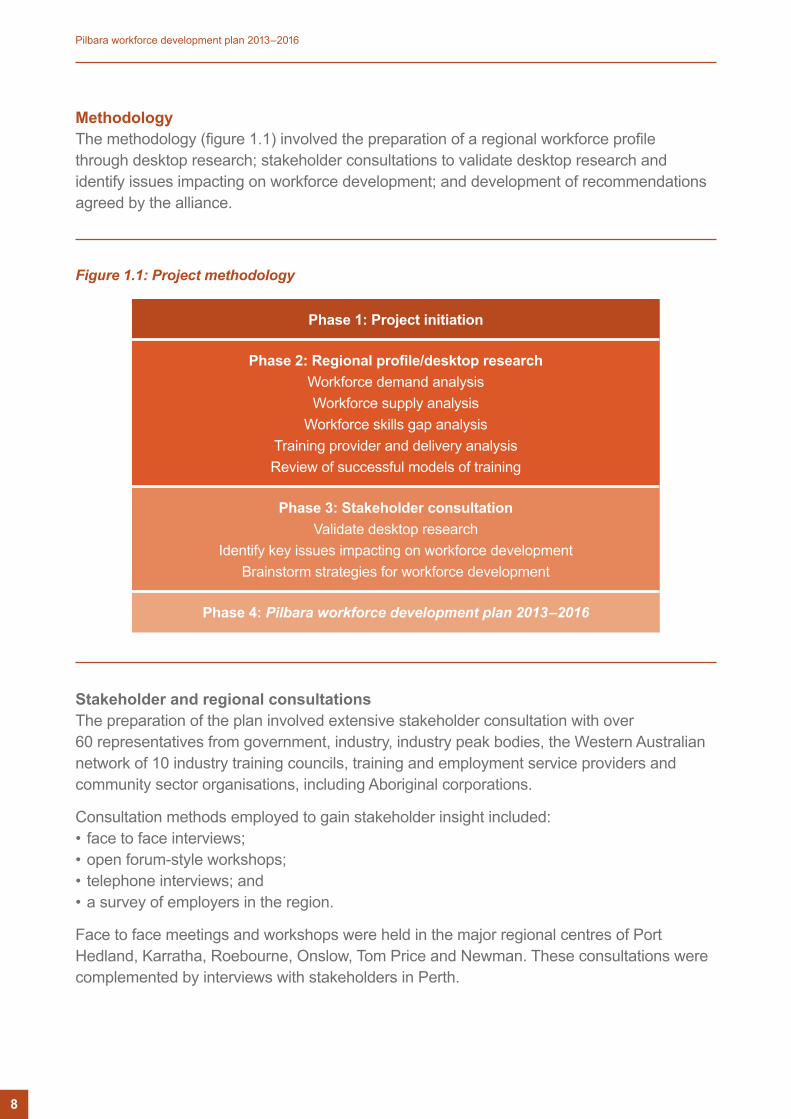
MethodologyThe methodology (figure 1.1) involved the preparation of a regional workforce profile through desktop research; stakeholder consultations to validate desktop research and identify issues impacting on workforce development; and development of recommendations agreed by the alliance.
Figure 1.1: Project methodology
Phase 1: Project initiation
Phase 2: Regional profile/desktop research Workforce demand analysis Workforce supply analysis
Workforce skills gap analysis Training provider and delivery analysis Review of successful models of training
Phase 3: Stakeholder consultation Validate desktop research
Identify key issues impacting on workforce development Brainstorm strategies for workforce development
Phase 4: Pilbara workforce development plan 2013–2016
Stakeholder and regional consultationsThe preparation of the plan involved extensive stakeholder consultation with over 60 representatives from government, industry, industry peak bodies, the Western Australian network of 10 industry training councils, training and employment service providers and community sector organisations, including Aboriginal corporations.
Consultation methods employed to gain stakeholder insight included:• face to face interviews;• open forum-style workshops;• telephone interviews; and• a survey of employers in the region.
Face to face meetings and workshops were held in the major regional centres of Port Hedland, Karratha, Roebourne, Onslow, Tom Price and Newman. These consultations were complemented by interviews with stakeholders in Perth.
8
Pilbara workforce development plan 2013–2016
Appendix A contains a list of stakeholders involved in the consultation process.
Report structureThe remainder of this plan is structured as follows:
Chapter 2: Strategic context – summarises key strategic planning documents that were contextually relevant to the preparation of a workforce development plan for the Pilbara region.
Chapter 3: Workforce profile – summarises the workforce profile. This profile sets the scene for the workforce development plan by providing an overview of key workforce challenges and trends based upon a review of best available information at the time.
Chapter 4: Critical occupation shortages – summarises all available information on critical occupational shortages in the Pilbara to arrive at a regional priority occupation list for the region. The list draws on the findings of desktop research, consultation and an employer survey.
Chapter 5: Workforce challenges and opportunities – builds on sections 3 and 4 by contextualising key workforce development issues based on the findings of the workforce profile and a comprehensive consultation process.
Chapter 6: Strategies for workforce development – outlines a series of priority actions to guide workforce development in the Pilbara over the 2013–16 period.
9
Strategic context
Key strategic planning documents that were contextually relevant to the preparation of a workforce development plan for the Pilbara are outlined as follows.
Skilling WAThe Department of Training and Workforce Development (the Department) is the lead State Government agency in Western Australia for workforce development matters. In response to the increasing demand for skilled and semi-skilled labour in Western Australia, the Department developed a whole of government plan, Skilling WA – A workforce development plan for Western Australia (Skilling WA) in 2010. It will enable all Western Australians to both contribute and benefit from the opportunities that come from sustainable economic growth.
Skilling WA is an integrated planning framework (as illustrated in diagram 2.1) designed to identify issues impacting on workforce development throughout Western Australia and recommend the required actions to address these issues. It aims to build, attract and retain the skilled workforce needed to meet the economic needs of Western Australia, by ensuring the workforce development needs of industries, regions, enterprises and those under-represented in the workforce are addressed.
Skilling WA has five strategic goals which aim to address key issues impacting on the development of the Western Australian workforce.
10
Pilbara workforce development plan 2013–2016
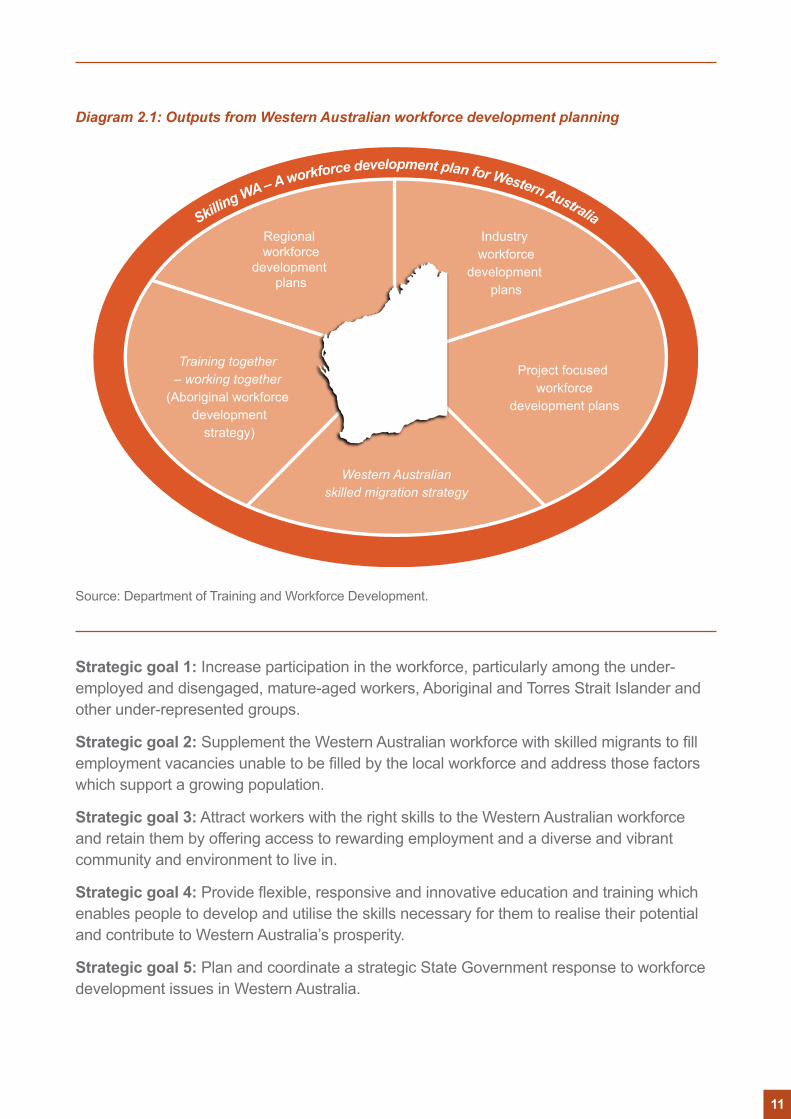
Diagram 2.1: Outputs from Western Australian workforce development planning
Skilling WA – A workforce development plan for Western Australia
Regional workforce
development plans
Industry workforce
development plans
Training together – working together
(Aboriginal workforce development
strategy)
Project focused workforce
development plans
Western Australianskilled migration strategy
Source: Department of Training and Workforce Development.
Strategic goal 1: Increase participation in the workforce, particularly among the under-employed and disengaged, mature-aged workers, Aboriginal and Torres Strait Islander and other under-represented groups.
Strategic goal 2: Supplement the Western Australian workforce with skilled migrants to fill employment vacancies unable to be filled by the local workforce and address those factors which support a growing population.
Strategic goal 3: Attract workers with the right skills to the Western Australian workforce and retain them by offering access to rewarding employment and a diverse and vibrant community and environment to live in.
Strategic goal 4: Provide flexible, responsive and innovative education and training which enables people to develop and utilise the skills necessary for them to realise their potential and contribute to Western Australia’s prosperity.
Strategic goal 5: Plan and coordinate a strategic State Government response to workforce development issues in Western Australia.
11
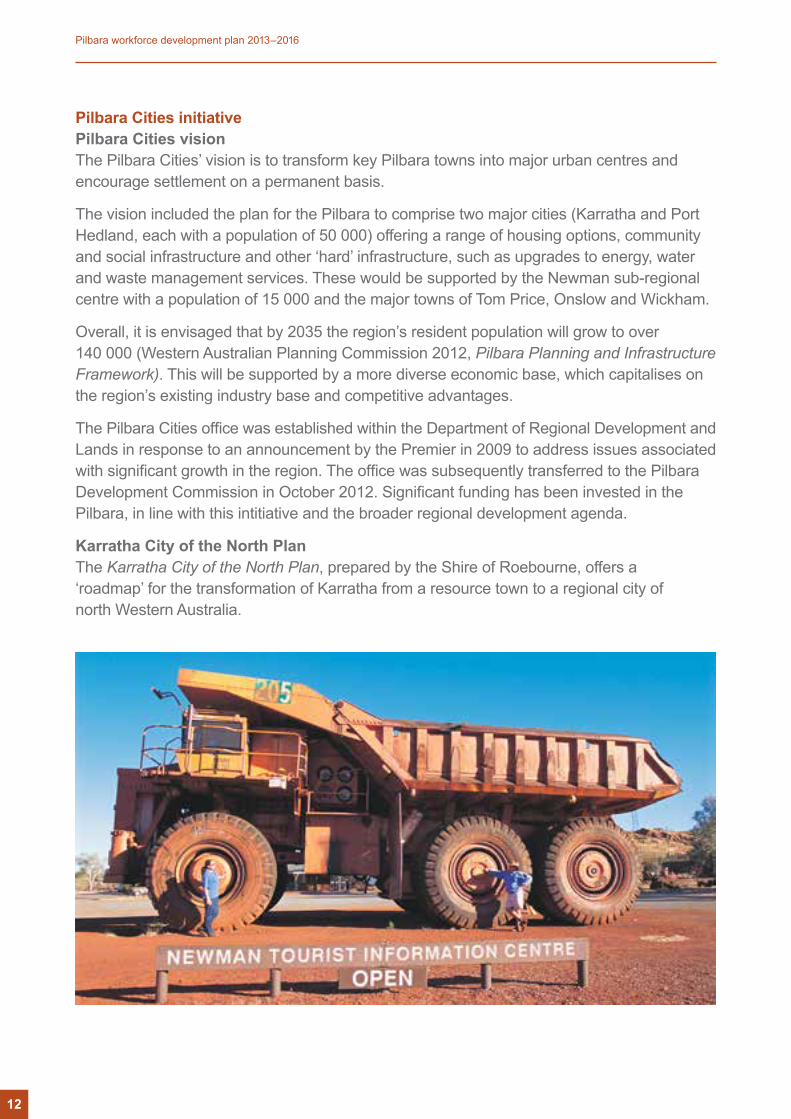
Pilbara Cities initiativePilbara Cities visionThe Pilbara Cities’ vision is to transform key Pilbara towns into major urban centres and encourage settlement on a permanent basis.
The vision included the plan for the Pilbara to comprise two major cities (Karratha and Port Hedland, each with a population of 50 000) offering a range of housing options, community and social infrastructure and other ‘hard’ infrastructure, such as upgrades to energy, water and waste management services. These would be supported by the Newman sub-regional centre with a population of 15 000 and the major towns of Tom Price, Onslow and Wickham.
Overall, it is envisaged that by 2035 the region’s resident population will grow to over 140 000 (Western Australian Planning Commission 2012, Pilbara Planning and Infrastructure Framework). This will be supported by a more diverse economic base, which capitalises on the region’s existing industry base and competitive advantages.
The Pilbara Cities office was established within the Department of Regional Development and Lands in response to an announcement by the Premier in 2009 to address issues associated with significant growth in the region. The office was subsequently transferred to the Pilbara Development Commission in October 2012. Significant funding has been invested in the Pilbara, in line with this intitiative and the broader regional development agenda.
Karratha City of the North PlanThe Karratha City of the North Plan, prepared by the Shire of Roebourne, offers a ‘roadmap’ for the transformation of Karratha from a resource town to a regional city of north Western Australia.
12
Pilbara workforce development plan 2013–2016
The vision for Karratha is ‘A liveable, compact, Regional City of 50 000+ people, with a diversified economy, a healthy local community which demonstrates demographic balance, affordability, high quality amenity, and infrastructure. It is a place of choice, to work, visit, grow up, raise families and age gracefully’ (Shire of Roebourne 2010).
The plan provides a range of strategies along with an estimate of the investment required by government and the private sector to achieve the shared Pilbara Cities vision for Karratha. A key component of the plan is to diversify the economic base and lower the cost of living, particularly with respect to housing costs.
Pilbara’s Port City Growth PlanThe Pilbara’s Port City Growth Plan provides high level strategies to facilitate the sustained growth of Port Hedland to be Pilbara’s ‘port city’ with a population of up to 50 000 people by 2031.
The plan is based on the vision that Port Hedland will be ‘A nationally significant, friendly city, where people want to live and are proud to call home’ (Town of Port Hedland, March 2012). The vision is supported by five core themes:• sustained and diversified economic growth;• strengthening local communities and culture;• housing diversity and land supply capacity; • environmental protection and change adaptation; and• building and maintaining infrastructure capacity.
Implications for workforce planningA core theme of the Pilbara Cities vision, as well as ensuring growth plans for Karratha and the Town of Port Hedland, is to transform the Pilbara from a region of cyclical economic activity linked to energy and natural resource investments to a more balanced and sustainable economy and community. Key commonalities in both growth plans include:• economic diversification; • housing diversity and affordability; and• provision of a high level of social and community services to standards comparable to other
metropolitan areas.
It is important to recognise that the above three domains are interlinked. Economic diversification can only occur if appropriate skills are available. Appropriate skills for economic diversification cannot be attracted or retained without the availability of sufficient housing at affordable prices and without the provision of adequate community services. Similarly, provision of high quality community services and sufficient affordable housing, will require an appropriately skilled labour force.
In this sense, this Pilbara workforce development plan 2013–2016 is critical to the successful delivery of the Pilbara Cities vision and the respective growth plans.
13
Workforce profile
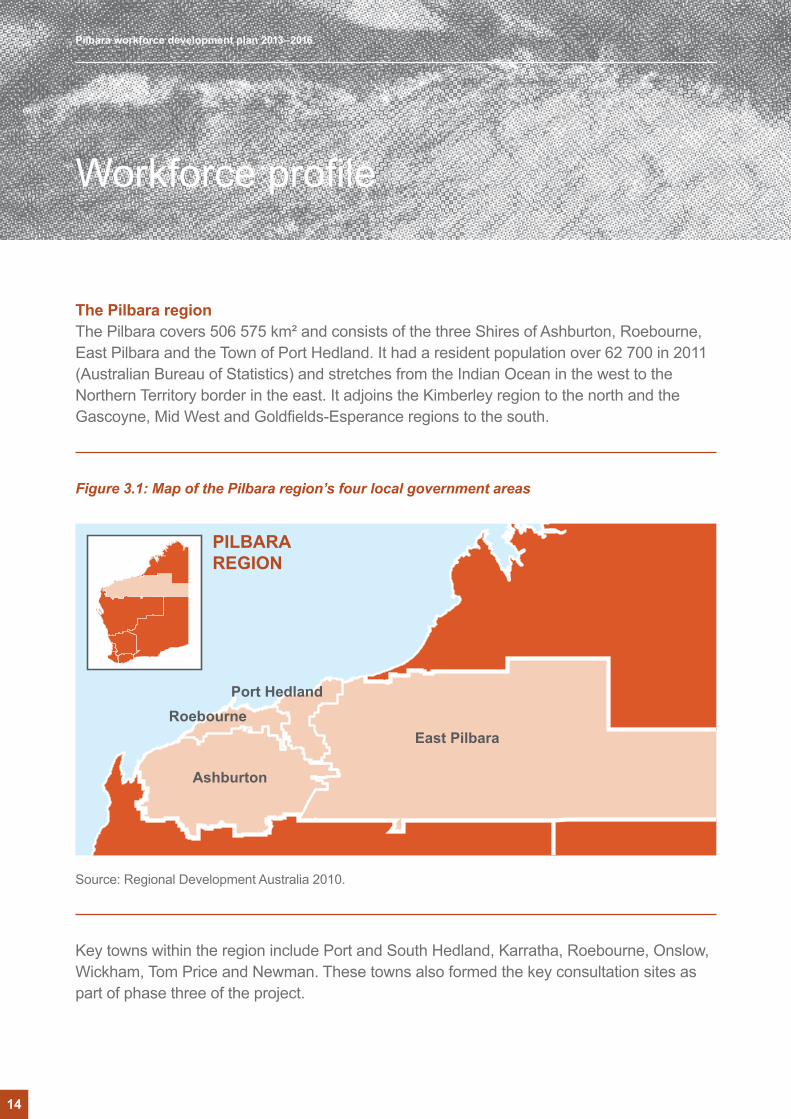
The Pilbara regionThe Pilbara covers 506 575 km² and consists of the three Shires of Ashburton, Roebourne, East Pilbara and the Town of Port Hedland. It had a resident population over 62 700 in 2011 (Australian Bureau of Statistics) and stretches from the Indian Ocean in the west to the Northern Territory border in the east. It adjoins the Kimberley region to the north and the Gascoyne, Mid West and Goldfields-Esperance regions to the south.
Figure 3.1: Map of the Pilbara region’s four local government areas
Source: Regional Development Australia 2010.
Port Hedland
East Pilbara
Ashburton
Roebourne
PILBARAREGION
Key towns within the region include Port and South Hedland, Karratha, Roebourne, Onslow, Wickham, Tom Price and Newman. These towns also formed the key consultation sites as part of phase three of the project.
14
Pilbara workforce development plan 2013–2016
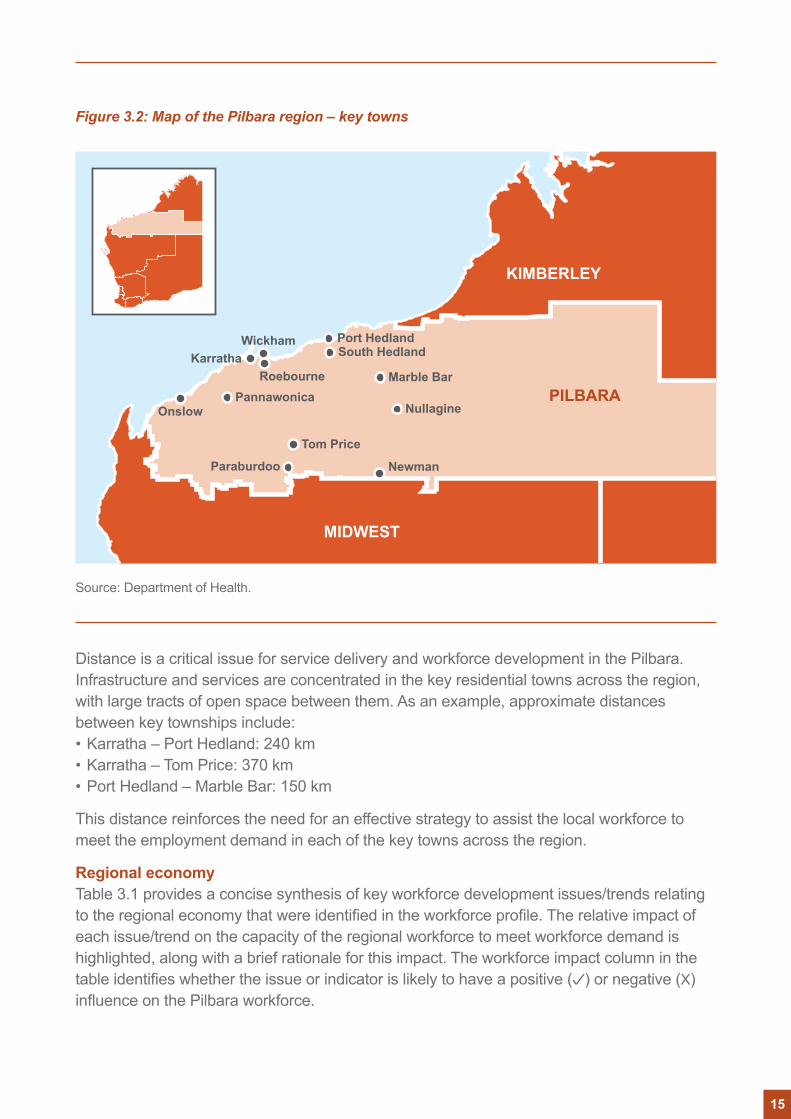
Figure 3.2: Map of the Pilbara region – key towns
Source: Department of Health.
Distance is a critical issue for service delivery and workforce development in the Pilbara. Infrastructure and services are concentrated in the key residential towns across the region, with large tracts of open space between them. As an example, approximate distances between key townships include:• Karratha – Port Hedland: 240 km• Karratha – Tom Price: 370 km• Port Hedland – Marble Bar: 150 km
This distance reinforces the need for an effective strategy to assist the local workforce to meet the employment demand in each of the key towns across the region.
Regional economyTable 3.1 provides a concise synthesis of key workforce development issues/trends relating to the regional economy that were identified in the workforce profile. The relative impact of each issue/trend on the capacity of the regional workforce to meet workforce demand is highlighted, along with a brief rationale for this impact. The workforce impact column in the table identifies whether the issue or indicator is likely to have a positive ( ) or negative (X) influence on the Pilbara workforce.
MIDWEST
KIMBERLEY
PILBARA
Port HedlandSouth Hedland
Marble Bar
Nullagine
NewmanParaburdoo
Tom Price
PannawonicaOnslow
Roebourne
WickhamKarratha
15
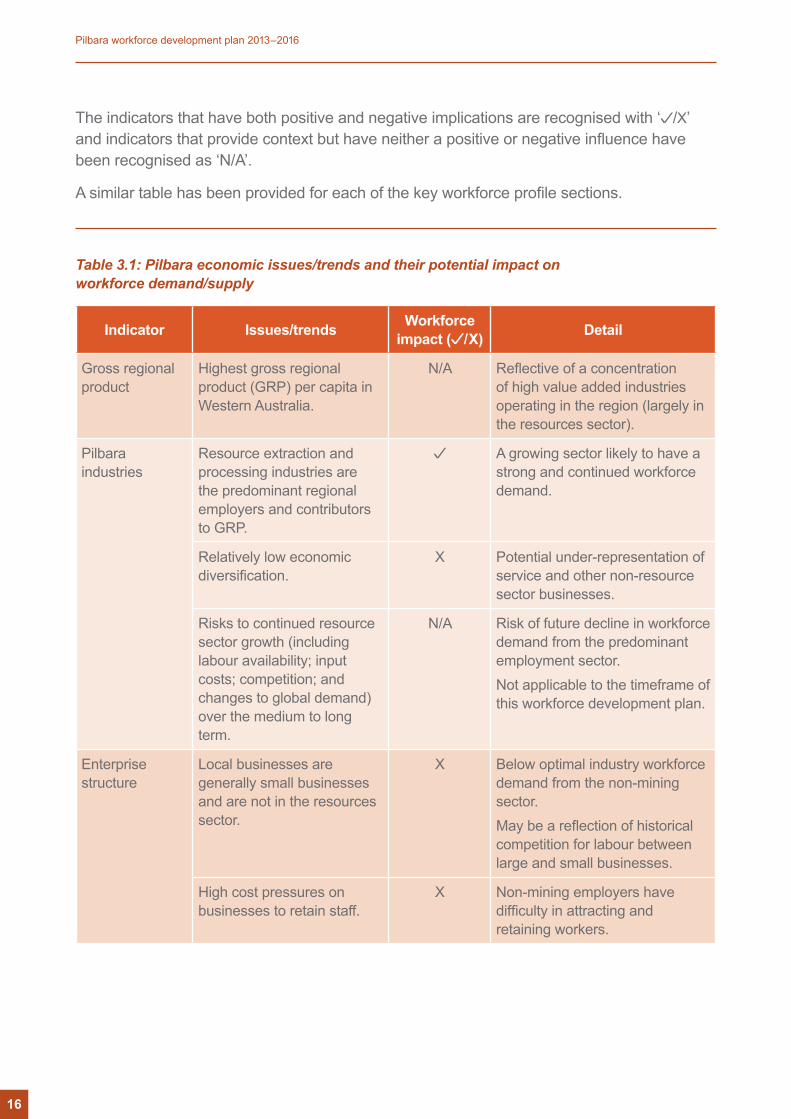
The indicators that have both positive and negative implications are recognised with ‘ /X’ and indicators that provide context but have neither a positive or negative influence have been recognised as ‘N/A’.
A similar table has been provided for each of the key workforce profile sections.
Table 3.1: Pilbara economic issues/trends and their potential impact on workforce demand/supply
Indicator Issues/trends Workforce impact ( /X) Detail
Gross regional product
Highest gross regional product (GRP) per capita in Western Australia.
N/A Reflective of a concentration of high value added industries operating in the region (largely in the resources sector).
Pilbara industries
Resource extraction and processing industries are the predominant regional employers and contributors to GRP.
A growing sector likely to have a strong and continued workforce demand.
Relatively low economic diversification.
X Potential under-representation of service and other non-resource sector businesses.
Risks to continued resource sector growth (including labour availability; input costs; competition; and changes to global demand) over the medium to long term.
N/A Risk of future decline in workforce demand from the predominant employment sector.Not applicable to the timeframe of this workforce development plan.
Enterprise structure
Local businesses are generally small businesses and are not in the resources sector.
X Below optimal industry workforce demand from the non-mining sector.May be a reflection of historical competition for labour between large and small businesses.
High cost pressures on businesses to retain staff.
X Non-mining employers have difficulty in attracting and retaining workers.
16
Pilbara workforce development plan 2013–2016
Indicator Issues/trends Workforce impact ( /X) Detail
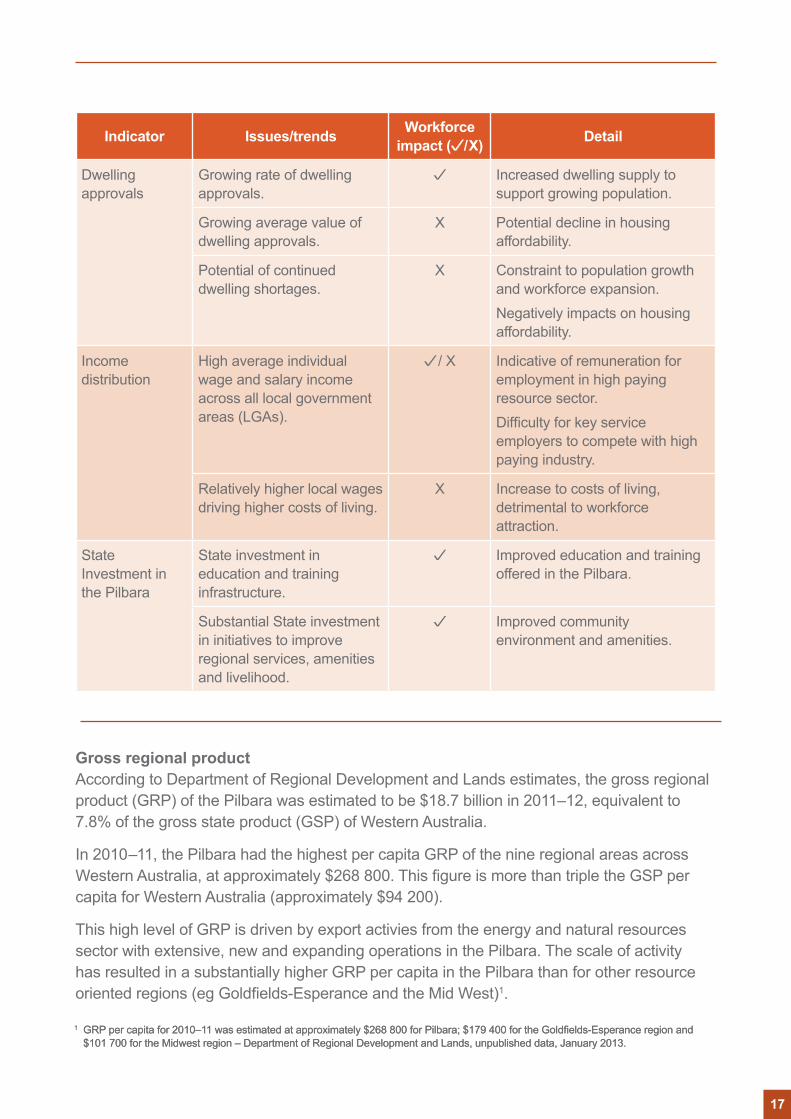
Dwelling approvals
Growing rate of dwelling approvals.
Increased dwelling supply to support growing population.
Growing average value of dwelling approvals.
X Potential decline in housing affordability.
Potential of continued dwelling shortages.
X Constraint to population growth and workforce expansion.Negatively impacts on housing affordability.
Income distribution
High average individual wage and salary income across all local government areas (LGAs).
/ X Indicative of remuneration for employment in high paying resource sector. Difficulty for key service employers to compete with high paying industry.
Relatively higher local wages driving higher costs of living.
X Increase to costs of living, detrimental to workforce attraction.
State Investment in the Pilbara
State investment in education and training infrastructure.
Improved education and training offered in the Pilbara.
Substantial State investment in initiatives to improve regional services, amenities and livelihood.
Improved community environment and amenities.
Gross regional productAccording to Department of Regional Development and Lands estimates, the gross regional product (GRP) of the Pilbara was estimated to be $18.7 billion in 2011–12, equivalent to 7.8% of the gross state product (GSP) of Western Australia.
In 2010–11, the Pilbara had the highest per capita GRP of the nine regional areas across Western Australia, at approximately $268 800. This figure is more than triple the GSP per capita for Western Australia (approximately $94 200).
This high level of GRP is driven by export activies from the energy and natural resources sector with extensive, new and expanding operations in the Pilbara. The scale of activity has resulted in a substantially higher GRP per capita in the Pilbara than for other resource oriented regions (eg Goldfields-Esperance and the Mid West)1.
1 GRP per capita for 2010–11 was estimated at approximately $268 800 for Pilbara; $179 400 for the Goldfields-Esperance region and $101 700 for the Midwest region – Department of Regional Development and Lands, unpublished data, January 2013.
1 GRP per capita for 2010–11 was estimated at approximately $268 800 for Pilbara; $179 400 for the Goldfields-Esperance region and $101 700 for the Midwest region – Department of Regional Development and Lands, unpublished data, January 2013.
17
Pilbara industriesThe Pilbara is an economy dominated by the extraction, processing and export of minerals and hydrocarbons. It is the core mining region of the State, with almost half of the State’s mining (in terms of value) occurring in this region. Iron ore dominates production and accounts for 93.3% of regional mining production, with the remainder comprising manganese, copper, salt, gold and silver. Industry production in the region was valued at $34.5 billion in 2009–10, accounting for just under half of the State’s total mineral production (Department of Regional Development and Lands 2011a).
In addition, the Pilbara is the base of Australia’s largest offshore oil and gas reserves located in the Carnarvon Basin. This is the State’s second most valuable resource (by value of production) after iron ore. According to the Pilbara Development Commission (2012), sale of oil and gas from the Basin generated $23 billion in revenue in 2011.
Other industries that contribute to regional production include construction, manufacturing, retail, tourism and agriculture. However, the output of these industries pales in comparison to iron ore.
Enterprise structureThere were 2283 businesses registered in the Pilbara in June 2007 (Australian Bureau of Statistics 2010)2, with nearly half of these located in the Shire of Roebourne.
Despite the high production value and large numbers of people employed by the mining industry, the mining sector accounts for only 2.2% (51 registrations) of the 2283 registered businesses in the Pilbara. This is likely due to the capital intensity of the mining industry, which tends to be dominated by a relatively small number of large corporations with headquarters based outside of the Pilbara region.
By comparison, the construction industry (which is frequently dependent on the mining industry for contracts) accounts for the greatest number of business registrations (549 businesses, 24%) and employs 13% of workers in the region.
Other prominent industries, represented by locally registered businesses include: property and business services (417 businesses, 18% of all local businesses); retail trade (297 businesses, 13% of all local businesses); and transport and storage (174 businesses, 8% of all local businesses).
Of these businesses, 56% (1287) employed no staff (for example, were owner operator businesses or individual ABN registrations) and a further 24% (546 businesses) employed between one and four staff.
Dwelling approvalsDwelling approvals are a lead indicator for population growth and generally a broad indicator of business and consumer confidence. The strong growth in approvals is indicative of a growing regional workforce and an expanding construction industry.
2 Data for the number of registered businesses in the Town of Port Hedland and the Shire of East Pilbara was excluded from ABS reporting. These figures are, however, represented in the total number of business registrations for the Pilbara.
18
Pilbara workforce development plan 2013–2016
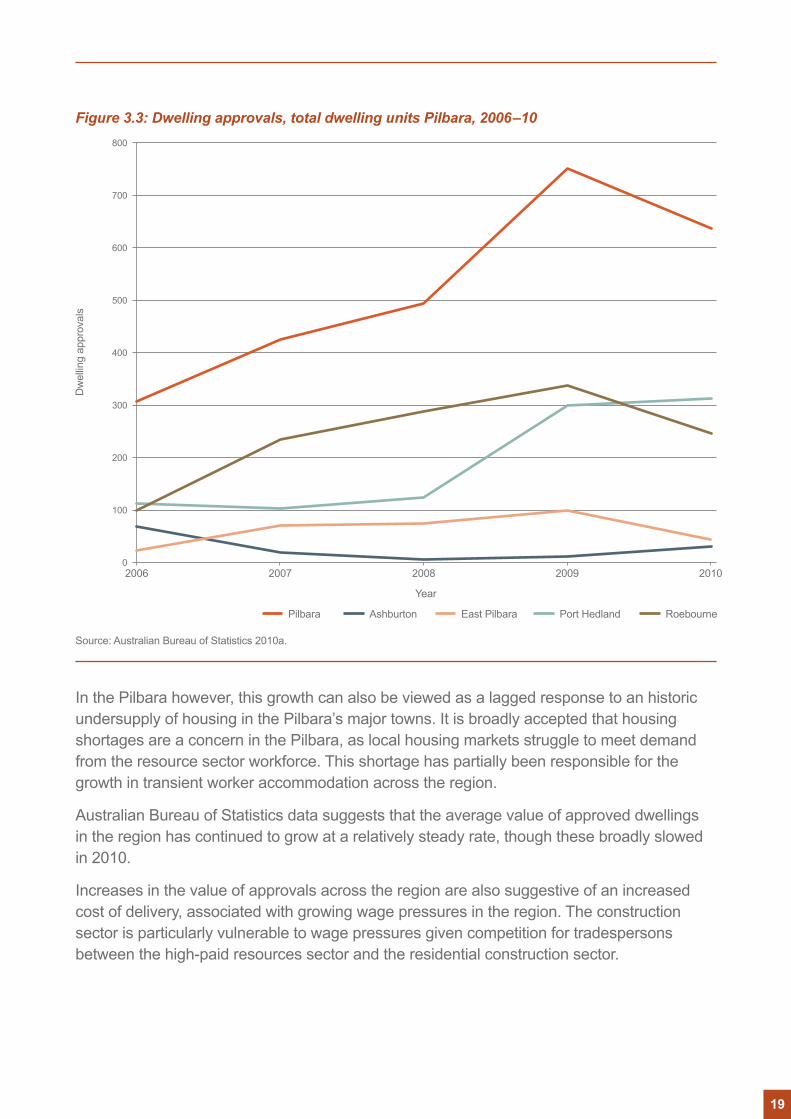
In the Pilbara however, this growth can also be viewed as a lagged response to an historic undersupply of housing in the Pilbara’s major towns. It is broadly accepted that housing shortages are a concern in the Pilbara, as local housing markets struggle to meet demand from the resource sector workforce. This shortage has partially been responsible for the growth in transient worker accommodation across the region.
Australian Bureau of Statistics data suggests that the average value of approved dwellings in the region has continued to grow at a relatively steady rate, though these broadly slowed in 2010.
Increases in the value of approvals across the region are also suggestive of an increased cost of delivery, associated with growing wage pressures in the region. The construction sector is particularly vulnerable to wage pressures given competition for tradespersons between the high-paid resources sector and the residential construction sector.
Figure 3.3: Dwelling approvals, total dwelling units Pilbara, 2006–10
Dw
ellin
g ap
prov
als
600
500
800
700
400
200
300
100
0
Source: Australian Bureau of Statistics 2010a.
Ashburton East Pilbara Port Hedland RoebournePilbara
Year
2006 2007 2008 2009 2010
19
Income distributionAverage salary income in the Pilbara is substantially higher than that of the State as a whole and is growing at a relatively faster pace. According to the Australian Bureau of Statistics (2010b), Pilbara residents had an average wage and salary income of $67 610, compared with $46 199 for the average Western Australian in 2009. This disparity grew over the 2006–09 period, with Pilbara wages increasing at an average annual rate of 8.9%. This growth was primarily driven by wage increases in the Shire of Roebourne, where wages increased at a rate of 10% per annum, growing to an average of $77 692 in 2009.
High average income estimates in the Pilbara are driven by a heavily skewed income distribution. While there are relatively similar levels of low income earners across the Pilbara and Western Australia, there is significant divergence in the number of low to middle income earners (under-represented in the Pilbara) and high income earners (over-represented in the Pilbara).
This is reflective of the skewed employment profile in the region (heavily skewed toward the higher wage resources sector) and as noted in the Regional labour market section, has the potential to crowd-out employers in other sectors that are unable to compete with the high pay currently available in these industries.
State investment in the PilbaraSignificant State funding has been invested in the Pilbara, in line with the State Government’s Pilbara Cities initiative and broader regional development agenda. In 2010–11, the State Government contributed $335 million in Royalties for Regions funding to the region. This accounted for 46% of regional funding across the State. By comparison, regional funding to the Kimberley accounted for 20% of Royalties for Region’s funding and all other regions received 10% or less.
The State Government budget for 2011–12 allocated $254.5 million for investment in the Pilbara. Similar to the 2010–11 allocation, capital investment continues to be provided for key utility, education, transport and key service infrastructure investments.
These investments align strongly with Skilling WA through their capacity to offer potential employees a ‘diverse and vibrant community and environment to live in’. Education investments also increase the capacity of the local State Training Provider, Pilbara Institute, to provide ‘flexible, responsive and innovative education’.
20
Pilbara workforce development plan 2013–2016
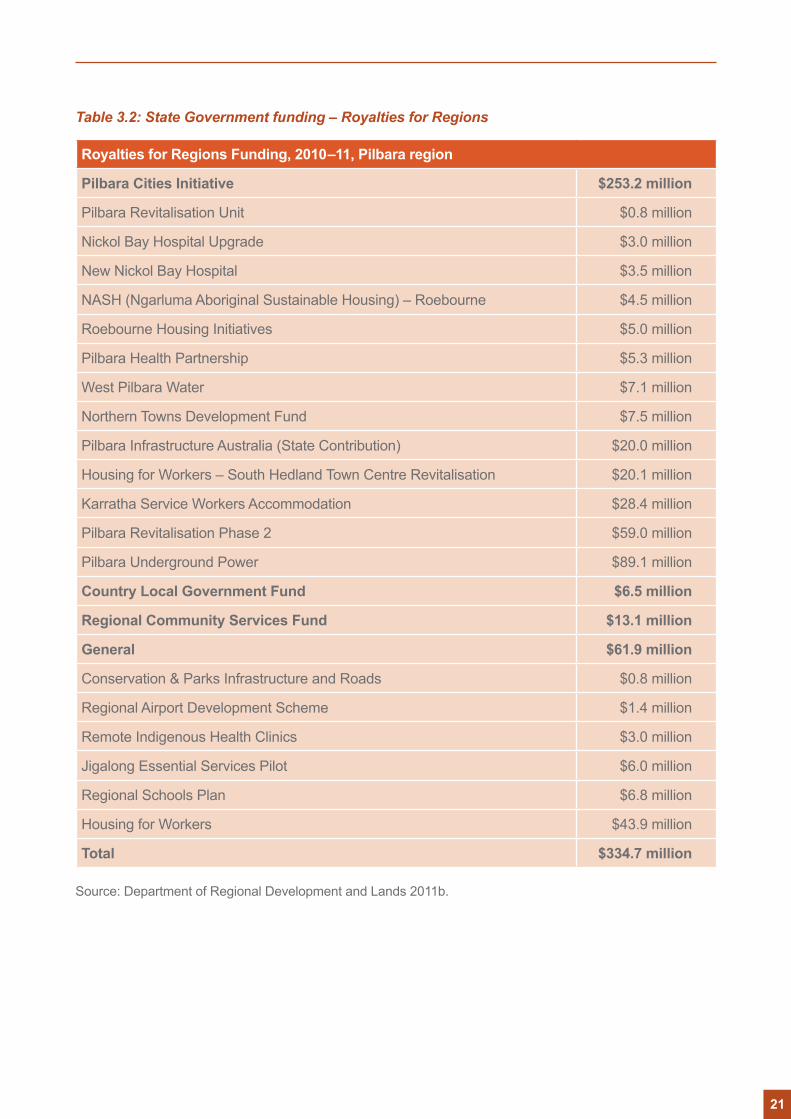
Table 3.2: State Government funding – Royalties for Regions
Royalties for Regions Funding, 2010–11, Pilbara region
Pilbara Cities Initiative $253.2 million
Pilbara Revitalisation Unit $0.8 million
Nickol Bay Hospital Upgrade $3.0 million
New Nickol Bay Hospital $3.5 million
NASH (Ngarluma Aboriginal Sustainable Housing) – Roebourne $4.5 million
Roebourne Housing Initiatives $5.0 million
Pilbara Health Partnership $5.3 million
West Pilbara Water $7.1 million
Northern Towns Development Fund $7.5 million
Pilbara Infrastructure Australia (State Contribution) $20.0 million
Housing for Workers – South Hedland Town Centre Revitalisation $20.1 million
Karratha Service Workers Accommodation $28.4 million
Pilbara Revitalisation Phase 2 $59.0 million
Pilbara Underground Power $89.1 million
Country Local Government Fund $6.5 million
Regional Community Services Fund $13.1 million
General $61.9 million
Conservation & Parks Infrastructure and Roads $0.8 million
Regional Airport Development Scheme $1.4 million
Remote Indigenous Health Clinics $3.0 million
Jigalong Essential Services Pilot $6.0 million
Regional Schools Plan $6.8 million
Housing for Workers $43.9 million
Total $334.7 million
Source: Department of Regional Development and Lands 2011b.
21
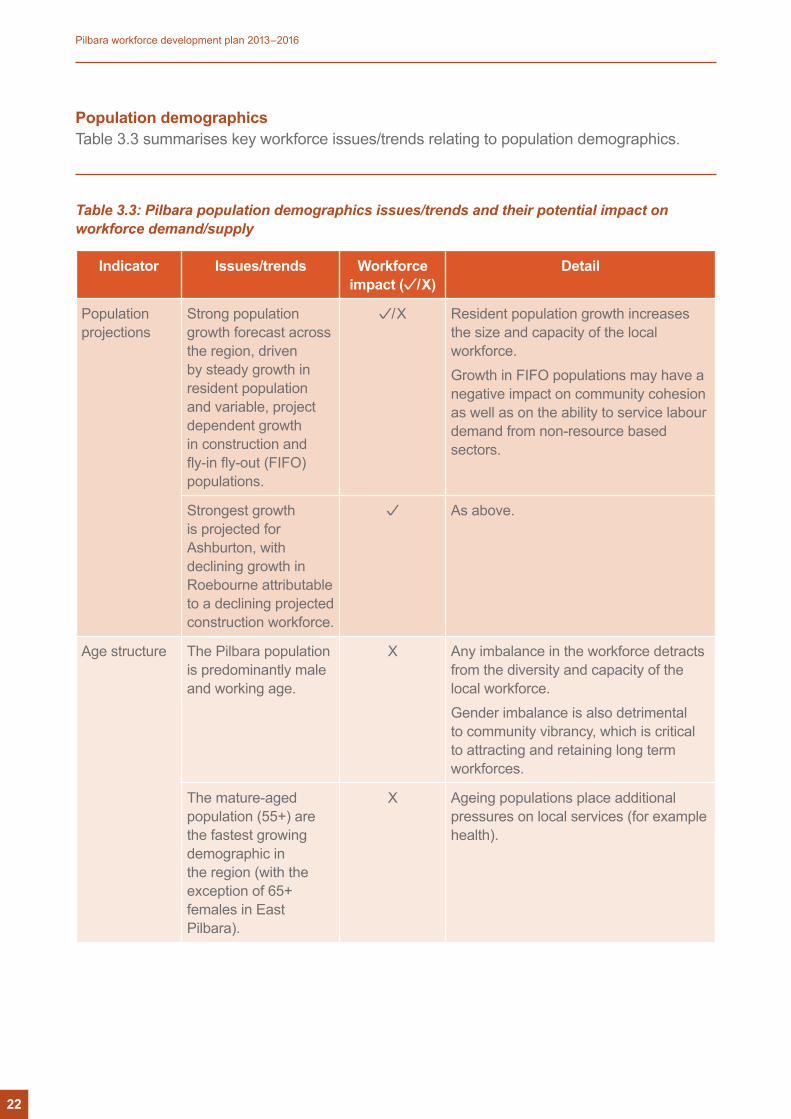
Population demographicsTable 3.3 summarises key workforce issues/trends relating to population demographics.
Table 3.3: Pilbara population demographics issues/trends and their potential impact on workforce demand/supply
Indicator Issues/trends Workforce impact ( /X)
Detail
Population projections
Strong population growth forecast across the region, driven by steady growth in resident population and variable, project dependent growth in construction and fly-in fly-out (FIFO) populations.
/X Resident population growth increases the size and capacity of the local workforce.Growth in FIFO populations may have a negative impact on community cohesion as well as on the ability to service labour demand from non-resource based sectors.
Strongest growth is projected for Ashburton, with declining growth in Roebourne attributable to a declining projected construction workforce.
As above.
Age structure The Pilbara population is predominantly male and working age.
X Any imbalance in the workforce detracts from the diversity and capacity of the local workforce.Gender imbalance is also detrimental to community vibrancy, which is critical to attracting and retaining long term workforces.
The mature-aged population (55+) are the fastest growing demographic in the region (with the exception of 65+ females in East Pilbara).
X Ageing populations place additional pressures on local services (for example health).
22
Pilbara workforce development plan 2013–2016
Indicator Issues/trends Workforce impact ( /X)
Detail
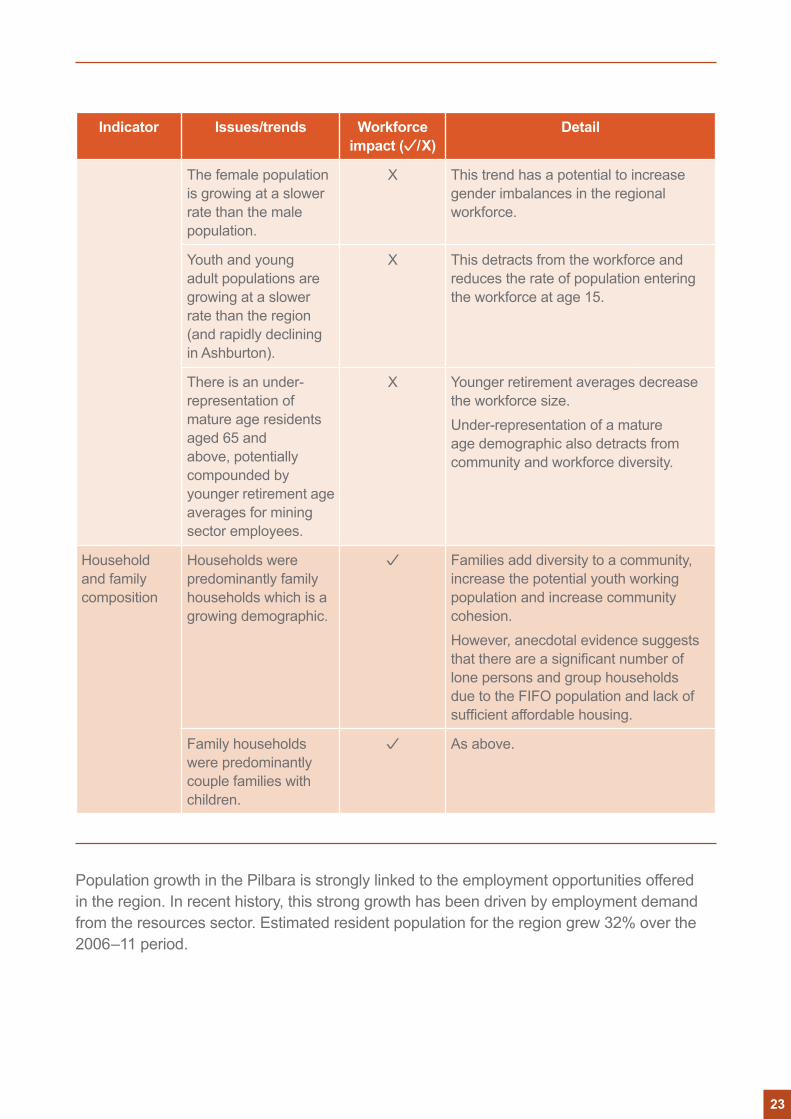
The female population is growing at a slower rate than the male population.
X This trend has a potential to increase gender imbalances in the regional workforce.
Youth and young adult populations are growing at a slower rate than the region (and rapidly declining in Ashburton).
X This detracts from the workforce and reduces the rate of population entering the workforce at age 15.
There is an under-representation of mature age residents aged 65 and above, potentially compounded by younger retirement age averages for mining sector employees.
X Younger retirement averages decrease the workforce size. Under-representation of a mature age demographic also detracts from community and workforce diversity.
Household and family composition
Households were predominantly family households which is a growing demographic.
Families add diversity to a community, increase the potential youth working population and increase community cohesion.However, anecdotal evidence suggests that there are a significant number of lone persons and group households due to the FIFO population and lack of sufficient affordable housing.
Family households were predominantly couple families with children.
As above.
Population growth in the Pilbara is strongly linked to the employment opportunities offered in the region. In recent history, this strong growth has been driven by employment demand from the resources sector. Estimated resident population for the region grew 32% over the 2006–11 period.
23
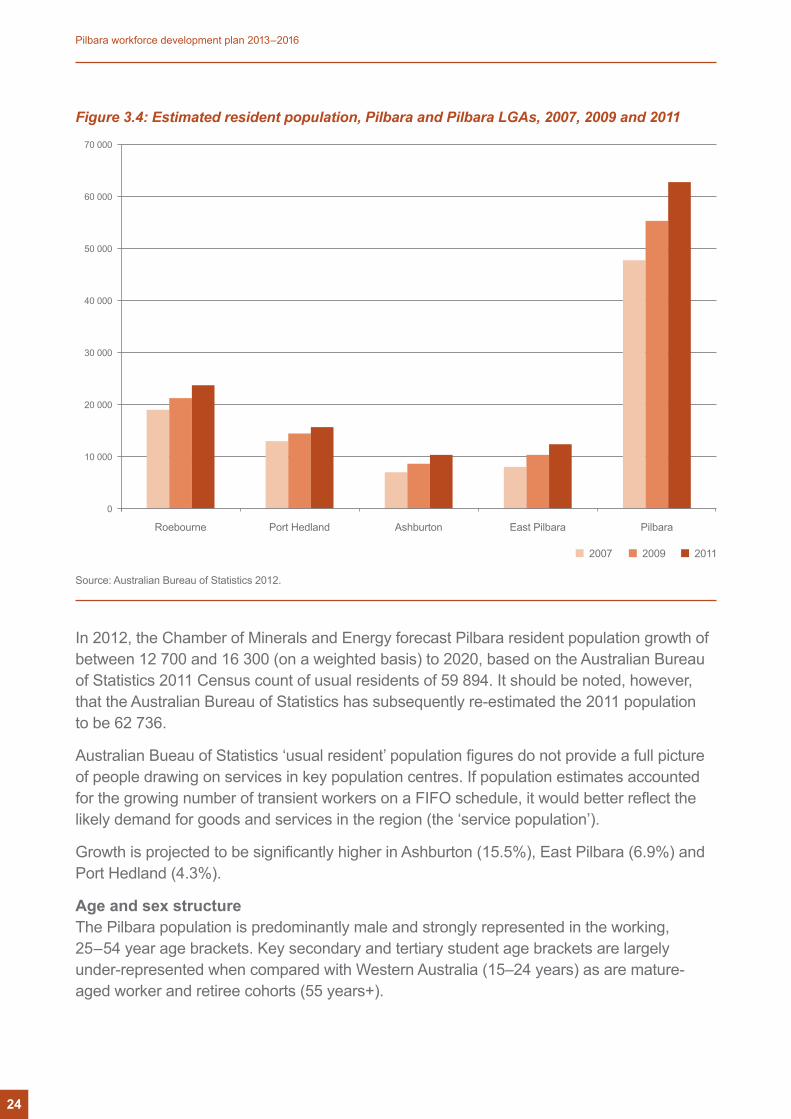
Figure 3.4: Estimated resident population, Pilbara and Pilbara LGAs, 2007, 2009 and 2011
70 000
60 000
50 000
40 000
30 000
20 000
10 000
0
Source: Australian Bureau of Statistics 2012.
Roebourne Port Hedland Ashburton East Pilbara Pilbara
In 2012, the Chamber of Minerals and Energy forecast Pilbara resident population growth of between 12 700 and 16 300 (on a weighted basis) to 2020, based on the Australian Bureau of Statistics 2011 Census count of usual residents of 59 894. It should be noted, however, that the Australian Bureau of Statistics has subsequently re-estimated the 2011 population to be 62 736.
Australian Bueau of Statistics ‘usual resident’ population figures do not provide a full picture of people drawing on services in key population centres. If population estimates accounted for the growing number of transient workers on a FIFO schedule, it would better reflect the likely demand for goods and services in the region (the ‘service population’).
Growth is projected to be significantly higher in Ashburton (15.5%), East Pilbara (6.9%) and Port Hedland (4.3%).
Age and sex structureThe Pilbara population is predominantly male and strongly represented in the working, 25–54 year age brackets. Key secondary and tertiary student age brackets are largely under-represented when compared with Western Australia (15–24 years) as are mature-aged worker and retiree cohorts (55 years+).
2007 2009 2011
24
Pilbara workforce development plan 2013–2016
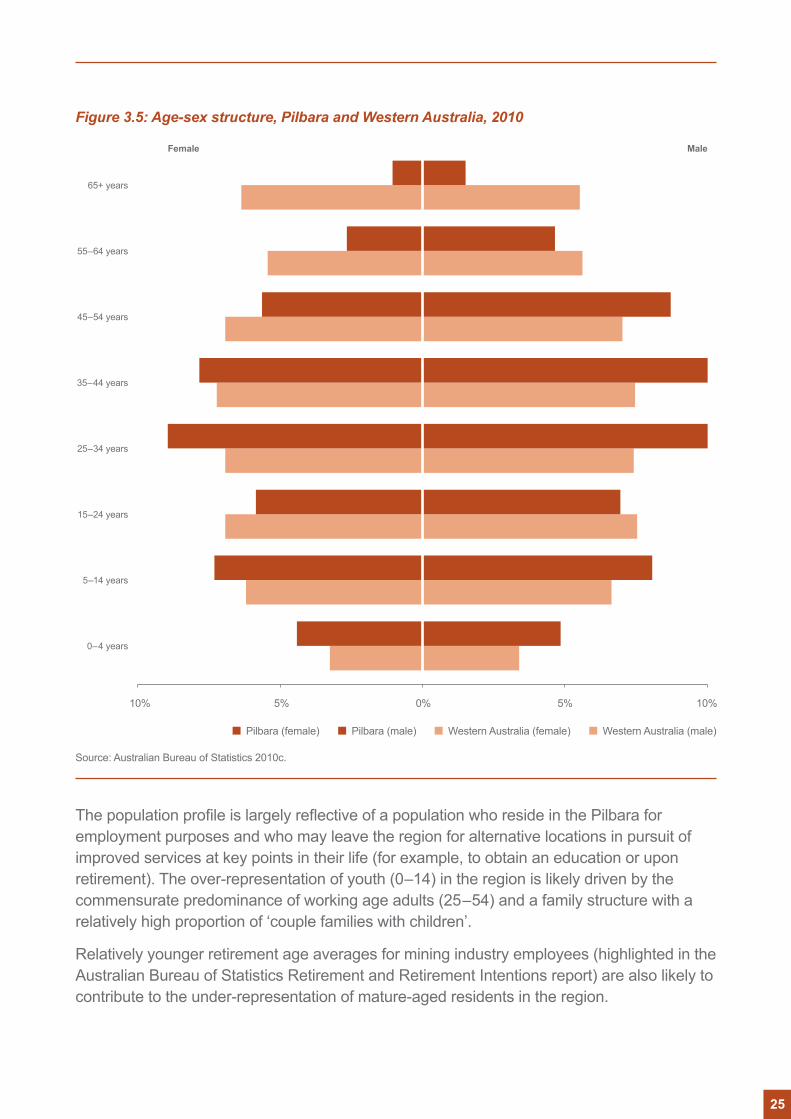
Figure 3.5: Age-sex structure, Pilbara and Western Australia, 2010
Source: Australian Bureau of Statistics 2010c.
The population profile is largely reflective of a population who reside in the Pilbara for employment purposes and who may leave the region for alternative locations in pursuit of improved services at key points in their life (for example, to obtain an education or upon retirement). The over-representation of youth (0–14) in the region is likely driven by the commensurate predominance of working age adults (25–54) and a family structure with a relatively high proportion of ‘couple families with children’.
Relatively younger retirement age averages for mining industry employees (highlighted in the Australian Bureau of Statistics Retirement and Retirement Intentions report) are also likely to contribute to the under-representation of mature-aged residents in the region.
Female Male
10% 10%5% 0% 5%
65+ years
55–64 years
45–54 years
35–44 years
25–34 years
15–24 years
5–14 years
0–4 years
Pilbara (female) Pilbara (male) Western Australia (female) Western Australia (male)
25
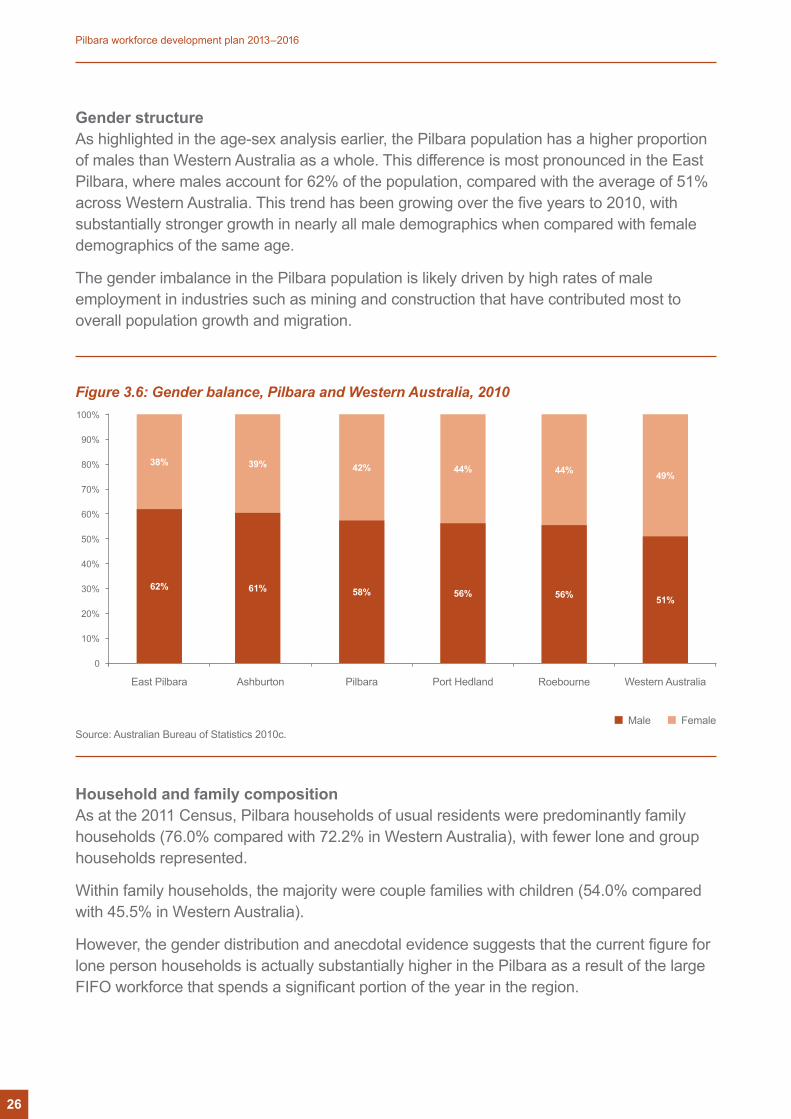
Gender structureAs highlighted in the age-sex analysis earlier, the Pilbara population has a higher proportion of males than Western Australia as a whole. This difference is most pronounced in the East Pilbara, where males account for 62% of the population, compared with the average of 51% across Western Australia. This trend has been growing over the five years to 2010, with substantially stronger growth in nearly all male demographics when compared with female demographics of the same age.
The gender imbalance in the Pilbara population is likely driven by high rates of male employment in industries such as mining and construction that have contributed most to overall population growth and migration.
Figure 3.6: Gender balance, Pilbara and Western Australia, 2010
Source: Australian Bureau of Statistics 2010c.
Household and family compositionAs at the 2011 Census, Pilbara households of usual residents were predominantly family households (76.0% compared with 72.2% in Western Australia), with fewer lone and group households represented.
Within family households, the majority were couple families with children (54.0% compared with 45.5% in Western Australia).
However, the gender distribution and anecdotal evidence suggests that the current figure for lone person households is actually substantially higher in the Pilbara as a result of the large FIFO workforce that spends a significant portion of the year in the region.
100%
90%
80%
70%
60%
50%
40%
30%
20%
10%
0
East Pilbara RoebourneAshburton Pilbara Port Hedland Western Australia
Male Female
38% 39% 42%
62% 61% 58%
44%
56%
44%
56%
49%
51%
26
Pilbara workforce development plan 2013–2016
27
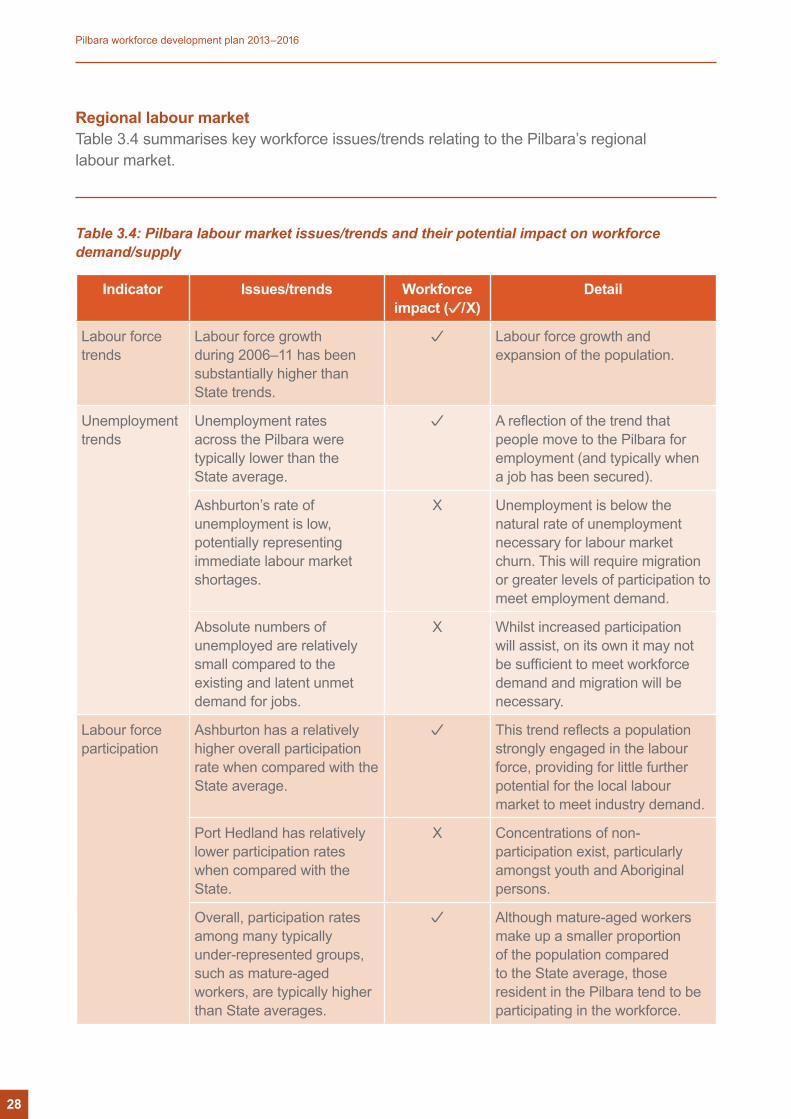
Regional labour marketTable 3.4 summarises key workforce issues/trends relating to the Pilbara’s regional labour market.
Table 3.4: Pilbara labour market issues/trends and their potential impact on workforce demand/supply
Indicator Issues/trends Workforce impact ( /X)
Detail
Labour force trends
Labour force growth during 2006–11 has been substantially higher than State trends.
Labour force growth and expansion of the population.
Unemployment trends
Unemployment rates across the Pilbara were typically lower than the State average.
A reflection of the trend that people move to the Pilbara for employment (and typically when a job has been secured).
Ashburton’s rate of unemployment is low, potentially representing immediate labour market shortages.
X Unemployment is below the natural rate of unemployment necessary for labour market churn. This will require migration or greater levels of participation to meet employment demand.
Absolute numbers of unemployed are relatively small compared to the existing and latent unmet demand for jobs.
X Whilst increased participation will assist, on its own it may not be sufficient to meet workforce demand and migration will be necessary.
Labour force participation
Ashburton has a relatively higher overall participation rate when compared with the State average.
This trend reflects a population strongly engaged in the labour force, providing for little further potential for the local labour market to meet industry demand.
Port Hedland has relatively lower participation rates when compared with the State.
X Concentrations of non-participation exist, particularly amongst youth and Aboriginal persons.
Overall, participation rates among many typically under-represented groups, such as mature-aged workers, are typically higher than State averages.
Although mature-aged workers make up a smaller proportion of the population compared to the State average, those resident in the Pilbara tend to be participating in the workforce.
28
Pilbara workforce development plan 2013–2016
Indicator Issues/trends Workforce impact ( /X)
Detail
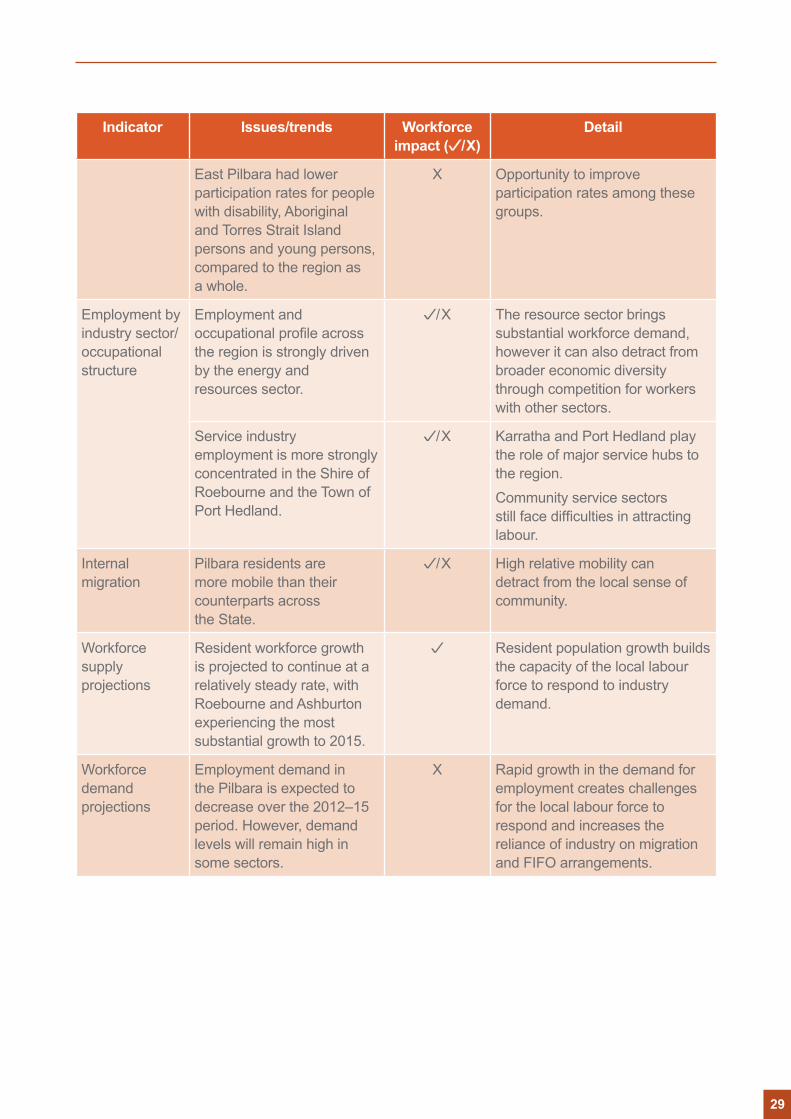
East Pilbara had lower participation rates for people with disability, Aboriginal and Torres Strait Island persons and young persons, compared to the region as a whole.
X Opportunity to improve participation rates among these groups.
Employment by industry sector/ occupational structure
Employment and occupational profile across the region is strongly driven by the energy and resources sector.
/X The resource sector brings substantial workforce demand, however it can also detract from broader economic diversity through competition for workers with other sectors.
Service industry employment is more strongly concentrated in the Shire of Roebourne and the Town of Port Hedland.
/X Karratha and Port Hedland play the role of major service hubs to the region.Community service sectors still face difficulties in attracting labour.
Internal migration
Pilbara residents are more mobile than their counterparts across the State.
/X High relative mobility can detract from the local sense of community.
Workforce supply projections
Resident workforce growth is projected to continue at a relatively steady rate, with Roebourne and Ashburton experiencing the most substantial growth to 2015.
Resident population growth builds the capacity of the local labour force to respond to industry demand.
Workforce demand projections
Employment demand in the Pilbara is expected to decrease over the 2012–15 period. However, demand levels will remain high in some sectors.
X Rapid growth in the demand for employment creates challenges for the local labour force to respond and increases the reliance of industry on migration and FIFO arrangements.
29
Indicator Issues/trends Workforce impact ( /X)
Detail
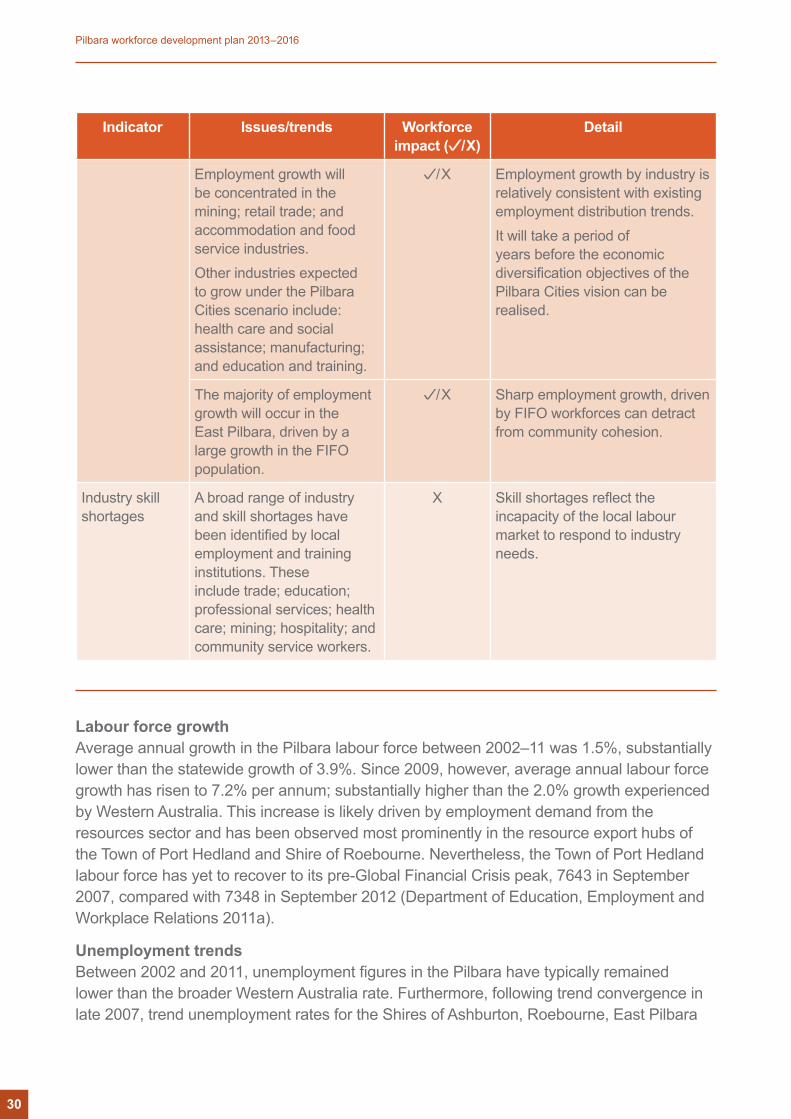
Employment growth will be concentrated in the mining; retail trade; and accommodation and food service industries.Other industries expected to grow under the Pilbara Cities scenario include: health care and social assistance; manufacturing; and education and training.
/X Employment growth by industry is relatively consistent with existing employment distribution trends.It will take a period of years before the economic diversification objectives of the Pilbara Cities vision can be realised.
The majority of employment growth will occur in the East Pilbara, driven by a large growth in the FIFO population.
/X Sharp employment growth, driven by FIFO workforces can detract from community cohesion.
Industry skill shortages
A broad range of industry and skill shortages have been identified by local employment and training institutions. These include trade; education; professional services; health care; mining; hospitality; and community service workers.
X Skill shortages reflect the incapacity of the local labour market to respond to industry needs.
Labour force growthAverage annual growth in the Pilbara labour force between 2002–11 was 1.5%, substantially lower than the statewide growth of 3.9%. Since 2009, however, average annual labour force growth has risen to 7.2% per annum; substantially higher than the 2.0% growth experienced by Western Australia. This increase is likely driven by employment demand from the resources sector and has been observed most prominently in the resource export hubs of the Town of Port Hedland and Shire of Roebourne. Nevertheless, the Town of Port Hedland labour force has yet to recover to its pre-Global Financial Crisis peak, 7643 in September 2007, compared with 7348 in September 2012 (Department of Education, Employment and Workplace Relations 2011a).
Unemployment trendsBetween 2002 and 2011, unemployment figures in the Pilbara have typically remained lower than the broader Western Australia rate. Furthermore, following trend convergence in late 2007, trend unemployment rates for the Shires of Ashburton, Roebourne, East Pilbara
30
Pilbara workforce development plan 2013–2016
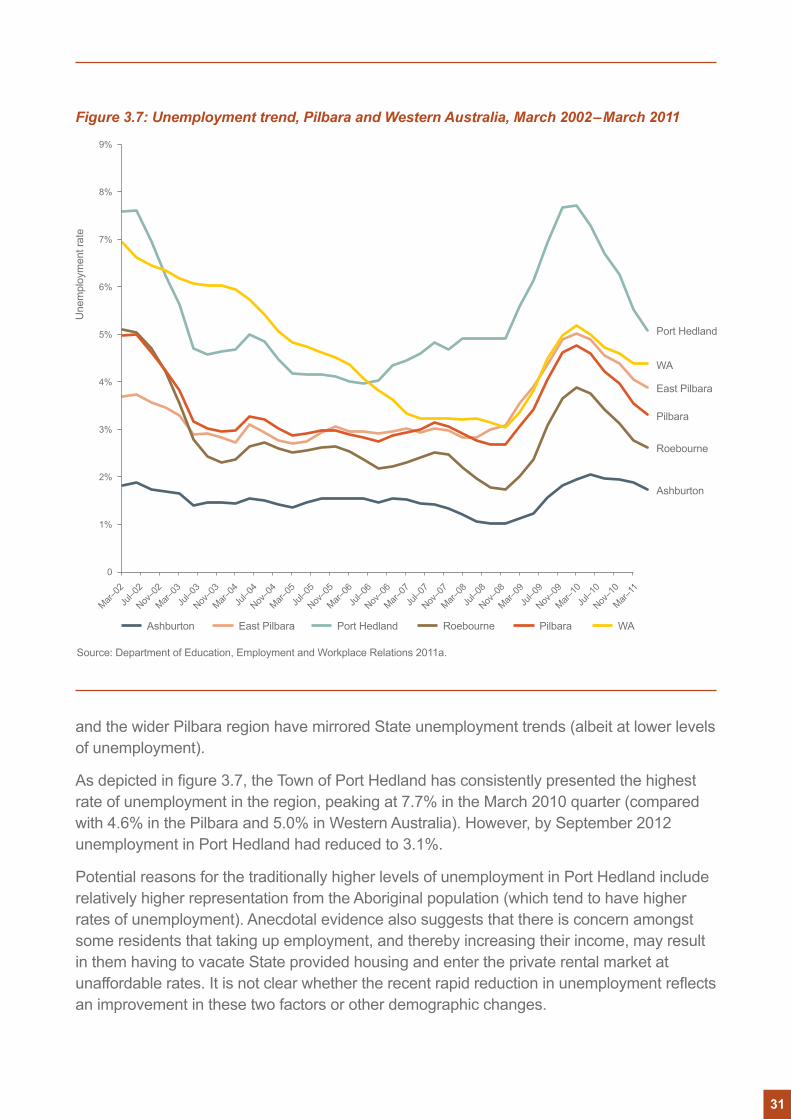
Figure 3.7: Unemployment trend, Pilbara and Western Australia, March 2002–March 2011
Une
mpl
oym
ent r
ate
9%
Mar–02
Mar–03
Mar–04
Mar–05
Mar–06
Mar–07
Mar–08
Mar–09
Nov–0
9Ju
l–02
Jul–0
3Ju
l–04
Jul–0
5Ju
l–06
Jul–0
7Ju
l–08
Jul–0
9Ju
l–10
Nov–0
2
Nov–0
3
Nov–0
4
Nov–0
5
Nov–0
6
Nov–0
7
Nov–0
8
Mar–10
Mar–11
Nov–1
0
8%
7%
6%
5%
4%
2%
0
Source: Department of Education, Employment and Workplace Relations 2011a.
Ashburton East Pilbara
3%
1%
Port Hedland Roebourne Pilbara WA
Ashburton
Roebourne
Pilbara
East Pilbara
WA
Port Hedland
and the wider Pilbara region have mirrored State unemployment trends (albeit at lower levels of unemployment).
As depicted in figure 3.7, the Town of Port Hedland has consistently presented the highest rate of unemployment in the region, peaking at 7.7% in the March 2010 quarter (compared with 4.6% in the Pilbara and 5.0% in Western Australia). However, by September 2012 unemployment in Port Hedland had reduced to 3.1%.
Potential reasons for the traditionally higher levels of unemployment in Port Hedland include relatively higher representation from the Aboriginal population (which tend to have higher rates of unemployment). Anecdotal evidence also suggests that there is concern amongst some residents that taking up employment, and thereby increasing their income, may result in them having to vacate State provided housing and enter the private rental market at unaffordable rates. It is not clear whether the recent rapid reduction in unemployment reflects an improvement in these two factors or other demographic changes.
31
Ashburton has the region’s lowest unemployment rate (1.0% at September 2012), significantly below the natural rate of unemployment required to cater for general labour force churn (deemed to be around 4–5%) and this suggests further labour shortages.
Finally, while the pool of unemployed labour in the Pilbara presents an opportunity for meeting increasing labour demand from industry (for example through training, mentoring and job placement), in September 2012 there were only 617 unemployed residents across the region3, with larger groups concentrated in the larger residential regions of the Town of Port Hedland (231) and the Shire of Roebourne (203). Subsequently, employees will need to be sought from outside the region to meet the demand, which cannot be met from the current resident workforce.
Labour force participationThe table opposite shows the workforce participation rates for the four Pilbara LGAs, the Pilbara region and Western Australia as a whole. While the Shires of Ashburton and East Pilbara have higher rates than the State and regional average, the Shire of Roebourne and the Town of Port Hedland have relatively lower rates of participation compared to the rest of the region but are also still ahead of the State average.
3 This figure excludes CDEP participants, who are classified as employed in the DEEWR count of the unemployed.
32
Pilbara workforce development plan 2013–2016
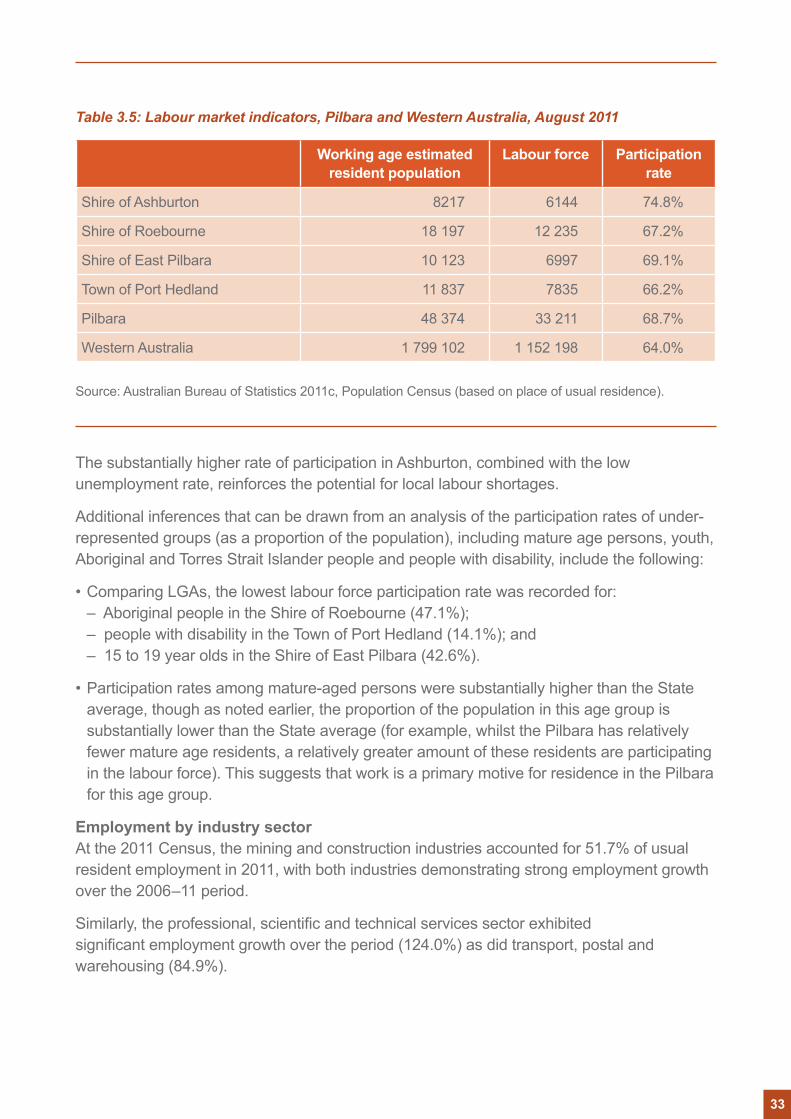
Table 3.5: Labour market indicators, Pilbara and Western Australia, August 2011
Working age estimated resident population
Labour force Participation rate
Shire of Ashburton 8217 6144 74.8%
Shire of Roebourne 18 197 12 235 67.2%
Shire of East Pilbara 10 123 6997 69.1%
Town of Port Hedland 11 837 7835 66.2%
Pilbara 48 374 33 211 68.7%
Western Australia 1 799 102 1 152 198 64.0%
Source: Australian Bureau of Statistics 2011c, Population Census (based on place of usual residence).
The substantially higher rate of participation in Ashburton, combined with the low unemployment rate, reinforces the potential for local labour shortages.
Additional inferences that can be drawn from an analysis of the participation rates of under-represented groups (as a proportion of the population), including mature age persons, youth, Aboriginal and Torres Strait Islander people and people with disability, include the following:
• Comparing LGAs, the lowest labour force participation rate was recorded for: – Aboriginal people in the Shire of Roebourne (47.1%); – people with disability in the Town of Port Hedland (14.1%); and – 15 to 19 year olds in the Shire of East Pilbara (42.6%).
• Participation rates among mature-aged persons were substantially higher than the State average, though as noted earlier, the proportion of the population in this age group is substantially lower than the State average (for example, whilst the Pilbara has relatively fewer mature age residents, a relatively greater amount of these residents are participating in the labour force). This suggests that work is a primary motive for residence in the Pilbara for this age group.
Employment by industry sectorAt the 2011 Census, the mining and construction industries accounted for 51.7% of usual resident employment in 2011, with both industries demonstrating strong employment growth over the 2006–11 period.
Similarly, the professional, scientific and technical services sector exhibited significant employment growth over the period (124.0%) as did transport, postal and warehousing (84.9%).
33
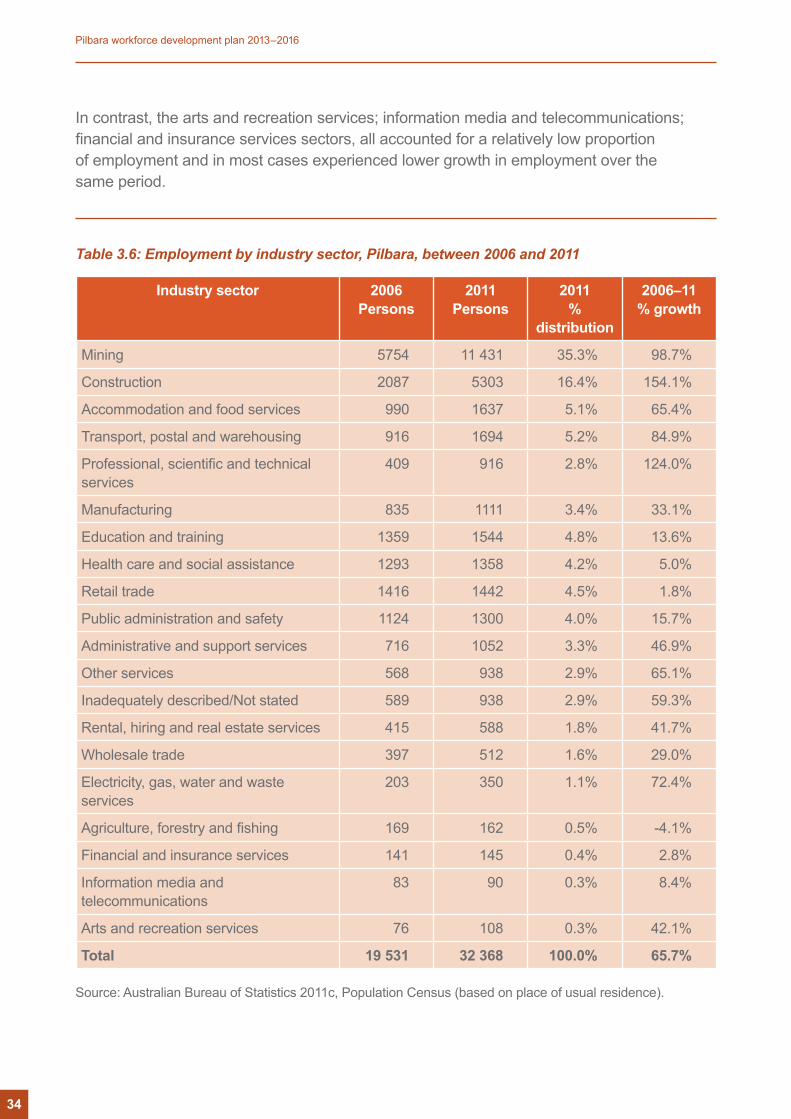
In contrast, the arts and recreation services; information media and telecommunications; financial and insurance services sectors, all accounted for a relatively low proportion of employment and in most cases experienced lower growth in employment over the same period.
Table 3.6: Employment by industry sector, Pilbara, between 2006 and 2011
Industry sector 2006 Persons
2011 Persons
2011 %
distribution
2006–11 % growth
Mining 5754 11 431 35.3% 98.7%
Construction 2087 5303 16.4% 154.1%
Accommodation and food services 990 1637 5.1% 65.4%
Transport, postal and warehousing 916 1694 5.2% 84.9%
Professional, scientific and technical services
409 916 2.8% 124.0%
Manufacturing 835 1111 3.4% 33.1%
Education and training 1359 1544 4.8% 13.6%
Health care and social assistance 1293 1358 4.2% 5.0%
Retail trade 1416 1442 4.5% 1.8%
Public administration and safety 1124 1300 4.0% 15.7%
Administrative and support services 716 1052 3.3% 46.9%
Other services 568 938 2.9% 65.1%
Inadequately described/Not stated 589 938 2.9% 59.3%
Rental, hiring and real estate services 415 588 1.8% 41.7%
Wholesale trade 397 512 1.6% 29.0%
Electricity, gas, water and waste services
203 350 1.1% 72.4%
Agriculture, forestry and fishing 169 162 0.5% -4.1%
Financial and insurance services 141 145 0.4% 2.8%
Information media and telecommunications
83 90 0.3% 8.4%
Arts and recreation services 76 108 0.3% 42.1%
Total 19 531 32 368 100.0% 65.7%
Source: Australian Bureau of Statistics 2011c, Population Census (based on place of usual residence).
34
Pilbara workforce development plan 2013–2016
Occupation structureThe 2011 Census also revealed that as a consequence of the large number of jobs in the resources sector and associated industries, technicians and trade workers was the predominant occupation (28.0%) for those employed in the Pilbara in 2011.
Machinery operators and drivers was the second largest occupational group one of the major occupational groups, especially significant in the major mining locations, suggesting this work was often associated with mining activity.
Professionals was the third most represented occupation in the region but the second most represented in Roebourne, which confirms the relatively greater economic diversity of this larger, urbanised, local government economy.
Labourers were also well represented (11.3%) in the Pilbara, accounting for a greater proportion of occupations in each local government area when compared with the State average (Australian Bureau of Statistics 2011).
Internal migrationAustralian Bureau of Statistics data for 2011 indicates that Pilbara residents are more mobile than their counterparts elsewhere across the State, with only 29.0% of residents living at the same address as five years previously. This compares with 54.2% of residents for Western Australia.
Pilbara residents also have a higher rate of interstate mobility than Western Australia as a whole.
In addition to these figures, the reliance of the resources sector on FIFO arrangements to supplement their local workforce further adds to the transient nature of regional populations in the Pilbara, 30.2% of the Pilbara population declared their usual residence to be outside Western Australia, compared to only 6.2% for the State as a whole.
International migrationIn 2011, at least 19.5% of the Pilbara population (11 657 residents) were born overseas. This compares to 30.7% for Western Australia as a whole. Approximately 6.7% of the Pilbara’s population were born in the Oceania and Antarctic region (mostly New Zealand), 5.2% were born in North-West Europe (mostly the United Kingdom) and a further 2.5% were born in South-East Asia.
35
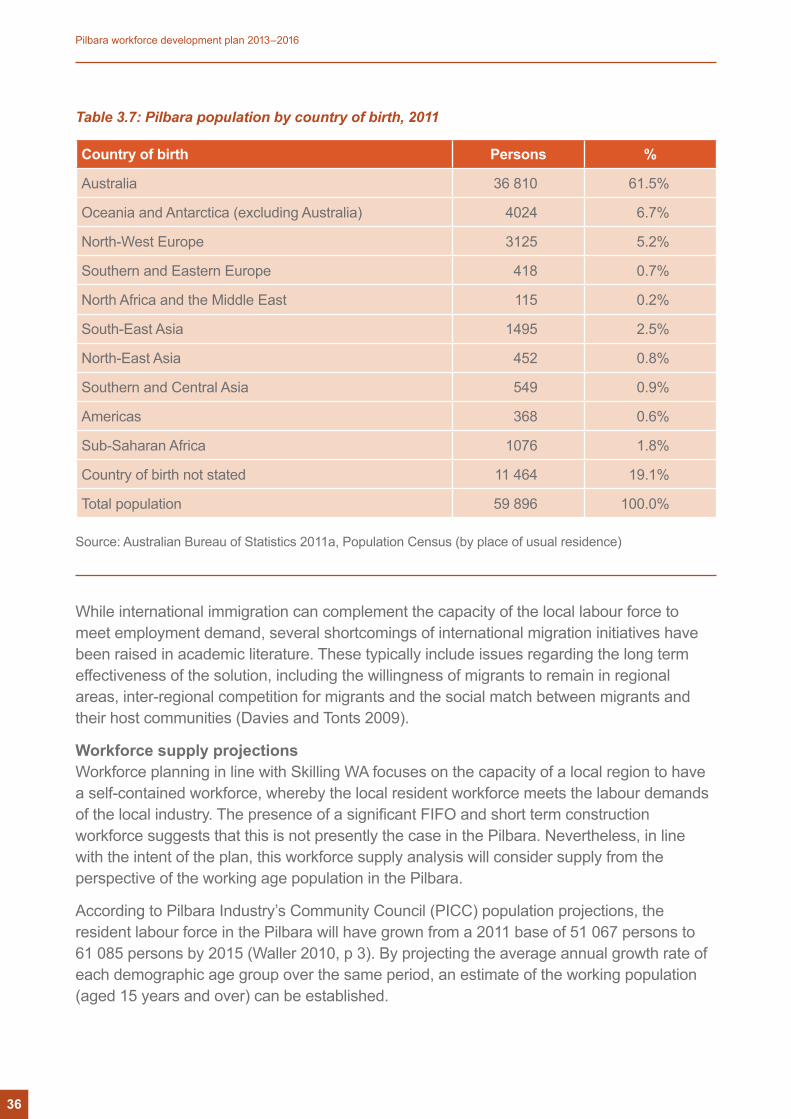
Table 3.7: Pilbara population by country of birth, 2011
Country of birth Persons %
Australia 36 810 61.5%
Oceania and Antarctica (excluding Australia) 4024 6.7%
North-West Europe 3125 5.2%
Southern and Eastern Europe 418 0.7%
North Africa and the Middle East 115 0.2%
South-East Asia 1495 2.5%
North-East Asia 452 0.8%
Southern and Central Asia 549 0.9%
Americas 368 0.6%
Sub-Saharan Africa 1076 1.8%
Country of birth not stated 11 464 19.1%
Total population 59 896 100.0%
Source: Australian Bureau of Statistics 2011a, Population Census (by place of usual residence)
While international immigration can complement the capacity of the local labour force to meet employment demand, several shortcomings of international migration initiatives have been raised in academic literature. These typically include issues regarding the long term effectiveness of the solution, including the willingness of migrants to remain in regional areas, inter-regional competition for migrants and the social match between migrants and their host communities (Davies and Tonts 2009).
Workforce supply projectionsWorkforce planning in line with Skilling WA focuses on the capacity of a local region to have a self-contained workforce, whereby the local resident workforce meets the labour demands of the local industry. The presence of a significant FIFO and short term construction workforce suggests that this is not presently the case in the Pilbara. Nevertheless, in line with the intent of the plan, this workforce supply analysis will consider supply from the perspective of the working age population in the Pilbara.
According to Pilbara Industry’s Community Council (PICC) population projections, the resident labour force in the Pilbara will have grown from a 2011 base of 51 067 persons to 61 085 persons by 2015 (Waller 2010, p 3). By projecting the average annual growth rate of each demographic age group over the same period, an estimate of the working population (aged 15 years and over) can be established.
36
Pilbara workforce development plan 2013–2016
The projections estimate growth in the Pilbara resident workforce population of approximately 5000 persons, with the Shires of Roebourne and Ashburton contributing the majority of this growth.
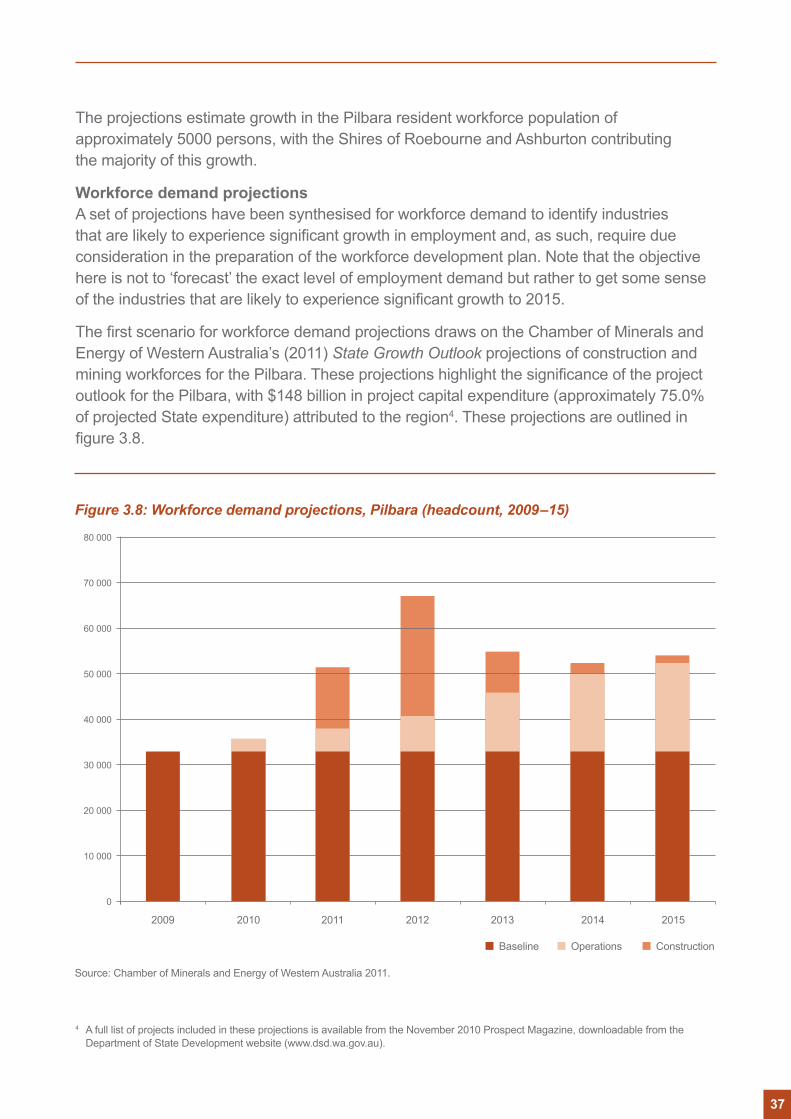
Workforce demand projectionsA set of projections have been synthesised for workforce demand to identify industries that are likely to experience significant growth in employment and, as such, require due consideration in the preparation of the workforce development plan. Note that the objective here is not to ‘forecast’ the exact level of employment demand but rather to get some sense of the industries that are likely to experience significant growth to 2015.
The first scenario for workforce demand projections draws on the Chamber of Minerals and Energy of Western Australia’s (2011) State Growth Outlook projections of construction and mining workforces for the Pilbara. These projections highlight the significance of the project outlook for the Pilbara, with $148 billion in project capital expenditure (approximately 75.0% of projected State expenditure) attributed to the region4. These projections are outlined in figure 3.8.
Figure 3.8: Workforce demand projections, Pilbara (headcount, 2009–15)
80 000
70 000
60 000
50 000
40 000
30 000
20 000
10 000
0
Source: Chamber of Minerals and Energy of Western Australia 2011.
2009 2010 2011 2012 2013 2014 2015
Baseline Operations Construction
4 A full list of projects included in these projections is available from the November 2010 Prospect Magazine, downloadable from the Department of State Development website (www.dsd.wa.gov.au).
37
The projections highlight a peak construction workforce in 2012, which declines over the subsequent three years to 2015. This is mirrored by a steadily growing operational mining workforce over the same period. The implications for growth across other industries are relatively minor with mining employment accounting for the majority of employment growth.
Under an alternative, policy driven scenario, a set of projections have been prepared in line with the delivery of the Pilbara Cities economic diversification objectives. These projections anticipate the transition of the economy toward a more diversified employment distribution by 2035.
The results suggest that both diversification and employment growth will occur slowly at first, with investment in infrastructure, agglomeration benefits and industry cluster development driving an increased growth rate across all industry sectors over time.
Industries expected to grow under this scenario between 2012 and 2015 include retail trade; health care and social assistance; manufacturing; and education and training. These industries are all relatively under-represented in the current profile and their growth will drive the diversification of the economy.
Industry critical/skills shortage occupationsJoblink Enterprises Incorporated (2011) and the Pilbara Institute (2011) each undertook an external scanning exercise to identify occupations in the Pilbara that are experiencing critical workforce shortages. These findings reinforce the 2010 assessment by the Department of Education, Employment and Workplace Relations’ Survey of Employers Recruitment Experiences which nominated specific occupations in the region that were ‘difficult to fill’.
Occupations consistently identified across all reviews have included trade, education, professional services, health care, mining, hospitality and community service workers.
A more detailed summary of the findings of these three reviews is included in chapter 4 of this plan.
38
Pilbara workforce development plan 2013–2016
39
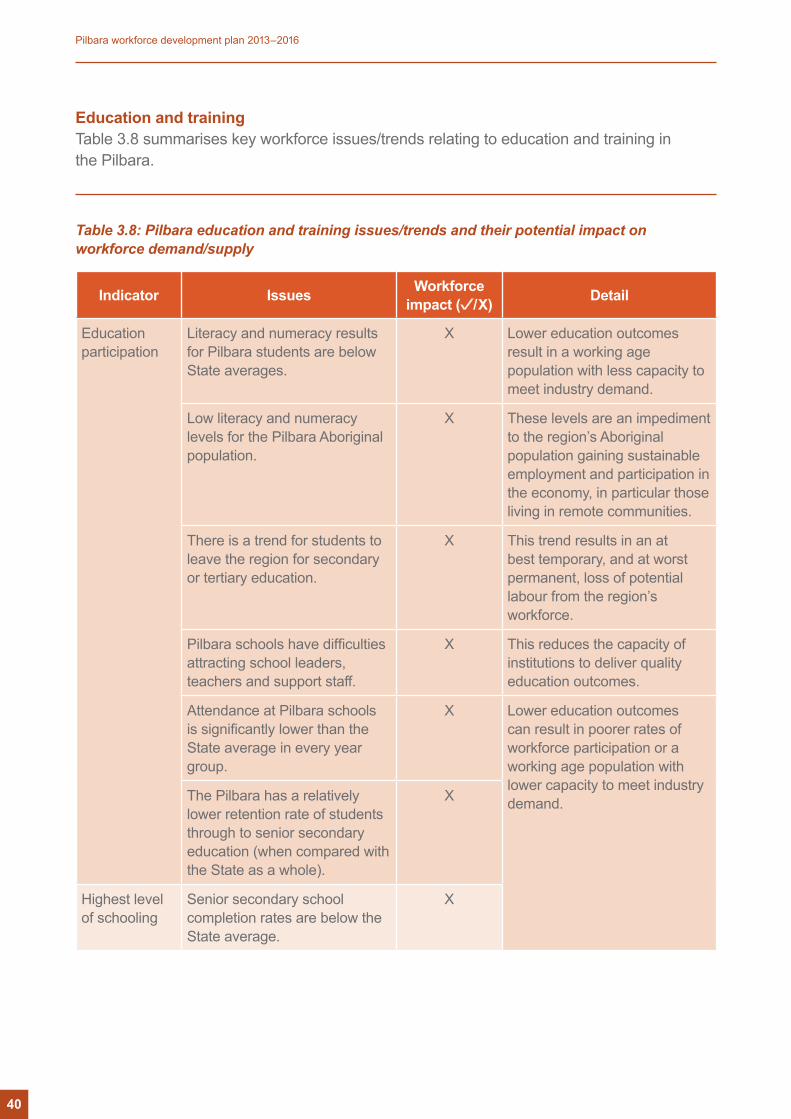
Education and trainingTable 3.8 summarises key workforce issues/trends relating to education and training in the Pilbara.
Table 3.8: Pilbara education and training issues/trends and their potential impact on workforce demand/supply
Indicator Issues Workforce impact ( /X) Detail
Education participation
Literacy and numeracy results for Pilbara students are below State averages.
X Lower education outcomes result in a working age population with less capacity to meet industry demand.
Low literacy and numeracy levels for the Pilbara Aboriginal population.
X These levels are an impediment to the region’s Aboriginal population gaining sustainable employment and participation in the economy, in particular those living in remote communities.
There is a trend for students to leave the region for secondary or tertiary education.
X This trend results in an at best temporary, and at worst permanent, loss of potential labour from the region’s workforce.
Pilbara schools have difficulties attracting school leaders, teachers and support staff.
X This reduces the capacity of institutions to deliver quality education outcomes.
Attendance at Pilbara schools is significantly lower than the State average in every year group.
X Lower education outcomes can result in poorer rates of workforce participation or a working age population with lower capacity to meet industry demand.The Pilbara has a relatively
lower retention rate of students through to senior secondary education (when compared with the State as a whole).
X
Highest level of schooling
Senior secondary school completion rates are below the State average.
X
40
Pilbara workforce development plan 2013–2016
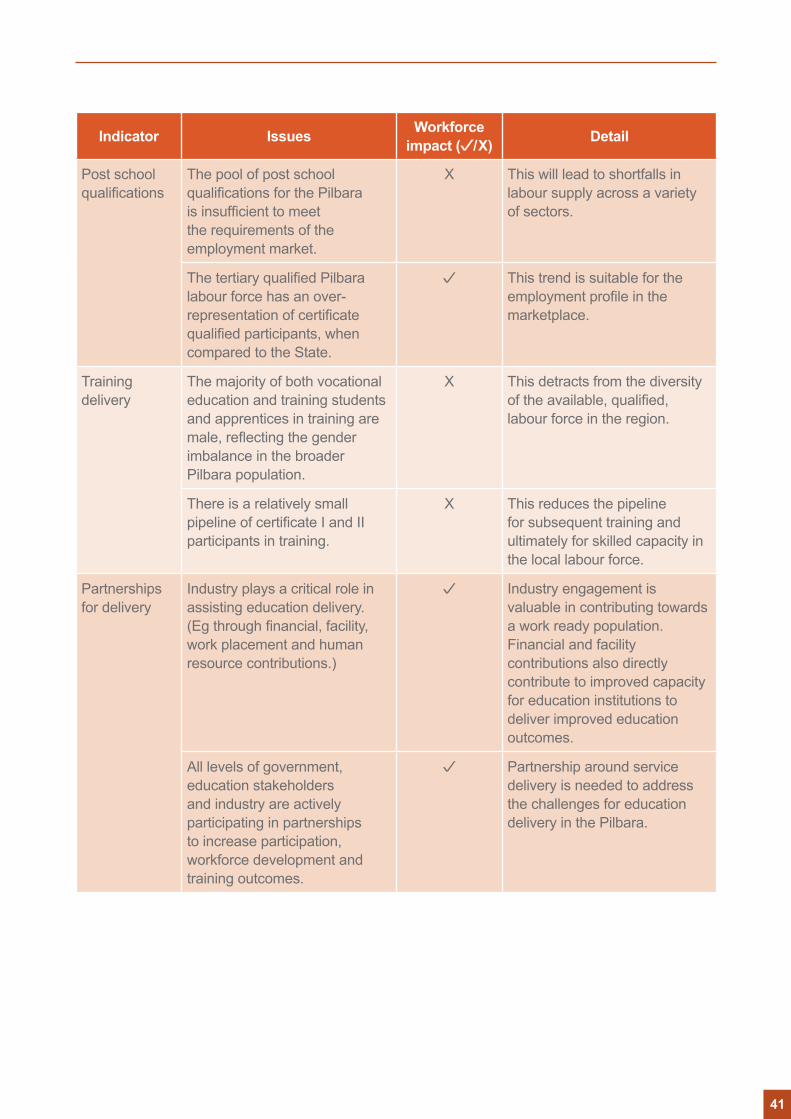
Indicator Issues Workforce impact ( /X) Detail
Post school qualifications
The pool of post school qualifications for the Pilbara is insufficient to meet the requirements of the employment market.
X This will lead to shortfalls in labour supply across a variety of sectors.
The tertiary qualified Pilbara labour force has an over-representation of certificate qualified participants, when compared to the State.
This trend is suitable for the employment profile in the marketplace.
Training delivery
The majority of both vocational education and training students and apprentices in training are male, reflecting the gender imbalance in the broader Pilbara population.
X This detracts from the diversity of the available, qualified, labour force in the region.
There is a relatively small pipeline of certificate I and II participants in training.
X This reduces the pipeline for subsequent training and ultimately for skilled capacity in the local labour force.
Partnerships for delivery
Industry plays a critical role in assisting education delivery. (Eg through financial, facility, work placement and human resource contributions.)
Industry engagement is valuable in contributing towards a work ready population. Financial and facility contributions also directly contribute to improved capacity for education institutions to deliver improved education outcomes.
All levels of government, education stakeholders and industry are actively participating in partnerships to increase participation, workforce development and training outcomes.
Partnership around service delivery is needed to address the challenges for education delivery in the Pilbara.
41
Indicator Issues Workforce impact ( /X) Detail
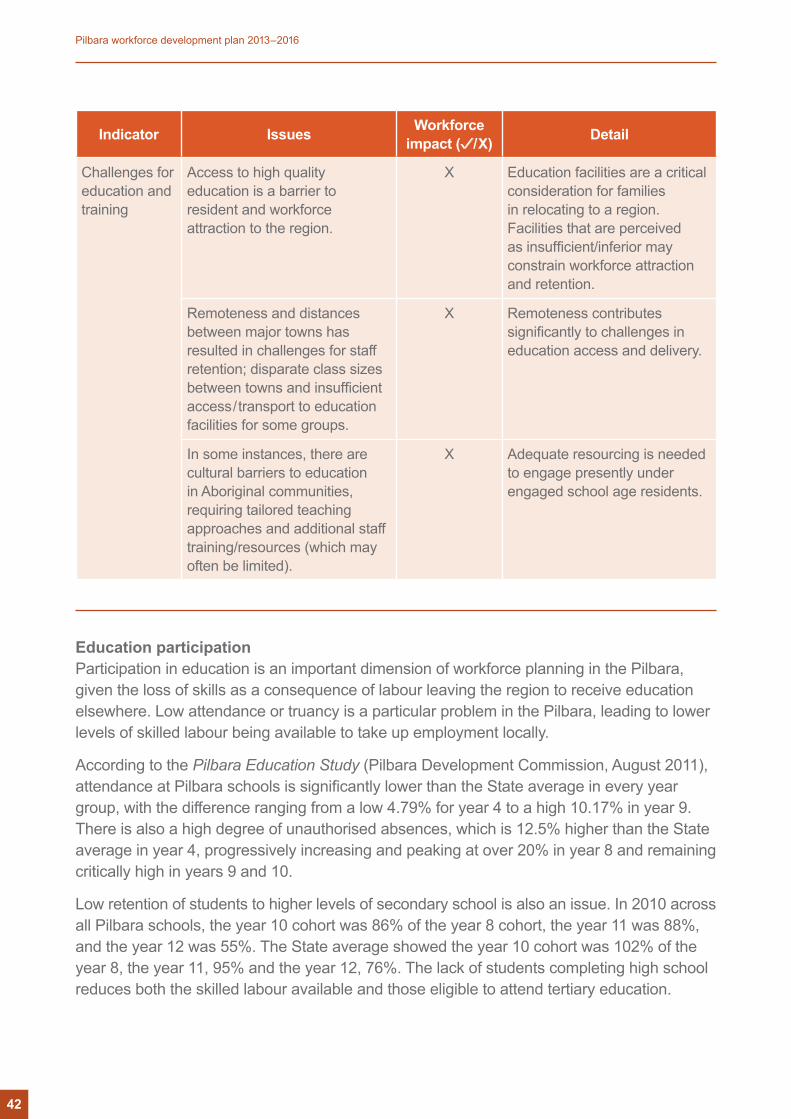
Challenges for education and training
Access to high quality education is a barrier to resident and workforce attraction to the region.
X Education facilities are a critical consideration for families in relocating to a region. Facilities that are perceived as insufficient/inferior may constrain workforce attraction and retention.
Remoteness and distances between major towns has resulted in challenges for staff retention; disparate class sizes between towns and insufficient access/transport to education facilities for some groups.
X Remoteness contributes significantly to challenges in education access and delivery.
In some instances, there are cultural barriers to education in Aboriginal communities, requiring tailored teaching approaches and additional staff training/resources (which may often be limited).
X Adequate resourcing is needed to engage presently under engaged school age residents.
Education participationParticipation in education is an important dimension of workforce planning in the Pilbara, given the loss of skills as a consequence of labour leaving the region to receive education elsewhere. Low attendance or truancy is a particular problem in the Pilbara, leading to lower levels of skilled labour being available to take up employment locally.
According to the Pilbara Education Study (Pilbara Development Commission, August 2011), attendance at Pilbara schools is significantly lower than the State average in every year group, with the difference ranging from a low 4.79% for year 4 to a high 10.17% in year 9. There is also a high degree of unauthorised absences, which is 12.5% higher than the State average in year 4, progressively increasing and peaking at over 20% in year 8 and remaining critically high in years 9 and 10.
Low retention of students to higher levels of secondary school is also an issue. In 2010 across all Pilbara schools, the year 10 cohort was 86% of the year 8 cohort, the year 11 was 88%, and the year 12 was 55%. The State average showed the year 10 cohort was 102% of the year 8, the year 11, 95% and the year 12, 76%. The lack of students completing high school reduces both the skilled labour available and those eligible to attend tertiary education.
42
Pilbara workforce development plan 2013–2016
The education and training institutions available in the Pilbara include: 21 primary schools, six high schools, six community schools, 10 State Training Provider campuses and two college campuses, together with four other education outlets.
Lower than average rates of enrolment (relative to the size of the population) is exacerbated by parents often transferring their children out of the local schooling system as they transition from primary to high school. High school and tertiary student numbers are as a consequence below typical participation rates.
Highest level of schoolingThe highest level of schooling achieved by residents in the Pilbara is lower than the State average. In 2010, only 80.0% of year 12 students at Pilbara public schools graduated, compared with 87.0% for all public schools in Western Australia (Pilbara Development Commission August 2011).
According to the 2011 Census data, Aboriginal residents in the Pilbara have a lower average level of schooling completed relative to Western Australia’s Aboriginal population. In the Pilbara, 19.4% of Aboriginal adult residents had completed year 12, ranging from 18.9% in the Town of Port Hedland to 20.1% in Shires of Roebourne and Ashburton. This compares to 20.6% rate for total Western Australia’s Aboriginal population (Australian Bureau of Statistics 2011b).
43

Post school qualificationsIt is forecast that 92.5% of all new jobs created between 2010 and 2017 will require post school qualifications (Skilling WA). The Pilbara will need to increase either the number of people eligible for and completing post school qualifications at institutions within the region or import more qualified workers to increase the size of the Pilbara’s workforce.
According to the 2011 Census, 56.7% of adult residents have post school qualifications in Western Australia. In the Pilbara, the average is 66.8%, being 65.6% in the Shire of East Pilbara, 65.7% in the Shire of Ashburton, 68.4% in the Shire of Roebourne and 66.1% in the Town of Port Hedland (Australian Bureau of Statistics 2011e).
Source: Australian Bureau of Statistics 2011e, Population Census.
Figure 3.9: Post school qualifications of Pilbara and Western Australian residents 2011
Postgraduate degree Graduate diploma and certificate
Bachelor degree Advanced diploma and diploma
Certificate
35%
30%
25%
20%
15%
10%
5%
0
The higher proportion of post school qualifications of adult residents in the Pilbara highlights the nature of industries and work performed. There is a divergence in qualifications within the Pilbara workforce compared to Western Australia overall, with a higher proportion of workers who have not completed year 12, but also a higher proportion of post school qualifications (attributable to skilled migrants attracted to the region).
Ashburton (S) East Pilbara (S) Port Hedland (T) Roebourne (S) WA
44
Pilbara workforce development plan 2013–2016
Training deliveryVocational education and training is likely to be the key means of providing the post school qualified workforce in the Pilbara. Vocational education and training apprenticeships and traineeships are undertaken at the six community schools, four other education outlets, 10 State Training Provider campuses and two college campuses, as well as private training providers.
The Department of Training and Workforce Development’s VET Enrolments Data Collection (2011) indicates that in 2010 there were a total of 5150 students funded under the National Training Agreement enrolled in vocational education and training courses in the Pilbara, predominantly studying certificate II and III level qualifications.
Apprenticeships and traineeships were undertaken by 1472 people in the Pilbara as at 31 December 2011. The majority of apprentices and trainees who were living in the Pilbara and ‘in training’5 were males undertaking certificate III level courses (Department of Training and Workforce Development, TRS data, December 2011).
Partnerships for deliveryEducation delivery arrangements in the Pilbara are unique due to the geographical remoteness of the region, the scale of local resource sector demand for skilled workers and the predominance of the resource sector as the major local employer. This unique situation has resulted in a number of innovative models for education delivery. In particular, there has been an increased role played by iron ore, gas and oil industry employers in education and training, and the development of various industry-education institution partnerships. These partnership arrangements are formed primarily to benefit community and industry through the identification of improved employment and qualification pathways for local residents.
Challenges for education and training deliveryAccess to quality education has been identified as one of the main reasons families/households are reluctant to move to and remain in the Pilbara. Education outcomes and opportunities are perceived to be of a lower standard than that achieved generally throughout the State, leading to the view that education in the metropolitan area and other large regional centres is of a higher quality, with more choice and greater opportunity.
Challenges for education provision in the Pilbara relate to distance and relative isolation, climatic and environmental conditions, as well as the perceived inferior lifestyle and facilities available compared with the metropolitan area and some other regional areas. This leads to students travelling elsewhere for training, and education institutions being unable to attract quality staff. Lower student numbers in turn make it difficult to justify a full complement of courses compared with the metropolitan area or the payment of above average salaries to attract staff. The lack of curriculum breadth, depth and quality limits the attraction of high performing staff who may seek a more diverse curriculum range.
5 ‘In training’ is a snapshot count of apprentices and trainees with a training contract at a point in time.
45
For some courses however, opposing trends have emerged, where enrolments for courses have reached saturation and there are challenges providing adequate infrastructure. Examples of such courses include electrical, fabrication and mechanical, health and allied health services and ‘High Risk Licence’ training. Additionally, flexible assessment approaches, such as Transforming the Trades, have not received the necessary support of employers to be viable on a large scale.
The challenges and barriers to achieving education and training outcomes are various but can be experienced simultaneously. Challenges occur at enrolment or the commencement of studies and during the course. Personal challenges to enrolling and maintaining studies, particularly among disadvantaged groups, include continued domestic responsibilities, a lack of income, a lack of personal transport, a lack of access to computers out of class and poor nutrition.
Students may also face institutional challenges, such as high costs for training, insufficient access to training facilities, insufficient recognition of individual learning styles, insufficient support for learners and inappropriate assessment.
Challenges also exist for the high number of FIFO personnel seeking to up-skill, for whom it is difficult to attend classes in person or even online. Limited on the job training may be provided in some circumstances, but only some training at particular levels can be offered in this manner.
Aboriginal training faces particular challenges where communities demonstrate a comparatively low affinity with the concept of lifelong formal learning, demonstrate a more limited preparedness for school commencement and offer limited support for schooling and homework activities at home. Where courses are popular with Aboriginal students and reach saturation, there is not the infrastructure available to expand the offering.
Aboriginal participationThe Aboriginal and Torres Strait Islander population in the Pilbara is a key demographic for consideration. In addition to accounting for approximately 17% of the regional population (Department of Regional Development and Lands 2011a), the participation of Aboriginal people in the workforce is a particular strategic focus of Skilling WA.
Accurately characterising the Pilbara’s Aboriginal population is relatively difficult. The majority of readily quantifiable data is sourced from the 2011 Census. The Census figures are subject to undercount, as well as responses with unknown Aboriginal status and as a result the Census figures underestimate the region’s actual Aboriginal population. The Census figures are best interpreted as broad indicators and actual numbers should be treated with caution. Table 3.9 summarises key workforce issues/trends relating to Aboriginal workforce participation in the Pilbara.
46
Pilbara workforce development plan 2013–2016
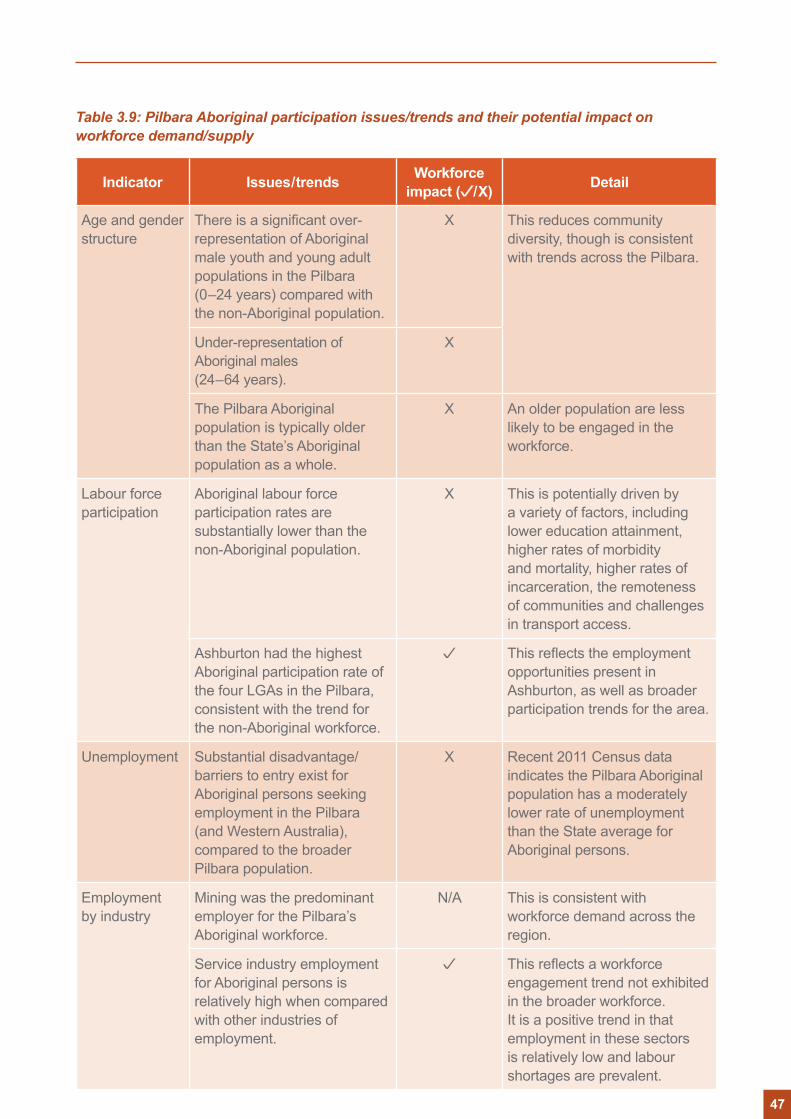
Table 3.9: Pilbara Aboriginal participation issues/trends and their potential impact on workforce demand/supply
Indicator Issues/trends Workforce impact ( /X) Detail
Age and gender structure
There is a significant over-representation of Aboriginal male youth and young adult populations in the Pilbara (0–24 years) compared with the non-Aboriginal population.
X This reduces community diversity, though is consistent with trends across the Pilbara.
Under-representation of Aboriginal males (24–64 years).
X
The Pilbara Aboriginal population is typically older than the State’s Aboriginal population as a whole.
X An older population are less likely to be engaged in the workforce.
Labour force participation
Aboriginal labour force participation rates are substantially lower than the non-Aboriginal population.
X This is potentially driven by a variety of factors, including lower education attainment, higher rates of morbidity and mortality, higher rates of incarceration, the remoteness of communities and challenges in transport access.
Ashburton had the highest Aboriginal participation rate of the four LGAs in the Pilbara, consistent with the trend for the non-Aboriginal workforce.
This reflects the employment opportunities present in Ashburton, as well as broader participation trends for the area.
Unemployment Substantial disadvantage/barriers to entry exist for Aboriginal persons seeking employment in the Pilbara (and Western Australia), compared to the broader Pilbara population.
X Recent 2011 Census data indicates the Pilbara Aboriginal population has a moderately lower rate of unemployment than the State average for Aboriginal persons.
Employment by industry
Mining was the predominant employer for the Pilbara’s Aboriginal workforce.
N/A This is consistent with workforce demand across the region.
Service industry employment for Aboriginal persons is relatively high when compared with other industries of employment.
This reflects a workforce engagement trend not exhibited in the broader workforce. It is a positive trend in that employment in these sectors is relatively low and labour shortages are prevalent.
47
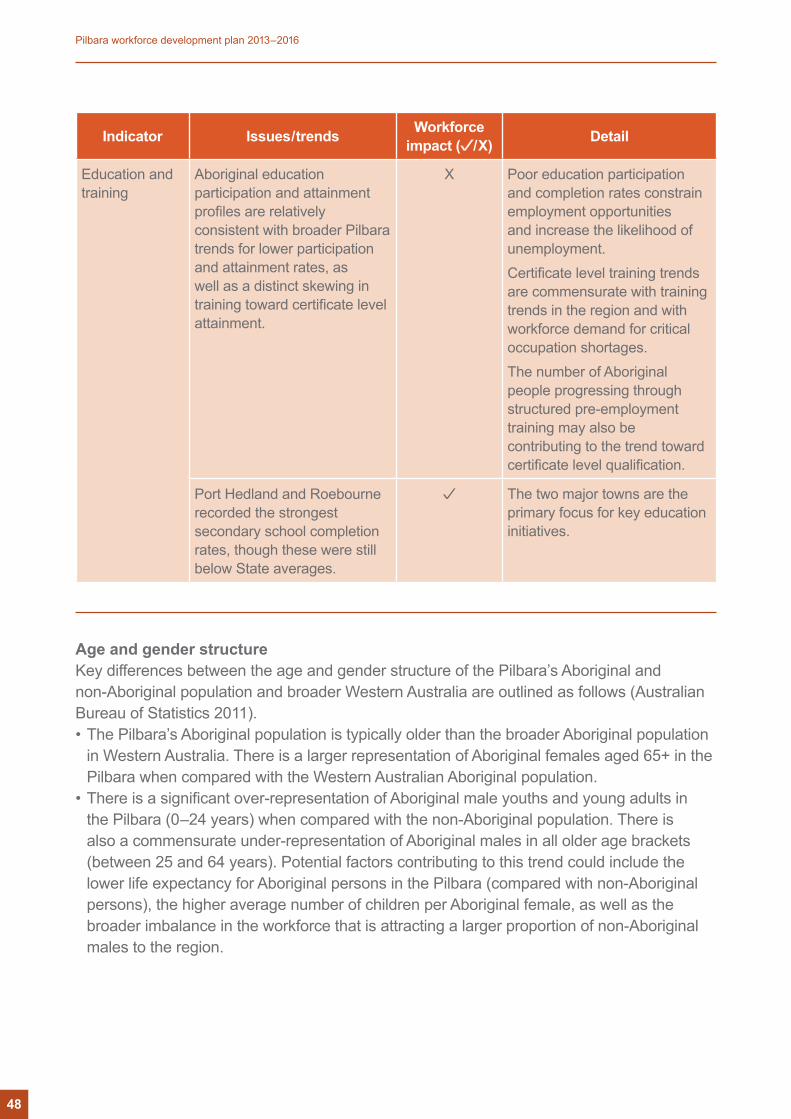
Indicator Issues/trends Workforce impact ( /X) Detail
Education and training
Aboriginal education participation and attainment profiles are relatively consistent with broader Pilbara trends for lower participation and attainment rates, as well as a distinct skewing in training toward certificate level attainment.
X Poor education participation and completion rates constrain employment opportunities and increase the likelihood of unemployment.Certificate level training trends are commensurate with training trends in the region and with workforce demand for critical occupation shortages.The number of Aboriginal people progressing through structured pre-employment training may also be contributing to the trend toward certificate level qualification.
Port Hedland and Roebourne recorded the strongest secondary school completion rates, though these were still below State averages.
The two major towns are the primary focus for key education initiatives.
Age and gender structureKey differences between the age and gender structure of the Pilbara’s Aboriginal and non-Aboriginal population and broader Western Australia are outlined as follows (Australian Bureau of Statistics 2011).• The Pilbara’s Aboriginal population is typically older than the broader Aboriginal population
in Western Australia. There is a larger representation of Aboriginal females aged 65+ in the Pilbara when compared with the Western Australian Aboriginal population.
• There is a significant over-representation of Aboriginal male youths and young adults in the Pilbara (0–24 years) when compared with the non-Aboriginal population. There is also a commensurate under-representation of Aboriginal males in all older age brackets (between 25 and 64 years). Potential factors contributing to this trend could include the lower life expectancy for Aboriginal persons in the Pilbara (compared with non-Aboriginal persons), the higher average number of children per Aboriginal female, as well as the broader imbalance in the workforce that is attracting a larger proportion of non-Aboriginal males to the region.
48
Pilbara workforce development plan 2013–2016
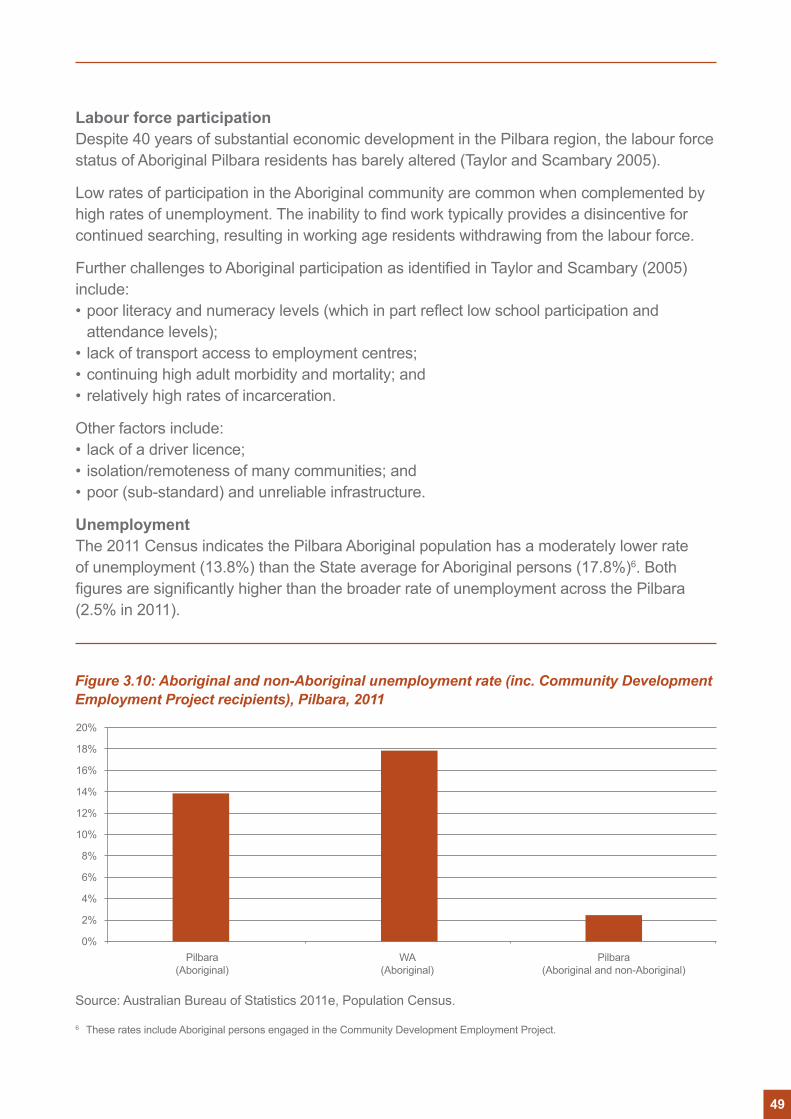
Labour force participationDespite 40 years of substantial economic development in the Pilbara region, the labour force status of Aboriginal Pilbara residents has barely altered (Taylor and Scambary 2005).
Low rates of participation in the Aboriginal community are common when complemented by high rates of unemployment. The inability to find work typically provides a disincentive for continued searching, resulting in working age residents withdrawing from the labour force.
Further challenges to Aboriginal participation as identified in Taylor and Scambary (2005) include:• poor literacy and numeracy levels (which in part reflect low school participation and
attendance levels);• lack of transport access to employment centres;• continuing high adult morbidity and mortality; and• relatively high rates of incarceration.
Other factors include:• lack of a driver licence;• isolation/remoteness of many communities; and• poor (sub-standard) and unreliable infrastructure.
UnemploymentThe 2011 Census indicates the Pilbara Aboriginal population has a moderately lower rate of unemployment (13.8%) than the State average for Aboriginal persons (17.8%)6. Both figures are significantly higher than the broader rate of unemployment across the Pilbara (2.5% in 2011).
Source: Australian Bureau of Statistics 2011e, Population Census.
Figure 3.10: Aboriginal and non-Aboriginal unemployment rate (inc. Community Development Employment Project recipients), Pilbara, 2011
20%
14%
18%
12%
16%
8%
10%
4%
6%
0%
2%
Pilbara (Aboriginal)
Pilbara (Aboriginal and non-Aboriginal)
WA (Aboriginal)
6 These rates include Aboriginal persons engaged in the Community Development Employment Project.
49
Employment by industryAccording to the Australian Bureau of Statistics (2011), mining employs the greatest number of Aboriginal persons in the Pilbara, (917 persons, 41.3% of the employed Aboriginal workforce in the Pilbara), compared with 35.3% share for total employed in the region.
Outside of mining, service industries are the major employers for Aboriginal persons. This includes construction (9.1% of the employed Aboriginal workforce); health care and social assistance (7.6%); education and training (7.1%); and public administration and safety (5.9%).
Education and trainingAccording to the Australian Bureau of Statistics (2011b) 12.2% of Aboriginal adult persons residing in the Pilbara left school in year 8 or earlier or did not go to school at all, compared with 10.7% for Aboriginal persons across the State. These rates varied across the region from 7.5% for the Shire of Roebourne, followed by 11.2% for the Shire of Ashburton and 11.6% for the Town of Port Hedland, with the Shire of East Pilbara experiencing the highest proportion of low levels of educational attainment with their rate being 18.1%. This outcome is partly related to the regional distribution of educational facilities in Pilbara.
As stated earlier (in the Highest level of schooling section), year 12 completion rates were lower for Aboriginal persons in the Pilbara, with all four LGAs recording a lower rate in 2011 than the State average for Aboriginal population.
In the Pilbara, 39.3% of adult resident Aboriginal population had post school qualifications, compared to 37.8% for the whole of Western Australia’s Aboriginal population. Pilbara’s Aboriginal population was under-represented in the bachelor degree and above and advanced diploma/diploma levels and over-represented in the certificate level. This was consistent across all four of the Pilbara’s LGAs.
Specifically, when compared between the LGAs, the Shire of Roebourne had the highest level of post school qualifications at 44.7% of their Aboriginal population, compared to the lowest for the Shire of Ashburton at 30.9%. For the certificate level, the Shire of Ashburton had 18.0%; the highest percentage of their Aboriginal population holding this level of qualification, compared to 15.3% for the Shire of East Pilbara.
Regional infrastructureThe Pilbara Planning and Infrastructure Framework was released in January 2012. The infrastructure priorities articulated in the framework are a succinct summary pertinent to this Pilbara workforce development plan 2013–2016.
The delivery of the infrastructure priorities identified in the framework will be critical to supporting the attraction and retention of workers to the region, the expansion of the residential footprint in key towns and the ongoing growth and diversification of the local economy. Furthermore, the timeframe for delivery of the identified priority infrastructure assets is reasonably consistent between the framework and this workforce development plan.
50
Pilbara workforce development plan 2013–2016
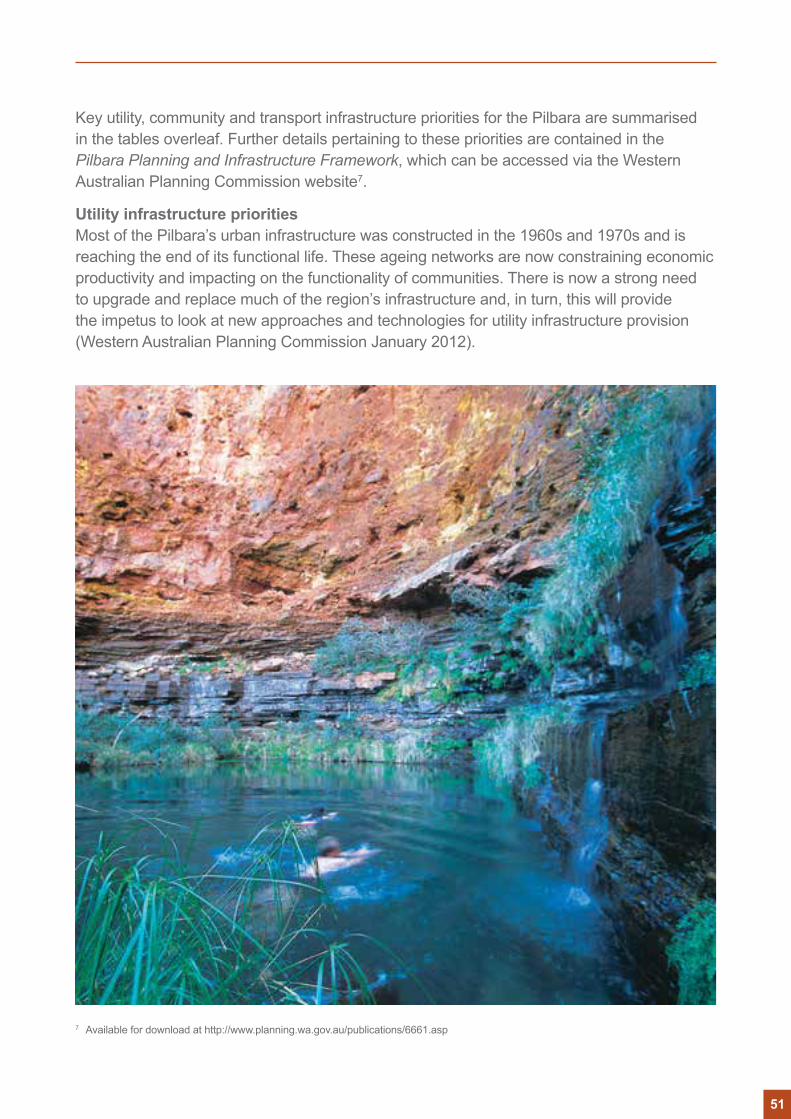
Key utility, community and transport infrastructure priorities for the Pilbara are summarised in the tables overleaf. Further details pertaining to these priorities are contained in the Pilbara Planning and Infrastructure Framework, which can be accessed via the Western Australian Planning Commission website7.
Utility infrastructure prioritiesMost of the Pilbara’s urban infrastructure was constructed in the 1960s and 1970s and is reaching the end of its functional life. These ageing networks are now constraining economic productivity and impacting on the functionality of communities. There is now a strong need to upgrade and replace much of the region’s infrastructure and, in turn, this will provide the impetus to look at new approaches and technologies for utility infrastructure provision (Western Australian Planning Commission January 2012).
7 Available for download at http://www.planning.wa.gov.au/publications/6661.asp
51
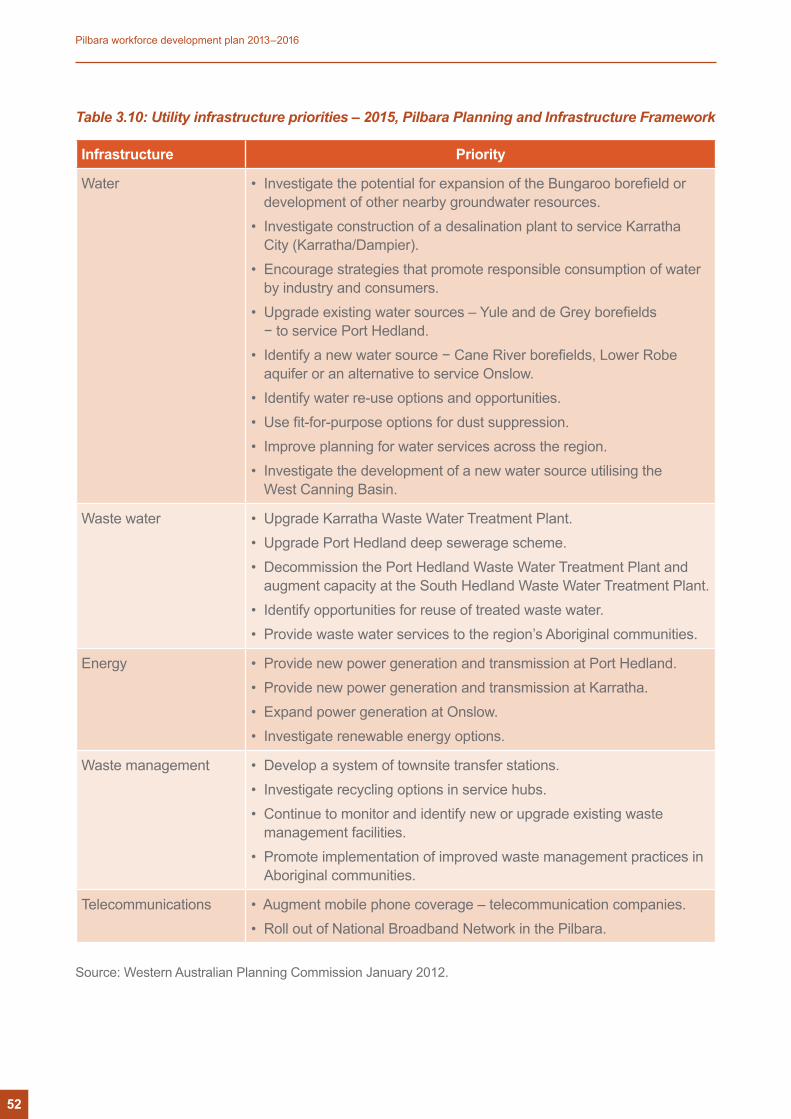
Table 3.10: Utility infrastructure priorities – 2015, Pilbara Planning and Infrastructure Framework
Infrastructure Priority
Water • Investigate the potential for expansion of the Bungaroo borefield or development of other nearby groundwater resources.
• Investigate construction of a desalination plant to service Karratha City (Karratha/Dampier).
• Encourage strategies that promote responsible consumption of water by industry and consumers.
• Upgrade existing water sources – Yule and de Grey borefields − to service Port Hedland.
• Identify a new water source − Cane River borefields, Lower Robe aquifer or an alternative to service Onslow.
• Identify water re-use options and opportunities.• Use fit-for-purpose options for dust suppression.• Improve planning for water services across the region.• Investigate the development of a new water source utilising the
West Canning Basin.
Waste water • Upgrade Karratha Waste Water Treatment Plant.• Upgrade Port Hedland deep sewerage scheme.• Decommission the Port Hedland Waste Water Treatment Plant and
augment capacity at the South Hedland Waste Water Treatment Plant.• Identify opportunities for reuse of treated waste water.• Provide waste water services to the region’s Aboriginal communities.
Energy • Provide new power generation and transmission at Port Hedland.• Provide new power generation and transmission at Karratha.• Expand power generation at Onslow.• Investigate renewable energy options.
Waste management • Develop a system of townsite transfer stations.• Investigate recycling options in service hubs.• Continue to monitor and identify new or upgrade existing waste
management facilities.• Promote implementation of improved waste management practices in
Aboriginal communities.
Telecommunications • Augment mobile phone coverage – telecommunication companies.• Roll out of National Broadband Network in the Pilbara.
Source: Western Australian Planning Commission January 2012.
52
Pilbara workforce development plan 2013–2016
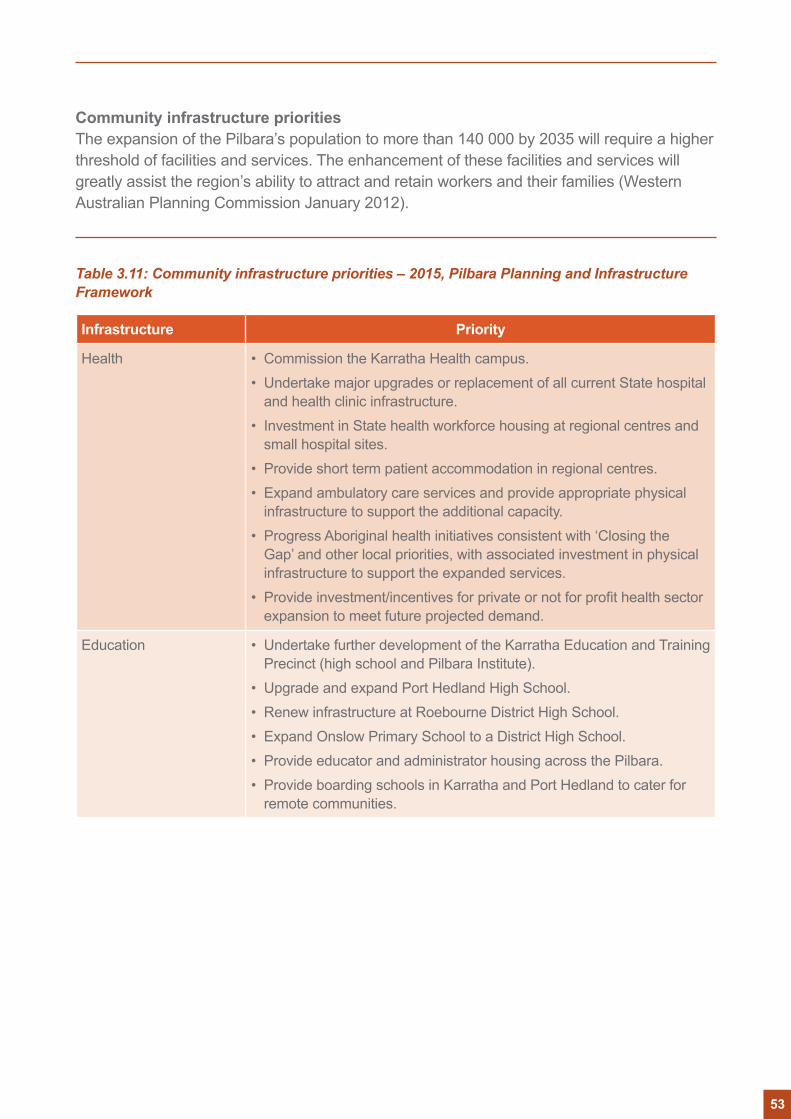
Community infrastructure prioritiesThe expansion of the Pilbara’s population to more than 140 000 by 2035 will require a higher threshold of facilities and services. The enhancement of these facilities and services will greatly assist the region’s ability to attract and retain workers and their families (Western Australian Planning Commission January 2012).
Table 3.11: Community infrastructure priorities – 2015, Pilbara Planning and Infrastructure Framework
Infrastructure Priority
Health • Commission the Karratha Health campus.• Undertake major upgrades or replacement of all current State hospital
and health clinic infrastructure.• Investment in State health workforce housing at regional centres and
small hospital sites.• Provide short term patient accommodation in regional centres.• Expand ambulatory care services and provide appropriate physical
infrastructure to support the additional capacity.• Progress Aboriginal health initiatives consistent with ‘Closing the
Gap’ and other local priorities, with associated investment in physical infrastructure to support the expanded services.
• Provide investment/incentives for private or not for profit health sector expansion to meet future projected demand.
Education • Undertake further development of the Karratha Education and Training Precinct (high school and Pilbara Institute).
• Upgrade and expand Port Hedland High School.• Renew infrastructure at Roebourne District High School.• Expand Onslow Primary School to a District High School.• Provide educator and administrator housing across the Pilbara.• Provide boarding schools in Karratha and Port Hedland to cater for
remote communities.
53
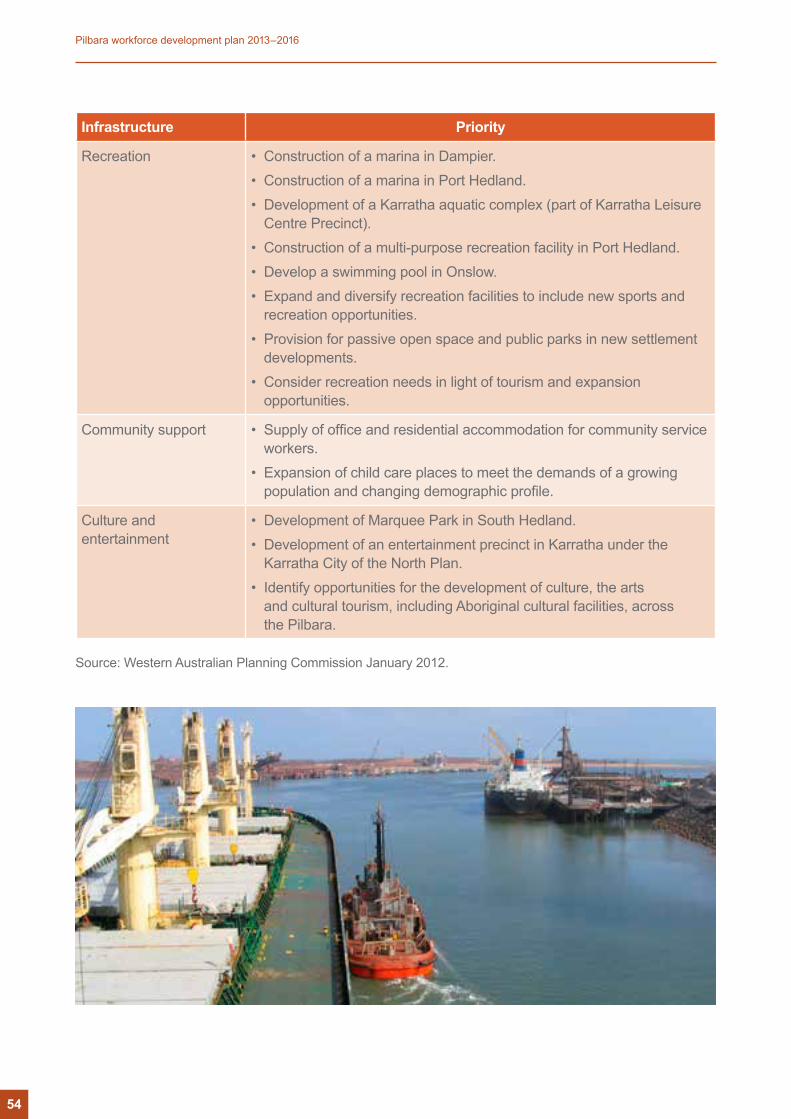
Infrastructure Priority
Recreation • Construction of a marina in Dampier.• Construction of a marina in Port Hedland.• Development of a Karratha aquatic complex (part of Karratha Leisure
Centre Precinct).• Construction of a multi-purpose recreation facility in Port Hedland.• Develop a swimming pool in Onslow.• Expand and diversify recreation facilities to include new sports and
recreation opportunities.• Provision for passive open space and public parks in new settlement
developments.• Consider recreation needs in light of tourism and expansion
opportunities.
Community support • Supply of office and residential accommodation for community service workers.
• Expansion of child care places to meet the demands of a growing population and changing demographic profile.
Culture and entertainment
• Development of Marquee Park in South Hedland.• Development of an entertainment precinct in Karratha under the
Karratha City of the North Plan.• Identify opportunities for the development of culture, the arts
and cultural tourism, including Aboriginal cultural facilities, across the Pilbara.
Source: Western Australian Planning Commission January 2012.
54
Pilbara workforce development plan 2013–2016
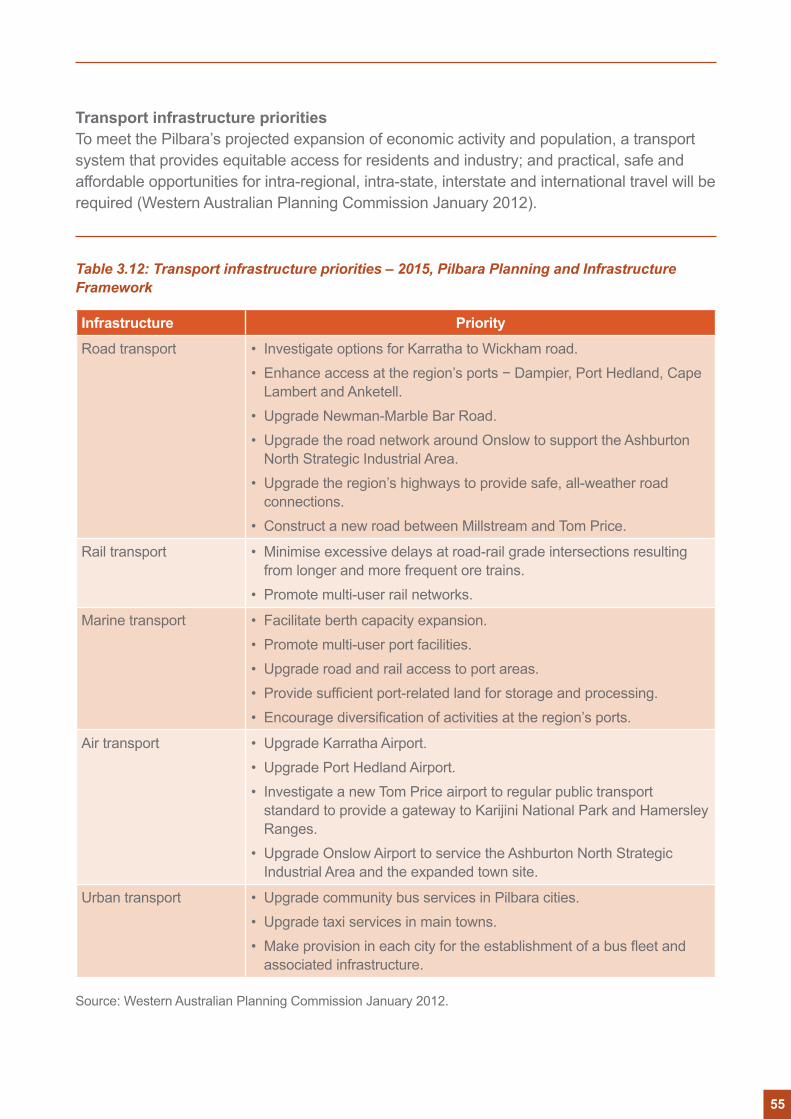
Transport infrastructure prioritiesTo meet the Pilbara’s projected expansion of economic activity and population, a transport system that provides equitable access for residents and industry; and practical, safe and affordable opportunities for intra-regional, intra-state, interstate and international travel will be required (Western Australian Planning Commission January 2012).
Table 3.12: Transport infrastructure priorities – 2015, Pilbara Planning and Infrastructure Framework
Infrastructure Priority
Road transport • Investigate options for Karratha to Wickham road.• Enhance access at the region’s ports − Dampier, Port Hedland, Cape
Lambert and Anketell.• Upgrade Newman-Marble Bar Road.• Upgrade the road network around Onslow to support the Ashburton
North Strategic Industrial Area.• Upgrade the region’s highways to provide safe, all-weather road
connections.• Construct a new road between Millstream and Tom Price.
Rail transport • Minimise excessive delays at road-rail grade intersections resulting from longer and more frequent ore trains.
• Promote multi-user rail networks.
Marine transport • Facilitate berth capacity expansion.• Promote multi-user port facilities.• Upgrade road and rail access to port areas.• Provide sufficient port-related land for storage and processing.• Encourage diversification of activities at the region’s ports.
Air transport • Upgrade Karratha Airport.• Upgrade Port Hedland Airport.• Investigate a new Tom Price airport to regular public transport
standard to provide a gateway to Karijini National Park and Hamersley Ranges.
• Upgrade Onslow Airport to service the Ashburton North Strategic Industrial Area and the expanded town site.
Urban transport • Upgrade community bus services in Pilbara cities.• Upgrade taxi services in main towns.• Make provision in each city for the establishment of a bus fleet and
associated infrastructure.
Source: Western Australian Planning Commission January 2012.
55
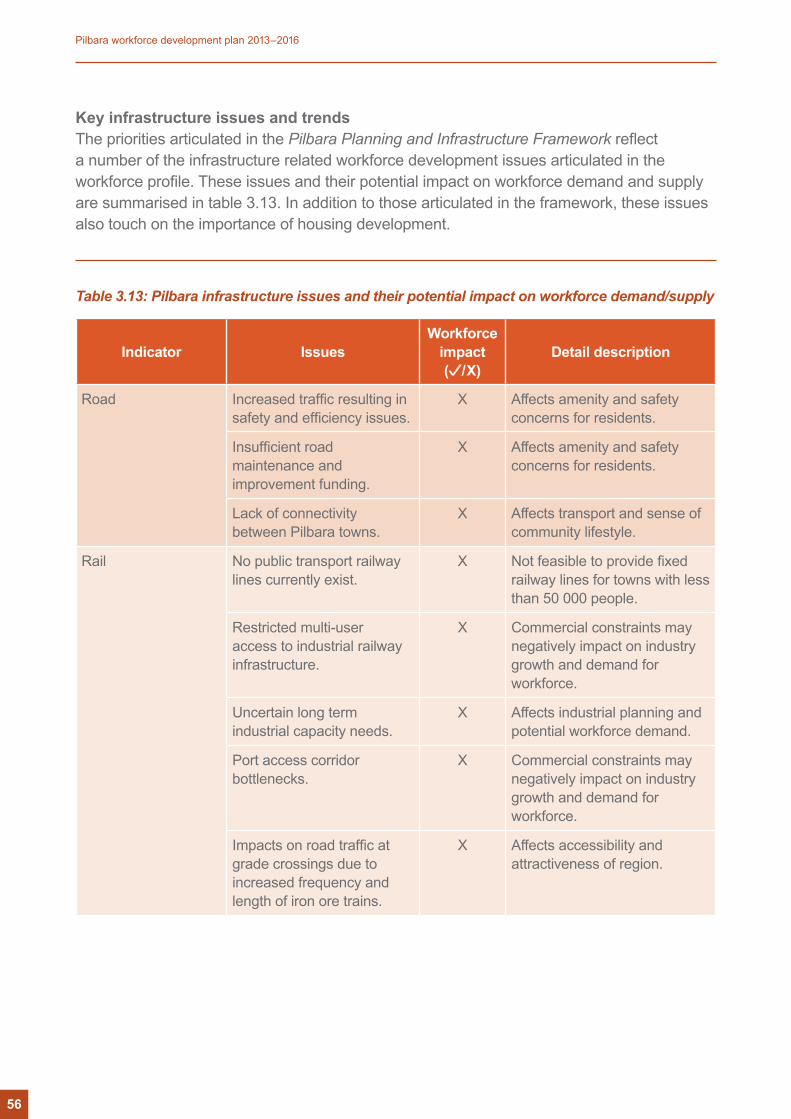
Key infrastructure issues and trends The priorities articulated in the Pilbara Planning and Infrastructure Framework reflect a number of the infrastructure related workforce development issues articulated in the workforce profile. These issues and their potential impact on workforce demand and supply are summarised in table 3.13. In addition to those articulated in the framework, these issues also touch on the importance of housing development.
Table 3.13: Pilbara infrastructure issues and their potential impact on workforce demand/supply
Indicator IssuesWorkforce
impact ( /X)
Detail description
Road Increased traffic resulting in safety and efficiency issues.
X Affects amenity and safety concerns for residents.
Insufficient road maintenance and improvement funding.
X Affects amenity and safety concerns for residents.
Lack of connectivity between Pilbara towns.
X Affects transport and sense of community lifestyle.
Rail No public transport railway lines currently exist.
X Not feasible to provide fixed railway lines for towns with less than 50 000 people.
Restricted multi-user access to industrial railway infrastructure.
X Commercial constraints may negatively impact on industry growth and demand for workforce.
Uncertain long term industrial capacity needs.
X Affects industrial planning and potential workforce demand.
Port access corridor bottlenecks.
X Commercial constraints may negatively impact on industry growth and demand for workforce.
Impacts on road traffic at grade crossings due to increased frequency and length of iron ore trains.
X Affects accessibility and attractiveness of region.
56
Pilbara workforce development plan 2013–2016
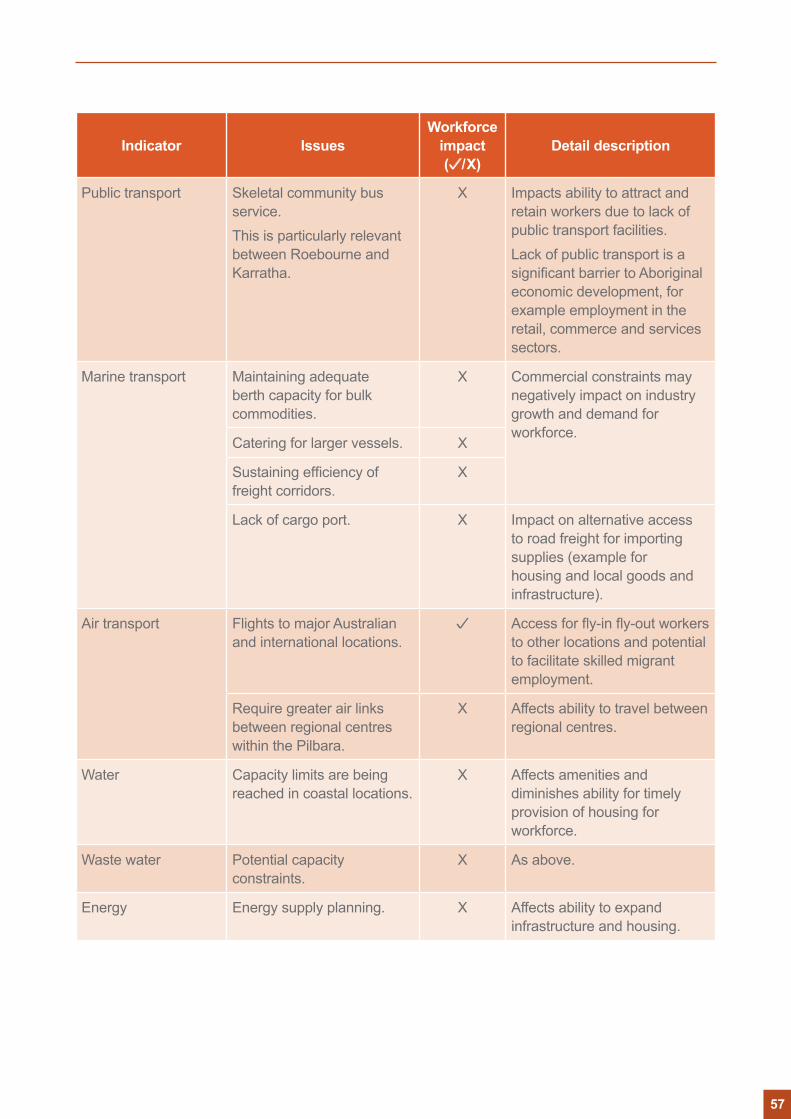
Indicator IssuesWorkforce
impact ( /X)
Detail description
Public transport Skeletal community bus service.This is particularly relevant between Roebourne and Karratha.
X Impacts ability to attract and retain workers due to lack of public transport facilities.Lack of public transport is a significant barrier to Aboriginal economic development, for example employment in the retail, commerce and services sectors.
Marine transport Maintaining adequate berth capacity for bulk commodities.
X Commercial constraints may negatively impact on industry growth and demand for workforce.
Catering for larger vessels. X
Sustaining efficiency of freight corridors.
X
Lack of cargo port. X Impact on alternative access to road freight for importing supplies (example for housing and local goods and infrastructure).
Air transport Flights to major Australian and international locations.
Access for fly-in fly-out workers to other locations and potential to facilitate skilled migrant employment.
Require greater air links between regional centres within the Pilbara.
X Affects ability to travel between regional centres.
Water Capacity limits are being reached in coastal locations.
X Affects amenities and diminishes ability for timely provision of housing for workforce.
Waste water Potential capacity constraints.
X As above.
Energy Energy supply planning. X Affects ability to expand infrastructure and housing.
57
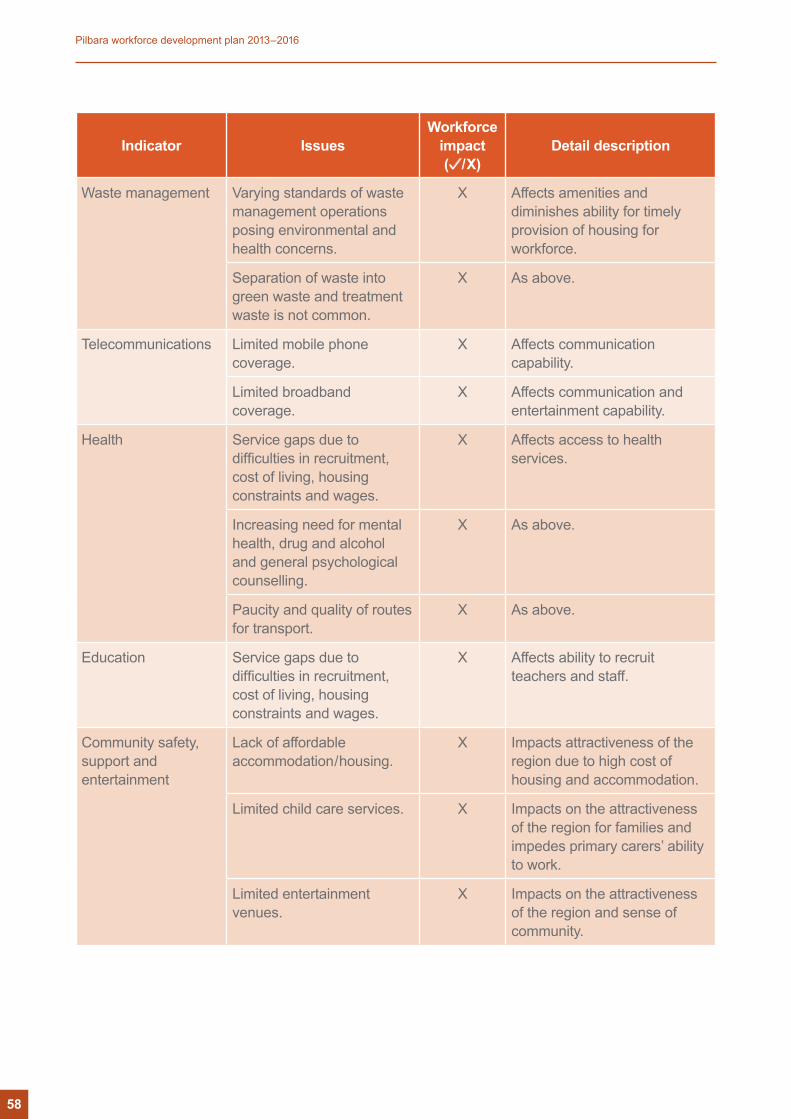
Indicator IssuesWorkforce
impact ( /X)
Detail description
Waste management Varying standards of waste management operations posing environmental and health concerns.
X Affects amenities and diminishes ability for timely provision of housing for workforce.
Separation of waste into green waste and treatment waste is not common.
X As above.
Telecommunications Limited mobile phone coverage.
X Affects communication capability.
Limited broadband coverage.
X Affects communication and entertainment capability.
Health Service gaps due to difficulties in recruitment, cost of living, housing constraints and wages.
X Affects access to health services.
Increasing need for mental health, drug and alcohol and general psychological counselling.
X As above.
Paucity and quality of routes for transport.
X As above.
Education Service gaps due to difficulties in recruitment, cost of living, housing constraints and wages.
X Affects ability to recruit teachers and staff.
Community safety, support and entertainment
Lack of affordable accommodation/housing.
X Impacts attractiveness of the region due to high cost of housing and accommodation.
Limited child care services. X Impacts on the attractiveness of the region for families and impedes primary carers’ ability to work.
Limited entertainment venues.
X Impacts on the attractiveness of the region and sense of community.
58
Pilbara workforce development plan 2013–2016
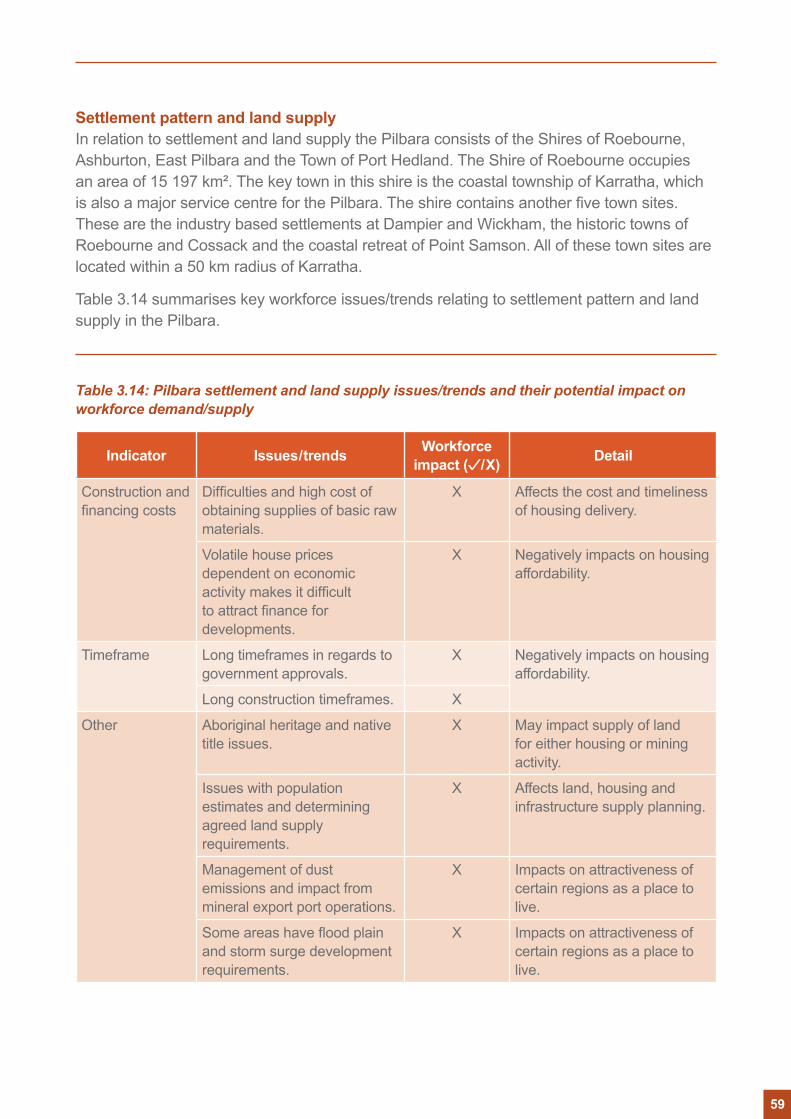
Settlement pattern and land supplyIn relation to settlement and land supply the Pilbara consists of the Shires of Roebourne, Ashburton, East Pilbara and the Town of Port Hedland. The Shire of Roebourne occupies an area of 15 197 km². The key town in this shire is the coastal township of Karratha, which is also a major service centre for the Pilbara. The shire contains another five town sites. These are the industry based settlements at Dampier and Wickham, the historic towns of Roebourne and Cossack and the coastal retreat of Point Samson. All of these town sites are located within a 50 km radius of Karratha.
Table 3.14 summarises key workforce issues/trends relating to settlement pattern and land supply in the Pilbara.
Table 3.14: Pilbara settlement and land supply issues/trends and their potential impact on workforce demand/supply
Indicator Issues/trends Workforce impact ( /X) Detail
Construction and financing costs
Difficulties and high cost of obtaining supplies of basic raw materials.
X Affects the cost and timeliness of housing delivery.
Volatile house prices dependent on economic activity makes it difficult to attract finance for developments.
X Negatively impacts on housing affordability.
Timeframe Long timeframes in regards to government approvals.
X Negatively impacts on housing affordability.
Long construction timeframes. X
Other Aboriginal heritage and native title issues.
X May impact supply of land for either housing or mining activity.
Issues with population estimates and determining agreed land supply requirements.
X Affects land, housing and infrastructure supply planning.
Management of dust emissions and impact from mineral export port operations.
X Impacts on attractiveness of certain regions as a place to live.
Some areas have flood plain and storm surge development requirements.
X Impacts on attractiveness of certain regions as a place to live.
59
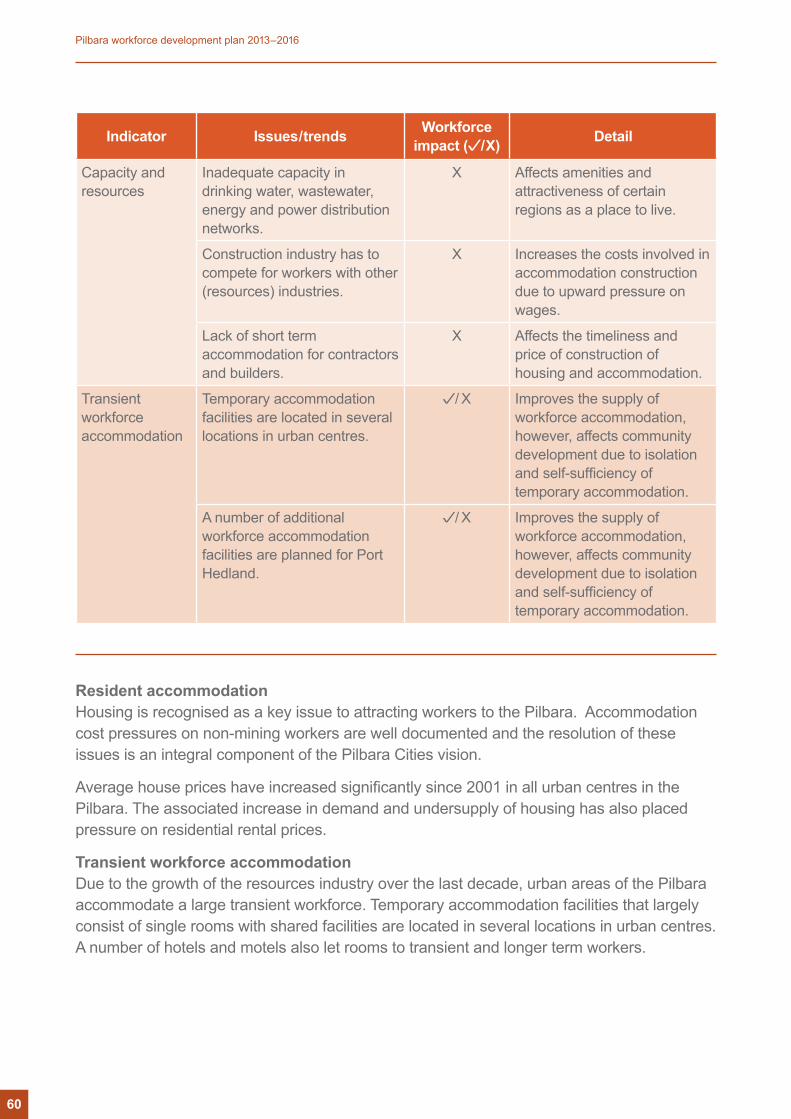
Indicator Issues/trends Workforce impact ( /X) Detail
Capacity and resources
Inadequate capacity in drinking water, wastewater, energy and power distribution networks.
X Affects amenities and attractiveness of certain regions as a place to live.
Construction industry has to compete for workers with other (resources) industries.
X Increases the costs involved in accommodation construction due to upward pressure on wages.
Lack of short term accommodation for contractors and builders.
X Affects the timeliness and price of construction of housing and accommodation.
Transient workforce accommodation
Temporary accommodation facilities are located in several locations in urban centres.
/ X Improves the supply of workforce accommodation, however, affects community development due to isolation and self-sufficiency of temporary accommodation.
A number of additional workforce accommodation facilities are planned for Port Hedland.
/ X Improves the supply of workforce accommodation, however, affects community development due to isolation and self-sufficiency of temporary accommodation.
Resident accommodationHousing is recognised as a key issue to attracting workers to the Pilbara. Accommodation cost pressures on non-mining workers are well documented and the resolution of these issues is an integral component of the Pilbara Cities vision.
Average house prices have increased significantly since 2001 in all urban centres in the Pilbara. The associated increase in demand and undersupply of housing has also placed pressure on residential rental prices.
Transient workforce accommodationDue to the growth of the resources industry over the last decade, urban areas of the Pilbara accommodate a large transient workforce. Temporary accommodation facilities that largely consist of single rooms with shared facilities are located in several locations in urban centres. A number of hotels and motels also let rooms to transient and longer term workers.
60
Pilbara workforce development plan 2013–2016
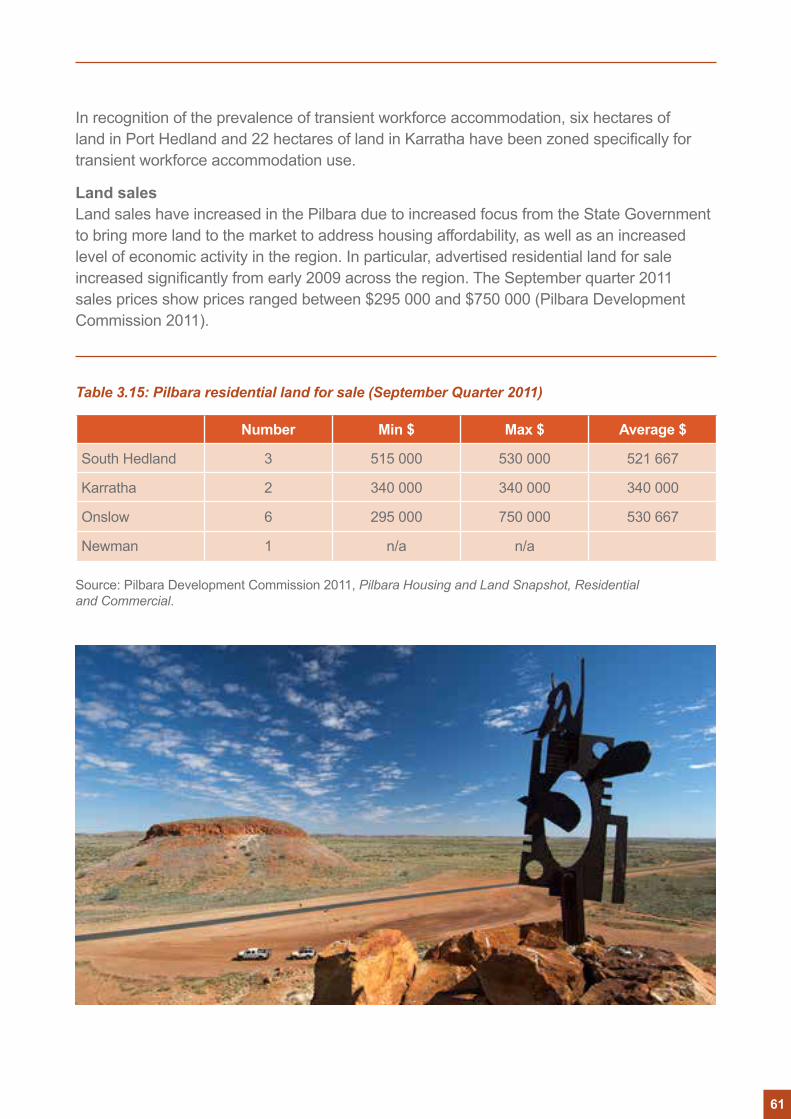
In recognition of the prevalence of transient workforce accommodation, six hectares of land in Port Hedland and 22 hectares of land in Karratha have been zoned specifically for transient workforce accommodation use.
Land salesLand sales have increased in the Pilbara due to increased focus from the State Government to bring more land to the market to address housing affordability, as well as an increased level of economic activity in the region. In particular, advertised residential land for sale increased significantly from early 2009 across the region. The September quarter 2011 sales prices show prices ranged between $295 000 and $750 000 (Pilbara Development Commission 2011).
Table 3.15: Pilbara residential land for sale (September Quarter 2011)
Number Min $ Max $ Average $
South Hedland 3 515 000 530 000 521 667
Karratha 2 340 000 340 000 340 000
Onslow 6 295 000 750 000 530 667
Newman 1 n/a n/a
Source: Pilbara Development Commission 2011, Pilbara Housing and Land Snapshot, Residential and Commercial.
61
Residential landAccording to the Western Australian Planning Commission’s regional hotspots and land supply updates, there are large amounts of undeveloped zoned land around Karratha (1164 hectares) and comparatively limited undeveloped land around Port Hedland, Onslow and Newman (115 hectares, 94 hectares and 72 hectares respectively).
Development of this land however, is constrained by a number of factors.
Table 3.16: Factors influencing land development
Factor
Cost • Difficulties and high cost of obtaining supplies of basic raw materials.• Volatile house prices dependent on economic activity makes it difficult to
attract finance for developments.
Timeframe • Long timeframes in regards to government approvals.• Long construction timeframes.
Capacity • Inadequate capacity in drinking water, wastewater, energy and power distribution networks.
• Construction industry has to compete for workers with other industries.• Lack of short term accommodation for contractors and builders.
Other • Aboriginal heritage and native title issues.• Issues with population estimates and determining agreed land supply
requirements.• Management of dust emissions and impact from mineral export port
operations.• Some areas have flood plain and storm surge development requirements.
Advertised commercial and industrial property sales have increased since early 2010. The increase in the number of properties advertised for sale has placed downward pressure on the average advertised sales price. Over this same period, land sales and their average price has fluctuated.
62
Pilbara workforce development plan 2013–2016
Sustained growth in the demand for resources sector workers in the Pilbara has the potential to produce significant economic benefits if the demand for workers can be met with a suitably qualified workforce. Potential economic benefits include increased economic activity and growth in regional GDP, while challenges potentially include occupational shortages, increased wage competition and foregone productivity and output.
The Pilbara is already experiencing occupational shortages in a variety of industries, with the Pilbara Dialogue8 highlighting rapidly growing labour demand as a key contributor to the ‘workforce crisis’ in the Pilbara. This perspective builds on the quantitative findings of the WA State Growth Outlook (2011) which projected sustained growth in the region’s operational mining workforce to 2015, along with substantial fluctuations in construction workforce demand to meet resource project expansion.
In an environment of constrained housing supply and strong to moderate population growth it is anticipated that workforce shortages across the region will continue to present a challenge to the region’s prosperity.
Critically, growth in demand for resource projects affects not only the construction and mining sectors, but the entire regional economy. Benefits are distributed through the economy via wages and subsequent expenditure on a variety of goods and services, as well as increases in demand for inputs to construction and operational activities. This flow-on effect creates demand for workers across all sectors of the Pilbara’s economy. However, in an environment of constrained workforce supply (as indicated by the low unemployment and high participation rates identified in chapter 3) this can result in workforce shortages in a variety of industries.
This section draws together the findings of a literature review, regional consultation and an employer survey to highlight occupations that had experienced critical worker shortages in the Pilbara in recent years.
Literature reviewCritical occupational shortages for the region were identified through the literature review of the Joblink Entreprises Incorporated and Pilbara Institute’s individual external scanning exercise in 2011, and the Department of Education, Employment and Workplace Relations’ Survey of Employers’ Recruitment Experience.
Critical occupation shortages
8 Held at the University of Western Australia on Tuesday 3rd April, 2012
63
Joblink Enterprises Incorporated identified a series of core workforce shortages in the Pilbara, through their Pilbara Environmental Scan (2011). These shortages included:• professionals: in particular, civil engineers, mechanical engineers, transport engineers,
physiotherapists and registered nurses; and• technicians and trade workers: in particular motor mechanics, motorcycle mechanics,
welders (1st Class) and electrical engineering technicians.
In addition, the scan highlighted clear expectations for shortages in the construction and mining workforce in the short to medium term. Joblink Enterprises also identified the following training needs:• up-skilling existing trades people, traineeships and apprenticeships to support construction,
mineral and petroleum sectors (with an emphasis on process controllers, skilled information technology and telecommunication workers);
• health workers and industry mentors to support increased Indigenous employment participation; and
• hospitality industry training to support steady growth in the tourism sector.
64
Pilbara workforce development plan 2013–2016
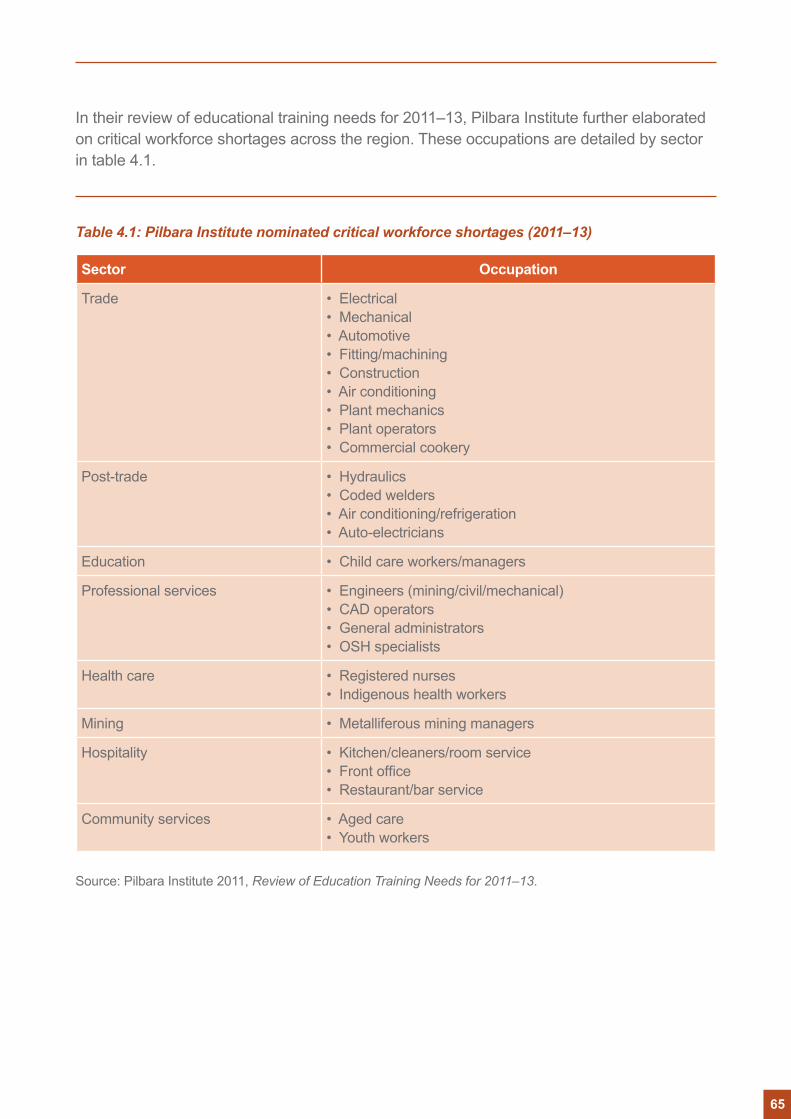
In their review of educational training needs for 2011–13, Pilbara Institute further elaborated on critical workforce shortages across the region. These occupations are detailed by sector in table 4.1.
Table 4.1: Pilbara Institute nominated critical workforce shortages (2011–13)
Sector Occupation
Trade • Electrical • Mechanical • Automotive • Fitting/machining • Construction • Air conditioning • Plant mechanics • Plant operators • Commercial cookery
Post-trade • Hydraulics • Coded welders • Air conditioning/refrigeration • Auto-electricians
Education • Child care workers/managers
Professional services • Engineers (mining/civil/mechanical) • CAD operators • General administrators • OSH specialists
Health care • Registered nurses • Indigenous health workers
Mining • Metalliferous mining managers
Hospitality • Kitchen/cleaners/room service • Front office • Restaurant/bar service
Community services • Aged care • Youth workers
Source: Pilbara Institute 2011, Review of Education Training Needs for 2011–13.
65
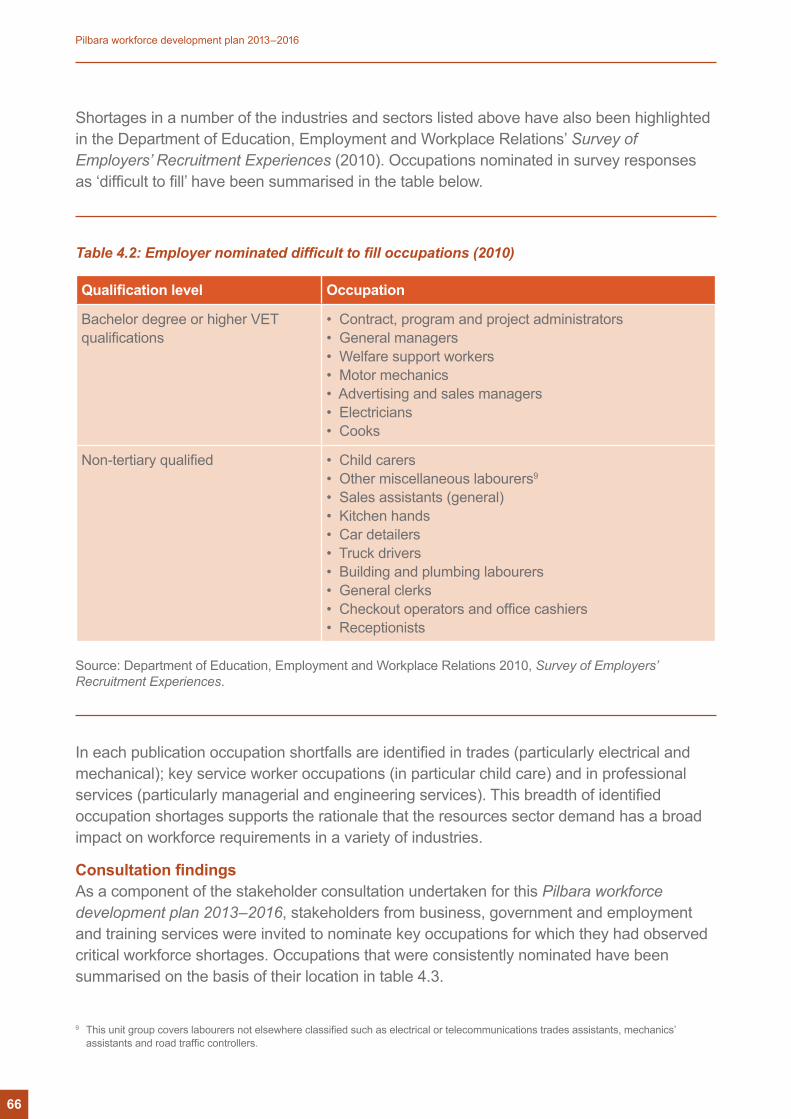
Shortages in a number of the industries and sectors listed above have also been highlighted in the Department of Education, Employment and Workplace Relations’ Survey of Employers’ Recruitment Experiences (2010). Occupations nominated in survey responses as ‘difficult to fill’ have been summarised in the table below.
Table 4.2: Employer nominated difficult to fill occupations (2010)
Qualification level Occupation
Bachelor degree or higher VET qualifications
• Contract, program and project administrators • General managers • Welfare support workers • Motor mechanics • Advertising and sales managers • Electricians • Cooks
Non-tertiary qualified • Child carers • Other miscellaneous labourers9 • Sales assistants (general) • Kitchen hands • Car detailers • Truck drivers • Building and plumbing labourers • General clerks • Checkout operators and office cashiers • Receptionists
Source: Department of Education, Employment and Workplace Relations 2010, Survey of Employers’ Recruitment Experiences.
In each publication occupation shortfalls are identified in trades (particularly electrical and mechanical); key service worker occupations (in particular child care) and in professional services (particularly managerial and engineering services). This breadth of identified occupation shortages supports the rationale that the resources sector demand has a broad impact on workforce requirements in a variety of industries.
Consultation findingsAs a component of the stakeholder consultation undertaken for this Pilbara workforce development plan 2013–2016, stakeholders from business, government and employment and training services were invited to nominate key occupations for which they had observed critical workforce shortages. Occupations that were consistently nominated have been summarised on the basis of their location in table 4.3.
9 This unit group covers labourers not elsewhere classified such as electrical or telecommunications trades assistants, mechanics’ assistants and road traffic controllers.
66
Pilbara workforce development plan 2013–2016
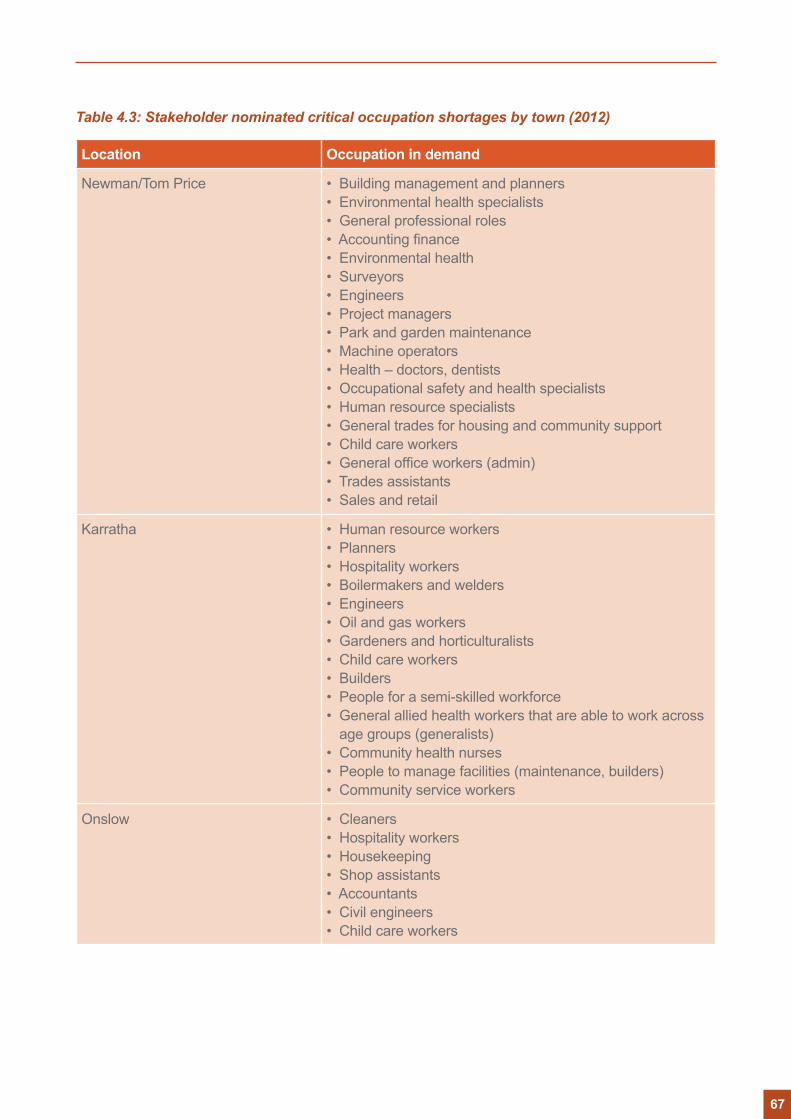
Table 4.3: Stakeholder nominated critical occupation shortages by town (2012)
Location Occupation in demand
Newman/Tom Price • Building management and planners • Environmental health specialists • General professional roles • Accounting finance • Environmental health • Surveyors • Engineers • Project managers • Park and garden maintenance • Machine operators • Health – doctors, dentists • Occupational safety and health specialists • Human resource specialists • General trades for housing and community support • Child care workers • General office workers (admin) • Trades assistants • Sales and retail
Karratha • Human resource workers • Planners • Hospitality workers • Boilermakers and welders • Engineers • Oil and gas workers • Gardeners and horticulturalists • Child care workers • Builders • People for a semi-skilled workforce • General allied health workers that are able to work across
age groups (generalists)• Community health nurses • People to manage facilities (maintenance, builders) • Community service workers
Onslow • Cleaners • Hospitality workers • Housekeeping • Shop assistants • Accountants • Civil engineers • Child care workers
67
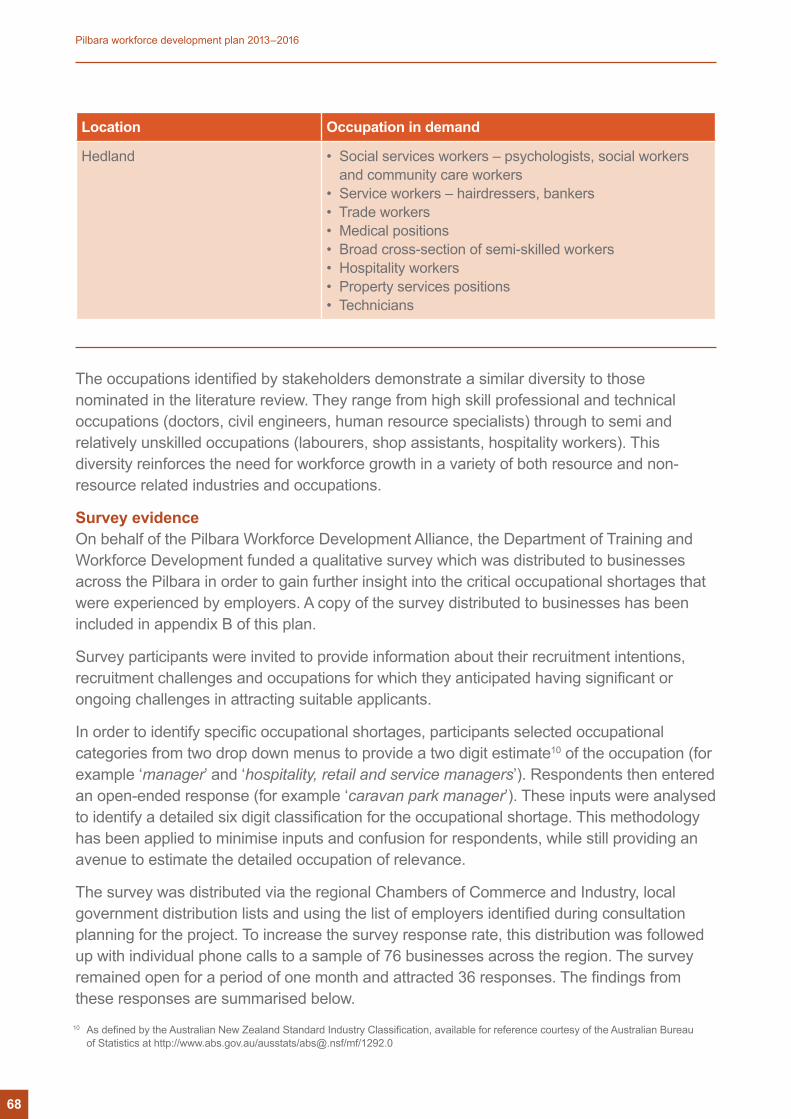
Location Occupation in demand
Hedland • Social services workers – psychologists, social workers and community care workers
• Service workers – hairdressers, bankers • Trade workers • Medical positions • Broad cross-section of semi-skilled workers • Hospitality workers • Property services positions • Technicians
The occupations identified by stakeholders demonstrate a similar diversity to those nominated in the literature review. They range from high skill professional and technical occupations (doctors, civil engineers, human resource specialists) through to semi and relatively unskilled occupations (labourers, shop assistants, hospitality workers). This diversity reinforces the need for workforce growth in a variety of both resource and non-resource related industries and occupations.
Survey evidenceOn behalf of the Pilbara Workforce Development Alliance, the Department of Training and Workforce Development funded a qualitative survey which was distributed to businesses across the Pilbara in order to gain further insight into the critical occupational shortages that were experienced by employers. A copy of the survey distributed to businesses has been included in appendix B of this plan.
Survey participants were invited to provide information about their recruitment intentions, recruitment challenges and occupations for which they anticipated having significant or ongoing challenges in attracting suitable applicants.
In order to identify specific occupational shortages, participants selected occupational categories from two drop down menus to provide a two digit estimate10 of the occupation (for example ‘manager’ and ‘hospitality, retail and service managers’). Respondents then entered an open-ended response (for example ‘caravan park manager’). These inputs were analysed to identify a detailed six digit classification for the occupational shortage. This methodology has been applied to minimise inputs and confusion for respondents, while still providing an avenue to estimate the detailed occupation of relevance.
The survey was distributed via the regional Chambers of Commerce and Industry, local government distribution lists and using the list of employers identified during consultation planning for the project. To increase the survey response rate, this distribution was followed up with individual phone calls to a sample of 76 businesses across the region. The survey remained open for a period of one month and attracted 36 responses. The findings from these responses are summarised below.
10 As defined by the Australian New Zealand Standard Industry Classification, available for reference courtesy of the Australian Bureau of Statistics at http://www.abs.gov.au/ausstats/[email protected]/mf/1292.0
68
Pilbara workforce development plan 2013–2016
Respondent informationThe majority of survey respondents were representatives of businesses located in the major towns of Hedland (both Port and South, 16 respondents) and Karratha (14 responses). The remaining responses were received from businesses in Newman (2), Onslow (3) and regional areas outside of the six major towns (1).
A total of 17 respondents (47.0%) employed 1–4 full time equivalent (FTE) employees; 11 (31.0%) employed 5–19 FTE; and the remaining eight (22.0%) employed 20–199 FTE employees.
A total of 75.0% of respondents planned to recruit at least one employee within the next year. The remaining 25.0% (nine businesses) indicated that they would not be recruiting. All nine businesses without a plan to expand were small businesses with four employees or less, inferring either a lack of demand or capacity to employ additional workers. Qualitative feedback suggests that these businesses would like to expand, however due to a variety of factors (including finance and constraints on their capacity to recruit more workers) they have not done so.
Responses were received from a range of industries, with retail (5); accommodation; cafes and restaurants (4); education and training (4); and construction (4) featuring prominently.
Survey findingsSurvey respondents have indicated that workforce shortages are currently being experienced in a wide variety of occupations.
Consistent feedback received across all industries was that quality tradesmen and engineers are currently in short supply. Respondents partly attributed this trend to the lack of skills in the region, but also attributed it to the capacity of local business to pay the ‘mining wage rates’ being charged by available contractors.
Along with the shortage in local construction tradesmen (in particular, carpenter and joiner, electrician, plumber, tiler and bricklayer) and engineers (specifically, civil, mechanical, industrial and production or plant engineer) five of the 36 respondents (14.0%) expressed a need for general clerks. Receptionists, accounting clerks, office managers and delivery drivers were also in high demand; while hotels, cafes and restaurants reported significant difficulties in employing chefs, cooks, cleaners, housekeepers, gardeners and maintenance staff.
Various local training and vocational education businesses suggested that they had insufficient access to quality training providers and education aides, while community service businesses also had insufficient access to community workers and youth workers. Metal fabricators, welders and metal fitters and machinists were also in high demand in the manufacturing industry.
69
These shortages represent a challenge for all industries, with unmet workforce demand likely to affect training services, community services, manufacturing/resource supply chains and professional services across the region.
Feedback from those surveyed indicated that wage competition with the mining sector is affecting the capacity of local businesses to engage unskilled and skilled labour alike. This pressure was considered unsustainable by small business respondents and was also noted to result in high rates of employee turnover across the region. Wage pressures are further compounded by the requirement for local businesses to outlay substantial accommodation subsidies to engage labour at a variety of levels. One respondent indicated they had lost a number of unskilled workers to more affordable towns on the west coast, while others mentioned that they could only employ local workers who had their own local accommodation arrangements.
The cost and challenges associated with filling employment vacancies has led a number of businesses to rely on contractors rather than permanent employees, where available. Outsourcing of positions to Perth and other regional locations is also being embraced in order to combat the rising cost of business (and in particular, labour) inputs.
Constraints on the size of the local labour force have also resulted in a number of businesses relying on FIFO workforces, where appropriate. However, those that could not afford to offer a FIFO roster, or found a FIFO roster too difficult to manage, noted that they simply could not attract or retain their required workforce.
Respondents also noted that constraints on available training courses limited their capacity to up-skill their workforce to meet their business needs. Accommodation providers in particular noted that they had difficulty in accessing adequate training for their staff to expand their skill set and allow them to move into higher skill roles.
Specific shortages noted by businesses have been summarised in the following regional priority occupation list (RPOL).
Regional priority occupation listCritical occupational shortages identified through the literature review, consultation and business survey have been collated to inform a regional priority occupation list for the Pilbara. This list is intended to assist State Government initiatives to target and grow specific areas of the Pilbara’s workforce.
The Department of Training and Workforce Development currently prepares a State priority occupation list (SPOL) which is an annually produced list of skilled occupations in high demand or considered industry-critical in Western Australia. In order to be included on the SPOL, an occupation must have:• valid data to rationalise its inclusion; • specialised skills that require extended learning and preparation time; • clear education/training pathways; and • must require skills that are in short supply.
70
Pilbara workforce development plan 2013–2016
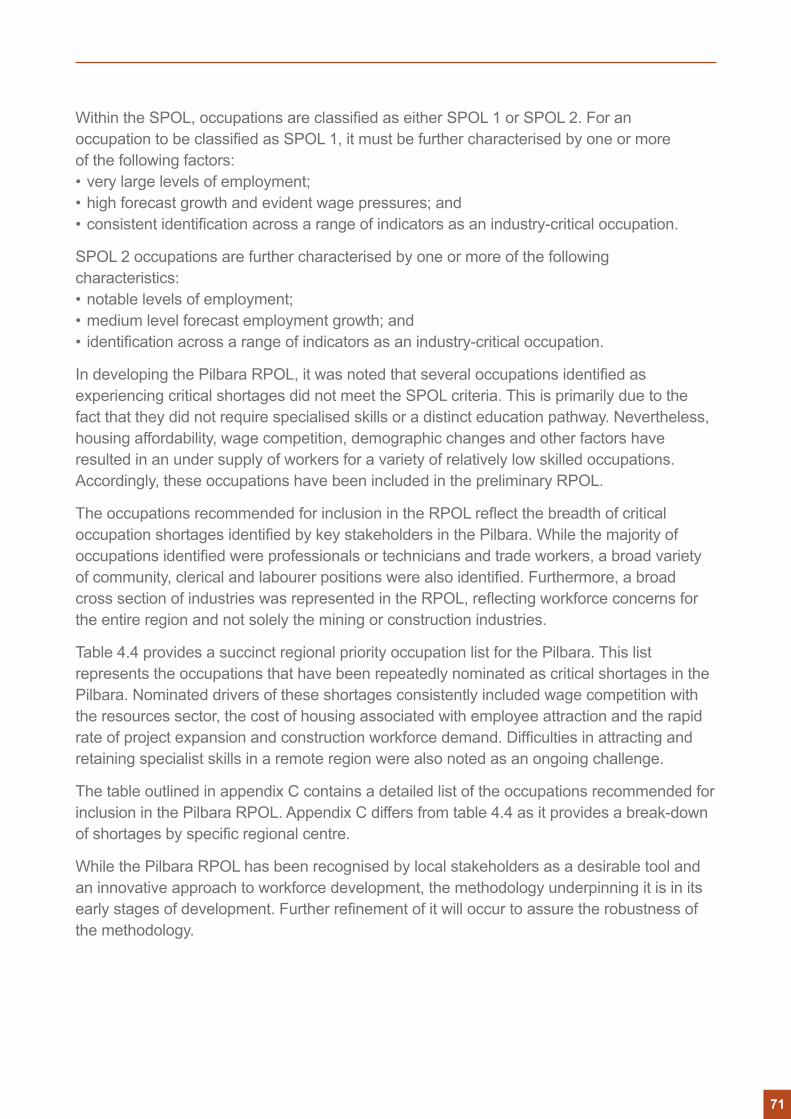
Within the SPOL, occupations are classified as either SPOL 1 or SPOL 2. For an occupation to be classified as SPOL 1, it must be further characterised by one or more of the following factors:• very large levels of employment;• high forecast growth and evident wage pressures; and• consistent identification across a range of indicators as an industry-critical occupation.
SPOL 2 occupations are further characterised by one or more of the following characteristics:• notable levels of employment;• medium level forecast employment growth; and• identification across a range of indicators as an industry-critical occupation.
In developing the Pilbara RPOL, it was noted that several occupations identified as experiencing critical shortages did not meet the SPOL criteria. This is primarily due to the fact that they did not require specialised skills or a distinct education pathway. Nevertheless, housing affordability, wage competition, demographic changes and other factors have resulted in an under supply of workers for a variety of relatively low skilled occupations. Accordingly, these occupations have been included in the preliminary RPOL.
The occupations recommended for inclusion in the RPOL reflect the breadth of critical occupation shortages identified by key stakeholders in the Pilbara. While the majority of occupations identified were professionals or technicians and trade workers, a broad variety of community, clerical and labourer positions were also identified. Furthermore, a broad cross section of industries was represented in the RPOL, reflecting workforce concerns for the entire region and not solely the mining or construction industries.
Table 4.4 provides a succinct regional priority occupation list for the Pilbara. This list represents the occupations that have been repeatedly nominated as critical shortages in the Pilbara. Nominated drivers of these shortages consistently included wage competition with the resources sector, the cost of housing associated with employee attraction and the rapid rate of project expansion and construction workforce demand. Difficulties in attracting and retaining specialist skills in a remote region were also noted as an ongoing challenge.
The table outlined in appendix C contains a detailed list of the occupations recommended for inclusion in the Pilbara RPOL. Appendix C differs from table 4.4 as it provides a break-down of shortages by specific regional centre.
While the Pilbara RPOL has been recognised by local stakeholders as a desirable tool and an innovative approach to workforce development, the methodology underpinning it is in its early stages of development. Further refinement of it will occur to assure the robustness of the methodology.
71
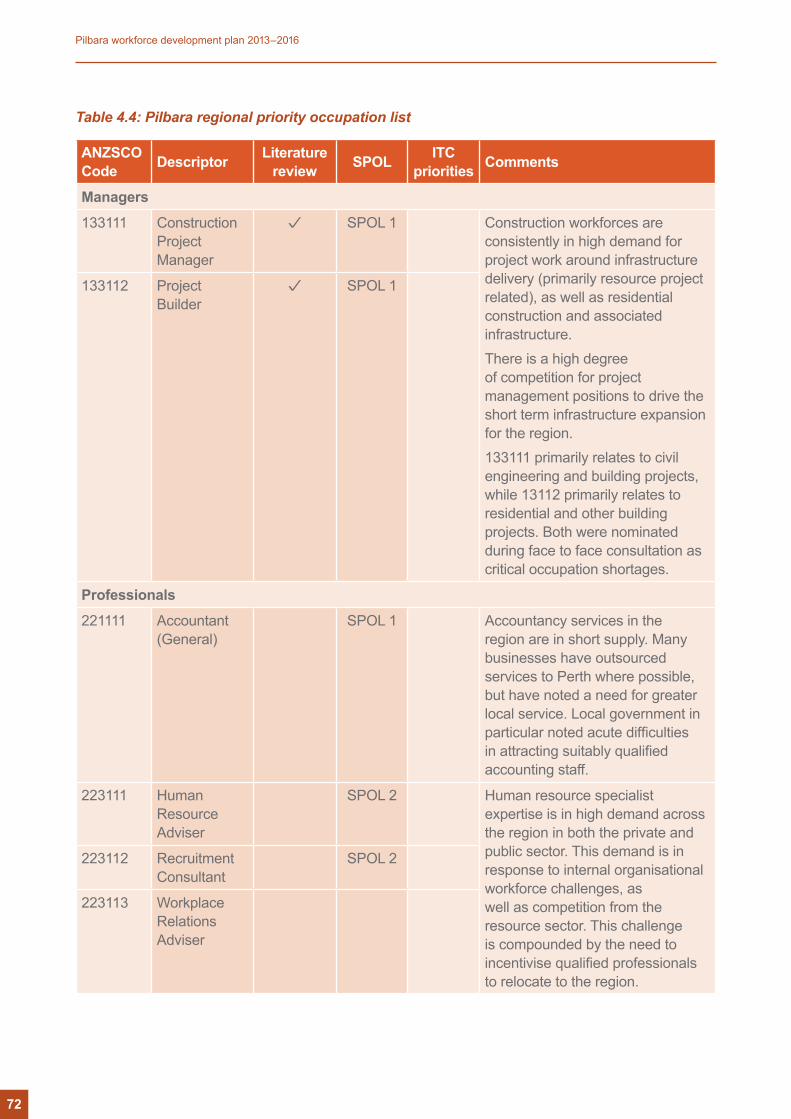
Table 4.4: Pilbara regional priority occupation list
ANZSCO Code Descriptor Literature
review SPOL ITC priorities Comments
Managers
133111 Construction Project Manager
SPOL 1 Construction workforces are consistently in high demand for project work around infrastructure delivery (primarily resource project related), as well as residential construction and associated infrastructure.There is a high degree of competition for project management positions to drive the short term infrastructure expansion for the region.133111 primarily relates to civil engineering and building projects, while 13112 primarily relates to residential and other building projects. Both were nominated during face to face consultation as critical occupation shortages.
133112 Project Builder
SPOL 1
Professionals
221111 Accountant (General)
SPOL 1 Accountancy services in the region are in short supply. Many businesses have outsourced services to Perth where possible, but have noted a need for greater local service. Local government in particular noted acute difficulties in attracting suitably qualified accounting staff.
223111 Human Resource Adviser
SPOL 2 Human resource specialist expertise is in high demand across the region in both the private and public sector. This demand is in response to internal organisational workforce challenges, as well as competition from the resource sector. This challenge is compounded by the need to incentivise qualified professionals to relocate to the region.
223112 Recruitment Consultant
SPOL 2
223113 Workplace Relations Adviser
72
Pilbara workforce development plan 2013–2016
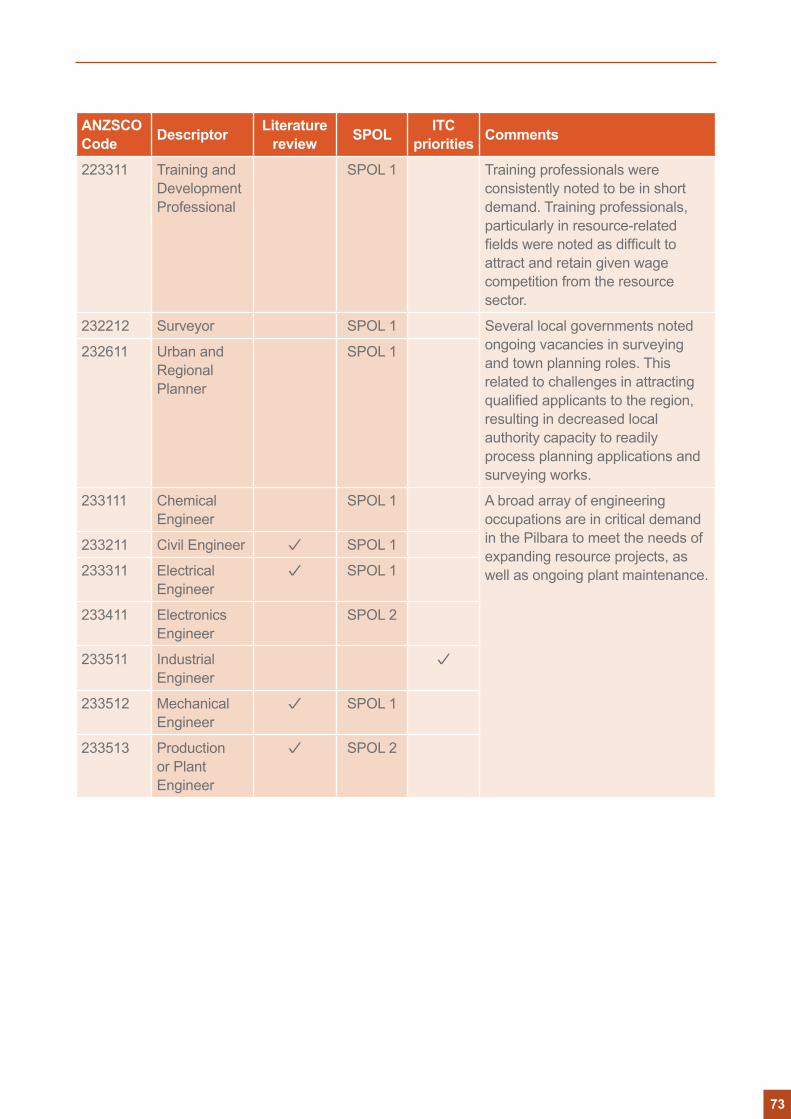
ANZSCO Code Descriptor Literature
review SPOL ITC priorities Comments
223311 Training and Development Professional
SPOL 1 Training professionals were consistently noted to be in short demand. Training professionals, particularly in resource-related fields were noted as difficult to attract and retain given wage competition from the resource sector.
232212 Surveyor SPOL 1 Several local governments noted ongoing vacancies in surveying and town planning roles. This related to challenges in attracting qualified applicants to the region, resulting in decreased local authority capacity to readily process planning applications and surveying works.
232611 Urban and Regional Planner
SPOL 1
233111 Chemical Engineer
SPOL 1 A broad array of engineering occupations are in critical demand in the Pilbara to meet the needs of expanding resource projects, as well as ongoing plant maintenance.
233211 Civil Engineer SPOL 1
233311 Electrical Engineer
SPOL 1
233411 Electronics Engineer
SPOL 2
233511 Industrial Engineer
233512 Mechanical Engineer
SPOL 1
233513 Production or Plant Engineer
SPOL 2
73
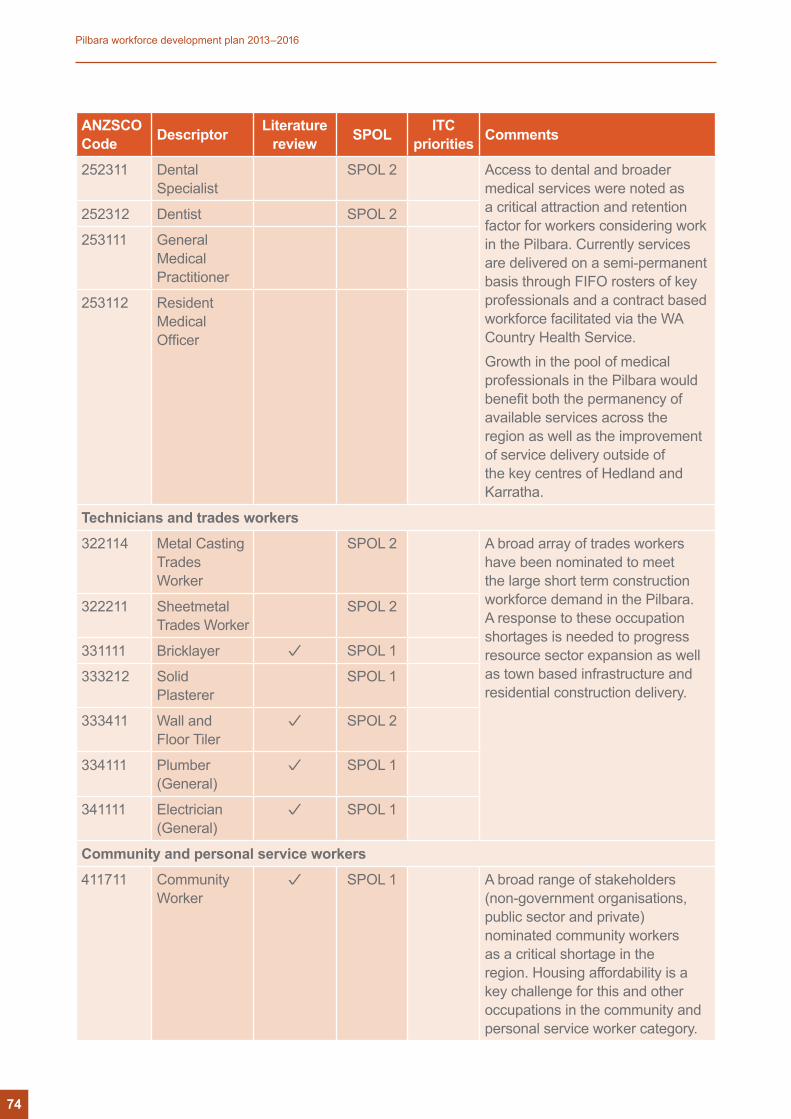
ANZSCO Code Descriptor Literature
review SPOL ITC priorities Comments
252311 Dental Specialist
SPOL 2 Access to dental and broader medical services were noted as a critical attraction and retention factor for workers considering work in the Pilbara. Currently services are delivered on a semi-permanent basis through FIFO rosters of key professionals and a contract based workforce facilitated via the WA Country Health Service. Growth in the pool of medical professionals in the Pilbara would benefit both the permanency of available services across the region as well as the improvement of service delivery outside of the key centres of Hedland and Karratha.
252312 Dentist SPOL 2
253111 General Medical Practitioner
253112 Resident Medical Officer
Technicians and trades workers
322114 Metal Casting Trades Worker
SPOL 2 A broad array of trades workers have been nominated to meet the large short term construction workforce demand in the Pilbara. A response to these occupation shortages is needed to progress resource sector expansion as well as town based infrastructure and residential construction delivery.
322211 Sheetmetal Trades Worker
SPOL 2
331111 Bricklayer SPOL 1
333212 Solid Plasterer
SPOL 1
333411 Wall and Floor Tiler
SPOL 2
334111 Plumber (General)
SPOL 1
341111 Electrician (General)
SPOL 1
Community and personal service workers
411711 Community Worker
SPOL 1 A broad range of stakeholders (non-government organisations, public sector and private) nominated community workers as a critical shortage in the region. Housing affordability is a key challenge for this and other occupations in the community and personal service worker category.
74
Pilbara workforce development plan 2013–2016
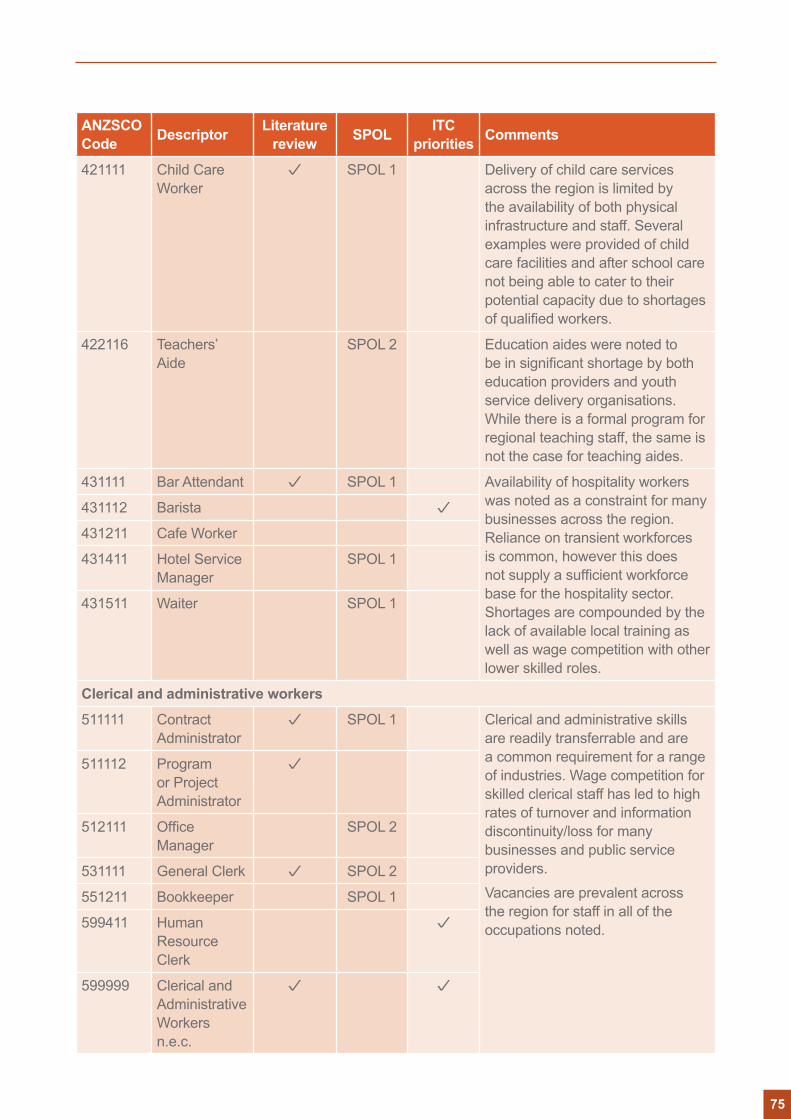
ANZSCO Code Descriptor Literature
review SPOL ITC priorities Comments
421111 Child Care Worker
SPOL 1 Delivery of child care services across the region is limited by the availability of both physical infrastructure and staff. Several examples were provided of child care facilities and after school care not being able to cater to their potential capacity due to shortages of qualified workers.
422116 Teachers’ Aide
SPOL 2 Education aides were noted to be in significant shortage by both education providers and youth service delivery organisations. While there is a formal program for regional teaching staff, the same is not the case for teaching aides.
431111 Bar Attendant SPOL 1 Availability of hospitality workers was noted as a constraint for many businesses across the region. Reliance on transient workforces is common, however this does not supply a sufficient workforce base for the hospitality sector. Shortages are compounded by the lack of available local training as well as wage competition with other lower skilled roles.
431112 Barista
431211 Cafe Worker
431411 Hotel Service Manager
SPOL 1
431511 Waiter SPOL 1
Clerical and administrative workers
511111 Contract Administrator
SPOL 1 Clerical and administrative skills are readily transferrable and are a common requirement for a range of industries. Wage competition for skilled clerical staff has led to high rates of turnover and information discontinuity/loss for many businesses and public service providers.Vacancies are prevalent across the region for staff in all of the occupations noted.
511112 Program or Project Administrator
512111 Office Manager
SPOL 2
531111 General Clerk SPOL 2
551211 Bookkeeper SPOL 1
599411 Human Resource Clerk
599999 Clerical and Administrative Workers n.e.c.
75

ANZSCO Code Descriptor Literature
review SPOL ITC priorities Comments
Sales workers
621111 Sales Assistant (General)
SPOL 2 The retail sector faces similar challenges to the hospitality sector in attracting and retaining a stable local workforce.These shortages are particularly prevalent in smaller towns throughout the region.
76
Pilbara workforce development plan 2013–2016
The remote nature of the Pilbara, its highly transient workforce and a significant and growing demand for workers in the region combine to create a unique set of workforce development challenges and opportunities. Key issues identified through the stakeholder consultation process that contribute to these challenges and opportunities have been grouped according to their relevance to the five Skilling WA strategic goals summarised as follows.
Strategies to address these key issues are outlined in chapter 6.
Workforce challenges and opportunities
77
Workforce participation
Stakeholders identified key issues that are likely to influence the Pilbara workforce in relation to strategic goal 1:
• The Pilbara workforce is predominantly male and ageing. Youth populations are growing at a relatively slow rate. There is a need to identify employment opportunities for the ageing workforce and to attract stay-at-home parents into the workforce through part time employment incentives.
• The Pilbara has generally high participation rates among most under-represented groups, when compared with State averages. Although, this was particularly high for mature-aged workers, this is largely a function of the significant number of mature age residents leaving the region on retirement. These high rates of participation mean that initiatives to increase workforce participation among these groups will yield relatively small workforce increases.
• Despite the above trend, Aboriginal participation was low when compared to regional trends. This was particularly prevalent in the East Pilbara and was coupled with high rates of unemployment in Port Hedland. Workforce planning to increase participation of Aboriginal people needs to be cognisant of the significant barriers to participation in the region, including education, health, housing, isolation, transport and cultural concerns. An encouraging trend for the participation of Aboriginal people was apparent in the high representation of Aboriginal workers in key service industries (for example health care and social assistance, education and training, and public administration and safety), that were broadly under-represented in the regional economy.
• Local people in social housing are hesitant to seek full time employment as it results in them being paid above the social housing threshold, leading to them potentially losing housing security. They may enter Government Regional Officers’ Housing (GROH) or supported employer housing, but run the risk that if they move on from the job, they then lose their place in the local market.
Stakeholder consultation issues specifically related to Aboriginal workforce participation in the Pilbara are summarised as follows.
• The majority of ‘stream 1 and stream 2’11 participants that are readily employable are typically already engaged in the workforce. Those that are currently not employed are those in ‘stream 3 and stream 4’ who require significant support services and assistance to re-engage with employment.
11 When job seekers make their first contact with Centrelink, a Job Seeker Classification Instrument (and where necessary, A Job Capacity Assessment) is used to place job seekers into one of four streams based on their level of disadvantage. Work ready job seekers are classified as ‘stream 1’ while job seekers whose pathway to employment may be longer are classified as stream 2, 3 or 4. Further details are available at www.deewr.gov.au
Strategic goal 1 Increase participation in the workforce, particularly among the under-employed and disengaged, mature-aged workers, Aboriginal and Torres Strait Islander and other under-represented groups.
78
Pilbara workforce development plan 2013–2016
• The way employers typically advertise is considered a barrier for Aboriginal job seekers. Service providers have relayed feedback from Aboriginal job seekers that they struggle with finding where jobs are advertised. Current advertising processes typically assume a degree of computer literacy and computer access, which is not necessarily always appropriate.
• Current requirements for obtaining a drivers licence in the region were consistently raised as prohibitive. This is a critical issue given the importance of personal transportation to employability.
• Aboriginal service providers have commented that key performance indicators for grant funding do not necessarily always fit with the staged outcomes and support needed for disengaged Aboriginal people in remote communities.
• Some of the cultural issues for Aboriginal people (for example, lore time and attendance at funerals) pose challenges in managing absences in a workforce environment.
• Unemployed Aboriginal persons are often not able to meet minimum literacy and numeracy requirements. In instances where the job seeker has no history of work, there is often no understanding of the mutual obligation between the worker and the employer.
• The transient nature of members of the Aboriginal workforce is problematic for employers who do not have the flexibility to accommodate part time workforces.
• The appetite from local Aboriginal people for mining roles has past its peak. It is perceived that those with an interest in mining related employment have already sought roles. This has resulted in training providers, employment service agencies and businesses seeking Aboriginal workers drawing on workforces outside of the Pilbara.
Stakeholder consultation issues specifically related to female and mature age workforce participation in the Pilbara are summarised as follows.
• It is slightly easier to recruit female workers. Businesses in key towns across the Pilbara indicated that they rely heavily on the ‘partner workforce’ that is drawn to the region courtesy of mining employment.
• There is a large, under engaged female workforce in the Pilbara. The key issue driving this under engagement is the availability of affordable and suitable child care. Holiday care is also a significant limitation. Access to culturally appropriate and sustainable child care is important to young single mothers to assist them to participate in the economy and move from welfare dependency.
• Although female students are typically not disposed to trade occupations, local education providers perceive there is an opportunity to increase promotion of trade associated courses to female students.
• Small business start ups in South and Port Hedland are typically driven by females. This sector struggles to grow, however, given the expense of taking on employees (and the associated housing challenges for workers).
• There is a large proportion of mature-aged workers in the local government workforce that fit into the ‘baby boomer’ category. These people are seeking a higher quality of local services and amenity if they are to remain in the region.
79
Migration
Stakeholders identified key issues that are likely to influence the Pilbara workforce in relation to strategic goal 2:
• Shortages were identified in trade, post-trade, education, professional services, health care, mining, hospitality and community service occupations. Further details on critical occupation shortages in the region are provided in chapter 4 of this plan.
• Previous modelling has indicated that demand for workers in 2012–15 will significantly outstrip supply. Workforce demand will be particularly high in the Shire of Ashburton and will require migration to meet demand. This will need to be complemented by an appropriate investment in education to assist in up-skilling the growing local labour force.
• The mining sector has the greatest demand for workers. Based on industry demand projections, this trend is likely to continue to 2015, underscoring the need for initiatives to attract skilled migrants with industry specific skills to meet demand.
• FIFO arrangements will continue to be prevalent, along with growth of residents through migration. There are social issues associated with the growth in temporary/permanent workforce migrants.
• There are challenges with workers transferring trade related licenses from interstate. Harmonisation of occupational licensing between Western Australia, interstate and overseas labour markets is considered a critical issue for local businesses considering migration alternatives.
• There is a worldwide shortage of labour in the mining sector, not purely in Australia. To this extent, migration can supplement domestic mining workforce supply, however it will never replace the need for ongoing local training and workforce development.
• Aboriginal workers are participating as FIFO workers from communities across the Pilbara and elsewhere. Mining companies are not just employing local Aboriginal workers, but are actively seeking work ready participants from across other regions in Australia. This is reflective of the small pool of local work ready Aboriginal labour.
• Lifestyle issues and a lack of preparation for the region in relation to the remoteness, climate and ability to access services are the most common issues for migrants. Language and cultural nuances were also acknowledged as key challenges for some employers.
• Department of Immigration and Citizenship does have regional migration agents that travel to the Pilbara, but local businesses have suggested there is some confusion regarding how and when to access them.
Strategic goal 2 Supplement the Western Australian workforce with skilled migrants to fill employment vacancies unable to be filled by the local workforce and address those factors which support a growing population.
80
Pilbara workforce development plan 2013–2016
Attraction and retention
Stakeholders identified key issues that are likely to influence the Pilbara workforce in relation to strategic goal 3:
• Relatively low economic diversification in the Pilbara has resulted in the under-representation of service and other non-resources sector businesses. Reasons for this include high cost pressures on non-resources sector businesses to attract and retain staff. Low participation in non-resource sector training pipelines has also limited the capacity of local businesses in these sectors to grow.
• Large FIFO populations have, anecdotally, been noted as having a negative impact on community cohesion and on the appeal of residence in Pilbara towns. This is a critical issue for local planning.
• Service industry employment is relatively concentrated in the Shire of Roebourne and Town of Port Hedland (though is still under-represented). This is in line with the Pilbara Cities vision and provides a base for industry growth and diversity in these areas.
• Pilbara residents are highly mobile creating challenges for workforce retention. Investments in community infrastructure and programs will be needed to improve the amenity, community cohesion and services that will help develop a sense of community.
• Key infrastructure and service shortages include investment in road maintenance and improvement; public transport options; housing; broadband and mobile service coverage; health and education service delivery; urban amenity investments; and child care centres and services. Of these, housing was the most prevalent concern, with a variety of planning, policy and construction initiatives needed to increase supply. This has created challenges for worker attraction and retention across all industries in the economy.
• Low competitiveness of salaries that can be offered by local government and sectors other than mining was commonly highlighted as a critical retention issue. Other employers are unable to offer salaries that are as attractive for employees. Young residents in particular have an expectation that they are going to earn substantial incomes in the mining sector and are reluctant to consider opportunities in other sectors.
• Salary competition has led to workers (particularly low skilled) quickly gaining an expectation that they are worth very high wages, creating substantial challenges for sectors unable to meet these expectations.
Strategic goal 3 Attract workers with the right skills to the Western Australian workforce and retain them by offering access to rewarding employment and a diverse and vibrant community and environment to live in.
81
• Housing affordability along with the availability of land and housing was consistently nominated as the greatest challenge for workforce attraction and retention. To employ local workers, local employers rely heavily on the worker’s spouse having accommodation provided (for example, a resource sector or government worker that already has accommodation provided as a part of their employment conditions). Access to housing is a consistent challenge for government, private sector and not for profit sector employers alike, and a critical constraint to business growth in the region.
• While all major towns are experiencing a constraint on housing, Ashburton in particular suffers from a land constraint for housing and commercial premises. Because of the high cost of land and high cost of building, start up costs for new businesses are very high and this creates additional risk for investors.
• Small businesses cannot afford the investment necessary to attract employees from Perth and instead rely on the local labour market for their employees. The inability to attract workers prevents small business growth.
• Attracting professionals to the region to work in local government is very challenging. Local governments in the Pilbara invest a significant amount of time and resources in training employees.
• The development of service worker accommodation in Karratha has been welcomed by representatives of the not for profit and key services sectors. Simultaneously however, some stakeholders have advocated the need for the model to transition toward a not for profit housing model rather than the establishment of a third tier of government housing in the region.
Throughout stakeholder consultation, a variety of critical retention issues were nominated as leading to workers leaving the Pilbara. These included:• the quality of local education for children and young people; • ageing parents/family commitments;• better lifestyle options elsewhere;• residents having a 2–3 year plan to work regionally, build experience and savings and only
staying for this length of time;• a lack of personal support services and general community facilities;• a lack of retail options and child care services;• a lack of health services;• parental concern regarding the distance to hospital services; and• inability to access suitable/affordable housing alternatives.
Many of these are common retention issues for regional communities, not unique to the Pilbara. However, where continual improvement in these areas can be delivered in line with the Pilbara Cities vision, this will contribute toward workforce retention in the region.
82
Pilbara workforce development plan 2013–2016
Skills development and utilisation
Stakeholders identified key issues that are likely to influence the Pilbara workforce in relation to strategic goal 4:
• The Pilbara population typically has lower education participation, retention and achievement outcomes when compared to the State average. This is particularly the case for the region’s Aboriginal population. This trend has a detrimental effect on the capacity of the region’s workforce to respond to industry demand and currently places greater pressure on migration requirements.
• The majority of apprentices in training are male, further exacerbating existing gender imbalances in the workforce.
• Industry partnerships play a critical role in providing training and employment pathways for Pilbara residents. Contributions include financial, facility, work placement and human resource contributions to assist in developing a potential pipeline for their workforce needs.
• The size and distribution of Pilbara towns and their remoteness creates unique challenges. These include challenges to teacher retention, student and teacher transport, and class size requirements and ratios. Investment in broadband infrastructure to support e-learning initiatives, and in accommodation and transport to encourage participation will need to be considered as a component of workforce planning.
• Trends for youth and young adults to leave the region for education detract from the labour force pipeline and from the capacity of the workforce to retain working parents.
• A significant proportion of tertiary students currently study via external studies. The remainder of students at the Pilbara Institute are typically engaged in part time or full time employment. In contrast to the typical trend in metropolitan areas, there are very few school leavers studying full time at the institute. Pilbara school leavers instead typically leave the region to pursue a university qualification, obtain an apprenticeship while working or transition straight into full time employment. There is currently no culture of full time learning in the region.
• There is a need to lower student–teacher ratios in Pilbara schools, particularly because Aboriginal children often need greater attention and varied teaching mediums.
• A wide variety of education and training products were perceived to be under supplied across the region. Examples included cross-cultural awareness and competency training; leadership, governance and management training for government/public servants in the Pilbara; hospitality courses; child care courses; and first aid training.
Strategic goal 4 Provide flexible, responsive and innovative education and training which enables people to develop and utilise the skills necessary for them to realise their potential and contribute to Western Australia’s prosperity.
83
• Training courses were identified as a valued opportunity for members of the ‘partner workforce’ in the region to connect with other members of the Pilbara community and develop their own skills. Nevertheless, feedback was received that available training options for desired courses are limited.
• There was a perception that schools have a limited perspective on employment and training pathways for students and that schools have a high staff turnover, limiting continuity in programs that support students in their education pathways beyond school.
• The current apprentice minimum wage is perceived as insufficient to support an individual to live and train in the Pilbara. Stakeholders indicated a need to consider a variation on the apprentice wage for the region, which would also contribute to apprentice attraction.
• The Pilbara Institute indicated that wage competition with the resources sector is a particular challenge to the retention of trainers for electrical trade and other resource related course trainers.
Planning and coordination
Key stakeholder consultation issues identified that are likely to influence the planning and coordination of a consistent workforce response are as follows.
• A lack of ownership of responsibility between local, State and Australian Government over key workforce development issues, which is complicated by the sheer breadth of issues relevant for consideration, will be partly addressed by the Pilbara workforce development plan 2013–2016.
• There is a need for a clear delineation of funding responsibility for key strategies. A particular concern was raised that royalties from oil and gas are Federal, while royalties from mining are State level. There is a perception in some communities that towns impacted by oil and gas do not receive the same investment of State royalties since these locations are more closely linked to Federal, off shore, domains.
• There was a perception of governance overlap between the Pilbara Development Commission, the Pilbara Regional Council, Regional Development Australia – Pilbara, Pilbara Cities and other State agencies working in the region.
Strategic goal 5 Plan and coordinate a strategic State Government response to workforce development issues in Western Australia.
84
Pilbara workforce development plan 2013–2016
In order to address the workforce challenges and opportunities identified in chapter 5, a series of priority actions have been workshopped with the Pilbara Workforce Development Alliance. These have drawn on inputs from local and State level stakeholder consultations and have been refined through the input of the alliance and nominated lead agencies to ensure both relevance and practicality of action implementation.
The overall timeframe for implementation of priority actions is over a three year period to 2016. The alliance has recommended a lead agency to drive the implementation of each action. The Department of Training and Workforce Development has consulted with various State Government agencies identified as lead agencies, on the nature of the strategy and its capacity for ready implementation.
In addition to the nomination of the lead agency, it is recommended that the alliance continue to oversee the implementation of actions and act as the custodians of the strategy. It will be critical that local buy-in continues to be maintained through the alliance.
The alliance will also regularly review the Pilbara workforce development plan 2013–2016 along with other initiatives which will inform Skilling WA, thereby providing the bottom-up feedback to the statewide planning framework.
Details of each of the priority actions are provided overleaf.
Strategies for workforce development
85
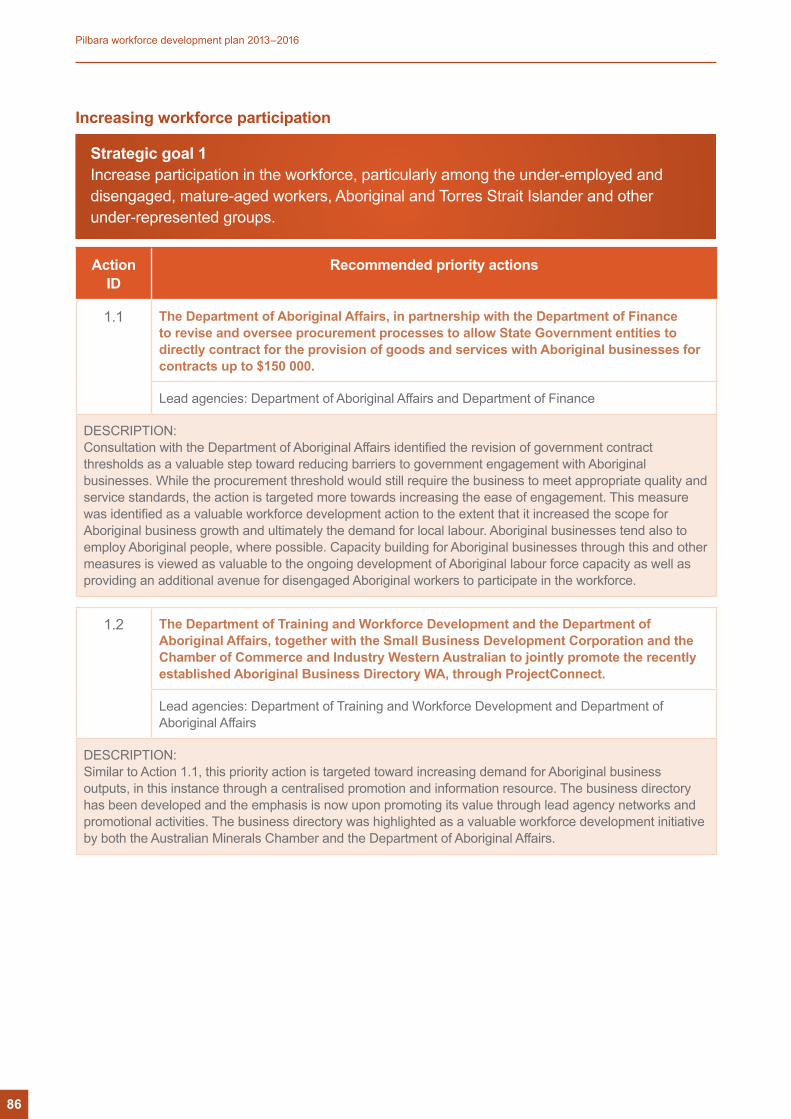
Increasing workforce participation
Action ID
Recommended priority actions
1.1 The Department of Aboriginal Affairs, in partnership with the Department of Finance to revise and oversee procurement processes to allow State Government entities to directly contract for the provision of goods and services with Aboriginal businesses for contracts up to $150 000.
Lead agencies: Department of Aboriginal Affairs and Department of Finance
DESCRIPTION:Consultation with the Department of Aboriginal Affairs identified the revision of government contract thresholds as a valuable step toward reducing barriers to government engagement with Aboriginal businesses. While the procurement threshold would still require the business to meet appropriate quality and service standards, the action is targeted more towards increasing the ease of engagement. This measure was identified as a valuable workforce development action to the extent that it increased the scope for Aboriginal business growth and ultimately the demand for local labour. Aboriginal businesses tend also to employ Aboriginal people, where possible. Capacity building for Aboriginal businesses through this and other measures is viewed as valuable to the ongoing development of Aboriginal labour force capacity as well as providing an additional avenue for disengaged Aboriginal workers to participate in the workforce.
1.2 The Department of Training and Workforce Development and the Department of Aboriginal Affairs, together with the Small Business Development Corporation and the Chamber of Commerce and Industry Western Australian to jointly promote the recently established Aboriginal Business Directory WA, through ProjectConnect.
Lead agencies: Department of Training and Workforce Development and Department of Aboriginal Affairs
DESCRIPTION: Similar to Action 1.1, this priority action is targeted toward increasing demand for Aboriginal business outputs, in this instance through a centralised promotion and information resource. The business directory has been developed and the emphasis is now upon promoting its value through lead agency networks and promotional activities. The business directory was highlighted as a valuable workforce development initiative by both the Australian Minerals Chamber and the Department of Aboriginal Affairs.
Strategic goal 1 Increase participation in the workforce, particularly among the under-employed and disengaged, mature-aged workers, Aboriginal and Torres Strait Islander and other under-represented groups.
86
Pilbara workforce development plan 2013–2016
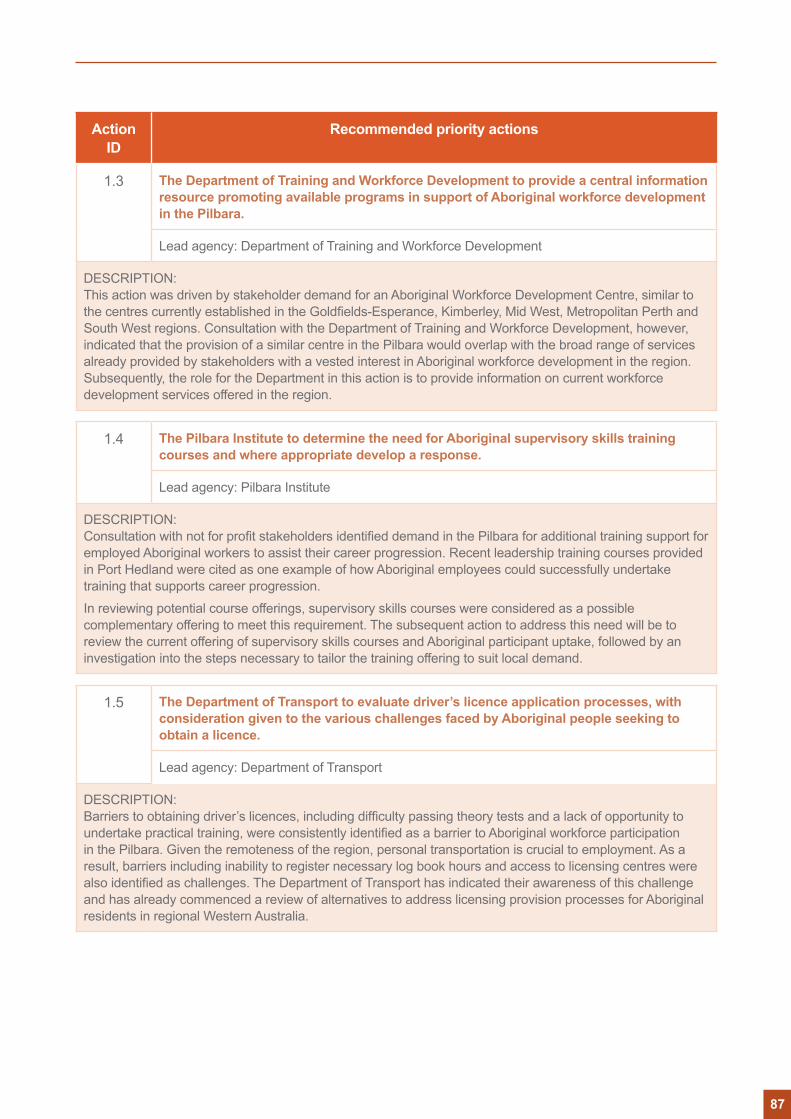
Action ID
Recommended priority actions
1.3 The Department of Training and Workforce Development to provide a central information resource promoting available programs in support of Aboriginal workforce development in the Pilbara.
Lead agency: Department of Training and Workforce Development
DESCRIPTION: This action was driven by stakeholder demand for an Aboriginal Workforce Development Centre, similar to the centres currently established in the Goldfields-Esperance, Kimberley, Mid West, Metropolitan Perth and South West regions. Consultation with the Department of Training and Workforce Development, however, indicated that the provision of a similar centre in the Pilbara would overlap with the broad range of services already provided by stakeholders with a vested interest in Aboriginal workforce development in the region. Subsequently, the role for the Department in this action is to provide information on current workforce development services offered in the region.
1.4 The Pilbara Institute to determine the need for Aboriginal supervisory skills training courses and where appropriate develop a response.
Lead agency: Pilbara Institute
DESCRIPTION: Consultation with not for profit stakeholders identified demand in the Pilbara for additional training support for employed Aboriginal workers to assist their career progression. Recent leadership training courses provided in Port Hedland were cited as one example of how Aboriginal employees could successfully undertake training that supports career progression.
In reviewing potential course offerings, supervisory skills courses were considered as a possible complementary offering to meet this requirement. The subsequent action to address this need will be to review the current offering of supervisory skills courses and Aboriginal participant uptake, followed by an investigation into the steps necessary to tailor the training offering to suit local demand.
1.5 The Department of Transport to evaluate driver’s licence application processes, with consideration given to the various challenges faced by Aboriginal people seeking to obtain a licence.
Lead agency: Department of Transport
DESCRIPTION: Barriers to obtaining driver’s licences, including difficulty passing theory tests and a lack of opportunity to undertake practical training, were consistently identified as a barrier to Aboriginal workforce participation in the Pilbara. Given the remoteness of the region, personal transportation is crucial to employment. As a result, barriers including inability to register necessary log book hours and access to licensing centres were also identified as challenges. The Department of Transport has indicated their awareness of this challenge and has already commenced a review of alternatives to address licensing provision processes for Aboriginal residents in regional Western Australia.
87
Action ID
Recommended priority actions
1.6 The Department of Regional Development to work with the Department of Transport and Department of the Attorney General to develop a joint approach to tackling the issues facing Aboriginal people in remote communities with respect to driver’s licences.
Lead agency: Department of Regional Development
DESCRIPTION: In order to further address challenges around licensing, stakeholders stated that greater flexibility in license requirements from employers offered further potential for reducing barriers to workforce participation. One stakeholder cited an effective example of a work site adopting a ‘buddy system’, whereby only one in two Aboriginal employees are required to obtain a licence and have access to a vehicle (as opposed to mandatory license requirements). Consideration of these and other flexible alternatives that reduce reliance on driver’s licences as a precondition for employment are perceived as a practical opportunity to increase Aboriginal workforce participation.
1.7 The Department of Housing to consider investigating an increased provision of residential boarding facilities with 24 hour wrap around support services for Aboriginal apprentices and trainees.
Lead agency: Department of Housing
DESCRIPTION: This action was identified as a critical step to service the continued growth in training courses offered by Pilbara Institute for Aboriginal participants and the demand for Aboriginal trainees and apprentices. Local student accommodation is considered invaluable to participant retention and training completion and to the development of effective employees through the receipt of adjunct work readiness and life skills training.
At the time of writing, BHP was in the process of building a residential boarding house for Aboriginal apprenticeships and traineeships. This priority action endorses the replication of this initiative in Newman and Roebourne.
1.8 The Department of Training and Workforce Development to review existing Aboriginal pre-employment pathways, with a view to improving access and outcomes.
Lead agency: Department of Training and Workforce Development
DESCRIPTION: Not for profit stakeholders, the Australian Minerals Council and the Department of Aboriginal Affairs identified the need to continuously identify, evaluate and where appropriate, replicate effective pre-employment programs – in particular, those which are successful in engaging Aboriginal youth and streams 2 and 3 participants. This action specifically focuses on the review of existing Aboriginal pre-employment pathways with a view to improving access and outcomes.
88
Pilbara workforce development plan 2013–2016
Action ID
Recommended priority actions
1.9 The Department of Training and Workforce Development to develop a support package in the form of a web portal to support small to medium enterprises with the engagement, attraction and retention of employees (including female, Aboriginal and mature-aged workers).
Lead agency: Department of Training and Workforce Development
DESCRIPTION: This initiative reflects the view of stakeholders. That is, small and medium sized enterprises (SMEs), non-resources sector businesses, local government authorities and not for profit organisations seek information and advice to assist them to improve their capacity to attract and retain workers, particularly from minority and equity groups.
Assistance from the Department of Training and Workforce Development to provide guidelines, templates, tools and disseminate case studies of successful examples would help employers to make informed decisions and avoid making costly human resource mistakes.
In addition, the Department of Training and Workforce Development is working collaboratively with the Chamber of Commerce and Industry to run a series of diversity employment forums. The forums will allow for an officer to visit small businesses employers on a one on one basis to promote and assist them to employ people from a range of diversity groups.
The portal together with the planned forums will allow business to actively engage in workforce planning and development practice. This will strengthen the building of a diverse workforce.
1.10 The Pilbara Development Commission to advocate for and work with the Pilbara Industry’s Community Council to develop and seek agreement on a joint policy position, whereby annual health check certificates are transferable between companies and sites.
Lead agency: Pilbara Development Commission
DESCRIPTION: Contracting companies managing pools of construction and other temporary labour identified health check requirements for each individual mine site as a labour supply bottleneck and red tape requirement that increases the cost of doing business for worker’s regularly transferring between sites. Industry recognition of a consistent, transferrable health check process would remove this overhead and increase the ease and expediency of accessing and deploying labour in the region. The requirement is seen to be a particular deterrent for Aboriginal labour.
In the longer term, industry and government recognition of a broader, consistent and transferrable health certificate would improve business efficiency and reduce barriers to workforce entry and readiness.
89
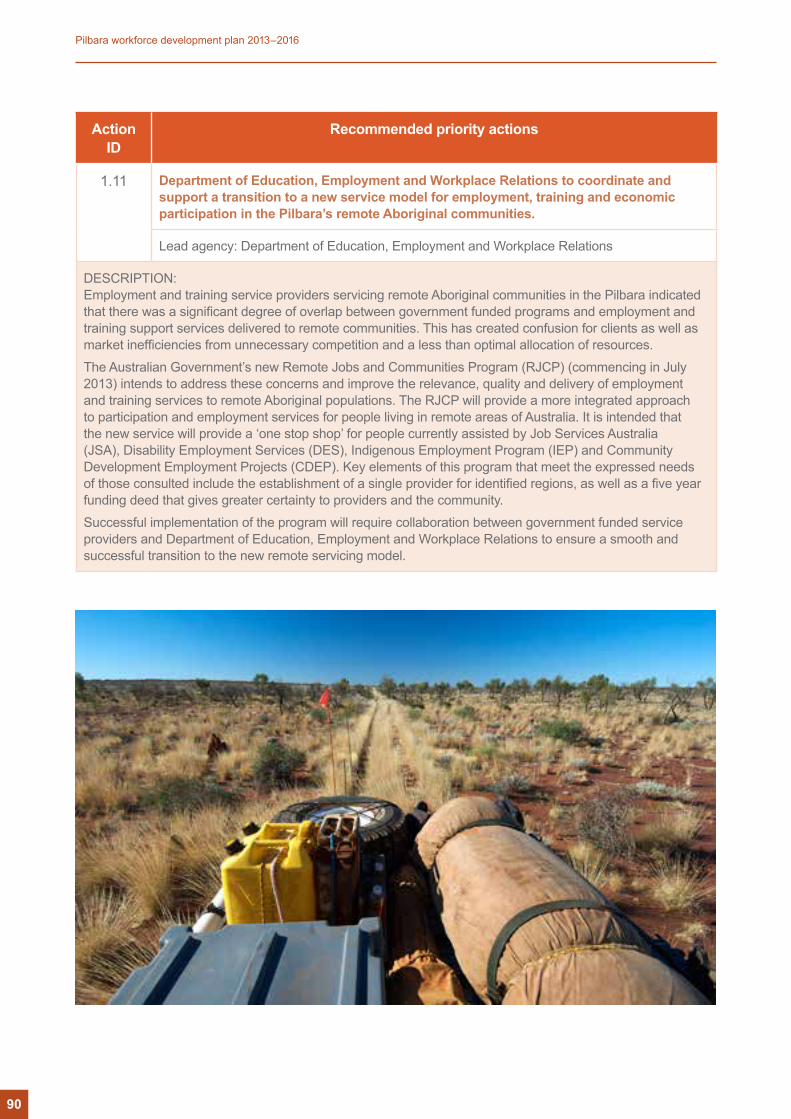
Action ID
Recommended priority actions
1.11 Department of Education, Employment and Workplace Relations to coordinate and support a transition to a new service model for employment, training and economic participation in the Pilbara’s remote Aboriginal communities.
Lead agency: Department of Education, Employment and Workplace Relations
DESCRIPTION: Employment and training service providers servicing remote Aboriginal communities in the Pilbara indicated that there was a significant degree of overlap between government funded programs and employment and training support services delivered to remote communities. This has created confusion for clients as well as market inefficiencies from unnecessary competition and a less than optimal allocation of resources.
The Australian Government’s new Remote Jobs and Communities Program (RJCP) (commencing in July 2013) intends to address these concerns and improve the relevance, quality and delivery of employment and training services to remote Aboriginal populations. The RJCP will provide a more integrated approach to participation and employment services for people living in remote areas of Australia. It is intended that the new service will provide a ‘one stop shop’ for people currently assisted by Job Services Australia (JSA), Disability Employment Services (DES), Indigenous Employment Program (IEP) and Community Development Employment Projects (CDEP). Key elements of this program that meet the expressed needs of those consulted include the establishment of a single provider for identified regions, as well as a five year funding deed that gives greater certainty to providers and the community.
Successful implementation of the program will require collaboration between government funded service providers and Department of Education, Employment and Workplace Relations to ensure a smooth and successful transition to the new remote servicing model.
90
Pilbara workforce development plan 2013–2016
Action ID
Recommended priority actions
1.12 The Pilbara Workforce Development Alliance to support the development of remote workforce development plans and community action plans under the Remote Jobs and Communities Program.
Lead agency: Pilbara Workforce Development Alliance
DESCRIPTION: July 2013 will mark the commencement date for three new consolidated RJCP providers in the Port Hedland region, Karratha region and Western Desert region in the Pilbara. In the first six months of their contracts, each of these providers will be required to develop a workforce development strategy and community action plan that links workforce planning and employment and training outcomes with local and regional employment and economic development opportunities. The workforce development plan will identify employment opportunities and outline how employers will be engaged to place job seekers (and in particular young job seekers) in their region. Workforce plans will be developed in conjunction with a community action plan, which will identify and support the economic and community development activities that the communities in each region regard as priorities.
The strategies identified in the remote region workforce development strategies will be specifically tailored to the needs of job seekers in remote communities including addressing issues identified in the RJCP Pilbara Workforce Development Strategy such as the need for a focus on pathways into employment for Aboriginal youth in remote areas. The Pilbara Workforce Development Alliance would encourage RJCP specific strategies to include for example:
Action x.x – development of a case management model which coordinates pre-employment engagement and capacity-building services to disengaged youth including school leavers;
Action x.x – increase the emphasis placed on career guidance as part of the package of work-readiness and pre-employment services available to remote job seekers, including school leavers.
In order to maximise the efficiency and effectiveness of the remote workforce development plans, it will be important for Pilbara Workforce Development Alliance members to actively engage with RJCP providers around strategy development. This will ensure greater consistency between the regional and local plans and also provide for realisation of greater ease of strategy implementation. It is suggested that the new RJCP providers for the Pilbara be invited to become members of the Pilbara Workforce Development Alliance.
1.13 Karratha and Port Hedland local governments to review their local infrastructure, amenity and program offering and strategies to help employers attract and retain mature-aged workers.
Lead agencies: Town of Port Hedland and Shire of Roebourne
DESCRIPTION: As highlighted in the workforce profile, the age distribution of Pilbara residents is relatively skewed towards young to middle aged populations and markedly declines for residents aged fifty years and over. This decline is in part attributed to the lack of community infrastructure, services and social activities on offer to mature age workers in the larger towns of Port Hedland and Karratha.
This action calls upon the two local governments to review the infrastructure assets and community programs available to assess their suitability for use by mature age people. Examples provided related in particular to recreational and lifestyle amenity, as well as health services.
91
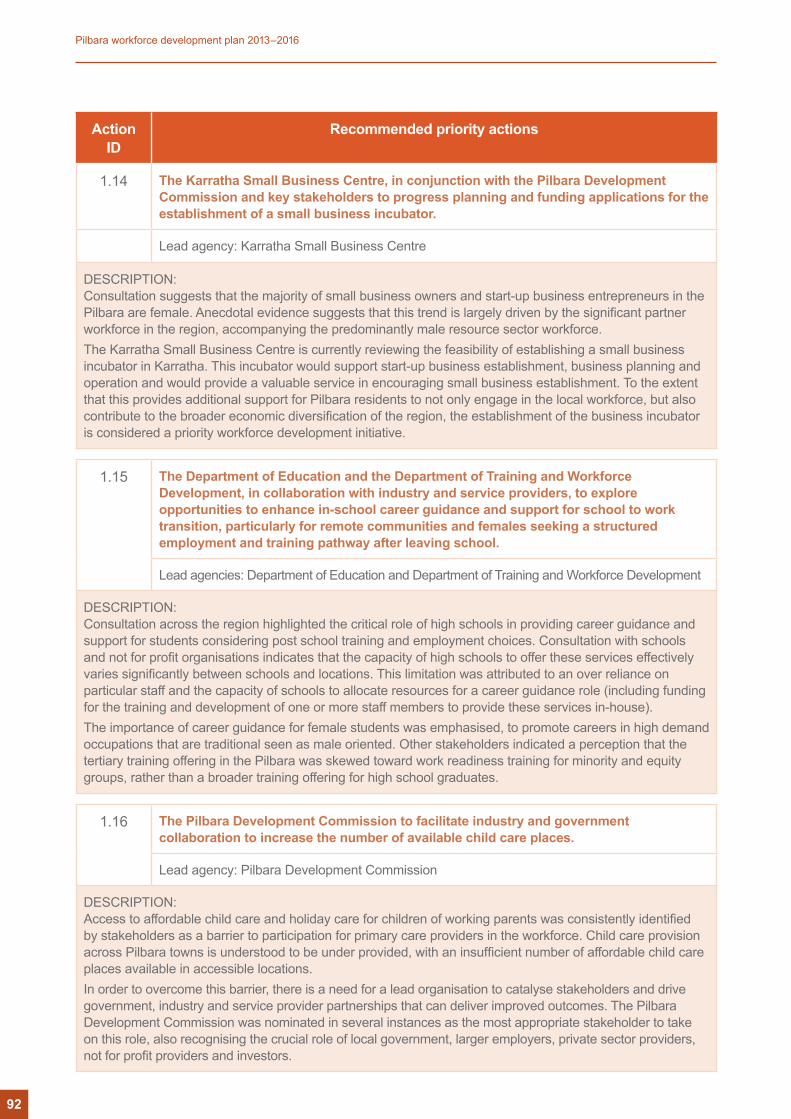
Action ID
Recommended priority actions
1.14 The Karratha Small Business Centre, in conjunction with the Pilbara Development Commission and key stakeholders to progress planning and funding applications for the establishment of a small business incubator.
Lead agency: Karratha Small Business Centre
DESCRIPTION: Consultation suggests that the majority of small business owners and start-up business entrepreneurs in the Pilbara are female. Anecdotal evidence suggests that this trend is largely driven by the significant partner workforce in the region, accompanying the predominantly male resource sector workforce. The Karratha Small Business Centre is currently reviewing the feasibility of establishing a small business incubator in Karratha. This incubator would support start-up business establishment, business planning and operation and would provide a valuable service in encouraging small business establishment. To the extent that this provides additional support for Pilbara residents to not only engage in the local workforce, but also contribute to the broader economic diversification of the region, the establishment of the business incubator is considered a priority workforce development initiative.
1.15 The Department of Education and the Department of Training and Workforce Development, in collaboration with industry and service providers, to explore opportunities to enhance in-school career guidance and support for school to work transition, particularly for remote communities and females seeking a structured employment and training pathway after leaving school.
Lead agencies: Department of Education and Department of Training and Workforce Development
DESCRIPTION: Consultation across the region highlighted the critical role of high schools in providing career guidance and support for students considering post school training and employment choices. Consultation with schools and not for profit organisations indicates that the capacity of high schools to offer these services effectively varies significantly between schools and locations. This limitation was attributed to an over reliance on particular staff and the capacity of schools to allocate resources for a career guidance role (including funding for the training and development of one or more staff members to provide these services in-house). The importance of career guidance for female students was emphasised, to promote careers in high demand occupations that are traditional seen as male oriented. Other stakeholders indicated a perception that the tertiary training offering in the Pilbara was skewed toward work readiness training for minority and equity groups, rather than a broader training offering for high school graduates.
1.16 The Pilbara Development Commission to facilitate industry and government collaboration to increase the number of available child care places.
Lead agency: Pilbara Development Commission
DESCRIPTION:Access to affordable child care and holiday care for children of working parents was consistently identified by stakeholders as a barrier to participation for primary care providers in the workforce. Child care provision across Pilbara towns is understood to be under provided, with an insufficient number of affordable child care places available in accessible locations. In order to overcome this barrier, there is a need for a lead organisation to catalyse stakeholders and drive government, industry and service provider partnerships that can deliver improved outcomes. The Pilbara Development Commission was nominated in several instances as the most appropriate stakeholder to take on this role, also recognising the crucial role of local government, larger employers, private sector providers, not for profit providers and investors.
92
Pilbara workforce development plan 2013–2016
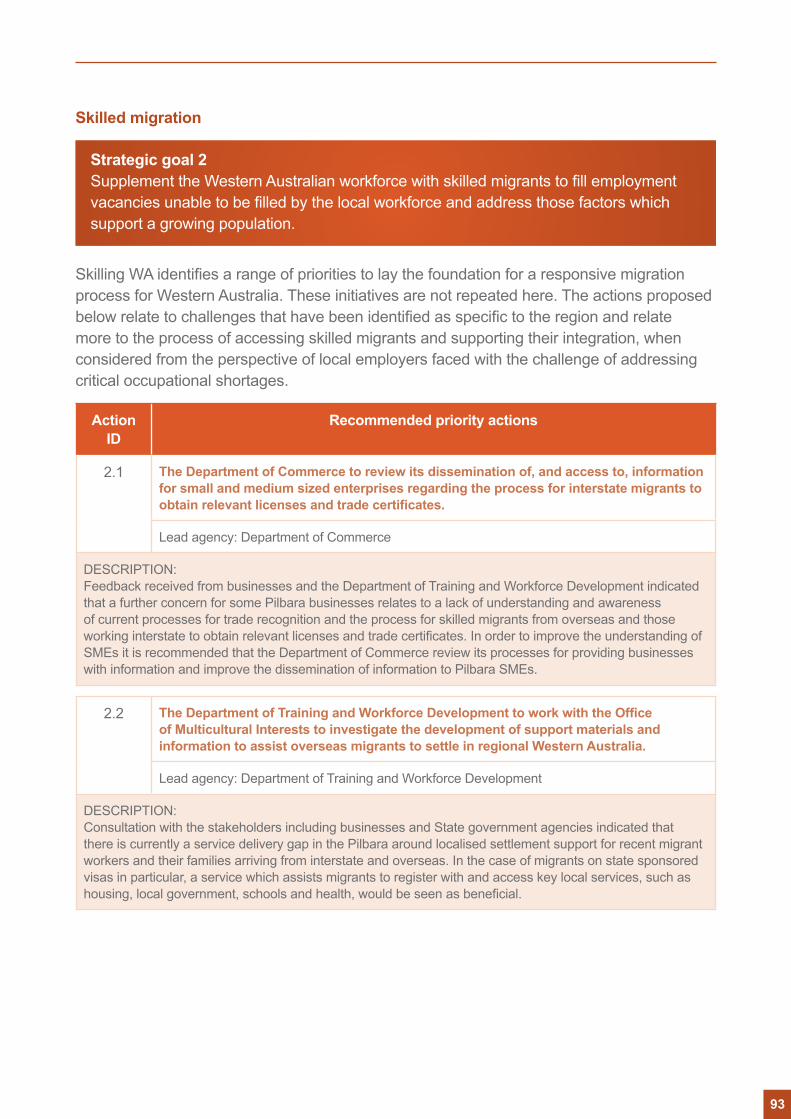
Skilled migration
Skilling WA identifies a range of priorities to lay the foundation for a responsive migration process for Western Australia. These initiatives are not repeated here. The actions proposed below relate to challenges that have been identified as specific to the region and relate more to the process of accessing skilled migrants and supporting their integration, when considered from the perspective of local employers faced with the challenge of addressing critical occupational shortages.
Action ID
Recommended priority actions
2.1 The Department of Commerce to review its dissemination of, and access to, information for small and medium sized enterprises regarding the process for interstate migrants to obtain relevant licenses and trade certificates.
Lead agency: Department of Commerce
DESCRIPTION: Feedback received from businesses and the Department of Training and Workforce Development indicated that a further concern for some Pilbara businesses relates to a lack of understanding and awareness of current processes for trade recognition and the process for skilled migrants from overseas and those working interstate to obtain relevant licenses and trade certificates. In order to improve the understanding of SMEs it is recommended that the Department of Commerce review its processes for providing businesses with information and improve the dissemination of information to Pilbara SMEs.
2.2 The Department of Training and Workforce Development to work with the Office of Multicultural Interests to investigate the development of support materials and information to assist overseas migrants to settle in regional Western Australia.
Lead agency: Department of Training and Workforce Development
DESCRIPTION: Consultation with the stakeholders including businesses and State government agencies indicated that there is currently a service delivery gap in the Pilbara around localised settlement support for recent migrant workers and their families arriving from interstate and overseas. In the case of migrants on state sponsored visas in particular, a service which assists migrants to register with and access key local services, such as housing, local government, schools and health, would be seen as beneficial.
Strategic goal 2 Supplement the Western Australian workforce with skilled migrants to fill employment vacancies unable to be filled by the local workforce and address those factors which support a growing population.
93
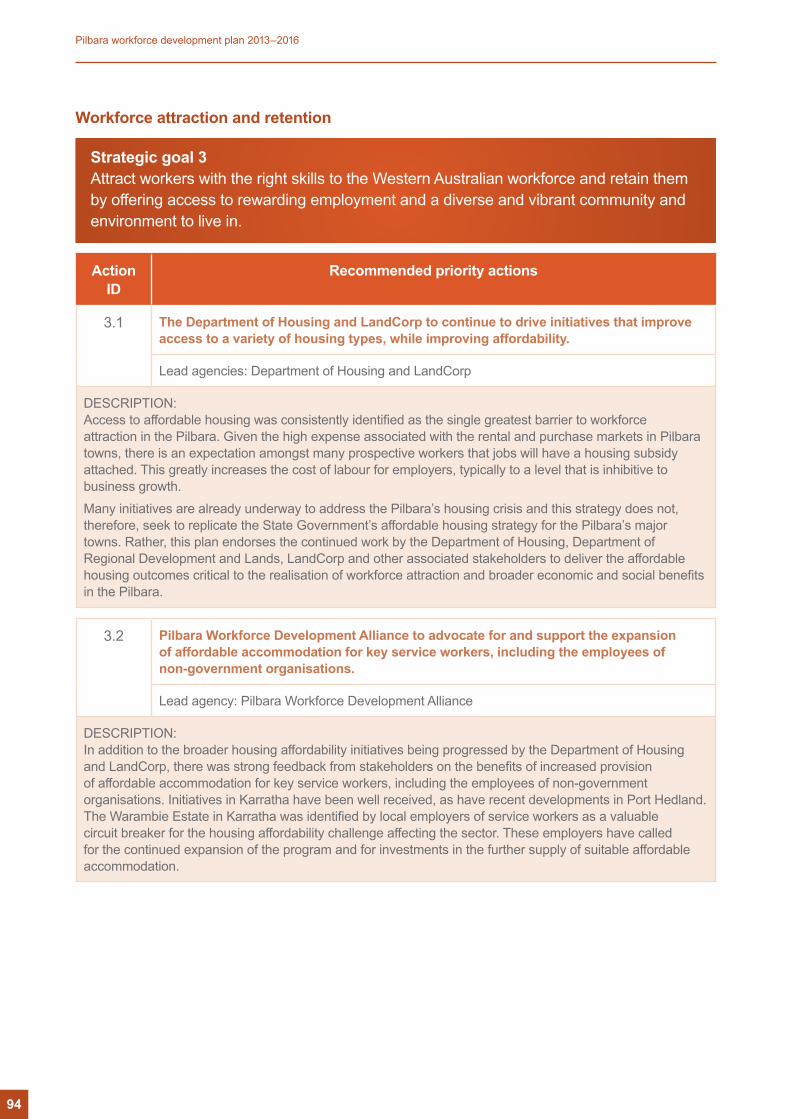
Workforce attraction and retention
Action ID
Recommended priority actions
3.1 The Department of Housing and LandCorp to continue to drive initiatives that improve access to a variety of housing types, while improving affordability.
Lead agencies: Department of Housing and LandCorp
DESCRIPTION: Access to affordable housing was consistently identified as the single greatest barrier to workforce attraction in the Pilbara. Given the high expense associated with the rental and purchase markets in Pilbara towns, there is an expectation amongst many prospective workers that jobs will have a housing subsidy attached. This greatly increases the cost of labour for employers, typically to a level that is inhibitive to business growth.
Many initiatives are already underway to address the Pilbara’s housing crisis and this strategy does not, therefore, seek to replicate the State Government’s affordable housing strategy for the Pilbara’s major towns. Rather, this plan endorses the continued work by the Department of Housing, Department of Regional Development and Lands, LandCorp and other associated stakeholders to deliver the affordable housing outcomes critical to the realisation of workforce attraction and broader economic and social benefits in the Pilbara.
3.2 Pilbara Workforce Development Alliance to advocate for and support the expansion of affordable accommodation for key service workers, including the employees of non-government organisations.
Lead agency: Pilbara Workforce Development Alliance
DESCRIPTION: In addition to the broader housing affordability initiatives being progressed by the Department of Housing and LandCorp, there was strong feedback from stakeholders on the benefits of increased provision of affordable accommodation for key service workers, including the employees of non-government organisations. Initiatives in Karratha have been well received, as have recent developments in Port Hedland. The Warambie Estate in Karratha was identified by local employers of service workers as a valuable circuit breaker for the housing affordability challenge affecting the sector. These employers have called for the continued expansion of the program and for investments in the further supply of suitable affordable accommodation.
Strategic goal 3 Attract workers with the right skills to the Western Australian workforce and retain them by offering access to rewarding employment and a diverse and vibrant community and environment to live in.
94
Pilbara workforce development plan 2013–2016
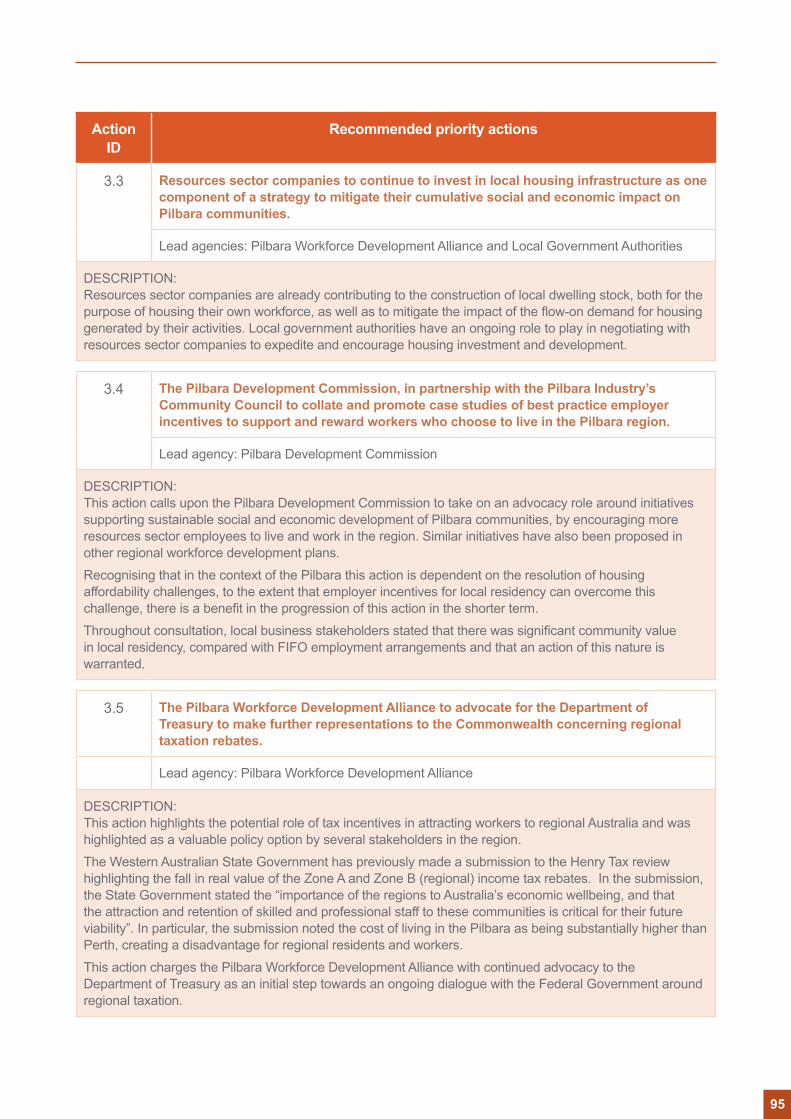
Action ID
Recommended priority actions
3.3 Resources sector companies to continue to invest in local housing infrastructure as one component of a strategy to mitigate their cumulative social and economic impact on Pilbara communities.
Lead agencies: Pilbara Workforce Development Alliance and Local Government Authorities
DESCRIPTION: Resources sector companies are already contributing to the construction of local dwelling stock, both for the purpose of housing their own workforce, as well as to mitigate the impact of the flow-on demand for housing generated by their activities. Local government authorities have an ongoing role to play in negotiating with resources sector companies to expedite and encourage housing investment and development.
3.4 The Pilbara Development Commission, in partnership with the Pilbara Industry’s Community Council to collate and promote case studies of best practice employer incentives to support and reward workers who choose to live in the Pilbara region.
Lead agency: Pilbara Development Commission
DESCRIPTION: This action calls upon the Pilbara Development Commission to take on an advocacy role around initiatives supporting sustainable social and economic development of Pilbara communities, by encouraging more resources sector employees to live and work in the region. Similar initiatives have also been proposed in other regional workforce development plans.
Recognising that in the context of the Pilbara this action is dependent on the resolution of housing affordability challenges, to the extent that employer incentives for local residency can overcome this challenge, there is a benefit in the progression of this action in the shorter term.
Throughout consultation, local business stakeholders stated that there was significant community value in local residency, compared with FIFO employment arrangements and that an action of this nature is warranted.
3.5 The Pilbara Workforce Development Alliance to advocate for the Department of Treasury to make further representations to the Commonwealth concerning regional taxation rebates.
Lead agency: Pilbara Workforce Development Alliance
DESCRIPTION: This action highlights the potential role of tax incentives in attracting workers to regional Australia and was highlighted as a valuable policy option by several stakeholders in the region.
The Western Australian State Government has previously made a submission to the Henry Tax review highlighting the fall in real value of the Zone A and Zone B (regional) income tax rebates. In the submission, the State Government stated the “importance of the regions to Australia’s economic wellbeing, and that the attraction and retention of skilled and professional staff to these communities is critical for their future viability”. In particular, the submission noted the cost of living in the Pilbara as being substantially higher than Perth, creating a disadvantage for regional residents and workers.
This action charges the Pilbara Workforce Development Alliance with continued advocacy to the Department of Treasury as an initial step towards an ongoing dialogue with the Federal Government around regional taxation.
95
Action ID
Recommended priority actions
3.6 The Pilbara Development Commission to advocate for the priority roll out of National Broadband Network (NBN) infrastructure to the Pilbara, including the prioritisation of Port Hedland in the current three year NBN plan.
Lead agency: Pilbara Development Commission
DESCRIPTION: Broadband access presents significant opportunities for business capacity and service delivery improvements in regional and remote locations, as well as contributing to the liveability and appeal of Pilbara communities to residents and new migrants.
Given the significance of Port Hedland to the Pilbara Cities vision, it is important to regional stakeholders that Port Hedland be included in the three year plan for the roll out of the network – particularly given the impact improved broadband services may have for businesses, service providers and residents in this rapidly growing town.
3.7 Pilbara Development Commission to play an active role in marketing the benefits of employment and residence in the Pilbara to interstate labour markets.
Lead agency: Pilbara Development Commission
DESCRIPTION: The Pilbara Development Commission have nominated themselves as having a greater role to play in the promotion of the Pilbara region and Pilbara-based employment opportunities to interstate and inter-regional employment markets. Actions nominated within this broader role included promotion of the region at employment exhibitions, utilising conference speaking roles to promote the region and actively assisting local businesses with the promotion of their employment needs to the broader national market.
3.8 The Department of Commerce to continue to participate in the development of the National Occupational Licensing System.
Lead agency: Department of Commerce
DESCRIPTION: Transferability of trade licences and tickets is understood by Pilbara employers and other stakeholders to be a significant barrier to accessing trade qualified workers from interstate. There are opportunities for greater harmonisation of trade licensing requirements nationally.
The National Occupational Licensing Authority (NOLA) is the independent statutory authority responsible for establishing the National Occupational Licensing System for specific occupations across Australia. It has supported the work of the COAG National Licensing Taskforce to develop the policy around the first wave of occupations, and will be responsible for implementing the Licensing System for these occupations as well as developing policy for the next wave of occupations. COAG has announced that the first wave of National Occupational Licensing System (NOLS) is scheduled to commence in mid-2014, with no date as yet set for the commencement of the second wave of the system.
96
Pilbara workforce development plan 2013–2016
Education and training
Action ID
Recommended priority actions
4.1 The Pilbara Development Commission to support the establishment of an ‘education alliance’ as recommended in the Pilbara Education Study.
Lead agency: Pilbara Development Commission
DESCRIPTION: The Pilbara Education Study (released August 2011) highlighted the need for better coordination between education providers in the Pilbara, and a consistent and integrated approach across the region for investment in education infrastructure and service delivery. In order to facilitate this process, the study recommended the establishment of an ‘education alliance’, consisting of representatives from the primary, secondary and tertiary education sectors. In addition, the study recommended that this alliance be charged with the establishment and implementation of a 10 year plan for education delivery in the Pilbara. This recommendation was reconfirmed during consultation with education industry representatives at all levels in the Pilbara.
4.2 The Pilbara Workforce Development Alliance to explore the opportunity of the Pilbara Industry Community Council working with the Department of Education to identify and negotiate a consistent role for industry in education across the region.
Lead agency: Pilbara Workforce Development Alliance
DESCRIPTION: ‘Piecemeal partnerships’ with industry were identified as a challenge for the education sector in the Pilbara. This does not discredit the invaluable contribution that industry continues to make to the education sector through scholarships, donations, infrastructure funding and other avenues; although consultation suggests that the impact of these efforts would benefit from improved coordination.
Typically, relationships are established between an individual school and a company for a sponsorship arrangement, varying from one off contributions to continuing arrangements. The fragmented nature of these arrangements, however, means that some schools and students have benefited more than others. Furthermore, some schools have indicated that they are cautious about approaching companies for support lest this detract from existing sponsorship arrangements.
Many of these challenges could be addressed by coordinating priorities across the sector and by negotiating agreements with the private sector collectively. This initiative would be facilitated by the Education Alliance with involvement from the Pilbara Industry Community Council and the Department of Education.
Strategic goal 4 Provide flexible, responsive and innovative education and training which enables people to develop and utilise the skills necessary for them to realise their potential and contribute to Western Australia’s prosperity.
97
Action ID
Recommended priority actions
4.3 Pilbara Institute to review the demand for vocational training across the Pilbara and ensure that the current scope of courses meets this demand.
Lead agency: Pilbara Institute
DESCRIPTION: Stakeholders have suggested that demand for a range of vocational education and training courses is not currently being met. Perceived demand for additional training courses and course scope was highlighted in the smaller towns of Onslow, Newman and Tom Price. This recommendation will see Pilbara Institute review the demand for its courses in these locations, to identify unmet demand. The action builds upon the State Training Plan and will require additional consultation with community members and businesses, in order to address the latent demand for tertiary training in the Pilbara.
4.4 The Pilbara Development Commission to consult with the Department of Industry, Innovation, Climate, Science, Research and Tertiary Education to identify opportunities and barriers for the delivery of Workplace English Language and Literacy programs in Pilbara towns.
Lead agency: Pilbara Development Commission
DESCRIPTION: Forum participants in Onslow highlighted the challenges that poor rates of literacy and numeracy in their local workforces create for their businesses. Other SMEs consulted indicated that there is an appetite amongst employers to part fund literacy and numeracy training for current employees, which would benefit the employer in the short term as well as developing the human capital of the Pilbara workforce more broadly.
An immediate obstacle is the perceived lack of knowledge and awareness of local courses available and the process for accessing this training.
The Australian Government Department of Industry, Innovation, Climate Science, Research and Tertiary Education presently fund a Workplace English Language and Literacy program (WELL). The WELL program provides grant funding for training, resourcing and strategic projects to organisations for English language and literacy training linked to job related workplace training.
4.5 The Department of Industry, Innovation, Climate, Science, Research and Tertiary Education to evaluate funding opportunities for expansion of apprentice case management and mentoring in the Pilbara. The Department of Training and Workforce Development to be involved on a consultative basis.
Lead agency: Department of Industry, Innovation, Climate, Science, Research and Tertiary Education
DESCRIPTION: Stakeholders identified the need for additional apprenticeship case management and mentorship investment in the Pilbara, particularly in the smaller towns beyond the business hubs of Karratha and Port Hedland. This investment is targeted toward improved completion rates in these towns. The Department of Training and Workforce Development have indicated a desire to be consulted regarding the expansion of apprentice support services given their funding of the Pilbara ApprentiCentre network.
98
Pilbara workforce development plan 2013–2016
Action ID
Recommended priority actions
4.6 The Department of Industry, Innovation, Climate, Science, Research and Tertiary Education to consider the feasibility of a regional weighting for apprentice wages in the Pilbara.
Lead agency: Department of Industry, Innovation, Climate, Science, Research and Tertiary Education
DESCRIPTION: Several stakeholders highlighted the constraint that apprentice wages place on the financial capacity of individuals to take up and complete an apprenticeship. Given the relatively higher cost of living in Pilbara towns compared to metropolitan Perth – in particular the cost of housing – the apprentice wage is considered insufficient for those who do not benefit from an effective housing subsidy. Whilst some employers already supplement apprentice wages, this is not feasible for many SMEs.
4.7 The Pilbara Development Commission to guide the strategic workforce infrastructure priorities highlighted in the Pilbara Education Study through cabinet process.
Lead agency: Pilbara Development Commission
DESCRIPTION: The Pilbara Education Study identified a series of education infrastructure priorities for the Pilbara. These include the:
• Electrical Instrumentation Centre of Specialisation; and
• Health and Allied Services Training Centre.
The need to progress these infrastructure priorities was reinforced through consultation for this workforce plan.
4.8 The Pilbara Development Commission to continue to support the UWA feasibility study on the establishment of a physical presence in the Pilbara. Where appropriate, the alliance to advocate for Federal endorsement of tertiary education investment in a physical presence in the Pilbara.
Lead agency: Pilbara Development Commission
DESCRIPTION: As the region’s population continues to grow, the demand for and viability of a local university campus will increase. No university currently has a physical presence in the Pilbara, although UWA is currently undertaking a study to assess the feasibility of investing in the local delivery of post-graduate courses.
During consultation, the establishment of a university presence in the Pilbara was highlighted as a significant opportunity to expand the region’s education offering and one which would contribute to the economic diversification of the region.
99
Action ID
Recommended priority actions
4.9 Pilbara Institute to evaluate the feasibility of providing on site accommodation for students and trainers who are visiting the campus.
Lead agencies: Pilbara Institute and Department of Housing
DESCRIPTION: The Pilbara Institute Karratha and Port Hedland campuses play a crucial role in servicing the Pilbara region. Given the accommodation affordability challenges in these locations, the institute has identified the need to investigate the possibility of expanding their on site accommodation offering to cater to visiting trainers and students. An initial action in this process is the preparation of a study to establish the demand for and financial feasibility of the proposal. If feasible, this exercise would be preceded by an approach to potential project funders from government and the private sector.
4.10 The Pilbara Education Alliance to develop and implement an information strategy for the education, training and career pathways available in the Pilbara.
Lead agency: Pilbara Development Commission/Pilbara Education Alliance
DESCRIPTION: An early priority action for the Pilbara Education Alliance will be to map education and career pathways for priority occupations in the Pilbara. Building on this mapping exercise, will be the work necessary to implement an information/communication strategy to raise awareness amongst students and potential employees regarding the pathways available.
Stakeholders consulted for this plan recognise that much of the required information currently exists, but is dispersed across a variety of organisations and in various formats.
100
Pilbara workforce development plan 2013–2016
A coordinated response
Action ID
Recommended priority actions
5.1 The Government will establish a ministerially endorsed and mandated governance arrangement to strengthen the integration and alignment of statutory land use planning, regional development and local government service delivery within existing legislative planning frameworks for the Pilbara region.
Lead agencies: Department of Regional Development and Department of Lands
DESCRIPTION: There is a strong perception amongst stakeholders that governance arrangements for the Pilbara are fragmented, with overlap between the Pilbara Development Commission, the Pilbara Regional Council, Regional Development Australia – Pilbara, Pilbara Cities and other State agencies working in the region. This view was expressed not only in relation to workforce development actions, but more broadly around the economic development agenda for the region. A review of the roles of individual entities and their responsibilities within a broader development framework provides a starting point for addressing this issue.
5.2 Government agencies to consider the relocation of senior personnel to the region to expedite policy implementation and improve service delivery.
Lead agency: Department of Premier and Cabinet
DESCRIPTION: In line with the governance and service delivery review outlined in Action 5.1, several stakeholders highlighted the value that would be placed on the relocation of senior government personnel, so that individuals with responsibilities for regional service delivery live and work in the region. Consideration of the extent to which personnel can be relocated would need to be made in light of the broader regional development agenda at the State Government level and on the availability of accommodation.
5.3 The Department of Regional Development and its network of Community Resource Centres to establish an online ‘Pilbara portal’ for residents and businesses seeking information on government services available in the Pilbara.
Lead agency: Department of Regional Development
DESCRIPTION: Local stakeholders and members of the alliance identified a need for information regarding government services available to Pilbara towns to be centralised and made available over the internet. The content of the portal would include relevant policy and strategy information, as well as providing a directory of services and contacts, employment vacancies with government agencies and notices of visiting health/immigration/education services. Presently, the broad range of stakeholders charged with delivering different facets of workforce development (and broader regional governance) each maintain their own channels of communication and promotion. Centralising these resources would reduce confusion for businesses, workers and residents in the region and would make communication more effective.
Presently, the Community Resource Centres in the region provide a physical hub for accessing a variety of services and include facilities to access a range of government information. Further opportunity exists to centralise the online footprint of these services.
Strategic goal 5 Plan and coordinate a strategic State Government response to workforce development issues in Western Australia.
101
Action ID
Recommended priority actions
5.4 The Pilbara Regional Council to establish a coordinated approach to local government knowledge management in the Pilbara.
Lead agency: Pilbara Regional Council
DESCRIPTION: A high rate of staff turn-over in local government has consistently been identified as a challenge to local government service delivery. In particular, the loss of information relating to service delivery process has been highlighted by stakeholders. In order to address this issue, local government representatives have recommended the establishment of a coordinated approach to knowledge management in the region across the four local governments. A consistent approach to knowledge management would be particularly beneficial given current practice of sharing staff resources across the region to meet critical skill shortages from time to time.
102
Pilbara workforce development plan 2013–2016
Australian Bureau of Statistics 2010, Cat. 8165.0, Counts of Australian Businesses including Entries and Exits, released June 2010.
Australian Bureau of Statistics 2010a, National Regional Profile – Pilbara (Statistical Division), ‘Total dwelling units’.
Australian Bureau of Statistics 2010b, National Regional Profile – Pilbara (Statistical Division), ‘Economy – Estimates of personal income’.
Australian Bureau of Statistics 2010c, National Regional Profile – Pilbara (Statistical Division), ‘Estimated resident population by age and sex – at 30 June’.
Australian Bureau of Statistics 2011, Cat. 3235.0, Population by Age and Sex, Regions of Australia, accessed November 2012, http://www.abs.gov.au/AUSSTATS/[email protected]/DetailsPage/3235.02011?OpenDocument
Australian Bureau of Statistics 2011, Population Census – Basic Community Profile, accessed November 2012, http://www.censusdata.abs.gov.au/census_services/getproduct/census/2011/communityprofile/50806?opendocument&navpos=230
Australian Bureau of Statistics 2011a, Population Census – Expanded Community Profile, accessed November 2012, http://www.censusdata.abs.gov.au/census_services/getproduct/census/2011/communityprofile/50806?opendocument&navpos=230
Australian Bureau of Statistics 2011b, Population Census – Indigenous Community Profile, accessed November 2012, http://www.censusdata.abs.gov.au/census_services/getproduct/census/2011/communityprofile/50806?opendocument&navpos=230
Australian Bureau of Statistics 2011c, Population Census (based on place of usual residence), Table builder accessed November 2012, http://www.abs.gov.au/websitedbs/censushome.nsf/home/tablebuilder?opendocument&navpos=240
Australian Bureau of Statistics 2011d, Population Census (based on place of enumeration), Time Series Profile accessed November 2012, http://www.censusdata.abs.gov.au/census_services/getproduct/census/2011/communityprofile/50806?opendocument&navpos=230
Australian Bureau of Statistics 2011e, Population Census, accessed November 2012, http://www.abs.gov.au/websitedbs/censushome.nsf/home/tablebuilder?opendocument&navpos=240
Australian Bureau of Statistics 2012, Cat 3218.0 Population Estimates by Local Government Area 2001–2011, Accessed April 2013 http://www.abs.gov.au/AUSSTATS/[email protected]/DetailsPage/3218.02011?OpenDocument
Chamber of Minerals and Energy of Western Australia 2011, State Growth Outlook, Chamber of Minerals and Energy, Perth, p 45.
Chamber of Minerals and Energy of Western Australia 2012, Pilbara Population and Employment Study, Chamber of Minerals and Energy, Perth, p 15.
Davies, A and Tonts, M 2009, Economic Diversity and Regional Socioeconomic Performance: An Empirical Analysis of the Western Australian Grain Belt, ‘Geographical Research’ vol. 48, 3, pp. 223–234.
Department of Education, Employment and Workplace Relations 2010, Survey of Employers’ Recruitment Experiences Pilbara ESA – August 2010 p 6, Department of Education, Employment and Workplace Relations, Canberra.
Department of Education, Employment and Workplace Relations 2011, Small Area Labour Market Data, Department of Education, Employment and Workplace Relations, Canberra.
Department of Education, Employment and Workplace Relations 2011a, Labour force growth Pilbara March 2002–June 2011, Department of Education, Employment and Workplace Relations, Canberra.
References
103
Department of Training and Workforce Development 2010, Skilling WA – A workforce development plan for Western Australia, Department of Training and Workforce Development, Perth.
Department of Training and Workforce Development September 2011, State Priority Occupation List, Department of Training and Workforce Development, Perth.
Department of Training and Workforce Development 2011, VET Enrolment Data Collection, Department of Training and Workforce Development, Perth.
Department of Training and Workforce Development December 2011, TRS, Department of Training and Workforce Development, Perth.
Department of Regional Development and Lands 2011, Annual Report 2010–11, Government of Western Australia, Perth.
Department of Regional Development and Lands 2011a, Pilbara: a region in profile 2011, pp 1–7, Department of Regional Development and Lands, Perth.
Department of Regional Development and Lands 2011b, Royalties for Regions Snapshot 2010–11, p 7, (also available on http://www.point-ds.com.au/R4R/).
Department of Regional Development and Lands 2012, Pilbara Cities, accessed 8 November 2012, http://www.rdl.wa.gov.au/royalties/r4rpilbara/Pages/default.aspx.
Joblink Enterprises Incorporated 2011, School Business Community Partnership Brokers Environment Scan, (Pilbara Environmental Scan), Joblink Enterprises Incorporated.
Pilbara Development Commission August 2011, Pilbara Education Study, pp 13–18, CCS Strategic for Pilbara Development Commission, North Perth.
Pilbara Development Commission 2011, Pilbara Housing and Land Snapshot, Residential and Commercial (Quarter ending September 2011), Pilbara Development Commission, p 14.
Pilbara Development Commission 2012, Future Development of the Pilbara, Pilbara Development Commission, p 4.
Pilbara Development Commission 2012a, Economic Profile, Pilbara Development Commission, accessed March 2013, http://www.economicprofile.com.au/pilbara/trends/building-approvals#bar-chart
Pilbara Institute 2011, Review of Education Training Needs, Pilbara Institute, Karratha.
Regional Development Australia 2010, Preliminary Pilbara Regional Plan, Regional Development Australia, Canberra.
Shire of East Pilbara 2010, Pilbara Cities: Newman Revitalisation Plan, Shire of East Pilbara, Newman.
Shire of Roebourne 2010, Pilbara Cities: Karratha City of the North Plan, Shire of Roebourne, Karratha.
Taylor, J and Scambary, B 2005, Indigenous People and the Pilbara Mining Boom – A Baseline for Regional Participation, Australian National University – Centre for Aboriginal Economic Policy Research, Research Monograph No.25, Canberra.
Town of Port Hedland March 2012, Draft Pilbara’s Port City Growth Plan, Town of Port Hedland, Port Hedland.
Waller, M 2010, Planning for Resources Growth in the Pilbara: Revised Employment and Population Projections to 2020, Pilbara Industry’s Community Council.
Western Australian Planning Commission November 2008, Newman Regional Hotspots Land Supply Update, Western Australian Planning Commission, Perth, p 5.
Western Australian Planning Commission December 2010, Karratha Regional Hotspots Land Supply Update, Western Australian Planning Commission, Perth, p 3.
Western Australian Planning Commission April 2011, Port Hedland Regional Hotspots Land Supply Update, Western Australian Planning Commission, Perth, p 3.
Western Australian Planning Commission November 2011, Onslow Regional Hotspots Land Supply Update, Western Australian Planning Commission, Perth, p 3.
Western Australian Planning Commission January 2012, Pilbara Planning and Infrastructure Framework, accessed January 2012, http://www.planning.wa.gov.au/publications/6661.asp
104
Pilbara workforce development plan 2013–2016
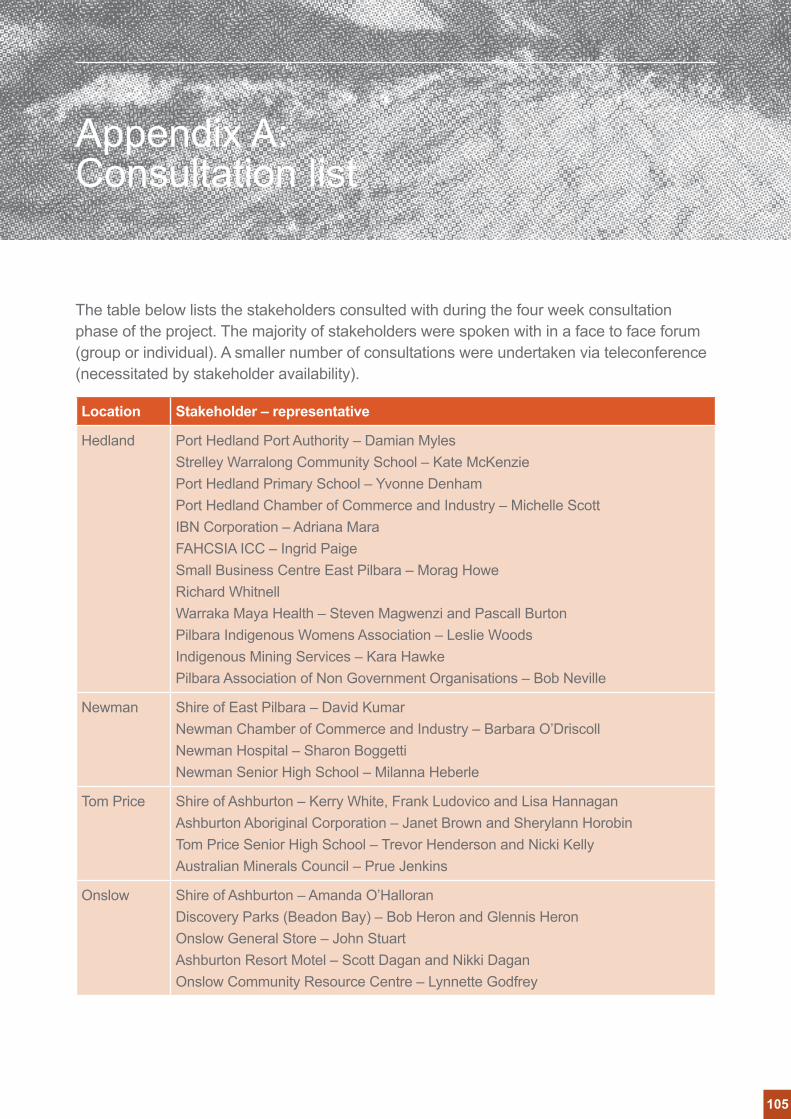
Appendix A: Consultation list
The table below lists the stakeholders consulted with during the four week consultation phase of the project. The majority of stakeholders were spoken with in a face to face forum (group or individual). A smaller number of consultations were undertaken via teleconference (necessitated by stakeholder availability).
Location Stakeholder – representative
Hedland Port Hedland Port Authority – Damian MylesStrelley Warralong Community School – Kate McKenziePort Hedland Primary School – Yvonne DenhamPort Hedland Chamber of Commerce and Industry – Michelle ScottIBN Corporation – Adriana MaraFAHCSIA ICC – Ingrid PaigeSmall Business Centre East Pilbara – Morag HoweRichard WhitnellWarraka Maya Health – Steven Magwenzi and Pascall BurtonPilbara Indigenous Womens Association – Leslie WoodsIndigenous Mining Services – Kara HawkePilbara Association of Non Government Organisations – Bob Neville
Newman Shire of East Pilbara – David KumarNewman Chamber of Commerce and Industry – Barbara O’DriscollNewman Hospital – Sharon BoggettiNewman Senior High School – Milanna Heberle
Tom Price Shire of Ashburton – Kerry White, Frank Ludovico and Lisa HannaganAshburton Aboriginal Corporation – Janet Brown and Sherylann HorobinTom Price Senior High School – Trevor Henderson and Nicki KellyAustralian Minerals Council – Prue Jenkins
Onslow Shire of Ashburton – Amanda O’HalloranDiscovery Parks (Beadon Bay) – Bob Heron and Glennis HeronOnslow General Store – John StuartAshburton Resort Motel – Scott Dagan and Nikki DaganOnslow Community Resource Centre – Lynnette Godfrey
105
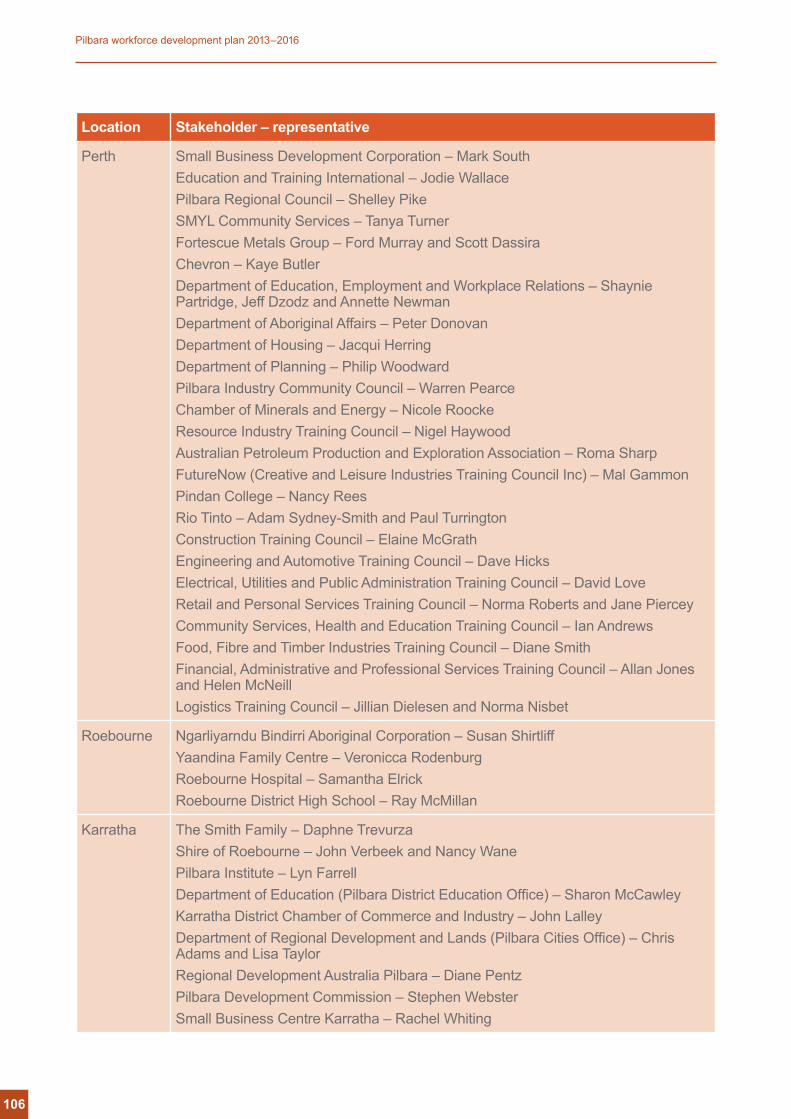
Location Stakeholder – representative
Perth Small Business Development Corporation – Mark SouthEducation and Training International – Jodie WallacePilbara Regional Council – Shelley PikeSMYL Community Services – Tanya TurnerFortescue Metals Group – Ford Murray and Scott DassiraChevron – Kaye ButlerDepartment of Education, Employment and Workplace Relations – Shaynie Partridge, Jeff Dzodz and Annette NewmanDepartment of Aboriginal Affairs – Peter DonovanDepartment of Housing – Jacqui HerringDepartment of Planning – Philip WoodwardPilbara Industry Community Council – Warren PearceChamber of Minerals and Energy – Nicole RoockeResource Industry Training Council – Nigel HaywoodAustralian Petroleum Production and Exploration Association – Roma SharpFutureNow (Creative and Leisure Industries Training Council Inc) – Mal GammonPindan College – Nancy ReesRio Tinto – Adam Sydney-Smith and Paul TurringtonConstruction Training Council – Elaine McGrathEngineering and Automotive Training Council – Dave HicksElectrical, Utilities and Public Administration Training Council – David LoveRetail and Personal Services Training Council – Norma Roberts and Jane PierceyCommunity Services, Health and Education Training Council – Ian AndrewsFood, Fibre and Timber Industries Training Council – Diane SmithFinancial, Administrative and Professional Services Training Council – Allan Jones and Helen McNeillLogistics Training Council – Jillian Dielesen and Norma Nisbet
Roebourne Ngarliyarndu Bindirri Aboriginal Corporation – Susan ShirtliffYaandina Family Centre – Veronicca RodenburgRoebourne Hospital – Samantha ElrickRoebourne District High School – Ray McMillan
Karratha The Smith Family – Daphne TrevurzaShire of Roebourne – John Verbeek and Nancy WanePilbara Institute – Lyn FarrellDepartment of Education (Pilbara District Education Office) – Sharon McCawleyKarratha District Chamber of Commerce and Industry – John LalleyDepartment of Regional Development and Lands (Pilbara Cities Office) – Chris Adams and Lisa TaylorRegional Development Australia Pilbara – Diane PentzPilbara Development Commission – Stephen WebsterSmall Business Centre Karratha – Rachel Whiting
106
Pilbara workforce development plan 2013–2016

Appendix B:Employer survey
IntroductionThank you for taking the time to complete this short survey.
The survey has been developed to assist the State Government in identifying the occupations for which there are critical shortages in the Pilbara.
The information collected from responses will be used to develop a Priority Occupation List which is specific for the Pilbara region. This list will assist in developing the Pilbara Workforce Development Plan for the period 2012 to 2015 and to inform occupation specific skill migration strategies for the region. Information pertaining to individual responses will be kept confidential and will not be disclosed in any reporting material.
The survey should take no longer than 5-10 minutes to complete.
Your business1. What is the common trading name for your business? __________________________________________________________________
2. Please select the industry category that is the most appropriate to describe your business. (list single digit industry categories - 2008 classification)
3. Approximately how many employees does your business currently employ in the Pilbara region?
1–4 persons 5–19 persons 20–199 persons 200 or more persons
4. Where are the majority of your Pilbara business operations (by number of employees) located? (respondents may tick more than one box)
Port Hedland / South Hedland
Karratha
Roebourne
Newman
Tom Price
Onslow
Other, please specify
107
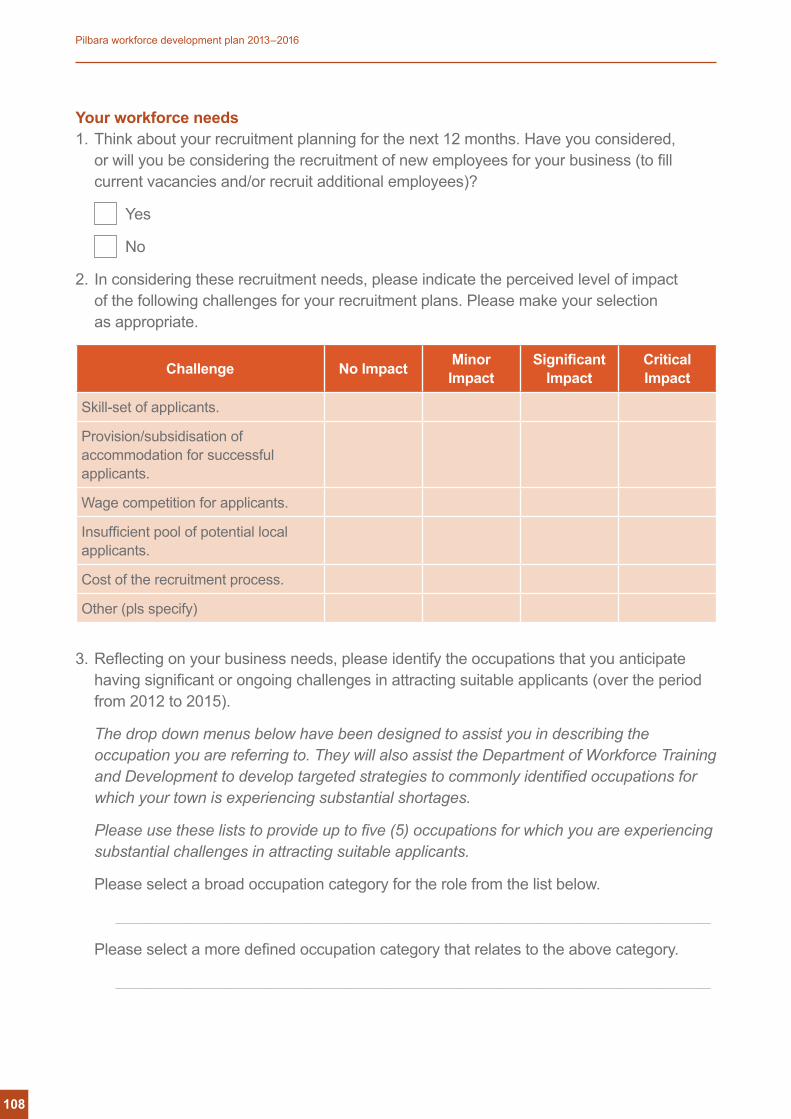
Your workforce needs1. Think about your recruitment planning for the next 12 months. Have you considered,
or will you be considering the recruitment of new employees for your business (to fill current vacancies and/or recruit additional employees)?
Yes
No
2. In considering these recruitment needs, please indicate the perceived level of impact of the following challenges for your recruitment plans. Please make your selection as appropriate.
Challenge No Impact Minor Impact
Significant Impact
Critical Impact
Skill-set of applicants.
Provision/subsidisation of accommodation for successful applicants.
Wage competition for applicants.
Insufficient pool of potential local applicants.
Cost of the recruitment process.
Other (pls specify)
3. Reflecting on your business needs, please identify the occupations that you anticipate having significant or ongoing challenges in attracting suitable applicants (over the period from 2012 to 2015).
The drop down menus below have been designed to assist you in describing the occupation you are referring to. They will also assist the Department of Workforce Training and Development to develop targeted strategies to commonly identified occupations for which your town is experiencing substantial shortages.
Please use these lists to provide up to five (5) occupations for which you are experiencing substantial challenges in attracting suitable applicants.
Please select a broad occupation category for the role from the list below.
____________________________________________________________________________________________________________________________________________________________________
Please select a more defined occupation category that relates to the above category.
____________________________________________________________________________________________________________________________________________________________________
108
Pilbara workforce development plan 2013–2016

Please provide any additional detail/ description to define the role, such as the role title.
____________________________________________________________________________________________________________________________________________________________________
____________________________________________________________________________________________________________________________________________________________________
____________________________________________________________________________________________________________________________________________________________________
____________________________________________________________________________________________________________________________________________________________________
Thank you
Thank you for your participation in this survey.
As previously stated, individual company information will be kept confidential and will not be reported in any reporting material.
109
Appendix C: Detailed regional priority occupation list
The table outlined opposite contains a detailed list of the occupations recommended for inclusion in the Pilbara RPOL. Where appropriate, the geographic specificity of the occupation shortage has been highlighted, along with the presence of the occupation on the current SPOL and the industry training council list of priority occupations.
110
Pilbara workforce development plan 2013–2016
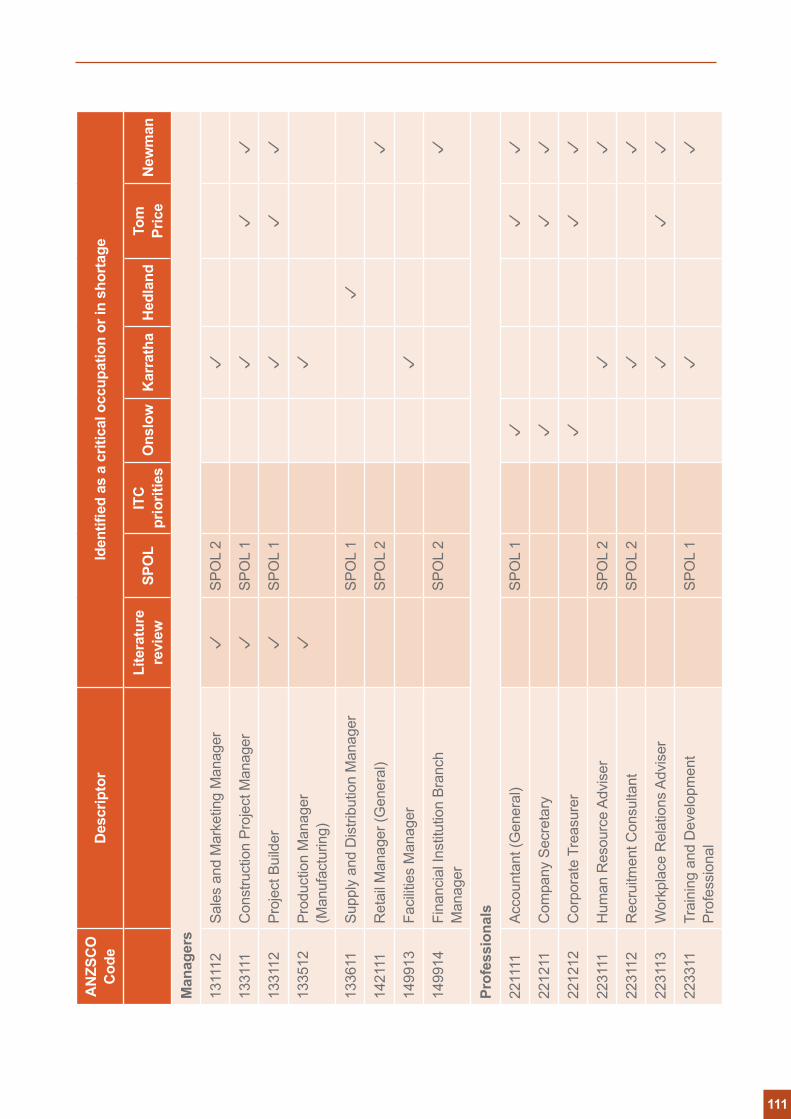
AN
ZSC
O
Cod
eD
escr
ipto
rId
entifi
ed a
s a
criti
cal o
ccup
atio
n or
in s
horta
ge
Lite
ratu
re
revi
ewSP
OL
ITC
pr
iorit
ies
Ons
low
Kar
rath
aH
edla
ndTo
m
Pric
eN
ewm
an
Man
ager
s
1311
12Sa
les
and
Mar
ketin
g M
anag
erSP
OL
2
1331
11C
onst
ruct
ion
Proj
ect M
anag
erSP
OL
1
1331
12Pr
ojec
t Bui
lder
SP
OL
1
1335
12Pr
oduc
tion
Man
ager
(M
anuf
actu
ring)
1336
11Su
pply
and
Dis
tribu
tion
Man
ager
SPO
L 1
1421
11R
etai
l Man
ager
(Gen
eral
) SP
OL
2
1499
13Fa
cilit
ies
Man
ager
1499
14Fi
nanc
ial I
nstit
utio
n Br
anch
M
anag
erSP
OL
2
Prof
essi
onal
s
2211
11Ac
coun
tant
(Gen
eral
) SP
OL
1
2212
11C
ompa
ny S
ecre
tary
2212
12C
orpo
rate
Tre
asur
er
2231
11H
uman
Res
ourc
e Ad
vise
r SP
OL
2
2231
12R
ecru
itmen
t Con
sulta
nt
SPO
L 2
2231
13W
orkp
lace
Rel
atio
ns A
dvis
er
2233
11Tr
aini
ng a
nd D
evel
opm
ent
Prof
essi
onal
SPO
L 1
111
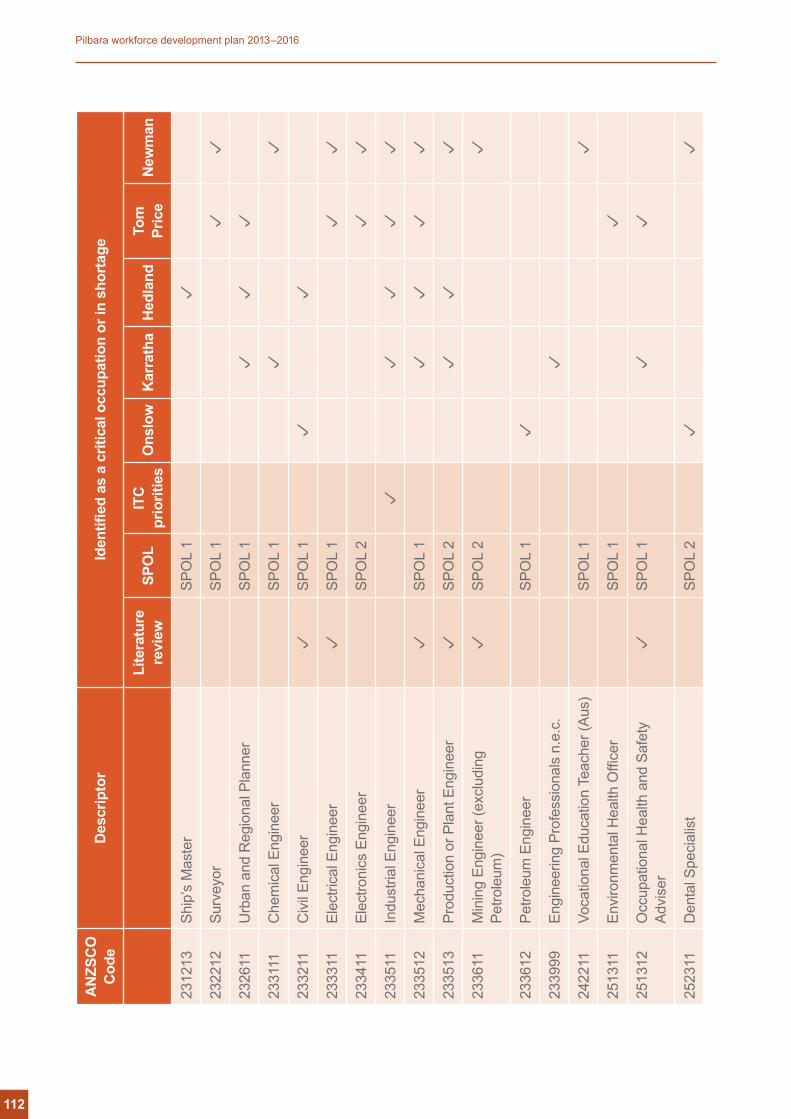
AN
ZSC
O
Cod
eD
escr
ipto
rId
entifi
ed a
s a
criti
cal o
ccup
atio
n or
in s
horta
ge
Lite
ratu
re
revi
ewSP
OL
ITC
pr
iorit
ies
Ons
low
Kar
rath
aH
edla
ndTo
m
Pric
eN
ewm
an
2312
13Sh
ip’s
Mas
ter
SPO
L 1
2322
12Su
rvey
orSP
OL
1
2326
11U
rban
and
Reg
iona
l Pla
nner
SPO
L 1
2331
11C
hem
ical
Eng
inee
rSP
OL
1
2332
11C
ivil
Engi
neer
SPO
L 1
2333
11El
ectri
cal E
ngin
eer
SPO
L 1
2334
11El
ectro
nics
Eng
inee
rSP
OL
2
2335
11In
dust
rial E
ngin
eer
2335
12M
echa
nica
l Eng
inee
rSP
OL
1
2335
13Pr
oduc
tion
or P
lant
Eng
inee
rSP
OL
2
2336
11M
inin
g En
gine
er (e
xclu
ding
Pe
trole
um)
SPO
L 2
2336
12Pe
trole
um E
ngin
eer
SPO
L 1
2339
99En
gine
erin
g Pr
ofes
sion
als
n.e.
c.
2422
11Vo
catio
nal E
duca
tion
Teac
her (
Aus)
SPO
L 1
2513
11En
viro
nmen
tal H
ealth
Offi
cer
SPO
L 1
2513
12O
ccup
atio
nal H
ealth
and
Saf
ety
Advi
ser
SPO
L 1
2523
11D
enta
l Spe
cial
ist
SPO
L 2
112
Pilbara workforce development plan 2013–2016
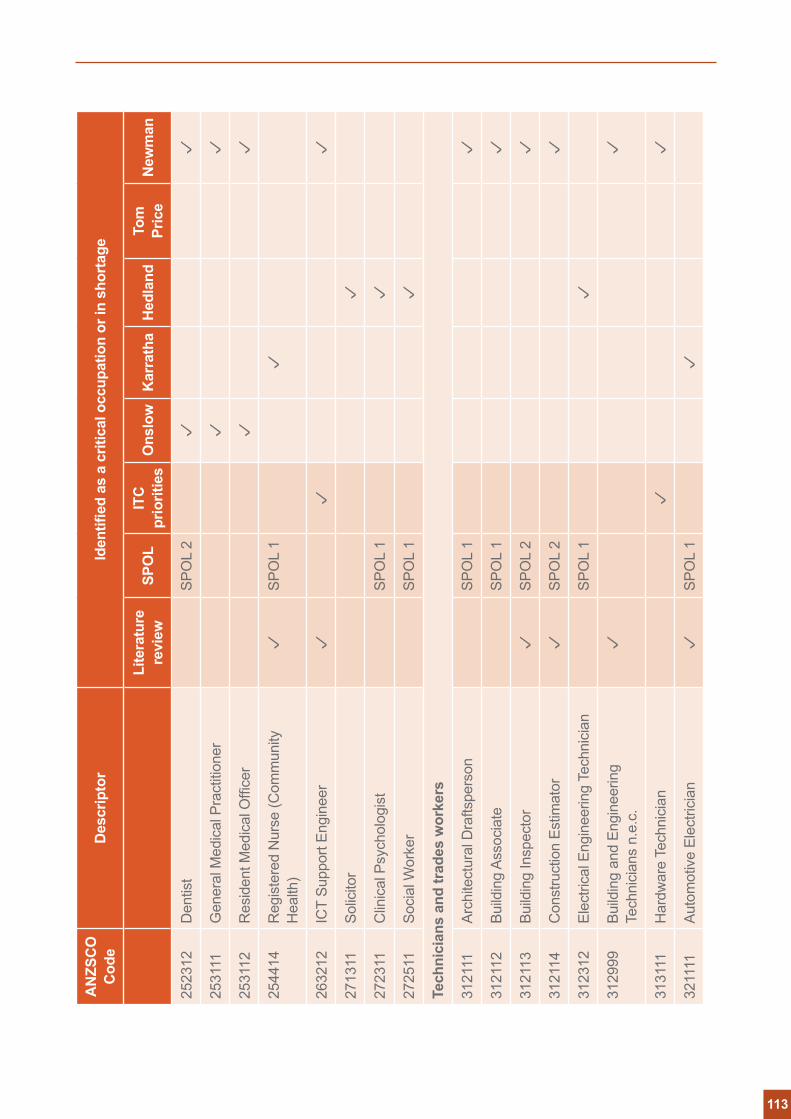
AN
ZSC
O
Cod
eD
escr
ipto
rId
entifi
ed a
s a
criti
cal o
ccup
atio
n or
in s
horta
ge
Lite
ratu
re
revi
ewSP
OL
ITC
pr
iorit
ies
Ons
low
Kar
rath
aH
edla
ndTo
m
Pric
eN
ewm
an
2523
12D
entis
tSP
OL
2
2531
11G
ener
al M
edic
al P
ract
ition
er
2531
12R
esid
ent M
edic
al O
ffice
r
2544
14R
egis
tere
d N
urse
(Com
mun
ity
Hea
lth)
SPO
L 1
2632
12IC
T Su
ppor
t Eng
inee
r
2713
11So
licito
r
2723
11C
linic
al P
sych
olog
ist
SPO
L 1
2725
11So
cial
Wor
ker
SPO
L 1
Tech
nici
ans
and
trad
es w
orke
rs
3121
11Ar
chite
ctur
al D
rafts
pers
onSP
OL
1
3121
12Bu
ildin
g As
soci
ate
SPO
L 1
3121
13Bu
ildin
g In
spec
tor
SPO
L 2
3121
14C
onst
ruct
ion
Estim
ator
SPO
L 2
3123
12El
ectri
cal E
ngin
eerin
g Te
chni
cian
SPO
L 1
3129
99Bu
ildin
g an
d En
gine
erin
g Te
chni
cian
s n.
e.c.
3131
11H
ardw
are
Tech
nici
an
3211
11Au
tom
otiv
e El
ectri
cian
SPO
L 1
113
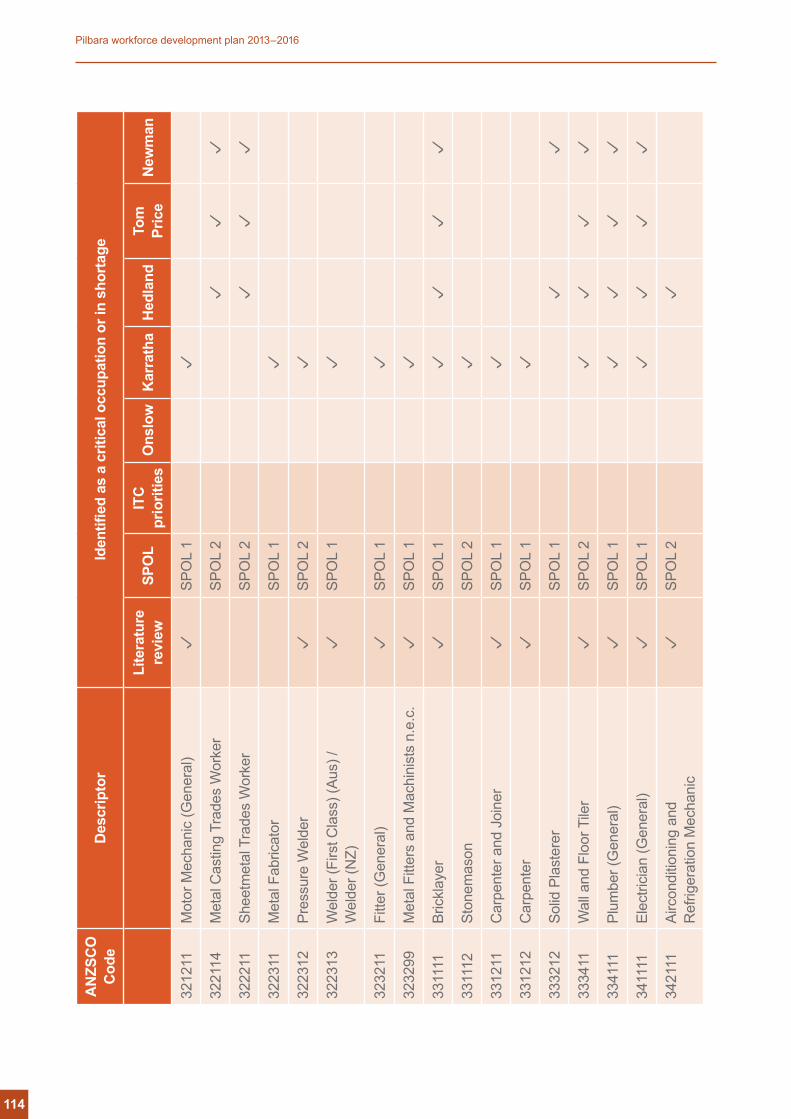
AN
ZSC
O
Cod
eD
escr
ipto
rId
entifi
ed a
s a
criti
cal o
ccup
atio
n or
in s
horta
ge
Lite
ratu
re
revi
ewSP
OL
ITC
pr
iorit
ies
Ons
low
Kar
rath
aH
edla
ndTo
m
Pric
eN
ewm
an
3212
11M
otor
Mec
hani
c (G
ener
al)
SPO
L 1
3221
14M
etal
Cas
ting
Trad
es W
orke
rSP
OL
2
3222
11Sh
eetm
etal
Tra
des
Wor
ker
SPO
L 2
3223
11M
etal
Fab
ricat
orSP
OL
1
3223
12Pr
essu
re W
elde
rSP
OL
2
3223
13W
elde
r (Fi
rst C
lass
) (Au
s) /
W
elde
r (N
Z)SP
OL
1
3232
11Fi
tter (
Gen
eral
)SP
OL
1
3232
99M
etal
Fitt
ers
and
Mac
hini
sts
n.e.
c.SP
OL
1
3311
11Br
ickl
ayer
SPO
L 1
3311
12St
onem
ason
SPO
L 2
3312
11C
arpe
nter
and
Joi
ner
SPO
L 1
3312
12C
arpe
nter
SPO
L 1
3332
12So
lid P
last
erer
SPO
L 1
3334
11W
all a
nd F
loor
Tile
rSP
OL
2
3341
11Pl
umbe
r (G
ener
al)
SPO
L 1
3411
11El
ectri
cian
(Gen
eral
)SP
OL
1
3421
11Ai
rcon
ditio
ning
and
R
efrig
erat
ion
Mec
hani
cSP
OL
2
114
Pilbara workforce development plan 2013–2016
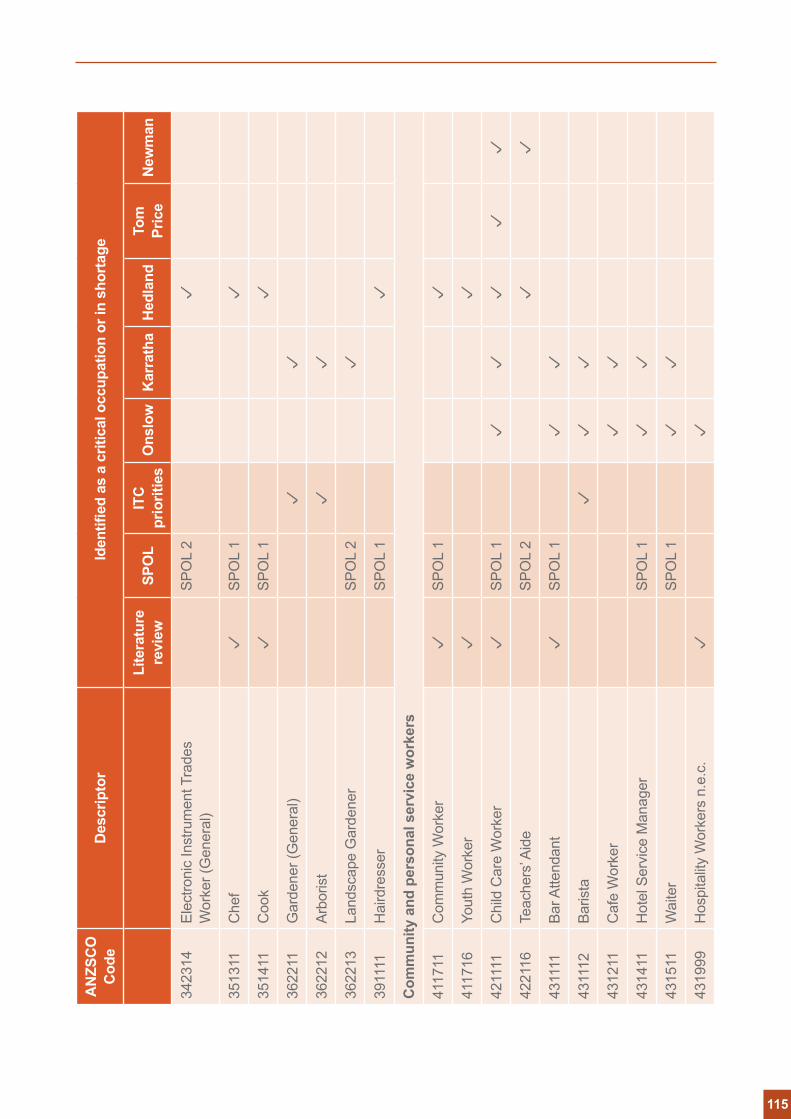
AN
ZSC
O
Cod
eD
escr
ipto
rId
entifi
ed a
s a
criti
cal o
ccup
atio
n or
in s
horta
ge
Lite
ratu
re
revi
ewSP
OL
ITC
pr
iorit
ies
Ons
low
Kar
rath
aH
edla
ndTo
m
Pric
eN
ewm
an
3423
14El
ectro
nic
Inst
rum
ent T
rade
s W
orke
r (G
ener
al)
SPO
L 2
3513
11C
hef
SPO
L 1
3514
11C
ook
SPO
L 1
3622
11G
arde
ner (
Gen
eral
)
3622
12Ar
boris
t
3622
13La
ndsc
ape
Gar
dene
rSP
OL
2
3911
11H
aird
ress
erSP
OL
1
Com
mun
ity a
nd p
erso
nal s
ervi
ce w
orke
rs
4117
11C
omm
unity
Wor
ker
SPO
L 1
4117
16Yo
uth
Wor
ker
4211
11C
hild
Car
e W
orke
rSP
OL
1
4221
16Te
ache
rs’ A
ide
SPO
L 2
4311
11Ba
r Atte
ndan
t SP
OL
1
4311
12Ba
rista
4312
11C
afe
Wor
ker
4314
11H
otel
Ser
vice
Man
ager
SPO
L 1
4315
11W
aite
rSP
OL
1
4319
99H
ospi
talit
y W
orke
rs n
.e.c
.
115
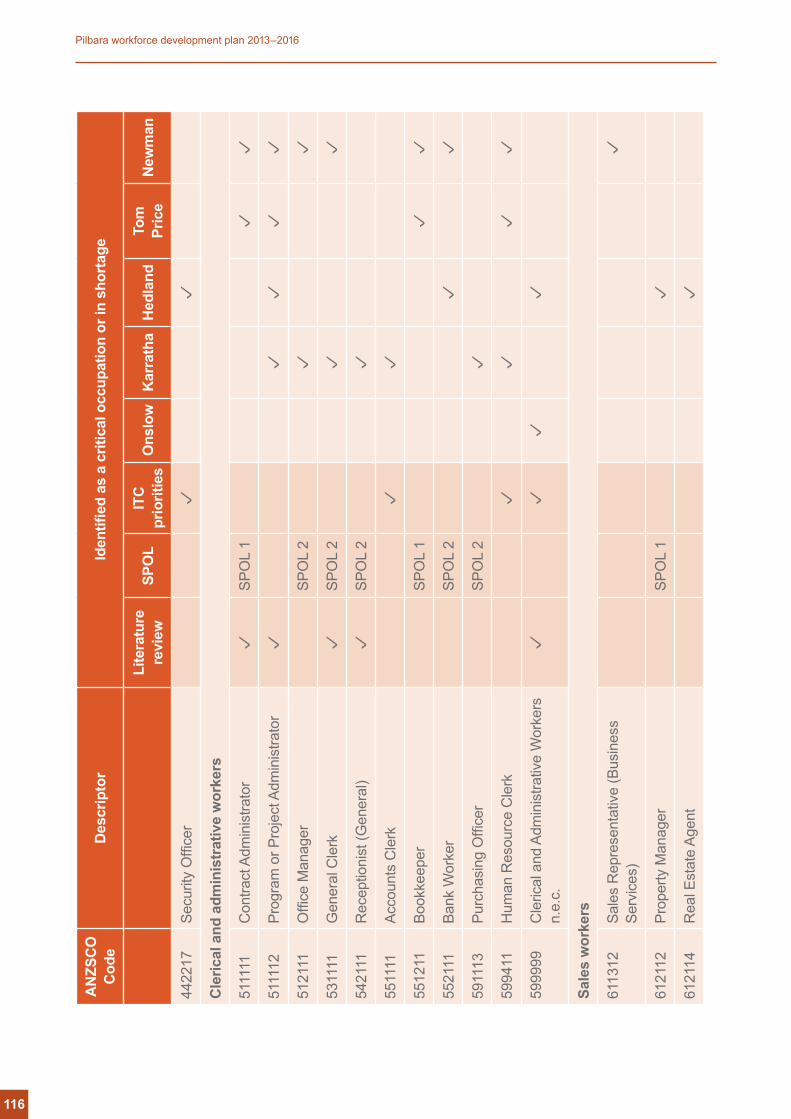
AN
ZSC
O
Cod
eD
escr
ipto
rId
entifi
ed a
s a
criti
cal o
ccup
atio
n or
in s
horta
ge
Lite
ratu
re
revi
ewSP
OL
ITC
pr
iorit
ies
Ons
low
Kar
rath
aH
edla
ndTo
m
Pric
eN
ewm
an
4422
17Se
curit
y O
ffice
r
Cle
rical
and
adm
inis
trat
ive
wor
kers
5111
11C
ontra
ct A
dmin
istra
tor
SPO
L 1
5111
12Pr
ogra
m o
r Pro
ject
Adm
inis
trato
r
5121
11O
ffice
Man
ager
SPO
L 2
5311
11G
ener
al C
lerk
SPO
L 2
5421
11R
ecep
tioni
st (G
ener
al)
SPO
L 2
5511
11Ac
coun
ts C
lerk
5512
11Bo
okke
eper
SPO
L 1
5521
11Ba
nk W
orke
rSP
OL
2
5911
13Pu
rcha
sing
Offi
cer
SPO
L 2
5994
11H
uman
Res
ourc
e C
lerk
5999
99C
leric
al a
nd A
dmin
istra
tive
Wor
kers
n.
e.c.
Sale
s w
orke
rs
6113
12Sa
les
Rep
rese
ntat
ive
(Bus
ines
s Se
rvic
es)
6121
12Pr
oper
ty M
anag
erSP
OL
1
6121
14R
eal E
stat
e Ag
ent
116
Pilbara workforce development plan 2013–2016
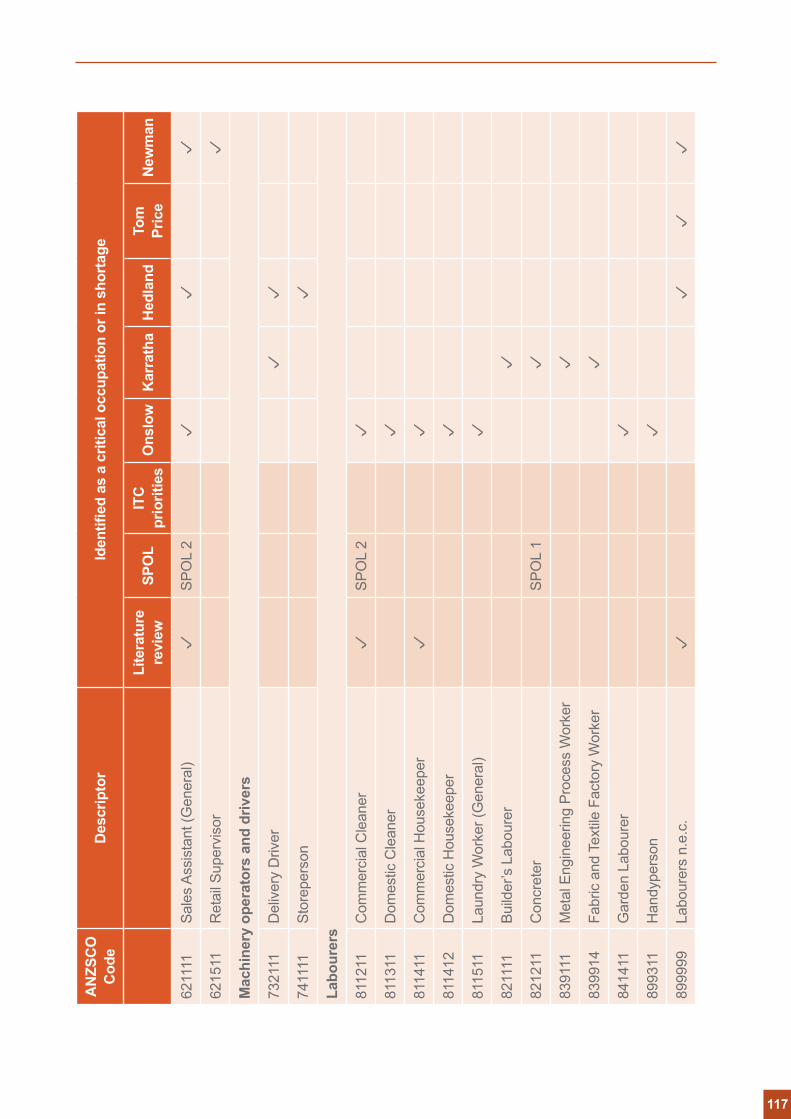
AN
ZSC
O
Cod
eD
escr
ipto
rId
entifi
ed a
s a
criti
cal o
ccup
atio
n or
in s
horta
ge
Lite
ratu
re
revi
ewSP
OL
ITC
pr
iorit
ies
Ons
low
Kar
rath
aH
edla
ndTo
m
Pric
eN
ewm
an
6211
11Sa
les
Assi
stan
t (G
ener
al)
SPO
L 2
6215
11R
etai
l Sup
ervi
sor
Mac
hine
ry o
pera
tors
and
driv
ers
7321
11D
eliv
ery
Driv
er
7411
11St
orep
erso
n
Labo
urer
s
8112
11C
omm
erci
al C
lean
erSP
OL
2
8113
11D
omes
tic C
lean
er
8114
11C
omm
erci
al H
ouse
keep
er
8114
12D
omes
tic H
ouse
keep
er
8115
11La
undr
y W
orke
r (G
ener
al)
8211
11Bu
ilder
’s L
abou
rer
8212
11C
oncr
eter
SPO
L 1
8391
11M
etal
Eng
inee
ring
Proc
ess
Wor
ker
8399
14Fa
bric
and
Tex
tile
Fact
ory
Wor
ker
8414
11G
arde
n La
bour
er
8993
11H
andy
pers
on
8999
99La
bour
ers
n.e.
c.
117

118
Pilbara workforce development plan 2013–2016
119

For further information or to provide comment on the plan, please contact:
State Workforce Planning Department of Training and Workforce Development T: +61 8 6551 5000 Email: [email protected]