pigment characterization of important golden age panel paintings of the 17th century
TRANSCRIPT

Spectrochimica Acta Part A: Molecular and Biomolecular Spectroscopy 136 (2015) 594–600
Contents lists available at ScienceDirect
Spectrochimica Acta Part A: Molecular andBiomolecular Spectroscopy
journal homepage: www.elsevier .com/locate /saa
Pigment characterization of important golden age panel paintingsof the 17th century
http://dx.doi.org/10.1016/j.saa.2014.09.0721386-1425/� 2014 Elsevier B.V. All rights reserved.
⇑ Corresponding author. Tel.: +48 12 617 34 96; fax: +48 12 633 6348.E-mail address: [email protected] (E. Proniewicz).
Ewa Pieta a, Edyta Proniewicz b,⇑, Bo _zena Szmelter-Fausek c, Justyna Olszewska-Swietlik c,Leonard M. Proniewicz a
a Faculty of Chemistry, Jagiellonian University, ul. Ingardena 3, 30-060 Kraków, Polandb Faculty of Foundry Engineering, AGH University of Science and Technology, ul. Reymonta 23, 30-059 Kraków, Polandc Department of Painting Technologies and Techniques, The Institute for the Study, Conservation and Restoration of Cultural Heritage, Nicolaus Copernicus University in Torun, ul.Sienkiewicza 30/32, 87-100 Torun, Poland
h i g h l i g h t s
� Vibrational analysis of panelpaintings: Seven Acts of Charity andAngelic Concert.� Spectroscopic identification of ground
layers and admixture of pigments.� Determination of the pictorial
technique.
g r a p h i c a l a b s t r a c t
OM images under VIS and UV light
2PbO·SnO2
Fe2O3
Wavenumber/cm-1
Ram
an in
tens
ity
Seven Acts of Charity, Anton Möller
a r t i c l e i n f o
Article history:Received 7 July 2014Received in revised form 10 September 2014Accepted 18 September 2014Available online 30 September 2014
Keywords:Gdansk school of paintingAnton MöllerHermann HanPigmentsMicro-Raman spectroscopy, MRSX-ray fluorescence spectroscopy, XRF
a b s t r a c t
Samples were obtained from two world-famous 17th century panel paintings of the Gdansk school ofpanting: ‘Seven Acts of Charity’ (1607, in St. Mary’s Church in Gdansk, Poland) by Anton Möller and ‘AngelicConcert’ (1611, in Diocesan Museum in Pelplin, Poland) by Hermann Han. Micro-Raman spectroscopy(MRS), optical microscopy (OM), and X-ray fluorescence (XRF) spectroscopy studies of the samples wereperformed to characterize the pigments present in the individual painting layers (a rich palette of white,black, blue, red, and yellow pigments) and the pictorial techniques used by the artists.
� 2014 Elsevier B.V. All rights reserved.
Introduction
‘Seven Acts of Charity’ (1607, in St Mary’s Church in Gdansk,Poland) – the main painting of the Alms Table and the painting
from the donation boxes collection – by Anton Möller (1563/5-1611) (Fig. 1) and ‘Angelic Concert’ (1611, in Diocesan Museum inPelplin, Poland) – an altar predella originally located in the Cathe-dral in Pelplin – by Hermann Han (1580–1627/8) (Fig. 2) areworld-famous panel paintings of the 17th century Golden Age.These pieces of art were created by two outstanding painterswho worked in Gdansk. Anton Möller arrived in Gdansk from

1 2
3
4
2
4
2 1 3
SA.1
1 2 12
3 SA.2
Points of sampling
Point of sampling lingling
1 2
3 4
SA.3 (a)
(b)
(a)
(a)
Fig. 1. ‘Seven Acts of Charity’ (1607, St Mary’s Church in Gdansk) by Anton Möller and the OM images of the micro-sample cross-sections: SA.1 – the yellow impasto of light,SA.2 – the green leaf, and SA.3 – the yellow robe (under visible (a) and ultraviolet (b) light). (For interpretation of the references to color in this figure legend, the reader isreferred to the web version of this article.)
SA.1.2.b
SA.1.3
tens
ity
E. Pieta et al. / Spectrochimica Acta Part A: Molecular and Biomolecular Spectroscopy 136 (2015) 594–600 595
Koenigsberg. He is best known for Biblical themes and allegoricalcompositions that are often compared to the art of Flanders andthe Netherlands. His art was influenced by Netherlandish andGerman painters [1]. Hermann Han was Netherlandish but bornin Gdansk. His early works were devoted to morality scenes.However, he is mostly known for altar paintings depicting St. Maryand compositions related to the history of the Church for Cister-cians in Pelplin (The Royal Prussia; currently Poland) and Oliwa(Poland). As a great master, he was appointed as the Polish King’sPainter [2].
Toward the end of the Middle Ages, Gdansk grew rapidly,becoming in the 16th century the largest city on the Baltic sea-board. Maintaining close cultural and trade relations with theNetherlands and Germany, this city became an artistic center inEurope. Historical sources point to Gdansk as a center of the timbertrade for the entire Baltic. The timber was floated down on the Vis-tula River, whose mouth is situated in the city [3]. The Gdansk andNetherlandish artists, unlike the Italian painters who used lessdurable species of wooden panels grounded by animal glue,painted mainly on oak panels whitewashed by ground consisting
1
2
AC.1
Point of sampling
Fig. 2. ‘Angelic Concert’ (1611, Diocesan Museum in Pelpin) by Hermann Han andthe OM image of the micro-sample cross-section: AC.1 – the yellow violin. (Forinterpretation of the references to color in this figure legend, the reader is referredto the web version of this article.)
of chalk [CaCO3] and animal glue [4–6]. ‘Seven Acts of Charity’,291 � 189 cm in dimensions, is painted on a wooden panel madeof nine boards most likely oak, whereas ‘Angelic Concert’,40 � 135 cm in dimensions, is painted on a panel made of four lin-den boards.
SA.1.1
SA.1.2.a
Wavenumber/cm-1
Ram
an In
Fig. 3. The MRS spectra of sample SA.1– the yellow impasto of light (the yellowcolored region); SA.1.1 white ground layer – chalk, SA.1.2 brown imprimatura – a:mixture of chalk and carbon-based pigment, b: mixture of hematite and carbon-based pigment, SA.1.3 yellow layer – mixture of lead tin yellow type I and leadwhite. (For interpretation of the references to color in this figure legend, the readeris referred to the web version of this article.)

596 E. Pieta et al. / Spectrochimica Acta Part A: Molecular and Biomolecular Spectroscopy 136 (2015) 594–600
In the Northern regions of the Alps, especially in the Nether-lands, there was a tendency to apply an intermediate layer, calledprimuersel, on the painting ground layer and underdrawing. Primu-ersel was flesh-colored, lightly pigmented layer that mainly gavethe ground a beige or flesh color and prevented the ground fromabsorbing binding medium from the paint layers and fixing theunderdrawing during the painting process. Karel van Manderreferred to primuersel in the Schilder-boeck (1604) [7]. GiorgioVasari (1550, Italy) called it imprimatura [7]. In certain Flemishworks by Dirck Bouts (1415–1475) and Hans Memling (1435–1494), this intermediate layer was white, whereas in works byJan van Scorel (1495–1562) and Maarten van Heemskerck (1498–1574), it was gray. Near the end of the 16th century (approxi-mately 1575), colored ground layers appeared in the Netherlands,especially in the Haarlem school of painting, most likely instead ofimprimatura [7,8]. Likewise, the Gdansk artists used white groundstogether with various colored ones obtained by mixing chalk, leadwhite, yellow ochre, iron oxide red, brown umber, charcoal, andother pigments [5,8].
The pigment palette of the Netherlandish and Gdansk painterswas very similar [5]. They commonly used lead white [2PbCO3-
�Pb(OH)2], lead tin yellow [light (type 1) – Pb2SnO4 and dark (typeII) – Pb(Sn,Si)O3], and yellow ochre [Fe2O3�H2O]. Among red pig-ments, vermilion [HgS, a synthetic equivalent of cinnabar origi-nally made from the powdered mineral cinnabar], red lead[minimum, Pb3O4], carmine (organic red – carminic acid), and ironoxide red [Fe2O3] were popular. For blue areas, painters appliedlazurite [Na8[Al6Si6O24]Sn], natural azurite [Cu3(CO3)2(OH)2], andsmalt [CoO�nK2SiO3]. Smalt can be found in the Northern
Wavenumber/cm-1
Ram
an In
tens
ity
SA.2.1
SA.2.2.c
SA.2.3.a
SA.2.3.b
SA.2.3.c
Fig. 4. The MRS spectra of sample SA.2– the green leaf (the green colored region); SA.2.1 wpigment, c: vermilion, SA.2.3 blue layer – a: azurite, b: vermilion, c: lead tin yellow typreferred to the web version of this article.)
Netherlandish paintings dated from the middle of the sixteenthcentury onwards, most likely as a substitute for lapis lazuli andazurite imported from Hungary, which became expensive anddifficult to obtain after the conquest of Hungary by the Turks in1526 [4]. Green color was obtained using natural malachite[Cu2CO3(OH)2] and copper green [Cu(CH3COO)2]. Charcoal wasused as a black pigment [6,9].
The main aim of the study was to obtain analytical informationon the materials used for the ground and painting layers of ‘SevenActs of Charity’ and ‘Angelic Concert’. The painting technique,namely the characteristic features related to certain schools ofpainting, was characterized on the basis of analysis of three sam-ples of Möller’s and one sample of Han’s paintings. Knowledge ofthe materials used is very important for planning future conserva-tion and restoration treatments.
Material and methods
Samples
‘Seven Acts of Charity’ and ‘Angelic Concert’ are of high worth andhistorical value as well as being in a good state of conservation.Therefore, we were able to take only very limited samples of thesepaintings.
Three micro-samples (thickness: SA.1 – 261 lm, SA.2 – 122 lm,and SA.3 – 242 lm) were taken from different parts of the ‘SevenActs of Charity’ painting by Anton Möller: the yellow impasto of light(SA.1), the green leaf (SA.2), and the yellow robe (SA.3) (Fig. 1). Onesample (thickness: 42 lm) was taken from the yellow region of
SA.2.2.a
SA.2.2.b 1049
1053
Ram
an In
tens
ity
Wavenumber/cm-1
hite ground layer – chalk, SA.2.2. brown imprimatura – a: lead white, b: carbon-basede I. (For interpretation of the references to color in this figure legend, the reader is

sity
SA.3.3
SA.3.4
E. Pieta et al. / Spectrochimica Acta Part A: Molecular and Biomolecular Spectroscopy 136 (2015) 594–600 597
‘Angelic Concert’ by Hermann Han: the yellow violin (AC.1) (Fig. 2).The numbers given at the cross-sections of the samples under vis-ible and ultraviolet light denote the technological layers, beginningfrom the ground layer and proceeding up to the varnish. The sam-ples represent the characteristics and predominant hues in thepainting composition.
The cross-sections of the samples were prepared by embeddingthe samples in a small resin block (acrylic resin ‘Duracryl 0’ SpofaDental – Praha) and polishing.
Ram
an In
ten
SA.3.1
SA.3.2.a
SA.3.2.b
Optical microscopy measurements
OM measurements under visible light for samples SA.1–SA.3and AC.1 were performed using a Nikon Optiphot-2 (Nikon Inc.,USA) conventional reflected light microscope. OM measurementsunder visible and ultraviolet light of the SA.3 sample were per-formed using a Nikon Eclipse E 600 fluorescence microscope(Nikon Inc., USA).
Wavenumber/cm-1
Fig. 5. The MRS spectra of sample SA.3 – the yellow robe (the yellow coloredregion); SA.3.1 white ground layer – chalk, SA.3.2 brown imprimatura – a: mixture oflazurite and chalk, b: mixture of hematite and carbon-based pigment, SA.3.3 whitelayer – lead white, SA.3.4 yellow layer – lead tin yellow type I. (For interpretation ofthe references to color in this figure legend, the reader is referred to the web versionof this article.)
AC.1.2.c
Micro-Raman measurements
The Micro-Raman spectra (MRS) of the sample layers wererecorded using an InVia spectrometer (Renishaw, England)equipped with a CCD detector. The excitation wavelength was pro-vided by a diode laser emitting a 785.0 nm line. To avoid burningthe samples, the laser power at the sample was 0.3 mW. The sam-ple surface was controlled after each measurement (before andafter measurements the microscopic images of the investigatedsamples were compared). All spectra were acquired with an aver-age spectral resolution of 4 cm�1 in the spectral range of 100–3200 cm�1. In most cases, 4 scans (160 s acquisition time) weresufficient to obtain high-quality MRS spectra (good signal to noise(S/N) ratio). However, in certain cases, the S/N level was low. Thus,16 scans were recorded to obtain an improved S/N ratio. The pre-sented spectra were not smoothed and were subjected to a minorbaseline correction. The baseline procedure was carefully per-formed to ensure that the pigments’ MRS spectra were not dueto artifacts introduced by the procedure.
aman
Inte
nsity
AC.1.2.a
AC.1.2.b
X-ray fluorescence measurementsMeasurements were performed on a Mini Pal PW 4025 (PhilipsMinimate) energy dispersive X-ray spectrometer. The excitationparameters used during the measurements were voltage at 25 kVand current at 0.03 mA.
R
AC.1.1.b
Fitting procedure
Fitting of the lead white pigment MRS spectrum (Fig. 4, SA.2.2 atrace) was performed using the GRAMS/AI program (GalacticIndustries Co., Salem, NH). A 50/50% Lorentzian/Gaussian bandshape was assumed and was fixed for all the bands.
Wavenumber/cm-1
AC.1.1.a
Fig. 6. The MRS spectra of sample AC.1 – the yellow violin (the yellow coloredregion); AC.1.1 gray ground layer – a: carbon-based pigment, b: mixture of red leadand lead white, AC.1.2 yellow layer – a: lead tin yellow type I, b: vermilion, c:mixture of hematite and lead white. (For interpretation of the references to color inthis figure legend, the reader is referred to the web version of this article.)
Results and discussion
Optical (Fig. 1 (SA.1–SA.3 insets) and 2 (AC.1 inset)), vibrational(Figs. 3–6), and XRF (Fig. 7) analysis of the paintings’ cross-sectionsdemonstrated that the samples were multilayered and that the lay-ers were not always homogenous (see the OM images in Figs. 1 and2 and the Raman spectra in Fig. 3, traces SA.1.2.a–b; Fig. 4, tracesSA.2.2.a–c and SA.2.3.a–c; Fig. 5, traces SA.3.1.a–b; and Fig. 6,traces AC.1.1.a–b and AC.1.2.a–c). The Raman spectra of each layerrevealed characteristic spectral features due to the particular pig-ments. The identification of the pigments, listed in Table 1, was

598 E. Pieta et al. / Spectrochimica Acta Part A: Molecular and Biomolecular Spectroscopy 136 (2015) 594–600
mainly based on spectral databases of pigments [10–12] (seeTable 2).
The OM analysis of sample SA.1 (the yellow impasto of light;Fig. 1, SA.1 inset) demonstrated that the sample consists of threeindividual layers. The Raman spectrum of the SA.1.1 ground layer(Fig. 3, SA.1.1 trace) showed a set of bands at 1086, 281, and151 cm�1 due to chalk/calcite [CaCO3] [13]. The Raman spectra ofthe brown imprimatura layer (Fig. 3, SA.1.2 traces) exhibited verybroad Raman signals (at �1582 and 1329 cm�1) assigned mainlyto a carbon-based pigment – most likely charcoal [14,15] – mixedwith a small concentration of chalk (Fig. 3, SA.1.2.a trace) or hema-tite [Fe2O3] (at 612, 409, 291, and 224 cm�1) [16] (Fig. 3, SA.1.2.btrace).
Noteworthy is a fact that in the SA.1.2.b spectrum the D(stretching vibrations in the planar graphite structure) and G(result of defects of the graphite structure and the presence of het-eroatoms) bands due to carbon-based pigment are slightly shiftedto �1600 and 1270 cm�1, respectively. It is know that these bandspositions showed a large range of values (D: from 1345 to1394 cm�1 and G: from 1578 to 1603 cm�1) and their broadnessis due to their overlap with the D0 and G0 spectral features[17,18]. From studies on changes in the Raman spectra of woodand bamboo charcoal with heat treatment it is also known thattwo broad bands of G and D become sharper at higher temperatureand G band splits to G (�1580 cm�1) and D0 (�1620 cm�1) bands[19]. Based on above information, the thermal heating of the sam-ple can be excluded as a source of the bands wavenumber shift.The particle size effect [20] and the presence of iron oxides (hema-tite) [21] could explain of the observed shift in wavenumbers.Another possibility is a presence in charcoal of carbon traces inan intermediate structure (showing the characteristic 1239–1280
Cou
nts
Cou
nts
Pb
Pb
Pb
Pb
Pb
Pb
Pb
Pb Pb Pb
Fe Fe
Fe
Fe
Ca
Ca
Ca Cu Cu
SA.1
SA.3
Fig. 7. The XRF spectra of sample SA.1 – the yellow impasto of light (the yellow colored regrobe (the yellow colored region), and sample AC.1 – the yellow violin (the yellow colored rereferred to the web version of this article.)
(R2) and 1500–1530 (R1) cm�1 Raman bands) between graphiticand amorphous, so-called turbostatic or random structure [19,22].
The last layer of the SA.1. sample (Fig. 1, SA.1.3) showed spectralfeatures at 455, 289, 272, 194, and 126 cm�1 due to lead tin yellowtype I [Pb2SnO4] [13,14,23] and a weak 1050 cm�1 Raman signal,most likely due to lead white (hydrocerussite) [2PbCO3�Pb(OH)2][13,24,25] (Fig. 3, SA.1.3 trace).
The XRF analysis proved that the thickest white SA.1.1 paintlayer of sample SA.1 consists of chalk. Thus, in the SA.1 case, cal-cium is the predominant element, with lead and small amountsof iron (Fig. 7, SA.1 section) (see Table 3 for main identifiedelements).
The SA.2 sample taken from a part of the green leaf (Fig. 1, SA.2inset), like SA.1, consisted of three layers. The Raman analysis ofthe ground layer (Fig. 4, SA.2.1 trace) suggested the presence ofchalk (similar to the SA.1.1 layer). However, the brown imprimatu-ra layer yielded three spectra due to hydrocerussite (at �1053 and1049 cm�1) with traces of carbon-based pigment (Fig. 4, SA.2.2.atrace), due to carbon-based pigment (Fig. 4, SA.2.2.b trace), anddue to red pigment vermilion [HgS] (at 342, 283, and 253 cm�1)[13,26,27] (Fig. 4, SA.2.2.c trace). The Raman analysis of the bluelayer identified a heterogeneous mixture of blue pigment azurite[2CuCO3�Cu(OH)2] [13,26,28,29] (Fig. 4, SA.2.3.a trace), vermilion(Fig. 4, SA.2.3.b trace), and lead tin yellow type I (Fig. 4, SA.2.3.ctrace) (see Table 1 for the list of the pigments’ characteristic Ramanbands).
Consequently, the XRF spectrum of sample SA.2 showed thatcopper from the wide azurite layer (Fig. 1, SA.2 inset) is the pre-dominant element, but small amounts of lead, calcium, and ironcan also be detected (Fig. 7, SA.2 section). However, the presenceof iron was not detected by the MRS analysis. Several possibilities
Cou
nts
Pb
Pb
Pb
Pb
Pb Pb
Pb
Pb
Fe
Fe
Fe
Cou
nts
Ca
Ca
Cu
Cu
SA.2
AC.1
Pb
Fe
ion), sample SA.2 – the green leaf (the green colored region), sample SA.3 – the yellowgion). (For interpretation of the references to color in this figure legend, the reader is
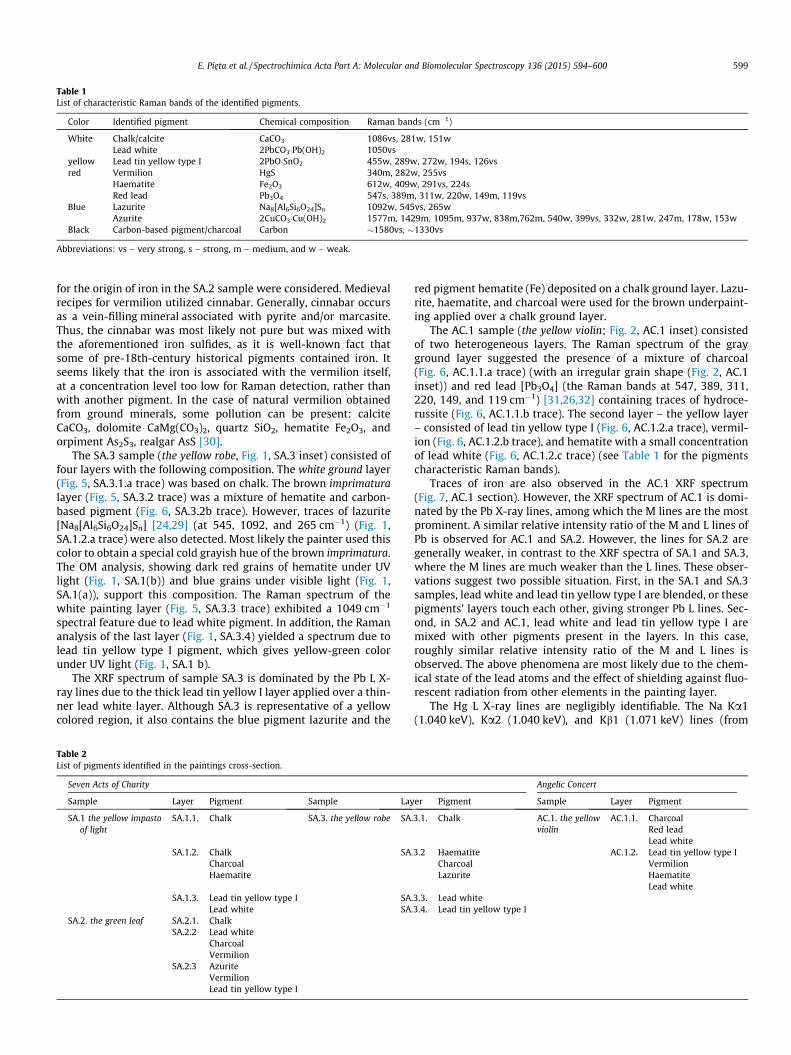
Table 1List of characteristic Raman bands of the identified pigments.
Color Identified pigment Chemical composition Raman bands (cm�1)
White Chalk/calcite CaCO3 1086vs, 281w, 151wLead white 2PbCO3�Pb(OH)2 1050vs
yellow Lead tin yellow type I 2PbO�SnO2 455w, 289w, 272w, 194s, 126vsred Vermilion HgS 340m, 282w, 255vs
Haematite Fe2O3 612w, 409w, 291vs, 224sRed lead Pb3O4 547s, 389m, 311w, 220w, 149m, 119vs
Blue Lazurite Na8[Al6Si6O24]Sn 1092w, 545vs, 265wAzurite 2CuCO3�Cu(OH)2 1577m, 1429m, 1095m, 937w, 838m,762m, 540w, 399vs, 332w, 281w, 247m, 178w, 153w
Black Carbon-based pigment/charcoal Carbon �1580vs, �1330vs
Abbreviations: vs – very strong, s – strong, m – medium, and w – weak.
E. Pieta et al. / Spectrochimica Acta Part A: Molecular and Biomolecular Spectroscopy 136 (2015) 594–600 599
for the origin of iron in the SA.2 sample were considered. Medievalrecipes for vermilion utilized cinnabar. Generally, cinnabar occursas a vein-filling mineral associated with pyrite and/or marcasite.Thus, the cinnabar was most likely not pure but was mixed withthe aforementioned iron sulfides, as it is well-known fact thatsome of pre-18th-century historical pigments contained iron. Itseems likely that the iron is associated with the vermilion itself,at a concentration level too low for Raman detection, rather thanwith another pigment. In the case of natural vermilion obtainedfrom ground minerals, some pollution can be present: calciteCaCO3, dolomite CaMg(CO3)2, quartz SiO2, hematite Fe2O3, andorpiment As2S3, realgar AsS [30].
The SA.3 sample (the yellow robe, Fig. 1, SA.3 inset) consisted offour layers with the following composition. The white ground layer(Fig. 5, SA.3.1.a trace) was based on chalk. The brown imprimaturalayer (Fig. 5, SA.3.2 trace) was a mixture of hematite and carbon-based pigment (Fig. 6, SA.3.2b trace). However, traces of lazurite[Na8[Al6Si6O24]Sn] [24,29] (at 545, 1092, and 265 cm�1) (Fig. 1,SA.1.2.a trace) were also detected. Most likely the painter used thiscolor to obtain a special cold grayish hue of the brown imprimatura.The OM analysis, showing dark red grains of hematite under UVlight (Fig. 1, SA.1(b)) and blue grains under visible light (Fig. 1,SA.1(a)), support this composition. The Raman spectrum of thewhite painting layer (Fig. 5, SA.3.3 trace) exhibited a 1049 cm�1
spectral feature due to lead white pigment. In addition, the Ramananalysis of the last layer (Fig. 1, SA.3.4) yielded a spectrum due tolead tin yellow type I pigment, which gives yellow-green colorunder UV light (Fig. 1, SA.1 b).
The XRF spectrum of sample SA.3 is dominated by the Pb L X-ray lines due to the thick lead tin yellow I layer applied over a thin-ner lead white layer. Although SA.3 is representative of a yellowcolored region, it also contains the blue pigment lazurite and the
Table 2List of pigments identified in the paintings cross-section.
Seven Acts of Charity
Sample Layer Pigment Sample Lay
SA.1 the yellow impastoof light
SA.1.1. Chalk SA.3. the yellow robe SA
SA.1.2. Chalk SACharcoalHaematite
SA.1.3. Lead tin yellow type I SALead white SA
SA.2. the green leaf SA.2.1. ChalkSA.2.2 Lead white
CharcoalVermilion
SA.2.3 AzuriteVermilionLead tin yellow type I
red pigment hematite (Fe) deposited on a chalk ground layer. Lazu-rite, haematite, and charcoal were used for the brown underpaint-ing applied over a chalk ground layer.
The AC.1 sample (the yellow violin; Fig. 2, AC.1 inset) consistedof two heterogeneous layers. The Raman spectrum of the grayground layer suggested the presence of a mixture of charcoal(Fig. 6, AC.1.1.a trace) (with an irregular grain shape (Fig. 2, AC.1inset)) and red lead [Pb3O4] (the Raman bands at 547, 389, 311,220, 149, and 119 cm�1) [31,26,32] containing traces of hydroce-russite (Fig. 6, AC.1.1.b trace). The second layer – the yellow layer– consisted of lead tin yellow type I (Fig. 6, AC.1.2.a trace), vermil-ion (Fig. 6, AC.1.2.b trace), and hematite with a small concentrationof lead white (Fig. 6, AC.1.2.c trace) (see Table 1 for the pigmentscharacteristic Raman bands).
Traces of iron are also observed in the AC.1 XRF spectrum(Fig. 7, AC.1 section). However, the XRF spectrum of AC.1 is domi-nated by the Pb X-ray lines, among which the M lines are the mostprominent. A similar relative intensity ratio of the M and L lines ofPb is observed for AC.1 and SA.2. However, the lines for SA.2 aregenerally weaker, in contrast to the XRF spectra of SA.1 and SA.3,where the M lines are much weaker than the L lines. These obser-vations suggest two possible situation. First, in the SA.1 and SA.3samples, lead white and lead tin yellow type I are blended, or thesepigments’ layers touch each other, giving stronger Pb L lines. Sec-ond, in SA.2 and AC.1, lead white and lead tin yellow type I aremixed with other pigments present in the layers. In this case,roughly similar relative intensity ratio of the M and L lines isobserved. The above phenomena are most likely due to the chem-ical state of the lead atoms and the effect of shielding against fluo-rescent radiation from other elements in the painting layer.
The Hg L X-ray lines are negligibly identifiable. The Na Ka1(1.040 keV), Ka2 (1.040 keV), and Kb1 (1.071 keV) lines (from
Angelic Concert
er Pigment Sample Layer Pigment
.3.1. Chalk AC.1. the yellowviolin
AC.1.1. CharcoalRed leadLead white
.3.2 Haematite AC.1.2. Lead tin yellow type ICharcoal VermilionLazurite Haematite
Lead white.3.3. Lead white.3.4. Lead tin yellow type I

Table 3XRF analysis of main identified elements.
Energy (keV) Line Element
3.69 Ka1 Ca4.01 Kb12.34 Ma1 Pb2.44 Mb1
10.45 La110.55 La112.61 Lb1
6.39 Ka1 Fe7.06 Kb18.04 Ka1 Cu8.90 Kb1
600 E. Pieta et al. / Spectrochimica Acta Part A: Molecular and Biomolecular Spectroscopy 136 (2015) 594–600
lazurite) were not determined due to the detection window. TheKa and Kb lines of S, another chemical element characteristic ofvermilion and lazurite, are covered by Ca K lines (3.691–4.012 keV) and cannot be observed. Likewise, the Sn L lines(2PbO�SnO2) are overlapped by Ca lines (3.691 (Ka1), 3.688(Ka2), and 4.012 keV (Kb1)) and cannot be detected.
Conclusions
In this paper, two world-famous 17th century panel paintings‘Seven Acts of Charity’ by Anton Möller and ‘Angelic Concert’ byHermann Han, were investigated. The analysis performed provedthat the two abovementioned artists were influenced by the NorthSchool of Painting and the widespread tendency to use woodenpanels and white and gray grounds. The use of the white chalkground and the brown imprimatura in Möller’s painting was typi-cal of the painting technique of the 16th century Netherlandishartists, such as Maarten van Heemskerck (1498–1574) and CornelisAntonisz (1505–1553). In contrast to the Netherlandish artists,Han’s painting was instead under the local influence of usinglinden wood boards.
Anton Möller painted ‘Seven Acts of Charity’ on the brown inter-mediate layer. Hermann Han painted the gray ground first, directlyon the wooden panel. A gray ground was commonly used by artistssuch as Karel van Mander (1548–1606), Cornelis Cornelisz vanHaarlem (1562–1638), and Hendrick Goltzius (1558–1617) [4].
The ground layer and material are different in the paintings ofthe two artists. The thick (160 lm) white ground in ‘Seven Acts ofCharity’ by Anton Möller contains chalk, whereas the ground in‘Angelic Concert’ by Hermann Han is very thin (only approximately20 lm) and gray. This gray color derives from a mixture of leadwhite, charcoal, and a small concentration of red lead. The analysisalso showed that in the case of ‘Seven Acts of Charity’, the groundlayer was overlaid with a brownish gray interlayer of imprimaturaconsisting of lead white, carbon-based pigment, lazurite, andhematite.
Möller’s pigment palette comprised, among others, chalk, leadwhite (hydrocerussite), lead tin yellow (type I), vermillion, hema-tite, lazurite, azurite, and carbon-based pigment. On the otherhand, Han preferred lead white (hydrocerussite), lead tin yellowtype I, vermilion, hematite, red lead, and charcoal. These pigmentswere typically used in this period of time.
Acknowledgments
This work was supported by the Polish National Science Centerof the Ministry of Science and Higher Education (Grant No. N N204370340 to J. Olszewska-Swietlik).
The authors kindly thank Adam Cupa M.Sc. (Phys.) (Departmentof Painting Technologies and Techniques, in the Institute for theStudy, Conservation and Restoration of Cultural Heritage at Nicol-aus Copernicus University in Torun, Poland) for performing the XRFmeasurements and Zuzanna Rozłucka Sc.D. (Chem.) (Departmentof Conservation of Painting and Polychromed Sculpture in theInstitute for the Study, Conservation and Restoration of CulturalHeritage at Nicolaus Copernicus University in Torun, Poland) forperforming the OM under UV measurements.
References
[1] T. Grzybkowska, The Golden Age of Gdansk’s Painting against the Backgroundof the Artistic Culture of the Town 1520–1620, Polish Scientific PublishersPWN, Warszawa, Poland, 1990. p. 67.
[2] J. Tylicki, Hermann Han, a Dutch from Gdansk, Biuletyn Historii Sztuki 71(2009) 201–204.
[3] T. Wa _zny, Dendrochronology 20 (2002) 313.[4] J.P Filedt Kok, W. Halsema-Kubes, W.Th. Kloek, Kunst voor de beeldenstorm:
Noordnederlandse kunst 1525–1580: Catalogus, Rijksmuseum, Amsterdam,1986.
[5] J. Olszewska-Swietlik, Painting technology and techniques of selected modernepitaphs from the St Mary’s Church in Gdansk, Nicolaus Copernicus University,Torun, 2009. p. 111.
[6] M. Doerner, The materials of the artist and their use in painting: with notes onthe techniques of the old masters, A Harvest/HBJ Book, 1984, p. 304.
[7] A. Vandivere, In search of van Mander’s Primuersel: intermediate layers inearly netherlandish paintings, ICOM-CC working group Art TechnologicalSource Research, Vienna, 23–24 September 2010.
[8] E. Hendriks, in: N. Kohler (Ed.), Painting in Haarlem 1500–1850: The Collectionof the Frans Hals Museum, Ludion, 2006, pp. 79–81.
[9] M. Faries, Ch. Steinbüchel, J.R.J. van Asperen de Boer, in: A. Wallert, E.Hermens, M. Peek (Eds.), Historical Painting Techniques, Materials, and StudioPractice, University of Leiden, The Netherlands, 1995 (preprints of asymposium).
[10] I.M. Bell, R.J.H. Clark, P.J. Gibbs, Spectrochim. Acta A 53 (1997) 2159.[11] L. Burgio, R.J.H. Clark, Spectrochim. Acta A 57 (2001) 1491.[12] K. Castro, M. Pérez-Alonso, M.D. Rodríguez-Laso, L.A. Fernández, J.M.
Madariaga, Anal. Bioanal. Chem. 382 (2005) 248.[13] T.D. Chaplin, R.J.H. Clark, D. Jacobs, K. Jensen, G.D. Smith, Anal. Chem. 77
(2005) 3611.[14] S. Daniilia, K.S. Andrikopoulos, S. Sotiropoulou, I. Karapanagiotis, Appl. Phys. A
90 (2008) 565.[15] C. Frausto-Reyes, M. Ortiz-Morales, J.M. Bujdud-Pérez, G.E. Magaña-Cota, R.
Mejía-Falcón, Spectrochim. Acta A 74 (2009) 1275.[16] M.C. Marco de Lucas, F. Moncada, J. Rosen, J. Raman Spectrosc. 37 (2006) 1154.[17] E.P. Tomasini, E.B. Halac, M. Reinoso, E.J. Di Liscia, M.S. Maier, J. Raman
Spectrosc. 43 (2012) 1671.[18] K. Ishimaru, T. Hata, P. Bronsveld, T. Nishizawa, Y. Imamura, J. Wood Sci. 53
(2007) 442.[19] M. Kawakami, T. Karato, T. Takenaka, S. Yokoyama, ISIJ Int. 1027 (2005) 45.[20] D. Alon, G. Mintz, I. Cohen, S. Weiner, F. Boaretto, Radiocarbon 44 (2002) 1.[21] A. Hernanz, J.M. Gavira-Vallejo, J.F. Ruiz-López, J. Raman Spectrosc. 1054
(2006) 37.[22] L. Lu, V. Sahajwalla, C. Kong, D. Harris, Carbon 2001 (1821) 39.[23] A. Deneckere, M. Leeflang, M. Bloem, C.A. Chavannes-Mazel, B. Vekemans, L.
Vincze, P. Vandenabeele, L. Moens, Spectrochim. Acta A 83 (2011) 194.[24] M.-J. Benquerença, N.F.C. Mendes, E. Castellucci, V.M.F. Gaspar, F.P.S.C. Gil, J.
Raman Spectrosc. 40 (2009) 2135.[25] L. Burgio, R.J.H. Clark, P.J. Gibbs, J. Raman Spectrosc. 30 (1999) 181.[26] V.S.F. Muralha, L. Burgio, R.J.H. Clark, Spectrochim. Acta A 92 (2012) 21.[27] P. Vandenabeele, F. Verpoort, L. Moens, J. Raman Spectrosc. 32 (2001) 263.[28] M. Abdel-Ghani, H.G.M. Edwards, B. Stern, R. Janaway, Spectrochim. Acta A 73
(2009) 566.[29] M. Bicchieri, M. Nardone, P.A. Russo, A. Sodo, M. Corsi, G. Cristoforetti, V.
Palleschi, A. Salvetti, E. Tognoni, Spectrochim. Acta B 56 (2001) 915.[30] E. Eastaugh, V. Walsh, T. Chaplin, R. Siddall, Pigment Compendium. A
Dictionary Optical Microscopy of Historical Pigments, Elsevier, Amsterdam,2008.
[31] M. Abdel-Ghani, H.G.M. Edwards, R. Janaway, B. Stern, Vib. Spectrosc. 48(2008) 69.
[32] H.G.M. Edwards, D.W. Farwell, E.M. Newton, F. Rull Perez, S. Jorge Villar, J.Raman Spectrosc. 31 (2000) 407.