picasso: drawing out the artistic talents of db query...
TRANSCRIPT
February 2012 Picasso (Information Summit) 1
Picasso: Drawing Out the Artistic
Talents of DB Query Optimizers
Jayant Haritsa Database Systems Lab
Indian Institute of Science
Prof Jayant Haritsa
Prof. Jayant R. Haritsa is on the distinguished faculty of the Supercomputer Education & Research Centre and the Department of Computer Science & Automation at the Indian Institute of Science, Bangalore, since 1992.
He received the BTech degree in Electronics and Communications Engineering from the Indian Institute of Technology (Madras), and the MS and PhD degrees in Computer Science from the University of Wisconsin (Madison).
He is on the editorial board of numerous International Publications. He is a Member of the Mathematical Sciences Research Committee, CSIR, Govt. of India. He is also a Distinguished Scientist of ACM, Senior Member of IEEE and Life Member of CSI.
His honours include: Distinguished Alumnus, Indian Institute of Technology (Madras), India, 2012 Fellow, Indian Academy of Sciences (IASc), India, 2010 Fellow, Indian National Academy of Engineering (INAE), India, 2009 Fellow, The National Academy of Sciences (NASI), India, 2006
Shanti Swarup Bhatnagar Prize, CSIR, 2009 Hari Om Ashram Prerit Dr. Vikram Sarabhai Research Award, PRL, 2007 Swarnajayanti Fellowship, Dept. of Science & Technology, Govt. of India, 2002 Sir C V Raman Young Scientist Award in Computer Science, Govt. of Karnataka, 2001 Research Awards from IBM, Google and Microsoft
His research interests are in database systems.
His Research focus and publications can be found here:http://dsl.serc.iisc.ernet.in/~haritsa/
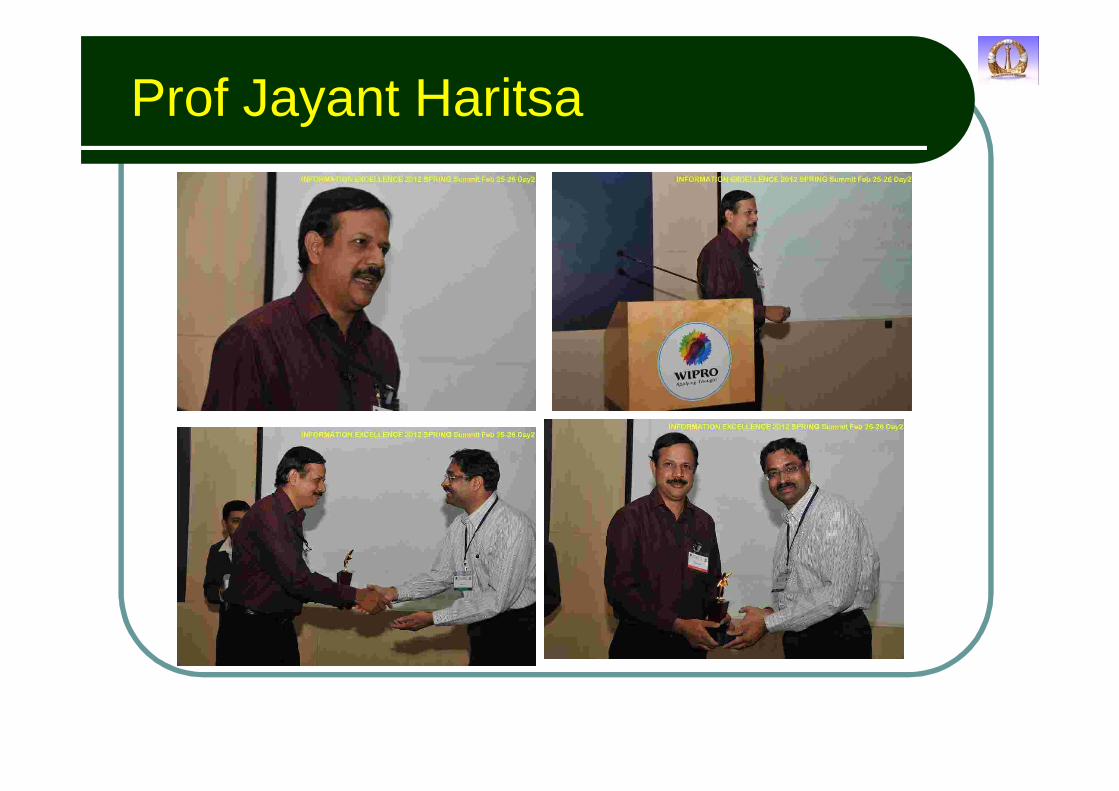
Prof Jayant Haritsa
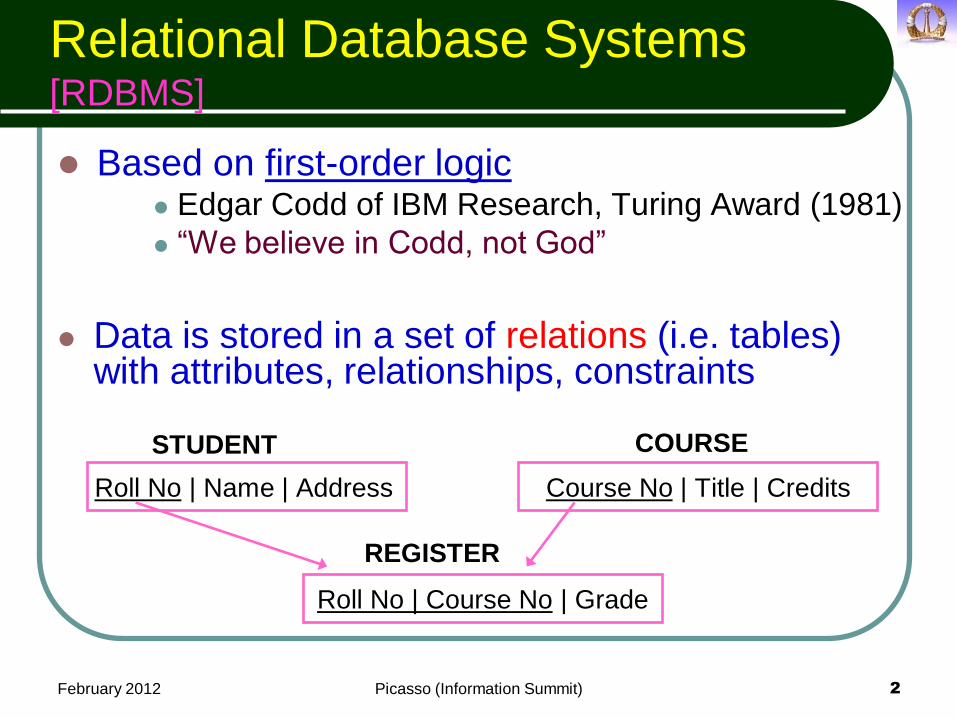
Relational Database Systems [RDBMS]
Based on first-order logic Edgar Codd of IBM Research, Turing Award (1981)
“We believe in Codd, not God”
Data is stored in a set of relations (i.e. tables)
with attributes, relationships, constraints
Roll No | Name | Address Course No | Title | Credits
Roll No | Course No | Grade
STUDENT COURSE
REGISTER
February 2012 2 Picasso (Information Summit)
QUERY INTERFACE
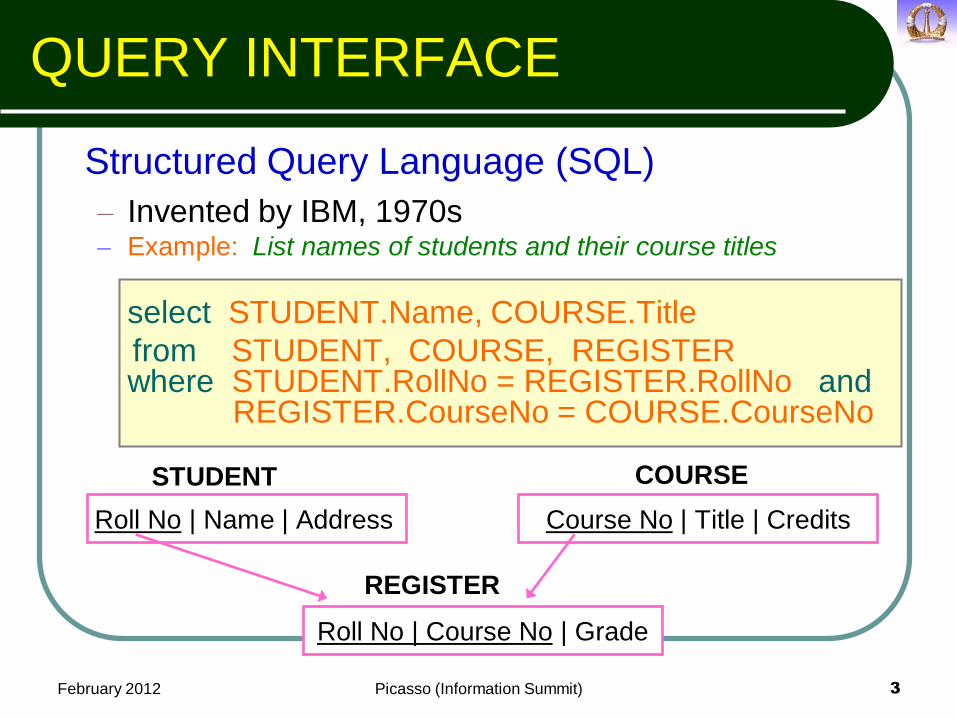
Structured Query Language (SQL)
– Invented by IBM, 1970s – Example: List names of students and their course titles
select STUDENT.Name, COURSE.Title
from STUDENT, COURSE, REGISTER where STUDENT.RollNo = REGISTER.RollNo and REGISTER.CourseNo = COURSE.CourseNo
Roll No | Name | Address Course No | Title | Credits
Roll No | Course No | Grade
STUDENT COURSE
REGISTER
February 2012 3 Picasso (Information Summit)
February 2012 Picasso (Information Summit) 4
Query Execution Plans
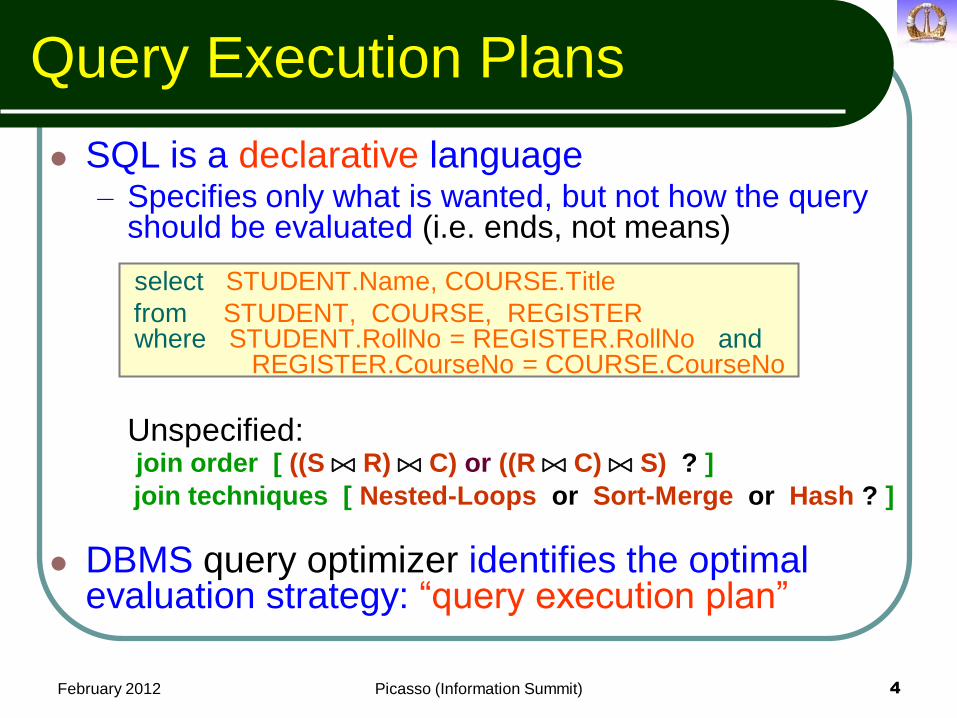
SQL is a declarative language – Specifies only what is wanted, but not how the query
should be evaluated (i.e. ends, not means) select STUDENT.Name, COURSE.Title
from STUDENT, COURSE, REGISTER where STUDENT.RollNo = REGISTER.RollNo and REGISTER.CourseNo = COURSE.CourseNo
Unspecified: join order [ ((S ! R) ! C) or ((R ! C) ! S) ? ]
join techniques [ Nested-Loops or Sort-Merge or Hash ? ]
DBMS query optimizer identifies the optimal evaluation strategy: “query execution plan”
February 2012 Picasso (Information Summit) 5
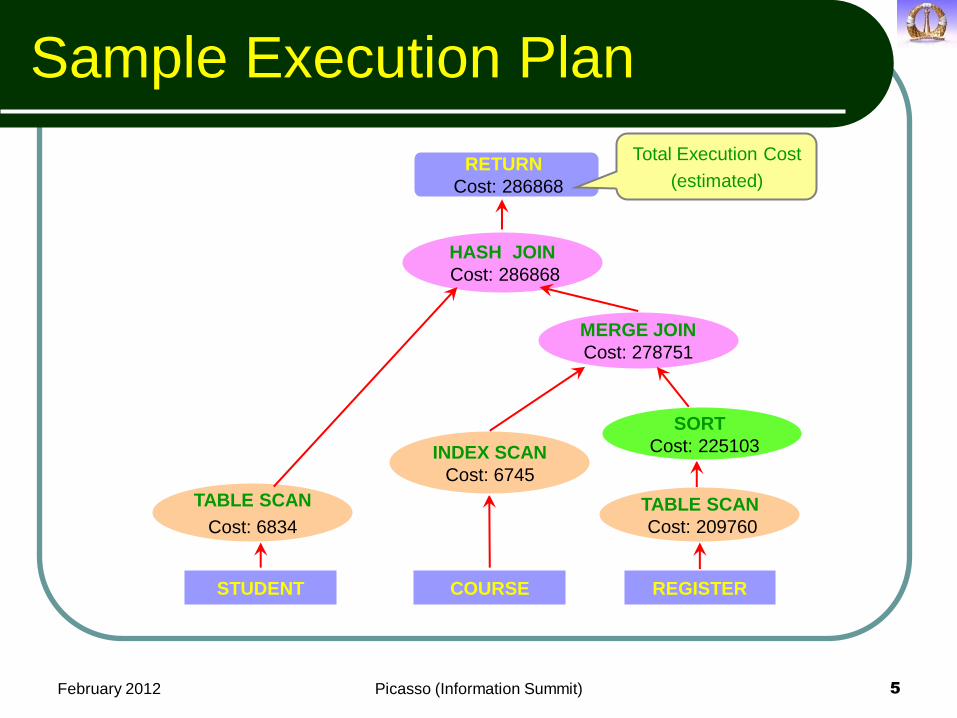
Sample Execution Plan
RETURN
Cost: 286868
HASH JOIN
Cost: 286868
TABLE SCAN
Cost: 6834
STUDENT
MERGE JOIN
Cost: 278751
TABLE SCAN
Cost: 209760
COURSE REGISTER
INDEX SCAN
Cost: 6745
SORT
Cost: 225103
Total Execution Cost
(estimated)
Query Plan Selection
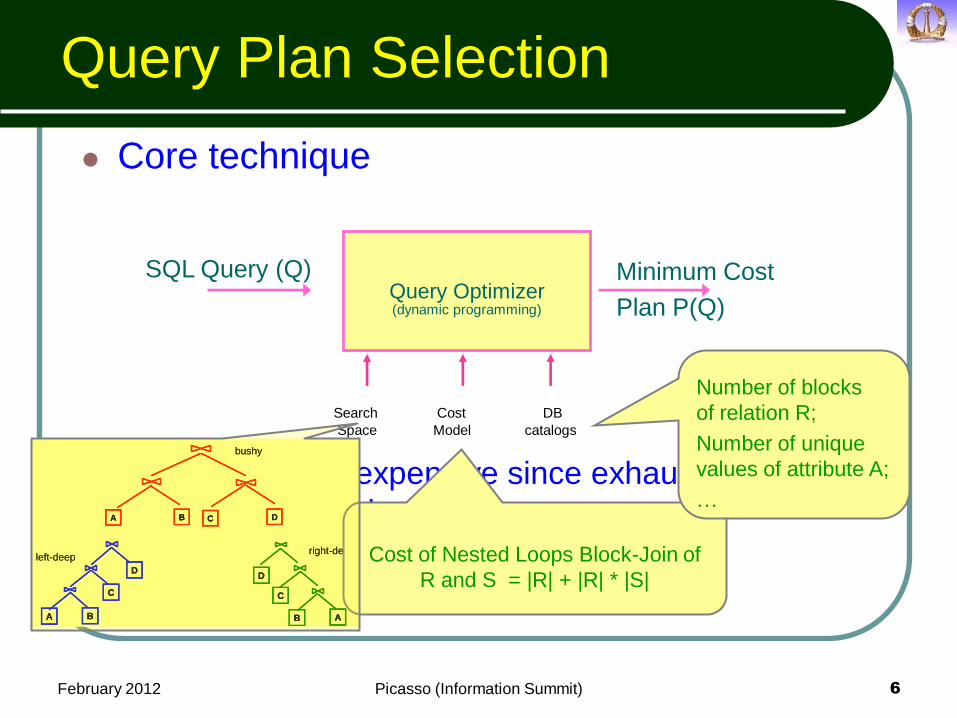
Core technique
Computationally expensive since exhaustive search of
exponential search space
(e.g. n-way table join n! permutations)
BA
C
D
AB
C
D
C DBA
bushy
left-deepright-deep
BA
C
D
BA
C
D
AB
C
D
AB
C
D
C DBA C DBA
bushy
left-deepright-deep
February 2012 Picasso (Information Summit) 6
SQL Query (Q) Query Optimizer (dynamic programming)
Minimum Cost
Plan P(Q)
DB
catalogs
Cost
Model
Search
Space
Cost of Nested Loops Block-Join of
R and S = |R| + |R| * |S|
Number of blocks
of relation R;
Number of unique
values of attribute A;
…
February 2012 Picasso (Information Summit) 7
Need for careful plan selection
Cost difference between best plan choice
and a random choice can be enormous
(orders of magnitude!)
Only a small percentage of really good
plans over the (exponential) search space
Relational Selectivities
Cost-based Query Optimizer’s choice of execution plan = f (query, database, system, …)
For a given database and system setup, execution plan = f (selectivities of query’s base relations) – selectivity is the estimated percentage of rows of a
relation used in producing the query result
February 2012 Picasso (Information Summit) 8
February 2012 Picasso (Information Summit) 9
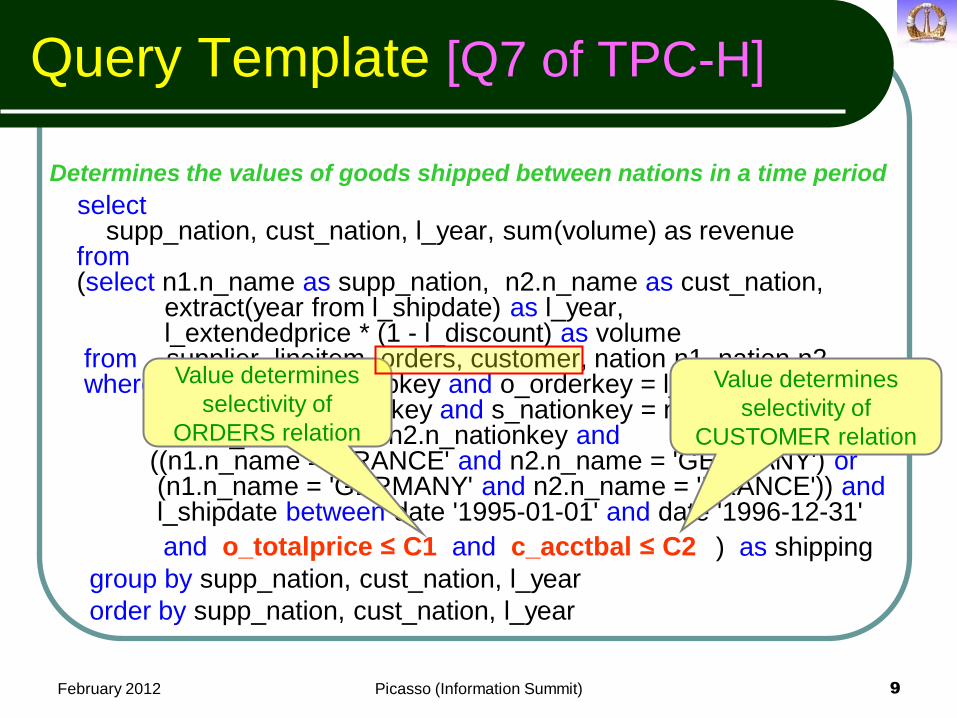
Query Template [Q7 of TPC-H]
select supp_nation, cust_nation, l_year, sum(volume) as revenue from (select n1.n_name as supp_nation, n2.n_name as cust_nation, extract(year from l_shipdate) as l_year, l_extendedprice * (1 - l_discount) as volume from supplier, lineitem, orders, customer, nation n1, nation n2 where s_suppkey = l_suppkey and o_orderkey = l_orderkey and c_custkey = o_custkey and s_nationkey = n1.n_nationkey and c_nationkey = n2.n_nationkey and ((n1.n_name = 'FRANCE' and n2.n_name = 'GERMANY') or (n1.n_name = 'GERMANY' and n2.n_name = 'FRANCE')) and l_shipdate between date '1995-01-01' and date '1996-12-31'
group by supp_nation, cust_nation, l_year
order by supp_nation, cust_nation, l_year
and o_totalprice ≤ C1 and c_acctbal ≤ C2 ) as shipping
Determines the values of goods shipped between nations in a time period
Value determines
selectivity of
ORDERS relation
Value determines
selectivity of
CUSTOMER relation
February 2012 Picasso (Information Summit) 10
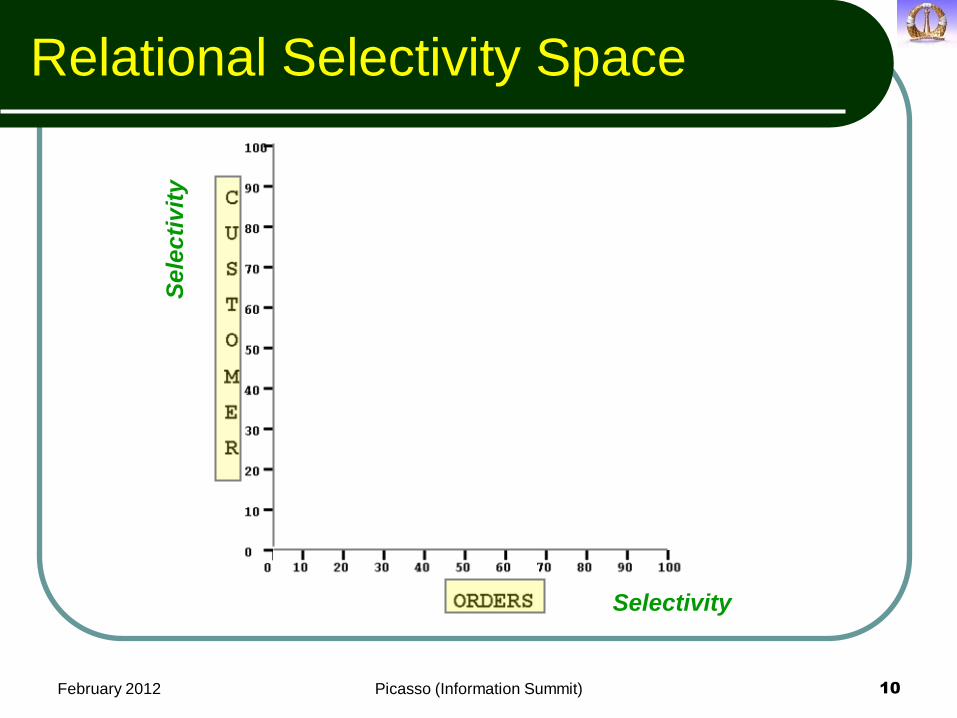
Relational Selectivity Space
Selectivity
Se
lec
tiv
ity
February 2012 Picasso (Information Summit) 11
Plan and Cost Diagrams
A plan diagram is a pictorial enumeration of the plan choices of the query optimizer over the relational selectivity space
A cost diagram is a visualization of the (estimated) plan execution costs over the same relational selectivity space
February 2012 Picasso (Information Summit) 12
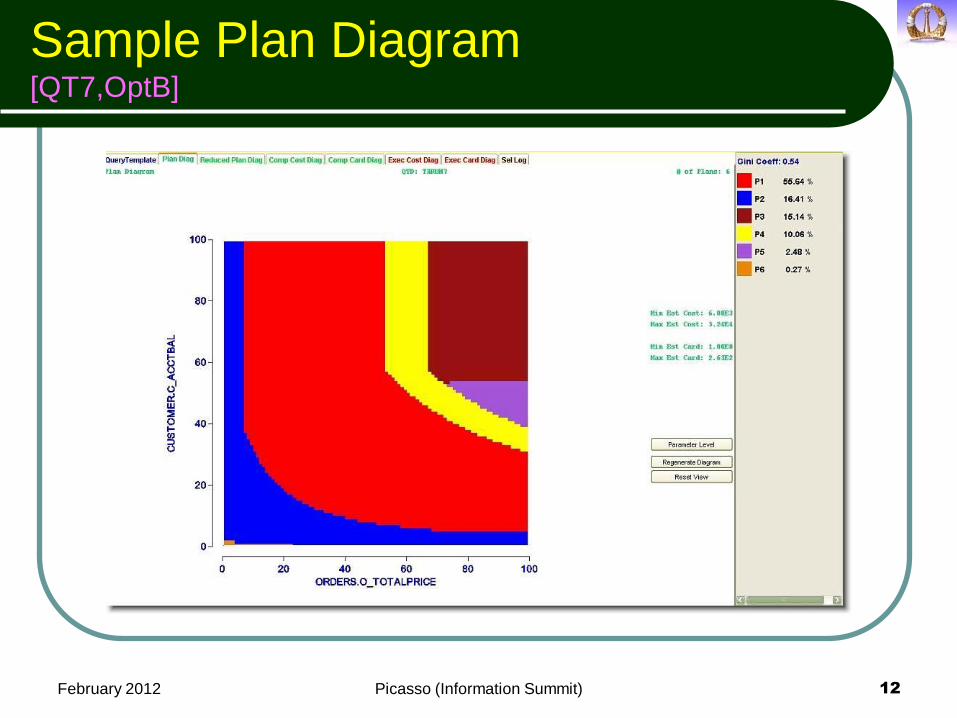
Sample Plan Diagram [QT7,OptB]
February 2012 Picasso (Information Summit) 13
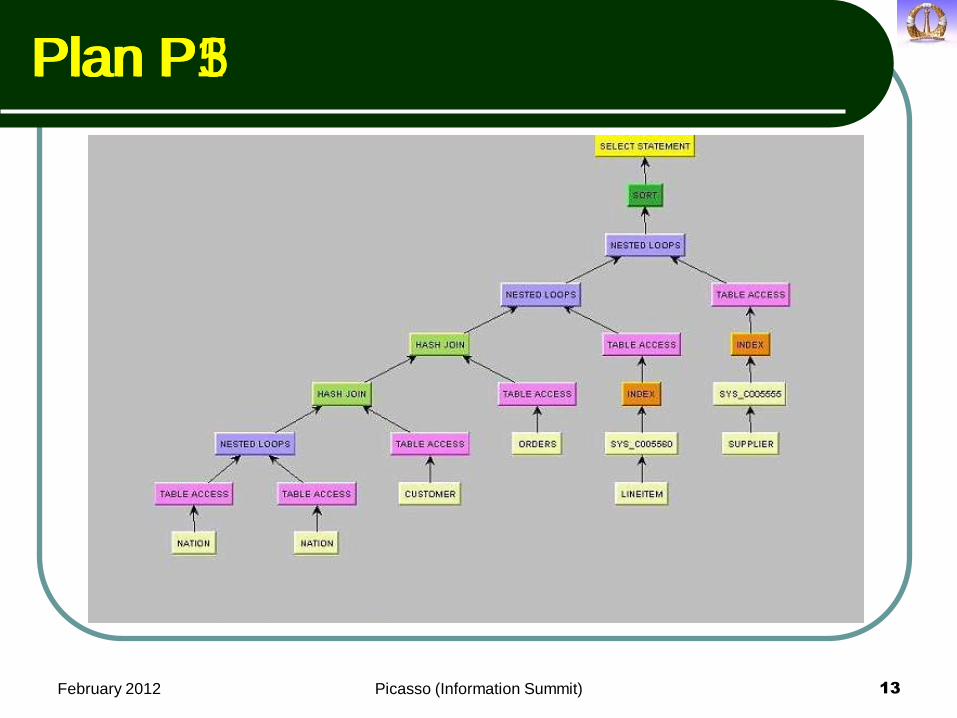
Plan P1 Plan P3 Plan P5
February 2012 Picasso (Information Summit) 14
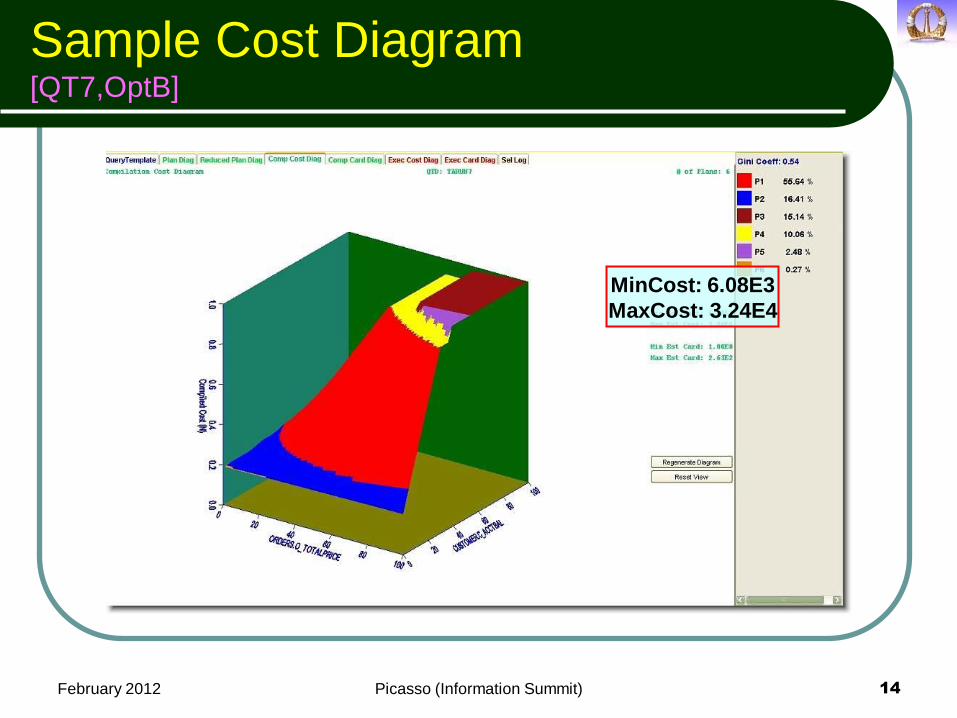
Sample Cost Diagram [QT7,OptB]
MinCost: 6.08E3
MaxCost: 3.24E4
February 2012 Picasso (Information Summit) 16
Part I: PICASSO
February 2012 Picasso (Information Summit) 17
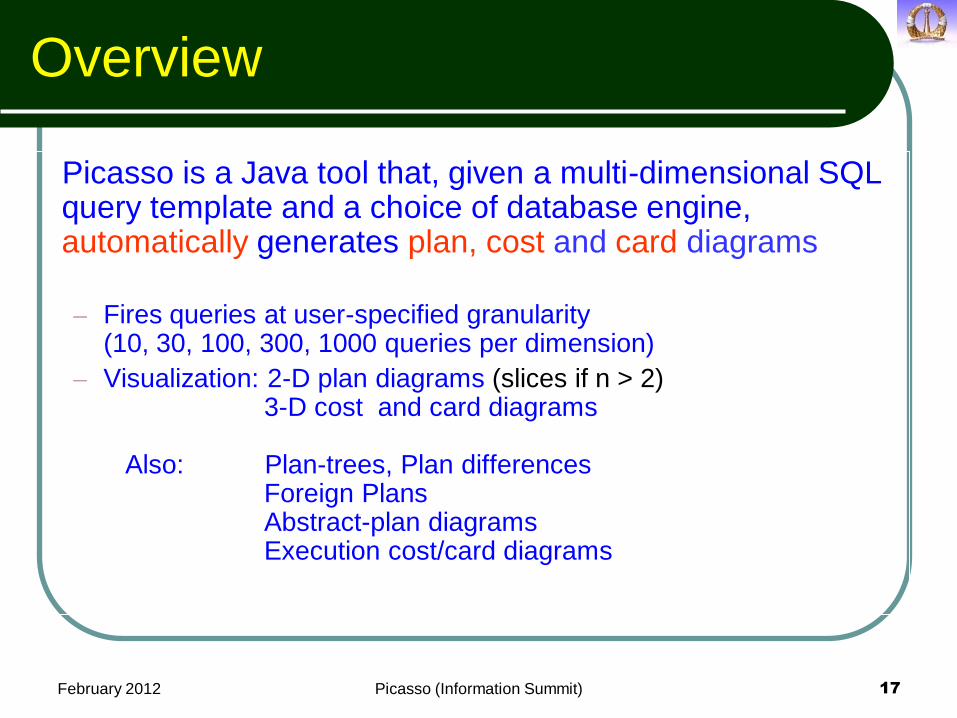
Overview
Picasso is a Java tool that, given a multi-dimensional SQL query template and a choice of database engine, automatically generates plan, cost and card diagrams – Fires queries at user-specified granularity
(10, 30, 100, 300, 1000 queries per dimension)
– Visualization: 2-D plan diagrams (slices if n > 2) 3-D cost and card diagrams Also: Plan-trees, Plan differences Foreign Plans Abstract-plan diagrams Execution cost/card diagrams
February 2012 Picasso (Information Summit) 18
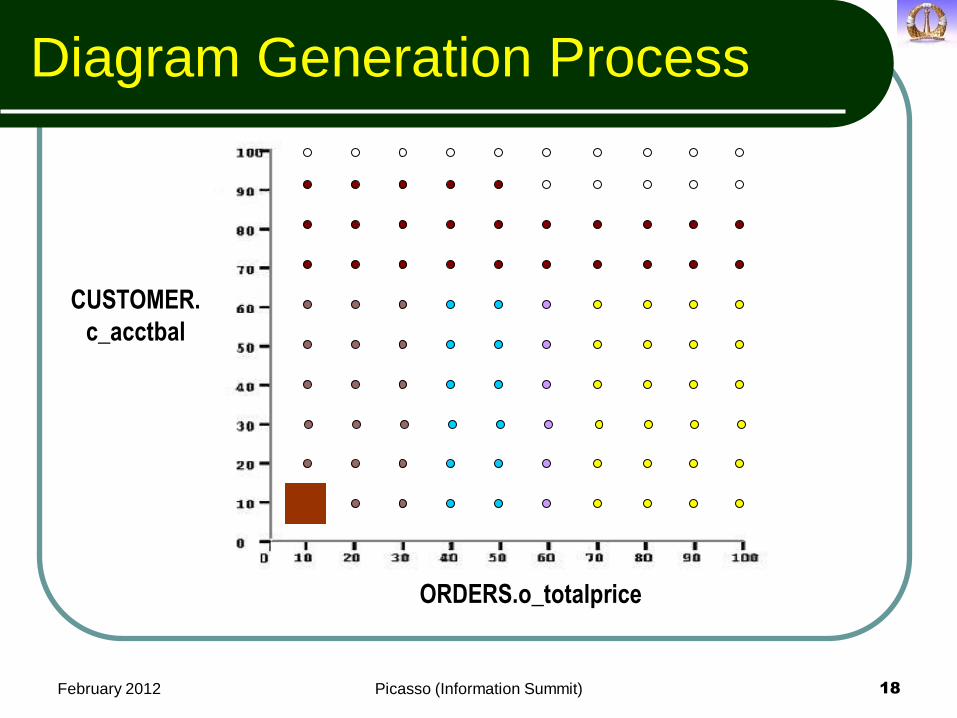
ORDERS.o_totalprice
CUSTOMER.
c_acctbal
Diagram Generation Process

Tool Status
~50000 lines of code (2004-09) with ~100 classes
Uses Java3D, VisAd, JGraph, Swing
Operational on DB2/Oracle/SQLServer/Sybase/PostgreSQL
Copyrighted by IISc in May 2006
Released as free software in Nov 2006 by Associate
Director of IISc
Release of version 1.0 in May 2007,
version 2.0 in Feb 2009, version 3.0 in April 2012
In use at academic and industrial labs worldwide
– CMU, Purdue, Duke, TU Munich, NU Singapore, IIT-B, …
– IBM, Microsoft, Oracle, Sybase, HP, …
Received Best Software award in
Very Large Data Base (VLDB) conference, 2010
February 2012 Picasso (Information Summit) 21
February 2012 Picasso (Information Summit) 22
Why do they care?
Excited the interest of industrial and
academic communities
– serious problems and anomalies in current
optimizer design optimizer evaluator / debugger / designer
database administrators – response time fault profiler
– testbed for database researchers
– educational aid for students
Why do we care?
NOT s/w development for its own sake !
Development of the tool has thrown up many interesting core CS research problems involving theory, algorithms, statistics, tree matching, …
February 2012 Picasso (Information Summit) 23

February 2012 Picasso (Information Summit) 24
PICASSO OUTPUT
Full result listing at http://dsl.serc.iisc.ernet.in/projects/PICASSO
February 2012 Picasso (Information Summit) 25
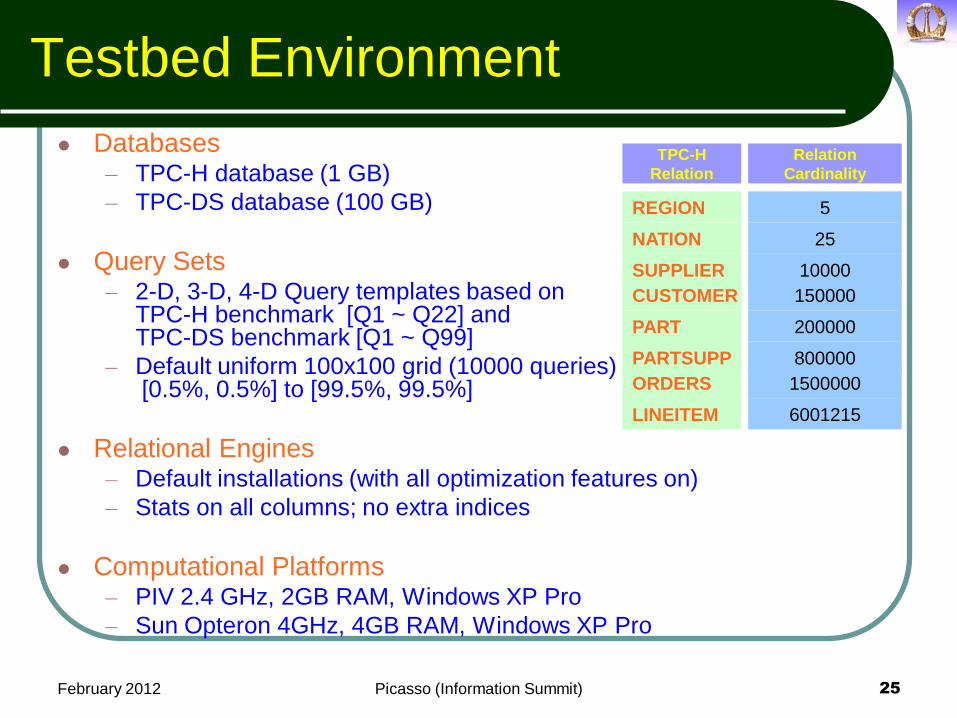
Testbed Environment
Databases – TPC-H database (1 GB)
– TPC-DS database (100 GB)
Query Sets – 2-D, 3-D, 4-D Query templates based on
TPC-H benchmark [Q1 ~ Q22] and TPC-DS benchmark [Q1 ~ Q99]
– Default uniform 100x100 grid (10000 queries) [0.5%, 0.5%] to [99.5%, 99.5%]
Relational Engines – Default installations (with all optimization features on)
– Stats on all columns; no extra indices
Computational Platforms – PIV 2.4 GHz, 2GB RAM, Windows XP Pro
– Sun Opteron 4GHz, 4GB RAM, Windows XP Pro
TPC-H
Relation
Relation
Cardinality
5
25
10000
150000
200000
800000
1500000
6001215
REGION
NATION
SUPPLIER
CUSTOMER
PART
PARTSUPP
ORDERS
LINEITEM

February 2012 Picasso (Information Summit) 26
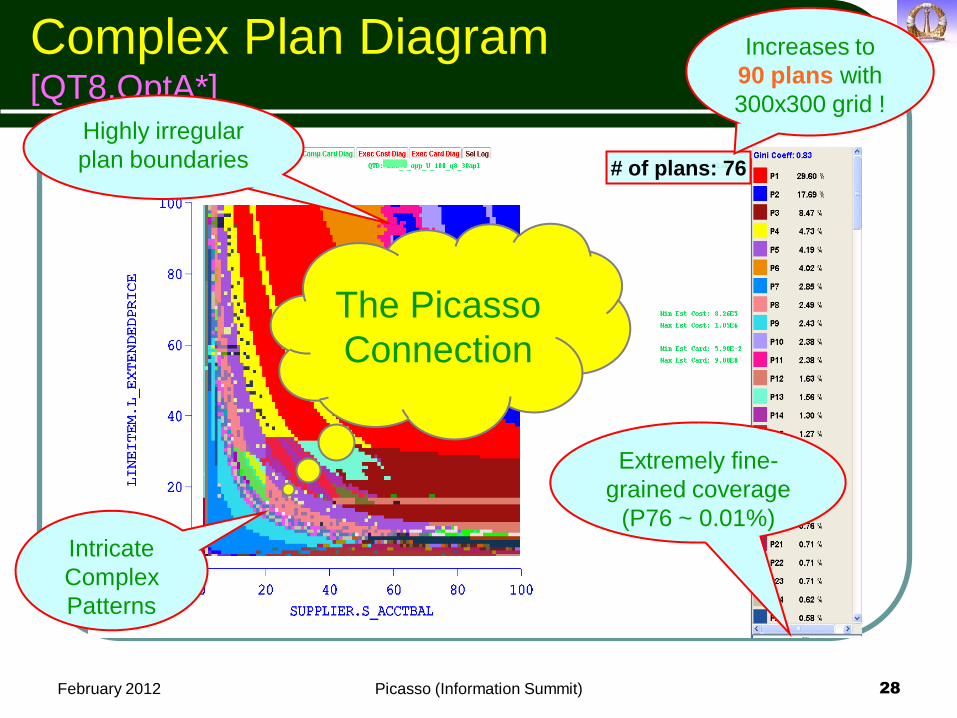
The Picasso Connection
Plan diagrams are often similar to cubist paintings ! [ Pablo Picasso founder of cubist genre ]
Woman with a guitar
Georges Braque, 1913
February 2012 Picasso (Information Summit) 27
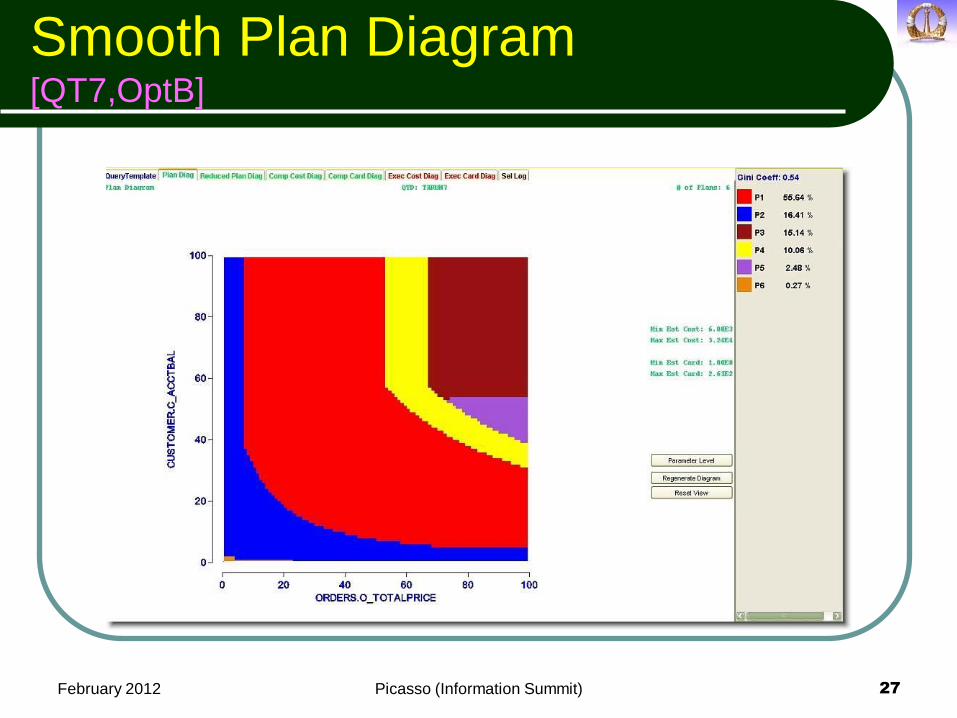
Smooth Plan Diagram [QT7,OptB]
February 2012 Picasso (Information Summit) 28
Complex Plan Diagram [QT8,OptA*]
Extremely fine-
grained coverage
(P76 ~ 0.01%)
Highly irregular
plan boundaries
Intricate
Complex
Patterns
# of plans: 76
Increases to
90 plans with
300x300 grid !
The Picasso
Connection
February 2012 Picasso (Information Summit) 29
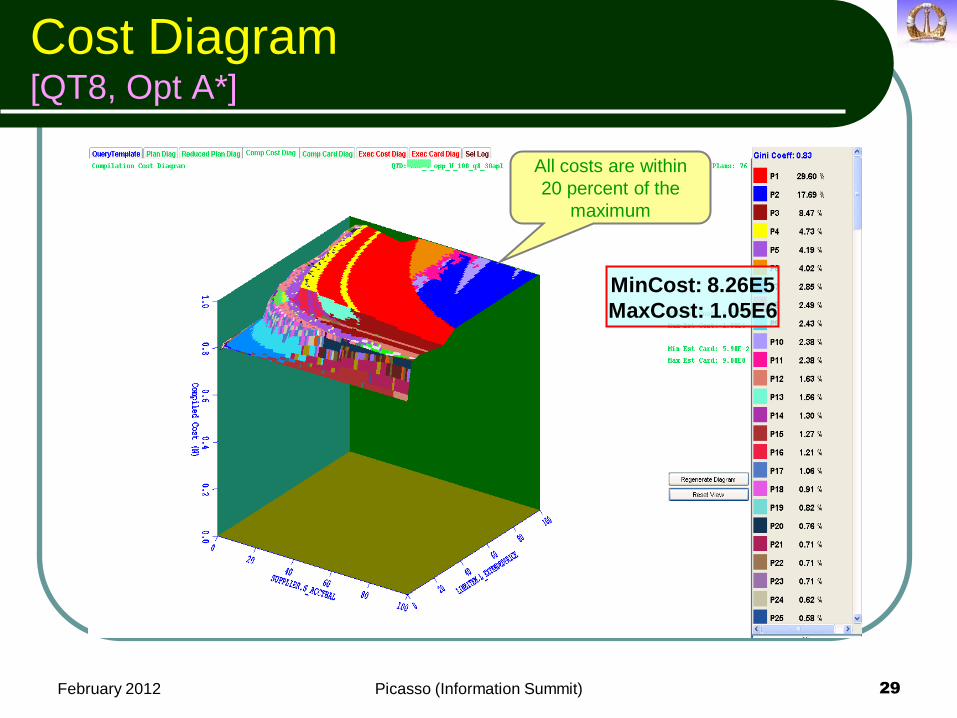
Cost Diagram [QT8, Opt A*]
All costs are within
20 percent of the
maximum
MinCost: 8.26E5
MaxCost: 1.05E6
February 2012 Picasso (Information Summit) 30
Remarks
Modern optimizers tend to make extremely fine-grained and skewed choices
Is this an over-kill, perhaps not merited by the coarseness of the underlying cost space i.e. are optimizers “doing too good a job” ?
Is it feasible to reduce the plan diagram complexity without materially affecting the plan quality? (Part II)
February 2012 Picasso (Information Summit) 31
Picasso Art Gallery
Duplicates and Islands
Plan Switch Points
Footprint Pattern
Speckle Pattern
February 2012 Picasso (Information Summit) 32
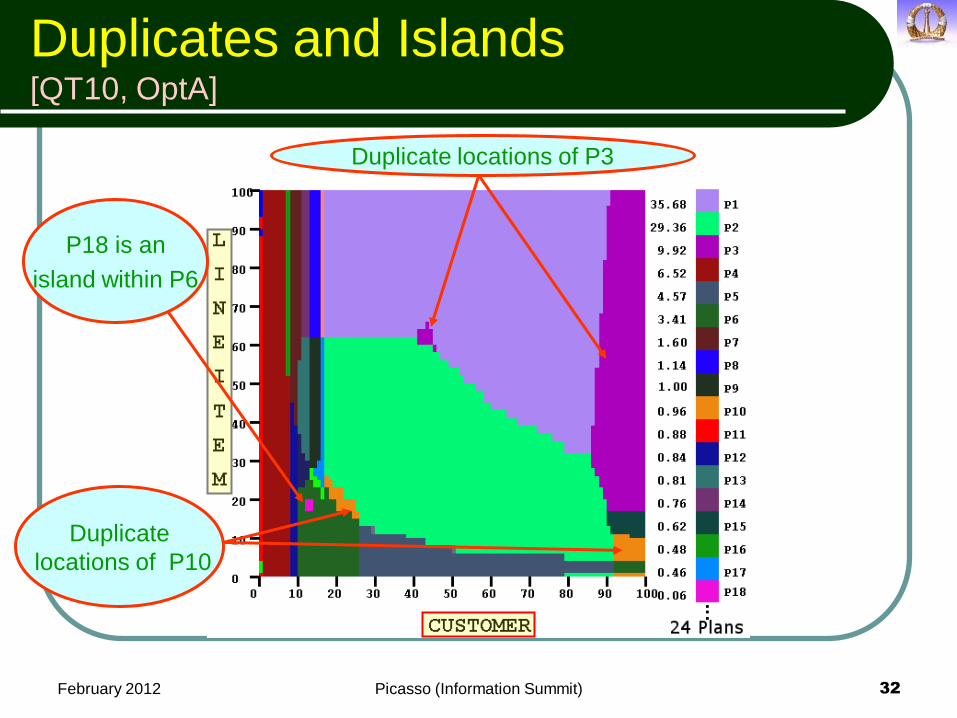
Duplicates and Islands [QT10, OptA]
Duplicate locations of P3
Duplicate
locations of P10
P18 is an
island within P6
February 2012 Picasso (Information Summit) 33
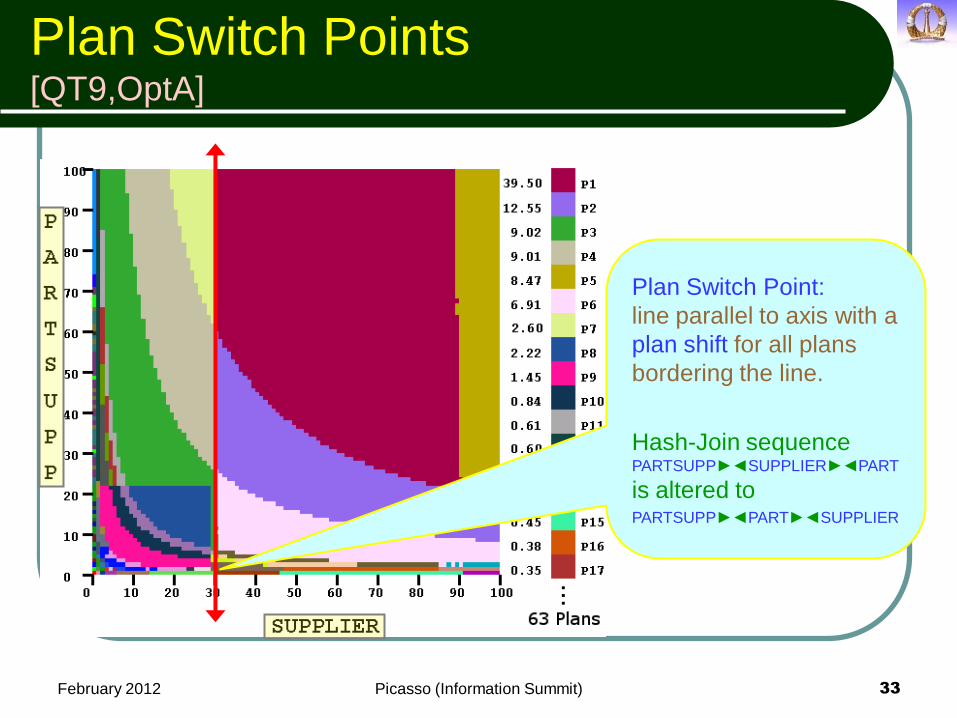
Plan Switch Points [QT9,OptA]
Plan Switch Point:
line parallel to axis with a
plan shift for all plans
bordering the line.
Hash-Join sequence PARTSUPP►◄SUPPLIER►◄PART
is altered to
PARTSUPP►◄PART►◄SUPPLIER
February 2012 Picasso (Information Summit) 34
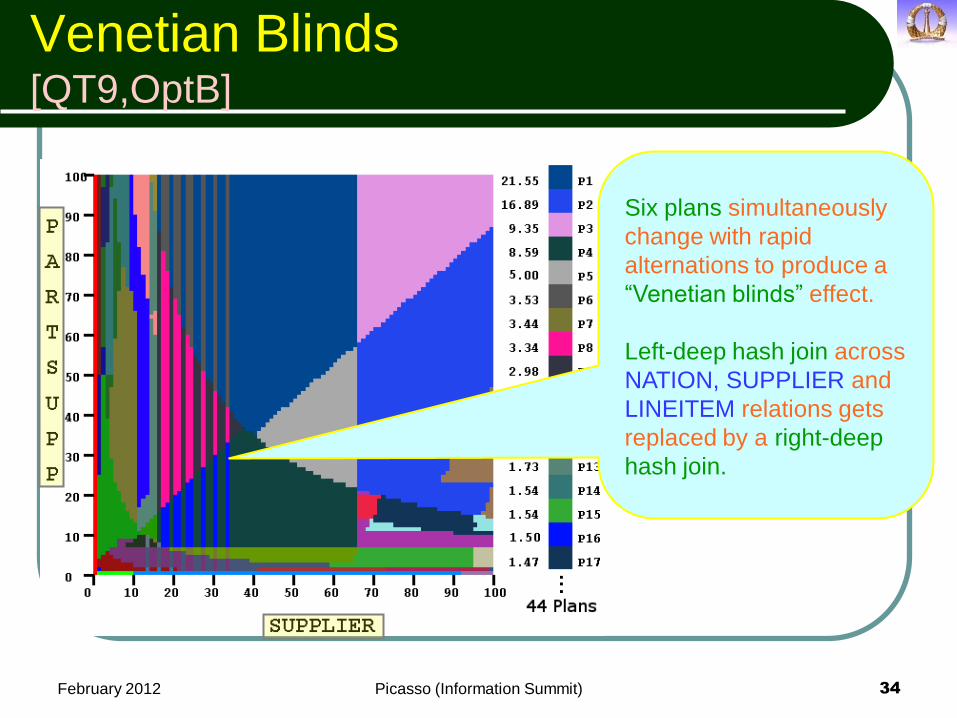
Venetian Blinds [QT9,OptB]
Six plans simultaneously
change with rapid
alternations to produce a
“Venetian blinds” effect.
Left-deep hash join across
NATION, SUPPLIER and
LINEITEM relations gets
replaced by a right-deep
hash join.

February 2012 Picasso (Information Summit) 35
Footprint Pattern [QT7,OptA]
P7 is a thin and broken
curved pattern in the
middle of P2’s region.
P2 has sort-merge-join
at the top of the plan
tree, while P7 uses
hash-join
February 2012 Picasso (Information Summit) 36
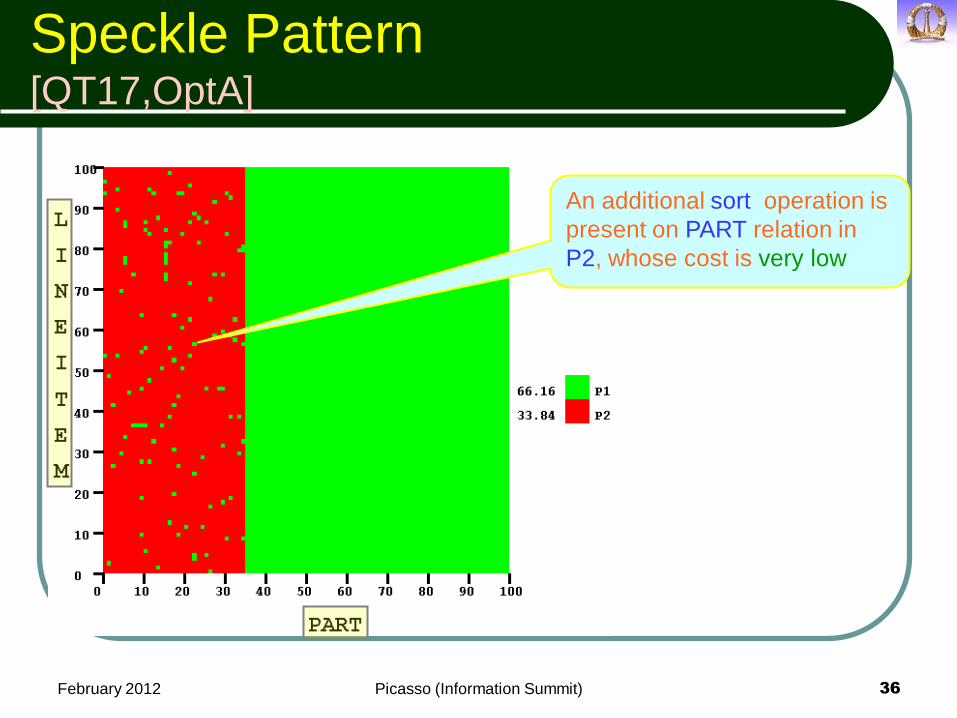
Speckle Pattern [QT17,OptA]
An additional sort operation is
present on PART relation in
P2, whose cost is very low
February 2012 Picasso (Information Summit) 37
Non-Monotonic Cost Behavior
Plan-Switch Non-Monotonic Costs
Intra-Plan Non-Monotonic Costs
February 2012 Picasso (Information Summit) 38
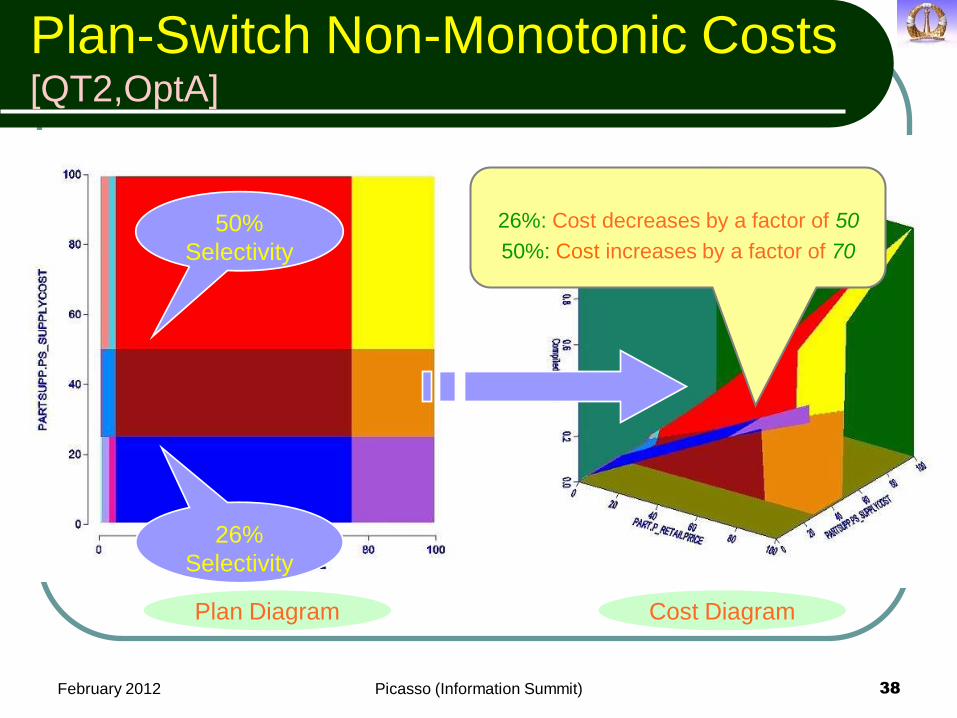
Plan-Switch Non-Monotonic Costs [QT2,OptA]
Plan Diagram Cost Diagram
26%
Selectivity
50%
Selectivity
26%: Cost decreases by a factor of 50
50%: Cost increases by a factor of 70

February 2012 Picasso (Information Summit) 39
Intra-Plan Non-Monotonic Costs [QT21,OptA]
Plan Diagram Cost Diagram
Nested loops join whose cost decreases
with increasing input cardinalities
February 2012 Picasso (Information Summit) 40
Remarks
Optimizers may have become too complex over time, making it difficult to anticipate the interactions and side-effects of their modules
Well-kept secret by optimizer developers? Perhaps worth having a re-look at optimizer design …

February 2012 Picasso (Information Summit) 41
Part II: PLAN DIAGRAM
REDUCTION
February 2012 Picasso (Information Summit) 42
Problem Statement
Can the plan diagram be recolored with a smaller set of colors (i.e. some plans are “swallowed” by others), such that Guarantee:
No query point in the original diagram has its estimated cost increased, post-swallowing, by more than λ percent (user-defined)
Analogy: (with due apologies to Sri Lankans in the audience) Sri Lanka agrees to be annexed by India if it is assured that the cost of living of each Lankan citizen is not increased by more than λ percent
February 2012 Picasso (Information Summit) 43
Our Results
Optimal plan diagram reduction (w.r.t. minimizing the number of plans/colors) is NP-hard – through problem-reduction from classical Set Cover
Designed CostGreedy, a greedy heuristic-based algorithm with following properties: [m is number of query points, n is number of plans in diagram] – Time complexity is O(mn)
linear in number of plans for a given diagram resolution
– Approximation Factor is O(ln m) bound is both tight and optimal
in practice, closely approximates optimal
February 2012 Picasso (Information Summit) 44
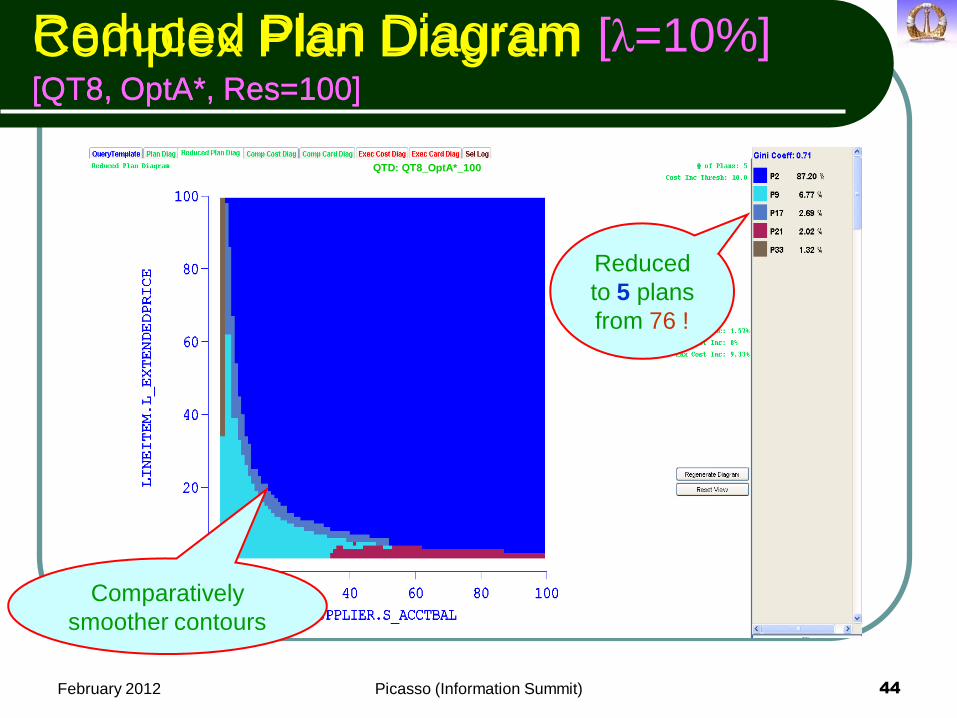
Reduced Plan Diagram [λ=10%] [QT8, OptA*, Res=100] Complex Plan Diagram [QT8, OptA*, Res=100]
Reduced
to 5 plans
from 76 !
Comparatively
smoother contours
QTD: QT8_OptA*_100
February 2012 Picasso (Information Summit) 45
Anorexic Reduction
Extensive empirical evaluation with a spectrum of multi-dimensional TPCH-based query templates indicates that
“With a cost-increase-threshold of just 20%, virtually all complex plan diagrams [irrespective of query templates, data distribution, query distribution, system configurations, etc.] reduce to “anorexic levels” (~10 or less plans)!
February 2012 Picasso (Information Summit) 46
Applications of
Plan Diagram Reduction
Quantifies redundancy in plan search space
Provides better candidates for plan-cacheing
Enhances viability of Parametric Query Optimization (PQO) techniques
Improves efficiency/quality of Least-Expected-Cost (LEC) plans
Minimizes overheads of multi-plan (e.g. Adaptive Query Processing) approaches
Identifies selectivity-error resistant plan choices – retained plans are robust choices over larger
selectivity parameter space
Part III: Identifying Robust Plans
with Plan Diagram Reduction
February 2012 Picasso (Information Summit) 47
February 2012 Picasso (Information Summit) 48
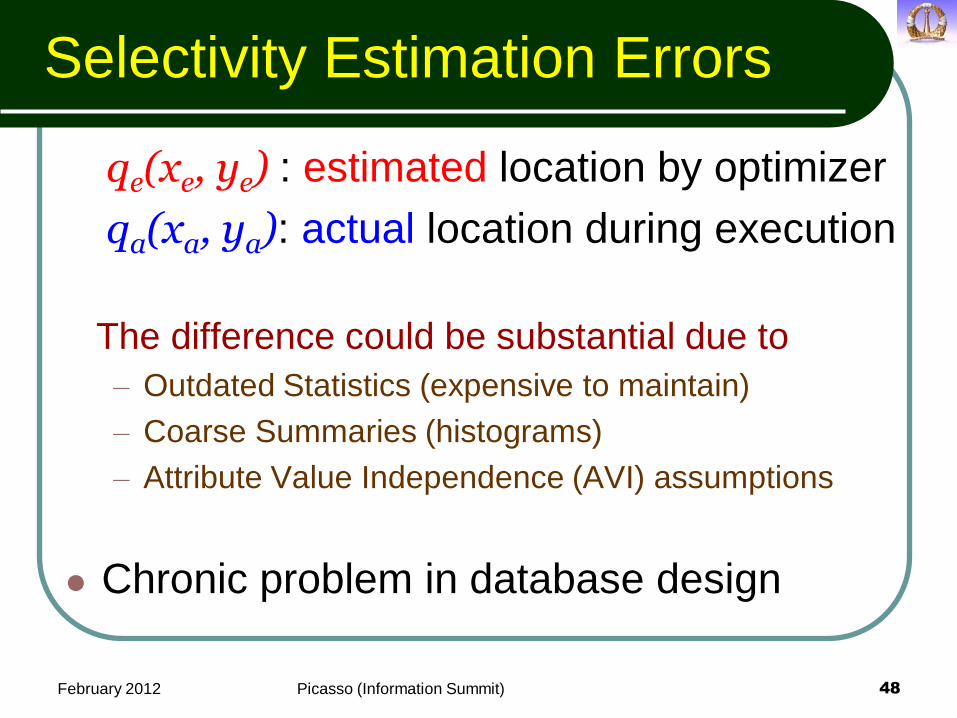
Selectivity Estimation Errors
qe(xe, ye) : estimated location by optimizer
qa(xa, ya): actual location during execution
The difference could be substantial due to
– Outdated Statistics (expensive to maintain)
– Coarse Summaries (histograms)
– Attribute Value Independence (AVI) assumptions
Chronic problem in database design
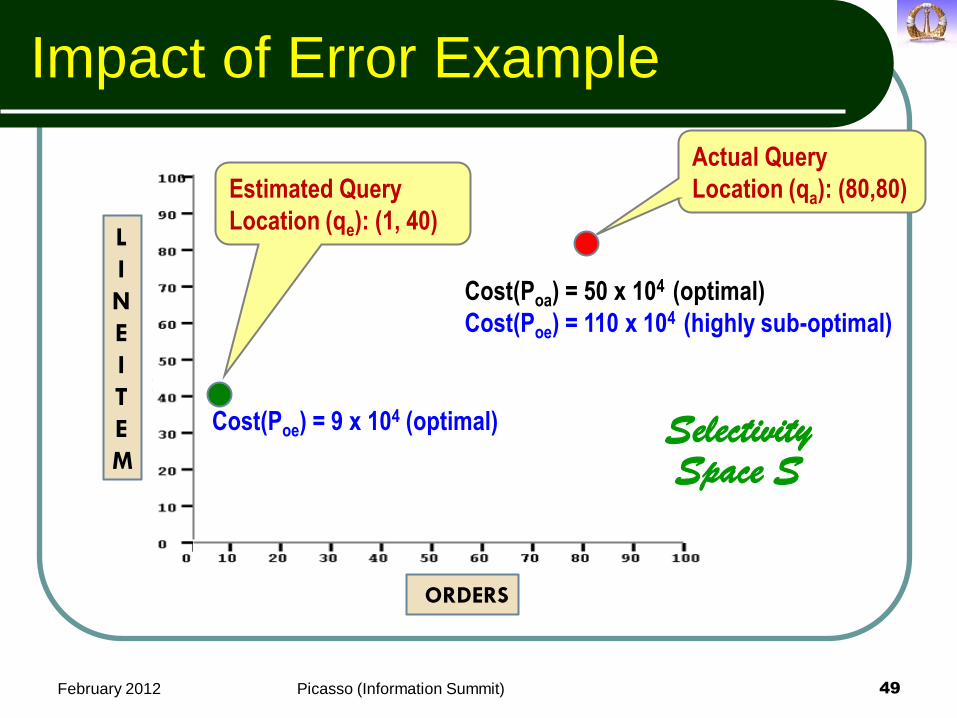
Impact of Error Example
February 2012 Picasso (Information Summit) 49
Cost(Poe) = 9 x 10⁴ (optimal)
Cost(Poa) = 50 x 104 (optimal)
Cost(Poe) = 110 x 104 (highly sub-optimal)
L
I
N
E
I
T
E
M
ORDERS
Estimated Query
Location (qe): (1, 40)
Actual Query
Location (qa): (80,80)
Selectivity Space S

Error Locations wrt
Plan Replacement Regions
February 2012 Picasso (Information Summit)
``
Endo-optimalre
Swallowre
Exo-optimalre
S
Selectivity X
Sele
cti
vit
y Y
0
100
qe
qa
qa
qa
50
0 100
Inherently robust Inherently robust ???
February 2012 Picasso (Information Summit) 51
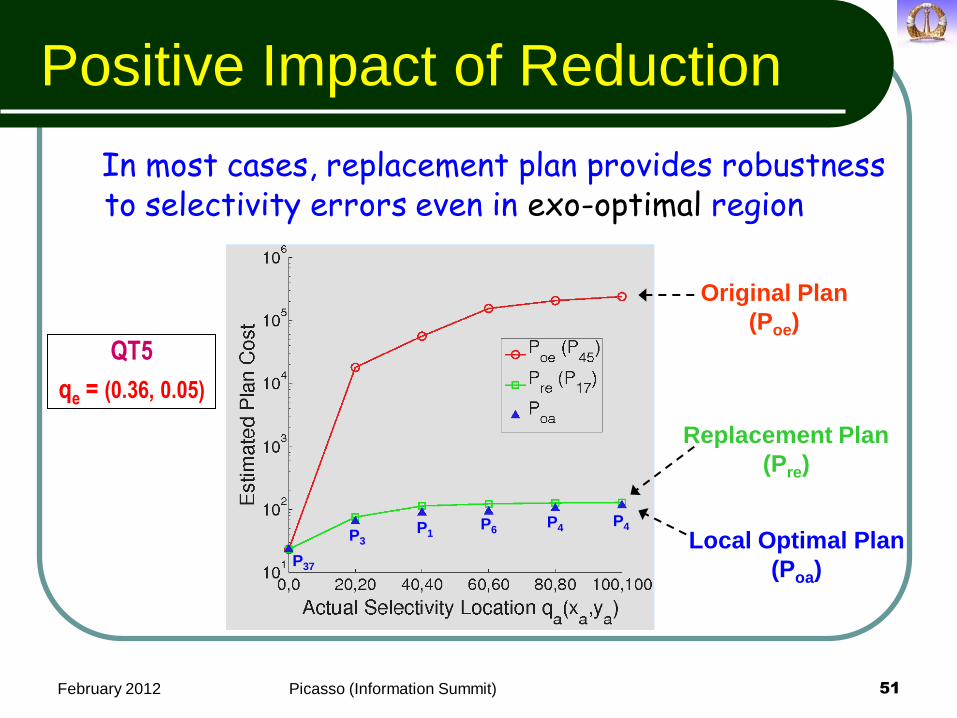
Positive Impact of Reduction
In most cases, replacement plan provides robustness to selectivity errors even in exo-optimal region
Original Plan
(Poe)
Replacement Plan
(Pre)
Local Optimal Plan
(Poa)
QT5
qe = (0.36, 0.05)
P1 P3
P6 P4
P4
P37

February 2012 Picasso (Information Summit) 52
Negative Impact of Reduction
But, occasionally, the replacement is much worse than the original plan !
Replacement Plan
(Pre)
Original Plan
(Poe)
Local Optimal Plan
(Poa)
QT5
qe = (0.03, 0.14)
P1 P3
P6 P4
P4
P37

Research Challenge
How do we ensure that plan replacements can only help, but never materially hurt the expected performance?
February 2012 Picasso (Information Summit) 53

Analogy Update
India can swallow Sri Lanka only if Indian passport can guarantee cost of living of Lankan citizen is within λ of that obtained with the Lankan passport, no matter where the Lankan citizen emigrates.
February 2012 Picasso (Information Summit) 54

February 2012 Picasso (Information Summit) 55
Our Contribution
Mathematical analysis to show that only the perimeter of the selectivity space suffices to determine global safety
Border Safety ⇒ Interior Safety !

February 2012 Picasso (Information Summit) 56
CONCLUSIONS
February 2012 Picasso (Information Summit) 57
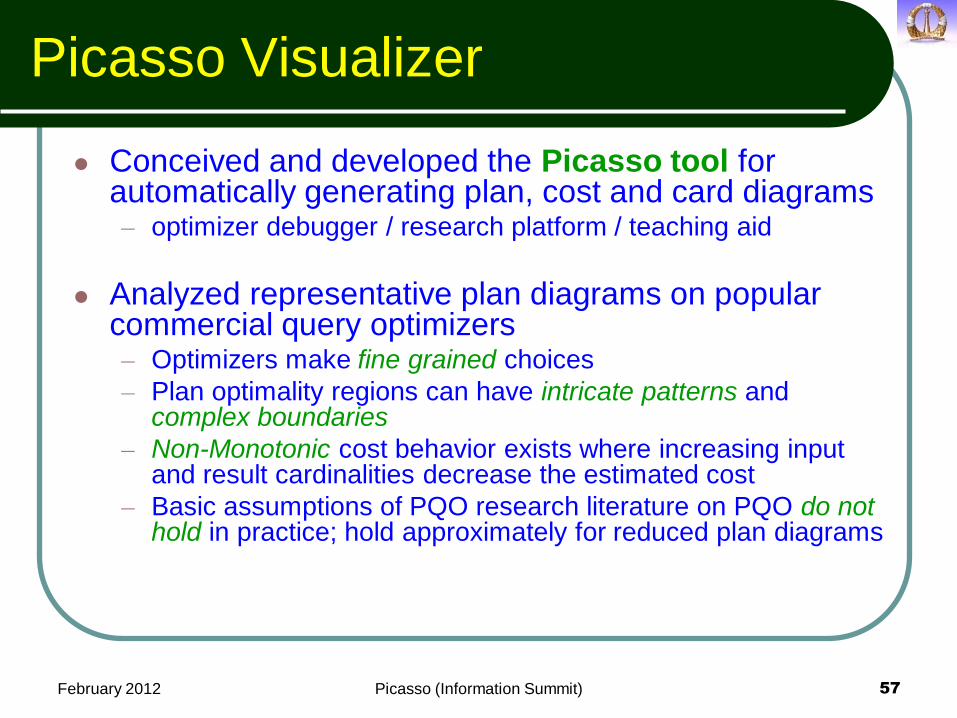
Picasso Visualizer
Conceived and developed the Picasso tool for automatically generating plan, cost and card diagrams – optimizer debugger / research platform / teaching aid
Analyzed representative plan diagrams on popular commercial query optimizers – Optimizers make fine grained choices
– Plan optimality regions can have intricate patterns and complex boundaries
– Non-Monotonic cost behavior exists where increasing input and result cardinalities decrease the estimated cost
– Basic assumptions of PQO research literature on PQO do not hold in practice; hold approximately for reduced plan diagrams
Take Away
We can efficiently produce plan diagrams that simultaneously possess the desirable properties of being online, anorexic, safe and robust.
This result could play a meaningful role in designing the next generation of database query optimizers.
February 2012 Picasso (Information Summit) 58
February 2012 Picasso (Information Summit) 59
More Details
http://dsl.serc.iisc.ernet.in/projects/PICASSO
Publications, Software, Sample Diagrams
February 2012 Picasso (Information Summit) 60
QUESTIONS?

February 2012 Picasso (Information Summit) 61
END PRESENTATION