physiotherapist workforce, 2012—methodology guide · methodological notes ... analysis and...
TRANSCRIPT

Spending and Health Workforce
Physiotherapist Workforce, 2012— Methodology Guide

Our VisionBetter data. Better decisions. Healthier Canadians.
Our MandateTo lead the development and maintenance of comprehensive and integrated health information that enables sound policy and effective health system management that improve health and health care.
Our ValuesRespect, Integrity, Collaboration, Excellence, Innovation

Table of Contents About CIHI’s Physiotherapist Data ............................................................................................... iii Methodological Notes ................................................................................................................... 1
Data Quality ............................................................................................................................... 1 Data Providers ........................................................................................................................... 1
Population of Interest ............................................................................................................. 3 Population of Reference and Collection Period ......................................................................... 3 Defining the Workforce .............................................................................................................. 3 Data Processing Methods ......................................................................................................... 5
File Processing ...................................................................................................................... 5 Identification of Secondary Registrations .............................................................................. 5 Non-Response ....................................................................................................................... 6
Data Limitations ......................................................................................................................... 9 Key Concepts and Definitions ................................................................................................... 9
Analytical Methods ...................................................................................................................... 10 Urban/Rural Statistics .............................................................................................................. 10
Missing Values in Urban/Rural Statistics .............................................................................. 10 Methodological and Historical Revisions .................................................................................... 11
Supply ..................................................................................................................................... 11 Demographics ......................................................................................................................... 11
Year of Birth ......................................................................................................................... 11 Gender ................................................................................................................................. 11 Education ............................................................................................................................. 12 Employment ......................................................................................................................... 12
References .................................................................................................................................. 13


iii
Physiotherapist Workforce, 2012—Methodology Guide
About CIHI’s Physiotherapist Data Collecting and reporting health human resources (HHR) data assists decision-makers in the planning and distribution of health care providers. Since 2007, the Canadian Institute for Health Information (CIHI) has collected information on the supply and distribution, demographics, geography, education and employment of physiotherapists in selected provinces and territories in Canada.
Companion Products on CIHI’s Website The following companion products are available on CIHI’s website at www.cihi.ca/hhr.
Physiotherapist Workforce, 2012
– Summary and Provincial/Territorial Profiles (XLSX)
– Presentation (PPTX)
– Data Tables (XLSX)
– Methodology Guide (PDF)
Previous reports
– Physiotherapists in Canada series
Reference documents
– Physiotherapist Database Manual
– Privacy Impact Assessment
For more information, please contact
Program Lead, Health Human Resources Canadian Institute for Health Information 495 Richmond Road, Suite 600 Ottawa, Ontario K2A 4H6
Phone: 613-241-7860 Fax: 613-241-8120 Email: [email protected] Website: www.cihi.ca

1
Physiotherapist Workforce, 2012—Methodology Guide
Methodological Notes This guide will provide a better understanding of the strengths and limitations of the physiotherapist data reported in Physiotherapist Workforce, 2012 and the ways in which it can be effectively used and analyzed. This information is particularly important when making comparisons with other data sources and when drawing conclusions regarding changes over time.
Data Quality CIHI is founded upon the principles of data quality, privacy and confidentiality. Data collection, processing, analysis and dissemination are guided by CIHI’s commitment to publishing high-quality data in a privacy-sensitive manner. This section outlines the methodologies used to maximize the accuracy, comparability, timeliness, usability and relevance of the Physiotherapist Database (PTDB).
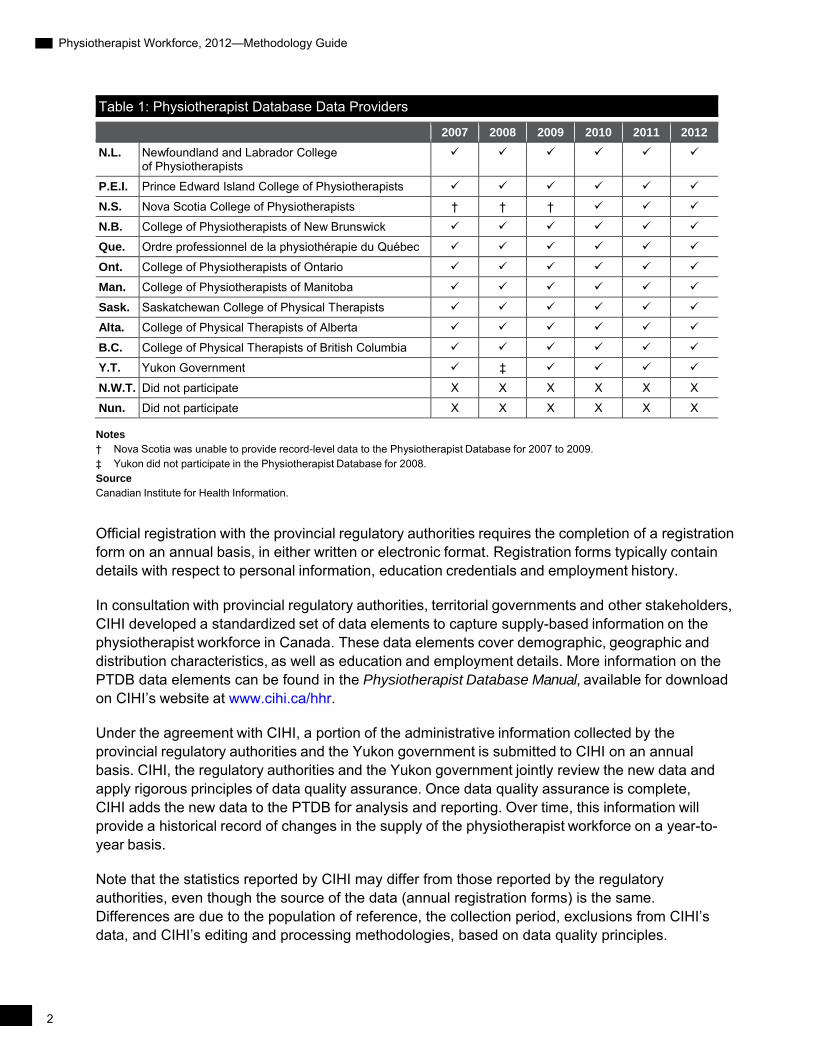
Data Providers The provincial regulatory authorities and the Yukon government participate in the PTDB and are the primary collectors of data compiled in the CIHI database. All provincial or territorial regulatory authorities have participated since 2007; the Northwest Territories and Nunavut do not participate, as there are no regulatory authorities in those territories. For 2008 only, the Yukon government was unable to participate in the PTDB.
For 2007 to 2009, Nova Scotia was unable to provide data to the PTDB. Aggregate data from the Nova Scotia College of Physiotherapists was inserted to provide an estimation of supply and gender only from 2007 to 2009. In 2009, it also supplied aggregate information on certain education and employment data elements. Since 2010, Nova Scotia has been able to provide record-level data to the PTDB.
Since 2003, the Ordre professionnel de la physiothérapie du Québec has included two categories of professionals: physiotherapists and physical rehabilitation therapists. This report includes detailed data specific to physiotherapists and aggregate data on physical rehabilitation therapists.
Physiotherapist Workforce, 2012—Methodology Guide
2
Table 1: Physiotherapist Database Data Providers
2007 2008 2009 2010 2011 2012
N.L. Newfoundland and Labrador College of Physiotherapists
P.E.I. Prince Edward Island College of Physiotherapists
N.S. Nova Scotia College of Physiotherapists † † †
N.B. College of Physiotherapists of New Brunswick
Que. Ordre professionnel de la physiothérapie du Québec
Ont. College of Physiotherapists of Ontario
Man. College of Physiotherapists of Manitoba
Sask. Saskatchewan College of Physical Therapists
Alta. College of Physical Therapists of Alberta
B.C. College of Physical Therapists of British Columbia
Y.T. Yukon Government ‡
N.W.T. Did not participate X X X X X X
Nun. Did not participate X X X X X X
Notes † Nova Scotia was unable to provide record-level data to the Physiotherapist Database for 2007 to 2009. ‡ Yukon did not participate in the Physiotherapist Database for 2008. Source Canadian Institute for Health Information.
Official registration with the provincial regulatory authorities requires the completion of a registration form on an annual basis, in either written or electronic format. Registration forms typically contain details with respect to personal information, education credentials and employment history.
In consultation with provincial regulatory authorities, territorial governments and other stakeholders, CIHI developed a standardized set of data elements to capture supply-based information on the physiotherapist workforce in Canada. These data elements cover demographic, geographic and distribution characteristics, as well as education and employment details. More information on the PTDB data elements can be found in the Physiotherapist Database Manual, available for download on CIHI’s website at www.cihi.ca/hhr.
Under the agreement with CIHI, a portion of the administrative information collected by the provincial regulatory authorities and the Yukon government is submitted to CIHI on an annual basis. CIHI, the regulatory authorities and the Yukon government jointly review the new data and apply rigorous principles of data quality assurance. Once data quality assurance is complete, CIHI adds the new data to the PTDB for analysis and reporting. Over time, this information will provide a historical record of changes in the supply of the physiotherapist workforce on a year-to-year basis.
Note that the statistics reported by CIHI may differ from those reported by the regulatory authorities, even though the source of the data (annual registration forms) is the same. Differences are due to the population of reference, the collection period, exclusions from CIHI’s data, and CIHI’s editing and processing methodologies, based on data quality principles.

3
Physiotherapist Workforce, 2012—Methodology Guide
Population of Interest
The population of interest for the physiotherapist data includes all physiotherapists registered with a regulatory authority within a Canadian province or territory. Since 2003, the Ordre professionnel de la physiothérapie du Québec has included two categories of professionals: physiotherapists and physical rehabilitation therapists.
The PTDB population of interest, however, includes physiotherapists only. The population is further refined to include all physiotherapists who submit active registrations with a Canadian provincial licensing authority or with the Yukon government.
For any given year, the population includes those physiotherapists who registered between the start of the registration period for the provincial regulatory authority/territorial government and September 1.
Population of Reference and Collection Period CIHI takes steps to manipulate the population of reference of the PTDB to more closely represent the population of interest. So that it can meet data quality guidelines for timeliness, CIHI collects data as of September 1 of the registration period in each participating jurisdiction. Therefore, the population of reference for the PTDB is all regulated physiotherapists who submit an active practising registration in a Canadian province or territory as of September 1. The 12-month registration period varies among the provinces and territories, as each jurisdiction is responsible for setting the start and end dates of its own registration period.
Defining the Workforce As part of their registration/licensing process, the regulatory authorities collect membership data on an annual basis. They collect data for all members applying for active and inactive registration.
Since the data collected by the provincial regulatory authorities is wider in scope than CIHI’s population of reference, CIHI applies a filtering methodology from the point of data collection through data processing. It targets the relevant records that meet the criteria for the reference population and also meet the information needs addressed in the analysis.
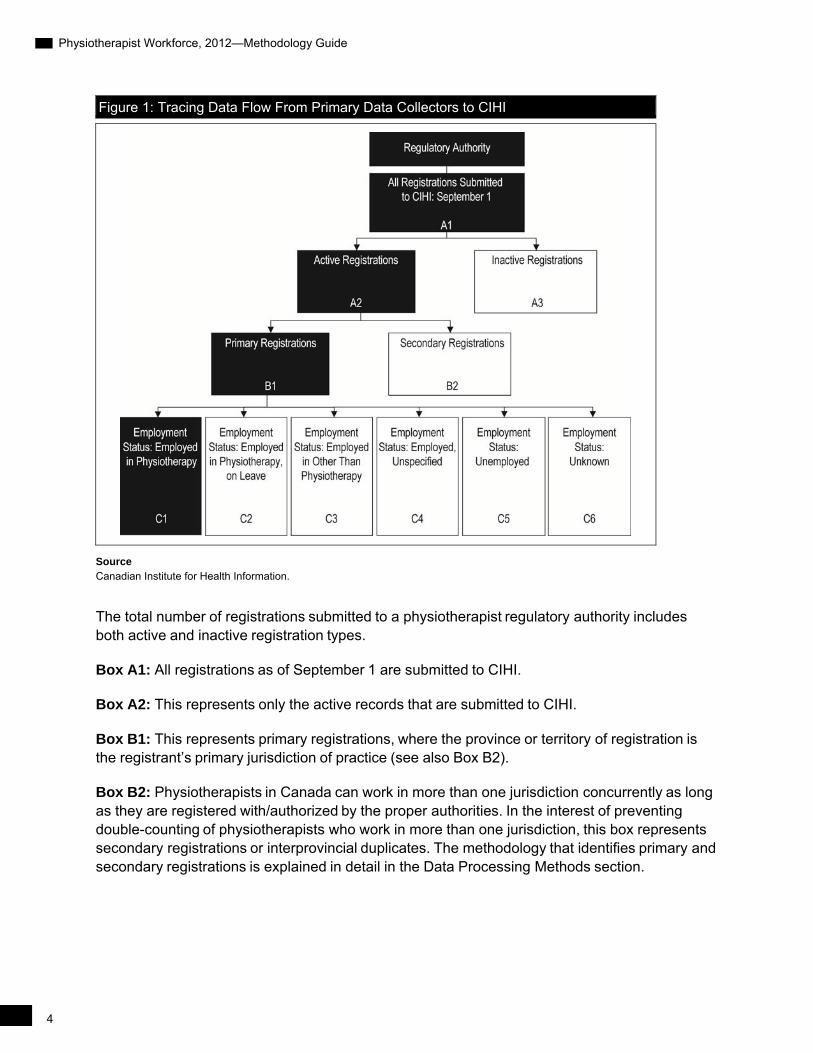
The figure below illustrates the data flow when this methodology is applied. Explanations of each step within the data flow are provided in the text following the diagram.
Physiotherapist Workforce, 2012—Methodology Guide
4
Figure 1: Tracing Data Flow From Primary Data Collectors to CIHI
Source Canadian Institute for Health Information.
The total number of registrations submitted to a physiotherapist regulatory authority includes both active and inactive registration types.
Box A1: All registrations as of September 1 are submitted to CIHI.
Box A2: This represents only the active records that are submitted to CIHI.
Box B1: This represents primary registrations, where the province or territory of registration is the registrant’s primary jurisdiction of practice (see also Box B2).
Box B2: Physiotherapists in Canada can work in more than one jurisdiction concurrently as long as they are registered with/authorized by the proper authorities. In the interest of preventing double-counting of physiotherapists who work in more than one jurisdiction, this box represents secondary registrations or interprovincial duplicates. The methodology that identifies primary and secondary registrations is explained in detail in the Data Processing Methods section.

5
Physiotherapist Workforce, 2012—Methodology Guide
Boxes C1 to C6: In most cases, statistics produced by provincial regulatory authorities and the Yukon government include all active practising registrations regardless of Employment Status. In contrast, CIHI’s statistics typically include only those registrants who explicitly state their Employment Status in physiotherapy (Box C1). Those physiotherapists who are on leave, employed outside of physiotherapy or unemployed, or whose Employment Status is unknown, are excluded from the final statistics (boxes C2 to C6).
Data Processing Methods File Processing
Once data files are received by CIHI, all records undergo two stages of processing before they are included in the national database. The first stage ensures that data is in the proper format and that all responses pass specific validity and logic tests. If the data submitted does not match the standardized CIHI codes, an exception report and data file summary (identifying and explaining the errors) are sent to the data provider. In addition, the data is tested for a logical relationship between specific fields (for example, an error is identified in the exception report if the year of graduation is earlier than the year of birth). Errors are reviewed jointly by CIHI and the respective data provider representative. In cases where the data provider is not able to make the corrections, CIHI may make them directly with the explicit consent of the provider. If a correction cannot be made, the code is changed to the appropriate default/missing value.
Identification of Secondary Registrations
Once the file has passed all validity and logic tests, the second stage of processing begins. Since physiotherapists are able to register simultaneously in more than one jurisdiction, a methodology has been developed to identify those who are living outside of Canada or are registered in more than one province or territory, in order to ensure an accurate count of the number of those registered and working in Canada only.
For example, there are administrative incentives for physiotherapists to maintain their Canadian physiotherapy licence while living and/or working outside of the country. A physiotherapist living abroad may continue to register with a Canadian regulatory authority each year, even though she or he may have no intention of returning to Canada in the subsequent 12-month period. CIHI must identify those who are living abroad and remove their data from analysis, since it reports on only the physiotherapist workforce within Canada.
For those living and working in Canada, CIHI must also identify registrations that do not reflect the primary jurisdiction of practice. Similar to the international situation, there are administrative incentives for physiotherapists to maintain their provincial or territorial physiotherapy licence while living and/or working in another Canadian jurisdiction. To avoid double-counting, CIHI evaluates each registration to ensure that it reflects the primary jurisdiction of practice. These secondary registrations are also termed interprovincial duplicates.
Physiotherapist Workforce, 2012—Methodology Guide
6
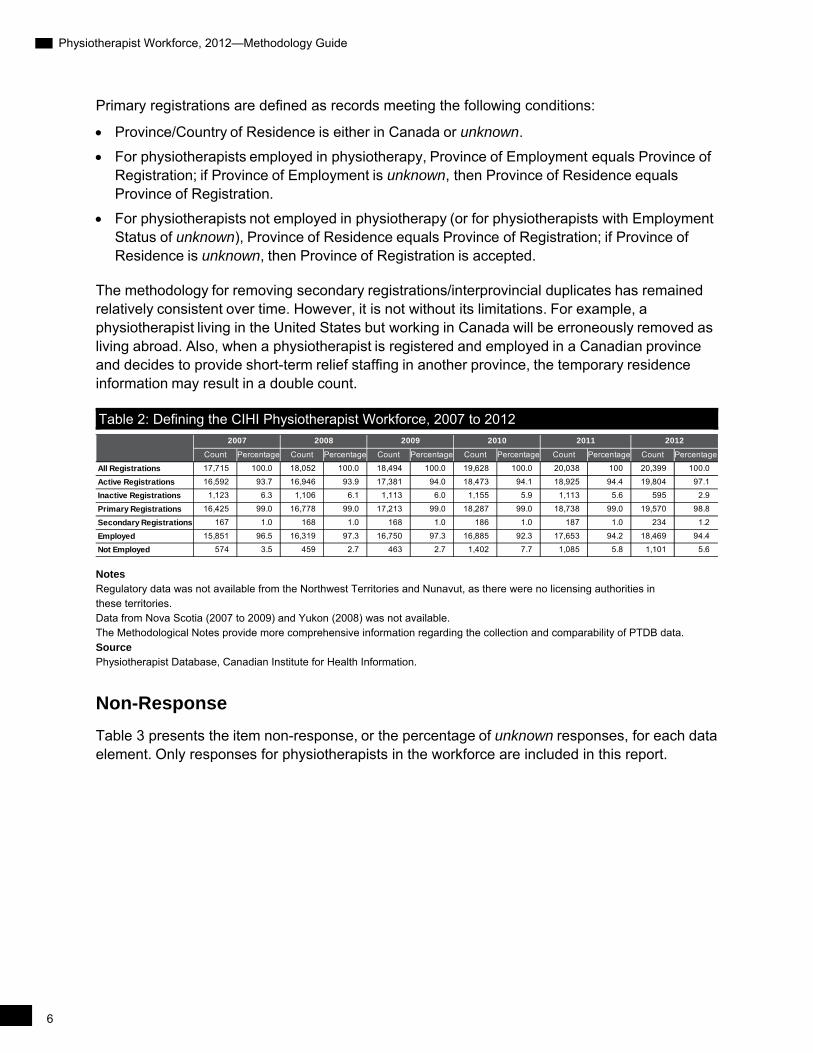
Primary registrations are defined as records meeting the following conditions:
Province/Country of Residence is either in Canada or unknown.
For physiotherapists employed in physiotherapy, Province of Employment equals Province of Registration; if Province of Employment is unknown, then Province of Residence equals Province of Registration.
For physiotherapists not employed in physiotherapy (or for physiotherapists with Employment Status of unknown), Province of Residence equals Province of Registration; if Province of Residence is unknown, then Province of Registration is accepted.
The methodology for removing secondary registrations/interprovincial duplicates has remained relatively consistent over time. However, it is not without its limitations. For example, a physiotherapist living in the United States but working in Canada will be erroneously removed as living abroad. Also, when a physiotherapist is registered and employed in a Canadian province and decides to provide short-term relief staffing in another province, the temporary residence information may result in a double count.
Table 2: Defining the CIHI Physiotherapist Workforce, 2007 to 2012
Notes Regulatory data was not available from the Northwest Territories and Nunavut, as there were no licensing authorities in these territories. Data from Nova Scotia (2007 to 2009) and Yukon (2008) was not available. The Methodological Notes provide more comprehensive information regarding the collection and comparability of PTDB data. Source Physiotherapist Database, Canadian Institute for Health Information.
Non-Response
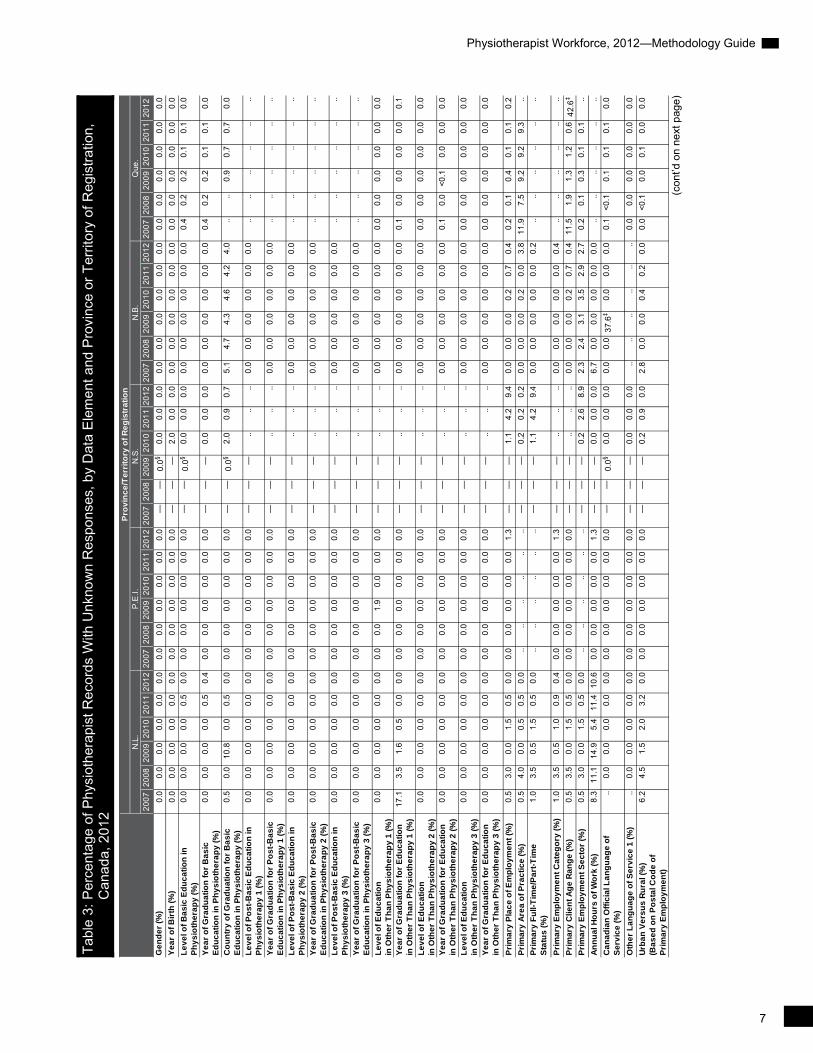
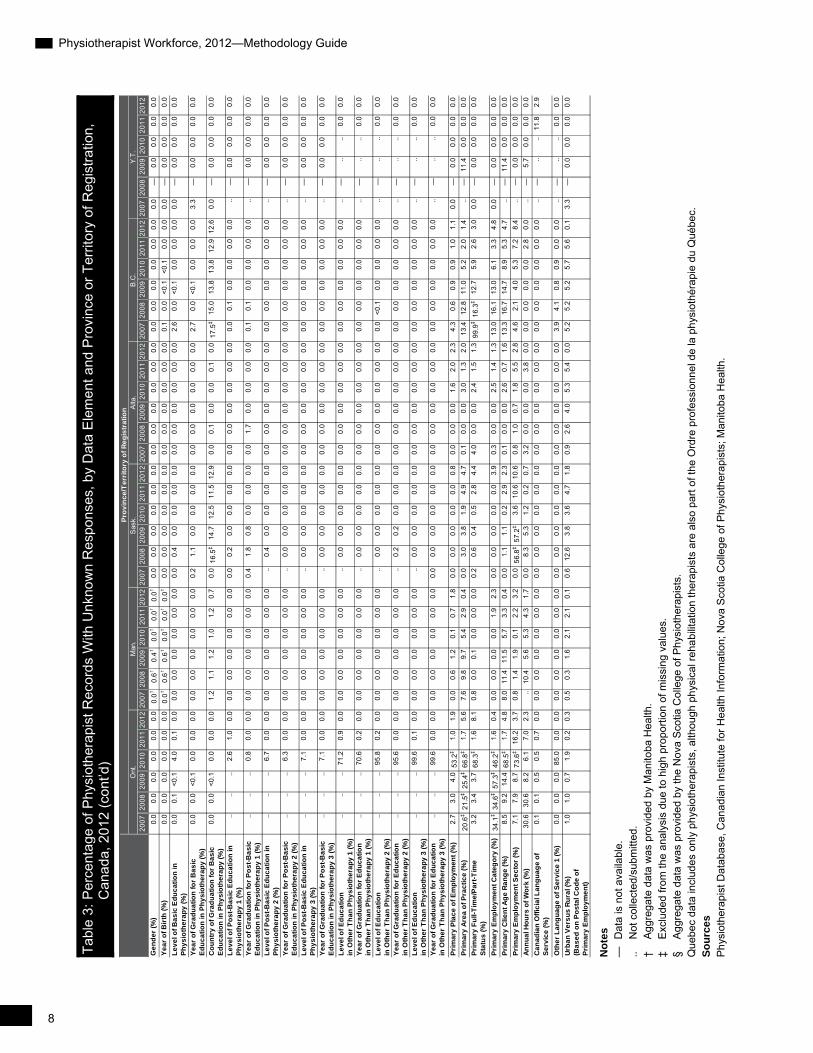
Table 3 presents the item non-response, or the percentage of unknown responses, for each data element. Only responses for physiotherapists in the workforce are included in this report.
Count Percentage Count Percentage Count Percentage Count Percentage Count Percentage Count Percentage
All Registrations 17,715 100.0 18,052 100.0 18,494 100.0 19,628 100.0 20,038 100 20,399 100.0
Active Registrations 16,592 93.7 16,946 93.9 17,381 94.0 18,473 94.1 18,925 94.4 19,804 97.1
Inactive Registrations 1,123 6.3 1,106 6.1 1,113 6.0 1,155 5.9 1,113 5.6 595 2.9
Primary Registrations 16,425 99.0 16,778 99.0 17,213 99.0 18,287 99.0 18,738 99.0 19,570 98.8
Secondary Registrations 167 1.0 168 1.0 168 1.0 186 1.0 187 1.0 234 1.2
Employed 15,851 96.5 16,319 97.3 16,750 97.3 16,885 92.3 17,653 94.2 18,469 94.4
Not Employed 574 3.5 459 2.7 463 2.7 1,402 7.7 1,085 5.8 1,101 5.6
2009 2010 2011 20122007 2008
Physiotherapist Workforce, 2012—Methodology Guide
Tabl
e 3:
Per
cent
age
of P
hysi
othe
rapi
st R
ecor
ds W
ith U
nkno
wn
Res
pons
es, b
y D
ata
Ele
men
t and
Pro
vinc
e or
Ter
ritor
y of
Reg
istra
tion,
C
anad
a, 2
012
(c
ont’d
on
next
pag
e)
2007
2008
2009
2010
2011
2012
2007
2008
2009
2010
2011
2012
2007
2008
2009
2010
2011
2012
2007
2008
2009
2010
2011
2012
2007
2008
2009
2010
2011
2012
Ge
nd
er
(%)
0.0
0.0
0.0
0.0
0.0
0.0
0.0
0.0
0.0
0.0
0.0
0.0
——
0.0§
0.0
0.0
0.0
0.0
0.0
0.0
0.0
0.0
0.0
0.0
0.0
0.0
0.0
0.0
0.0
Ye
ar
of
Bir
th (
%)
0.0
0.0
0.0
0.0
0.0
0.0
0.0
0.0
0.0
0.0
0.0
0.0
——
—2.
00.
00.
00.
00.
00.
00.
00.
00.
00.
00.
00.
00.
00.
00.
0L
ev
el o
f B
as
ic E
du
ca
tio
n in
P
hy
sio
the
rap
y (
%)
0.0
0.0
0.0
0.0
0.5
0.0
0.0
0.0
0.0
0.0
0.0
0.0
——
0.0§
0.0
0.0
0.0
0.0
0.0
0.0
0.0
0.0
0.0
0.4
0.2
0.2
0.1
0.1
0.0
Ye
ar
of
Gra
du
ati
on
fo
r B
as
ic
Ed
uc
ati
on
in P
hy
sio
the
rap
y (
%)
0.0
0.0
0.0
0.0
0.5
0.4
0.0
0.0
0.0
0.0
0.0
0.0
——
—0.
00.
00.
00.
00.
00.
00.
00.
00.
00.
40.
20.
20.
10.
10.
0
Co
un
try
of
Gra
du
ati
on
fo
r B
as
ic
Ed
uc
ati
on
in P
hy
sio
the
rap
y (
%)
0.5
0.0
10.8
0.0
0.5
0.0
0.0
0.0
0.0
0.0
0.0
0.0
——
0.0§
2.0
0.9
0.7
5.1
4.7
4.3
4.6
4.2
4.0
....
0.9
0.7
0.7
0.0
Le
ve
l of
Po
st-
Ba
sic
Ed
uc
ati
on
in
Ph
ys
ioth
era
py
1 (
%)
0.0
0.0
0.0
0.0
0.0
0.0
0.0
0.0
0.0
0.0
0.0
0.0
——
—..
....
0.0
0.0
0.0
0.0
0.0
0.0
....
....
....
Ye
ar
of
Gra
du
ati
on
fo
r P
os
t-B
as
ic
Ed
uc
ati
on
in P
hy
sio
the
rap
y 1
(%
)0.
00.
00.
00.
00.
00.
00.
00.
00.
00.
00.
00.
0—
——
....
..0.
00.
00.
00.
00.
00.
0..
....
....
..
Le
ve
l of
Po
st-
Ba
sic
Ed
uc
ati
on
in
Ph
ys
ioth
era
py
2 (
%)
0.0
0.0
0.0
0.0
0.0
0.0
0.0
0.0
0.0
0.0
0.0
0.0
——
—..
....
0.0
0.0
0.0
0.0
0.0
0.0
....
....
....
Ye
ar
of
Gra
du
ati
on
fo
r P
os
t-B
as
ic
Ed
uc
ati
on
in P
hy
sio
the
rap
y 2
(%
)0.
00.
00.
00.
00.
00.
00.
00.
00.
00.
00.
00.
0—
——
....
..0.
00.
00.
00.
00.
00.
0..
....
....
..
Le
ve
l of
Po
st-
Ba
sic
Ed
uc
ati
on
in
Ph
ys
ioth
era
py
3 (
%)
0.0
0.0
0.0
0.0
0.0
0.0
0.0
0.0
0.0
0.0
0.0
0.0
——
—..
....
0.0
0.0
0.0
0.0
0.0
0.0
....
....
....
Ye
ar
of
Gra
du
ati
on
fo
r P
os
t-B
as
ic
Ed
uc
ati
on
in P
hy
sio
the
rap
y 3
(%
)0.
00.
00.
00.
00.
00.
00.
00.
00.
00.
00.
00.
0—
——
....
..0.
00.
00.
00.
00.
00.
0..
....
....
..
Le
ve
l of
Ed
uc
ati
on
in
Oth
er
Th
an
Ph
ys
ioth
era
py
1 (
%)
0.0
0.0
0.0
0.0
0.0
0.0
0.0
0.0
1.9
0.0
0.0
0.0
——
—..
....
0.0
0.0
0.0
0.0
0.0
0.0
0.0
0.0
0.0
0.0
0.0
0.0
Ye
ar
of
Gra
du
ati
on
fo
r E
du
ca
tio
n
in O
the
r T
ha
n P
hy
sio
the
rap
y 1
(%
)17
.13.
51.
60.
50.
00.
00.
00.
00.
00.
00.
00.
0—
——
....
..0.
00.
00.
00.
00.
00.
00.
10.
00.
00.
00.
00.
1
Le
ve
l of
Ed
uc
ati
on
in
Oth
er
Th
an
Ph
ys
ioth
era
py
2 (
%)
0.0
0.0
0.0
0.0
0.0
0.0
0.0
0.0
0.0
0.0
0.0
0.0
——
—..
....
0.0
0.0
0.0
0.0
0.0
0.0
0.0
0.0
0.0
0.0
0.0
0.0
Ye
ar
of
Gra
du
ati
on
fo
r E
du
ca
tio
n
in O
the
r T
ha
n P
hy
sio
the
rap
y 2
(%
)0.
00.
00.
00.
00.
00.
00.
00.
00.
00.
00.
00.
0—
——
....
..0.
00.
00.
00.
00.
00.
00.
10.
0<0
.10.
00.
00.
0
Le
ve
l of
Ed
uc
ati
on
in
Oth
er
Th
an
Ph
ys
ioth
era
py
3 (
%)
0.0
0.0
0.0
0.0
0.0
0.0
0.0
0.0
0.0
0.0
0.0
0.0
——
—..
....
0.0
0.0
0.0
0.0
0.0
0.0
0.0
0.0
0.0
0.0
0.0
0.0
Ye
ar
of
Gra
du
ati
on
fo
r E
du
ca
tio
n
in O
the
r T
ha
n P
hy
sio
the
rap
y 3
(%
)0.
00.
00.
00.
00.
00.
00.
00.
00.
00.
00.
00.
0—
——
....
..0.
00.
00.
00.
00.
00.
00.
00.
00.
00.
00.
00.
0
Pri
ma
ry P
lac
e o
f E
mp
loy
me
nt
(%)
0.5
3.0
0.0
1.5
0.5
0.0
0.0
0.0
0.0
0.0
0.0
1.3
——
—1.
14.
29.
40.
00.
00.
00.
20.
70.
40.
20.
10.
40.
10.
10.
2P
rim
ary
Are
a o
f P
rac
tic
e (
%)
0.5
4.0
0.0
0.5
0.5
0.0
....
....
....
——
—0.
20.
20.
20.
00.
00.
00.
20.
03.
811
.97.
59.
29.
29.
3..
Pri
ma
ry F
ull-
Tim
e/P
art
-Tim
e
Sta
tus
(%
)1.
03.
50.
51.
50.
50.
0..
....
....
..—
——
1.1
4.2
9.4
0.0
0.0
0.0
0.0
0.0
0.2
....
....
....
Pri
ma
ry E
mp
loy
me
nt
Ca
teg
ory
(%
)1.
03.
50.
51.
00.
90.
40.
00.
00.
00.
00.
01.
3—
——
....
..0.
00.
00.
00.
00.
00.
4..
....
....
..P
rim
ary
Clie
nt
Ag
e R
an
ge
(%
)0.
53.
50.
01.
50.
50.
00.
00.
00.
00.
00.
00.
0—
——
....
..0.
00.
00.
00.
20.
70.
411
.51.
91.
31.
20.
642
.6‡
Pri
ma
ry E
mp
loy
me
nt
Se
cto
r (%
)0.
53.
00.
01.
50.
50.
0..
....
....
..—
——
0.2
2.6
8.9
2.3
2.4
3.1
3.5
2.9
2.7
0.2
0.1
0.3
0.1
0.1
..A
nn
ua
l Ho
urs
of
Wo
rk (
%)
8.3
11.1
14.9
5.4
11.4
10.6
0.0
0.0
0.0
0.0
0.0
1.3
——
—0.
00.
00.
06.
70.
00.
00.
00.
00.
0..
....
....
..C
an
ad
ian
Off
icia
l La
ng
ua
ge
of
Se
rvic
e (
%)
..0.
00.
00.
00.
00.
00.
00.
00.
00.
00.
00.
0—
—0.
0§0.
00.
00.
00.
00.
037
.6‡
0.0
0.0
0.0
0.1
<0.1
0.1
0.1
0.1
0.0
Oth
er
La
ng
ua
ge
of
Se
rvic
e 1
(%
)..
0.0
0.0
0.0
0.0
0.0
0.0
0.0
0.0
0.0
0.0
0.0
——
—0.
00.
00.
0..
....
....
..0.
00.
00.
00.
00.
00.
0U
rba
n V
ers
us
Ru
ral (
%)
(Ba
se
d o
n P
os
tal C
od
e o
f P
rim
ary
Em
plo
ym
en
t)
6.2
4.5
1.5
2.0
3.2
0.0
0.0
0.0
0.0
0.0
0.0
0.0
——
—0.
20.
90.
02.
80.
00.
00.
40.
20.
00.
0<0
.10.
00.
10.
00.
0
N.L
.P
.E.I.
N.S
.N
.B.
Que
.P
rov
inc
e/T
err
ito
ry o
f R
eg
istr
ati
on
7
Physiotherapist Workforce, 2012—Methodology Guide
Tabl
e 3:
Per
cent
age
of P
hysi
othe
rapi
st R
ecor
ds W
ith U
nkno
wn
Res
pons
es, b
y D
ata
Ele
men
t and
Pro
vinc
e or
Ter
ritor
y of
Reg
istra
tion,
C
anad
a, 2
012
(con
t’d)
N
ote
s
—
Dat
a is
not
ava
ilabl
e.
.. N
ot c
olle
cted
/sub
mitt
ed.
† A
ggre
gate
dat
a w
as p
rovi
ded
by M
anito
ba H
ealth
. ‡
Exc
lude
d fro
m th
e an
alys
is d
ue to
hig
h pr
opor
tion
of m
issi
ng v
alue
s.
§ A
ggre
gate
dat
a w
as p
rovi
ded
by th
e N
ova
Sco
tia C
olle
ge o
f Phy
siot
hera
pist
s.
Que
bec
data
incl
udes
onl
y ph
ysio
ther
apis
ts, a
lthou
gh p
hysi
cal r
ehab
ilita
tion
ther
apis
ts a
re a
lso
part
of th
e O
rdre
pro
fess
ionn
el d
e la
phy
siot
héra
pie
du Q
uébe
c.
So
urc
es
Phy
siot
hera
pist
Dat
abas
e, C
anad
ian
Inst
itute
for H
ealth
Info
rmat
ion;
Nov
a S
cotia
Col
lege
of P
hysi
othe
rapi
sts;
Man
itoba
Hea
lth.
2007
2008
2009
2010
2011
2012
2007
2008
2009
2010
2011
2012
2007
2008
2009
2010
2011
2012
2007
2008
2009
2010
2011
2012
2007
2008
2009
2010
2011
2012
2007
2008
2009
2010
2011
2012
Ge
nd
er
(%)
0.0
0.0
0.0
0.0
0.0
0.0
0.0†
0.6†
0.4†
0.0†
0.0†
0.0†
0.0
0.0
0.0
0.0
0.0
0.0
0.0
0.0
0.0
0.0
0.0
0.0
0.0
0.0
0.0
0.0
0.0
0.0
0.0
—0.
00.
00.
00.
0Y
ea
r o
f B
irth
(%
)0.
00.
00.
00.
00.
00.
00.
0†0.
6†0.
6†0.
0†0.
0†0.
0†0.
00.
00.
00.
00.
00.
00.
00.
00.
00.
00.
00.
00.
10.
0<0
.1<0
.10.
00.
00.
0—
0.0
0.0
0.0
0.0
Le
ve
l of
Ba
sic
Ed
uc
ati
on
in
Ph
ys
ioth
era
py
(%
)0.
00.
1<0
.14.
00.
10.
00.
00.
00.
00.
00.
00.
00.
00.
40.
00.
00.
00.
00.
00.
00.
00.
00.
00.
02.
60.
0<0
.10.
00.
00.
00.
0—
0.0
0.0
0.0
0.0
Ye
ar
of
Gra
du
ati
on
fo
r B
as
ic
Ed
uc
ati
on
in P
hy
sio
the
rap
y (
%)
0.0
0.0
<0.1
0.0
0.0
0.0
0.0
0.0
0.0
0.0
0.0
0.0
0.2
1.1
0.0
0.0
0.0
0.0
0.0
0.0
0.0
0.0
0.0
0.0
2.7
0.0
<0.1
0.0
0.0
0.0
3.3
—0.
00.
00.
00.
0
Co
un
try
of
Gra
du
ati
on
fo
r B
as
ic
Ed
uc
ati
on
in P
hy
sio
the
rap
y (
%)
0.0
0.0
<0.1
0.0
0.0
0.0
1.2
1.1
1.2
1.0
1.2
0.7
0.0
16.5
‡14
.712
.511
.512
.90.
00.
10.
00.
00.
10.
017
.5‡
15.0
13.8
13.8
12.9
12.6
0.0
—0.
00.
00.
00.
0
Le
ve
l of
Po
st-
Ba
sic
Ed
uc
ati
on
in
Ph
ys
ioth
era
py
1 (
%)
....
..2.
61.
00.
00.
00.
00.
00.
00.
00.
00.
00.
20.
00.
00.
00.
00.
00.
00.
00.
00.
00.
00.
00.
10.
00.
00.
00.
0..
—0.
00.
00.
00.
0
Ye
ar
of
Gra
du
ati
on
fo
r P
os
t-B
as
ic
Ed
uc
ati
on
in P
hy
sio
the
rap
y 1
(%
)..
....
0.8
0.0
0.0
0.0
0.0
0.0
0.0
0.0
0.0
0.4
1.8
0.8
0.0
0.0
0.0
0.0
1.7
0.0
0.0
0.0
0.0
0.1
0.1
0.0
0.0
0.0
0.0
..—
0.0
0.0
0.0
0.0
Le
ve
l of
Po
st-
Ba
sic
Ed
uc
ati
on
in
Ph
ys
ioth
era
py
2 (
%)
....
..6.
70.
00.
00.
00.
00.
00.
00.
00.
0..
0.4
0.0
0.0
0.0
0.0
0.0
0.0
0.0
0.0
0.0
0.0
0.0
0.0
0.0
0.0
0.0
0.0
..—
0.0
0.0
0.0
0.0
Ye
ar
of
Gra
du
ati
on
fo
r P
os
t-B
as
ic
Ed
uc
ati
on
in P
hy
sio
the
rap
y 2
(%
)..
....
6.3
0.0
0.0
0.0
0.0
0.0
0.0
0.0
0.0
..0.
00.
00.
00.
00.
00.
00.
00.
00.
00.
00.
00.
00.
00.
00.
00.
00.
0..
—0.
00.
00.
00.
0
Le
ve
l of
Po
st-
Ba
sic
Ed
uc
ati
on
in
Ph
ys
ioth
era
py
3 (
%)
....
..7.
10.
00.
00.
00.
00.
00.
00.
00.
0..
0.0
0.0
0.0
0.0
0.0
0.0
0.0
0.0
0.0
0.0
0.0
0.0
0.0
0.0
0.0
0.0
0.0
..—
0.0
0.0
0.0
0.0
Ye
ar
of
Gra
du
ati
on
fo
r P
os
t-B
as
ic
Ed
uc
ati
on
in P
hy
sio
the
rap
y 3
(%
)..
....
7.1
0.0
0.0
0.0
0.0
0.0
0.0
0.0
0.0
..0.
00.
00.
00.
00.
00.
00.
00.
00.
00.
00.
00.
00.
00.
00.
00.
00.
0..
—0.
00.
00.
00.
0
Le
ve
l of
Ed
uc
ati
on
in
Oth
er
Th
an
Ph
ys
ioth
era
py
1 (
%)
....
..71
.20.
90.
00.
00.
00.
00.
00.
00.
0..
0.0
0.0
0.0
0.0
0.0
0.0
0.0
0.0
0.0
0.0
0.0
0.0
0.0
0.0
0.0
0.0
0.0
..—
....
0.0
0.0
Ye
ar
of
Gra
du
ati
on
fo
r E
du
ca
tio
n
in O
the
r T
ha
n P
hy
sio
the
rap
y 1
(%
)..
....
70.6
0.2
0.0
0.0
0.0
0.0
0.0
0.0
0.0
..0.
00.
00.
00.
00.
00.
00.
00.
00.
00.
00.
00.
00.
00.
00.
00.
00.
0..
—..
..0.
00.
0
Le
ve
l of
Ed
uc
ati
on
in
Oth
er
Th
an
Ph
ys
ioth
era
py
2 (
%)
....
..95
.80.
20.
00.
00.
00.
00.
00.
00.
0..
0.0
0.0
0.0
0.0
0.0
0.0
0.0
0.0
0.0
0.0
0.0
0.0
<0.1
0.0
0.0
0.0
0.0
..—
....
0.0
0.0
Ye
ar
of
Gra
du
ati
on
fo
r E
du
ca
tio
n
in O
the
r T
ha
n P
hy
sio
the
rap
y 2
(%
)..
....
95.6
0.0
0.0
0.0
0.0
0.0
0.0
0.0
0.0
..0.
20.
20.
00.
00.
00.
00.
00.
00.
00.
00.
00.
00.
00.
00.
00.
00.
0..
—..
..0.
00.
0
Le
ve
l of
Ed
uc
ati
on
in
Oth
er
Th
an
Ph
ys
ioth
era
py
3 (
%)
....
..99
.60.
10.
00.
00.
00.
00.
00.
00.
0..
0.0
0.0
0.0
0.0
0.0
0.0
0.0
0.0
0.0
0.0
0.0
0.0
0.0
0.0
0.0
0.0
0.0
..—
....
0.0
0.0
Ye
ar
of
Gra
du
ati
on
fo
r E
du
ca
tio
n
in O
the
r T
ha
n P
hy
sio
the
rap
y 3
(%
)..
....
99.6
0.0
0.0
0.0
0.0
0.0
0.0
0.0
0.0
0.0
0.0
0.0
0.0
0.0
0.0
0.0
0.0
0.0
0.0
0.0
0.0
0.0
0.0
0.0
0.0
0.0
0.0
..—
....
0.0
0.0
Pri
ma
ry P
lac
e o
f E
mp
loy
me
nt
(%)
2.7
3.0
4.0
53.2
‡1.
01.
90.
00.
61.
20.
10.
71.
80.
00.
00.
00.
00.
00.
80.
00.
00.
01.
62.
02.
34.
30.
60.
90.
91.
01.
10.
0—
0.0
0.0
0.0
0.0
Pri
ma
ry A
rea
of
Pra
cti
ce
(%
)20
.6‡
21.5
‡25
.4‡
66.8
‡1.
75.
67.
69.
89.
75.
42.
90.
40.
03.
03.
81.
94.
94.
70.
10.
00.
03.
01.
32.
013
.412
.811
.05.
22.
01.
4..
—11
.40.
00.
00.
0P
rim
ary
Fu
ll-T
ime
/Pa
rt-T
ime
S
tatu
s (
%)
3.2
3.4
3.7
68.3
‡1.
68.
10.
80.
00.
10.
00.
00.
00.
20.
60.
40.
52.
84.
44.
00.
00.
02.
41.
51.
399
.9‡
16.3
‡12
.75.
92.
63.
00.
0—
0.0
0.0
0.0
0.0
Pri
ma
ry E
mp
loy
me
nt
Ca
teg
ory
(%
)34
.1‡
34.6
‡57
.3‡
46.2
‡1.
60.
40.
00.
00.
00.
01.
92.
30.
00.
00.
00.
00.
03.
90.
30.
00.
02.
51.
41.
313
.016
.113
.06.
13.
34.
80.
0—
0.0
0.0
0.0
0.0
Pri
ma
ry C
lien
t A
ge
Ra
ng
e (
%)
8.5
9.2
14.4
68.5
‡1.
74.
88.
011
.411
.55.
73.
30.
40.
01.
11.
10.
22.
92.
30.
10.
00.
02.
60.
71.
613
.316
.714
.78.
95.
34.
7..
—11
.40.
00.
00.
0P
rim
ary
Em
plo
ym
en
t S
ec
tor
(%)
7.1
7.9
8.7
73.6
‡16
.23.
70.
81.
41.
90.
12.
23.
20.
056
.8‡
57.2
‡3.
610
.610
.60.
81.
00.
71.
85.
52.
84.
62.
14.
05.
37.
28.
4..
—0.
00.
00.
00.
0A
nn
ua
l Ho
urs
of
Wo
rk (
%)
30.6
30.6
8.2
6.1
7.0
2.3
..10
.45.
65.
34.
31.
70.
08.
35.
31.
20.
20.
73.
20.
00.
00.
03.
80.
00.
00.
00.
00.
02.
80.
0..
—5.
70.
00.
00.
0C
an
ad
ian
Off
icia
l La
ng
ua
ge
of
Se
rvic
e (
%)
0.1
0.1
0.5
0.5
0.7
0.0
0.0
0.0
0.0
0.0
0.0
0.0
0.0
0.0
0.0
0.0
0.0
0.0
0.0
0.0
0.0
0.0
0.0
0.0
0.0
0.0
0.0
0.0
0.0
0.0
..—
....
11.8
2.9
Oth
er
La
ng
ua
ge
of
Se
rvic
e 1
(%
)0.
00.
00.
085
.00.
00.
00.
00.
00.
00.
00.
00.
00.
00.
00.
00.
00.
00.
00.
00.
00.
00.
00.
00.
03.
94.
10.
80.
90.
00.
0..
—..
..0.
00.
0U
rba
n V
ers
us
Ru
ral (
%)
(Ba
se
d o
n P
os
tal C
od
e o
f P
rim
ary
Em
plo
ym
en
t)
1.0
1.0
0.7
1.9
0.2
0.3
0.5
0.3
1.6
2.1
2.1
0.1
0.6
12.6
3.8
3.6
4.7
1.8
0.9
2.6
4.0
5.3
5.4
0.0
5.2
5.2
5.2
5.7
5.6
0.1
3.3
—0.
00.
00.
00.
0
Ont
.M
an.
Pro
vin
ce
/Te
rrit
ory
of
Re
gis
tra
tio
nS
ask.
Alta
.B
.C.
Y.T.
8
9
Physiotherapist Workforce, 2012—Methodology Guide
Data Limitations Data collected for the PTDB does not include the following:
For 2007 to 2009, the Nova Scotia College of Physiotherapists was not able to provide record-level data for Nova Scotia.
For 2007 to 2012, data was not available for the Northwest Territories and Nunavut, as there were no territorial licensing bodies in these territories at the time.
For 2008 only, the Yukon government was unable to participate in the PTDB.
Physiotherapists who registered with a participating provincial regulatory authority or territorial government authority after September 1 of the registration year are not included.
Physiotherapists with an inactive registration type are not included.
Key Concepts and Definitions A complete list of data elements and definitions is available in the Physiotherapist Database Manual at www.cihi.ca/hhr.
Physiotherapist Workforce, 2012—Methodology Guide
10
Analytical Methods Urban/Rural Statistics For analytical purposes, urban areas are defined (in part) as communities with populations that are greater than 10,000 people and are labelled by Statistics Canada as either a census metropolitan area (CMA) or a census agglomeration (CA). Rural/remote is equated with those communities outside the CMA/CA boundaries and is referred to as rural and small town (RST) by Statistics Canada. RST communities are further subdivided by identifying the degree to which they are influenced, in terms of social and economic integration, by larger urban centres. Metropolitan influenced zone (MIZ) categories disaggregate the RST population into four subgroups: strong, moderate, weak and none. These urban/rural/remote categories are applied to those communities (cities, town, villages) that can be equated with the Statistics Canada designation census subdivision (CSD).
For the purpose of the PTDB, the CMA/CA and MIZ categories were collapsed and may be interpreted in the following simple manner:
CMA/CA = large urban centre (urban).
Strong/moderate MIZ = small towns and rural areas located relatively close to larger urban centres (rural).
Weak/no MIZ = small towns and rural and remote communities distant from large urban centres (remote).
Details of the RST and MIZ classification schemes can be found in McNiven, et al.,1 du Plessis, et al.2 and CIHI.3
Missing Values in Urban/Rural Statistics
Missing values listed in the urban/rural statistics signify a sum of not in PCCF and unknown responses. For example, where the data provider has not submitted a postal code for a registrant, then it is coded as unknown. If the data provider has submitted a postal code for a registrant but it does not match the PCCF, then it is coded as not in PCCF.
11
Physiotherapist Workforce, 2012—Methodology Guide
Methodological and Historical Revisions
Methodological and historical changes to the data make it difficult to compare data across time. CIHI and the regulatory authorities continually strive to improve data quality; therefore, the following information must be taken into consideration when making historical comparisons and consulting previous CIHI publications. In all cases, comparisons should be made with caution and in consideration of the historical and methodological changes made.
Supply For 2007, the number of physiotherapists increased slightly due to enhancements made to
the methodology for secondary registrations.
For 2010, the number of physiotherapists in Ontario classified as on leave increased from 22 (0.3%) in 2009 to 792 (11.7%) in 2010. For 2011, the number of physiotherapists in Ontario classified as on leave decreased from 792 (11.7%) in 2010 to 371 (5.3%) in 2011, but the number of physiotherapists classified as unknown increased from 62 (0.9%) to 211 (3.0%). For 2012, the number of physiotherapists in Ontario classified as on leave decreased again from 371 (5.3%) in 2011 to 185 (2.5%) in 2012, but the number of physiotherapists classified as unknown increased from 211 (3.0%) to 296 (4.1%). According to the College of Physiotherapists of Ontario, these changes are the result of enhancements made to its data collection process that allows more precise reporting.
Demographics Year of Birth
Manitoba—The College of Physiotherapists of Manitoba (CPTM) does not provide record-level information on birth year; however, aggregate data was provided by Manitoba Health (2007 to 2012).
Nova Scotia—Aggregate data for Nova Scotia was provided by the Nova Scotia College of Physiotherapists (NSCP) for 2007 to 2009.
Gender
Manitoba—The CPTM does not provide record-level information on gender; however, aggregate data was provided by Manitoba Health (2007 to 2012).
Nova Scotia—Aggregate data for Nova Scotia was provided by the NSCP for 2007 to 2009. For 2007 and 2008, totals for Gender include out-of-province and non-practising registrants, as defined by the NSCP. For 2009, totals for Gender exclude inactive and non-practising registration types, as defined by the NSCP.

Physiotherapist Workforce, 2012—Methodology Guide
12
Education
Highest Level of Education in Physiotherapy
Quebec—Level of Post-Basic Education in Physiotherapy data was not available from the Ordre professionnel de la physiothérapie du Québec; therefore, Highest Level of Education for Quebec is based on Level of Basic Education in Physiotherapy only.
Ontario—Level of Post-Basic Education in Physiotherapy data was not available from the College of Physiotherapists of Ontario for 2007 to 2009; therefore, Highest Level of Education for Ontario is based on Level of Basic Education in Physiotherapy only for 2007 to 2009.
Yukon—Level of Post-Basic Education in Physiotherapy data was not available from the Yukon government for 2007; therefore, Highest Level of Education for Yukon is based on Level of Basic Education in Physiotherapy only for 2007.
Nova Scotia—Excluded for 2007 and 2008. Aggregate data provided by the NSCP for 2009.
Nova Scotia—Level of Post-Basic Education in Physiotherapy data was not available from the Nova Scotia College of Physiotherapists for 2010 to 2012; therefore, Highest Level of Education for Nova Scotia is based on Level of Basic Education in Physiotherapy only for these years.
Year of Graduation for Basic Education in Physiotherapy
Nova Scotia—Excluded for 2007 and 2008. Aggregate data provided by the NSCP for 2009.
Country of Graduation for Basic Education in Physiotherapy
Nova Scotia—Aggregate data provided by the NSCP for 2009.
Employment
Employment Status—On Leave
While the 2012 PTDB includes those physiotherapists who are employed in physiotherapy but on leave, business processes vary between data providers in terms of the range of data collected and options for registration types.
The on-leave portion of the physiotherapist workforce was not available from Quebec or Nova Scotia.
Number of Employers
Nova Scotia—Data on only one employment was available for 2010 to 2012.
Canadian Official Languages—Ability to Provide Service
Nova Scotia—Aggregate data provided by the NSCP for 2009.

13
Physiotherapist Workforce, 2012—Methodology Guide
References 1. McNiven C, Puderer H, Janes D. Census Metropolitan Area and Census Agglomeration
Influenced Zones (MIZ): A Description of the Methodology. Ottawa, ON: Statistics Canada; 2000. http://www.statcan.gc.ca. Accessed fall 2009. 92F0138MIE.
2. Du Plessis V, et al. Definitions of rural. Rural and Small Town Canada Analysis Bulletin. 2001;3(3). http://www.statcan.gc.ca. Accessed fall 2009. 21-006-XIE.
3. Canadian Institute for Health Information. Supply and Distribution of Registered Nurses in Rural and Small Town Canada. Ottawa, ON: CIHI; 2002. http://www.cihi.ca. Accessed fall 2009.


Production of this report is made possible by financial contributions from Health Canada and provincial and territorial governments. The views expressed herein do not necessarily represent the views of Health Canada or any provincial or territorial government.
All rights reserved.
The contents of this publication may be reproduced unaltered, in whole or in part and by any means, solely for non-commercial purposes, provided that the Canadian Institute for Health Information is properly and fully acknowledged as the copyright owner. Any reproduction or use of this publication or its contents for any commercial purpose requires the prior written authorization of the Canadian Institute for Health Information. Reproduction or use that suggests endorsement by, or affiliation with, the Canadian Institute for Health Information is prohibited.
For permission or information, please contact CIHI:
Canadian Institute for Health Information495 Richmond Road, Suite 600Ottawa, Ontario K2A 4H6
Phone: 613-241-7860Fax: [email protected]
ISBN 978-1-77109-236-4 (PDF)
© 2013 Canadian Institute for Health Information
How to cite this document:Canadian Institute for Health Information. Physiotherapist Workforce, 2012—Methodology Guide. Ottawa, ON: CIHI; 2013.
Cette publication est aussi disponible en français sous le titre Les physiothérapeutes 2012 — guide méthodologique.ISBN 978-1-77109-237-1 (PDF)
www.cihi.caAt the heart of data
Talk to UsCIHI Ottawa 495 Richmond Road, Suite 600 Ottawa, Ontario K2A 4H6 Phone: 613-241-7860
CIHI Toronto 4110 Yonge Street, Suite 300 Toronto, Ontario M2P 2B7 Phone: 416-481-2002
CIHI Victoria 880 Douglas Street, Suite 600 Victoria, British Columbia V8W 2B7 Phone: 250-220-4100
CIHI Montréal 1010 Sherbrooke Street West, Suite 300 Montréal, Quebec H3A 2R7 Phone: 514-842-2226
CIHI St. John’s 140 Water Street, Suite 701 St. John’s, Newfoundland and Labrador A1C 6H6 Phone: 709-576-7006