physico-chemical characterization of calcium strontium tartrate crystals
TRANSCRIPT
1. Phys. Chem Solids Vol58. No. IO. pp. 1599-1602, 1997
PIk 5002~3697@7)00113-3 Printed in Gna( Brimin. All rights reserved 0022-3697191 Sl7.00 + 0.00
PHYSICO-CHEMICAL CHARACTERIZATION OF CALCIUM STRONTIUM
TARTRATE CRYSTALS
K. SURYANARAYANA and S.M. DHARMAPRAKASH Department of Physics, Mangalore University, Mangalagangotri 574199, Karnataka, India
(Received 29 August 1996; accepted 24 February 1997)
Abstract-Mixed single crystals of calcium strontium tartrate (CST) of high optical quality and morphological perfection have been grown from light irradiated sodium meta silicate gel medium at ambient temperature. The results obtained on characterization of CST crystals using EDX, chemical analysis, X-ray diffraction and i&a-red spectral techniques are reported. A thermogravimetric study is carried out in order to study the kinetic parameters and associated mechanism of dehydration process. The two dimensional diffusion mechanism is suggested for the solid state nonisothermal dehydration step in CST crystals. The CST crystals turn out to be a tetrahydrate and the crystals are thermally unstable. The chemical composition was thus established as Ca&,,.&H406.4HZ0. 0 1997 Elsevier Science Ltd.
Keywords: calcium strontium tartrate, single crystals, characterization, thermal dehydration
1. INTRODUCTION
Single crystals of calcium strontium tartrate (CST) and strontium tartrate (ST) exhibit ferroelectric, nonlinear optical and spectra1 characteristics [l-4]. The CT and ST form their solid solution Cal_xSr$4H406.H20 (x =
0.1,0.2,..., 0.9) [5]. In the course of our investigations on the physical properties of (Y and ST our attention was drawn to the physic0 chemical behaviour of CST. This work has been undertaken to study the structural role of lattice water in the stability and properties of CST crystals. The present paper reports the physico-chemical properties of CST crystals by energy dispersive analysis of X-rays (EDX) and chemical analyses, X-ray diffraction (XRD) and infra-red (IR) spectra and by its thermal behaviour.
2. EXPERIMENTAL
2.1. Crystal growth
CST crystals were grown by controlled reaction mechanism in light irradiated sodium meta silicate gel at room temperature. The growth process involved the diffusion of calcium chloride (1 - x) and strontium chloride (x), where x = 0.1, 0.2 ,..., 0.9 solutions into a gel in which (L + ) tartaric acid was impregnated before hand. The chemicals used were of CDH AnalaR grade. Single crystals with high morphological perfection and transparency resulted for x = 0.5. The grown CST crystals were of the size of 10 X 6 X 4 mm3.
2.2. Physico-chemical measurements
The X-ray powder diffraction pattern of CST crystals was obtained using a Philips X-ray diffractometer with
Ni-filtered CuK, radiation (X = 1.5418 A). The IR absorption spectra of CST crystals were recorded on a Perkin Elmer 983 IR spectrometer in the range 4000- 400 cm-‘. A STA 1500 (Pohjmer Lab) thermal analyser was employed to obtain thermogravimetric (TG) and differential thermal analyser (DTA) traces of CST crys- tals. All measurements were carried out in a static air atmosphere with a heating rate of 10°C min-‘. The contents of calcium, strontium, carbon and hydrogen in CST crystals were determined by subjecting the crystals to conventional physical and chemical methods.
3. RESULTS AND DISCUSSION
3.1. Chemical analysis
The composition of CST crystals was established from gravimetric, EDX and carbon-hydrogen analyses. The results of the chemical analyses, given in Table 1, suggest the material to be tetrahydrate. The composition of the material is thus established as Cao.5Sr,&4H40&H20. The presence of four water molecules in the CST lattice is
further supported by the thermogravimetric analysis.
3.2. X-ray diffraction analyses
The experimental powder X-ray diffraction data for CST crystals are given in Table 2. It is observed from the powder data that ‘d’ and III0 data for CST crystal are different from ‘d’ and I/IO data for their parent components [6,7].
3.3. Infra-red absorption spectra
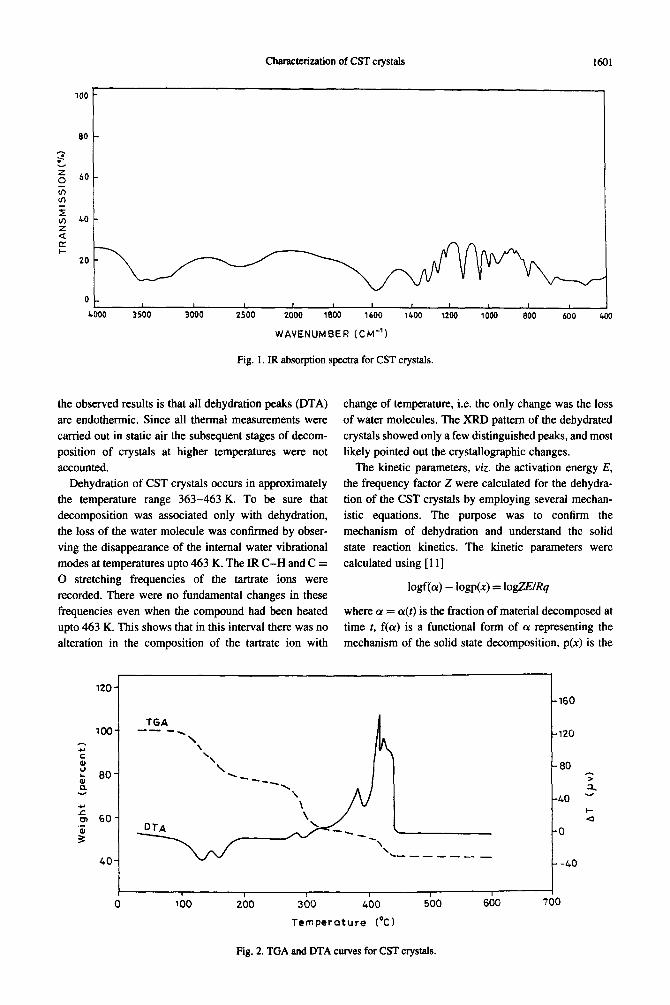
The IR absorption spectrum for CST crystals shown in Fig. 1. The results obtained from the IR spectrum are summarised in Table 3. The absorption bands in the
1599
1600 K. SURYANARAYANA and S. M. DHARMAPRAKASH
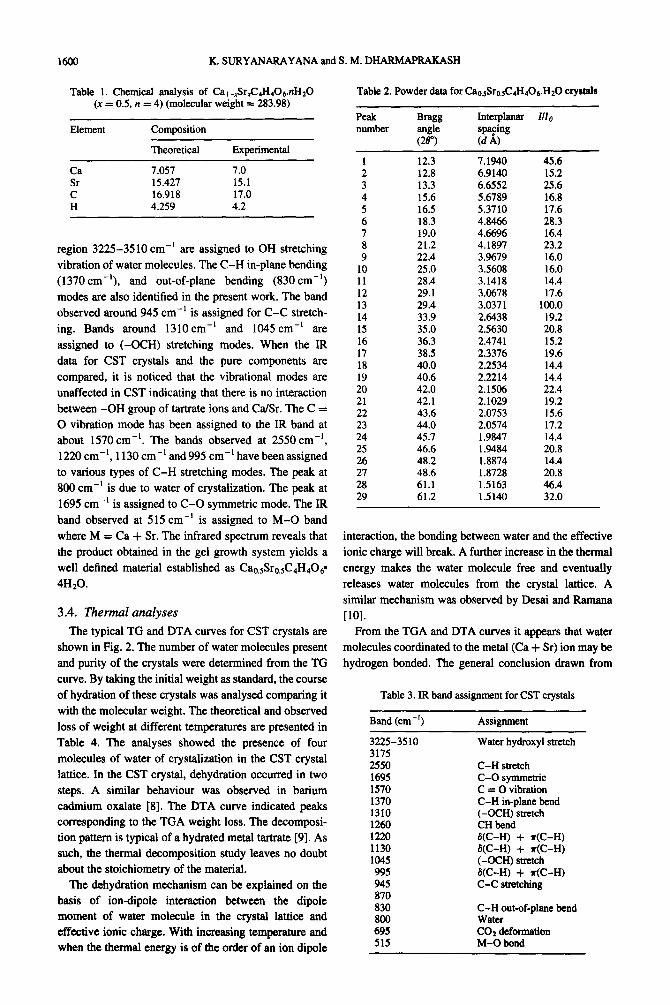
Table 1. Chemical analysis of Car_Sr&H.+Os.nHzO (x = 0.5, n = 4) (molecular weight = 283.98)
Element
Ca Sr C H
Composition
Theoretical
7.057 15.427 16.918 4.259
Experimental
7.0 15.1 17.0 4.2
region 3225-3510 cm-’ are assigned to OH stretching vibration of water molecules. The C-H in-plane bending (1370 cm-‘), and out-of-plane bending (830 cm-‘)
modes are also identified in the present work. The band observed around 945 cm-’ is assigned for C-C stretch-
ing. Bands around 1310 cm-’ and 1045 cm-’ are assigned to (-GCH) stretching modes. When the IR data for CST crystals and the pure components are compared, it is noticed that the vibrational modes are unaffected in CST indicating that there is no interaction between -OH group of tartrate ions and Ca/Sr. The C = 0 vibration mode has been assigned to the IR band at about 1570 cm-‘. The bands observed at 2550cm-‘, 1220cm-‘, 1130cm-‘and995 cm-‘havebeenassigned to various types of C-H stretching modes. The peak at 800 cm-’ is due to water of crystalization. The peak at
1695 cm-’ is assigned to C-O symmetric mode. The IR band observed at 515 cm-’ is assigned to M-O band where M = Ca + Sr. The infrared spectrum reveals that the product obtained in the gel growth system yields a well defined material established as Ca,&ir0,~C4H~06* 4HrO.
3.4. Thermal analyses
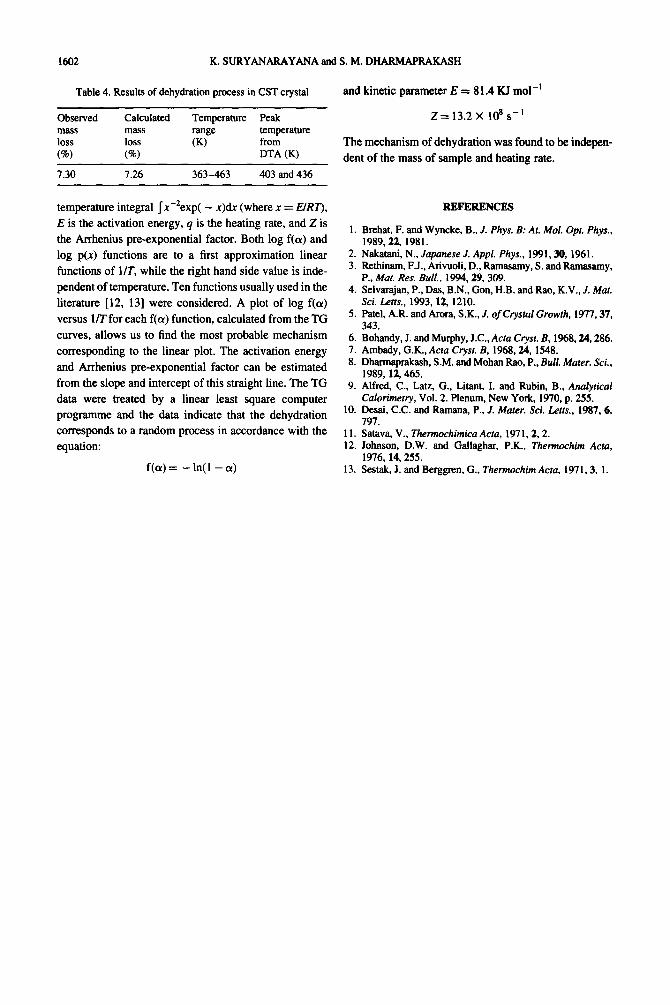
The typical TG and DTA curves for CST crystals are shown in Fig. 2. The number of water molecules present and purity of the crystals were determined from the TG curve. By taking the initial weight as standard, the course of hydration of these crystals was analysed comparing it with the molecular weight. The theoretical and observed loss of weight at different temperatures are presented in Table 4. The analyses showed the presence of four molecules of water of crystalization in the CST crystal lattice. In the CST crystal, dehydration occurred in two steps. A similar behaviour was observed in barium cadmium oxalate [8]. The DTA curve indicated peaks corresponding to the TGA weight loss. The decomposi- tion pattern is typical of a hydrated metal tartrate [9]. As such, the thermal decomposition study leaves no doubt about the stoichiometry of the material.
The dehydration mechanism can be explained on the basis of ion-dipole interaction between the dipole moment of water molecule in the crystal lattice and effective ionic charge. With increasing temperature and when the thermal energy is of the order of an ion dipole
Table 2. Powder data for Cao.sSro.sC,H~OOs.H~O crystals
Peak number
BmSg Interplanar I/lo angle (28”)
spa$ng (d A)
1 2 3 4 5 6 7 8 9
10 11 12 13 14 15 16 17 18 19 20 21 22 23 24 25 26 27 28 29
12.3 12.8 13.3 15.6 16.5 18.3 19.0 21.2 22.4 25.0 28.4 29.1 29.4 33.9 35.0 36.3 38.5 40.0 40.6 42.0 42.1 43.6 44.0 2.0574 45.7 1.9847 46.6 48.2 48.6 61.1 61.2
7.1940 6.9140 6.6552 5.6789 5.3710 4.8466 4.6696 4.1897 3.9679 3.5608 3.1418 3.0678 3.0371 2.6438 2.5630 2.4741 2.3376 2.2534 2.2214 2.1506 2.1029 2.0753
1.9484 1.8874 1.8728 1.5163 1.5140
45.6 15.2 25.6 16.8 17.6 28.3 16.4 23.2 16.0 16.0 14.4 17.6
100.0 19.2 20.8 15.2 19.6 14.4 14.4 22.4 19.2 15.6 17.2 14.4 20.8 14.4 20.8 46.4 32.0
interaction, the bonding between water and the effective ionic charge will break. A further increase in the thermal energy makes the water molecule free and eventually releases water molecules from the crystal lattice. A similar mechanism was observed by Desai and Ramana
WI. From the TGA and DTA curves it appears that water
molecules coordinated to the metal (Ca + Sr) ion may be hydrogen bonded. The general conclusion drawn from
Table 3. IR band assignment for CST crystals
Band (cm-‘)
3225-3510 3175 2550 1695 1570 1370 1310 1260 1220 1130 1045 995 945 870 830 800 695 515
Assignment
Water hydroxyl stretch
C-H stretch c-o symmetric C = 0 vibration C-H in-plane bend (-OCH) stretch CH bend &C-H) + *(C-H) &C-H) + *(C-H) (-OCH) stretch NC-H) + r(C-H) C-C stretching
C-H out-of-plane bend Water CO2 deformation M-O bond
Characterization of CST crystals 1601
60
0 ! I I I I I I I t
coo0 3500 3000 2500 2000 1800 lb00 1 coo 1200 1000 800 600
WAVENUMBER (CM-‘)
Fig. 1. IR absorption spectra for CST crystals.
the observed results is that all dehydration peaks (DTA) are endothermic. Since all thermal measurements were carried out in static air the subsequent stages of decom- position of crystals at higher temperatures were not accounted.
Dehydration of CST crystals occurs in approximately the temperature range 363-463 K. To be sure that decomposition was associated only with dehydration, the loss of the water molecule was confirmed by obser- ving the disappearance of the internal water vibrational modes at temperatures upto 463 K. The IR C-H and C = 0 stretching frequencies of the tartrate ions were recorded. There were no fundamental changes in these
change of temperature, i.e. the only change was the loss of water molecules. The XRD pattern of the dehydrated crystals showed only a few distinguished peaks, and most likely pointed out the crystallographic changes.
The kinetic parameters, viz. the activation energy E, the frequency factor 2 were calculated for the dehydra- tion of the CST crystals by employing several mechan- istic equations. The purpose was to confirm the mechanism of dehydration and understand the solid state reaction kinetics. The kinetic parameters were calculated using [ 1 l]
lo@(o) - logp(x) = logZE/Rq
frequencies even when the compound had been heated where (Y = o(r) is the fraction of material decomposed at upto 463 K. This shows that in this interval there was no time r, f(cr) is a functional form of u representing the alteration in the composition of the tartrate ion with mechanism of the solid state decomposition, p(x) is the
TGA -- -.
OTA
100 200 300 400 500 600 i
Temperature (‘C)
‘OC
160
120
80 ‘; a
40 - I- a
0
-40
1
Fig. 2. TGA and DTA curves for CST crystals.
1602 K. SURYANARAYANA and S. M. DHARMAPRAKASH
Table 4. Results of dehydration process in CST crystal
Observed mass loss (S)
7.30
Calculated lMSS
loss (%)
7.26
Temperature Peak range temperature (K) from
DTA (K)
363-463 403 and 436
and kinetic parameter E = 8 1.4 KJ mol -’
2=13.2X loss-
The mechanism of dehydration was found to be indepen- dent of the mass of sample and heating rate.
temperature integral Ix-*exp( - x)dx (where x = EIRT),
E is the activation energy, q is the heating rate, and 2 is the Arrhenius pre-exponential factor. Both log f(ar) and log p(x) functions are to a first approximation linear functions of l/T, while the right hand side value is inde- pendent of temperature. Ten functions usually used in the literature [12, 131 were considered. A plot of log f(cr) versus l/Tfor each f(ol) function, calculated from the TG
curves, allows us to find the most probable mechanism corresponding to the linear plot. The activation energy and Arrhenius pre-exponential factor can be estimated from the slope and intercept of this straight line. The TG data were treated by a linear least square computer programme and the data indicate that the dehydration corresponds to a random process in accordance with the equation:
REFERENCES
1. Brehat, F. and Wyncke, B., J. Phys. B: At. Mol. Opt. Phys., 1989.22, 1981.
2. Nakatani, N., Japanese J. Appf. Phys., 1991.30, 1961. 3. Rethinam, F.J., Arivuoli, D., Ramasamy, S. and Ramasamy,
P., Mar. Res. Bull., 1994, 29, 309. 4. Selvarajan, P., Das, B.N., Gon, H.B. and Rao, K.V., J. Mat.
sci. L.&s., 1993,12, 1210. 5. Patel, A.R. and Arora, S.K., J. ofcrystal Growth, 1977.37,
343. 6. Bohandy, J. and Murphy, J.C., Acta Crysr. B, 1968,24,286. 7. Ambady, G.K., Acta Cryst. B, 1968,24, 1548. 8. Dharmaprakash, S.M. and Mohan Rao, P., Bull. Mater. Sci.,
1989,12,46X 9. Alfred, C., Latz, G., Litant, I. and Rubin, B., Analytical
Calorimetry, Vol. 2. Plenum, New York, 1970, p. 255. 10. De&, C.C. and Ramana, P., J. Mater. Sci. Lens., 1987,6,
797. 11. Satava, V., Thermochimica Acta, 1971.2.2. 12. Johnson, D.W. and Gallaghar, P.K., Thermochim Ada,
1976,14,255. f(ar) = - ln( 1 - ar) 13. Sestak, J. and Berggren, G., Thermochim Acta, 1971.3, 1.