physical properties of particles and their implications ...etheses.bham.ac.uk/6911/1/vu16phd.pdf ·...
TRANSCRIPT
PHYSICAL PROPERTIES OF PARTICLES
AND THEIR IMPLICATIONS FOR THE
CALCULATION OF THE HUMAN
REGIONAL LUNG DOSE
By
VAN TUAN VU
A thesis submitted to the University of Birmingham for the degree of
DOCTOR OF PHILOSPHY
Division of Environmental Health and Risk Management
School of Geography, Earth and Environmental Sciences
University of Birmingham
University of Birmingham Research Archive
e-theses repository This unpublished thesis/dissertation is copyright of the author and/or third parties. The intellectual property rights of the author or third parties in respect of this work are as defined by The Copyright Designs and Patents Act 1988 or as modified by any successor legislation. Any use made of information contained in this thesis/dissertation must be in accordance with that legislation and must be properly acknowledged. Further distribution or reproduction in any format is prohibited without the permission of the copyright holder.
ABSTRACT
Ambient particles are of high concern due to their effects on both human health and climate
change. This study aims to investigate the physical properties of particles and their
implications for source apportionment and health human exposure studies. A wide range of
particle number size distribution (PNSD) measurements was conducted in selected
environments using state-of-the-art high time resolution instruments. It is found that PNSD
varied in different environments, depending on emission sources and atmospheric processes.
A mass balance model was used to predict the penetration, infiltration factors, deposition and
loss rates of indoor particles. The loss rates of indoor particles, which are mainly subject to
deposition, coagulation and evaporation, were found to be a function of particle size and
time. This study successfully predicted the concentration of indoor particles from outdoor
datasets based on an enhanced mass balance model with consideration of the change in loss
rate by time.
Moreover, HTDMA measurements were performed to study the hygroscopic properties of
particles in outdoor and indoor environments, and from five major indoor sources. The
particles emitted from indoor sources were mostly hydrophobic. An enhanced lung deposition
model based on the ICRP and MPPD models was developed to predict the deposition fraction
of particles in the human respiratory tract, with consideration of their hygroscopicity.
Furthermore, this work utilizes PNSD datasets to apportion the sources of particles by
number, surface area and volume using a Positive Matrix Factorization (PMF) model. A
combination of lung deposition models and the PMF technique was applied to identify which
sources are mostly responsible for deposited particles in the different regions of lung.

To my beloved wife, Anh L.M Tran,
who accompanies me wholeheartedly in this journey.
To my beloved parents, Tuoi T. Nguyen and Tuan D. Vu,
who always encourage me to pursue my passion.

ACKNOWLEDGEMENTS
First and foremost, I would like to express my deepest gratitude to my first supervisor,
Professor Roy M. Harrison, who has helped my childhood dream to be true by giving me a
fascinating opportunity to work and learn in a very professional environment. I am
particularly indebted to him for his intellectual guidance, kindness, and solicitude over the
last three years. His invaluable advices have greatly impacted the quality of this thesis.
I am also very grateful to Dr Juana Mari Delgado-Saborit, my second supervisor, for her
guidance and encouragement. She has been very kind and always willing to spend her
precious time in providing me not only with scientific assistance but also mental support.
Special thanks go to Dr Ždímal Vladimír, Dr Jakub Ondráček and other colleagues for their
great support at the Institute of Chemical Process Fundamentals (ICPF), Czech Republic,
where I spent a wonderful summer during my secondment.
I would like to acknowledge the wonderful financial support provided by the European Union
through Human Exposure to Aerosol Contaminants in Modern Microenvironments
(HEXACOMM) Marie Curie -ITN project.
I also appreciate other colleagues at the Norwegian Institute for Air Research (NILU) and the
Spanish National Research Council (CSIC) for their support during my short research visits
there. Thanks to my friends in the HEXACOMM team, we had a lot of fun during the
training and conference.
I would like to thank Dr. David Beddows, Dr. Mauro Masiol, Dr. Stefano Zauli Sajani and
Dr.Irina Nikolova, who provided me with useful material and academic advice. My warmest
thanks to Mrs. Mary Harding, who has been very kind and help me to deal with the massive
paperwork. To Carmela, Pallavi, Eunhwa, Paul, Suad and my friends in PH and GEES, thank
you all for your invaluable help.
TABLE OF CONTENTS
LIST OF FIGURES .................................................................................................................. i
LIST OF TABLES .................................................................................................................. vi
LIST OF ABBREVIATIONS ............................................................................................. viii
Chapter 1: INTRODUCTION ................................................................................................ 1
1.1. Background of ambient aerosols ................................................................................. 1
1.2. Health effects of ambient particles .............................................................................. 2
1.3. Literature review of respiratory exposure-dose analysis for inhaled submicron
aerosols ................................................................................................................................... 3
1.3.1. Introduction .......................................................................................................... 3
1.3.2. Factors controlling the lung dose of particles ...................................................... 5
1.4. Lung deposition models ............................................................................................ 13
1.5. Summary of lung dose studies .................................................................................. 14
1.6. Goals of this PhD study ............................................................................................. 15
1.7. Thesis outline ............................................................................................................ 16
Chapter 2: METHODOLOGY ............................................................................................. 19
2.1. Real time measurement instruments ......................................................................... 19
2.1.1. Scanning Mobility Particle Size Spectrometer (SMPS) .................................... 19
2.1.2. Fast Mobility Sizers (EEPS and FMPS) ............................................................ 22
2.1.3. Aerodynamic Particle Sizer (APS) .................................................................... 24
2.1.4. Hygroscopic Tandem Differential Mobility Analyser (HTDMA)..................... 26
2.2. Lung deposition models ............................................................................................ 27
2.2.1. International Commission on Radiological Protection (ICRP) model .............. 27
2.2.2. Multiple Path Particle Dosimetry (MPPD) model ............................................. 31
2.2.3. Comparison of the ICRP and MPPD models ..................................................... 32
2.3. Source apportionment model (PMF model) .............................................................. 35
2.4. Data handling ............................................................................................................ 37
Chapter 3: AN INVESTIGATION INTO THE PARTICLE SIZE DISTRIBUTION
COLLECTED FROM AN AUTOMOTIVE BRAKE CALIPER TEST RIG ................. 38
3.1. Introduction ............................................................................................................... 39
3.2. Experimental design and instruments ....................................................................... 40
3.3. Results ....................................................................................................................... 42
3.3.1. Particle number, surface and mass concentrations ............................................ 42
3.3.2. Evolution of number submicron particle size distribution ................................. 49
3.3.3. Particle volume (mass) size distribution ............................................................ 52
3.4. Conclusion ................................................................................................................. 54
Chapter 4: INDOOR/OUTDOOR MODELLING OF SUBMICRON PARTICLES IN A
HOUSE HEAVILY AFFECTED BY ROAD TRAFFIC EMISSIONS ............................ 55
4.1. Introduction ............................................................................................................... 56
4.2. Methodology ............................................................................................................. 57
4.2.1. Instruments and sampling site ............................................................................ 57
4.2.2. Data preparation ................................................................................................. 58
4.2.3. Indoor mass balance model ................................................................................ 59
4.2.4. Coagulation Model............................................................................................. 61
4.3. Result and Discussion ............................................................................................... 64
4.3.1. Indoor/outdoor (I/O) ratios ................................................................................ 64
4.3.2. Effect of coagulation on the loss/production of indoor particles ....................... 68
4.3.3. Prediction of the penetration factor, deposition rate, and infiltration factor using
a mass balance model ....................................................................................................... 73
4.3.4. Modelling the indoor particles at a house affected by traffic emissions based on
an application of a mass balance model to the full dataset ............................................... 84
4.4. Conclusion ................................................................................................................. 86
Chapter 5: HYGROSCOPIC PROPERTIES OF PARTICLES AND THEIR
IMPLICATIONS FOR THE CALCULATION OF LUNG DEPOSITION FRACTION
.................................................................................................................................................. 90
5.1. Introduction ............................................................................................................... 91
5.2. Hygroscopic properties of aerosols emitted from different source ........................... 92
5.2.1. Traffic Emissions ............................................................................................... 92
5.2.2. Biomass Burning ................................................................................................ 95
5.2.3. Nucleation .......................................................................................................... 96
5.3. Hygroscopic behaviour of ambient aerosols ............................................................. 98
5.3.1. Spatial Variation ................................................................................................ 98
5.3.2. Temporal Variation .......................................................................................... 101
5.4. Effect of aerosol hygroscopic properties on calculation of lung deposition ........... 102
5.4.1. Lung Deposition Calculation for Ambient Submicron Aerosols ..................... 102
5.4.2. A modified ICRP model for ambient particles ................................................ 104
5.5. Application of a modified ICRP model to calculate the lung deposition fraction of
ambient aerosols ................................................................................................................. 114
5.5.1. Particle size distribution from traffic, urban background and rural areas in
London, UK .................................................................................................................... 114
5.5.2. Deposition fraction of particles in traffic, urban background and rural areas . 116
5.6. Conclusion ............................................................................................................... 119
Chapter 6: SOURCE APPORTIONMENT OF THE LUNG DOSE OF AMBIENT
SUBMICROMETRE PARTICULATE MATTER .......................................................... 121
6.1. Introduction ............................................................................................................. 122
6.2. Materials and Methods ............................................................................................ 123
6.2.1. Site Description and Data Measurement.......................................................... 123
6.2.2. Data Handling, PMF and ICRP Models .......................................................... 124
6.3. Results ..................................................................................................................... 126
6.3.1. Overview of Data ............................................................................................. 126
6.3.2. PMF Results ..................................................................................................... 127
6.3.3. Which Source is Most Responsible for Particles Deposited in the Human
Respiratory Tract? .......................................................................................................... 142
6.4. Conclusions ............................................................................................................. 147
Chapter 7: PHYSICAL PROPERTIES AND LUNG DEPOSITION OF PARTICLES
EMITTED FROM FIVE MAJOR INDOOR SOURCES ................................................ 148
7.1. Introduction ............................................................................................................. 149
7.2. Materials and Methods ............................................................................................ 150
7.2.1. Site Description and Data Measurement.......................................................... 150
7.2.2. Data Handling .................................................................................................. 152
7.2.3. Estimation of hygroscopic growth factors in regions of the lung .................... 153
7.2.4. Modelling Particle Deposition in the Human Respiratory System. ................. 154
7.3. Results and discussion ............................................................................................. 156
7.3.1. Particle Size Distributions................................................................................ 156
7.3.2. Hygroscopic Growth Factor of Particles.......................................................... 162
7.3.3. Effects of Particles from Indoor Sources on the Lung Dose of Particles ........ 167
7.3.4. Estimation of daily regional deposited dose: A case study .............................. 174
7.4. Conclusion ............................................................................................................... 180
CHAPTER 8: CONCLUSION............................................................................................ 181

8.1. Summary ................................................................................................................. 181
8.2. Conclusion ............................................................................................................... 184
8.3. Implications ............................................................................................................. 185
8.4. Limitations and Future directions ........................................................................... 186
LIST OF RESEARCH PAPERS AND PRESENTATIONS ............................................ 188
REFERENCES ..................................................................................................................... 191
i
LIST OF FIGURES
Chapter 1
Figure 1.1: Regional lung fraction of hydrophobic particles with different densities
calculated for a man sitting, using an ICPR model .................................................................. 9
Figure 1.2: The structure of this PhD thesis .......................................................................... 17
Chapter 2
Figure 2.1: Flow schematic of an electric classifier with a long DMA ................................ 21
Figure 2.2: Schematic of CPC model 3775 ......................................................................... 22
Figure 2.3: Flow and Data Inversion Schematic of EEPS/FMPS ......................................... 23
Figure 2.4: Operation of APS 3221 ...................................................................................... 25
Figure 2.5: H-TDMA schematic ........................................................................................... 26
Figure 2.6: Empirical representation of inhalability of particles and their deposition in the
respiratory tract during cyclic breathing by transport though a series of filters .................... 29
Figure 2.7: Regional lung deposition fraction of spherical particles with unit density for a
man under nasal sitting breathing conditions based on ICRP and MPPD models ................ 34
Chapter 3
Figure 3.1: Schematic diagram of the test system ................................................................ 41
Figure 3.2: Total particle number concentrations from EEPS, CPC and APS during 15
minutes braking period at 45 psi load .................................................................................... 43
Figure 3.3: Total particle surface area (A) and mass (B) concentrations from EEPS and APS
during 15 minutes braking period at 45 psi load.................................................................... 44
Figure 3.4: Submicron particle size distribution during the experiment period at 45 psi brake
load ......................................................................................................................................... 49
Figure 3.5: The effect of temperature on nucleation event .................................................. 51
ii
Figure 3.6: Number size distribution of coarse particles at 45 psi braking load ................. 52
Figure 3.7: Brake wear particle volume size distribution at 45 psi brake load .................... 53
Figure 3.8: Brake wear particle mass size distribution at 45 psi brake load ........................ 54
Chapter 4
Figure 4.1: Sampling site and experimental conditions ....................................................... 57
Figure 4.2: Coagulation kernel with consideration of Brownian motion and its convection
effects and the van der Waals/viscous force with the Hamaker constant of 200KBT ........... 63
Figure 4.3: I/O ratio as a function of particle diameter at different times ............................ 64
Figure 4.4: Comparison of the diurnal patterns of I/O ratios of a typical week and weekend
day ......................................................................................................................................... 66
Figure 4.5: I/O ratios in different wind speeds .................................................................... 67
Figure 4.6: I/O ratios in different wind directions ............................................................... 68
Figure 4.7: The evolution of PNSD due to coagulation only during a 20 minute period .... 69
Figure 4.8: Loss or production (%) of indoor particles due to coagulation only during a 20
minute period at different total number concentrations of particles ..................................... 71
Figure 4.9: Correlation between the loss or production of particles of a specific size and their
concentrations during 20 minutes ......................................................................................... 72
Figure 4.10: Particle penetration factor through the study system ...................................... 74
Figure 4.11: Dependence of RMSE and r upon penetration factor and deposition rate ...... 76
Figure 4.12: RMSE and r depend upon penetration and infiltration factors ....................... 78
Figure 4.13: Comparison between deposition rates estimated by the mass balance model and
Lai & Nazaroff’s model ........................................................................................................ 80
Figure 4.14: Correlation efficient (r) between modelled and observed data ....................... 80
Figure 4.15: Total loss rate (kloss) of indoor particles in different time periods .................. 82

iii
Figure 4.16: Correlation coefficient (r) between modelled and observed data in different time
periods ................................................................................................................................... 82
Figure 4.17: Outdoor/indoor particle number size distribution (PNSD) in different time
periods ................................................................................................................................... 83
Figure 4.18: Comparison of indoor modelling by two the approaches for 2 sampling
campaigns ............................................................................................................................. 85
Figure 4.19: Comparison between the indoor concentrations modelled by a mass balance
model and measured data for particles with diameters of 16, 26 and 39 nm ........................ 87
Figure 4.20: Comparison between the indoor concentration modelled by a mass balance
model and measured data for particles with diameters of 60, 93 and 143 nm ...................... 88
Figure 4.21: Comparison between the indoor concentrations modelled by a mass balance
model and measured data for particles with diameters of 220, 242 and 450 nm .................. 89
Chapter 5
Figure 5.1: The variation of the hygroscopic growth as function of time and size .......... 106
Figure 5.2: Estimated hygroscopic growth factors of nearly, less and more hygroscopic
particles at 99.5% RH from different environments .......................................................... 111
Figure 5.3: Calculations of deposition fraction in total lung of ambient particles in various
environments ...................................................................................................................... 113
Figure 5.4: Calculations of deposition fraction in regional lung of ambient particles in
various environments ......................................................................................................... 114
Figure 5.5: Size distribution by number, surface area and mass of submicron particle at
traffic (Marylebone), urban background (North Kensington) and rural (Harwell) sampling
sites .................................................................................................................................... 116
Figure 5.6: Regional Fraction of particles from different ambient environments ............ 117
iv
Chapter 6
Figure 6.1: Particle number/volume size distribution (A) and diurnal pattern of particles by
number in North Kensington, UK during 2012 ................................................................. 126
Figure 6.2: Q-value with different number of factors ....................................................... 127
Figure 6.3: Polar plot, particle size distribution and diurnal pattern of six resolved PMF
factors ................................................................................................................................. 130
Figure 6.4: Gridded and smoothed back trajectory concentrations showing mean factor 4,
factor 5, NH4+, SO4
2-, PM2.5 and PM10 concentrations using the Concentration Weighted
Trajectory approach ........................................................................................................... 133
Figure 6.5: Gridded and smoothed back trajectory concentrations showing mean 4 factor
contributions using the CWT approach ............................................................................. 135
Figure 6.6: Profiles and contribution of each factor from PMF with four factor solution.. 137
Figure 6.7: Comparison of the secondary aerosol and urban background from the PMF
solution of four and six factors .......................................................................................... 138
Figure 6.8: Seasonal polar plot of urban accumulation mode and mixed secondary aerosols
............................................................................................................................................. 139
Figure 6.9: Seasonal polar plot of local traffic, aged emission, inorganic secondary aerosols
and nucleation .................................................................................................................... 139
Figure 6.10: Correlations between the urban accumulation mode factor and CWOD ..... 140
Figure 6.11: Correlations between other factors and CWOD ........................................... 141
Figure 6.12: Correlation between each factor ................................................................... 142
Chapter 7
Figure 7.1: Plan view of the apartment ............................................................................. 151
Figure 7.2: Particle number size distribution from indoors (without indoor sources) and
outdoor environments and five major indoor sources ........................................................ 158
v
Figure 7.3: Hygroscopic growth factor probability density function (GF-PDF) for outdoor
(left) and indoor (right) particles ........................................................................................ 163
Figure 7.4: Hygroscopic growth factor of particles generated from different indoor
sources ................................................................................................................................ 164
Figure 7.5: Modelled hygroscopic growth factors at 99.5% RH and in the human respiratory
tract .................................................................................................................................... 166
Figure 7.6: Deposition fraction curve from MPPD model for man and woman in resting and
light exercise ...................................................................................................................... 167
Figure 7.7: Deposition fraction of particle number in regions of the lung for adults ....... 168
Figure 7.8: Minute lung dose rate, concentration and lung deposition efficiency of particles
after indoor activities ......................................................................................................... 172
Figure 7.9: Deposition fractions of particles in lung regions for a man and a woman in the
different exposure scenarios .............................................................................................. 177
Figure 7.10: Daily regional lung dose of particles by number for a man and a woman in case
of no indoor sources ........................................................................................................... 178
Figure 7.11: A comparison of averaged daily regional lung dose for adults between no indoor
source and with exposure to each indoor source for 10 minutes ....................................... 179
Chapter 8
Figure 8.1: Source apportionment of particles deposited in the human respiratory tract . 184
vi
LIST OF TABLES
Chapter 1
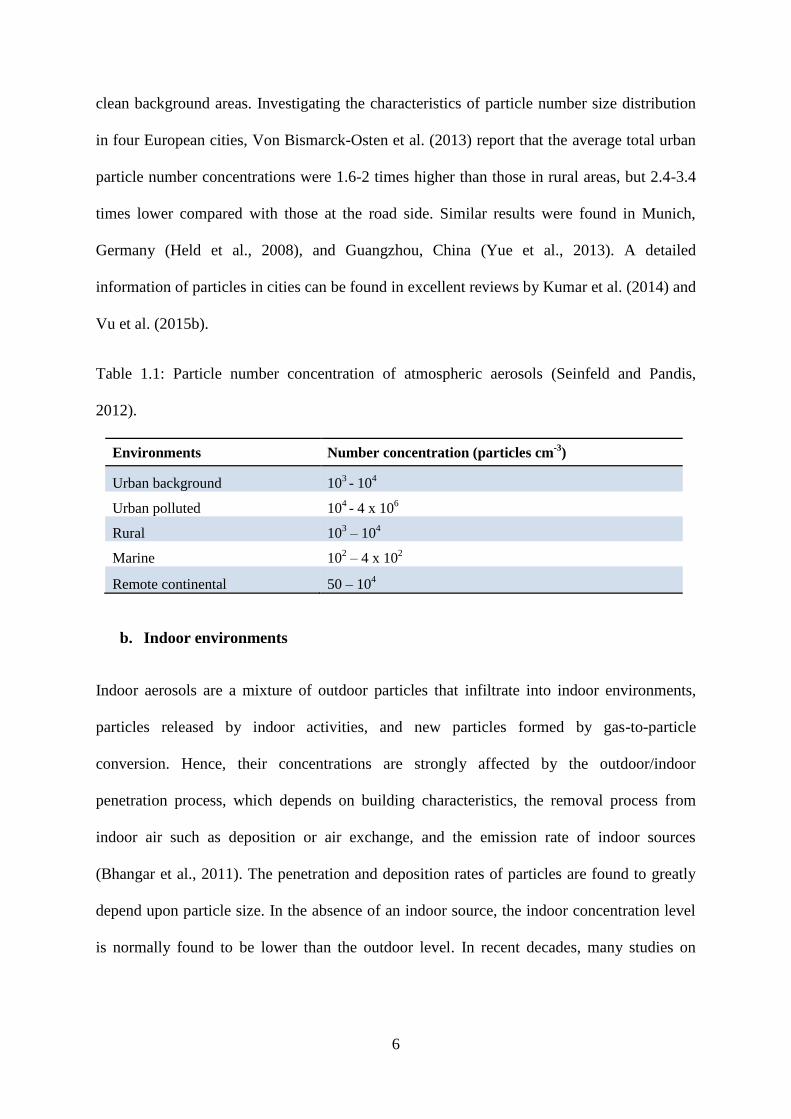
Table 1.1: Particle number concentration of atmospheric aerosols ........................................ 6
Table 1.2: Minute ventilation (L/min) for Caucasian people by ICRP (1994) ..................... 12
Table 1.3: Minute ventilation (L/min) for US people by EPA (1994).................................. 13
Chapter 2
Table 2.1: Recommended parameters for substitution in the ICRP model of regional
deposition due to inhalation ................................................................................................... 30
Table 2.2: MPPD model input for a man in resting (sitting) and light exercise state ........... 33
Chapter 3
Table 3.1: List of instruments used in the brake rig test ....................................................... 41
Table 3.2: Particle number concentration and size during experiments at different brake loads
(30, 45 and 60 psi) ................................................................................................................ 46
Table 3.3: Particle surface area and mass concentration and size during experiments at
different brake loads (30, 45 and 60 psi) .............................................................................. 47
Table 3.4: Comparison of PNSD of brake wear particles between this study and previous
studies .................................................................................................................................... 48
Chapter 4
Table 4.1: Input parameters for mass balance models, deposition and coagulation models.58
Chapter 5
Table 5.1: Hygroscopic growth factors and number fractions (in parenthesis in the table) of
three hygroscopic particle groups in the atmosphere ......................................................... 103
Chapter 6
vii
Table 6.1: Statistics of the particle number and volume concentrations for six factors ... 128
Table 6.2: Correlations between contributions of six factors with other chemical species 129
Table 6.3: Total and regional lung deposition fraction (DF) of each source .................... 143
Table 6.4: Deposition Fractions of particles in the whole lung in previous studies ......... 144
Table 6.5: Source apportionment of submicron particles deposited in the regional lung
(%) ...................................................................................................................................... 144
Chapter 7
Table 7.1: Input data to the MPPD model based on the reference respiratory values from
ICRP (1994) ....................................................................................................................... 155
Table 7.2: Lung deposition of particles from outdoor and indoor environments for adults
(averaged deposition efficiency for both men and women) ............................................... 170
Table 7.3: Assumption of time-activity and location for employments living in new suburbs
of Prague according to Novak and Sykora (2007) and Scheizer et al (2007) .................... 175
Table 7.4: Assumed particle number concentrations, CMD and minute ventilations for males
and females in the different exposure scenarios ................................................................ 176
viii
LIST OF ABBREVIATIONS
ACC Accumulation mode particles
AIT Aitken mode particles
AL Alveolar (region)
APS Aerodynamic Particle Sizer
CFD Computational fluid dynamics
CMD Count median diameter
COPD Chronic obstructive pulmonary disease
COWD Wood smoke indicator
CPC Condensation Particle Counter
DF Deposition Fraction
DMA Differential Mobility Analyser
EEPS Engine Exhaust Particle Sizer
ET Extrathoracic (region)
FMPS Fast Mobility Particle Sizer
GF (Hygroscopic) Growth factor
GSD Geometric standard deviation
HTDMA Hygroscopic Tandem Differential Mobility Analyzer
I/O Indoor/outdoor
ICRP International Commission on Radiological Protection model
MMD Mass median diameter
MPPD Multiple Path Particle Dosimetry
NU Nucleation mode particles
PMF Positive matrix factorization
PNSD Particle number size distributions
ix
RMSE Root Mean Square Error
SMD Surface area median diameter
SMPS Scanning Mobility Particle Size Spectrometer
TB Tracheo-bronchial region (region)
VE Minute Ventilation or Ventilation rate
VMD Volume median diameter
1
Chapter 1: INTRODUCTION
This chapter first aims to give the background of ambient aerosols and then discusses their
health effects. The main part of this chapter is a literature review of respiratory exposure
dose analysis for inhaled aerosols. In this review, lung dose, or the dose rate of particles and
their calculation methods, are defined. In addition, it briefly presents the main factors that
control the dose of particles in the human respiratory tract, such as particle properties,
minute ventilation or subject characterization. Finally, the main goals and outline of the PhD
study are introduced in this chapter.
The Chapter 1, 2 and 3 contain some sections of verbatim text adapted from Vu et al. (2015b)
published as part of this PhD. The author’s contribution: contribution of ideas and writing.
1.1. Background of ambient aerosols
Ambient aerosols are a mixture of organic and inorganic substances suspended as liquid
droplets or solid particles in the air, with diameters ranging between ~ 2 nm and ~ 100 µm.
Atmospheric aerosols can scatter light efficiently, changing the balance of solar radiation
reaching the earth’s surface, thus resulting in climate change; they also have indirect impacts
on the climate due to their effects on clouds formation by acting as cloud condensation
nuclei. In addition, some of them may contain potentially toxic chemicals such as polycyclic
aromatic hydrocarbons (PAHs), causing a series of health problems due to inhalation. As a
result, there has been a rapid rise in research on ambient aerosols in recent decades.
Ambient particles may be either directly derived in the ambient air from both anthropogenic
or natural sources, such as traffic emissions, biomass burning or volcanoes (primary
2
aerosols), or formed by chemical reactions such as atmospheric nucleation (secondary
aerosols). Each source has a different contribution to different particle metrics (number,
surface area and mass). In urban areas, traffic related emissions are well known as a major
source of both particle number and mass.
Different types of sources generate particles with different physical and chemical properties,
including their (number, surface area and mass) concentration, size, chemical composition,
and aerodynamic, hygroscopic, optical and other properties. Of these particle properties,
particle number size distribution is the most important parameter because it not only provides
us information about sources and atmospheric processing of particles, but it also plays a vital
role in determining regional lung deposition. In addition, particle size has marked effects
upon atmospheric visibility and climate.
1.2. Health effects of ambient particles
Exposure to ambient aerosols has been found to be associated with an increase in mortality,
such as exacerbation of asthma and cardiovascular problems in both epidemiological and
toxicological studies (Donaldson et al., 2001; Kumar et al., 2010). A recent study published
in Nature found that ambient air pollution, mostly by PM2.5 may cause more than 3 million
premature deaths on global scale every year (Lelieveld et al., 2015).
Aerosol properties in terms of physical and chemical characteristics play an important role in
exposed route and thus have a consequent direct health effect. Many previous studies have
found that particle mass and its chemical properties, such as PM10, black carbon and heavy
metals contained in PM are directly linked to the health effects; fine particles can also
penetrate deeper into the lungs. However, some recent evidence suggests that the ultrafine
particles that are most commonly measured in terms of their number concentrations could
have a higher toxicity compared to corresponding masses of fine particles due to their large
3
surface area, oxidative capacity and radical species formation, which can lead to cellular
DNA damage or induce inflammatory effects (Peters et al., 1997). Furthermore, the ultrafine
particle is widely known to penetrate into the lung more easily. Therefore, the determination
of the respiratory tract deposition of aerosol particles which depends much upon their size
distribution is becoming crucial in addressing the question of what the most important metric
linked to health outcome is (Harrison et al., 2010; Kumar et al., 2013).
1.3. Literature review of respiratory exposure-dose analysis for inhaled submicron
aerosols
1.3.1. Introduction
Exposure to ambient aerosols is consistently associated with adverse health effects in
numerous scientific studies (Pope and Dockery, 2006). In particular, smaller particles are able
to penetrate into the deeper regions of the respiratory tract including the pulmonary
epithelium, causing serious health problems such as lung morbidity and mortality (Donaldson
et al., 1998). Estimation of the respiratory deposition dose plays a vital role not only in the
determination of the particle-induced biological response in toxicological studies, but also in
risk assessment of air pollution in epidemiological studies. Harrison et al. (2010) indicate that
relating health outcomes to measured particle mass concentrations most likely underestimates
the public health impacts and emphasize that the regional dose, not pollutant exposure,
probably drives health outcomes.
The regional lung dose is defined as the proportion of inhaled particles deposited in the
respiratory tract during an exposure time period. The lung dose of particles by number in
different lung regions (i) with a specific particle size range (Dp1-Dp2) was calculated based
on the following equation (Hussein et al., 2013):
Dosei, = ∫ VE. DFi. nN0 . Δt. dlogDp
Dp2
Dp1 (1.1)
4
where, DFi is the deposited fraction of a specific particle in the human respiratory tract;
𝑛𝑁0 =dN/dlogDp is the lognormal particle number size distributions; Δt is the exposure time
period (minute ) and Dp is the particle diameter (µm); VE is defined as the minute ventilation
or ventilation rate is the volume of gas inhaled or exhaled from the lungs during a time period
(m3 minute
-1). Equation (1.1) can be transformed into equation (1.2):
Dosei, = CTN*VE * DFi* Δt (1.2)
where, DFi is the total deposition fraction of aerosol population in the different regional
lungs. CTN is the total number concentration (particle cm-3
).
Therefore, the daily regional dose of particles can be calculated as the following equation:
Daily Dosei = ∑ Cj ∗ VEj ∗ DFi,j ∗ tjnj=1 (1.3)
where, Cj, VEj, DFi,j, tj is the total concentration (particle cm-3
), minute ventilation (m3
minute-1
) , deposition fraction and exposure time (minutes) of particles in the different
exposure scenario j (such as in the working place, home or outdoor) and ∑ tj = 1440nj=1
minutes.
In a given exposure scenario, the respiratory tract deposited particle dose rate, which is
defined as the total amount of particles deposited in the respiratory tract during a period of
time, can be calculated as:
Dose Rate = DF * C*VE (1.4)
The dose not only depends upon the measured particle concentrations in each environment,
but is also influenced by complex parameters including particle properties, breathing patterns,
flow dynamics and lung structure. Although ambient aerosols and their deposition in the
respiratory tract have been of much concern in recent years, there are few studies on the
regional lung dose of ambient aerosols (Kristensson et al., 2013).
5
This work first discusses the factors governing the lung dose of particles. It then briefly
reviews and compares the current mathematical models of regional lung deposition. The third
part of this chapter will summarize the lung dose results from previous studies and finally
discuss the current challenges and future solutions.
1.3.2. Factors controlling the lung dose of particles
From equation (1.3), it is obvious that the lung dose of particles is controlled by four
important factors including concentration, minute ventilation, deposition fraction and
exposure time. This section will discuss these four factors and identify which is the most
important in lung dose monitoring.
1.3.2.1. Particle number concentration in different scenarios
a. Outdoor environments
Atmospheric aerosols are a mixture of primary particles emitted from anthropogenic
activities (transportation, power generation, industries or cooking), and natural sources
(volcanos, forest fires), and secondary particles formed by gas-to-particle conversion
mechanisms. Aerosol concentration is found to be quite variable between environments, and
even within in an environment types due to its strong dependence on the atmospheric process
or local sources. Table 1.1 shows the range of particle number concentration of atmospheric
aerosols in different environments. For example, the number concentrations of particles with
diameters from 3 nm to 10 µm vary in urban areas, ranging from ~103 to ~10
6 particle cm
-3
(Stanier et al., 2004; Wang et al., 2011b; Weijers et al., 2004), while the concentrations of
particles with diameters in the range of 10 nm–20 µm at urban background sites are normally
around 103-10
4 cm
-3. These values are lower than those in other urban sampling sites, such as
downtown and traffic or and suburban areas, but they are much higher than those in rural and
6
clean background areas. Investigating the characteristics of particle number size distribution
in four European cities, Von Bismarck-Osten et al. (2013) report that the average total urban
particle number concentrations were 1.6-2 times higher than those in rural areas, but 2.4-3.4
times lower compared with those at the road side. Similar results were found in Munich,
Germany (Held et al., 2008), and Guangzhou, China (Yue et al., 2013). A detailed
information of particles in cities can be found in excellent reviews by Kumar et al. (2014) and
Vu et al. (2015b).
Table 1.1: Particle number concentration of atmospheric aerosols (Seinfeld and Pandis,
2012).
Environments Number concentration (particles cm-3
)
Urban background 103 - 10
4
Urban polluted 104 - 4 x 10
6
Rural 103 – 10
4
Marine 102 – 4 x 10
2
Remote continental 50 – 104
b. Indoor environments
Indoor aerosols are a mixture of outdoor particles that infiltrate into indoor environments,
particles released by indoor activities, and new particles formed by gas-to-particle
conversion. Hence, their concentrations are strongly affected by the outdoor/indoor
penetration process, which depends on building characteristics, the removal process from
indoor air such as deposition or air exchange, and the emission rate of indoor sources
(Bhangar et al., 2011). The penetration and deposition rates of particles are found to greatly
depend upon particle size. In the absence of an indoor source, the indoor concentration level
is normally found to be lower than the outdoor level. In recent decades, many studies on
7
particle characterization have been conducted in different indoor environments, such as
homes, schools, offices, and other working places.
1.3.2.2. Variation in deposition fraction
As dissed below, the total and regional deposition fraction (or deposition fraction) vary
between nearly zero and almost one, depending upon the inhalation conditions (breath rate,
route and volume), subject category (lung morphology, age, gender, and disease), and particle
properties (size, shape, density and chemical composition) (Löndahl et al., 2014).
a. Particle properties
Particle size
Particle size is the most important parameter in determining the regional lung deposition of
particles because of its direct effects upon the main lung deposition mechanisms including
diffusion, impaction and sedimentation (ICRP, 1994; Martonen et al., 2005).
Hygroscopicity, particle density and shape
When an inhaled particle penetrates into the human respiratory tract, its size and density may
be changed due to its hygroscopic properties, altering its deposition efficiency. The
hygroscopic growth factors of particles depend on their initial size and chemical composition,
the regional lung’s temperature and relative humidity, and its travelling time in the lung
(Ruzer and Harley, 2012).
If the particle is spherical, the relationship between the growth factor and particle density is
given by the following equation (Martonen et al., 2005):
ρi =ρ0−ρH2O
Gfi3 + ρH2O (1.10)
8
where, ρ0 and ρi are the initial particle density and the particle density in the airway
generation i (g cm-3
); Gfi is the growth factor of the particle in the airway generation i; and
ρH2O is the particle density of water (g cm-3
).
Ferron et al. (1988) measured the growth and deposition of dry NaCl, CoCl2.6H2O and
ZnSO4.7H2O particles in the human regional lung due to inhalation. Their study reported that
small pure salt particles (Dp <1 µm) can grow and reach their final size during inhalation
while the larger particles ((Dp >7 µm) grow by less than 20% during inhalation. The
deposition of hydrophobic particles was found to be higher than those of hygroscopic
particles with an equivalent diameter for submicron particles, but lower for micron-sized
particles. Winkler-Heil et al. (2014) explain that diffusion has less effect on the submicron
particles, whereas there are more efficient impaction and sedimentation effects on super-
micron particles due to their hygroscopicity.
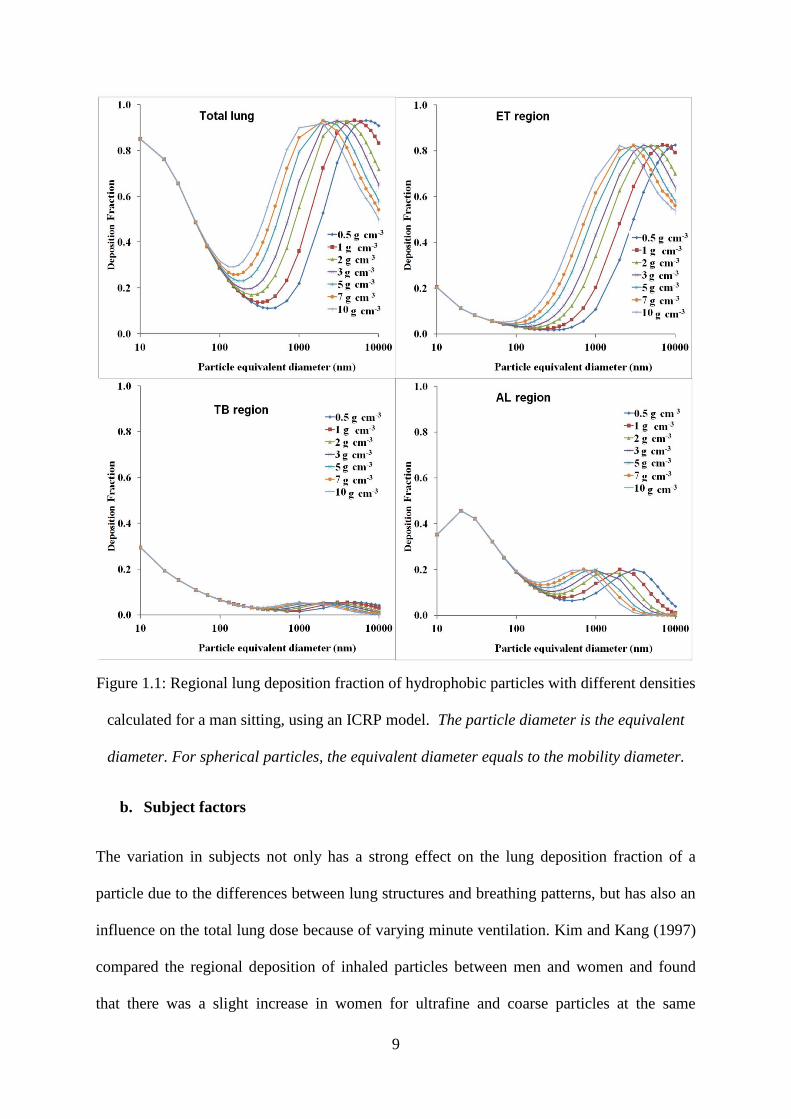
There are few studies on the effect of particle density and shape on regional lung deposition.
Figure 1.1 shows the effect of particle density on the deposition fraction of particles. Particles
with a higher density have a higher total deposition fraction than others with the same
diameter but lower density. Note that the particle density we used in the ICRP model is
“effective density”.
9
Figure 1.1: Regional lung deposition fraction of hydrophobic particles with different densities
calculated for a man sitting, using an ICRP model. The particle diameter is the equivalent
diameter. For spherical particles, the equivalent diameter equals to the mobility diameter.
b. Subject factors
The variation in subjects not only has a strong effect on the lung deposition fraction of a
particle due to the differences between lung structures and breathing patterns, but has also an
influence on the total lung dose because of varying minute ventilation. Kim and Kang (1997)
compared the regional deposition of inhaled particles between men and women and found
that there was a slight increase in women for ultrafine and coarse particles at the same
10
controlled breathing pattern. However, the total deposition fraction was slightly lower in
women than men with a spontaneous breathing pattern. This is consistent with predictions of
the ICRP model (ICRP, 1994).
There is no significant variation in the lung deposition fraction of fine particles found in adult
and elderly groups (Bennett et al., 1996). There are both experimental and modelling studies
for total lung deposition in children (Hofmann et al., 1989; Schiller-Scotland et al., 1994; Xu
and Yu, 1986; Zeman, 1998). There are possibly higher deposition fractions in infants and
young children compared to adults. However, these results are found to be variable and
inconsistent due to the difficulty in monitoring breathing patterns in experimental studies and
in modelling for the development of lung morphology. There is a lack of experimental data to
validate the models.
The total deposition fraction has shown an increase in the total lung deposition of ultrafine
and fine particles for patients with obstructive airway diseases such as asthma and chronic
obstructive pulmonary disease (COPD) (Löndahl et al., 2014). In one of the earliest
researches, Anderson et al. (1990) compared the total efficient respiratory tract deposition of
non-hygroscopic ultrafine particles (di-2-ethylhexyl sebacate- DEHS, size range: 0.02-0.24
µm) in five subjects with obstructive lung disease- three subjects with restrictive lung disease
and ten healthy subjects. The results showed that the total lung deposition fraction of ultrafine
particles in patients with restrictive lung disease was similar to that in healthy subjects, but
there is a significant increase in patients with obstructive lung disease.
Kim and Kang (1997) measured the total lung deposition fraction of monodisperse aerosols
of DEHS with 1.0 µm mass median aerodynamic diameter (GSD ~1.2) and found the lung
deposition fractions were double higher in COPD patients, around 50% higher in smokers
with small airways disease and asthmatics, and 16% higher in smokers. This result was
11
consistent with Chalupa et al. (2004), who found the efficient lung deposition of ultrafine
particles with a CMD of 23 nm and GSD of 1.6 was approximately 17% higher in asthmatic
subjects during breathing at rest, but that there was no significant difference during breathing
at exercise. Furthermore, Brown et al. (2002) compared the lung deposition fraction of
technetium-99m-labeled ultrafine carbon aerosols with a CMD of 33 nm and geometric
standard deviation (GSD, or ϭ) of 1.7 between 9 healthy subjects and 10 COPD patients, who
were subdivided into a bronchitis (7 patients) and an emphysemic (3 patients) group. The
data demonstrated that DFs in heathy subjects (DF ~0.62) was found to be slightly lower than
those of bronchitic patients (0.67), but much higher than those of emphysemic patients (0.48).
A lower lung deposition fraction of ultrafine particles in emphysemic patients was also found
by Londahl et al. (2012).
Human physical activity and minute ventilation
Exercise increases the human respiratory tract dose of particles in a constant
microenvironment due to the increase in both deposition fraction and minute ventilation.
Daigle et al. (2003) measured the lung deposition of a polydisperse carbonaceous ultrafine
particle (CMD ~26 nm, GSD ~1.6) in 17 healthy subjects during rest and exercise. The
deposition fraction during rest was 0.66 ± 0.11, which increased to 0.83 ± 0.04 during
moderate exercise, while the minute ventilation increased from 9.0 ± 1.3 L min-1
during rest
to 38.1 ± 9.5 L min-1
during exercise. As a result, the total number of deposited particles was
more than 4.5 times higher during exercise than at rest.
Similarly, Löndahl et al. (2007) compared the lung deposition of ultrafine hydrophobic and
hygroscopic particles during rest and exercise. The deposition fraction showed a small
increase in hydrophobic particles with diameter lower than 30 nm during exercise, but the
minute ventilation increased fourfold; therefore, the dose increased more than four times at
12
the exercise level. Moreover, there was no significant difference in the average deposition
fraction due to gender, but the minute ventilation for male subjects was four times higher than
female subjects during exercise.
As discussed above, minute ventilation is a main factor in the increase in dose rate when
doing exercise. Minute ventilation depends upon exercise level and subject characterization,
such as age, gender and disease. Brown et al. (2002) measured the minute ventilation in
COPD patients. The results showed that was 6.93 ± 1.63 and 10.9 ± 6.2 L min-1
in bronchitic
and emphysemic patients, which was found to be higher than that for healthy subjects (5.83 ±
1.36 L min-1
). Likewise, Londahl et al. (2012) found the minute ventilation in COPD patients
was 10.6 ± 2.9 L min-1
, while for healthy subjects it was 8.4 ± 1.5 L min-1
. Higher minute
ventilation was found in patients with asthma than healthy subjects (Chalupa et al., 2004).
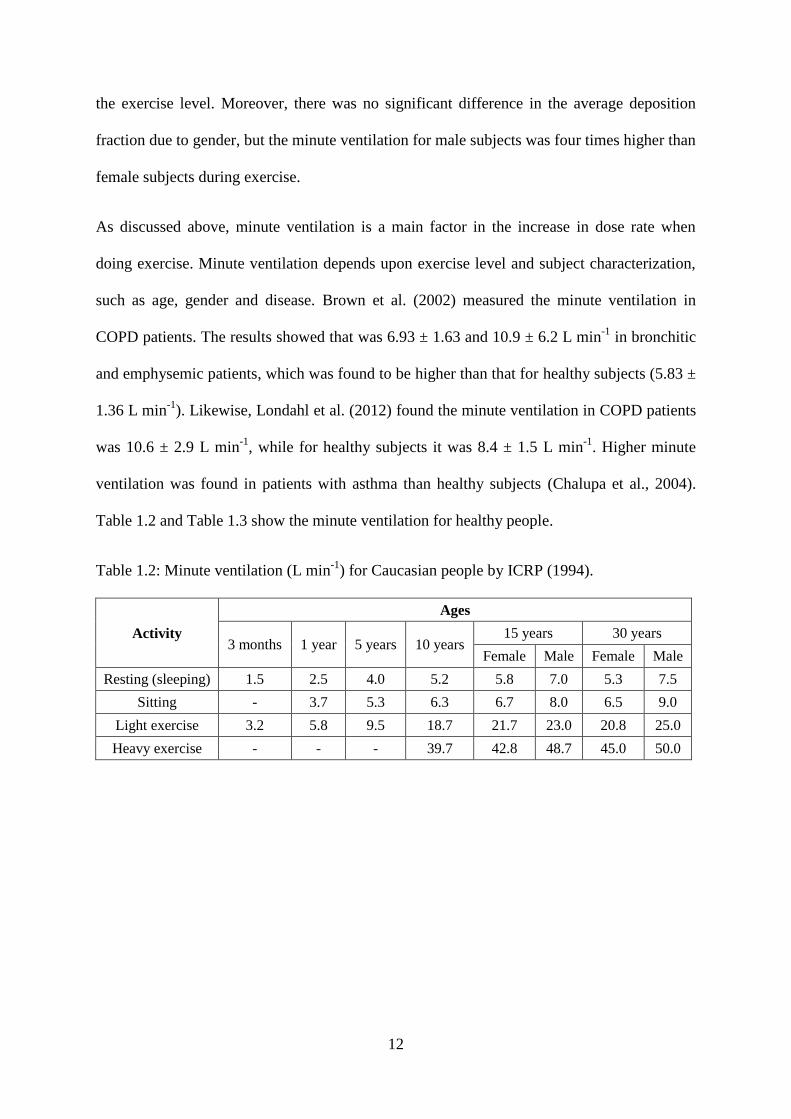
Table 1.2 and Table 1.3 show the minute ventilation for healthy people.
Table 1.2: Minute ventilation (L min-1
) for Caucasian people by ICRP (1994).
Activity
Ages
3 months 1 year 5 years 10 years 15 years 30 years
Female Male Female Male
Resting (sleeping) 1.5 2.5 4.0 5.2 5.8 7.0 5.3 7.5
Sitting - 3.7 5.3 6.3 6.7 8.0 6.5 9.0
Light exercise 3.2 5.8 9.5 18.7 21.7 23.0 20.8 25.0
Heavy exercise - - - 39.7 42.8 48.7 45.0 50.0
13
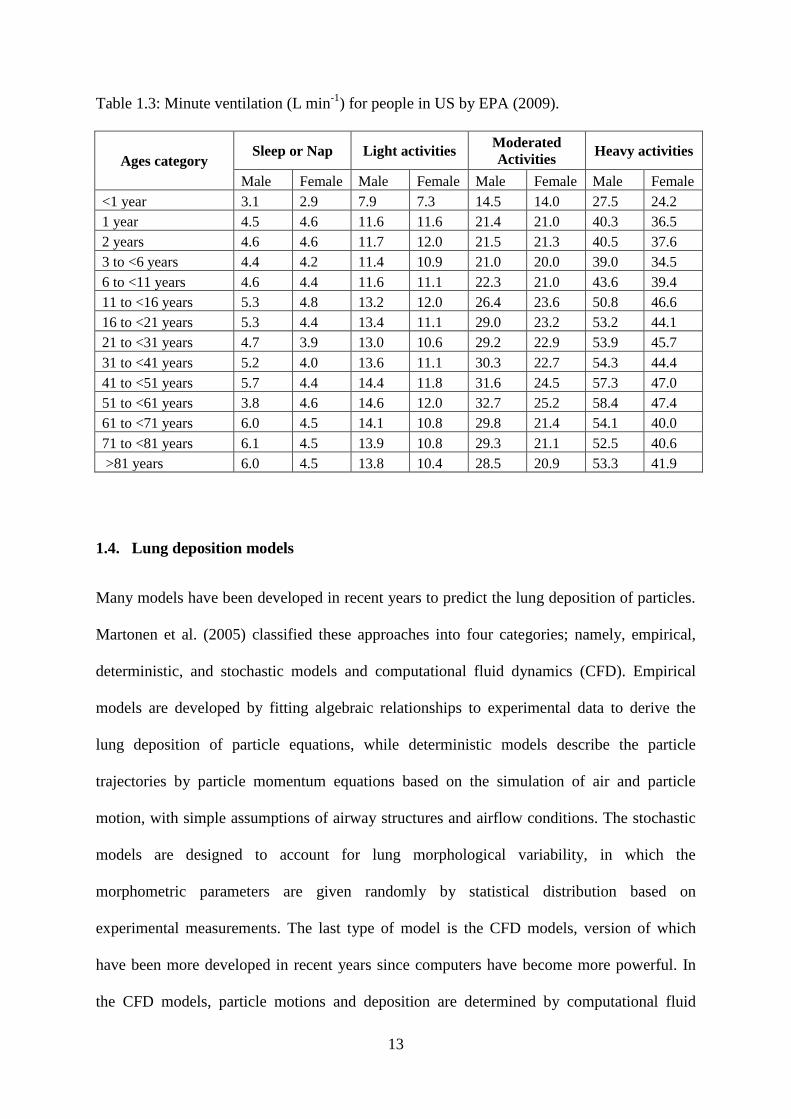
Table 1.3: Minute ventilation (L min-1
) for people in US by EPA (2009).
Ages category Sleep or Nap Light activities
Moderated
Activities Heavy activities
Male Female Male Female Male Female Male Female
<1 year 3.1 2.9 7.9 7.3 14.5 14.0 27.5 24.2
1 year 4.5 4.6 11.6 11.6 21.4 21.0 40.3 36.5
2 years 4.6 4.6 11.7 12.0 21.5 21.3 40.5 37.6
3 to <6 years 4.4 4.2 11.4 10.9 21.0 20.0 39.0 34.5
6 to <11 years 4.6 4.4 11.6 11.1 22.3 21.0 43.6 39.4
11 to <16 years 5.3 4.8 13.2 12.0 26.4 23.6 50.8 46.6
16 to <21 years 5.3 4.4 13.4 11.1 29.0 23.2 53.2 44.1
21 to <31 years 4.7 3.9 13.0 10.6 29.2 22.9 53.9 45.7
31 to <41 years 5.2 4.0 13.6 11.1 30.3 22.7 54.3 44.4
41 to <51 years 5.7 4.4 14.4 11.8 31.6 24.5 57.3 47.0
51 to <61 years 3.8 4.6 14.6 12.0 32.7 25.2 58.4 47.4
61 to <71 years 6.0 4.5 14.1 10.8 29.8 21.4 54.1 40.0
71 to <81 years 6.1 4.5 13.9 10.8 29.3 21.1 52.5 40.6
>81 years 6.0 4.5 13.8 10.4 28.5 20.9 53.3 41.9
1.4. Lung deposition models
Many models have been developed in recent years to predict the lung deposition of particles.
Martonen et al. (2005) classified these approaches into four categories; namely, empirical,
deterministic, and stochastic models and computational fluid dynamics (CFD). Empirical
models are developed by fitting algebraic relationships to experimental data to derive the
lung deposition of particle equations, while deterministic models describe the particle
trajectories by particle momentum equations based on the simulation of air and particle
motion, with simple assumptions of airway structures and airflow conditions. The stochastic
models are designed to account for lung morphological variability, in which the
morphometric parameters are given randomly by statistical distribution based on
experimental measurements. The last type of model is the CFD models, version of which
have been more developed in recent years since computers have become more powerful. In
the CFD models, particle motions and deposition are determined by computational fluid
14
dynamic simulations, which can describe the influence of complicated flow air patterns on
the particle motion and deposition in the respiratory airway system. One of the great strengths
of CFPD models is that they can predict the particle deposition fraction and localized patterns
in a specific selected geometric unit of the human respiratory tract.
From other modelling perspective, Hofmann (2011) divided current particle models into four
categories: the whole lung approach (i.e. deposition in the whole or regional lung); the local
lung approach (i.e. deposition in the localized lung region such as the airway bifurcations);
the Lagrangian approach; and the Eulerian approach. The Lagrangian approach considers the
transport and deposition of individual particles, while the Eulerian approach focuses on the
fate of a population of particles in the human respiratory tract. For more detail, the readers
can refer to the reviews of lung deposition models by Hofmann (2011) and Martonen et al.
(2005). The International Commission on Radiological Protection (ICRP) and Multiple-Path
Particle Dosimetry Model (MPPD) models are two of the most popular models for predicting
particle deposition in the whole and regional lung.
1.5. Summary of lung dose studies
On the microenvironment scale, Wang et al. (2010) predicted the regional lung deposition of
nanoparticles for workers in a carbon black manufacturing factory. The exposure
concentration was 25.7 × 10³, 42.1 × 10
3, and 13.7 × 10
3 particle cm
-3 (based on the
assumption of minute ventilation for workers being 1.5 m3 h
-1, the estimated lung dose rate
was 38.4 × 10⁹, 63.2 × 10
9, and 20.6 × 10
9 particles hour
-1 ) in the packaging, warehouse and
pelletizing areas, respectively. More than 64% of the total particle number was found in the
alveolar region. In a later research, Wang et al. (2011a) reported that the estimated lung dose
rate was 138.0 × 10⁹, 92.2 × 10
9, and 227.0 × 10
9 particles hour
-1 in three working areas, the
forming, threading and heat treating areas in a fastener manufacturing plant.
15
Similarly, Elihn et al. (2011) investigated the regional lung deposition of ultrafine particles in
seven industrial plants and at the different sites of 24 work activities and found the deposited
particle number varied between different working places. Londahl et al. (2009)
experimentally compared the human lung deposition of particles from the kerbside of a busy
street, from traffic exhaust and biomass combustion. The results showed that the deposition
doses (if inhaled total particle mass concentration of 100 µg m-3
) of particle numbers from
these above sources were 80.0 × 10⁹, 103 × 10
9, and 6.5 × 10
9 particles hour
-1.
For the daily lung dose calculation, Buonanno et al. (2011) developed a numerical
methodology based on the Monte Carlo method to estimate the tracheobronchial and alveolar
dose of submicron particles for different population age groups in Italy, using a combined
data set of particle number size distribution collected in major microenvironments and Italian
human activity data. The daily tracheobronchial and alveolar number dose for all of the age
groups was 65 × 109
and 150 × 109
particles day-1
, and the major sources of doses were found
to be indoor cooking (females), working time (males) and transportation (children).
Hussein et al. (2013) modelled the regional deposited dose of submicron aerosol particles for
males and females in the absence of indoor sources. The results demonstrated that the daily
dose of submicron particles in the respiratory tract for adult males was 40 × 109and 57 × 10
9
(particles day-1
) on weekends and workdays. In terms of regional lung dose, most of the
inhaled particles by number (62.8%) deposited in the alveolar region, followed by the
tracheobronchial region (22.7%) and the extra-thoracic region (14.5%). Furthermore,
Hussein et al. (2015) indicated that the daily lung dose of particles by number could increase
four folds due to exposure for 5 minutes of aerosols emitted during printing job.
1.6. Goals of this PhD study
16
The regional dose, not pollutant exposure, probably drives health outcomes in the
epidemiology studies (Harrison et al., 2011). Therefore, the aim of this study is to develop an
approach for the calculation of the human regional lung dose based on ICRP/MPPD models.
In addition, this study also aims to comprehensively investigate the physical properties of
particles which play important roles in the lung deposition calculation. Moreover, the
identification of the most relevant sources of atmospheric particles and the association
between a particle source and lung deposition could play a vital role not only for risk
assessment of air pollution in epidemiological studies, but also for policymakers to introduce
optimal legislation for air quality control for the protection of public health. Hence, the last
purpose of this study is to apportion the sources of particles deposition in the human
respiratory tract. To address these issues, the study focuses on:
(1) Measurement of particle size distribution for particle number from both indoor and
outdoor environments.
(2) Indoor/outdoor modelling for particle size using a mass balance model.
(3) The hygroscopic growth of particles and its implication for lung deposition
calculation.
(4) Source apportionment of the lung dose of ambient submicron particles.
(5) Lung dose of particles emitted from different major indoor sources and the modelling
of daily human lung dose of particles.
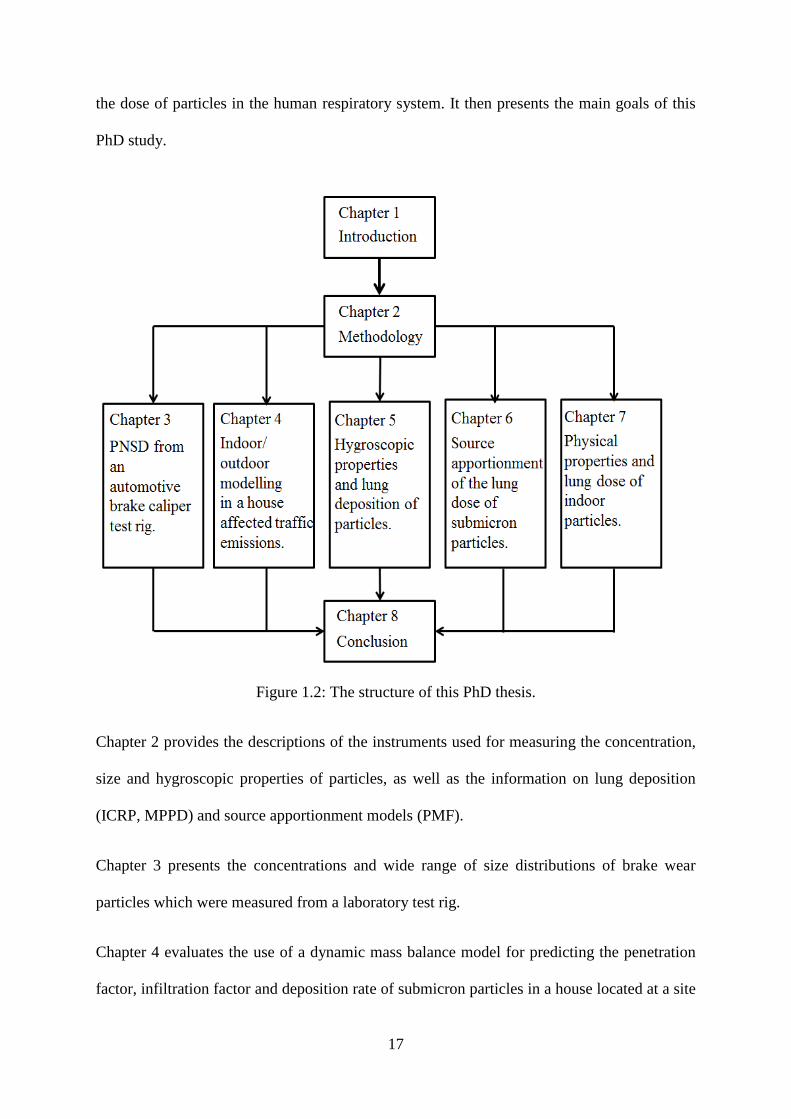
1.7. Thesis outline
This thesis consists of eight chapters, as shown in Figure 1.2. Chapter 1 gives the background
of ambient aerosols and their health effects, a literature review of the existing knowledge of
17
the dose of particles in the human respiratory system. It then presents the main goals of this
PhD study.
Figure 1.2: The structure of this PhD thesis.
Chapter 2 provides the descriptions of the instruments used for measuring the concentration,
size and hygroscopic properties of particles, as well as the information on lung deposition
(ICRP, MPPD) and source apportionment models (PMF).
Chapter 3 presents the concentrations and wide range of size distributions of brake wear
particles which were measured from a laboratory test rig.
Chapter 4 evaluates the use of a dynamic mass balance model for predicting the penetration
factor, infiltration factor and deposition rate of submicron particles in a house located at a site
18
of busy traffic in Bologna (Italy). This chapter also discusses the roles of coagulation and
evaporation processes in estimating the loss of indoor particles.
Chapter 5 reviews the existing knowledge on the hygroscopic properties of particles and their
influence on the lung deposition fraction calculation. In addition, it applies the modified
ICRP model to estimate the regional lung deposition fraction of particles collected from a
street canyon and an urban background site in London and a rural site in the west of London,
UK.
Chapter 6 presents the results of source apportionment of submicron particles at an urban
background area in London, UK. This chapter also identities which source is most
responsible for particles deposited in the human respiratory system.
Chapter 7 presents the results of physical properties of particles gained from the
indoor/outdoor experiments in Prague, Czech Republic from HEXACOMM sampling
campaigns. This chapter also discusses the lung deposition of particles emitted from five
major indoor sources.
Chapter 8 gives a summary of the thesis, followed by an overall conclusion derived from this
research. It also discusses the implications, limitation and future directions for this study.
19
Chapter 2: METHODOLOGY
This chapter outlines the general methodology used in the study. It first lists the real time
instruments used to characterize the concentration, size and hygroscopic properties of
particles, including a Scanning Mobility Particle Size Spectrometer (SMPS), Engine Exhaust
Particle Sizer (EEPS), Fast Mobility Particle Sizer (FMPS), Aerodynamic Particle Sizer
(APS), and Hygroscopic Tandem Differential Mobility Analyser (HTDMA). It then provides
information on the two human respiratory tract deposition models: a semi-experimental
model supplied by the International Commission on Radiological Protection (ICRP model)
and a Multiple-Path Particle Dosimetry Model developed by Applied Research Associates,
Inc. (MPPD model version 2.11). In addition, the chapter describes a positive matrix
factorization (PMF) model and its application on particle number size distribution in the
source apportionment study of particles. Finally, it summarizes the software and programing
language used for the data analysis.
2.1. Real time measurement instruments
2.1.1. Scanning Mobility Particle Size Spectrometer (SMPS)
An SMPS spectrometer is a high resolution nanoparticle sizer that is widely used to measure
aerosol size distributions in the size range from few to 1000 nm. The principal operation of
this spectrometer is based on the electrical mobility properties of particles. An SMPS system
mainly consists of an electrostatic classifier (EC) combined with a Differential Mobility
Analyser (DMA) to classify particle sizes based on their mobility, and a Condensation
20
Particle Counter (CPC) to count the particle number concentration. In our study, we used an
SMPS model 3696 from TSI (TSI, 2010).
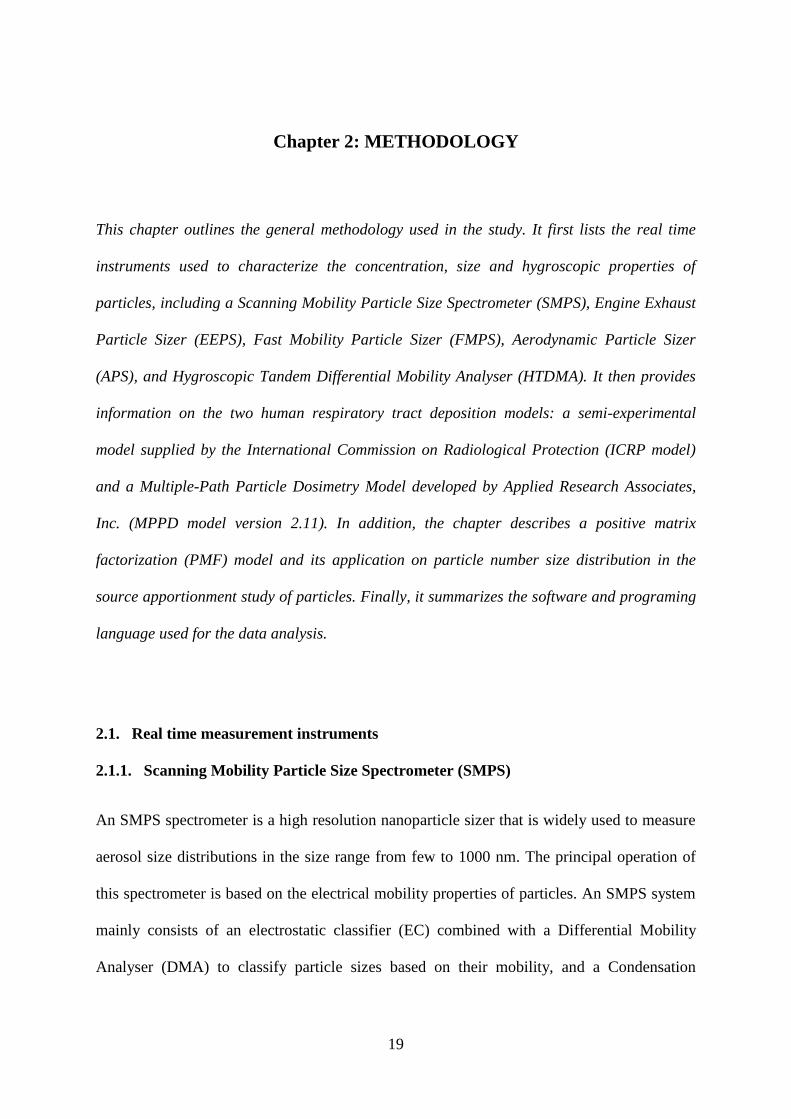
An aerosol impactor on the inlet should be mounted outside the electrostatic classifier to
remove large particles which may carry many more than a single charge. There are three
impactors, with nozzle diameters of 0.0475, 0.0508 and 0.0871 cm. The impactor is selected,
depending upon the type of DMA, CPC, aerosol sample flowrate and the collected size range.
In our study, we used an impactor with a nozzle diameter of 0.0508 cm that can remove
particles with a diameter larger than 1 µm. Before entering the DMA, sample aerosols are
neutralized by an aerosol neutralizer based on either radioactive or soft x-ray sources (TSI,
2010).
Differential Mobility Analyzer (DMA)
A DMA column consists of a high voltage centre rod and an outer grounded tube, generating
an electric field inside. As the aerosol sample flow come from the top to the bottom of the
column, the neutralized aerosols are forced to the outer tube or drawn to the inner rod due to
the effect of the electrical field on the charged particles; they are then separated according to
size based on their electric mobility. For example, particles with a higher electrical mobility
move towards the inner rod faster than those with a lower electrical mobility, and they make
contact with the central rod sooner (TSI, 2010).
The electrical mobility of an aerosol depends on its size, charge (which is controlled by a
neutralizer before entering the DMA), sample and sheath flows, the voltage of the central rod,
and the DMA geometry. At a given voltage and flow rate, only particles with a certain size
can pass through an output slit which is located at the bottom of the rod, and continue to the
CPC for concentration measurement. In our study, we used a long DMA from TSI in the
SMPS system.
21
Figure 2.1: Flow schematic of an electric classifier with a long DMA (TSI, 2010).
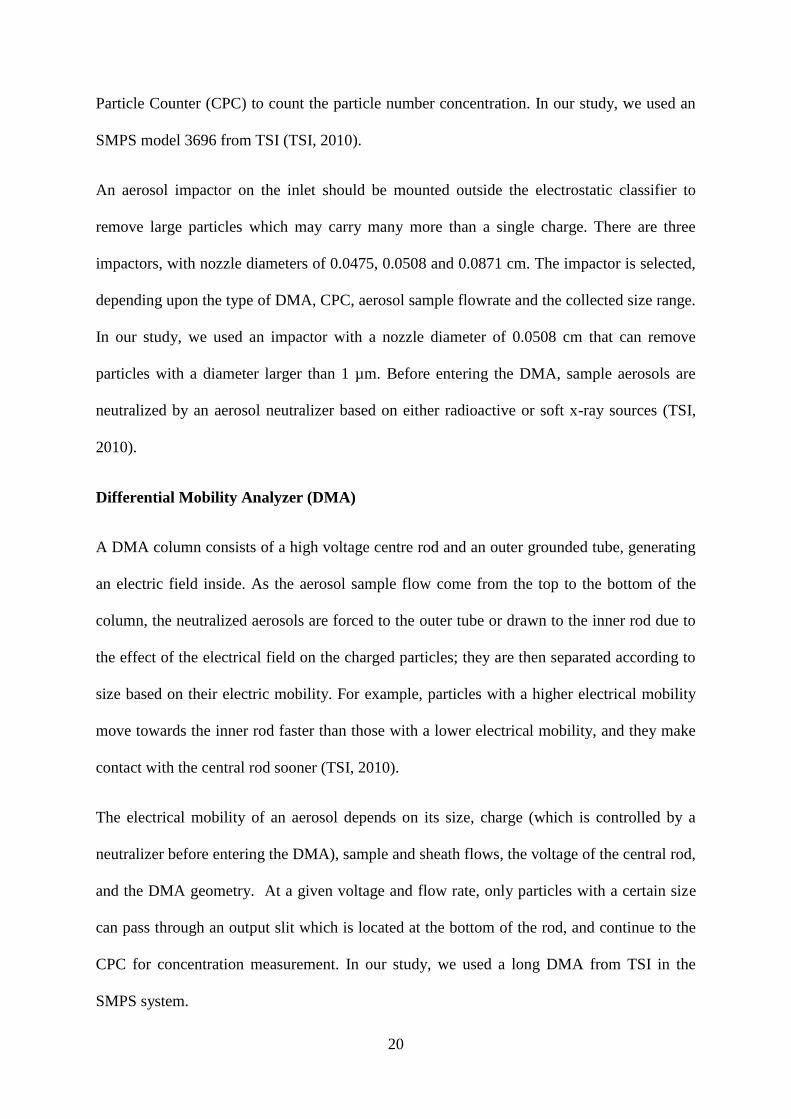
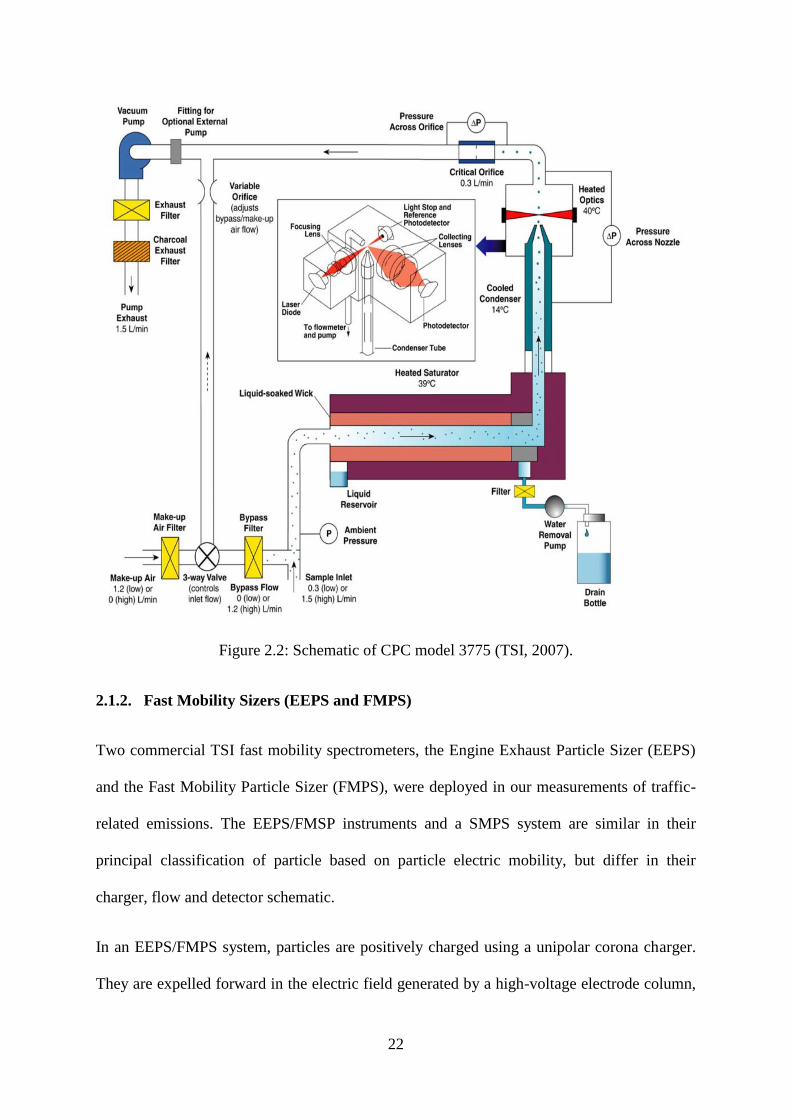
Condensation Particle Counter (CPC)
CPCs are used to detect the monodisperse aerosol once it passes through the DMA. The
principal operation of a CPC is that it uses heterogeneous condensation to grow the particle;
these grown particles will be detected by an optical detector. In our study, we employ the
CPCs from TSI using n-butanol as a supersaturated vapour. In these CPCs, the aerosol
sample stream passes through a heated saturator, where butanol is vaporized and
contaminated by diffused butanol vapours. Then, the aerosol and butanol vapour will pass
into a cooled condenser where butanol vapour is supersaturated and condensed. Particles in
the sample stream will be act as condensation nuclei and start to grow into larger droplets due
to condensation. The large droplets will enter into an optical detector and be easily counted
by number (TSI, 2007).
22
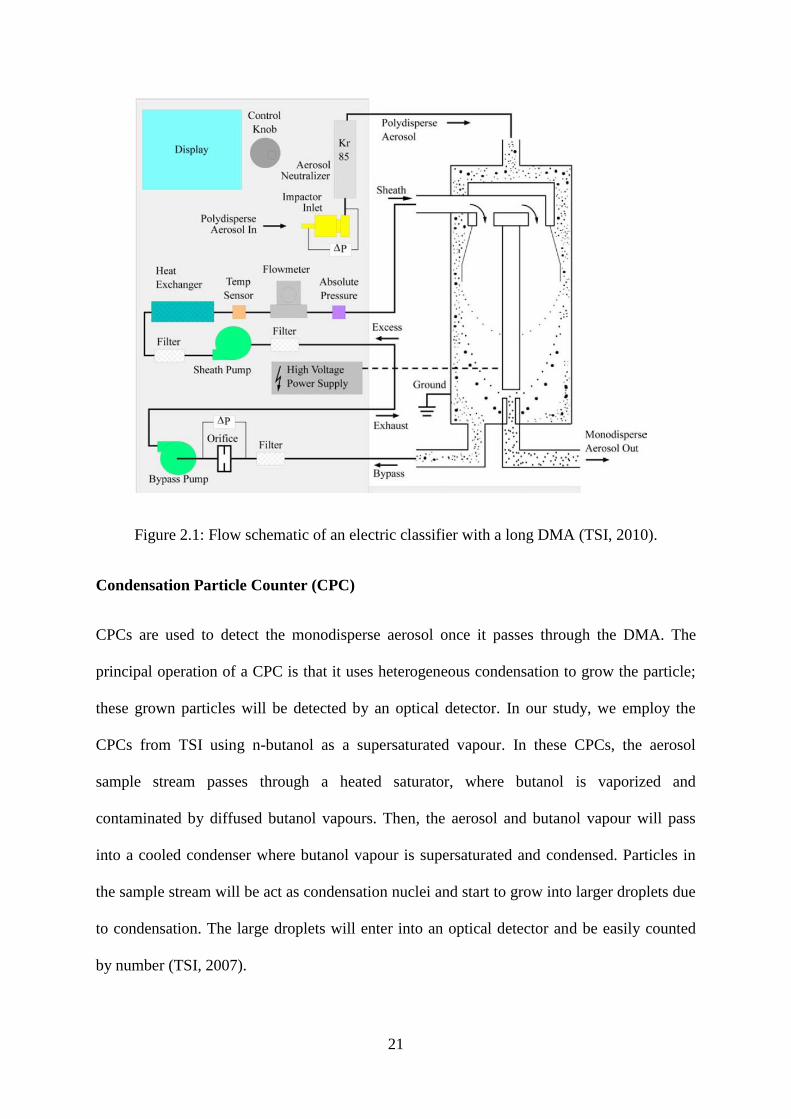
Figure 2.2: Schematic of CPC model 3775 (TSI, 2007).
2.1.2. Fast Mobility Sizers (EEPS and FMPS)
Two commercial TSI fast mobility spectrometers, the Engine Exhaust Particle Sizer (EEPS)
and the Fast Mobility Particle Sizer (FMPS), were deployed in our measurements of traffic-
related emissions. The EEPS/FMSP instruments and a SMPS system are similar in their
principal classification of particle based on particle electric mobility, but differ in their
charger, flow and detector schematic.
In an EEPS/FMPS system, particles are positively charged using a unipolar corona charger.
They are expelled forward in the electric field generated by a high-voltage electrode column,
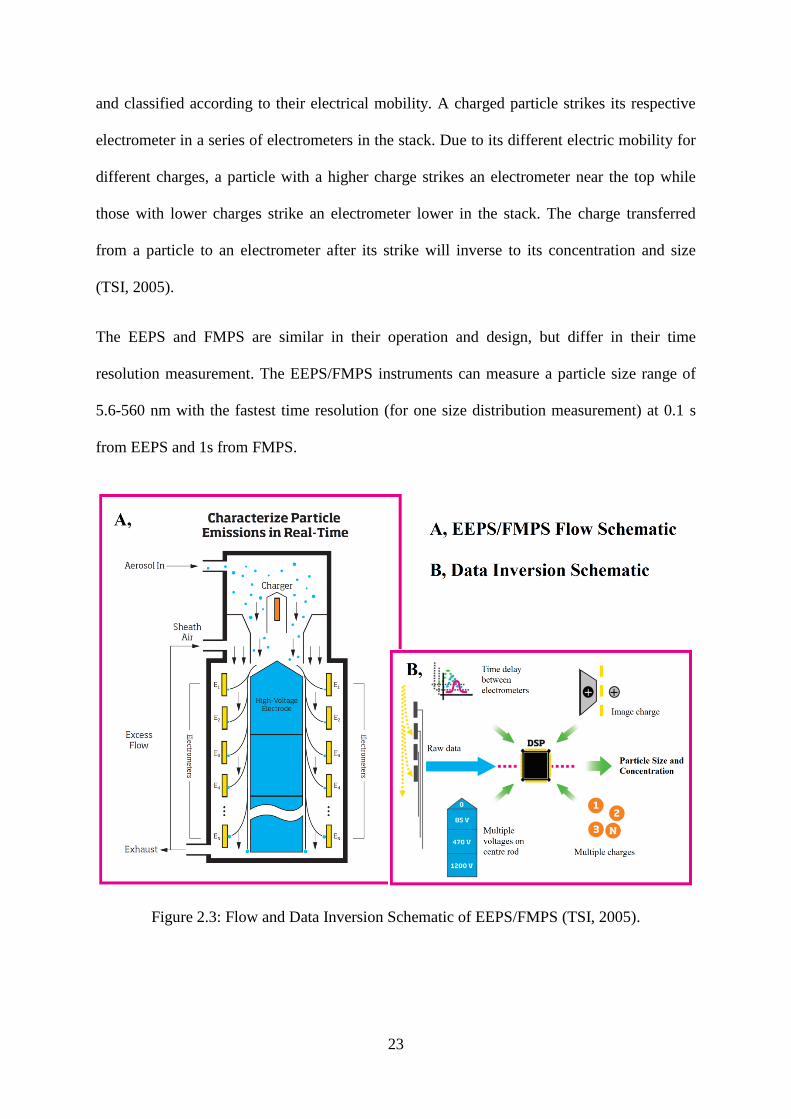
23
and classified according to their electrical mobility. A charged particle strikes its respective
electrometer in a series of electrometers in the stack. Due to its different electric mobility for
different charges, a particle with a higher charge strikes an electrometer near the top while
those with lower charges strike an electrometer lower in the stack. The charge transferred
from a particle to an electrometer after its strike will inverse to its concentration and size
(TSI, 2005).
The EEPS and FMPS are similar in their operation and design, but differ in their time
resolution measurement. The EEPS/FMPS instruments can measure a particle size range of
5.6-560 nm with the fastest time resolution (for one size distribution measurement) at 0.1 s
from EEPS and 1s from FMPS.
Figure 2.3: Flow and Data Inversion Schematic of EEPS/FMPS (TSI, 2005).
24
2.1.3. Aerodynamic Particle Sizer (APS)
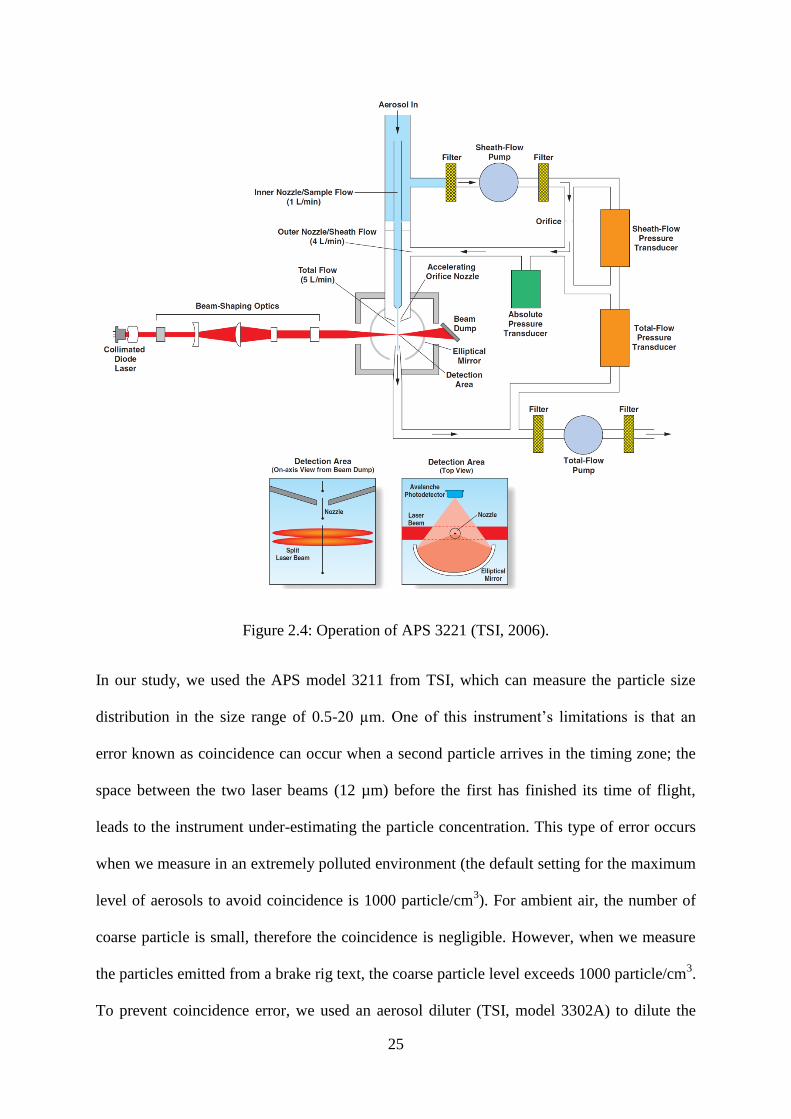
The APS sizes a particle in according to aerodynamic diameter in the range of 0.5-200 µm
based on a time-of-flight technique and detects particles using a light-scattering technique
(Hinds, 1999; TSI, 2006). In an APS, there are two partially overlapping laser beams to
detect particles. Once particles enter into the sample inlet, they are accelerated by the airflow
through an accelerating orifice. Small particles of less than 0.3 µm, with approximately the
same velocity as the air, will continue with the accelerating flow and exit. Larger particles
accelerate more slowly due to the increased inertia; their velocities depend on their sizes.
Light is scattered as a particle passes through the laser beam, and it is detected by an
avalanche photodetector (APD). The pulse of scattered light from the APD will be converted
into an electrical pulse. The particle velocity can be determined from the time interval
between the two electrical pulses created by that particle when it passes through two laser
beams, resulting in a determination of its size (TSI, 2006).
25
Figure 2.4: Operation of APS 3221 (TSI, 2006).
In our study, we used the APS model 3211 from TSI, which can measure the particle size
distribution in the size range of 0.5-20 µm. One of this instrument’s limitations is that an
error known as coincidence can occur when a second particle arrives in the timing zone; the
space between the two laser beams (12 µm) before the first has finished its time of flight,
leads to the instrument under-estimating the particle concentration. This type of error occurs
when we measure in an extremely polluted environment (the default setting for the maximum
level of aerosols to avoid coincidence is 1000 particle/cm3). For ambient air, the number of
coarse particle is small, therefore the coincidence is negligible. However, when we measure
the particles emitted from a brake rig text, the coarse particle level exceeds 1000 particle/cm3.
To prevent coincidence error, we used an aerosol diluter (TSI, model 3302A) to dilute the
26
aerosols in sample flow before they enter into the APS inlet. The dilution ratios of this diluter
were set up in the range from 20 to 100 times.
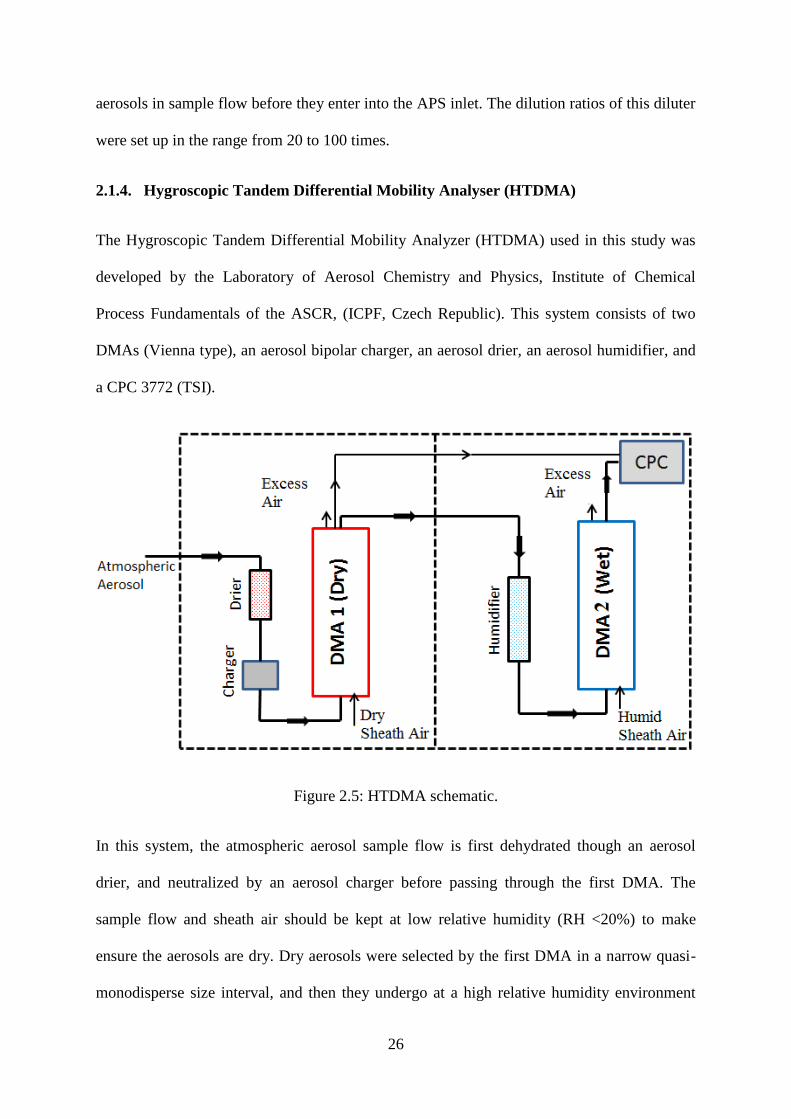
2.1.4. Hygroscopic Tandem Differential Mobility Analyser (HTDMA)
The Hygroscopic Tandem Differential Mobility Analyzer (HTDMA) used in this study was
developed by the Laboratory of Aerosol Chemistry and Physics, Institute of Chemical
Process Fundamentals of the ASCR, (ICPF, Czech Republic). This system consists of two
DMAs (Vienna type), an aerosol bipolar charger, an aerosol drier, an aerosol humidifier, and
a CPC 3772 (TSI).
Figure 2.5: HTDMA schematic.
In this system, the atmospheric aerosol sample flow is first dehydrated though an aerosol
drier, and neutralized by an aerosol charger before passing through the first DMA. The
sample flow and sheath air should be kept at low relative humidity (RH <20%) to make
ensure the aerosols are dry. Dry aerosols were selected by the first DMA in a narrow quasi-
monodisperse size interval, and then they undergo at a high relative humidity environment
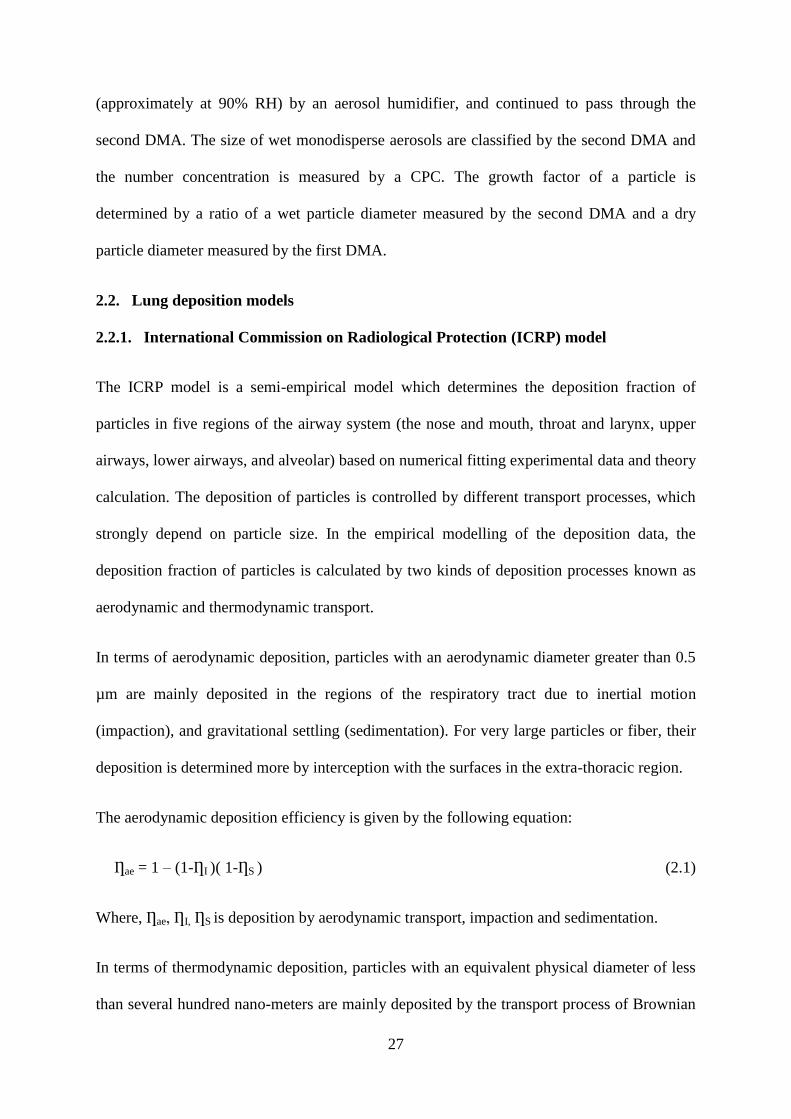
27
(approximately at 90% RH) by an aerosol humidifier, and continued to pass through the
second DMA. The size of wet monodisperse aerosols are classified by the second DMA and
the number concentration is measured by a CPC. The growth factor of a particle is
determined by a ratio of a wet particle diameter measured by the second DMA and a dry
particle diameter measured by the first DMA.
2.2. Lung deposition models
2.2.1. International Commission on Radiological Protection (ICRP) model
The ICRP model is a semi-empirical model which determines the deposition fraction of
particles in five regions of the airway system (the nose and mouth, throat and larynx, upper
airways, lower airways, and alveolar) based on numerical fitting experimental data and theory
calculation. The deposition of particles is controlled by different transport processes, which
strongly depend on particle size. In the empirical modelling of the deposition data, the
deposition fraction of particles is calculated by two kinds of deposition processes known as
aerodynamic and thermodynamic transport.
In terms of aerodynamic deposition, particles with an aerodynamic diameter greater than 0.5
µm are mainly deposited in the regions of the respiratory tract due to inertial motion
(impaction), and gravitational settling (sedimentation). For very large particles or fiber, their
deposition is determined more by interception with the surfaces in the extra-thoracic region.
The aerodynamic deposition efficiency is given by the following equation:
Ƞae = 1 – (1-ȠI )( 1-ȠS ) (2.1)
Where, Ƞae, ȠI, ȠS is deposition by aerodynamic transport, impaction and sedimentation.
In terms of thermodynamic deposition, particles with an equivalent physical diameter of less
than several hundred nano-meters are mainly deposited by the transport process of Brownian
28
diffusion. This thermodynamic transport is determined by the thermodynamic diameter of the
particle, which is considered to be equal to the particle volume equivalent diameter.
ICRP (1994) recommended that simultaneous thermodynamic and aerodynamic transport is
only significant for particles in a transit regime size range of 0.1 µm thermodynamic diameter
to 1 µm aerodynamic diameter. Thermodynamic transport predominantly accounts for the
deposition of small particles, while aerodynamic transport is mainly responsible for large
particles. For particles in a transit regime size range, their deposition efficiencies will be
combined by the following equation:
Ƞ = (Ƞth2 +Ƞae
2)1/2
(2.2)
Where, Ƞ is the total deposition and Ƞth, Ƞae is the deposition efficiencies determined by
thermodynamic and aerodynamic transport.
General equations of deposition efficiency of particles from the ICRP model
In the ICRP model, each regions of the respiratory tract is represented by an equivalent
particle filter, as shown in Figure 2.6. In the empirical filtration model, each anatomical
region can be represented by one or more filters in series, in which each filter can be
characterized by two parameters: its volume and its overall efficiency in removing airborne
particles.
The deposition efficiency (DEj) of particles that are deposited in the jth
filter is given by
equation (2.3):
𝐷𝐸𝑗 = Ƞ𝑗∅𝑗 ∏ (1 − Ƞ𝑗)𝑗−1𝑗𝑗=0 (2.3)
where, Ƞ𝑗 is the filtration efficiency of the jth
filter and ∅𝑗is the fraction of tidal air that
reaches the jth
filter on inhalation.
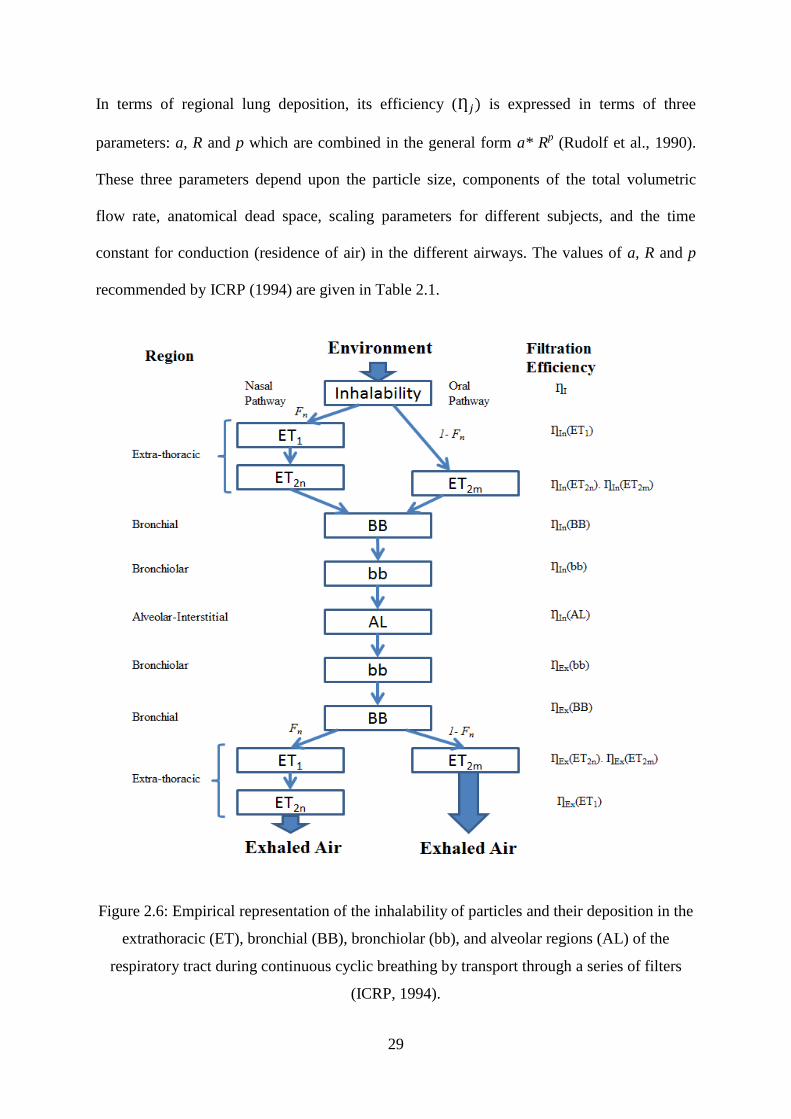
29
In terms of regional lung deposition, its efficiency (Ƞ𝑗) is expressed in terms of three
parameters: a, R and p which are combined in the general form a* Rp (Rudolf et al., 1990).
These three parameters depend upon the particle size, components of the total volumetric
flow rate, anatomical dead space, scaling parameters for different subjects, and the time
constant for conduction (residence of air) in the different airways. The values of a, R and p
recommended by ICRP (1994) are given in Table 2.1.
Figure 2.6: Empirical representation of the inhalability of particles and their deposition in the
extrathoracic (ET), bronchial (BB), bronchiolar (bb), and alveolar regions (AL) of the
respiratory tract during continuous cyclic breathing by transport through a series of filters
(ICRP, 1994).
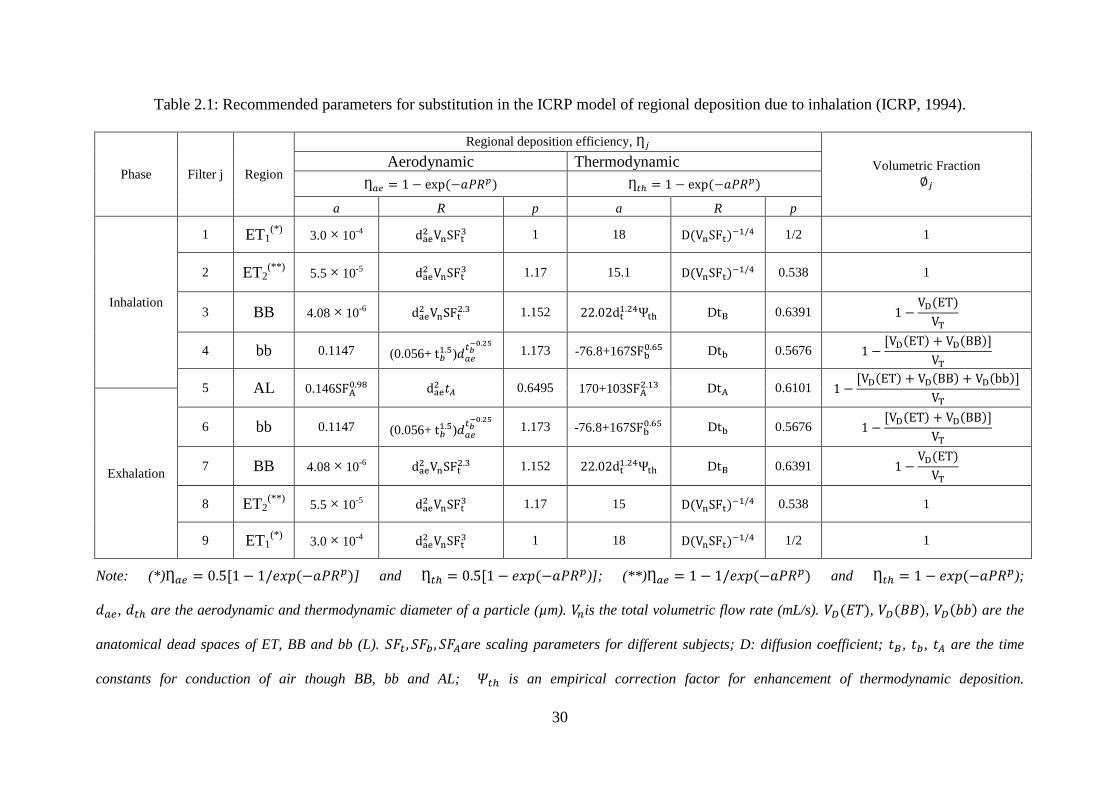
30
Table 2.1: Recommended parameters for substitution in the ICRP model of regional deposition due to inhalation (ICRP, 1994).
Phase Filter j Region
Regional deposition efficiency, Ƞ𝑗
Volumetric Fraction
∅𝑗
Aerodynamic Thermodynamic
Ƞ𝑎𝑒 = 1 − exp (−𝑎𝑃𝑅𝑝) Ƞ𝑡ℎ = 1 − exp (−𝑎𝑃𝑅𝑝)
a R p a R p
Inhalation
1 ET1(*)
3.0 × 10⁻⁴ dae
2 VnSFt3 1 18 D(VnSFt)−1/4 1/2 1
2 ET2(**)
5.5 × 10⁻⁵
dae2 VnSFt
3 1.17 15.1 D(VnSFt)−1/4 0.538 1
3 BB 4.08 × 10⁻⁶
dae2 VnSFt
2.3 1.152 22.02dt1.24Ψth DtB 0.6391 1 −
VD(ET)
VT
4 bb 0.1147 (0.056+ t𝑏1.5)𝑑𝑎𝑒
𝑡𝑏−0.25
1.173 -76.8+167SFb0.65 Dtb 0.5676 1 −
[VD(ET) + VD(BB)]
VT
5 AL 0.146SFA0.98 dae
2 𝑡𝐴 0.6495 170+103SFA2.13 DtA 0.6101 1 −
[VD(ET) + VD(BB) + VD(bb)]
VT
Exhalation
6 bb 0.1147 (0.056+ t𝑏1.5)𝑑𝑎𝑒
𝑡𝑏−0.25
1.173 -76.8+167SFb0.65 Dtb 0.5676 1 −
[VD(ET) + VD(BB)]
VT
7 BB 4.08 × 10⁻⁶
dae2 VnSFt
2.3 1.152 22.02dt1.24Ψth DtB 0.6391 1 −
VD(ET)
VT
8 ET2(**)
5.5 × 10⁻⁵
dae2 VnSFt
3 1.17 15 D(VnSFt)−1/4 0.538 1
9 ET1(*)
3.0 × 10⁻⁴ dae
2 VnSFt3 1 18 D(VnSFt)−1/4 1/2 1
Note: (*)Ƞ𝑎𝑒 = 0.5[1 − 1/𝑒𝑥𝑝 (−𝑎𝑃𝑅𝑝)] and Ƞ𝑡ℎ = 0.5[1 − 𝑒𝑥𝑝 (−𝑎𝑃𝑅𝑝)]; (**)Ƞ𝑎𝑒 = 1 − 1/𝑒𝑥𝑝 (−𝑎𝑃𝑅𝑝) and Ƞ𝑡ℎ = 1 − 𝑒𝑥𝑝 (−𝑎𝑃𝑅𝑝);
𝑑𝑎𝑒, 𝑑𝑡ℎ are the aerodynamic and thermodynamic diameter of a particle (µm). 𝑉𝑛is the total volumetric flow rate (mL/s). 𝑉𝐷(𝐸𝑇), 𝑉𝐷(𝐵𝐵), 𝑉𝐷(𝑏𝑏) are the
anatomical dead spaces of ET, BB and bb (L). 𝑆𝐹𝑡, 𝑆𝐹𝑏 , 𝑆𝐹𝐴are scaling parameters for different subjects; D: diffusion coefficient; 𝑡𝐵, 𝑡𝑏, 𝑡𝐴 are the time
constants for conduction of air though BB, bb and AL; 𝛹𝑡ℎ is an empirical correction factor for enhancement of thermodynamic deposition.
31
2.2.2. Multiple Path Particle Dosimetry (MPPD) model
The MPPD model of the human lung is a mathematical lung deposition model developed by
Asgharian et al. (2001). The MPPD model is most realistic deposition model, which
considers the branching asymmetry of airways and related air flows based on detailed
information on measured lung geometries.
There are four options of human lung structure provided in the software model: symmetric,
multiple-path, stochastic geometry and age-specific model. The symmetric and multiple path
models use a symmetric tree for the whole lung and the lobar data, as provided by Yeh and
Schum (1980). These models should be used to predict the regional lung (ET, TB, AL) or
total lung deposition of particles or average lobar-specific deposition. The stochastic model
uses data provided by Koblinger and Hofmann (1990). In this model, the asymmetric
structures of the tracheo-bronchial (TB) region are generated stochastically based on the
morphometric measurements of Yeh and Schum (1980).
This model mode can be used to accurately predict particle deposition in the specific lung
airways, as well as the regional lung; however it requires a powerful computer because of the
large datasets of generated lung structure. The age-specific model is built based on the
measurement data of Mortensen et al. (1989) and Mortensen et al. (1983). There are two
options in this model: (1) the age-specific symmetric model uses a dichotomous, branching,
symmetric tree single path model, and (2) the age-specific 5-lobe model uses 5-lobe
symmetric geometries which are similar to the Yeh-Schum 5-lobe lobar-specific model, but
different in the lung structure. These models are recommended for calculation of the particle
deposition in children and young adults in the age range from 3 months to 21 years.
Like the ICRP model, the mechanisms for particle deposition are considered by the diffusion
and sedimentation within an airway and impaction at the airway bifurcations. Therefore,
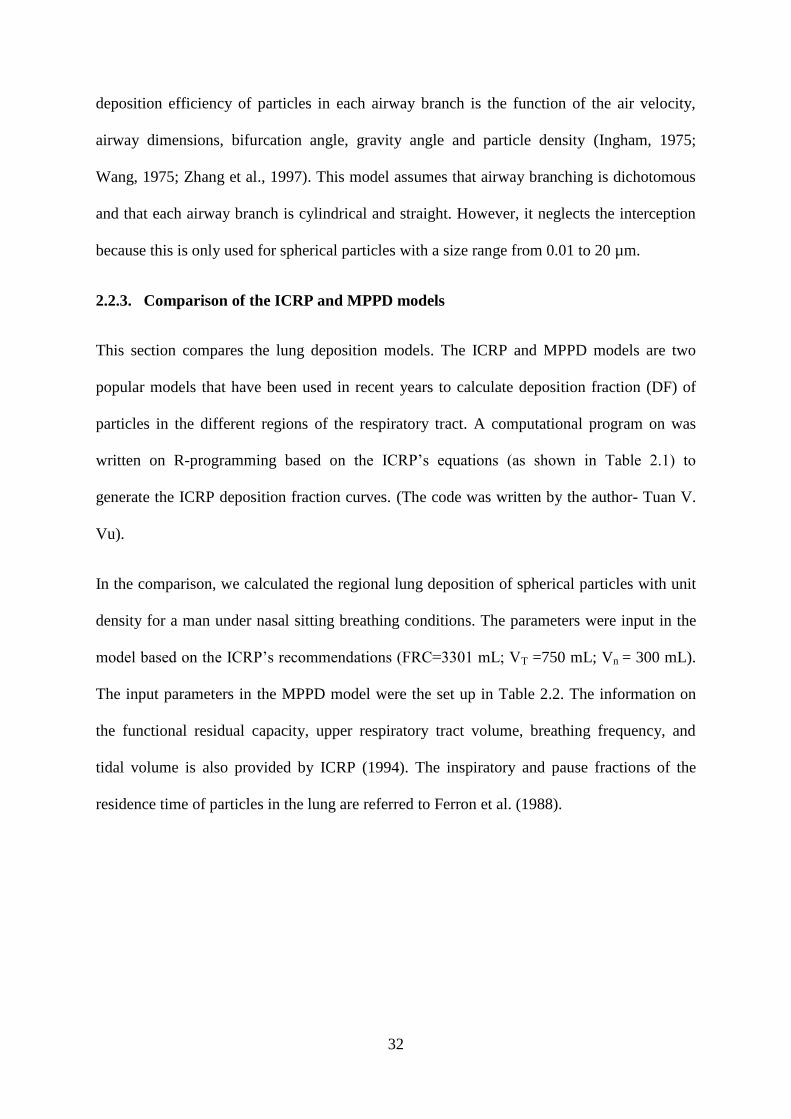
32
deposition efficiency of particles in each airway branch is the function of the air velocity,
airway dimensions, bifurcation angle, gravity angle and particle density (Ingham, 1975;
Wang, 1975; Zhang et al., 1997). This model assumes that airway branching is dichotomous
and that each airway branch is cylindrical and straight. However, it neglects the interception
because this is only used for spherical particles with a size range from 0.01 to 20 µm.
2.2.3. Comparison of the ICRP and MPPD models
This section compares the lung deposition models. The ICRP and MPPD models are two
popular models that have been used in recent years to calculate deposition fraction (DF) of
particles in the different regions of the respiratory tract. A computational program on was
written on R-programming based on the ICRP’s equations (as shown in Table 2.1) to
generate the ICRP deposition fraction curves. (The code was written by the author- Tuan V.
Vu).
In the comparison, we calculated the regional lung deposition of spherical particles with unit
density for a man under nasal sitting breathing conditions. The parameters were input in the
model based on the ICRP’s recommendations (FRC=3301 mL; VT =750 mL; Vn = 300 mL).
The input parameters in the MPPD model were the set up in Table 2.2. The information on
the functional residual capacity, upper respiratory tract volume, breathing frequency, and
tidal volume is also provided by ICRP (1994). The inspiratory and pause fractions of the
residence time of particles in the lung are referred to Ferron et al. (1988).
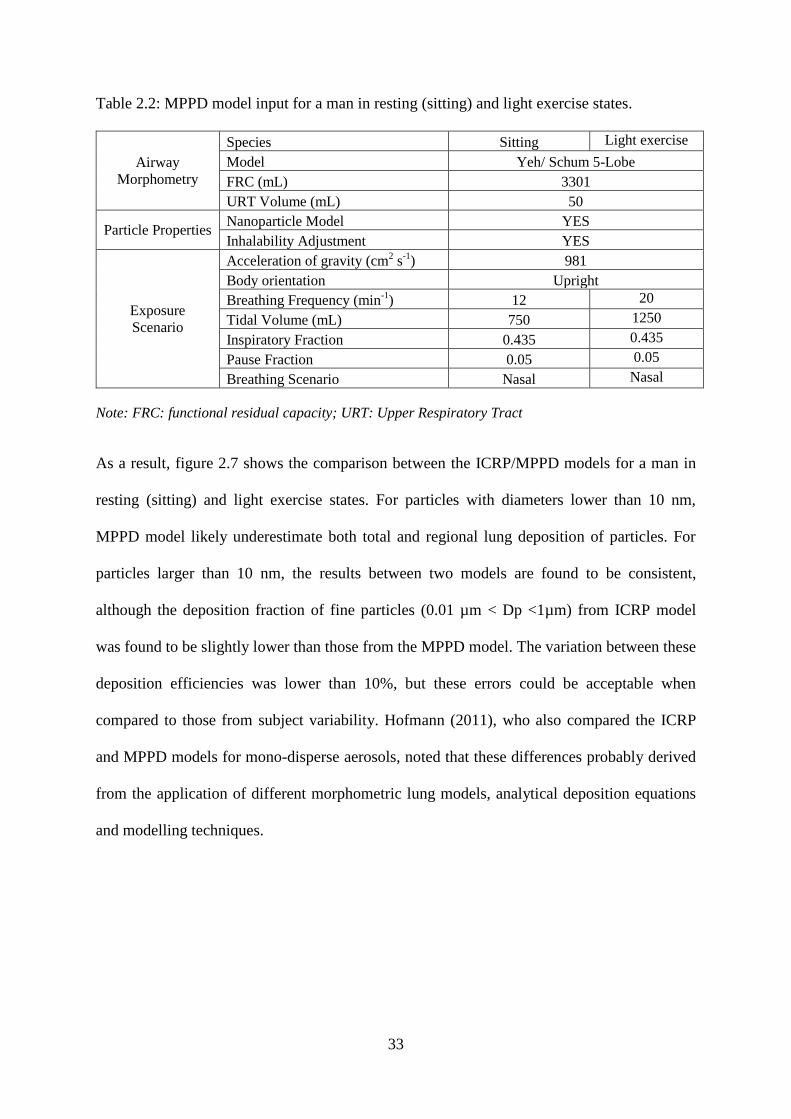
33
Table 2.2: MPPD model input for a man in resting (sitting) and light exercise states.
Airway
Morphometry
Species Sitting Light exercise
Model Yeh/ Schum 5-Lobe
FRC (mL) 3301
URT Volume (mL) 50
Particle Properties Nanoparticle Model YES
Inhalability Adjustment YES
Exposure
Scenario
Acceleration of gravity (cm2 s
-1) 981
Body orientation Upright
Breathing Frequency (min-1
) 12 20
Tidal Volume (mL) 750 1250
Inspiratory Fraction 0.435 0.435
Pause Fraction 0.05 0.05
Breathing Scenario Nasal Nasal
Note: FRC: functional residual capacity; URT: Upper Respiratory Tract
As a result, figure 2.7 shows the comparison between the ICRP/MPPD models for a man in
resting (sitting) and light exercise states. For particles with diameters lower than 10 nm,
MPPD model likely underestimate both total and regional lung deposition of particles. For
particles larger than 10 nm, the results between two models are found to be consistent,
although the deposition fraction of fine particles (0.01 µm < Dp <1µm) from ICRP model
was found to be slightly lower than those from the MPPD model. The variation between these
deposition efficiencies was lower than 10%, but these errors could be acceptable when
compared to those from subject variability. Hofmann (2011), who also compared the ICRP
and MPPD models for mono-disperse aerosols, noted that these differences probably derived
from the application of different morphometric lung models, analytical deposition equations
and modelling techniques.
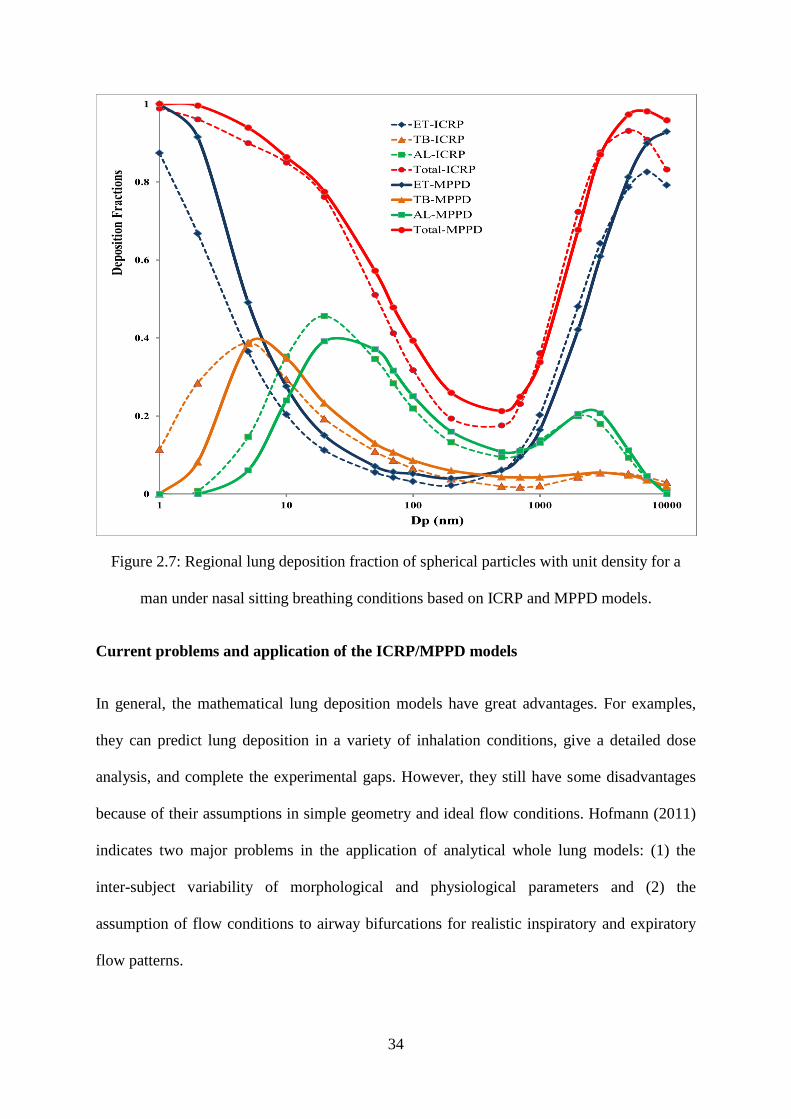
34
Figure 2.7: Regional lung deposition fraction of spherical particles with unit density for a
man under nasal sitting breathing conditions based on ICRP and MPPD models.
Current problems and application of the ICRP/MPPD models
In general, the mathematical lung deposition models have great advantages. For examples,
they can predict lung deposition in a variety of inhalation conditions, give a detailed dose
analysis, and complete the experimental gaps. However, they still have some disadvantages
because of their assumptions in simple geometry and ideal flow conditions. Hofmann (2011)
indicates two major problems in the application of analytical whole lung models: (1) the
inter-subject variability of morphological and physiological parameters and (2) the
assumption of flow conditions to airway bifurcations for realistic inspiratory and expiratory
flow patterns.
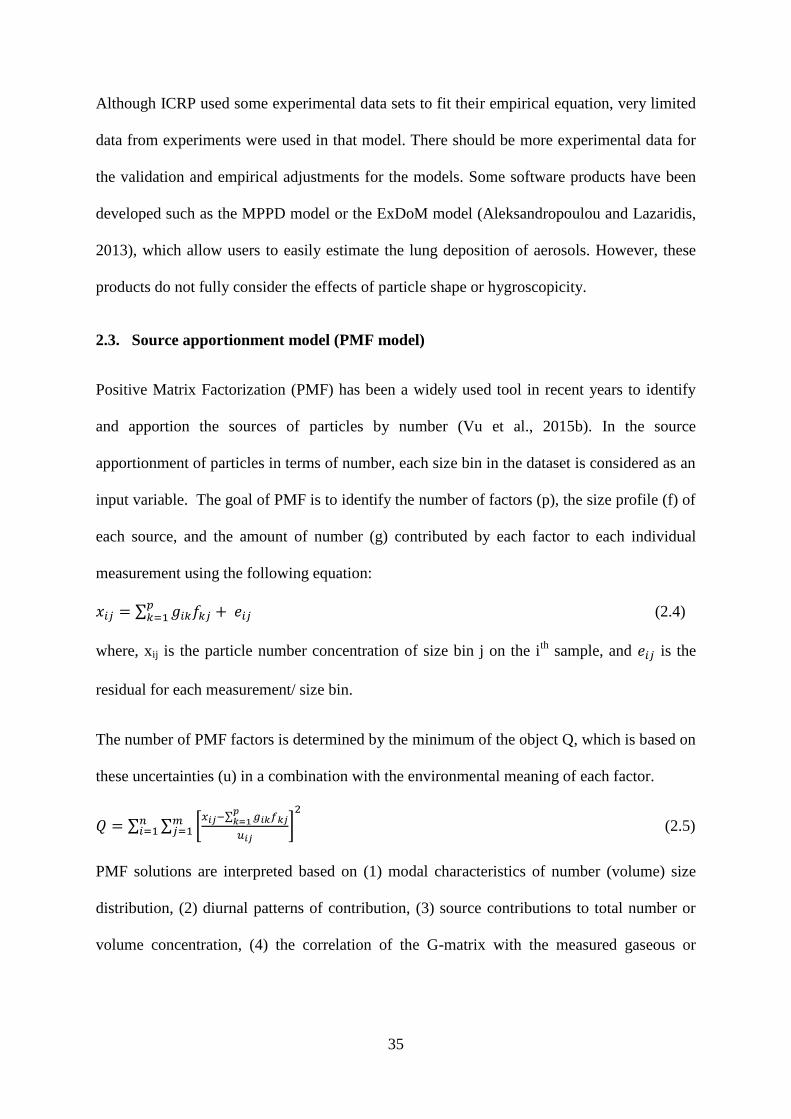
35
Although ICRP used some experimental data sets to fit their empirical equation, very limited
data from experiments were used in that model. There should be more experimental data for
the validation and empirical adjustments for the models. Some software products have been
developed such as the MPPD model or the ExDoM model (Aleksandropoulou and Lazaridis,
2013), which allow users to easily estimate the lung deposition of aerosols. However, these
products do not fully consider the effects of particle shape or hygroscopicity.
2.3. Source apportionment model (PMF model)
Positive Matrix Factorization (PMF) has been a widely used tool in recent years to identify
and apportion the sources of particles by number (Vu et al., 2015b). In the source
apportionment of particles in terms of number, each size bin in the dataset is considered as an
input variable. The goal of PMF is to identify the number of factors (p), the size profile (f) of
each source, and the amount of number (g) contributed by each factor to each individual
measurement using the following equation:
𝑥𝑖𝑗 = ∑ 𝑔𝑖𝑘𝑓𝑘𝑗 + 𝑒𝑖𝑗𝑝𝑘=1 (2.4)
where, xij is the particle number concentration of size bin j on the ith
sample, and 𝑒𝑖𝑗 is the
residual for each measurement/ size bin.
The number of PMF factors is determined by the minimum of the object Q, which is based on
these uncertainties (u) in a combination with the environmental meaning of each factor.
𝑄 = ∑ ∑ [𝑥𝑖𝑗−∑ 𝑔𝑖𝑘𝑓𝑘𝑗
𝑝𝑘=1
𝑢𝑖𝑗]
2𝑚𝑗=1
𝑛𝑖=1 (2.5)
PMF solutions are interpreted based on (1) modal characteristics of number (volume) size
distribution, (2) diurnal patterns of contribution, (3) source contributions to total number or
volume concentration, (4) the correlation of the G-matrix with the measured gaseous or
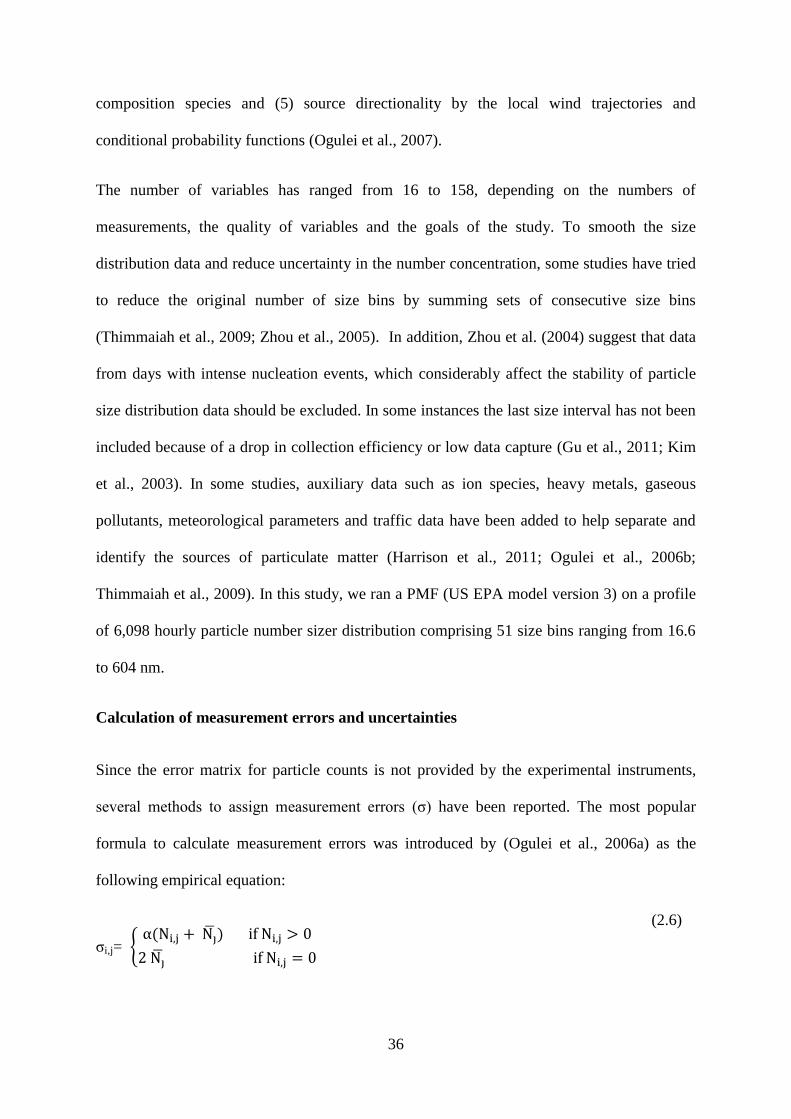
36
composition species and (5) source directionality by the local wind trajectories and
conditional probability functions (Ogulei et al., 2007).
The number of variables has ranged from 16 to 158, depending on the numbers of
measurements, the quality of variables and the goals of the study. To smooth the size
distribution data and reduce uncertainty in the number concentration, some studies have tried
to reduce the original number of size bins by summing sets of consecutive size bins
(Thimmaiah et al., 2009; Zhou et al., 2005). In addition, Zhou et al. (2004) suggest that data
from days with intense nucleation events, which considerably affect the stability of particle
size distribution data should be excluded. In some instances the last size interval has not been
included because of a drop in collection efficiency or low data capture (Gu et al., 2011; Kim
et al., 2003). In some studies, auxiliary data such as ion species, heavy metals, gaseous
pollutants, meteorological parameters and traffic data have been added to help separate and
identify the sources of particulate matter (Harrison et al., 2011; Ogulei et al., 2006b;
Thimmaiah et al., 2009). In this study, we ran a PMF (US EPA model version 3) on a profile
of 6,098 hourly particle number sizer distribution comprising 51 size bins ranging from 16.6
to 604 nm.
Calculation of measurement errors and uncertainties
Since the error matrix for particle counts is not provided by the experimental instruments,
several methods to assign measurement errors (σ) have been reported. The most popular
formula to calculate measurement errors was introduced by (Ogulei et al., 2006a) as the
following empirical equation:
σi,j= {α(Ni,j + Nj) if Ni,j > 0
2 Nj if Ni,j = 0
(2.6)
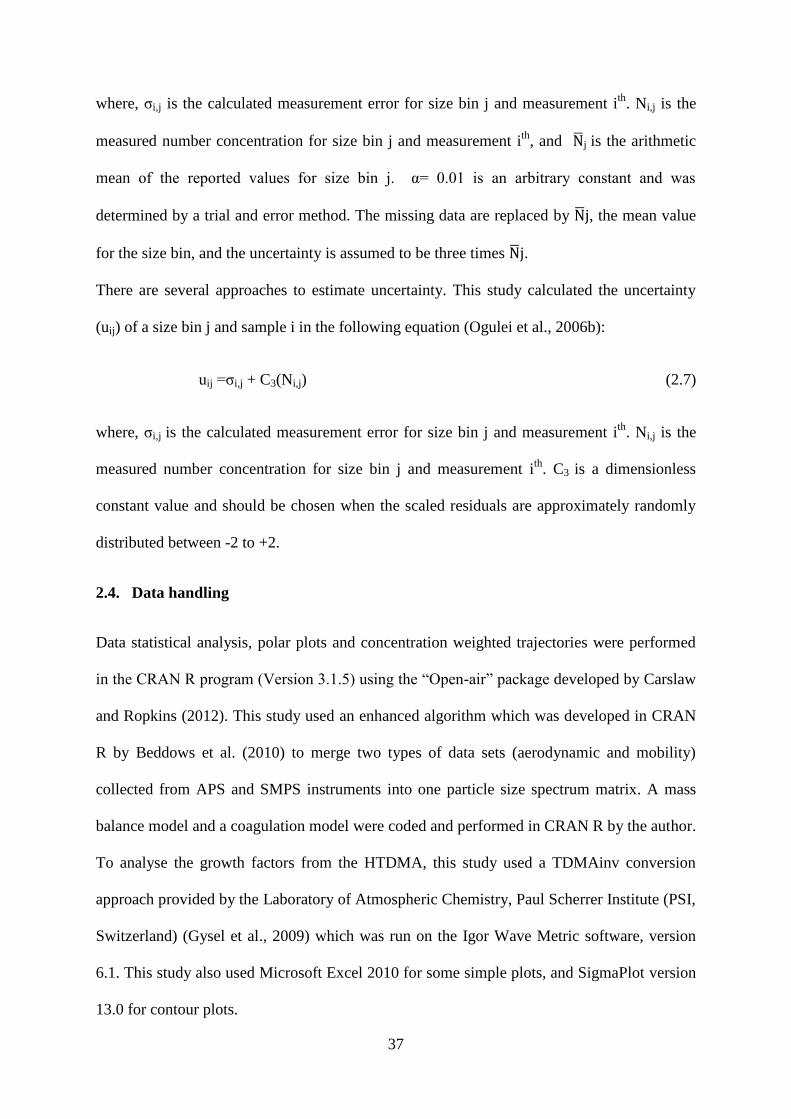
37
where, σi,j is the calculated measurement error for size bin j and measurement ith
. Ni,j is the
measured number concentration for size bin j and measurement ith
, and Nj is the arithmetic
mean of the reported values for size bin j. α= 0.01 is an arbitrary constant and was
determined by a trial and error method. The missing data are replaced by Nj, the mean value
for the size bin, and the uncertainty is assumed to be three times Nj.
There are several approaches to estimate uncertainty. This study calculated the uncertainty
(uij) of a size bin j and sample i in the following equation (Ogulei et al., 2006b):
uij =σi,j + C3(Ni,j) (2.7)
where, σi,j is the calculated measurement error for size bin j and measurement ith
. Ni,j is the
measured number concentration for size bin j and measurement ith
. C3 is a dimensionless
constant value and should be chosen when the scaled residuals are approximately randomly
distributed between -2 to +2.
2.4. Data handling
Data statistical analysis, polar plots and concentration weighted trajectories were performed
in the CRAN R program (Version 3.1.5) using the “Open-air” package developed by Carslaw
and Ropkins (2012). This study used an enhanced algorithm which was developed in CRAN
R by Beddows et al. (2010) to merge two types of data sets (aerodynamic and mobility)
collected from APS and SMPS instruments into one particle size spectrum matrix. A mass
balance model and a coagulation model were coded and performed in CRAN R by the author.
To analyse the growth factors from the HTDMA, this study used a TDMAinv conversion
approach provided by the Laboratory of Atmospheric Chemistry, Paul Scherrer Institute (PSI,
Switzerland) (Gysel et al., 2009) which was run on the Igor Wave Metric software, version
6.1. This study also used Microsoft Excel 2010 for some simple plots, and SigmaPlot version
13.0 for contour plots.
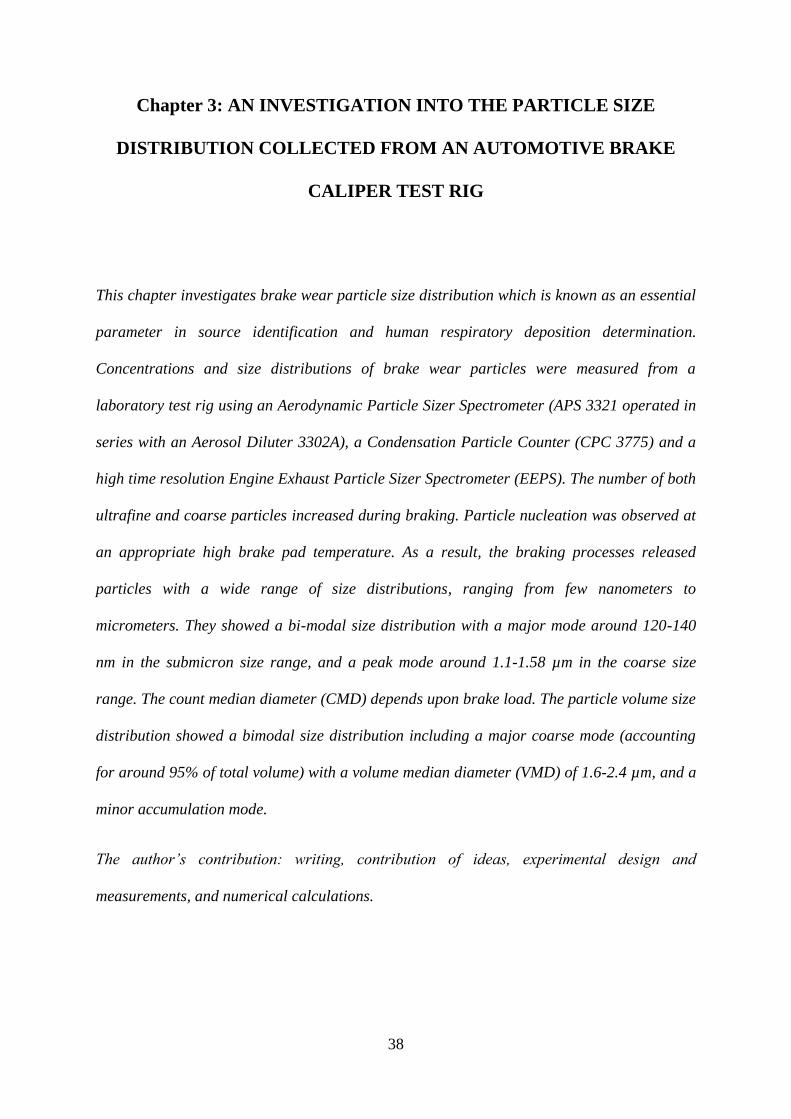
38
Chapter 3: AN INVESTIGATION INTO THE PARTICLE SIZE
DISTRIBUTION COLLECTED FROM AN AUTOMOTIVE BRAKE
CALIPER TEST RIG
This chapter investigates brake wear particle size distribution which is known as an essential
parameter in source identification and human respiratory deposition determination.
Concentrations and size distributions of brake wear particles were measured from a
laboratory test rig using an Aerodynamic Particle Sizer Spectrometer (APS 3321 operated in
series with an Aerosol Diluter 3302A), a Condensation Particle Counter (CPC 3775) and a
high time resolution Engine Exhaust Particle Sizer Spectrometer (EEPS). The number of both
ultrafine and coarse particles increased during braking. Particle nucleation was observed at
an appropriate high brake pad temperature. As a result, the braking processes released
particles with a wide range of size distributions, ranging from few nanometers to
micrometers. They showed a bi-modal size distribution with a major mode around 120-140
nm in the submicron size range, and a peak mode around 1.1-1.58 µm in the coarse size
range. The count median diameter (CMD) depends upon brake load. The particle volume size
distribution showed a bimodal size distribution including a major coarse mode (accounting
for around 95% of total volume) with a volume median diameter (VMD) of 1.6-2.4 µm, and a
minor accumulation mode.
The author’s contribution: writing, contribution of ideas, experimental design and
measurements, and numerical calculations.
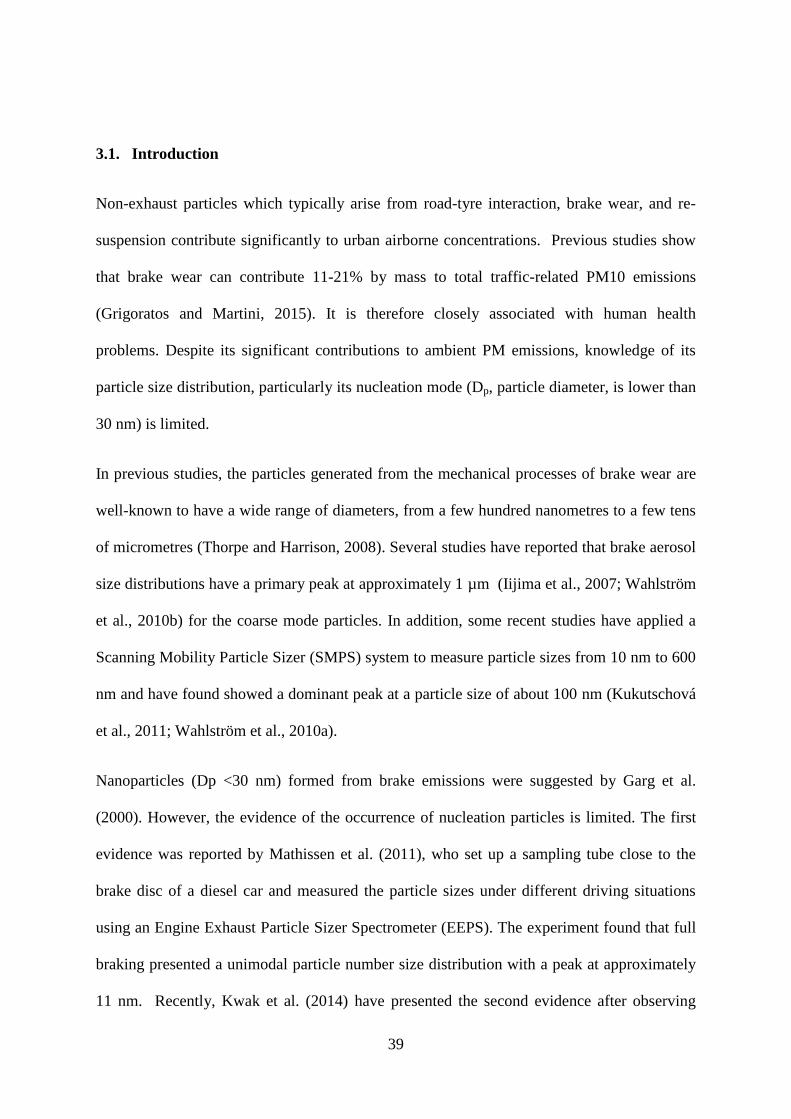
39
3.1. Introduction
Non-exhaust particles which typically arise from road-tyre interaction, brake wear, and re-
suspension contribute significantly to urban airborne concentrations. Previous studies show
that brake wear can contribute 11-21% by mass to total traffic-related PM10 emissions
(Grigoratos and Martini, 2015). It is therefore closely associated with human health
problems. Despite its significant contributions to ambient PM emissions, knowledge of its
particle size distribution, particularly its nucleation mode (Dp, particle diameter, is lower than
30 nm) is limited.
In previous studies, the particles generated from the mechanical processes of brake wear are
well-known to have a wide range of diameters, from a few hundred nanometres to a few tens
of micrometres (Thorpe and Harrison, 2008). Several studies have reported that brake aerosol
size distributions have a primary peak at approximately 1 µm (Iijima et al., 2007; Wahlström
et al., 2010b) for the coarse mode particles. In addition, some recent studies have applied a
Scanning Mobility Particle Sizer (SMPS) system to measure particle sizes from 10 nm to 600
nm and have found showed a dominant peak at a particle size of about 100 nm (Kukutschová
et al., 2011; Wahlström et al., 2010a).
Nanoparticles (Dp <30 nm) formed from brake emissions were suggested by Garg et al.
(2000). However, the evidence of the occurrence of nucleation particles is limited. The first
evidence was reported by Mathissen et al. (2011), who set up a sampling tube close to the
brake disc of a diesel car and measured the particle sizes under different driving situations
using an Engine Exhaust Particle Sizer Spectrometer (EEPS). The experiment found that full
braking presented a unimodal particle number size distribution with a peak at approximately
11 nm. Recently, Kwak et al. (2014) have presented the second evidence after observing
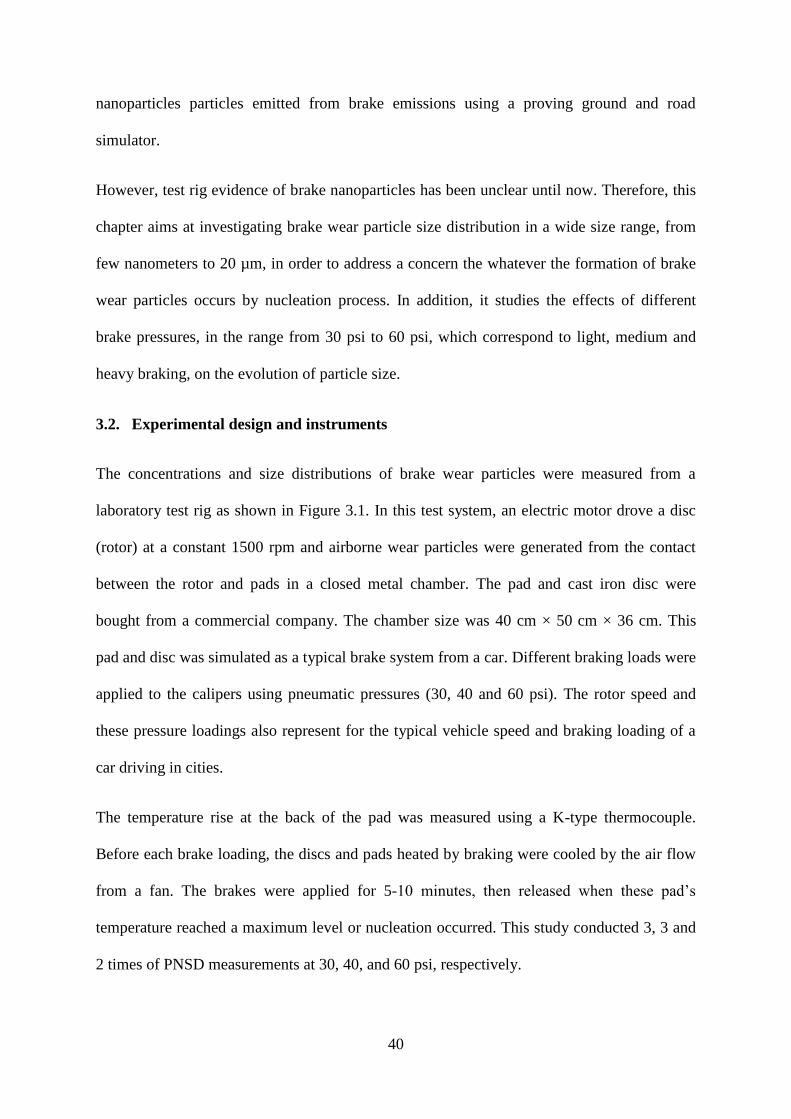
40
nanoparticles particles emitted from brake emissions using a proving ground and road
simulator.
However, test rig evidence of brake nanoparticles has been unclear until now. Therefore, this
chapter aims at investigating brake wear particle size distribution in a wide size range, from
few nanometers to 20 µm, in order to address a concern the whatever the formation of brake
wear particles occurs by nucleation process. In addition, it studies the effects of different
brake pressures, in the range from 30 psi to 60 psi, which correspond to light, medium and
heavy braking, on the evolution of particle size.
3.2. Experimental design and instruments
The concentrations and size distributions of brake wear particles were measured from a
laboratory test rig as shown in Figure 3.1. In this test system, an electric motor drove a disc
(rotor) at a constant 1500 rpm and airborne wear particles were generated from the contact
between the rotor and pads in a closed metal chamber. The pad and cast iron disc were
bought from a commercial company. The chamber size was 40 cm × 50 cm × 36 cm. This
pad and disc was simulated as a typical brake system from a car. Different braking loads were
applied to the calipers using pneumatic pressures (30, 40 and 60 psi). The rotor speed and
these pressure loadings also represent for the typical vehicle speed and braking loading of a
car driving in cities.
The temperature rise at the back of the pad was measured using a K-type thermocouple.
Before each brake loading, the discs and pads heated by braking were cooled by the air flow
from a fan. The brakes were applied for 5-10 minutes, then released when these pad’s
temperature reached a maximum level or nucleation occurred. This study conducted 3, 3 and
2 times of PNSD measurements at 30, 40, and 60 psi, respectively.
41
Figure 3.1: Schematic diagram of the test system.
The brake caliper- disc assembly was concealed within a simple metal enclosure. A sampling
inlet was connected to a suite of aerosol instruments which measured the size distribution of
the particles generated across the size range of 0.06–18 µm. The instruments included an
Aerodynamic Particle Sizer Spectrometer (TSI APS model 3321 operated in series with a TSI
Aerosol diluter model 3302A), a Condensation Particle Counter (TSI CPC model 3775) and a
high time resolution Engine Exhaust Particle Sizer Spectrometer (TSI EEPS model 3090).
The list of instruments and their operation details are given in Table 3.1.
Table 3.1: List of instruments used in the brake rig test.
Instruments Size range Resolution Measurement parameter/symbol
Aerosol Diluter 3302A dilution
ratio 100:1
Continuous
working
For diluting aerosol from the brake
emission
Aerodynamic Particle Sizer
Spectrometer (APS 3321) 0.53-20 µm 60 s
Particle number size distribution
(aerodynamic diameter)
Condensation Particle Counter
(CPC 3775) >4 nm 0.1 s Total number concentration
Engine Exhaust Particle Sizer
Spectrometer (EEPS 3090)
5.6 - 560
nm 0.1 s
Particle number size distribution
(mobility diameter)
Digital Thermometer (RS 206-
3722) - 1 s Pad temperature measurement
42
3.3. Results
3.3.1. Particle number, surface and mass concentrations
Number concentration
The submicron particle number concentrations were measured by the CPC 3775 and EEPS,
while super-micron and coarse particles were measured by an APS sampler. When the
braking pressure was applied, the particle number concentrations suddenly increased and
reached their maximum values in the first minute of braking. For example, the total
concentrations in the first minute of braking at a 45 psi load were 2.2 × 10⁴ and 1.1 × 10
4
particle cm-3
for submicron particles and super-micron particles (0.6 µm< Da <18 µm)
measured by CPC and APS while these values were 7.5 × 10³ and 157 particles cm
-3,
respectively in the background air.
In the next minute of braking, these numbers dropped dramatically to stable values around
1.1 × 10⁴ and 7.1 × 10
3 particles cm
-3. When the braking continued, the pad temperature
increased, therefore generating more concentrations of volatile organic compounds. When the
temperature increased to a critical level and the concentrations of volatile organic compounds
were high enough to be saturated, nucleation occurred, as seen in Figure 3.2. Nucleation
events were found at 45 psi (around 118.7-144.3 oC) and at 60 psi braking loads (at 155.6
oC). There was no nucleation event at 30 psi braking.
A decrease in the total number concentration of larger particles was found during nucleation.
When braking stopped, nucleation was immediately suppressed. As shown in Table 3.2, the
total number concentration of particles increased with higher braking loads.
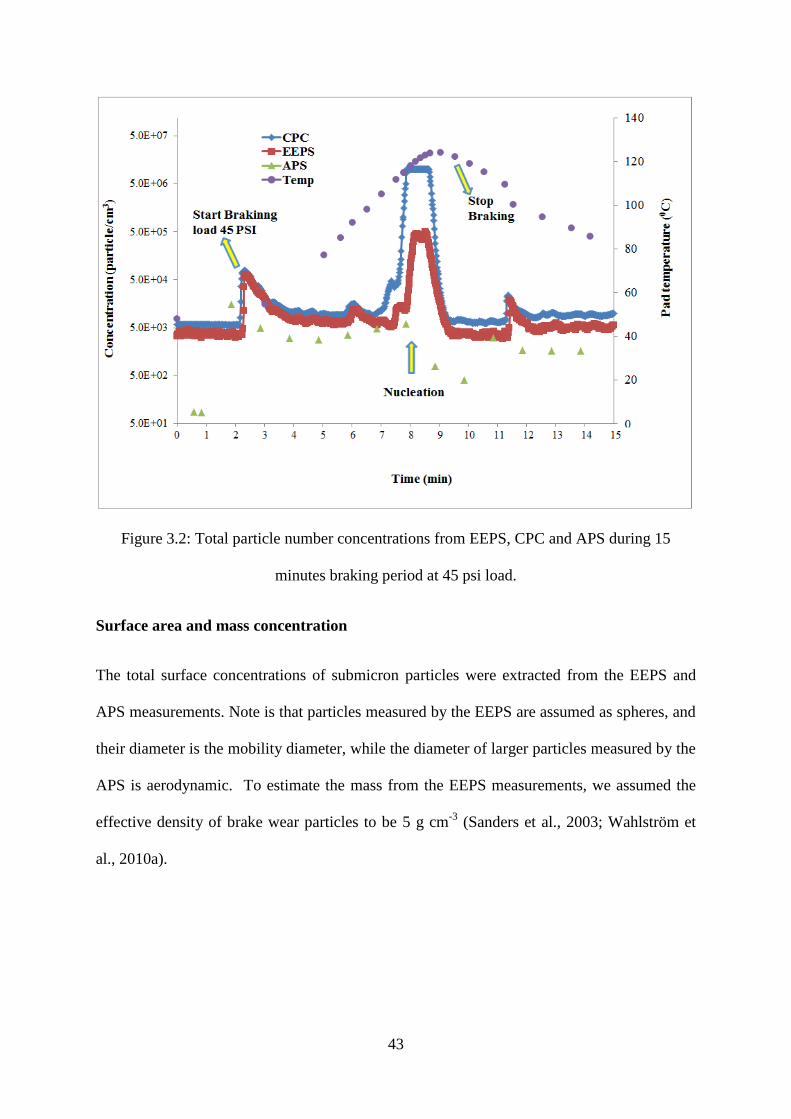
43
Figure 3.2: Total particle number concentrations from EEPS, CPC and APS during 15
minutes braking period at 45 psi load.
Surface area and mass concentration
The total surface concentrations of submicron particles were extracted from the EEPS and
APS measurements. Note is that particles measured by the EEPS are assumed as spheres, and
their diameter is the mobility diameter, while the diameter of larger particles measured by the
APS is aerodynamic. To estimate the mass from the EEPS measurements, we assumed the
effective density of brake wear particles to be 5 g cm-3
(Sanders et al., 2003; Wahlström et
al., 2010a).
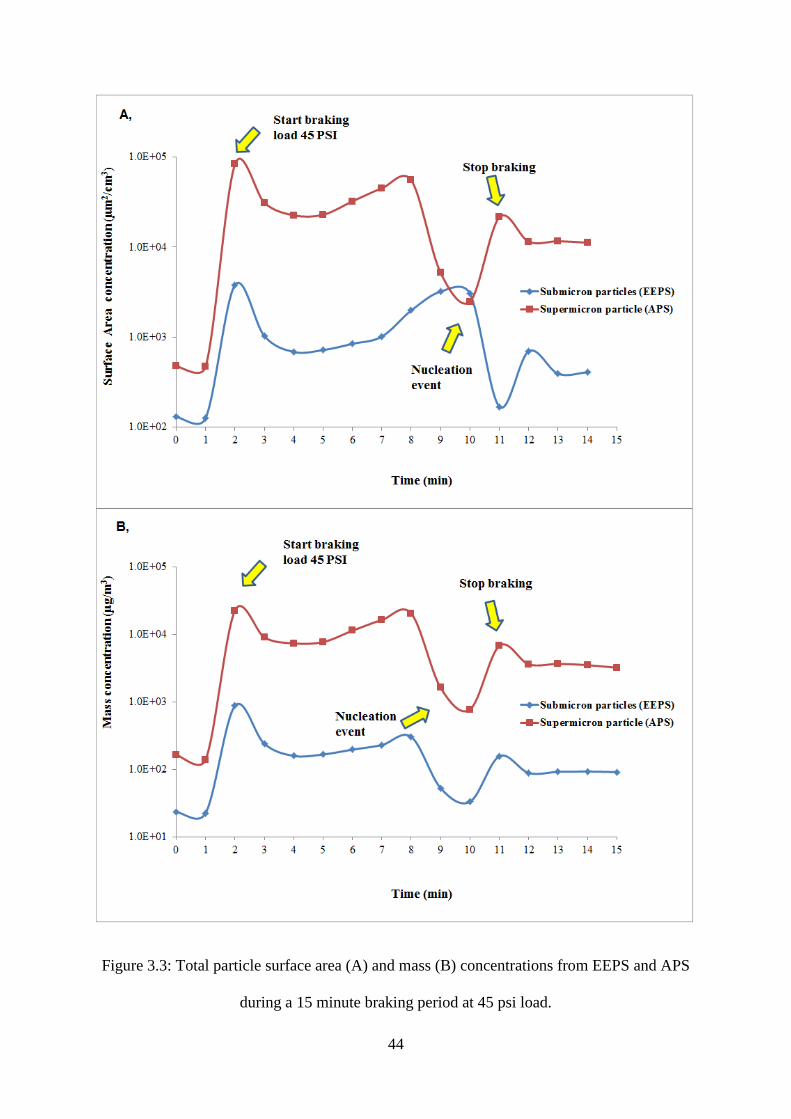
44
Figure 3.3: Total particle surface area (A) and mass (B) concentrations from EEPS and APS
during a 15 minute braking period at 45 psi load.
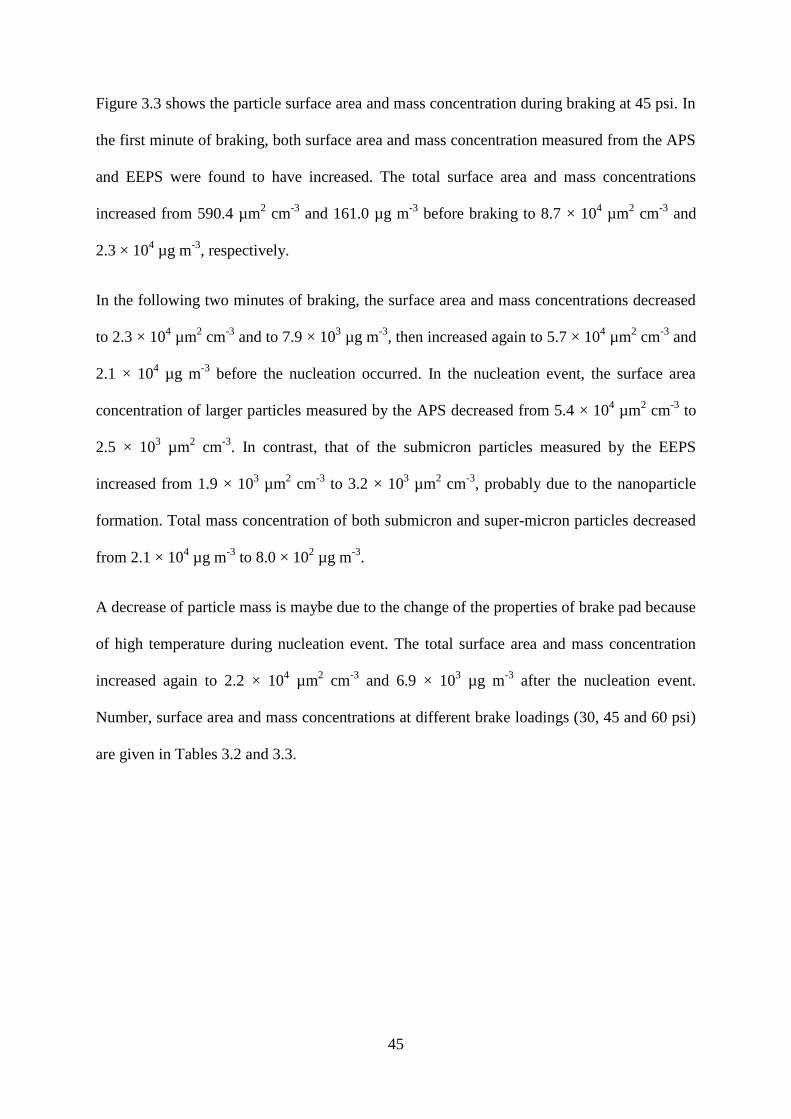
45
Figure 3.3 shows the particle surface area and mass concentration during braking at 45 psi. In
the first minute of braking, both surface area and mass concentration measured from the APS
and EEPS were found to have increased. The total surface area and mass concentrations
increased from 590.4 µm2 cm
-3 and 161.0 µg m
-3 before braking to 8.7 × 10
4 µm
2 cm
-3 and
2.3 × 10⁴ µg m
-3, respectively.
In the following two minutes of braking, the surface area and mass concentrations decreased
to 2.3 × 104 µm
2 cm
-3 and to 7.9 × 10
3 µg m
-3, then increased again to 5.7 × 10
4 µm
2 cm
-3 and
2.1 × 10⁴ µg m
-3 before the nucleation occurred. In the nucleation event, the surface area
concentration of larger particles measured by the APS decreased from 5.4 × 104 µm
2 cm
-3 to
2.5 × 103 µm
2 cm
-3. In contrast, that of the submicron particles measured by the EEPS
increased from 1.9 × 103 µm
2 cm
-3 to 3.2 × 10
3 µm
2 cm
-3, probably due to the nanoparticle
formation. Total mass concentration of both submicron and super-micron particles decreased
from 2.1 × 10⁴ µg m
-3 to 8.0 × 10
2 µg m
-3.
A decrease of particle mass is maybe due to the change of the properties of brake pad because
of high temperature during nucleation event. The total surface area and mass concentration
increased again to 2.2 × 104 µm
2 cm
-3 and 6.9 × 10
3 µg m
-3 after the nucleation event.
Number, surface area and mass concentrations at different brake loadings (30, 45 and 60 psi)
are given in Tables 3.2 and 3.3.
46
Table 3.2: Particle number concentration and size during experiments at different brake loads (30, 45 and 60 psi).
Press. Instru-
ments
Before braking Braking start point Braking Nucleation After braking stops
TN (103) CMD TN (10
3) CMD TN (10
3) CMD Temp. TN (10
3) CMD
TN
(103) CMD
30 PSI
CPC 9.3±2.5 - 22.5±0.7 - 12.3±1.8 - Max
100 No Nucleation event
7.0±1.1 -
EEPS 6.1±1.4 60±7 16.1±1.1 130±18 11.2±3.3 108±12 5.2±2.2 73±28
APS 0.24±0.12 1.0±0.1 7.9±4.3 1.1±0.1 2.8±0.2 1.3±0.1 0.4±0.1 1.0±0.1
45 PSI
CPC 11.0±4.5 - 37.9±14.9 - 17.5±7.8 - 118.7-
144.3
- 15.7±6.0 15.7±6.0 -
EEPS 5.9±1.9 59±15 25.5±10.3 140±14 10.3±4.3 122±18 - 7.9±2.2 7.9±2.2 49±29
APS 0.9±0.4 1.1±0.1 11.6±4.8 1.1±0.1 4.0±0.2 1.4±0.1 1.9±1.1 2.2±0.2 2.2±0.2 1.2±0.1
60 PSI
CPC 26.4±4.5 - 66.0±9.3 - 32.0±7.7 -
155.6
- 28.7±8.1 28.7±8.1 -
EEPS 21.0±4.3 59±2 45.8±6.3 139±8 23.3±4.9 132±11 - 13.3±2.1 13.3±2.1 46±8
APS 2.9±2.4 1.1±0.1 11.2±2.9 1.2±0.1 8.3±2.6 1.5±0.1 1.1±0.6 1.7±0.2 1.7±0.2 1.2±0.1
Note: TN: Total number of particles (particles cm-3
); CMD: Count Median Diameter for EEPS (nm) and APS (µm).
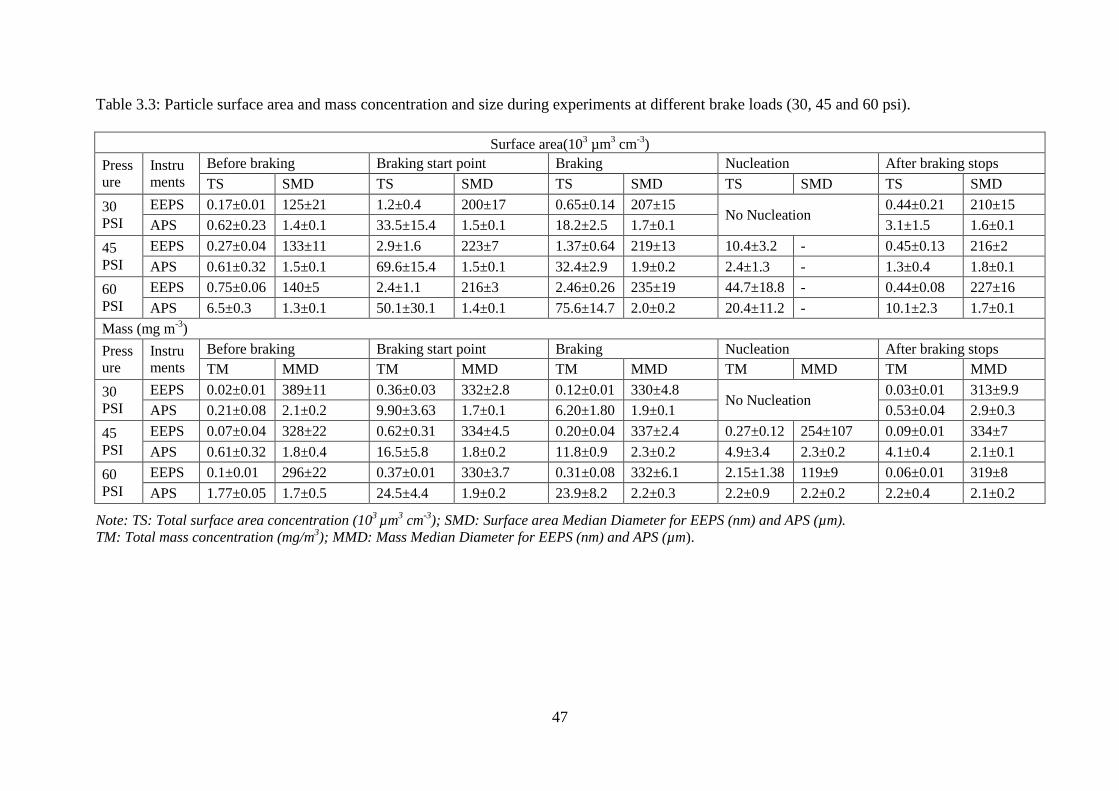
47
Table 3.3: Particle surface area and mass concentration and size during experiments at different brake loads (30, 45 and 60 psi).
Surface area(103 µm
3 cm
-3)
Press
ure
Instru
ments
Before braking Braking start point Braking Nucleation After braking stops
TS SMD TS SMD TS SMD TS SMD TS SMD
30
PSI
EEPS 0.17±0.01 125±21 1.2±0.4 200±17 0.65±0.14 207±15 No Nucleation
0.44±0.21 210±15
APS 0.62±0.23 1.4±0.1 33.5±15.4 1.5±0.1 18.2±2.5 1.7±0.1 3.1±1.5 1.6±0.1
45
PSI
EEPS 0.27±0.04 133±11 2.9±1.6 223±7 1.37±0.64 219±13 10.4±3.2 - 0.45±0.13 216±2
APS 0.61±0.32 1.5±0.1 69.6±15.4 1.5±0.1 32.4±2.9 1.9±0.2 2.4±1.3 - 1.3±0.4 1.8±0.1
60
PSI
EEPS 0.75±0.06 140±5 2.4±1.1 216±3 2.46±0.26 235±19 44.7±18.8 - 0.44±0.08 227±16
APS 6.5±0.3 1.3±0.1 50.1±30.1 1.4±0.1 75.6±14.7 2.0±0.2 20.4±11.2 - 10.1±2.3 1.7±0.1
Mass (mg m-3
)
Press
ure
Instru
ments
Before braking Braking start point Braking Nucleation After braking stops
TM MMD TM MMD TM MMD TM MMD TM MMD
30
PSI
EEPS 0.02±0.01 389±11 0.36±0.03 332±2.8 0.12±0.01 330±4.8 No Nucleation
0.03±0.01 313±9.9
APS 0.21±0.08 2.1±0.2 9.90±3.63 1.7±0.1 6.20±1.80 1.9±0.1 0.53±0.04 2.9±0.3
45
PSI
EEPS 0.07±0.04 328±22 0.62±0.31 334±4.5 0.20±0.04 337±2.4 0.27±0.12 254±107 0.09±0.01 334±7
APS 0.61±0.32 1.8±0.4 16.5±5.8 1.8±0.2 11.8±0.9 2.3±0.2 4.9±3.4 2.3±0.2 4.1±0.4 2.1±0.1
60
PSI
EEPS 0.1±0.01 296±22 0.37±0.01 330±3.7 0.31±0.08 332±6.1 2.15±1.38 119±9 0.06±0.01 319±8
APS 1.77±0.05 1.7±0.5 24.5±4.4 1.9±0.2 23.9±8.2 2.2±0.3 2.2±0.9 2.2±0.2 2.2±0.4 2.1±0.2
Note: TS: Total surface area concentration (103 µm
3 cm
-3); SMD: Surface area Median Diameter for EEPS (nm) and APS (µm).
TM: Total mass concentration (mg/m3); MMD: Mass Median Diameter for EEPS (nm) and APS (µm).
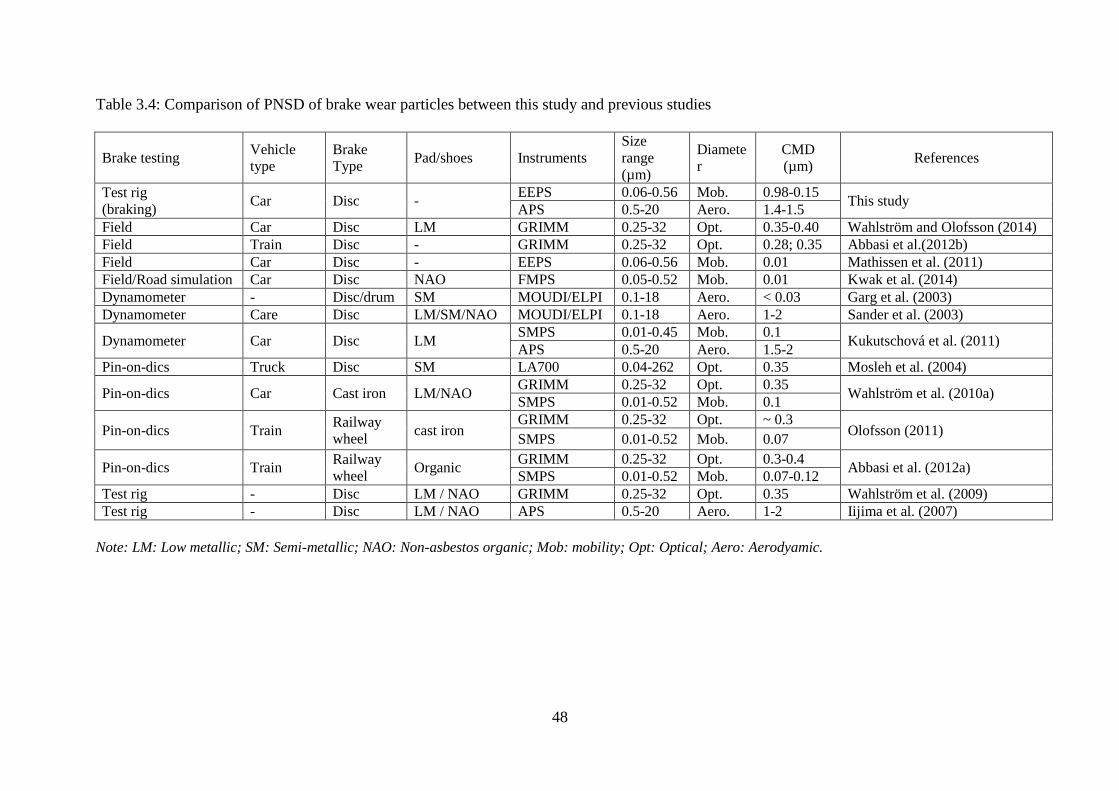
48
Table 3.4: Comparison of PNSD of brake wear particles between this study and previous studies
Brake testing Vehicle
type
Brake
Type Pad/shoes Instruments
Size
range
(µm)
Diamete
r
CMD
(µm) References
Test rig
(braking) Car Disc -
EEPS 0.06-0.56 Mob. 0.98-0.15 This study
APS 0.5-20 Aero. 1.4-1.5
Field Car Disc LM GRIMM 0.25-32 Opt. 0.35-0.40 Wahlström and Olofsson (2014)
Field Train Disc - GRIMM 0.25-32 Opt. 0.28; 0.35 Abbasi et al.(2012b)
Field Car Disc - EEPS 0.06-0.56 Mob. 0.01 Mathissen et al. (2011)
Field/Road simulation Car Disc NAO FMPS 0.05-0.52 Mob. 0.01 Kwak et al. (2014)
Dynamometer - Disc/drum SM MOUDI/ELPI 0.1-18 Aero. < 0.03 Garg et al. (2003)
Dynamometer Care Disc LM/SM/NAO MOUDI/ELPI 0.1-18 Aero. 1-2 Sander et al. (2003)
Dynamometer Car Disc LM SMPS 0.01-0.45 Mob. 0.1
Kukutschová et al. (2011) APS 0.5-20 Aero. 1.5-2
Pin-on-dics Truck Disc SM LA700 0.04-262 Opt. 0.35 Mosleh et al. (2004)
Pin-on-dics Car Cast iron LM/NAO GRIMM 0.25-32 Opt. 0.35
Wahlström et al. (2010a) SMPS 0.01-0.52 Mob. 0.1
Pin-on-dics Train Railway
wheel cast iron
GRIMM 0.25-32 Opt. ~ 0.3 Olofsson (2011)
SMPS 0.01-0.52 Mob. 0.07
Pin-on-dics Train Railway
wheel Organic
GRIMM 0.25-32 Opt. 0.3-0.4 Abbasi et al. (2012a)
SMPS 0.01-0.52 Mob. 0.07-0.12
Test rig - Disc LM / NAO GRIMM 0.25-32 Opt. 0.35 Wahlström et al. (2009)
Test rig - Disc LM / NAO APS 0.5-20 Aero. 1-2 Iijima et al. (2007)
Note: LM: Low metallic; SM: Semi-metallic; NAO: Non-asbestos organic; Mob: mobility; Opt: Optical; Aero: Aerodyamic.
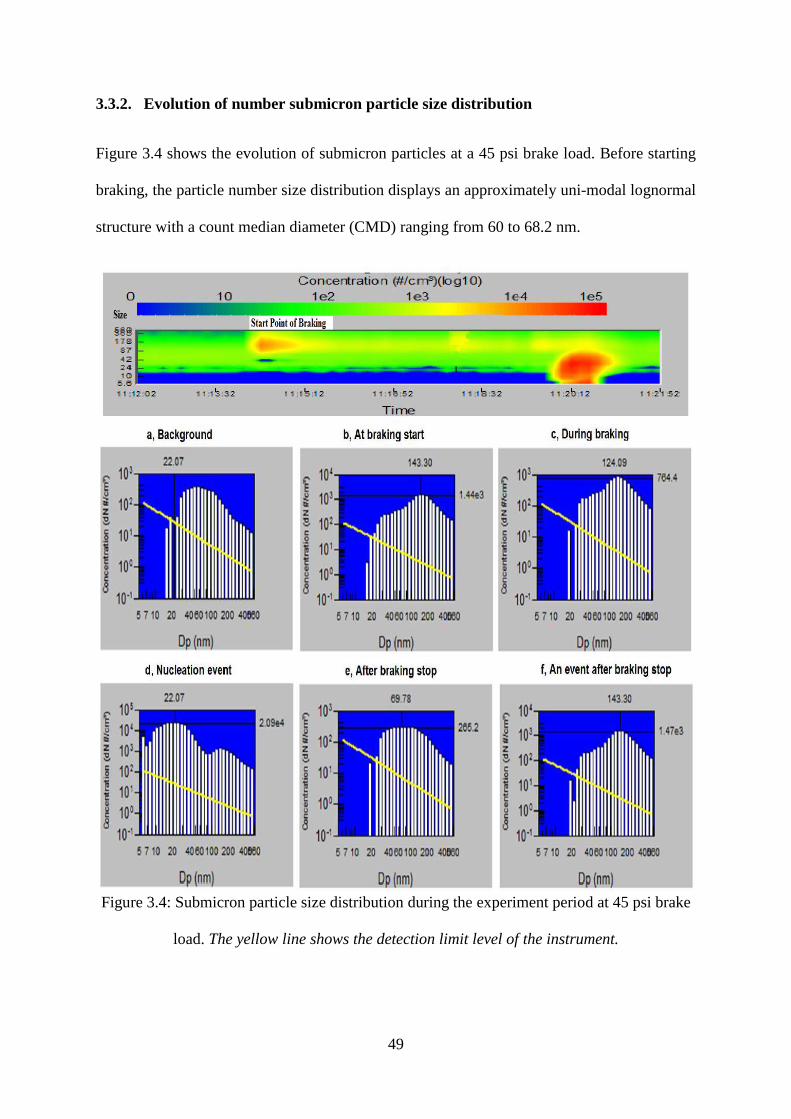
49
3.3.2. Evolution of number submicron particle size distribution
Figure 3.4 shows the evolution of submicron particles at a 45 psi brake load. Before starting
braking, the particle number size distribution displays an approximately uni-modal lognormal
structure with a count median diameter (CMD) ranging from 60 to 68.2 nm.
Figure 3.4: Submicron particle size distribution during the experiment period at 45 psi brake
load. The yellow line shows the detection limit level of the instrument.
50
In the first minute of braking: A bi-modal lognormal distribution of submicron particles
was found with the first mode at 29.43 nm and the second major mode at 154.4 nm. The
majority of particles was found in the accumulation mode with an average CMD ranging
from 144 to 158.9 nm. In terms of super-micron particles, the CMD increased from 1.01 µm
before braking to 1.12 µm. In this period, the majority of accumulation and coarse particles
were generated from the friction processes between the disc and pad. Nano particles were
also found, which grew rapidly probably due to coagulation process.
During braking period: After the first minute of braking, the CMD of submicron particles
decreased to 124.1 - 130.5 nm, while the CMD of super-micron particles increased to 1.26
µm. A bi-modal size distribution of submicron particles was found, with the first mode at
34.0 nm and the second major mode at 143.3 nm. The first mode was maybe due to the
growth of nano-particles, while a decrease in accumulation mode particles compared to the
braking start point shifted the CMD of accumulation mode from 154.4 nm to 143.3 nm.
During this period, there were few the Aitken mode particles (20 nm< Da <80 nm) than those
compared to in the background air. More large particles (Da >80 nm) were found than those
in the background air, but much fewer than those in the first minute of braking.
Nucleation event: After 5 minutes of braking, nucleation occurred when the temperature
reached 118.7oC. Because of nucleation, many new particles were formed, leading to a
decrease in CMD of both EEPS and APS size distributions. The CMD of submicron particles
was found in the nucleation mode with an average of 20.4 nm, while that of super-micron
particles decreased to 1.16 µm.
The formation of new particles probably due to the condensation of organic compounds
emitted from organic binder in the brake pad. When the pad temperature increased, lead to
breakdown and oxidation of organic binders in the brake pad. The products of breakdown are
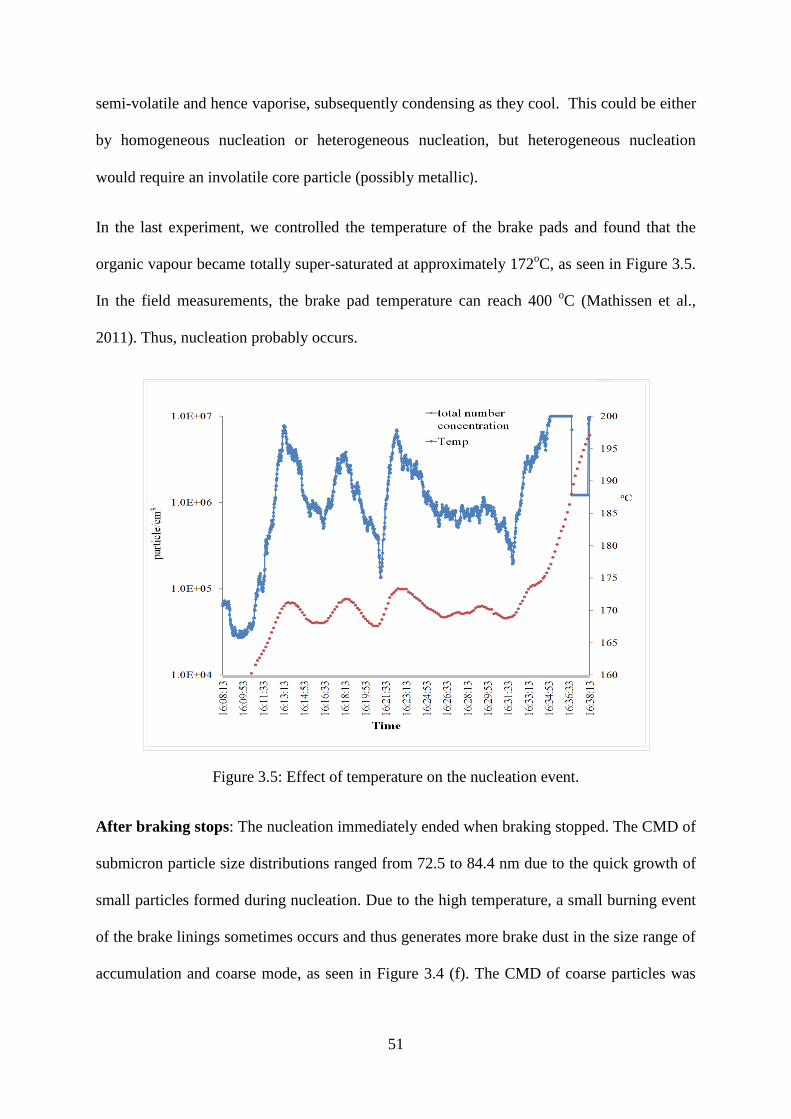
51
semi-volatile and hence vaporise, subsequently condensing as they cool. This could be either
by homogeneous nucleation or heterogeneous nucleation, but heterogeneous nucleation
would require an involatile core particle (possibly metallic).
In the last experiment, we controlled the temperature of the brake pads and found that the
organic vapour became totally super-saturated at approximately 172oC, as seen in Figure 3.5.
In the field measurements, the brake pad temperature can reach 400 oC (Mathissen et al.,
2011). Thus, nucleation probably occurs.
Figure 3.5: Effect of temperature on the nucleation event.
After braking stops: The nucleation immediately ended when braking stopped. The CMD of
submicron particle size distributions ranged from 72.5 to 84.4 nm due to the quick growth of
small particles formed during nucleation. Due to the high temperature, a small burning event
of the brake linings sometimes occurs and thus generates more brake dust in the size range of
accumulation and coarse mode, as seen in Figure 3.4 (f). The CMD of coarse particles was
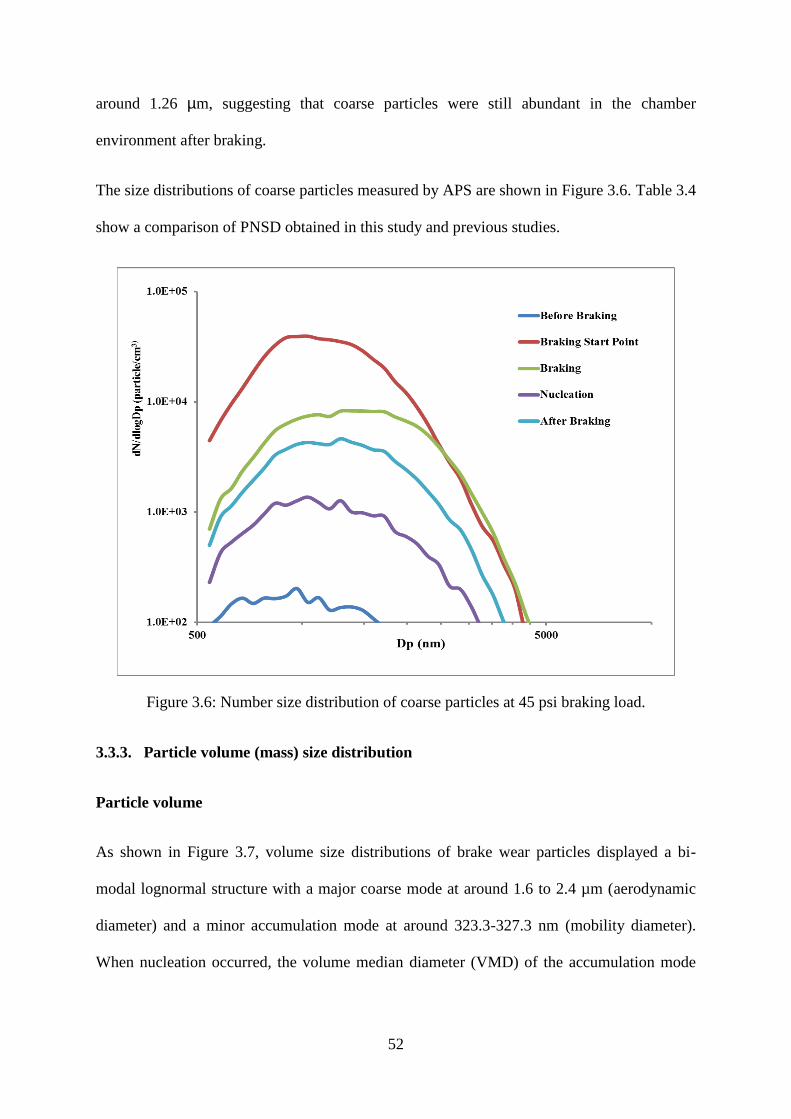
52
around 1.26 µm, suggesting that coarse particles were still abundant in the chamber
environment after braking.
The size distributions of coarse particles measured by APS are shown in Figure 3.6. Table 3.4
show a comparison of PNSD obtained in this study and previous studies.
Figure 3.6: Number size distribution of coarse particles at 45 psi braking load.
3.3.3. Particle volume (mass) size distribution
Particle volume
As shown in Figure 3.7, volume size distributions of brake wear particles displayed a bi-
modal lognormal structure with a major coarse mode at around 1.6 to 2.4 µm (aerodynamic
diameter) and a minor accumulation mode at around 323.3-327.3 nm (mobility diameter).
When nucleation occurred, the volume median diameter (VMD) of the accumulation mode

53
decreased to 100 nm. The VMD of coarse particles increased from 1.9 to 2.4 µm when the
pressure load increased from 30 psi to 60 psi during braking.
Coarse mode particles were found as the majority of total particle volume (86.2-95.7%),
followed by accumulation mode particles (4.0-11.7%).
Figure 3.7: Brake wear particle volume size distribution at 45 psi brake load.
Particle mass
In the calculation of mass, the effective density of brake wear particles was assumed to be 5 g
cm-3
as discussed above. By this assumption, the particle size distribution measured by EEPS
in mobility diameter was converted to those in aerodynamic diameter. The mass size
distribution is shown in Figure 3.8.
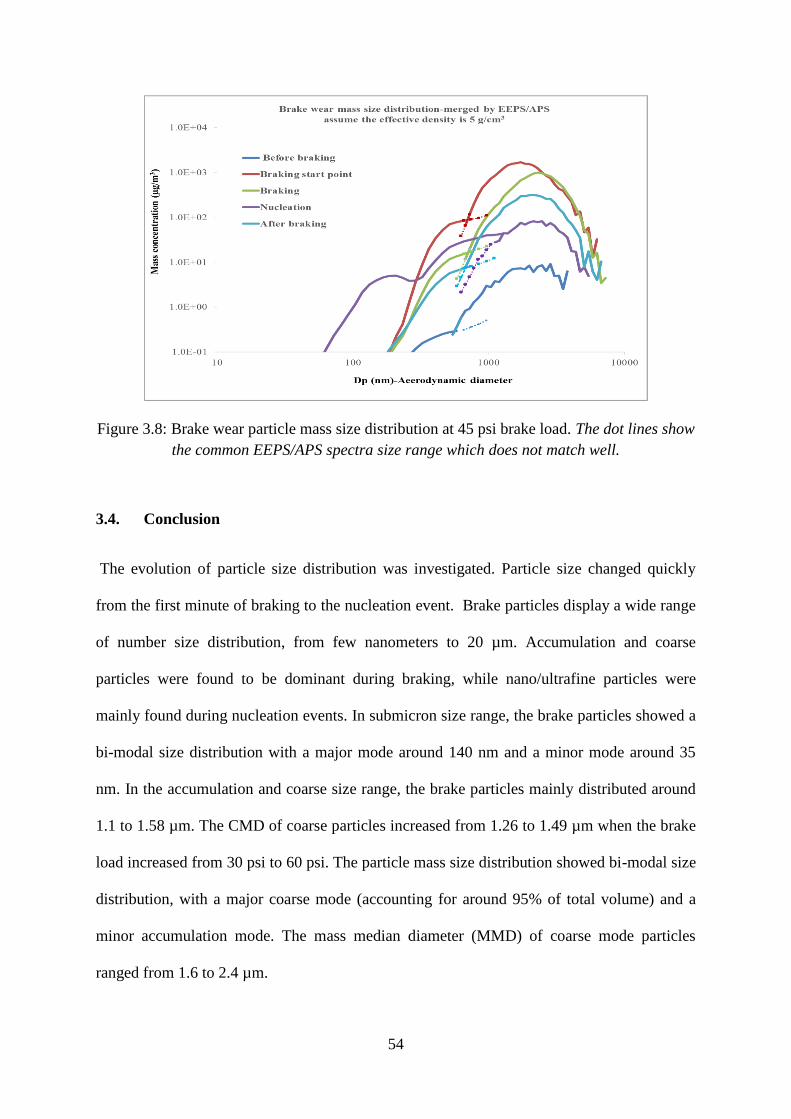
54
Figure 3.8: Brake wear particle mass size distribution at 45 psi brake load. The dot lines show
the common EEPS/APS spectra size range which does not match well.
3.4. Conclusion
The evolution of particle size distribution was investigated. Particle size changed quickly
from the first minute of braking to the nucleation event. Brake particles display a wide range
of number size distribution, from few nanometers to 20 µm. Accumulation and coarse
particles were found to be dominant during braking, while nano/ultrafine particles were
mainly found during nucleation events. In submicron size range, the brake particles showed a
bi-modal size distribution with a major mode around 140 nm and a minor mode around 35
nm. In the accumulation and coarse size range, the brake particles mainly distributed around
1.1 to 1.58 µm. The CMD of coarse particles increased from 1.26 to 1.49 µm when the brake
load increased from 30 psi to 60 psi. The particle mass size distribution showed bi-modal size
distribution, with a major coarse mode (accounting for around 95% of total volume) and a
minor accumulation mode. The mass median diameter (MMD) of coarse mode particles
ranged from 1.6 to 2.4 µm.
55
Chapter 4: INDOOR/OUTDOOR MODELLING OF SUBMICRON
PARTICLES IN A HOUSE HEAVILY AFFECTED BY ROAD TRAFFIC
EMISSIONS
This chapter evaluates the use of a dynamic mass balance model for predicting the
penetration factor, infiltration factor and deposition rate of submicron particles in a house
located in an area with busy traffic. Particle number size distributions (PNSD) were
measured by a Fast Mobility Particle Sizer system (FMPS model 3091, 5.6-560 nm) in both
indoor and outdoor environments at a house located at a site of busy traffic in Bologna
(Italy) in the period February-April 2012. The results show that the mass balance model
could not determine the unknown penetration factor and deposition rate separately because
of their inverse relationship, but it could predict successfully the infiltration rate. When the
penetration rate was controlled to be approximately unity in our experiment design, the
deposition rate and loss rate of particles at different times was calculated. The loss rate of
small particles (nucleation and Aitken mode) in the indoor environment was found to be
much higher than those of larger particles (accumulation mode). The study also found the
important roles of coagulation and evaporation processes in estimating the loss of indoor
particles.
The author’s contribution: writing, contribution of ideas and numerical calculations.
56
4.1. Introduction
Numerous studies have shown that people spend approximately 90% of their time indoors
(Harrison et al., 2009). Whilst indoors, people are probably exposed to either indoor particles
generated from indoor activities (i.e cooking or cleaning) or outdoor particles penetrating
from outdoor environments. Ogulei et al. (2006a) found that particles of outdoor origin
(traffic emissions and wood burning) could contribute approximately 3.5% of the total indoor
particle number by running a PMF model on the particle number size distribution, measured
in a townhouse in the northwest of Washington DC in the US. Therefore, determination of
the transport mechanisms as well as the fraction of outdoor aerosols that penetrate into indoor
environments is needed in order to apportion the sources of particles to their total lung dose
in human exposure studies.
The infiltration rate (F) of aerosols, which is defined as the equilibrium fraction of outdoor
particles that penetrate indoors and remains suspended, is controlled by three main factors,
the penetration factor (P), the deposition rate (kd) and the air exchange rate (𝑎𝑒𝑥). The
penetration factor, or efficiency of particles at a specific diameter, is defined as the fraction of
particles that pass through the building envelope. Thus, penetration efficiency and the
infiltration factor must be less than unity. These penetration and deposition processes of
particles not only greatly depend upon the building characteristics, such as building envelope
and surface area, but also on the characteristics of the particles, especially particle size.
Furthermore, other processes such as evaporation and coagulation could have significant
effects on the particle losses in a house in an area with busy traffic because of high number
concentration and volatile components.
However, there are limited studies of modelling indoor particles from outdoor particles from
a traffic site. Therefore, the objective of this study is to evaluate the use of a dynamic mass
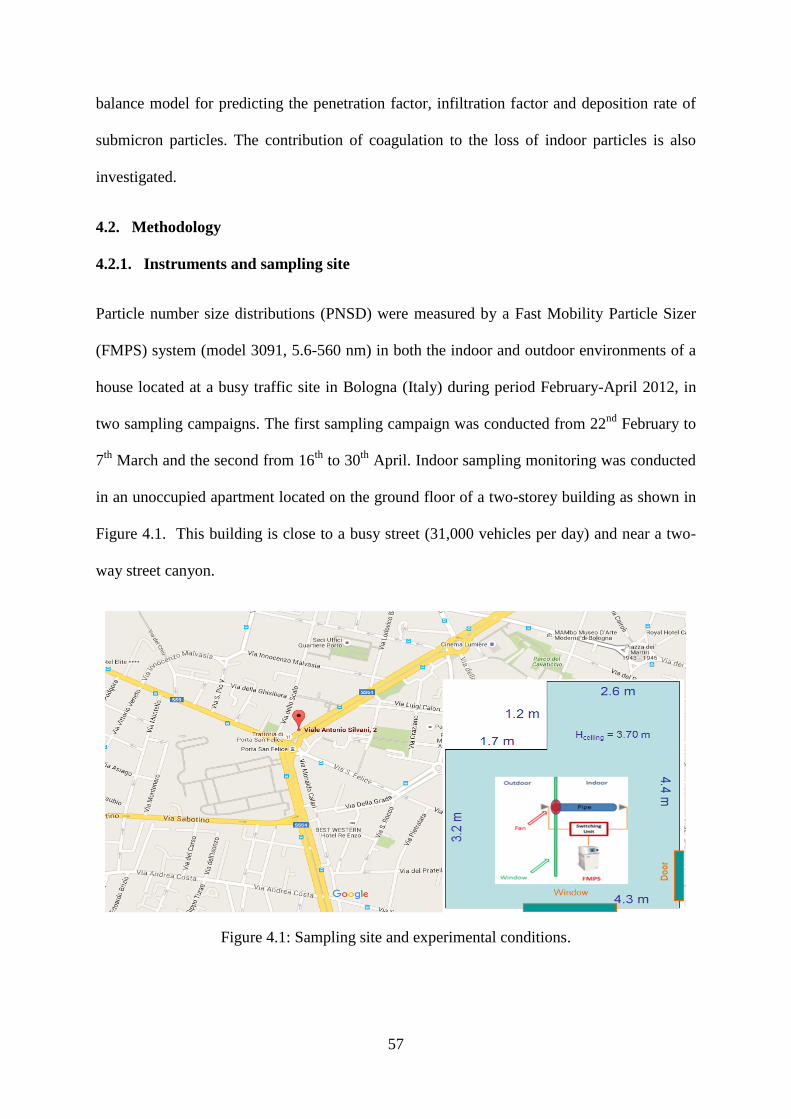
57
balance model for predicting the penetration factor, infiltration factor and deposition rate of
submicron particles. The contribution of coagulation to the loss of indoor particles is also
investigated.
4.2. Methodology
4.2.1. Instruments and sampling site
Particle number size distributions (PNSD) were measured by a Fast Mobility Particle Sizer
(FMPS) system (model 3091, 5.6-560 nm) in both the indoor and outdoor environments of a
house located at a busy traffic site in Bologna (Italy) during period February-April 2012, in
two sampling campaigns. The first sampling campaign was conducted from 22nd
February to
7th
March and the second from 16th
to 30th
April. Indoor sampling monitoring was conducted
in an unoccupied apartment located on the ground floor of a two-storey building as shown in
Figure 4.1. This building is close to a busy street (31,000 vehicles per day) and near a two-
way street canyon.
Figure 4.1: Sampling site and experimental conditions.
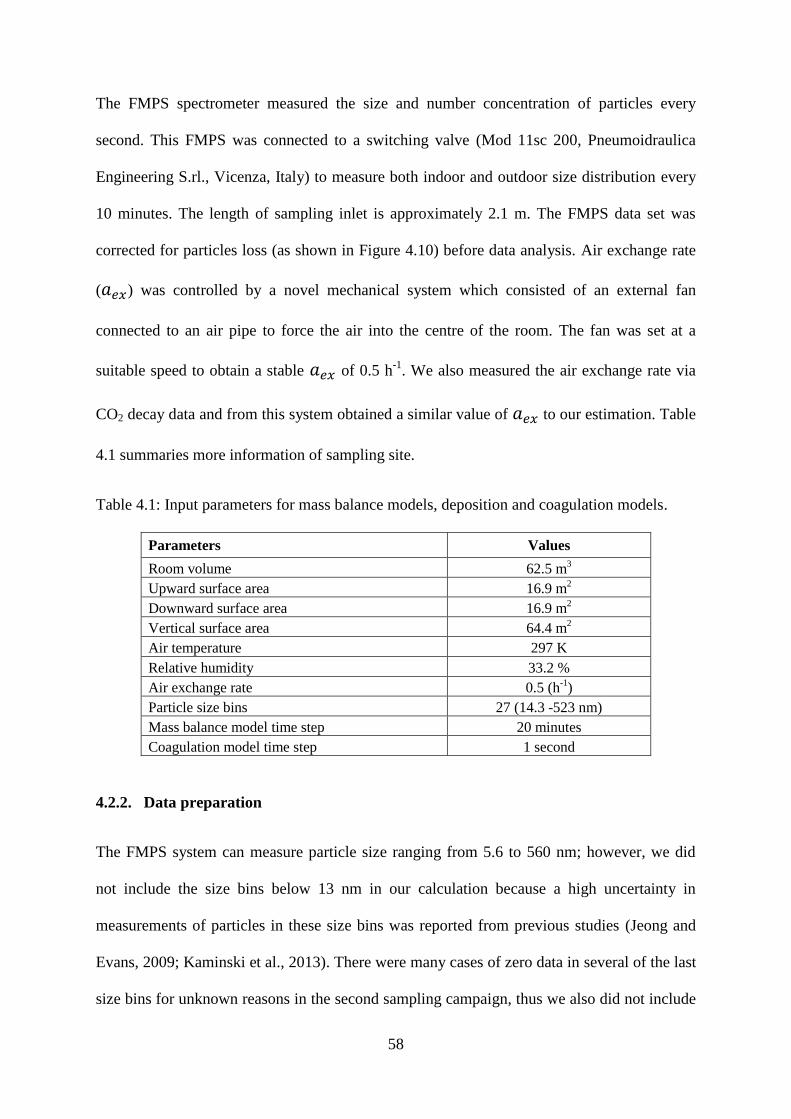
58
The FMPS spectrometer measured the size and number concentration of particles every
second. This FMPS was connected to a switching valve (Mod 11sc 200, Pneumoidraulica
Engineering S.rl., Vicenza, Italy) to measure both indoor and outdoor size distribution every
10 minutes. The length of sampling inlet is approximately 2.1 m. The FMPS data set was
corrected for particles loss (as shown in Figure 4.10) before data analysis. Air exchange rate
(𝑎𝑒𝑥) was controlled by a novel mechanical system which consisted of an external fan
connected to an air pipe to force the air into the centre of the room. The fan was set at a
suitable speed to obtain a stable 𝑎𝑒𝑥 of 0.5 h-1
. We also measured the air exchange rate via
CO2 decay data and from this system obtained a similar value of 𝑎𝑒𝑥 to our estimation. Table
4.1 summaries more information of sampling site.
Table 4.1: Input parameters for mass balance models, deposition and coagulation models.
Parameters Values
Room volume 62.5 m3
Upward surface area 16.9 m2
Downward surface area 16.9 m2
Vertical surface area 64.4 m2
Air temperature 297 K
Relative humidity 33.2 %
Air exchange rate 0.5 (h-1
)
Particle size bins 27 (14.3 -523 nm)
Mass balance model time step 20 minutes
Coagulation model time step 1 second
4.2.2. Data preparation
The FMPS system can measure particle size ranging from 5.6 to 560 nm; however, we did
not include the size bins below 13 nm in our calculation because a high uncertainty in
measurements of particles in these size bins was reported from previous studies (Jeong and
Evans, 2009; Kaminski et al., 2013). There were many cases of zero data in several of the last
size bins for unknown reasons in the second sampling campaign, thus we also did not include
59
the size bins over 300 nm for this campaign. The switching valve allowed the FMPS to
measure outdoor and indoor size distributions every 10 minutes; this study therefore averaged
the data from each 10 minute period, apart from the 2 minute samples at the beginning of
each period, to avoid any mixing of outdoor and indoor air streams. The data was analysed
using R programing. This study used the “open-air” package developed by Carslaw and
Ropkins (2012) for polar plots and time average. Contour plots were performed using the
Sigma Plot software, version 13.0. An indoor mass balance model and coagulation model
were written on R by the author (Tuan V. Vu).
4.2.3. Indoor mass balance model
The indoor particle concentration can be described using a mass balance model (Chen and
Zhao, 2011):
𝜕𝐶𝑖𝑛
𝜕𝑡= 𝑎𝐸𝑅 ∗ 𝑃 ∗ 𝐶𝑜𝑢𝑡 − 𝑎𝐸𝑅 ∗ 𝐶𝑖𝑛 − 𝑘𝑑 ∗ 𝐶𝑖𝑛 +
𝑆
𝑉+ 𝐽𝑂𝑡ℎ𝑒𝑟 (4.1)
Where Cin is the indoor particle concentration (particles cm-3
),
Cout is the outdoor particle concentration (particles cm-3
),
P is the penetration factor,
𝑎𝐸𝑅is the air exchange rate (h-1
),
𝑘𝑑is the deposition rate (h-1
),
S is the emission rate of particles (particles h-1
),
V is volume of the room (cm3), and t is the time (h).
JOther: particle production or loss rate due to other indoor processes such as coagulation,
nucleation, condensation or evaporation (particles h-1
).
For each time step of the specified period (∆t), the indoor concentration is modelled using a
numerical backward difference (Chen and Zhao, 2011):
60
𝐶𝑖𝑛 (𝑡+∆𝑡) =𝑎𝐸𝑅∗𝑃∗𝐶𝑜𝑢𝑡 (𝑡+∆𝑡)
𝑎𝐸𝑅+𝑘𝑑(1 − 𝑒−(𝑎𝐸𝑅+𝑘𝑑)∗∆𝑡) + 𝐶𝑖𝑛 (𝑡)𝑒−(𝑎𝐸𝑅+𝑘𝑑)∗∆𝑡 +
𝑆∗∆𝑡
𝑉+ 𝐽𝑜𝑡ℎ𝑒𝑟 ∗ ∆𝑡
(4.2)
There was no indoor source during the sampling campaign (S=0) and the air exchange rate
(𝑎𝑒𝑥) was controlled by 0.5 (h-1
), therefore the indoor concentration can be estimated
following the equation:
𝐶𝑖𝑛 (𝑡+∆𝑡) =0.5∗𝑃∗𝐶𝑜𝑢𝑡 (𝑡+∆𝑡)
0.5+𝑘𝑑(1 − 𝑒−(0.5+𝑘𝑑)∗∆𝑡) + 𝐶𝑖𝑛 (𝑡)𝑒−(0.5+𝑘𝑑)∗∆𝑡 + 𝐽𝑜𝑡ℎ𝑒𝑟 ∗ ∆𝑡 (4.3)
Based on the outdoor concentration (Cout), and the initial indoor concentration (Cin at a
specific time, such as t=0), we can estimate the indoor concentration Cin based on equation
(4.3). The outdoor and indoor switching valve time was 10 minutes, thus the time step
between two outdoor measurements (∆t) is 20 minutes (1/3 hour).
To determine the penetration factor and deposition rate (P, kp), the p and k values (with 0< P
≤1 and kP> 0) were changed with an interval of 0.01 until modelled Cin best fitted with
observed Cin. To evaluate goodness-of-fit in the comparison of the model to the observed data
set, we used two criteria:
1. The Root Mean Square Error (RMSE) between the model and observed indoor
concentrations:
RMSE = √∑ (𝐶𝑖𝑛 𝑏𝑦 𝑚𝑎𝑠𝑠 𝑏𝑎𝑙𝑎𝑛𝑐𝑒 𝑚𝑜𝑑𝑒𝑙 − 𝐶𝑖𝑛 𝑏𝑦 𝑚𝑒𝑎𝑠𝑢𝑟𝑒𝑚𝑒𝑛𝑡)2𝑁
𝑖=1
𝑁
where, N: total number of samples
2. The Pearson Correlation Coefficient of determination (r) between two indoor data sets
estimated by a mass balance model and observed by real measurements.
61
4.2.4. Coagulation Model
The coagulation equation was introduced by the following equation (Müller, 1928; Seinfeld
and Pandis, 2012):
𝜕𝑁𝑣
𝜕𝑡=
1
2∫ 𝛽𝑣−ṽ,ṽ
𝑣
0𝑁𝑣−ṽ𝑁ṽdṽ − 𝑁𝑣 ∫ 𝛽𝑣,ṽ𝑁ṽdṽ
∞
0 (4.4)
where v-ṽ and ṽ are the volumes of two coagulating particles, v is the volume of the new
particle due to coagulation, and N is the time-dependent number concentration (particles cm-
3) of particles with a volume of v, v-ṽ or ṽ. βv−ṽ,ṽ is the coagulation rate coefficient
(coagulation kernel) of the two colliding particles (cm3 particle
-1s
-1).
For a monomer size distribution, equation (4.4) is discretized and written in fully implicit
finite-difference form as (Jacobson, 2005; Seinfeld and Pandis, 2012):
𝑁𝑘,𝑡−𝑁𝑘,𝑡−∆𝑡
∆𝑡=
1
2∫ 𝛽𝑘−𝑗.𝑗
𝑘−1
𝑗=1𝑁𝑘−𝑗,𝑡𝑁𝑗,𝑡 − ∫ 𝛽𝑘,𝑗𝑁𝑘,𝑡
∞
𝑗=1𝑁𝑗,𝑡 (4.5)
where, k is the size bin which is produced when particles in bin k-j coagulate with particles in
size bin j. ∆𝑡 (s) is the time step and t and t - ∆𝑡 are the final and initial times respectively. A
size distribution is defined as a monomer size distribution when “the volume of each particle
in size bin k equals the volume of particles in the smallest size bin multiplied by k” (Jacobson
et al., 2005).
To solve equation (4.5), several techniques can be used, one of which is the semi-implicit
coagulation model discussed by Jacobson (1994). In this model, 𝑁𝑗,𝑡 is replaced by 𝑁𝑗,𝑡−∆𝑡.
Therefore, equation (4.5) is re-written as:
𝑁𝑘,𝑡 = 𝑁𝑘,𝑡−∆𝑡+
1
2∆𝑡 ∑ 𝛽𝑘−𝑗.𝑗
𝑘−1𝑗=1 𝑁𝑘−𝑗,𝑡𝑁𝑗,𝑡
1+ ∆𝑡 ∑ 𝛽𝑘.𝑗∞𝑗=1 𝑁𝑗,𝑡𝑁𝑗,𝑡−∆𝑡
(4.6)
62
Equation (4.6) is responsible for the loss of particles by number when two particles coagulate,
but does not conserve volume. In order to conserve volume concentration, equation (4.6) is
reformed as:
𝑣𝑘,𝑡 = 𝑣𝑘,𝑡−∆𝑡+∆𝑡 ∑ 𝛽𝑘−𝑗.𝑗
𝑘−1𝑗=1 𝑣𝑘−𝑗,𝑡𝑁𝑗,𝑡−∆𝑡
1+ ∆𝑡 ∑ 𝛽𝑘.𝑗∞𝑗=1 𝑁𝑗,𝑡−∆𝑡
(4.7)
where, 𝑣𝑘,𝑡 = 𝑣𝑘𝑁𝑘,𝑡.
For an arbitrary size distribution, equation (4.7) becomes:
𝑣𝑘,𝑡 = 𝑣𝑘,𝑡−∆𝑡+∆𝑡 ∑ (∑ 𝑓𝑖,𝑗,𝑘
𝑘−1𝑖=1 𝛽𝑘−𝑗.𝑗
𝑘𝑗=1 𝑣𝑖,𝑡𝑁𝑗,𝑡−∆𝑡)
1+ ∆𝑡 ∑ (1−𝑓𝑖,𝑗,𝑘)𝛽𝑘.𝑗𝑁𝐵𝑗=1
𝑁𝑗,𝑡−∆𝑡
(4.8)
where, 𝑓𝑖,𝑗,𝑘is the volume fraction and 𝑁𝐵 is the last size bin.
𝑓𝑖,𝑗,𝑘 = {
(𝑣𝑘−1−𝑉𝑖,𝑗
𝑣𝑘+1−𝑉𝑘)
𝑣𝑘𝑉𝑖,𝑗
𝑣𝑘 ≤ 𝑉𝑖,𝑗<𝑣𝑘+1 𝑤𝑖𝑡ℎ 𝑘<𝑁𝐵
1− 𝑓𝑖,𝑗,𝑘−1𝑣𝑘−1 ≤ 𝑉𝑖,𝑗<𝑣𝑘 𝑤𝑖𝑡ℎ 𝑘>1
1 𝑉𝑖,𝑗<𝑣𝑘 𝑤𝑖𝑡ℎ 𝑘=𝑁𝐵
0 𝑎𝑙𝑙 𝑜𝑡ℎ𝑒𝑟 𝑐𝑎𝑠𝑒𝑠
(4.9)
The final number concentration of particles due to coagulation is:
𝑁𝑘,𝑡 =𝑣𝑘,𝑡
𝑣𝑘 (4.10)
Coagulation rate coefficient (kernel)
The coagulation rate coefficient is calculated by:
βi,j = Ki,jCEi,j (4.11)
where, βi,j is the coagulation rate coefficient of particles (cm3
particle-1
s-1
); Ki,j is the
collision kernel (cm3
particle-1
s-1
) and CEi,j is a coalescence efficiency between particle size i
and size j.
Collision kernel
The collision kernel is calculated in this research with consideration of the following physical
processes:
Brownian motion
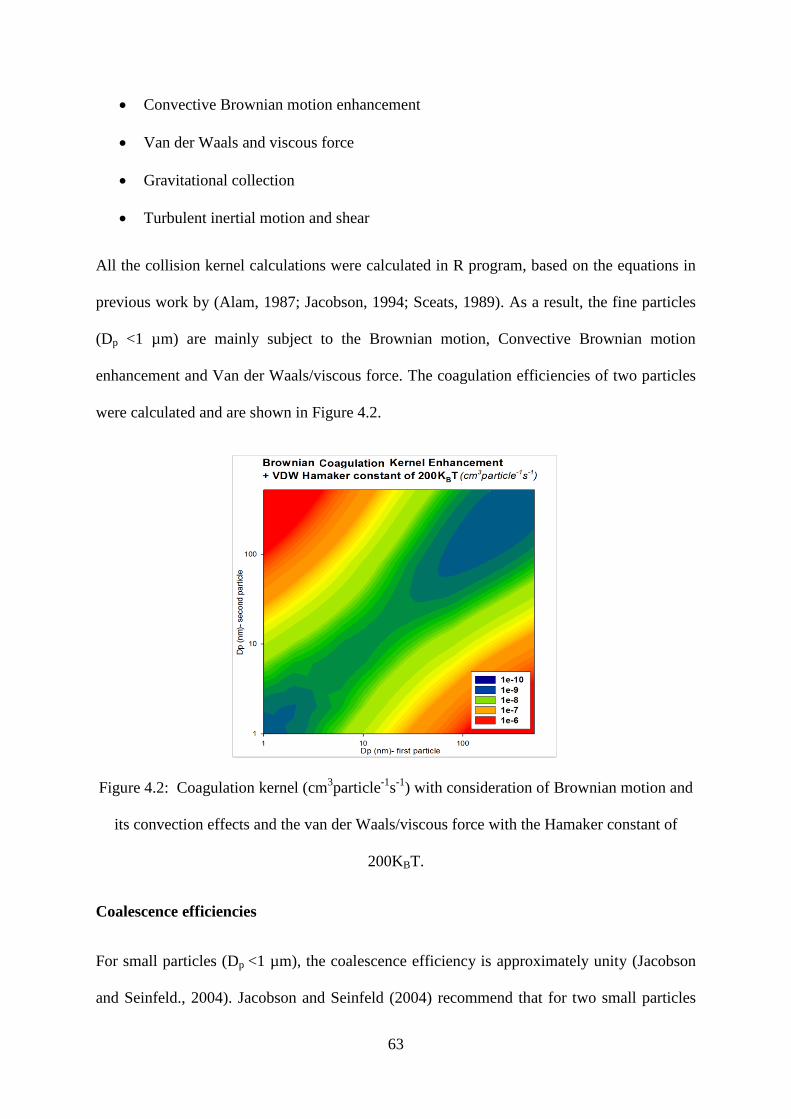
63
Convective Brownian motion enhancement
Van der Waals and viscous force
Gravitational collection
Turbulent inertial motion and shear
All the collision kernel calculations were calculated in R program, based on the equations in
previous work by (Alam, 1987; Jacobson, 1994; Sceats, 1989). As a result, the fine particles
(Dp <1 µm) are mainly subject to the Brownian motion, Convective Brownian motion
enhancement and Van der Waals/viscous force. The coagulation efficiencies of two particles
were calculated and are shown in Figure 4.2.
Figure 4.2: Coagulation kernel (cm3particle
-1s
-1) with consideration of Brownian motion and
its convection effects and the van der Waals/viscous force with the Hamaker constant of
200KBT.
Coalescence efficiencies
For small particles (Dp <1 µm), the coalescence efficiency is approximately unity (Jacobson
and Seinfeld., 2004). Jacobson and Seinfeld (2004) recommend that for two small particles
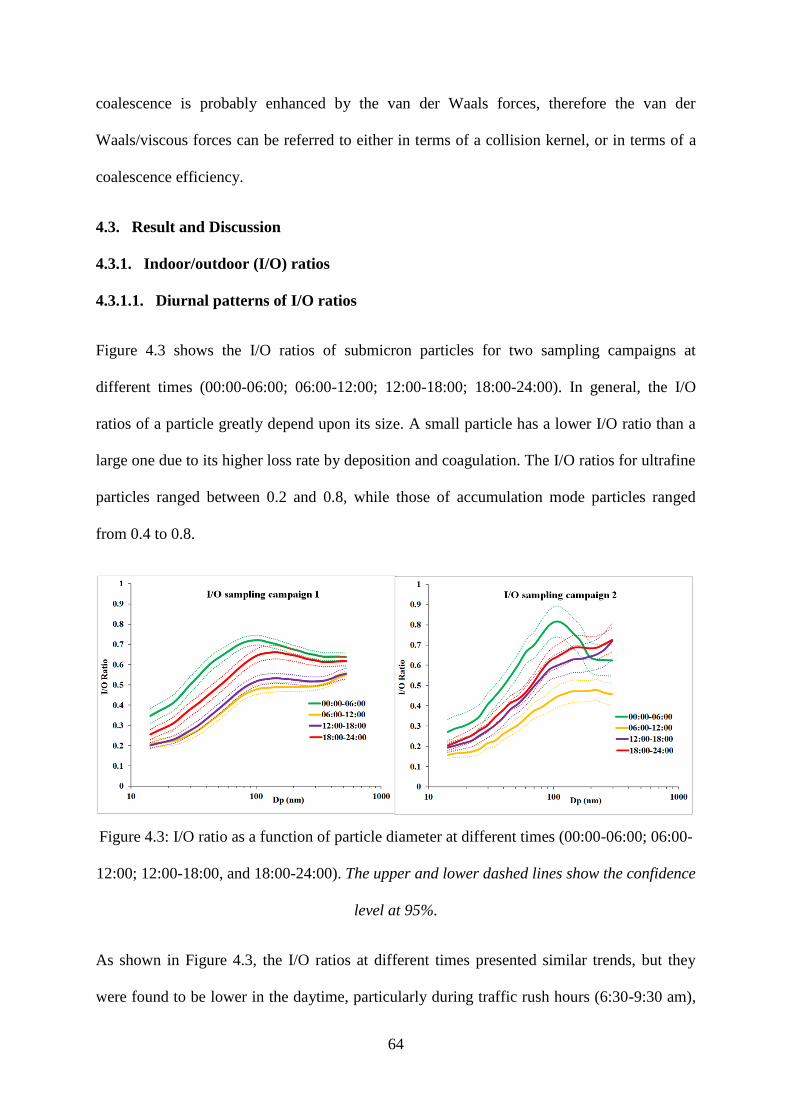
64
coalescence is probably enhanced by the van der Waals forces, therefore the van der
Waals/viscous forces can be referred to either in terms of a collision kernel, or in terms of a
coalescence efficiency.
4.3. Result and Discussion
4.3.1. Indoor/outdoor (I/O) ratios
4.3.1.1. Diurnal patterns of I/O ratios
Figure 4.3 shows the I/O ratios of submicron particles for two sampling campaigns at
different times (00:00-06:00; 06:00-12:00; 12:00-18:00; 18:00-24:00). In general, the I/O
ratios of a particle greatly depend upon its size. A small particle has a lower I/O ratio than a
large one due to its higher loss rate by deposition and coagulation. The I/O ratios for ultrafine
particles ranged between 0.2 and 0.8, while those of accumulation mode particles ranged
from 0.4 to 0.8.
Figure 4.3: I/O ratio as a function of particle diameter at different times (00:00-06:00; 06:00-
12:00; 12:00-18:00, and 18:00-24:00). The upper and lower dashed lines show the confidence
level at 95%.
As shown in Figure 4.3, the I/O ratios at different times presented similar trends, but they
were found to be lower in the daytime, particularly during traffic rush hours (6:30-9:30 am),
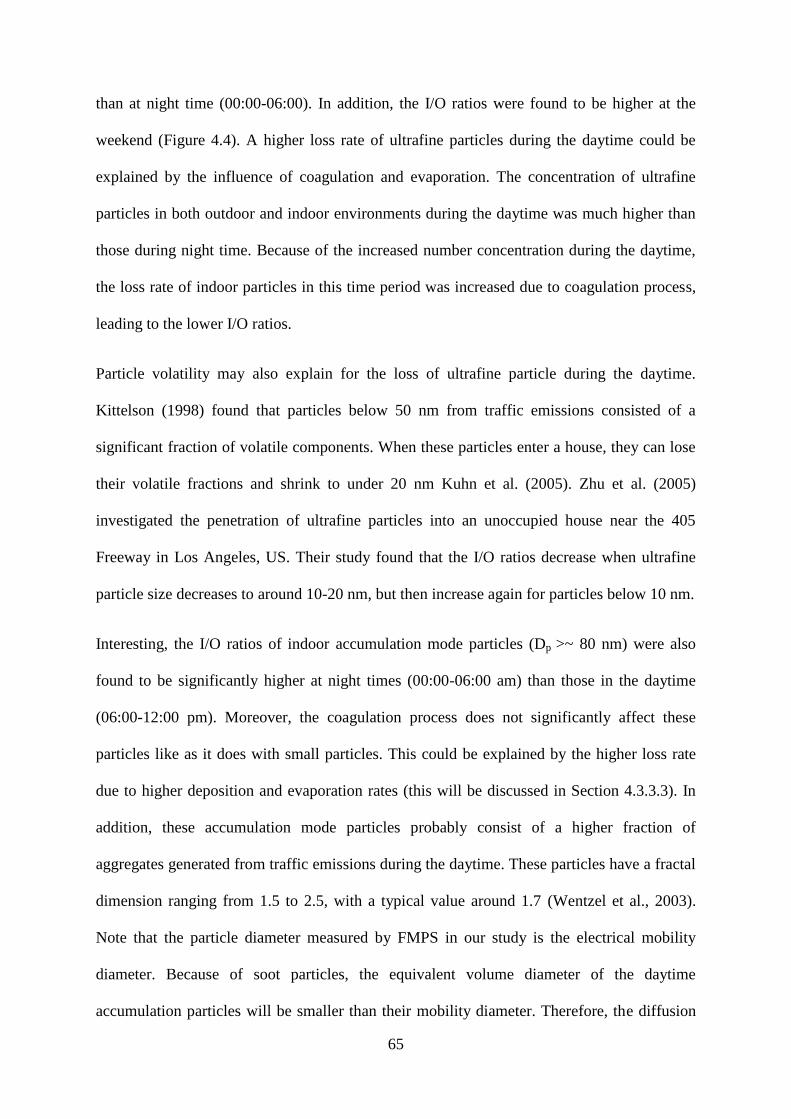
65
than at night time (00:00-06:00). In addition, the I/O ratios were found to be higher at the
weekend (Figure 4.4). A higher loss rate of ultrafine particles during the daytime could be
explained by the influence of coagulation and evaporation. The concentration of ultrafine
particles in both outdoor and indoor environments during the daytime was much higher than
those during night time. Because of the increased number concentration during the daytime,
the loss rate of indoor particles in this time period was increased due to coagulation process,
leading to the lower I/O ratios.
Particle volatility may also explain for the loss of ultrafine particle during the daytime.
Kittelson (1998) found that particles below 50 nm from traffic emissions consisted of a
significant fraction of volatile components. When these particles enter a house, they can lose
their volatile fractions and shrink to under 20 nm Kuhn et al. (2005). Zhu et al. (2005)
investigated the penetration of ultrafine particles into an unoccupied house near the 405
Freeway in Los Angeles, US. Their study found that the I/O ratios decrease when ultrafine
particle size decreases to around 10-20 nm, but then increase again for particles below 10 nm.
Interesting, the I/O ratios of indoor accumulation mode particles (Dp >~ 80 nm) were also
found to be significantly higher at night times (00:00-06:00 am) than those in the daytime
(06:00-12:00 pm). Moreover, the coagulation process does not significantly affect these
particles like as it does with small particles. This could be explained by the higher loss rate
due to higher deposition and evaporation rates (this will be discussed in Section 4.3.3.3). In
addition, these accumulation mode particles probably consist of a higher fraction of
aggregates generated from traffic emissions during the daytime. These particles have a fractal
dimension ranging from 1.5 to 2.5, with a typical value around 1.7 (Wentzel et al., 2003).
Note that the particle diameter measured by FMPS in our study is the electrical mobility
diameter. Because of soot particles, the equivalent volume diameter of the daytime
accumulation particles will be smaller than their mobility diameter. Therefore, the diffusion
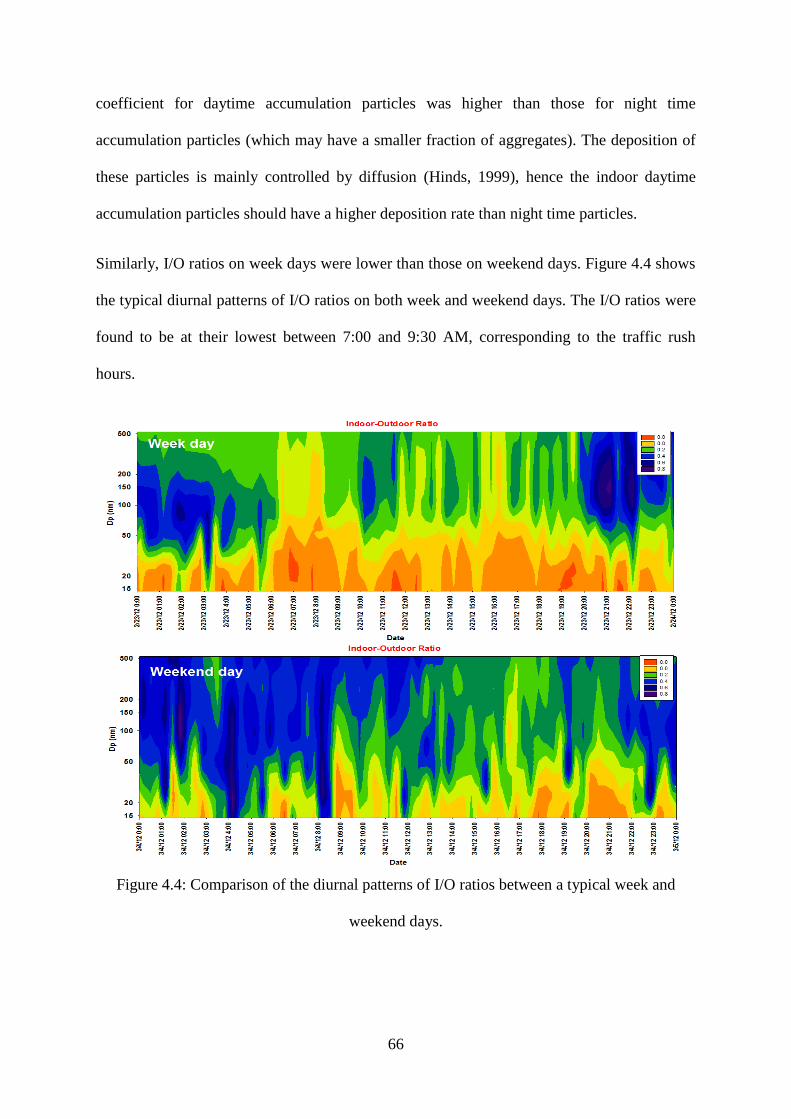
66
coefficient for daytime accumulation particles was higher than those for night time
accumulation particles (which may have a smaller fraction of aggregates). The deposition of
these particles is mainly controlled by diffusion (Hinds, 1999), hence the indoor daytime
accumulation particles should have a higher deposition rate than night time particles.
Similarly, I/O ratios on week days were lower than those on weekend days. Figure 4.4 shows
the typical diurnal patterns of I/O ratios on both week and weekend days. The I/O ratios were
found to be at their lowest between 7:00 and 9:30 AM, corresponding to the traffic rush
hours.
Figure 4.4: Comparison of the diurnal patterns of I/O ratios between a typical week and
weekend days.
67
4.3.1.2. Effects of meteorological parameters on the I/O ratios
Figure 4.5 shows the dependence of I/O ratios on wind speed and direction. I/O ratios,
particularly for accumulation particles (Dp >100 nm) increased when the wind speed
increased. The effect of wind speed is to dilute the local traffic emissions which would then
lead to higher I/O ratios. There was no clear influence of wind direction on the I/O ratios of
small particles, but it had a significant effect on the I/O ratios of particles larger than 100 nm.
The I/O ratios from SW wind direction were higher as seen in Figure 4.6. This is maybe due
to the long range transport of accumulation mode particles in the condition of strong wind at
night time (00:00-04:00).
Figure 4.5: I/O ratios in different wind speeds.
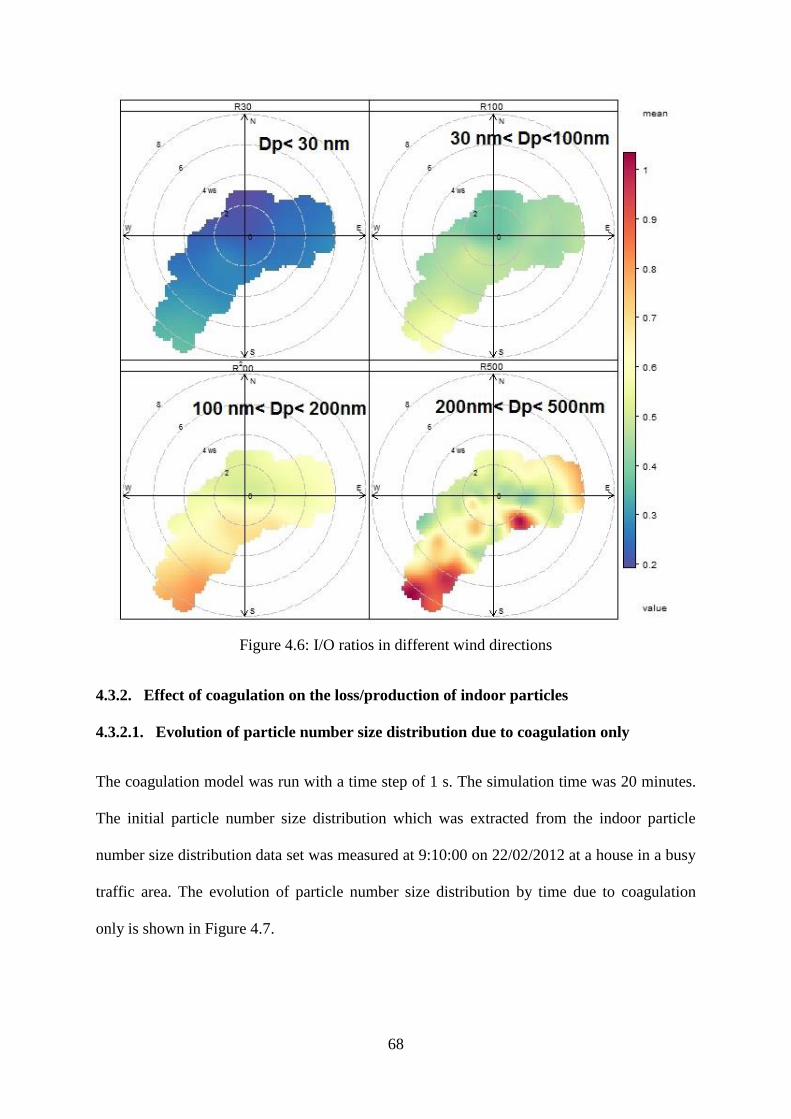
68
Figure 4.6: I/O ratios in different wind directions
4.3.2. Effect of coagulation on the loss/production of indoor particles
4.3.2.1. Evolution of particle number size distribution due to coagulation only
The coagulation model was run with a time step of 1 s. The simulation time was 20 minutes.
The initial particle number size distribution which was extracted from the indoor particle
number size distribution data set was measured at 9:10:00 on 22/02/2012 at a house in a busy
traffic area. The evolution of particle number size distribution by time due to coagulation
only is shown in Figure 4.7.
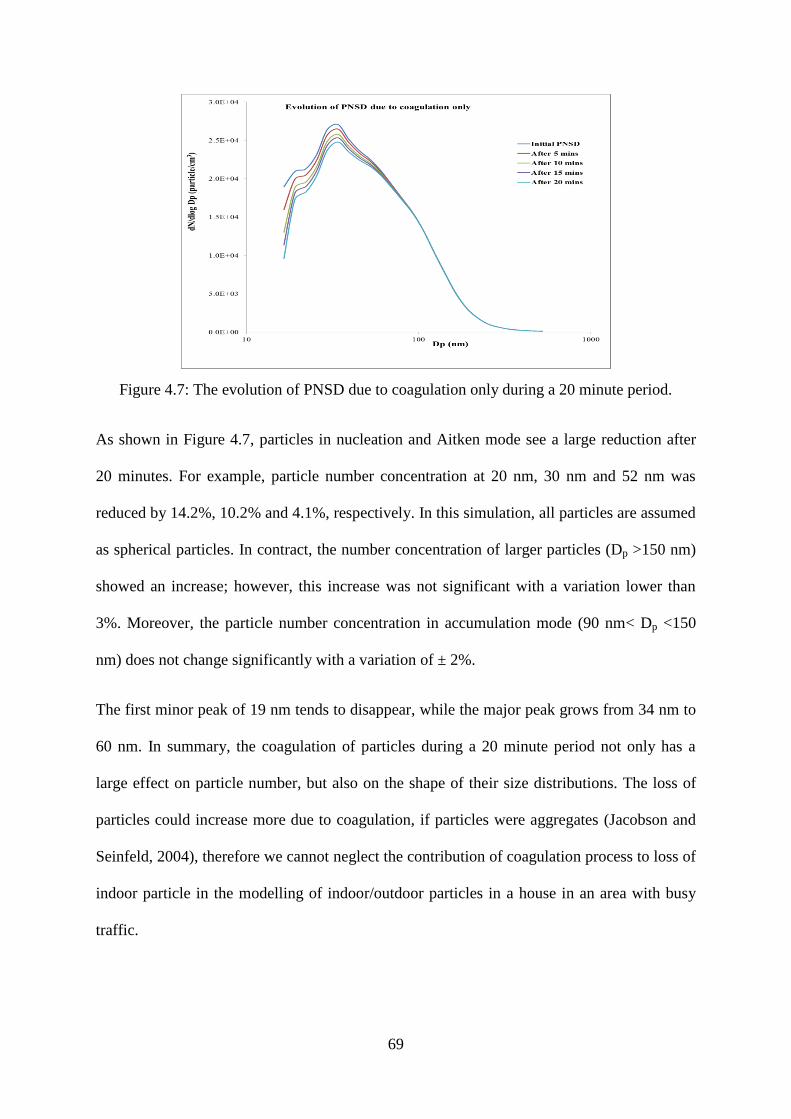
69
Figure 4.7: The evolution of PNSD due to coagulation only during a 20 minute period.
As shown in Figure 4.7, particles in nucleation and Aitken mode see a large reduction after
20 minutes. For example, particle number concentration at 20 nm, 30 nm and 52 nm was
reduced by 14.2%, 10.2% and 4.1%, respectively. In this simulation, all particles are assumed
as spherical particles. In contract, the number concentration of larger particles (Dp >150 nm)
showed an increase; however, this increase was not significant with a variation lower than
3%. Moreover, the particle number concentration in accumulation mode (90 nm< Dp <150
nm) does not change significantly with a variation of ± 2%.
The first minor peak of 19 nm tends to disappear, while the major peak grows from 34 nm to
60 nm. In summary, the coagulation of particles during a 20 minute period not only has a
large effect on particle number, but also on the shape of their size distributions. The loss of
particles could increase more due to coagulation, if particles were aggregates (Jacobson and
Seinfeld, 2004), therefore we cannot neglect the contribution of coagulation process to loss of
indoor particle in the modelling of indoor/outdoor particles in a house in an area with busy
traffic.
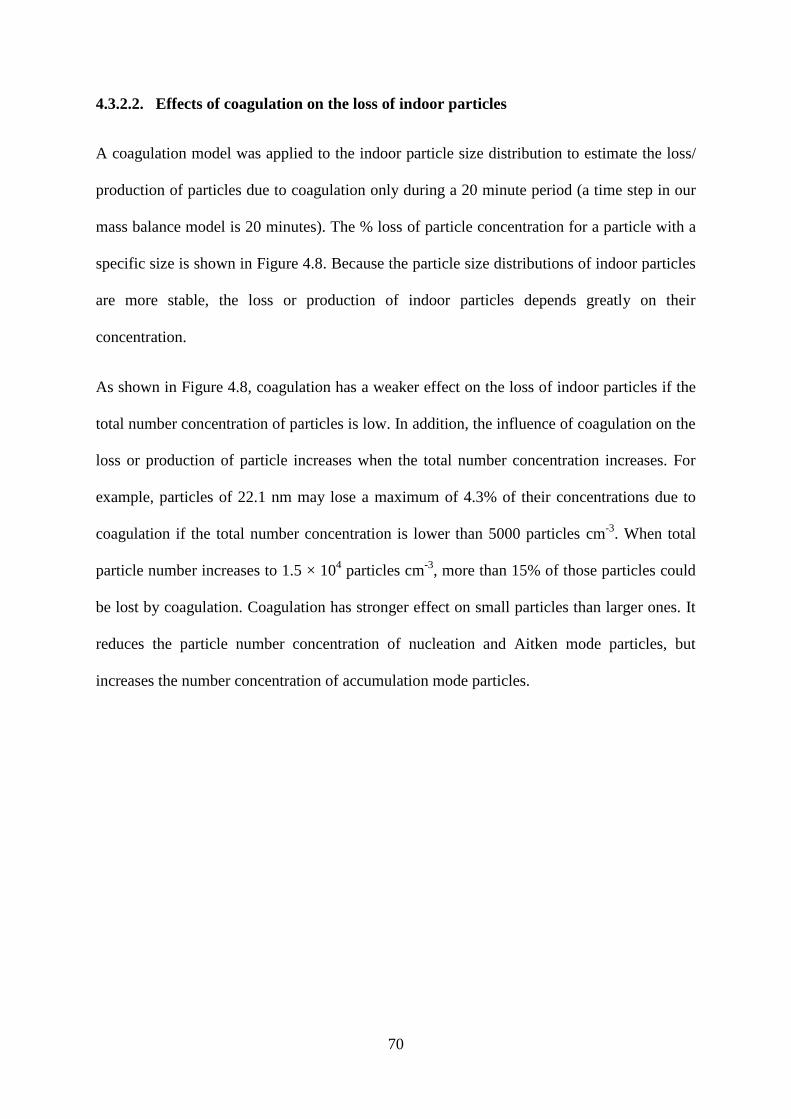
70
4.3.2.2. Effects of coagulation on the loss of indoor particles
A coagulation model was applied to the indoor particle size distribution to estimate the loss/
production of particles due to coagulation only during a 20 minute period (a time step in our
mass balance model is 20 minutes). The % loss of particle concentration for a particle with a
specific size is shown in Figure 4.8. Because the particle size distributions of indoor particles
are more stable, the loss or production of indoor particles depends greatly on their
concentration.
As shown in Figure 4.8, coagulation has a weaker effect on the loss of indoor particles if the
total number concentration of particles is low. In addition, the influence of coagulation on the
loss or production of particle increases when the total number concentration increases. For
example, particles of 22.1 nm may lose a maximum of 4.3% of their concentrations due to
coagulation if the total number concentration is lower than 5000 particles cm-3
. When total
particle number increases to 1.5 × 10⁴ particles cm
-3, more than 15% of those particles could
be lost by coagulation. Coagulation has stronger effect on small particles than larger ones. It
reduces the particle number concentration of nucleation and Aitken mode particles, but
increases the number concentration of accumulation mode particles.
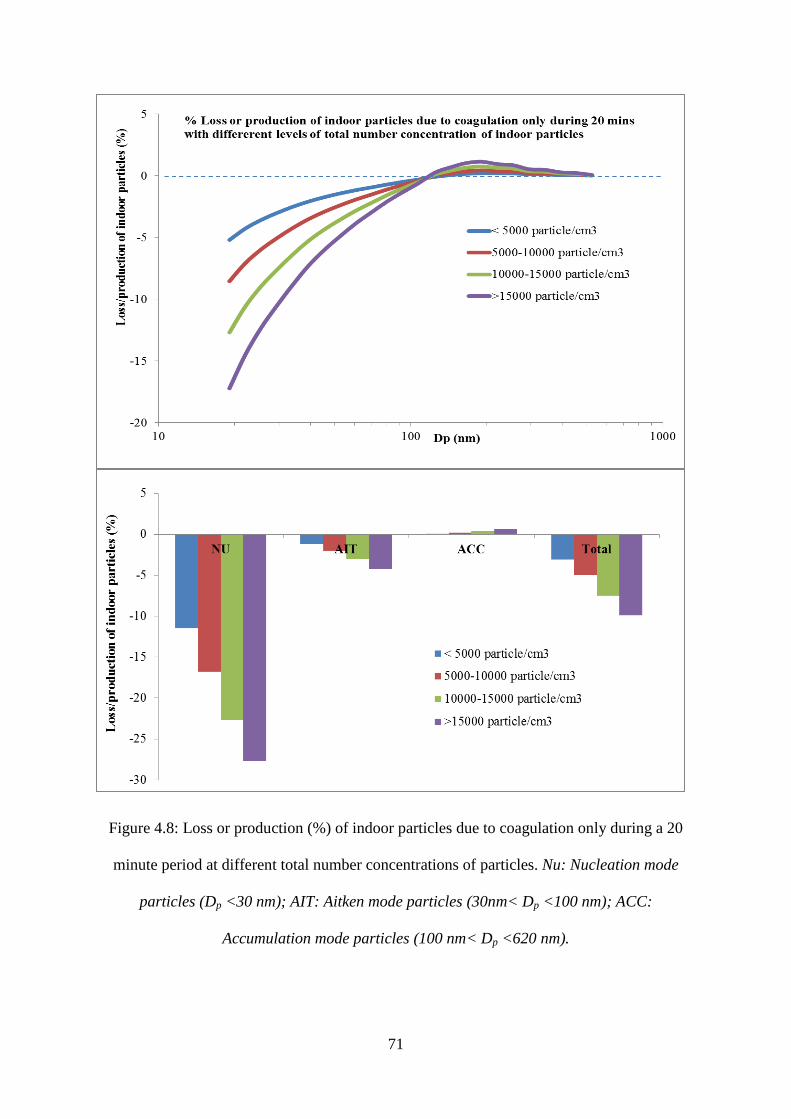
71
Figure 4.8: Loss or production (%) of indoor particles due to coagulation only during a 20
minute period at different total number concentrations of particles. Nu: Nucleation mode
particles (Dp <30 nm); AIT: Aitken mode particles (30nm< Dp <100 nm); ACC:
Accumulation mode particles (100 nm< Dp <620 nm).
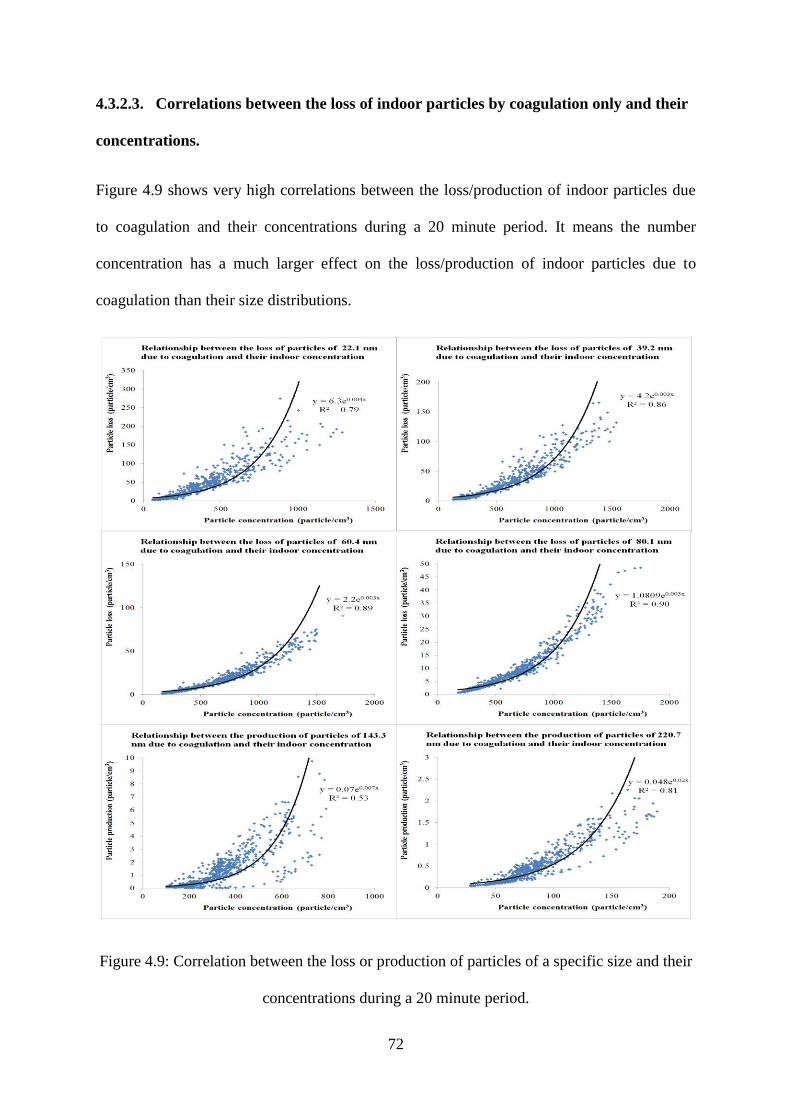
72
4.3.2.3. Correlations between the loss of indoor particles by coagulation only and their
concentrations.
Figure 4.9 shows very high correlations between the loss/production of indoor particles due
to coagulation and their concentrations during a 20 minute period. It means the number
concentration has a much larger effect on the loss/production of indoor particles due to
coagulation than their size distributions.
Figure 4.9: Correlation between the loss or production of particles of a specific size and their
concentrations during a 20 minute period.
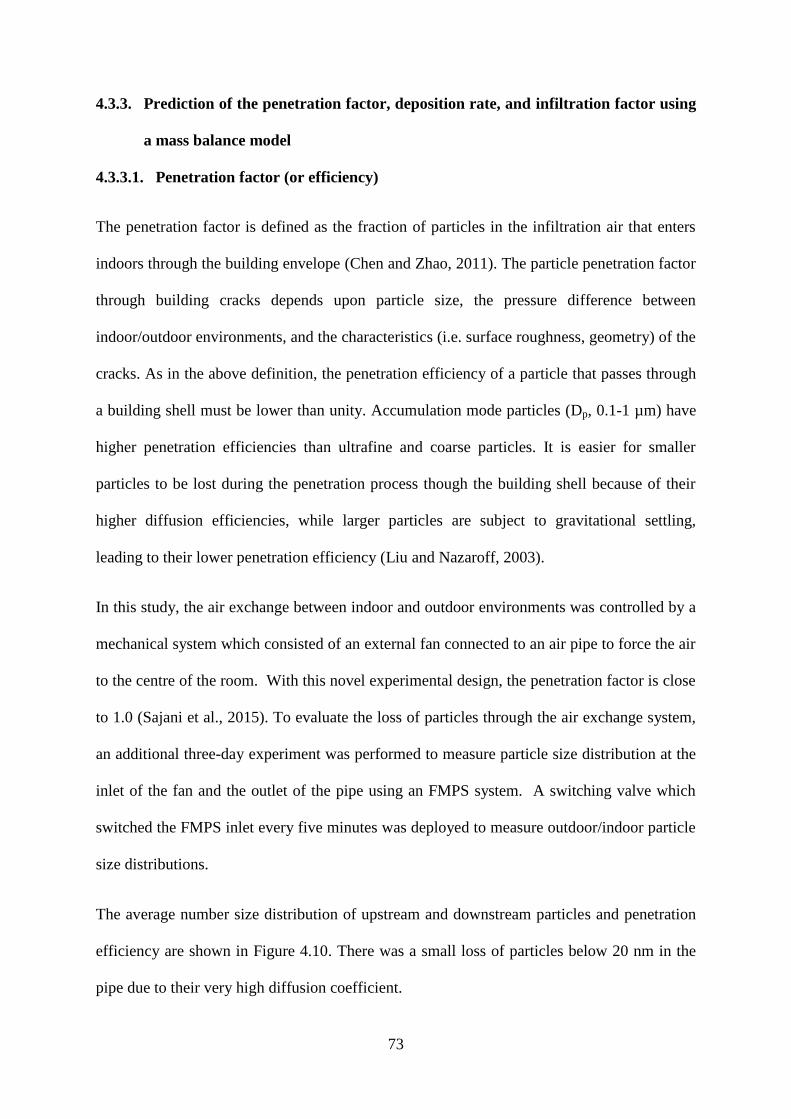
73
4.3.3. Prediction of the penetration factor, deposition rate, and infiltration factor using
a mass balance model
4.3.3.1. Penetration factor (or efficiency)
The penetration factor is defined as the fraction of particles in the infiltration air that enters
indoors through the building envelope (Chen and Zhao, 2011). The particle penetration factor
through building cracks depends upon particle size, the pressure difference between
indoor/outdoor environments, and the characteristics (i.e. surface roughness, geometry) of the
cracks. As in the above definition, the penetration efficiency of a particle that passes through
a building shell must be lower than unity. Accumulation mode particles (Dp, 0.1-1 µm) have
higher penetration efficiencies than ultrafine and coarse particles. It is easier for smaller
particles to be lost during the penetration process though the building shell because of their
higher diffusion efficiencies, while larger particles are subject to gravitational settling,
leading to their lower penetration efficiency (Liu and Nazaroff, 2003).
In this study, the air exchange between indoor and outdoor environments was controlled by a
mechanical system which consisted of an external fan connected to an air pipe to force the air
to the centre of the room. With this novel experimental design, the penetration factor is close
to 1.0 (Sajani et al., 2015). To evaluate the loss of particles through the air exchange system,
an additional three-day experiment was performed to measure particle size distribution at the
inlet of the fan and the outlet of the pipe using an FMPS system. A switching valve which
switched the FMPS inlet every five minutes was deployed to measure outdoor/indoor particle
size distributions.
The average number size distribution of upstream and downstream particles and penetration
efficiency are shown in Figure 4.10. There was a small loss of particles below 20 nm in the
pipe due to their very high diffusion coefficient.
74
Figure 4.10: Particle penetration factor through the study system.
4.3.3.2. Application of a mass balance model to predict the penetration factor,
infiltration factor and deposition rate
A mass balance model was applied to a night-time data set (00:00-06:00 am) which has an
averaged indoor number concentration of 5272.6 particles cm-3
. As discussed in section
4.3.2.3, the coagulation process could be negligible if total particle concentration is lower
than 5000 particles cm-3
. Therefore, we assumed that coagulation and evaporation process do
not play a significant role in this period. The mass balance model (4.3) will be converted to
the following equation:
𝐶𝑖𝑛 (𝑡+∆𝑡) =0.5∗𝑃∗𝐶𝑜𝑢𝑡 (𝑡+∆𝑡)
0.5+𝑘𝑑(1 − 𝑒−(0.5+𝑘𝑑)∗∆𝑡) + 𝐶𝑖𝑛 (𝑡)𝑒−(0.5+𝑘𝑑)∗∆𝑡 (4.12)
75
a. Can we predict simultaneously unknown penetration factor and deposition rate (kd, h-1
)
values using a mass balance model?
In equation (4.12), P and kd (h-1
) were allowed to vary independently over the likely ranges of
values 0< P ≤1 and kd >0 respectively. In our model, the P values varied with intervals of
0.01 between 0 and 1, and the kd (h-1
) values varied with intervals of 0.01 between 0 and 10.
Each pair of P and kd values result in different values of RMSE and r. To obtain the best fit
between the modelled and measured indoor concentration, the pair of P and kd values was
selected with a minimum value of RMSE and maximum value of r.
As a result, it is impossible to obtain a unique pair of P and kd values because there are
numerous pairs of values for P and kd that have similar low values of RMSE. For example,
Figure 4.10 shows the distribution of RMSE and r values for particles at a count diameter of
93.1 nm, depending on different values of P and kd. The orange curve shown in Figure 4.11
illustrates the area of lowest minimum value of RMSE. This means that there are many pairs
of P and kd values corresponding to a minimum value of RMSE (minimum value of RMSE is
1.45). In this case, P ranged from 0.45 to 1.0 and kd ranged from 0 to 0.35 h-1
. Similarly, as
shown in Figure 4.11, there were various pairs of P and kd that were close to the highest value
of r (~0.98). This result is in agreement with those of Bennett and Koutrakis (2006),
determined the best values for P and k through the minimum value of χ2 (referred to as the
error) using the NLIN procedure in SAS (SAS Inc. Carry, NC).
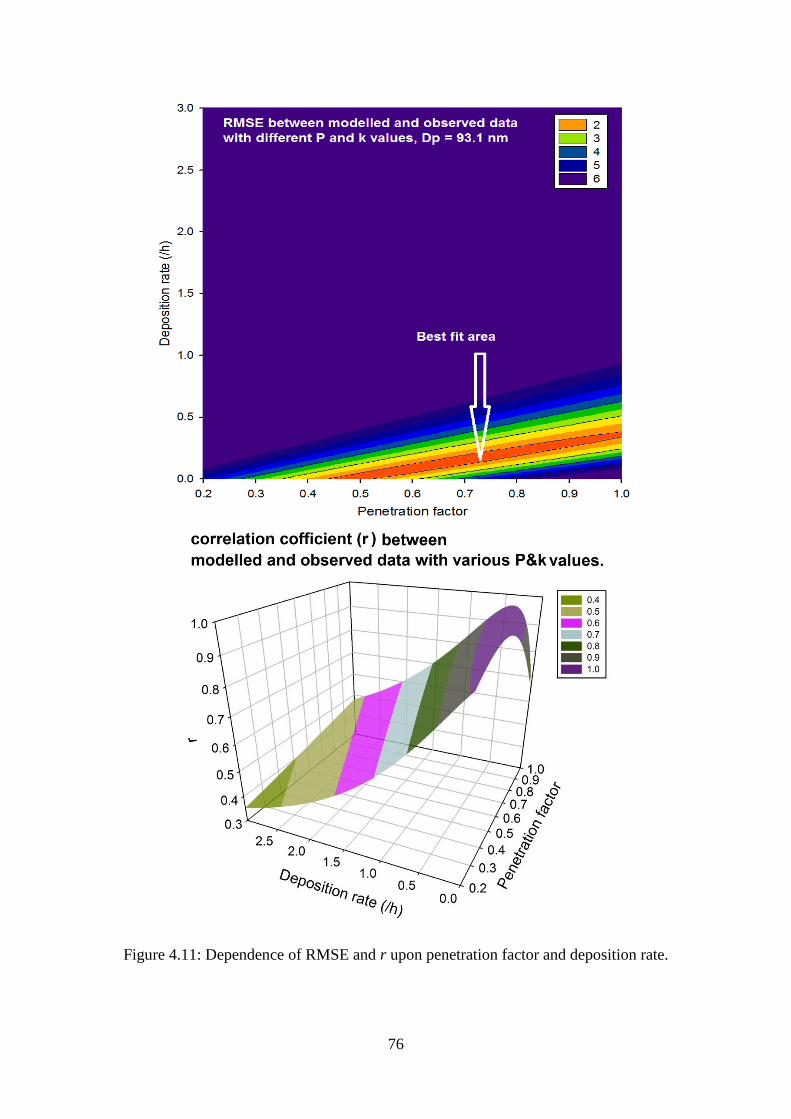
76
Figure 4.11: Dependence of RMSE and r upon penetration factor and deposition rate.
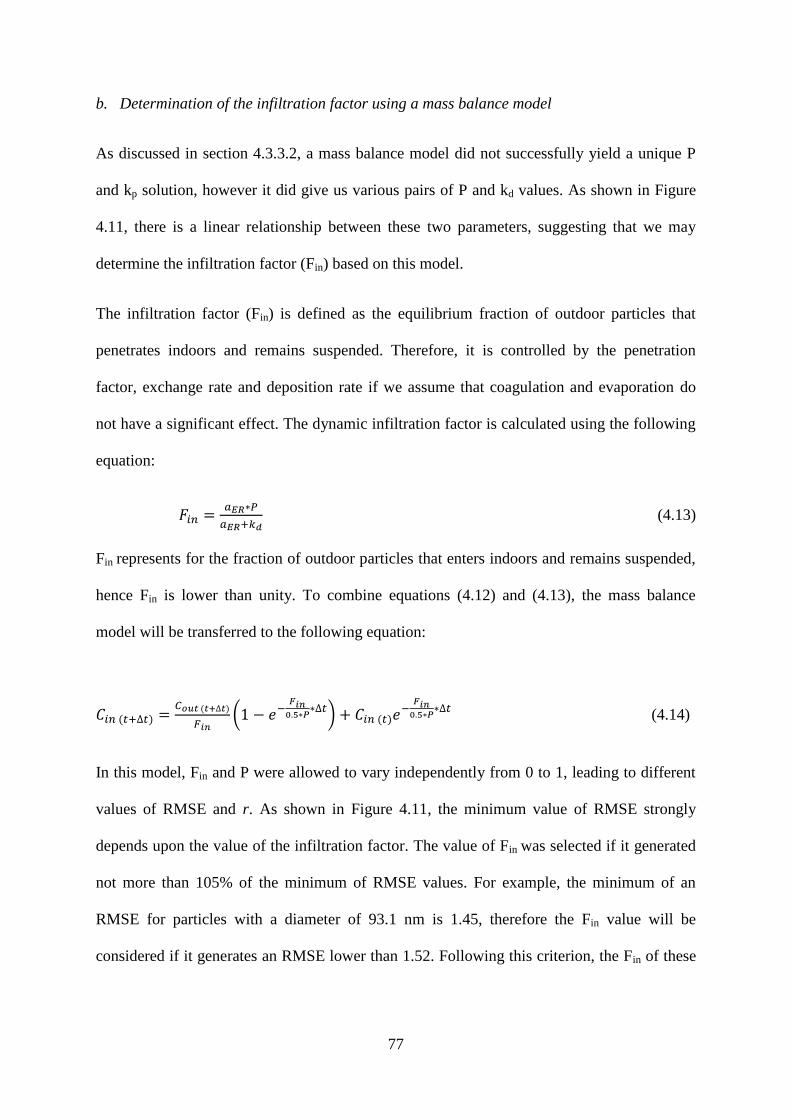
77
b. Determination of the infiltration factor using a mass balance model
As discussed in section 4.3.3.2, a mass balance model did not successfully yield a unique P
and kp solution, however it did give us various pairs of P and kd values. As shown in Figure
4.11, there is a linear relationship between these two parameters, suggesting that we may
determine the infiltration factor (Fin) based on this model.
The infiltration factor (Fin) is defined as the equilibrium fraction of outdoor particles that
penetrates indoors and remains suspended. Therefore, it is controlled by the penetration
factor, exchange rate and deposition rate if we assume that coagulation and evaporation do
not have a significant effect. The dynamic infiltration factor is calculated using the following
equation:
𝐹𝑖𝑛 =𝑎𝐸𝑅∗𝑃
𝑎𝐸𝑅+𝑘𝑑 (4.13)
Fin represents for the fraction of outdoor particles that enters indoors and remains suspended,
hence Fin is lower than unity. To combine equations (4.12) and (4.13), the mass balance
model will be transferred to the following equation:
𝐶𝑖𝑛 (𝑡+∆𝑡) =𝐶𝑜𝑢𝑡 (𝑡+∆𝑡)
𝐹𝑖𝑛(1 − 𝑒−
𝐹𝑖𝑛0.5∗𝑃
∗∆𝑡) + 𝐶𝑖𝑛 (𝑡)𝑒−𝐹𝑖𝑛
0.5∗𝑃∗∆𝑡
(4.14)
In this model, Fin and P were allowed to vary independently from 0 to 1, leading to different
values of RMSE and r. As shown in Figure 4.11, the minimum value of RMSE strongly
depends upon the value of the infiltration factor. The value of Fin was selected if it generated
not more than 105% of the minimum of RMSE values. For example, the minimum of an
RMSE for particles with a diameter of 93.1 nm is 1.45, therefore the Fin value will be
considered if it generates an RMSE lower than 1.52. Following this criterion, the Fin of these
78
particles value ranged between 0.45-0.52, as shown in Figure 4.12. In summary, a mass
balance model can successfully predict the infiltration factor.
Figure 4.12: RMSE and r depend upon penetration and infiltration factors.
79
c. Determination of the deposition rate (kd) when the penetration factor is known
The mass balance model fails to predict both unknown P and kd values, but it gives us the
relationship between these values. Therefore, if we know one value of these parameters, it is
easy to predict the value of the other. In our novel experimental design, the penetration factor
was controlled to be nearly unity, as shown in Figure 4.10; deposition rate was estimated
based on the application of a mass balance model to night time data sets. As shown in Figure
4.14, the mass balance model predicts very well indoor particles with a diameter larger than
34 nm (r >0.87), particularly for accumulation particles (r >0.95 for sampling campaign 1),
but it is not very good in predictions of nucleation mode particles (r ~0.64-0.81). This is
maybe due to the influence of evaporation and the weak effect of coagulation on the small
particles.
The estimated particle deposition rates are shown in Figure 4.13. They ranged from 0.3 to
1.97 h-1
, closely depending upon particle size. For submicron particles, a smaller particle has
a higher deposition rate. The deposition rate of a particle with a diameter of 30 nm is three
times higher than that of a particle with a diameter of 100 nm. This finding is consistent with
previous studies by Long et al. (2001), Chao et al. (2003) and Hussein et al. (2006). In
addition, we compare this deposition rate calculated by a mass balance model with those
calculated by Lai and Nazaroff (2000)’s theory models. For particles with a diameter smaller
than 150 nm, our estimated deposition rate fits very well with the calculation from models
with an assumption of friction velocity (u) ranging from 35 to 40 cm/s. For larger particles,
the deposition rate was found to be much higher than a Lai and Nazaroff (2000) deposition
rate curve. This is maybe due to their assumption of a perfectly smooth surface, which has a
marked effect on the accumulation mode particles.
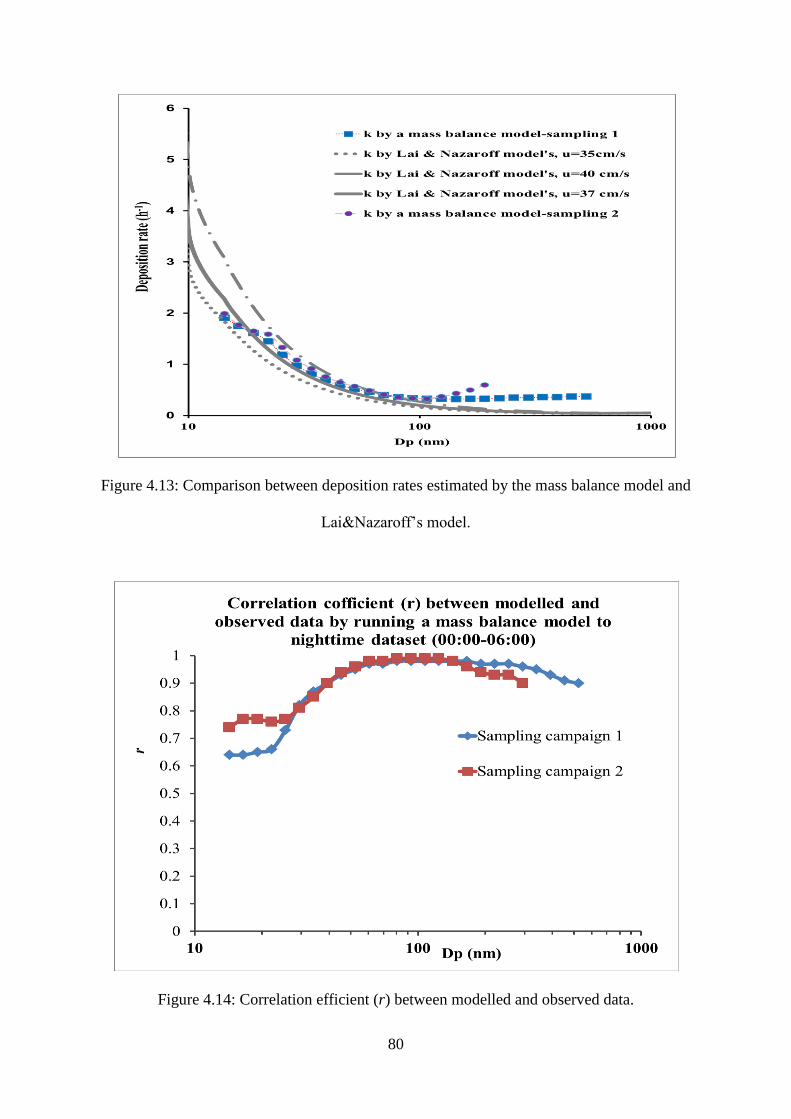
80
Figure 4.13: Comparison between deposition rates estimated by the mass balance model and
Lai&Nazaroff’s model.
Figure 4.14: Correlation efficient (r) between modelled and observed data.
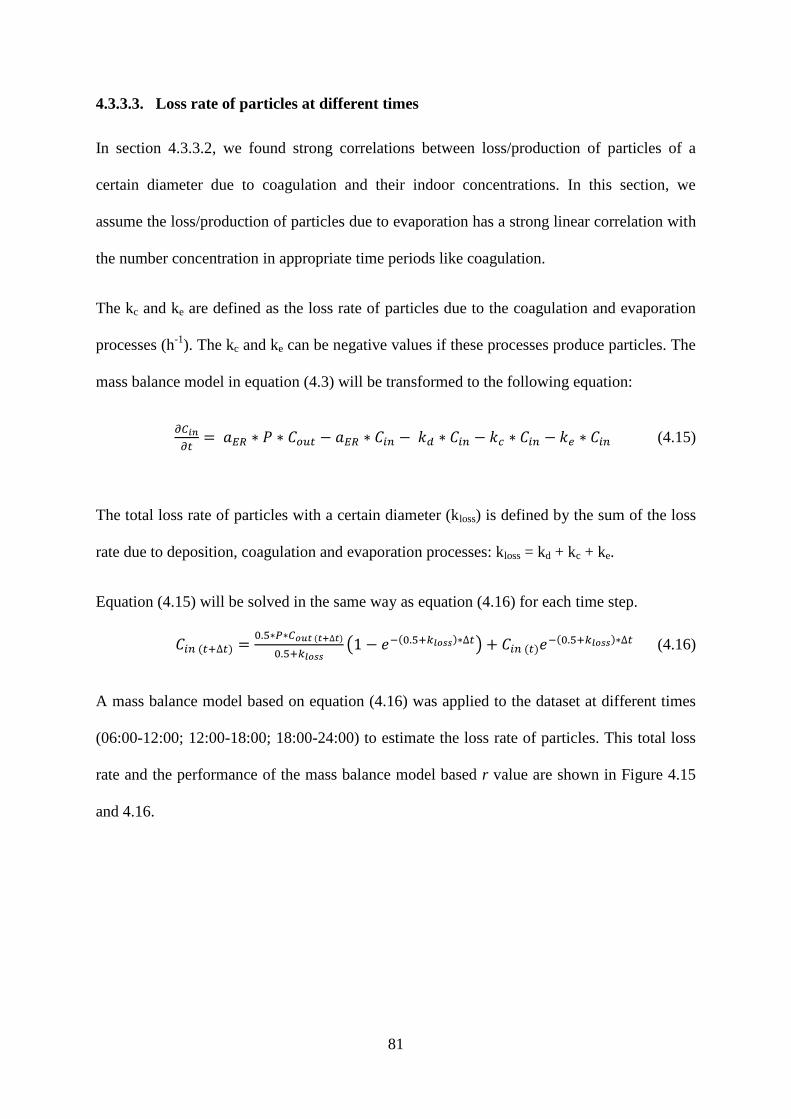
81
4.3.3.3. Loss rate of particles at different times
In section 4.3.3.2, we found strong correlations between loss/production of particles of a
certain diameter due to coagulation and their indoor concentrations. In this section, we
assume the loss/production of particles due to evaporation has a strong linear correlation with
the number concentration in appropriate time periods like coagulation.
The kc and ke are defined as the loss rate of particles due to the coagulation and evaporation
processes (h-1
). The kc and ke can be negative values if these processes produce particles. The
mass balance model in equation (4.3) will be transformed to the following equation:
𝜕𝐶𝑖𝑛
𝜕𝑡= 𝑎𝐸𝑅 ∗ 𝑃 ∗ 𝐶𝑜𝑢𝑡 − 𝑎𝐸𝑅 ∗ 𝐶𝑖𝑛 − 𝑘𝑑 ∗ 𝐶𝑖𝑛 − 𝑘𝑐 ∗ 𝐶𝑖𝑛 − 𝑘𝑒 ∗ 𝐶𝑖𝑛 (4.15)
The total loss rate of particles with a certain diameter (kloss) is defined by the sum of the loss
rate due to deposition, coagulation and evaporation processes: kloss = kd + kc + ke.
Equation (4.15) will be solved in the same way as equation (4.16) for each time step.
𝐶𝑖𝑛 (𝑡+∆𝑡) =0.5∗𝑃∗𝐶𝑜𝑢𝑡 (𝑡+∆𝑡)
0.5+𝑘𝑙𝑜𝑠𝑠(1 − 𝑒−(0.5+𝑘𝑙𝑜𝑠𝑠)∗∆𝑡) + 𝐶𝑖𝑛 (𝑡)𝑒−(0.5+𝑘𝑙𝑜𝑠𝑠)∗∆𝑡 (4.16)
A mass balance model based on equation (4.16) was applied to the dataset at different times
(06:00-12:00; 12:00-18:00; 18:00-24:00) to estimate the loss rate of particles. This total loss
rate and the performance of the mass balance model based r value are shown in Figure 4.15
and 4.16.
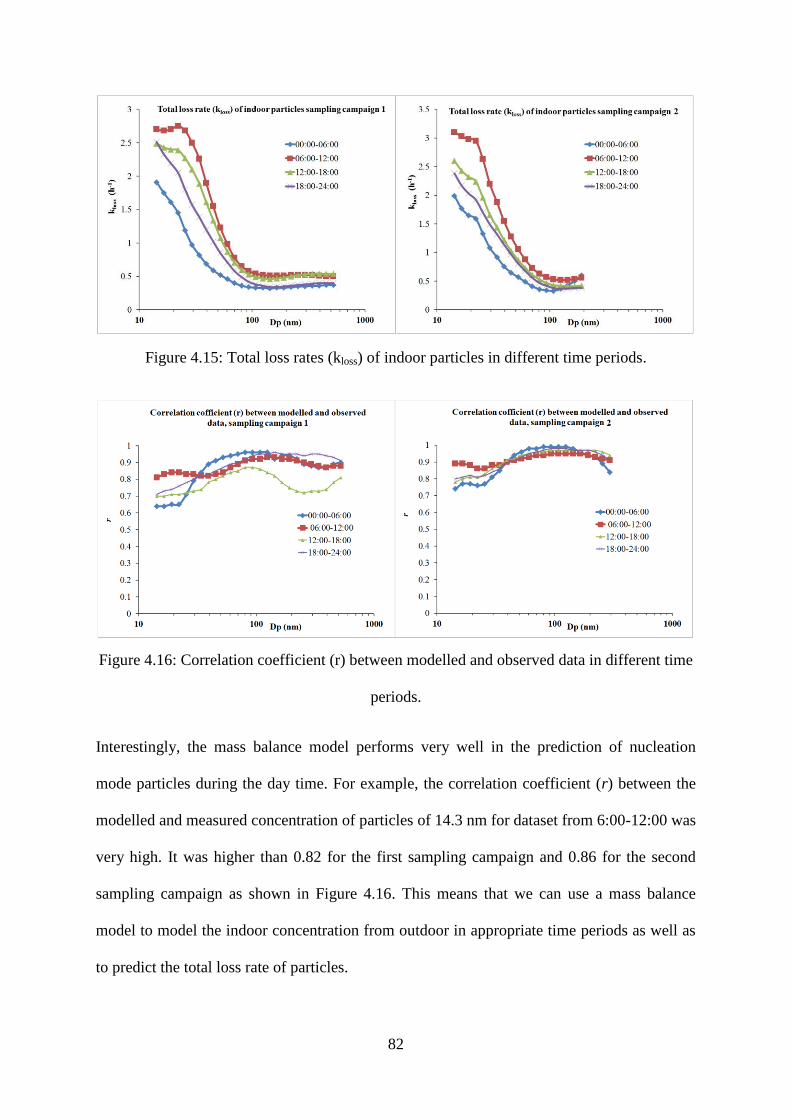
82
Figure 4.15: Total loss rates (kloss) of indoor particles in different time periods.
Figure 4.16: Correlation coefficient (r) between modelled and observed data in different time
periods.
Interestingly, the mass balance model performs very well in the prediction of nucleation
mode particles during the day time. For example, the correlation coefficient (r) between the
modelled and measured concentration of particles of 14.3 nm for dataset from 6:00-12:00 was
very high. It was higher than 0.82 for the first sampling campaign and 0.86 for the second
sampling campaign as shown in Figure 4.16. This means that we can use a mass balance
model to model the indoor concentration from outdoor in appropriate time periods as well as
to predict the total loss rate of particles.
83
Figure 4.15 shows the total loss rate (kloss) of particles in different time periods. A higher loss
rate was found in the period 06:00-12:00 than at night time, suggesting that coagulation and
evaporation play very important roles in the loss of particles during the daytime in a house
heavily affected by road traffic emissions. As shown in Figure 4.17, the particle number
concentration for both outdoor and indoor environments during the daytime was much higher
than that during the night time, resulting in a higher particle loss due to the coagulation
process.
This result is in agreement with the higher I/O ratio at night time that was discussed in
section 4.3.1.1. Like the deposition rate, the loss rate for a particle strongly depends upon its
size. The total loss rate of a particle increases exponentially when its size decrease from 100
nm to 22.5 nm. This is due to the greater increase in coagulation and evaporation effects on
small particles (the Aitken mode particles) than large particles (accumulation mode particles).
Figure 4.17: Outdoor/indoor particle number size distribution (PNSD) in different time
periods.
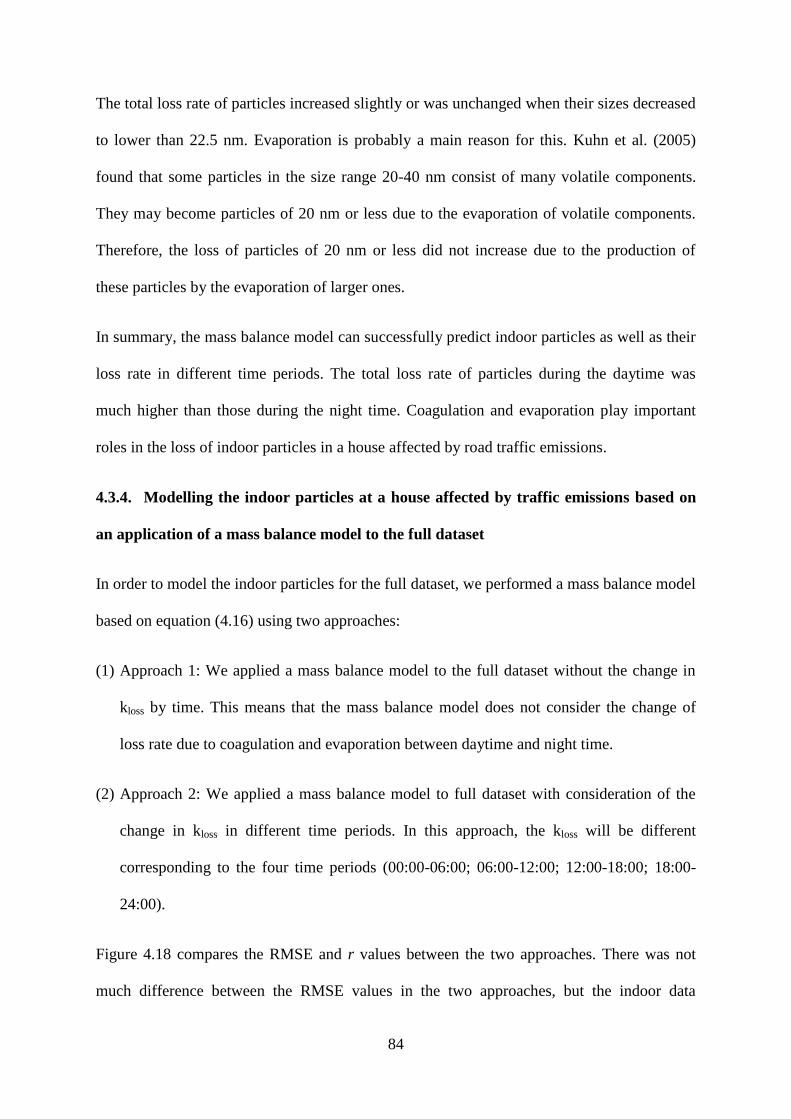
84
The total loss rate of particles increased slightly or was unchanged when their sizes decreased
to lower than 22.5 nm. Evaporation is probably a main reason for this. Kuhn et al. (2005)
found that some particles in the size range 20-40 nm consist of many volatile components.
They may become particles of 20 nm or less due to the evaporation of volatile components.
Therefore, the loss of particles of 20 nm or less did not increase due to the production of
these particles by the evaporation of larger ones.
In summary, the mass balance model can successfully predict indoor particles as well as their
loss rate in different time periods. The total loss rate of particles during the daytime was
much higher than those during the night time. Coagulation and evaporation play important
roles in the loss of indoor particles in a house affected by road traffic emissions.
4.3.4. Modelling the indoor particles at a house affected by traffic emissions based on
an application of a mass balance model to the full dataset
In order to model the indoor particles for the full dataset, we performed a mass balance model
based on equation (4.16) using two approaches:
(1) Approach 1: We applied a mass balance model to the full dataset without the change in
kloss by time. This means that the mass balance model does not consider the change of
loss rate due to coagulation and evaporation between daytime and night time.
(2) Approach 2: We applied a mass balance model to full dataset with consideration of the
change in kloss in different time periods. In this approach, the kloss will be different
corresponding to the four time periods (00:00-06:00; 06:00-12:00; 12:00-18:00; 18:00-
24:00).
Figure 4.18 compares the RMSE and r values between the two approaches. There was not
much difference between the RMSE values in the two approaches, but the indoor data
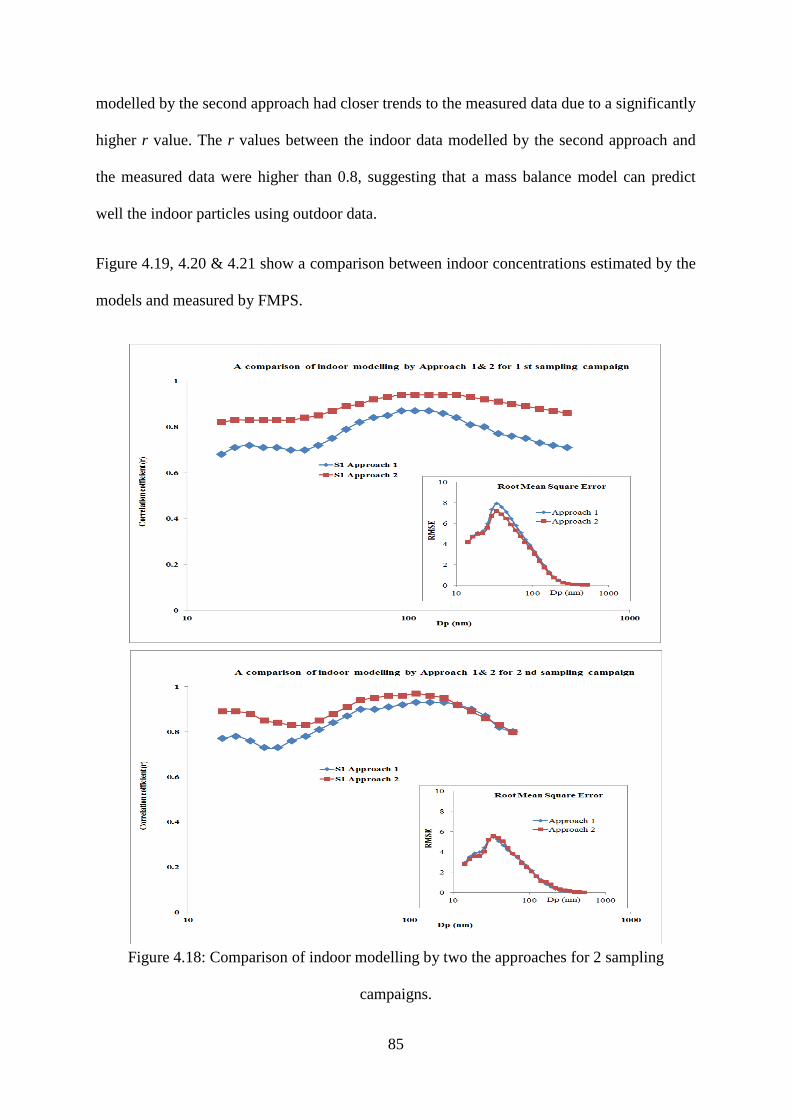
85
modelled by the second approach had closer trends to the measured data due to a significantly
higher r value. The r values between the indoor data modelled by the second approach and
the measured data were higher than 0.8, suggesting that a mass balance model can predict
well the indoor particles using outdoor data.
Figure 4.19, 4.20 & 4.21 show a comparison between indoor concentrations estimated by the
models and measured by FMPS.
Figure 4.18: Comparison of indoor modelling by two the approaches for 2 sampling
campaigns.
86
4.4. Conclusion
In conclusion, this study had investigated the I/O ratios in different time periods. As a result,
these ratios have a strong diurnal pattern and were much lower in the daytime than at night
time. In addition, it has evaluated the mass balance model that was applied to predict the
indoor concentrations from outdoor concentrations. A mass balance model cannot predict
unknown penetration factors and deposition rates separately, but it can predict the infiltration
factor. Coagulation and evaporation processes play important roles in the loss or production
of particles.
Based on the mass balance model, the loss rate of indoor particles was calculated. This not
only depends upon their size, but also the sampling time. A higher loss rate was found for
smaller particles and in the daytime. A very high correlation between the modelled and
measured indoor data suggests that a mass balance model with a consideration of different
loss rates during different time periods can predict very accurately the concentration of
indoor particles originating from outdoor particles in a house heavily affected by road traffic
emissions.
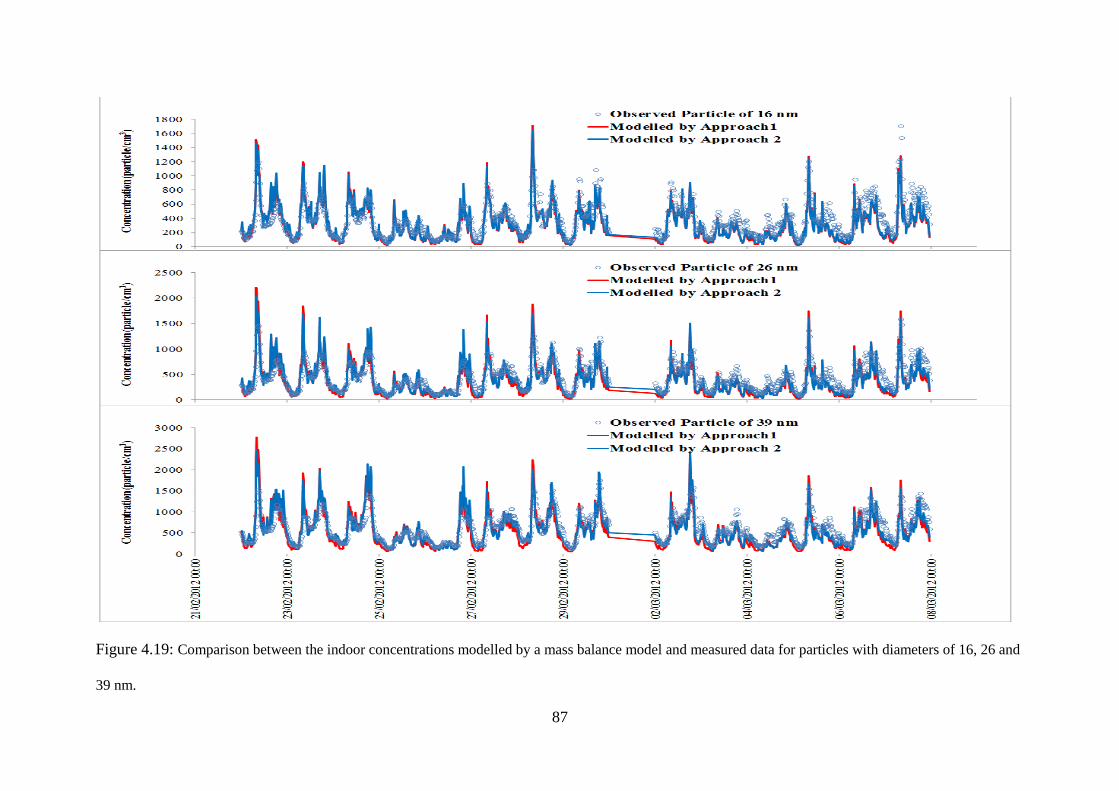
87
Figure 4.19: Comparison between the indoor concentrations modelled by a mass balance model and measured data for particles with diameters of 16, 26 and
39 nm.
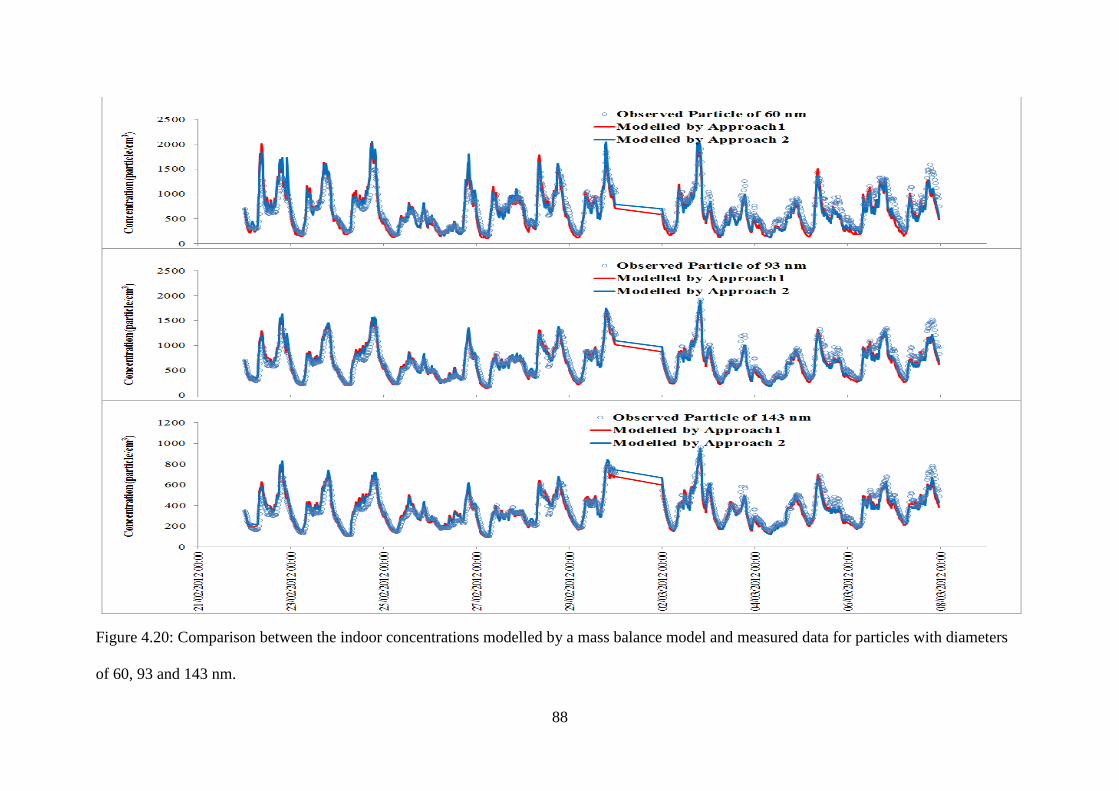
88
Figure 4.20: Comparison between the indoor concentrations modelled by a mass balance model and measured data for particles with diameters
of 60, 93 and 143 nm.
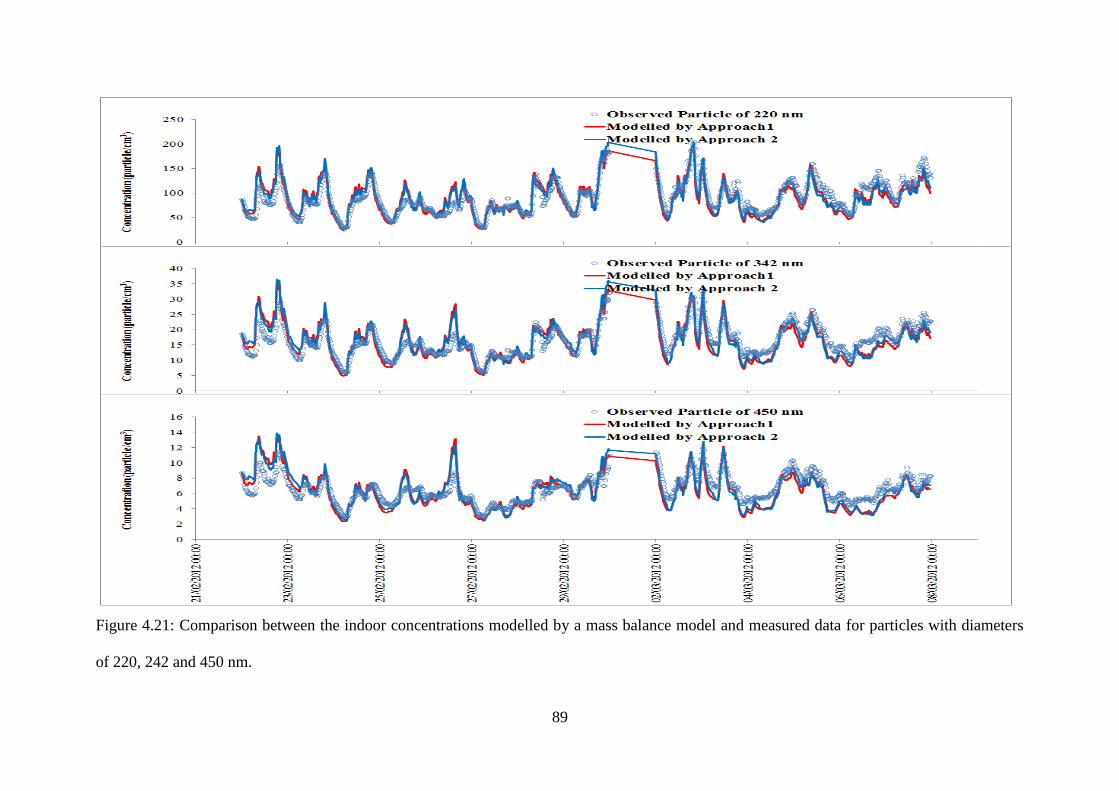
89
Figure 4.21: Comparison between the indoor concentrations modelled by a mass balance model and measured data for particles with diameters
of 220, 242 and 450 nm.
90
Chapter 5: HYGROSCOPIC PROPERTIES OF PARTICLES AND
THEIR IMPLICATIONS FOR THE CALCULATION OF LUNG
DEPOSITION FRACTION
This chapter presents the existing knowledge on the hygroscopic growth factor (Gf) of
atmospheric submicron particles and their influence on the lung deposition calculation. The
chapter first briefly reviews the Gf values of particles emitted from various sources, including
nucleation, traffic emissions and biomass burning, and discusses the spatial and temporal
variations. It then summarizes the Gf values of submicron particles and the number fraction
of each hygroscopic group measured in different ambient environments. These include
marine, roadside, urban background and rural environments. Furthermore, the effect of
hygroscopicity on the lung deposition fraction of ambient particles has been estimated. The
ICRP model seems to predict well the deposition fraction (DF) values for small ambient
particles in the extra-thoracic and tracheo-bronchial region, but not the alveolar region,
where they are overestimated. Finally, this chapter applies our modified ICRP model to
estimate the lung deposition of particles from a street canyon and an urban background site
in London and a rural site 80 kilometres to the west of London, UK.
This chapter contains some sections of verbatim text adapted from Vu et al. (2015b)
published as part of this PhD. The author’s contribution: writing, contribution of ideas and
numerical calculations.
91
5.1. Introduction
Hygroscopic properties are well known to play a vital role in the atmospheric behaviour and
health implications of aerosols (Ferron et al., 2005; Hiller, 1991; Tu and Knutson, 1984).
Aerosol particles can shrink or grow in size by exchanging water vapour with the surrounding
air as relative humidity (RH) changes, thus having a direct effect on the radiation balance of
the atmosphere through the change in scattering and absorption of light (Tang et al., 1981).
Furthermore, hygroscopicity has a strong influence on the ability of particles to act as cloud
condensation nuclei (Hämeri et al., 2001; Petters and Kreidenweis, 2007; Reutter et al.,
2009). Consequently, it also indirectly affects the global climate. Particles can also absorb the
water vapour in the respiratory tract when they penetrate into the lung, changing in size, and
hence affecting their lung deposition fraction (Broday and Georgopoulos, 2001; Chan et al.,
2002; Finlay and Stapleton, 1995; Hofmann, 2011).
The hygroscopic growth factor (Gf) is one of most used parameters in determining the
hygroscopic properties of particles and their influences. The hygroscopic growth factor (Gf)
is defined (Equation 5.1) as the ratio between particle diameter measured at a specific RH
(Dw), and dry particle diameter (Dp) measured at a low RH (RH <10%) (Massling et al.,
2005; Swietlicki et al., 2008):
Gf (RH) = 𝐷𝑤(RH)
𝐷𝑝 (RH<10%) (5. 1)
The Gf of atmospheric aerosols is determined by several methods, including measurement
using particle spectrometers (i.e. the Hygroscopic Tandem Differential Mobility Analyzer H-
TDMA) or estimated using models from the growth factors of each particle composition
(Meier et al., 2009). Gf values depend upon both the physical and chemical properties of
particles, such as particle size and composition. Based on the Gf values, ambient aerosols
92
have been classified into four hygroscopic groups: nearly hydrophobic particles (Gf =1.0-1.11
for 100 nm particles at RH =90%), less-hygroscopic particles (Gf =1.11-1.33), more-
hygroscopic particles (Gf =1.33-1.85) and sea-salt particles (Gf >1.85) (Swietlicki et al.,
2008).
Recently, there have been numerous publications which have reported measurements of the
hygroscopic growth factors of particles in various environments. Swietlicki et al. (2008)
made an excellent review on the hygroscopic properties of submicron atmospheric particles
measured with H-TDMA instruments. Swietlicki et al. (2008)’s work describes the Gf
measurement methods, the variation in measured Gf between different atmospheres as well as
the influence of chemical and physical properties on Gf. In addition, the implications of Gf in
predicting particle critical supersaturation have been considered (Rissler et al., 2010;
Swietlicki et al., 2008). However, the temporal variation or influence of sources upon Gf has
not yet been fully investigated. Therefore, this work aims to summarize the measured Gf
values from different sources and the chemical and physical processes which cause the
change in Gf values during ageing processes. In addition, we have estimated the influence of
hygroscopic properties on the lung deposition of ambient particles. Furthermore, we applied
our modified ICRP curves to estimate the regional lung deposition fraction of ambient
particles in three sites in southern England with strongly contrasting traffic volumes.
5.2. Hygroscopic properties of aerosols emitted from different source
5.2.1. Traffic Emissions
Traffic emissions are recognised as a main source of particles in urban environments
(Morawska et al., 2008), and hence the hygroscopic properties of traffic particles are of much
interest. One of the earliest Gf measurements of traffic particles was conducted by
93
Weingartner et al. (1993). Aerosols were generated by a four-stroke spark ignition engine
using unleaded gasoline and then analysed by a Humidity Tandem Differential Mobility
Analyzer (HTDMA) system. Measured growth factors of particles with original diameters of
29, 42, 77 and 111 nm at sub-and-super saturations showed very low values (~0.98-1.15), and
therefore they were considered to be hydrophobic. The study found that particles of different
sizes showed different hygroscopic behaviours. For example, primary particles with
diameters of 29 and 42 nm were observed to grow faster than aggregates with a diameter of
77 and 111 nm.
In addition, Weingartner et al. (1995) noted that particles with a diameter of 51.5 nm kept
their initial size, whilst larger ones (108 nm), typically non-spherical fractal-like structure
aggregates, shrank to around 99% of their initial size at RH ≤95%. This could be explained
by the capillary forces of water condensed in the angle cavities of aggregates, which caused
any asymmetric part of the aggregates to collapse. When exposed to RH ≥95%, both primary
particles and aggregates started to grow, but this growth was not appreciable. Similarly,
Weingartner et al. (1997) conducted an experiment on soot particles from a diesel engine and
found that these particles were also nearly hydrophobic with growth factors roughly 1.01 for
50-110 nm particles. This result was confirmed by Dua et al. (1999) who measured the
hygroscopicity of particles emitted from two different diesel-powered vehicles. The diesel
particles were found to be slightly soluble, and did not show a significant growth at a RH
greater than 99%.
The hygroscopicity of traffic particles depends upon the type of fuels, fuel additives and pre-
treatment devices. Weingartner et al. (1997) found that the growth factors of gasoline
particles were smaller than those of diesel particles measured under loads representing a lean
air/fuel ratio. In addition, a higher sulphur level in fuel was reported to lead to a higher
growth factor of particles. Moreover, soot particles become more hygroscopic once they are
94
subjected to pre-treatment with O3 and UV radiation (Weingartner et al., 1997), which can be
explained by the oxidation or photolysis of hydrocarbons such as PAHs on the particle
surface, which produce more soluble compounds.
In a further study on the effect of fuel on hygroscopic properties of diesel particles, Happonen
et al. (2013) studied the effect of adding oxygen into the fuel using hydro-treated vegetable
oils (HVO) and with HVO + fuel-oxygenate (di-n-pentyl ether) blend. They found an
increased hygroscopicity of exhaust particles after the addition of the oxygen rich blend.
Oxygen atoms, which were emitted in larger quantities with oxygenated fuel, may increase
the oxygen to carbon ratio of an hypothetical superficial thin layer of organic material on the
exhaust particles (Happonen et al. (2013)), resulting in more polar compounds by oxidation,
and thus increasing the hygroscopic growth of the emitted particles. This is consistent with
the findings of Jimenez et al. (2009), who reported that an increase of the oxygen to carbon-
ratio resulted in an in increased hygroscopicity of the organic aerosol.
During the ageing process, the hygroscopic properties of such particles could be changed
leading to a higher growth factor. Weingartner et al. (1995) measured the hygroscopicity of
aged aerosols in a dark bag filled with exhaust gases from an engine. Their investigation
found that particles became more hygroscopic when the residence time increased in the bag.
After six hours of the aging process, the Gf values of traffic particles increased from 1.0 to
1.04. Weingartner et al. (1997) suggested four possible mechanisms, to understand the
changes in the hygroscopicity of the soot particles during the aging process. These were
coagulation, gas-to-particle conversion, cloud processing and photochemical degradation.
Kotzick and Niessner (1999) studied the aging process of ultrafine carbon aerosols in order
to clarify which chemical and physical processes were responsible for these changes. They
suggested that coagulation of ultrafine carbonaceous aerosols with soluble particles such as
95
sodium chloride, sulphuric acid aerosols and oxidised hydrophilic species produced by
reaction with ozone could transform carbonaceous particles, making then more hydrophilic
and allowing them to act as cloud condensation nuclei in the atmospheric condensation
process. This is in agreement with Decesari et al. (2002) who suggested that water-soluble
organic compounds produced from the oxidation of soot particles make soot particles become
more hydrophilic.
In a recent study on the change in hygroscopicity during ageing of diesel soot, the increase in
the hygroscopic growth factor of soot particles was linked with the condensation of
secondary organic aerosols formed by the photo-oxidation of volatile organic compounds
emitted with exhaust gases (Tritscher et al., 2011).
5.2.2. Biomass Burning
Biomass burning is an important source of particulate matter in the atmosphere. The
hygroscopicity of particles emitted from biomass burning is known to change the light
scattering and cloud nucleation properties, thereby having a strong impact on the earth’s
radiative balance, as well as the climate. Hence, the hygroscopicity of biomass burning
related particles is of much concern.
Freshly emitted biomass burning particles are known to be hydrophobic or less-hygroscopic.
Rose et al. (2008) showed a low growth factor with Gf values varying between 1.04 and 1.10
at RH 85%. This low hygroscopic growth factor is due to the chemical properties of particles
generated from biomass burning, which mainly consist of organic materials and black carbon,
both known to be hydrophobic or less-hygroscopic (Martin et al., 2013). Dusek et al. (2011)
suggested that the hygroscopicity of wood burning particles was predominantly influenced by
organic compounds. The growth factors of freshly generated biomass burning particles are
small and equivalent to particles consisting of 5-20% ammonium sulphate along with
96
insoluble materials. Investigating the hygroscopic properties of five major organic products
(levoglucosan, D-glucose, and vanillic, syringic and 4-hydroxybenozoic acids) from the
pyrolysis of wood, Mochida and Kawamura (2004) found that levoglucosan and D-glucose
show a significant hygroscopic growth (Gf ~1.37-1.38 at 90% RH) while the remainder do
not show any hygroscopic growth even up to 95% RH.
Like traffic-related particles, particles emitted from biomass burning are expected to show an
increase in hygroscopic growth factors during ageing in the atmosphere. Kotchenruther and
Hobbs (1998) reported that the growth factors for light scattering for aged smoke (1.3-1.5)
were higher than those for fresh smoke (1.1-1.3). A recent study by Martin et al. (2013) who
conducted different wood burning experiments in a smog chamber found that the
hygroscopicity of such particles increased with time during the aging process, except in the
smouldering phase experiment. Secondary formation of soluble components such as sulphate
and polar organic compounds was responsible for the increase in the hygroscopicity of smoke
particles during ageing (Hallquist et al., 2009; Kotchenruther and Hobbs, 1998; Rogers et al.,
1991). Furthermore, Decesari et al. (2002) reported that macromolecular humic-like
substances can be formed by the atmospheric oxidation of soot; thereby increasing the water
uptake properties of aerosol particles. To conclude, the oxidation of organic soot is also
known as the main ageing process which makes particles become more hydrophilic (Martin
et al., 2013).
5.2.3. Nucleation
New particles formed by nucleation account for a significant fraction of the total number of
particles in the atmospheric environment. Ogulei et al. (2007) reported that nucleation related
with traffic emissions represented between 15% to 21% of the total number of particles in
97
Rochester, United States. Similarly, another study conducted by Kasumba et al. (2009) found
that nucleation represented between 15.4 to 20.7% of total particle number.
The hygroscopic properties of nucleation mode particles (4-20 nm) have been measured in
various environments such as in urban/suburban areas (Petäjä et al., 2007; Sakurai et al.,
2005; Väkevä et al., 2002b), in boreal forests (Hämeri et al., 2001; Park et al., 2009) and in
coastal regions (Buzorius et al., 2004; Väkevä et al., 2002a). Sakurai et al. (2005) measured
Gf in an urban background of Atlanta and reported that the 10 nm nucleation particles were
more hygroscopic; showing a growth factor value of ~1.4, which was equivalent to 10 nm
ammonium sulphate particles. This finding is in agreement with the hypothesis that new
particles in Atlanta consisted of ammonium and sulphate alone (Jung et al., 2006). Similarly,
Petäjä et al. (2007) found higher growth factors (Gf maximum ~ 1.6) of nucleation mode
particles during nucleation event days, compared to those (Gf maximum ~1.3) on non-event
days in Marseille (France). However, this study also found that the condensational growth of
nucleation mode particles does not only depend upon sulphuric acid concentration, but is also
controlled by other water insoluble components. By dividing the nucleation event days into
groups based on the anthropogenic influence, Petäjä et al. (2007) concluded that the Gf values
varied between the different properties of condensing vapours. Particularly, during clean
events with less anthropogenic influence, the growth of nucleation particles was due to
insoluble materials rather than the condensation of water soluble components, whilst during
the polluted events, the growth of particles was mainly contributed by water soluble
components.
More evidence of the contribution of other insoluble materials to the growth of nucleation
particles has been provided by other observations of the lower growth factor values of
nucleation particles (Hämeri et al., 2001; Väkevä et al., 2002a; Väkevä et al., 2002b). Väkevä
et al. (2002a) reported that the nucleation mode particles (8-10 nm) sampled during
98
nucleation events on the coast of Ireland were less hygroscopic (Gf ~1.1). This was attributed
to new particles formed in coastal areas as a result of the nucleation of iodine oxides
(Carpenter et al., 1999; O'Dowd et al., 2002a; O'Dowd et al., 2002b), resulting in a much
lower growth factor. In addition, Hämeri et al. (2001) investigated the hygroscopic growth of
nucleation particles at a boreal forest site in Southern Finland. This study concluded that the
sulphuric acid concentrations could not explain the growth of nucleation particles by
themselves in the boreal forest, suggesting that the growth process may be related to organic
compounds. To conclude, the hygroscopic growth factor of nucleation mode particles varied
between environments, depending upon the air masses as well as the nucleation and growth
mechanism in different atmospheres.
5.3. Hygroscopic behaviour of ambient aerosols
5.3.1. Spatial Variation
Urban environments
The growth factors of urban particles in most previous studies have been classified in three
groups: near-hydrophobic, less-hygroscopic and more-hygroscopic (Swietlicki et al., 2008).
The dominant hydrophobic and less-hygroscopic particles in the urban environments could be
explained by the sources of particles at these sites, where traffic-related emissions were found
as to be main source of urban ultrafine particles (Morawska et al., 2008). Near-hydrophobic
particles can be assumed to originate from fresh traffic emissions that contain black carbon,
while less-hygroscopic particles may have originated from transformed oil combustion
particles (Swietlicki et al., 2008). In addition, other combustion processes such as wood
combustion in some cases contribute significantly to the number fraction of near-hydrophobic
and less-hygroscopic particles (Baltensperger et al., 2002; Dusek et al., 2011).
99
Hygroscopic properties were measured at both urban background and kerbside sites in
previous studies. Ferron et al. (2005) reported that the growth factors of particles within a
certain size from different sampling sites do not vary significantly, but the
hydrophobic/hygroscopic particle fraction is strongly influenced by the type of site. At the
kerbside site, the number fraction of the nearly-hydrophobic group accounted for more than
80% of total particles with a size of 50 nm, while this number was 30-40% at the background
site. When particle size increases (>100 nm) the fraction of near-hydrophobic particles
decreases while the fractions of less hydrophobic and hygroscopic particles increases. For
example, nearly-hydrophobic particles measured at an urban background in Neuherberg,
Germany accounted for 42% of total particles with size of 50 nm while they only represented
25% of particles with a size of 200 nm (Tschiersch et al., 1997). This is consistent with the
decrease in traffic particles of larger sizes. Particle number size distributions of particles
emitted from vehicles show peaks at below 50 nm (Charron and Harrison, 2003).
Hygroscopic particles, which are known to come from regional background transportation,
were found to be dominant in the accumulation mode.
Rural environments
Aerosol particles in rural environments can derive from anthropogenic sources such as traffic
or industrial emissions by advection and from local emissions such as biomass burning, as
discussed below. They also originate from atmospheric processes such as nucleation. Since
rural sites may be exposed to aerosols from multiple sources, the observed Gf show a large
variation. Similar to urban environments, the growth factors in rural areas have been
classified into three groups: near-hydrophobic (Gf ~1.01-1.14), less-hygroscopic (Gf ~1.14-
1.32) and more-hygroscopic (1.34~1.63). The number fractions of the three classes show
differences between urban and rural areas. The less- and more-hygroscopic particles are
major contributors to the total number of particles. Swietlicki et al. (1999) reported that the
100
number fraction of more-hygroscopic particles accounted for 64% of total particle number
concentrations with a size of 35 nm, while this number increased to 81% of the total particle
number with a size of 265 nm. However, during biomass burning events, the contribution of
more-hygroscopic groups was limited and the number fraction of less-hygroscopic particles
was dominant (Rissler et al., 2006). The large fraction of organic compounds and black
carbon emitted from biomass burning were the reason for the abundance of less-hygroscopic
particles.
Marine environments
More-hygroscopic particles are ubiquitous in marine environments. Zhou et al. (2001)
reported that the frequency of occurrence of more-hygroscopic particles was above 81% and
when these were present it represented a number fraction larger than 0.93. A mixture of
ammonium sulphate and non-neutralized sulphate, which originate from oceanic biota, are
the main components of this group, leading to very high growth factors. For example, the
observed Gf of more-hygroscopic particles with a diameter of 50 nm in coastal environments
ranges from 1.40 to 1.9 at 90% RH (Zhou et al., 2001). These are much higher than the Gf in
rural (Gf ~1.32-1.61) and urban environments (Gf ~1.36-1.49).
The growth factors of marine aerosols are found to be even higher during days with high
wind speeds, when the marine aerosols include externally mixed sea salt particles. Wind at
high speeds brings freshly produced sea-salt particles with high volume fractions of sodium
chloride, with a large growth factor Gf >1.85, resulting in higher growth factors for marine
aerosols. However, the lifetime of externally mixed sea salt aerosols is short and limited by
ageing processes. During ageing periods, sodium chloride reacts with sulphuric acid or with
ammonium and sulphate compounds producing sodium sulphate, which has a lower growth
factor (Gf ~1.6). The number fraction of less-hygroscopic and near-hydrophobic particles was
101
often lower than 0.1 with the occurrence frequency around 20%. These particles could have
arrived from continental air masses or local emission from ships.
5.3.2. Temporal Variation
It is clear that the temporal pattern of the number fraction of hydrophobic/hygroscopic
particles depends strongly upon the pattern of local sources, as well as the meteorological
conditions such as temperature variation, precipitation or the origin of the air mass. Massling
et al. (2005) reported that the number fraction of nearly-hydrophobic particles measured in an
urban background area showed a distinct diurnal pattern, with peaks corresponding to daily
rush hours. Nearly-hydrophobic particles, which are found to be dominant during the daytime
in urban areas, can be attributed to soot and organic compounds emitted directly from
vehicles or the particles formed by nucleation in the dilution and cooling of fresh vehicular
emissions, leading to a lower averaged growth factor during the daytime. In contrast, another
study in a boreal forest by Hämeri et al. (2001) showed the opposite behaviour.
The growth factors of particles in nucleation and Aiken modes were found to be at their
highest during the early afternoon and lowest during the late evening and early morning. This
trend was consistent with other studies (Boy et al., 2004; Ehn et al., 2007; Fors et al., 2011;
Petäjä et al., 2007). Fors et al. (2011) suggested that an increase in the planetary boundary
layer depth which entrains more hygroscopic particles with height when the sun rises could
be an explanation for the increase in hygroscopic particles in boreal forests. Another reason
could be from the different atmospheric conditions between day and night (Ehn et al., 2007).
For example, the evaporation of semi-volatile organics with low hygroscopicity during the
daytime alters more hygroscopic particles (Fors et al., 2011). It could also be associated with
daytime oxidative processes which produce more functionalised organic compounds that
have higher hygrocopicity (Wong et al., 2011).
102
There are a few studies on long-term measurements of particle hygroscopicity. The growth
factors of each group seem to be stable, while fraction numbers exhibit a seasonal variation
(Ferron et al., 2005). A two-year study in southern Sweden reported that the number fraction
of less-hygroscopic particles was higher in winter (Fors et al., 2011). This trend concurs with
a recent study in Paris (Kamilli et al., 2014).
5.4. Effect of aerosol hygroscopic properties on calculation of lung deposition
5.4.1. Lung Deposition Calculation for Ambient Submicron Aerosols
The International Commission on Radiological Protection (ICRP) model and the Multiple
Path Particle Dosimetry model (MPPD) are those most widely used to estimate the regional
lung deposition of particles (Hussein et al., 2013). However, when these current mathematical
models are utilized to calculate the regional lung dose of ambient particles, the result may not
be accurate (Asgharian, 2004). Montoya et al. (2004) compared the total deposition fraction
of fine and ultrafine ambient aerosols measured in a group of six healthy adults and the
estimated total deposition fraction by the ICRP model. They reported that the ICRP model is
likely to predicts the total deposition fraction well for ambient particles smaller than 400 nm,
but underestimates the deposition of particles larger than 676 nm, which is in agreement with
other studies (e.g., Daigle et al. (2003), Londahl et al. (2009)). The main reason is that the
theoretical models do not account for particle growth due to the hygroscopic properties of
ambient particles when they penetrate into the respiratory system (Londahl et al., 2009;
Montoya et al., 2004).
The aim of this section is to investigate and compare the effects of the hygroscopicity of
particles from different ambient environments on their lung deposition fraction using a
modified ICRP model for hygroscopic particles. This chapter uses 13 published data sets
from previous studies for hygroscopic growth factors and their number fraction in rural,
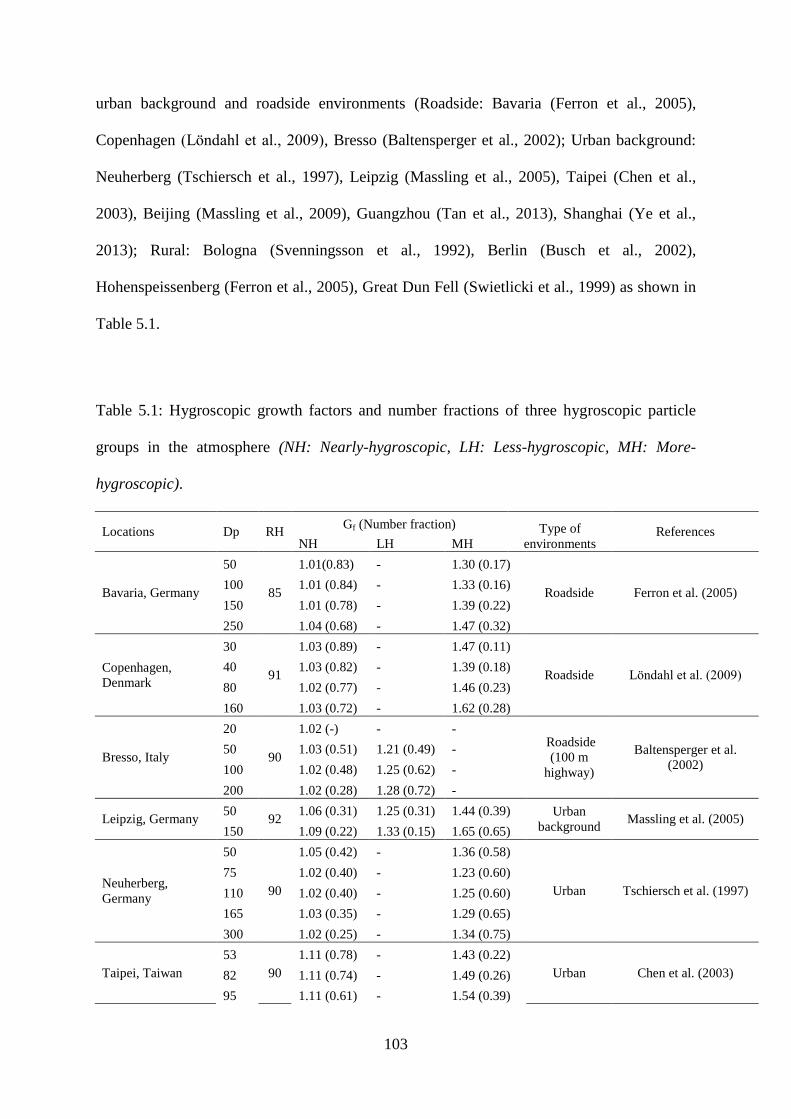
103
urban background and roadside environments (Roadside: Bavaria (Ferron et al., 2005),
Copenhagen (Londahl et al., 2009), Bresso (Baltensperger et al., 2002); Urban background:
Neuherberg (Tschiersch et al., 1997), Leipzig (Massling et al., 2005), Taipei (Chen et al.,
2003), Beijing (Massling et al., 2009), Guangzhou (Tan et al., 2013), Shanghai (Ye et al.,
2013); Rural: Bologna (Svenningsson et al., 1992), Berlin (Busch et al., 2002),
Hohenspeissenberg (Ferron et al., 2005), Great Dun Fell (Swietlicki et al., 1999) as shown in
Table 5.1.
Table 5.1: Hygroscopic growth factors and number fractions of three hygroscopic particle
groups in the atmosphere (NH: Nearly-hygroscopic, LH: Less-hygroscopic, MH: More-
hygroscopic).
Locations Dp RH Gf (Number fraction) Type of
environments References
NH LH MH
Bavaria, Germany
50
85
1.01(0.83) - 1.30 (0.17)
Roadside Ferron et al. (2005) 100 1.01 (0.84) - 1.33 (0.16)
150 1.01 (0.78) - 1.39 (0.22)
250 1.04 (0.68) - 1.47 (0.32)
Copenhagen,
Denmark
30
91
1.03 (0.89) - 1.47 (0.11)
Roadside Londahl et al. (2009) 40 1.03 (0.82) - 1.39 (0.18)
80 1.02 (0.77) - 1.46 (0.23)
160 1.03 (0.72) - 1.62 (0.28)
Bresso, Italy
20
90
1.02 (-) - - Roadside
(100 m
highway)
Baltensperger et al.
(2002)
50 1.03 (0.51) 1.21 (0.49) -
100 1.02 (0.48) 1.25 (0.62) -
200 1.02 (0.28) 1.28 (0.72) -
Leipzig, Germany 50
92 1.06 (0.31) 1.25 (0.31) 1.44 (0.39) Urban
background Massling et al. (2005)
150 1.09 (0.22) 1.33 (0.15) 1.65 (0.65)
Neuherberg,
Germany
50
90
1.05 (0.42) - 1.36 (0.58)
Urban Tschiersch et al. (1997)
75 1.02 (0.40) - 1.23 (0.60)
110 1.02 (0.40) - 1.25 (0.60)
165 1.03 (0.35) - 1.29 (0.65)
300 1.02 (0.25) - 1.34 (0.75)
Taipei, Taiwan
53
90
1.11 (0.78) - 1.43 (0.22)
Urban Chen et al. (2003) 82 1.11 (0.74) - 1.49 (0.26)
95 1.11 (0.61) - 1.54 (0.39)
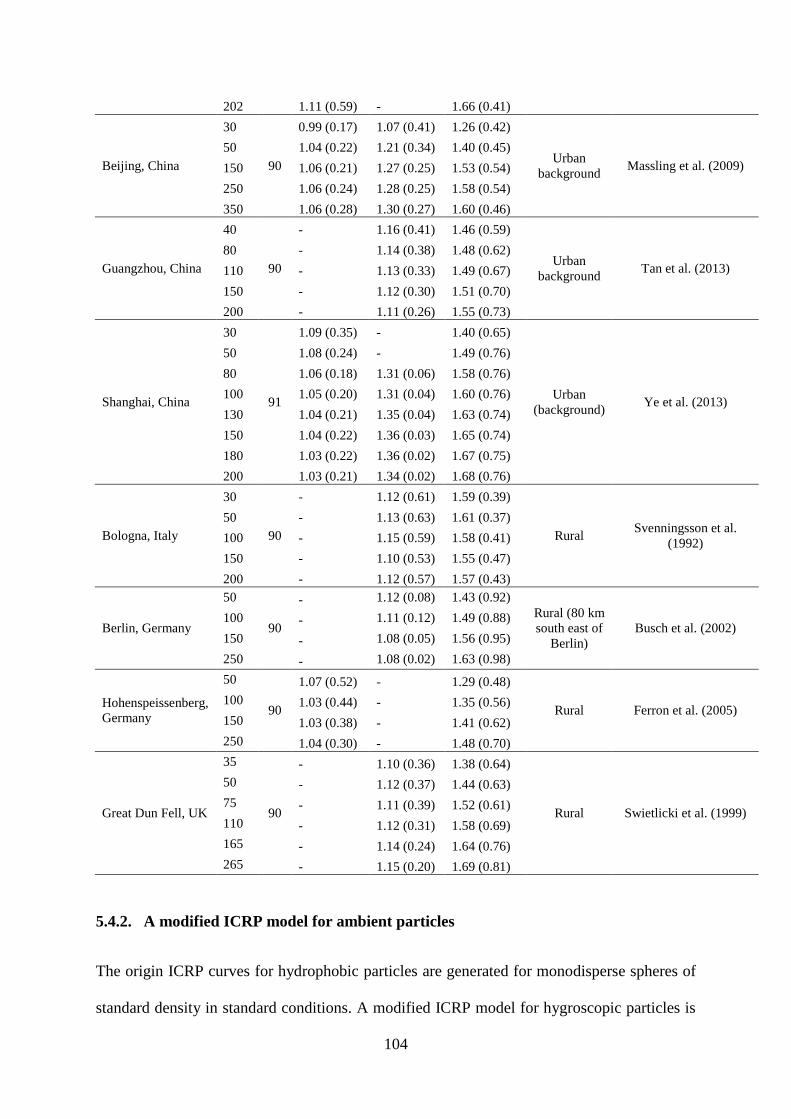
104
202 1.11 (0.59) - 1.66 (0.41)
Beijing, China
30
90
0.99 (0.17) 1.07 (0.41) 1.26 (0.42)
Urban
background Massling et al. (2009)
50 1.04 (0.22) 1.21 (0.34) 1.40 (0.45)
150 1.06 (0.21) 1.27 (0.25) 1.53 (0.54)
250 1.06 (0.24) 1.28 (0.25) 1.58 (0.54)
350 1.06 (0.28) 1.30 (0.27) 1.60 (0.46)
Guangzhou, China
40
90
- 1.16 (0.41) 1.46 (0.59)
Urban
background Tan et al. (2013)
80 - 1.14 (0.38) 1.48 (0.62)
110 - 1.13 (0.33) 1.49 (0.67)
150 - 1.12 (0.30) 1.51 (0.70)
200 - 1.11 (0.26) 1.55 (0.73)
Shanghai, China
30
91
1.09 (0.35) - 1.40 (0.65)
Urban
(background) Ye et al. (2013)
50 1.08 (0.24) - 1.49 (0.76)
80 1.06 (0.18) 1.31 (0.06) 1.58 (0.76)
100 1.05 (0.20) 1.31 (0.04) 1.60 (0.76)
130 1.04 (0.21) 1.35 (0.04) 1.63 (0.74)
150 1.04 (0.22) 1.36 (0.03) 1.65 (0.74)
180 1.03 (0.22) 1.36 (0.02) 1.67 (0.75)
200 1.03 (0.21) 1.34 (0.02) 1.68 (0.76)
Bologna, Italy
30
90
- 1.12 (0.61) 1.59 (0.39)
Rural Svenningsson et al.
(1992)
50 - 1.13 (0.63) 1.61 (0.37)
100 - 1.15 (0.59) 1.58 (0.41)
150 - 1.10 (0.53) 1.55 (0.47)
200 - 1.12 (0.57) 1.57 (0.43)
Berlin, Germany
50
90
- 1.12 (0.08) 1.43 (0.92)
Rural (80 km
south east of
Berlin)
Busch et al. (2002) 100 - 1.11 (0.12) 1.49 (0.88)
150 - 1.08 (0.05) 1.56 (0.95)
250 - 1.08 (0.02) 1.63 (0.98)
Hohenspeissenberg,
Germany
50
90
1.07 (0.52) - 1.29 (0.48)
Rural Ferron et al. (2005) 100 1.03 (0.44) - 1.35 (0.56)
150 1.03 (0.38) - 1.41 (0.62)
250 1.04 (0.30) - 1.48 (0.70)
Great Dun Fell, UK
35
90
- 1.10 (0.36) 1.38 (0.64)
Rural Swietlicki et al. (1999)
50 - 1.12 (0.37) 1.44 (0.63)
75 - 1.11 (0.39) 1.52 (0.61)
110 - 1.12 (0.31) 1.58 (0.69)
165 - 1.14 (0.24) 1.64 (0.76)
265 - 1.15 (0.20) 1.69 (0.81)
5.4.2. A modified ICRP model for ambient particles
The origin ICRP curves for hydrophobic particles are generated for monodisperse spheres of
standard density in standard conditions. A modified ICRP model for hygroscopic particles is
105
based on the previous work of Londahl et al. (2009), Kristensson et al. (2013) and Hussein et
al. (2013). Ambient particles are divided into three groups: near-hydrophobic, less-
hygroscopic and more-hygroscopic. Subsequently, the ICRP model is applied separately for
each type of particles, with a consideration of their growth when they penetrate into the
respiratory tract. The final deposition fraction, which is defined as the fraction of particle can
deposit in the lung in each environment was calculated by the mean value of deposition
fraction for these three groups weighted by their number fractions for each group as shown in
equation (2) and assuming a relative humidity equilibrium in the airways of 99.5%.It is
assumed that the submicron particles which have increased to their equilibrium size by their
growth in the respiratory tract have the same behaviour as insoluble particles with a similar
size in the respiratory system (Asgharian, 2004). For example, hygroscopic particles with an
initial size of 50 nm and a Gf value of 2 (at 99.5% RH) are assumed to have an equivalent
deposition fraction to hydrophobic particles (Gf = 1) with a diameter of 100 nm (Londahl et
al., 2009). However, when a particle penetrates into the lung, its growth is not only controlled
by its hygroscopic properties but also due to its residence time.
The submicron particles can growth rapidly while larger particles may not reach their
equilibrium size during the inhalation cycle. Hence, the above assumption by Londahl et al.
(2009) is limited to small particles which can grow and reach their equilibrium size rapidly.
Ferron (1977) found that particles smaller than 0.2 µm can reach their equilibrium size within
0.1 sec in the human respiratory tract. To correct the size growth for particles larger 0.2 µm
when they penetrate into the regional lung due to their residence time, our study used an
approach which described the correlation between particle growth and residence time,
provided by Ferron (1977). Particle growth can be approximated by the following equation
(Ferron, 1977; ICRP, 1994):

106
𝐹(𝑡) = 𝐷𝑝 (𝑡)−𝐷𝑝(0)
𝐷𝑝(𝑒)−𝐷𝑝(0)=
𝐷𝑝(0)∗[exp(−10𝑡0.55
𝐷𝑝(0))
0.6
−1]
𝐷𝑝(𝑒)−𝐷𝑝(0) (5.2)
where, F(t) is the fraction of equilibrium size, Dp (t) is the particle size in aerodynamic
diameter at t (s); Dp (0) is the initial dry particle (µm), Dp (e): Equilibrium particle size (µm),
and t is the residence time is the lung (s). In our estimation, atmospheric particles are
assumed to be spherical particles with unity density, therefore Dp is considered to be equal to
the particle volume equivalent (thermodynamic) diameter.
The variation in the hygroscopic growth fraction as a function of time calculated from
different initial sizes of dry particles is shown in Figure 5.1.
Figure 5.1: Variation in hygroscopic growth as a function of time and size.
To estimate the growth factor in each lung region, we assumed the residence time of particles
in the ET, TB, AL regions to be 0.116, 0.308, 1.32 s during inspiration and 1.56, 0.356 and
107
1.56 during expiration, with a pause time of 0.2 s (Ferron, 1977). The particle growth factor
is each region will be calculated by:
𝐴𝑣𝑒𝑟𝑎𝑔𝑒𝑑 𝐺𝑓 𝑖𝑛 𝑒𝑎𝑐ℎ 𝑙𝑢𝑛𝑔 𝑟𝑒𝑔𝑖𝑜𝑛 =∫ 𝐺𝑓′(𝑡)∗𝑑𝑡
𝑡2𝑡1
𝑡2−𝑡1 (5.3)
where, t1 and t2 are the time when particle come in and out of the regional lung; for example,
t1=0 and t2 =0.116s for particles coming in and out of the ET region during inspiration.
If we define 𝐺′𝑓(𝑡) as the growth factor of particle at t (s) (𝐺′𝑓(𝑡) =𝐷𝑝(𝑡)
𝐷𝑝(0)), and 𝐺𝑓(𝑚𝑎𝑥) as the
maximum growth factor of particles (when particles can reach their equilibrium size)
((𝐺𝑓(𝑚𝑎𝑥) =𝐷𝑝(𝑒)
𝐷𝑝(0)), from the equation (5.3) we have:
𝐺′𝑓(𝑡)= 𝐺𝑓(𝑚𝑎𝑥) + F(t)*(𝐺𝑓(𝑚𝑎𝑥) − 1) (5.4)
In the distal airways, the lumen air is likely to have reached equilibrium. However, in the
proximal airways and the extra-thoracic region of the respiratory tract, the relative humidity
in the airways may depart substantially from 99.5% equilibrium due to interactions between
the ambient air temperature and humidity and the temperature and water activity of the mucus
layer. Morrow (1986) showed that supersaturations as large as 130% could occur in the
trachea under certain ambient temperature and humidity conditions. Calculations presented in
this paper have been made considering a relative humidity of 99.5% and a temperature of 37
oC consistent throughout the respiratory tract.
DFambient= . DFnearly-hydrophobic + .DFless-hygroscopic + .DFmore-hygroscopic (5.5)
where, DFambient, DFnear-hydrophobic, DFless-hygroscopic, DFmore-hygroscopic are deposition fractions of
ambient particles, nearly-hydrophobic particles, less-hygroscopic particles and more-
hygroscopic particles, respectively. are the number fraction of nearly-hydrophobic,
less-hygroscopic and more-hygroscopic particles (= 1).
108
Calculation of the hygroscopic growth factor of particles at 99.5% RH.
Almost all published data for the growth factor of ambient particles were measured at around
90% RH (Swietlicki et al., 2008), whilst the RH in the respiratory tract is approximately
99.5% (Hussein et al., 2013). To estimate the growth factor of particles at the relative
humidity found in the lungs (99.5%), we used Rissler’s model (Kristensson et al., 2013;
Rissler et al., 2006) which was introduced in previous studies by Swietlicki et al. (1999),
Londahl et al. (2009) and Kristensson et al. (2013).
Gf = √1 + 𝐾𝑅𝑀𝑤
𝜌𝑊(
𝑎𝑤
1−𝑎𝑤)
3 (5.6)
where, KR is a hygroscopic parameter which presents the effective number of moles of
soluble molecules or ions per dry particle volume unit; Mw, ρw are the molecular weight and
density of water; and aw is water activity.
According to the Kohler equation:
aw = 𝑅𝐻
100.𝐶𝑘 (5.7)
where, Ck is the Kelvin curvature correction factor:
Ck = exp(4𝑀𝑊𝜎𝑠
𝑅𝑇.𝜌𝑤𝐷𝑝) (5.8)
σs is the surface tension of the solution; R and T are the ideal gas constant and temperature
respectively, and Dp is the particle diameter.
From equation (5.6), we have:
𝐺𝑓3 = 1 + KR
𝑀𝑤
𝜌𝑤
𝑎𝑤
1−𝑎𝑤 (5.9)
Combined with the Kohler equation (5.7), equation (5.9) will be:
𝐺𝑓3 = 1 + KR
𝑀𝑤
𝜌𝑤
𝑅𝐻
100𝐶𝑘−𝑅𝐻
109
KR = (𝐺𝑓
3−1)𝜌𝑤(100𝐶𝑘−𝑅𝐻)
𝑀𝑤𝑅𝐻 (5.10)
The HTDMA typically measures the Gf at relative humidity a%, which is lower than 99.5 %
(normally the relative humidity inside the second DMA of a HTDMA system is around 80-
90%). From equation 5.10, we can calculate the hygroscopic parameter at known relative
humidity a% measured by HTDMA.
KR-a% = (𝐺𝑓−𝑎%
3 −1)𝜌𝑤(100𝐶𝑘−𝑎%−𝑎)
𝑀𝑤𝑎 (5.11)
KR-a%: Hygroscopic parameter at relative humidity a %
Ck-a%: Kelvin curvature correction factor at relative humidity a %
From equation (5.8), we have:
Ck-a% = 𝑒4𝑀𝑤𝜎𝑠
𝑅𝑇𝜌𝑤𝐷𝑝−𝑎% (5.12)
Dp-a% : Particle diameter at relative humidity a %, therefore Dp-a% = Dp.Gf-a , in which Dp:
Dry particle diameter and Gf-a: growth factor at relative a %.
Similarly, the hygroscopic parameter at relative humidity 99.5% is
KR-99.5% = (𝐺𝑓−99.5%
3 −1)𝜌𝑤(100𝐶𝑘−99.5%−99.5)
𝑀𝑤.99.5 (5.13)
In Rissler’s model, the hygroscopic parameter is assumed as a constant parameter over the
relative humidity change, therefore KR is the same value for a % and 99.5%. From equation
(5.11) and (5.13), we have:
(𝐺𝑓−99.5%3 −1)𝜌𝑤(100𝐶𝑘−99.5%−99.5)
𝑀𝑤.99.5 =
(𝐺𝑓−𝑎%3 −1)𝜌𝑤(100𝐶𝑘−𝑎%−𝑎)
𝑀𝑤𝑎 (5.14)
The Gf at 99.5% RH is estimated from the following equation:
110
𝐺𝑓−99.5%3 = 1 +
(𝐺𝑓−𝑎%3 −1).99.5.(100𝐶𝑘−𝑎%−𝑎)
𝑎 (100𝐶𝑘−99.5%−99.5)
Gf-99.5% = √1 + (𝐺𝑓−𝑎3 − 1).
99.5
𝑎.
(100𝑒2.09
𝐷𝑝.𝐺𝑓−𝑎−𝑎)
(100𝑒2.09
𝐷𝑝.𝐺𝑓−99.5−99.5)
3
(5.15)
where, Gf-99.5% is the growth factor at 99.5% RH, Gf-RH is the growth factor at a% RH and Dp
is the particle diameter measured at low RH (<10%).
This model assumes that the number of soluble molecules is constant over the relative
humidity and the droplet solution is ideal (Rissler et al., 2010), therefore KR is assumed to be
a constant value as relative humidity changes from a% to 99.5%. The value of 2.09 was
calculated assuming a surface tension of 0.072 J m-2
. (M water=18 g mol-1
; R: 8.314 J mol-1
K-
1; T=298 K) according to Petters and Kreidenweis (2007).
Different surface tensions could cause some bias for growth factors calculation at 99.5%.
Most particles in the atmosphere are composed of a substantial amount of organic material,
which is functionalized from atmospheric processing and is likely to act as a surfactant and
substantially decrease the particle surface tension. However, the error associated with
different surface tensions can be acceptable, as proved by a comparison between different
models by Rissler et al. (2010).
The H-TDMA system has been used to determine hygroscopic growth factors and their
number fractions for particles with selected diameters, typically from 30 nm to 350 nm. To
estimate the hygroscopic growth factors and number fractions for a full size range (10-1000
nm), it is assumed that the hygroscopic parameter Kr and number fraction of particles at a
diameter of 30 nm, is suitable for those smaller than 30 nm, while those of particles with a
diameter of 350 nm are suitable for those larger than 350 nm (Hussein et al., 2013). Growth
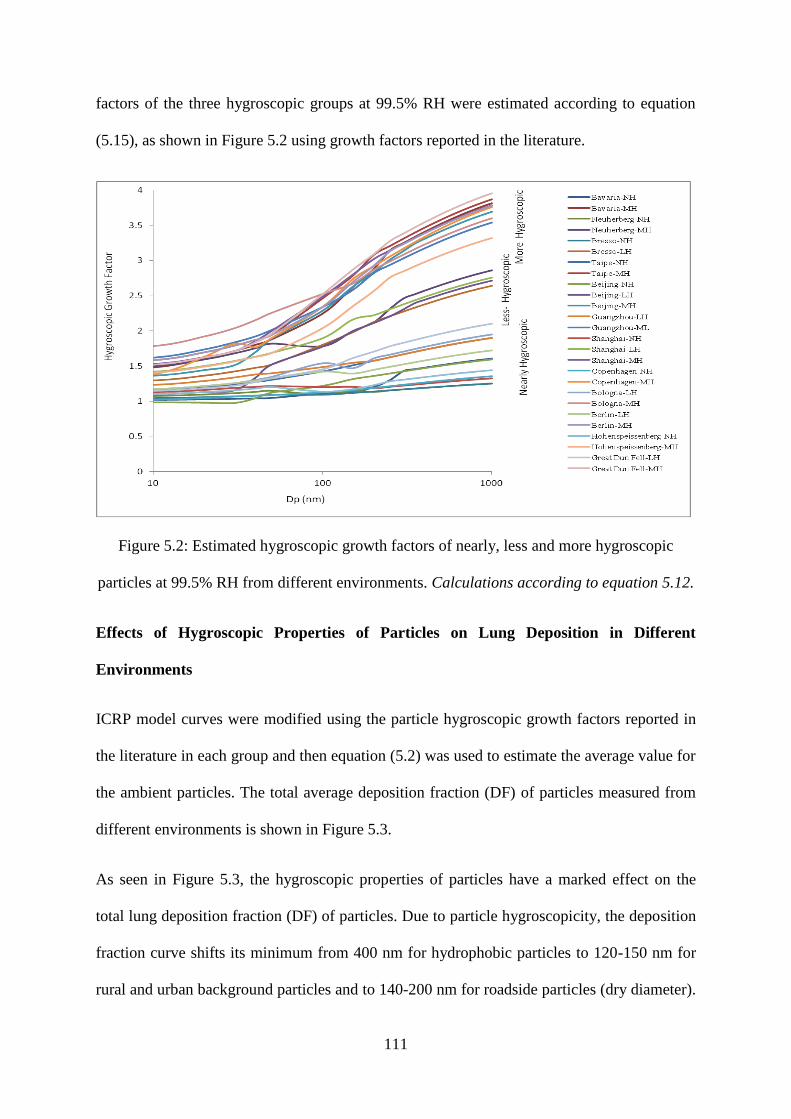
111
factors of the three hygroscopic groups at 99.5% RH were estimated according to equation
(5.15), as shown in Figure 5.2 using growth factors reported in the literature.
Figure 5.2: Estimated hygroscopic growth factors of nearly, less and more hygroscopic
particles at 99.5% RH from different environments. Calculations according to equation 5.12.
Effects of Hygroscopic Properties of Particles on Lung Deposition in Different
Environments
ICRP model curves were modified using the particle hygroscopic growth factors reported in
the literature in each group and then equation (5.2) was used to estimate the average value for
the ambient particles. The total average deposition fraction (DF) of particles measured from
different environments is shown in Figure 5.3.
As seen in Figure 5.3, the hygroscopic properties of particles have a marked effect on the
total lung deposition fraction (DF) of particles. Due to particle hygroscopicity, the deposition
fraction curve shifts its minimum from 400 nm for hydrophobic particles to 120-150 nm for
rural and urban background particles and to 140-200 nm for roadside particles (dry diameter).
112
This is consistent with the experimental and modelled deposition of airborne particles at a
kerbside site conducted by Londahl et al. (2009) who report that in kerbside areas, the lung
deposition fraction has a minimum value of around 200 nm. The shifts in deposition curves to
the left or right could be explained by the decrease in Brownian diffusion and the increase in
sedimentation and impaction (ICRP, 1994).
In roadside environments, the ICRP model seems to predict well the deposition fraction of
particles smaller than 200 nm. This could be explained by the fact that small particles at
traffic sites are freshly emitted from traffic exhaust, and therefore mostly comprise
hydrophobic particles.
At rural and urban background sites, the ICRP model seems to overestimate the lung
deposition fraction for particles smaller than 150 nm. For example, the deposition fraction of
hydrophobic particles with a diameter of 100 nm is found to be 40% higher than those of
particles with the same diameter size at rural sites. In contrast, the ICRP model seems to
underestimate the total deposition fraction for particles larger than 200 nm.
The DF values for ambient particles with a diameter of 1µm are more than two times higher
than those predicted by the ICRP model (Figure 5.3). This means that there is a huge error if
the ICRP model is used to predict the lung deposition fraction of ambient particles larger than
200 nm without considering their growth factors. The error of not including the
hygroscopicity factor of particles in the lung deposition calculation is of similar magnitude to
the individual variability in the deposition fraction for particles in the low deposition fraction
range associated with factors such as different lung geometries, breathing patterns, or lung
disease.
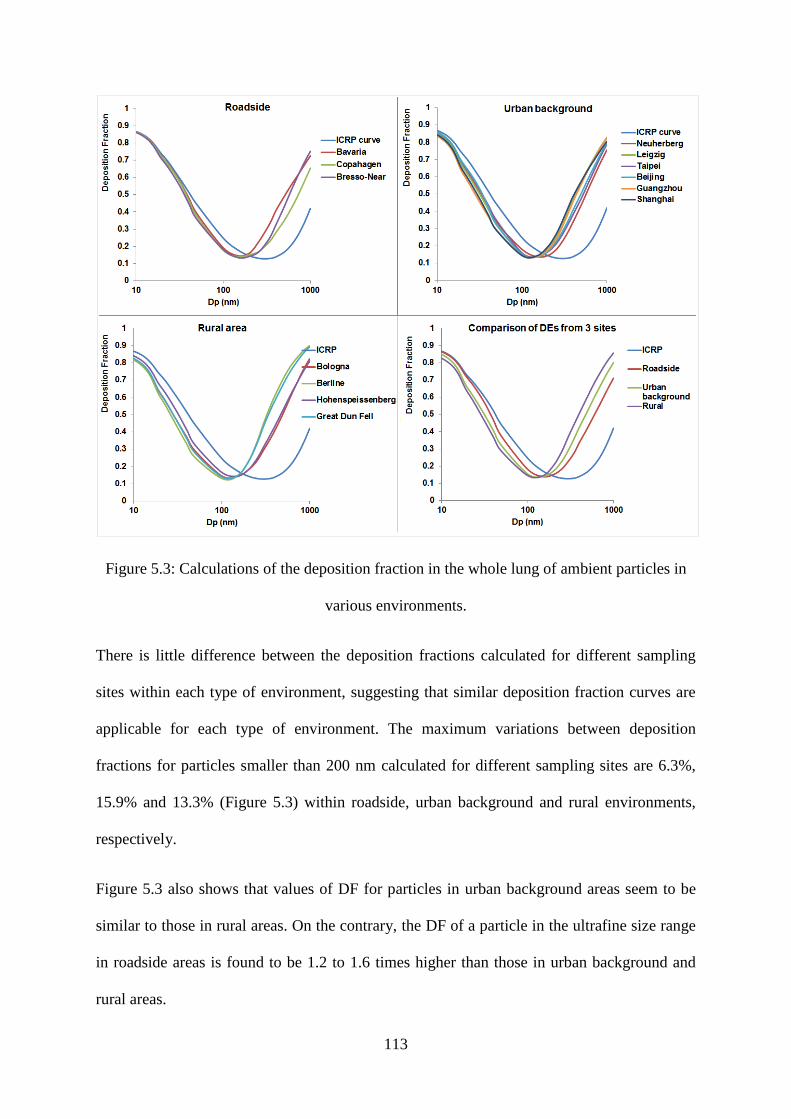
113
Figure 5.3: Calculations of the deposition fraction in the whole lung of ambient particles in
various environments.
There is little difference between the deposition fractions calculated for different sampling
sites within each type of environment, suggesting that similar deposition fraction curves are
applicable for each type of environment. The maximum variations between deposition
fractions for particles smaller than 200 nm calculated for different sampling sites are 6.3%,
15.9% and 13.3% (Figure 5.3) within roadside, urban background and rural environments,
respectively.
Figure 5.3 also shows that values of DF for particles in urban background areas seem to be
similar to those in rural areas. On the contrary, the DF of a particle in the ultrafine size range
in roadside areas is found to be 1.2 to 1.6 times higher than those in urban background and
rural areas.
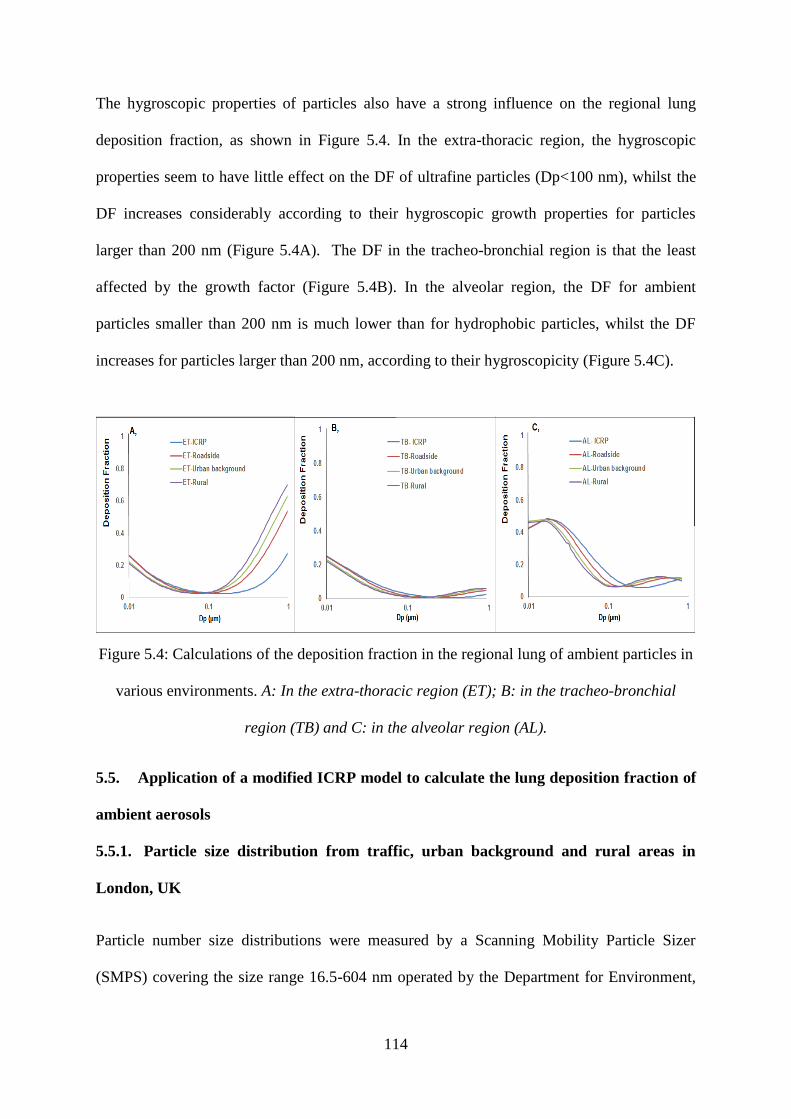
114
The hygroscopic properties of particles also have a strong influence on the regional lung
deposition fraction, as shown in Figure 5.4. In the extra-thoracic region, the hygroscopic
properties seem to have little effect on the DF of ultrafine particles (Dp<100 nm), whilst the
DF increases considerably according to their hygroscopic growth properties for particles
larger than 200 nm (Figure 5.4A). The DF in the tracheo-bronchial region is that the least
affected by the growth factor (Figure 5.4B). In the alveolar region, the DF for ambient
particles smaller than 200 nm is much lower than for hydrophobic particles, whilst the DF
increases for particles larger than 200 nm, according to their hygroscopicity (Figure 5.4C).
Figure 5.4: Calculations of the deposition fraction in the regional lung of ambient particles in
various environments. A: In the extra-thoracic region (ET); B: in the tracheo-bronchial
region (TB) and C: in the alveolar region (AL).
5.5. Application of a modified ICRP model to calculate the lung deposition fraction of
ambient aerosols
5.5.1. Particle size distribution from traffic, urban background and rural areas in
London, UK
Particle number size distributions were measured by a Scanning Mobility Particle Sizer
(SMPS) covering the size range 16.5-604 nm operated by the Department for Environment,
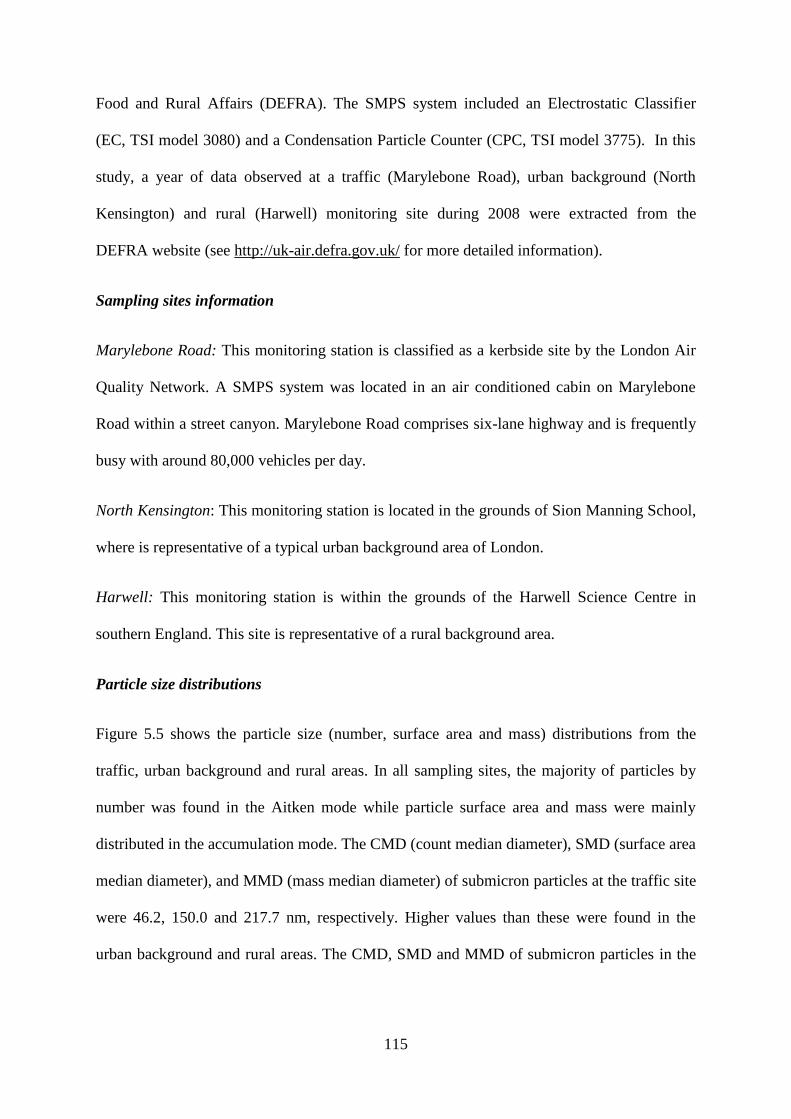
115
Food and Rural Affairs (DEFRA). The SMPS system included an Electrostatic Classifier
(EC, TSI model 3080) and a Condensation Particle Counter (CPC, TSI model 3775). In this
study, a year of data observed at a traffic (Marylebone Road), urban background (North
Kensington) and rural (Harwell) monitoring site during 2008 were extracted from the
DEFRA website (see http://uk-air.defra.gov.uk/ for more detailed information).
Sampling sites information
Marylebone Road: This monitoring station is classified as a kerbside site by the London Air
Quality Network. A SMPS system was located in an air conditioned cabin on Marylebone
Road within a street canyon. Marylebone Road comprises six-lane highway and is frequently
busy with around 80,000 vehicles per day.
North Kensington: This monitoring station is located in the grounds of Sion Manning School,
where is representative of a typical urban background area of London.
Harwell: This monitoring station is within the grounds of the Harwell Science Centre in
southern England. This site is representative of a rural background area.
Particle size distributions
Figure 5.5 shows the particle size (number, surface area and mass) distributions from the
traffic, urban background and rural areas. In all sampling sites, the majority of particles by
number was found in the Aitken mode while particle surface area and mass were mainly
distributed in the accumulation mode. The CMD (count median diameter), SMD (surface area
median diameter), and MMD (mass median diameter) of submicron particles at the traffic site
were 46.2, 150.0 and 217.7 nm, respectively. Higher values than these were found in the
urban background and rural areas. The CMD, SMD and MMD of submicron particles in the
116
urban background area were 52.9, 157.7 and 237.0 nm while the values of submicron
particles in the rural area were 56.9, 176.1 and 255.0 nm.
Figure 5.5: Size distribution by number, surface area and mass of submicron particle at traffic
(Marylebone Road), urban background (North Kensington) and rural (Harwell) sampling
sites. Assuming particles are spheres and effective density is 1 g cm-3
.
5.5.2. Deposition fraction of particles in traffic, urban background and rural areas
The deposition fractions of particles in traffic, urban background and rural areas were
calculated by the application of an original ICRP curve for hydrophobic particles and a
modified ICRP curve for hygroscopic particles. Figure 5.6 shows a comparison of the
deposition fraction of particles calculated by original and modified ICRP curves. The total
DF for submicron particles by number, surface area and mass was 0.49, 0.20 and 0.15 at the
traffic site while it was 0.44, 0.19 and 0.15 at the urban background site and 0.42, 0.17 and
0.14 at the rural site using original ICRP curves for hydrophobic particles. Based on the
modified ICRP curves for ambient particles, the DF by number decreased whereas those by
surface area and mass increased. The total DF for submicron particles by number, surface
area and mass calculated by a modified ICRP model was 0.44, 0.23 and 0.22 at the traffic site
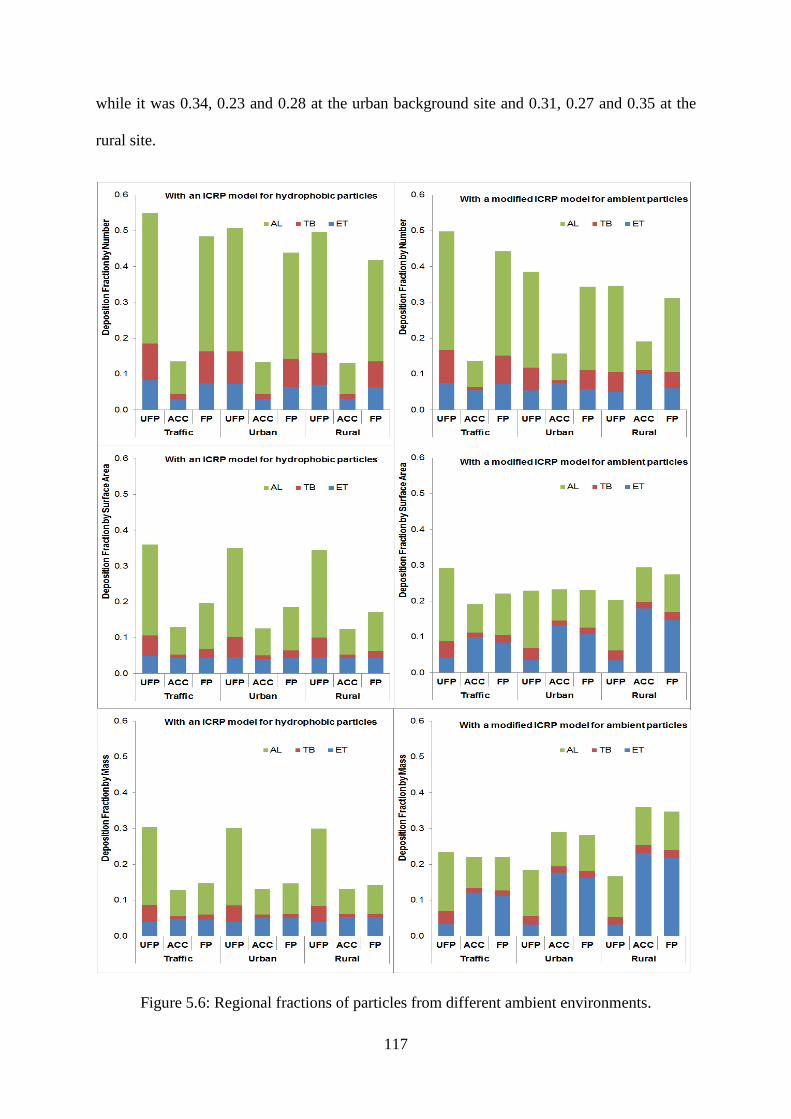
117
while it was 0.34, 0.23 and 0.28 at the urban background site and 0.31, 0.27 and 0.35 at the
rural site.
Figure 5.6: Regional fractions of particles from different ambient environments.
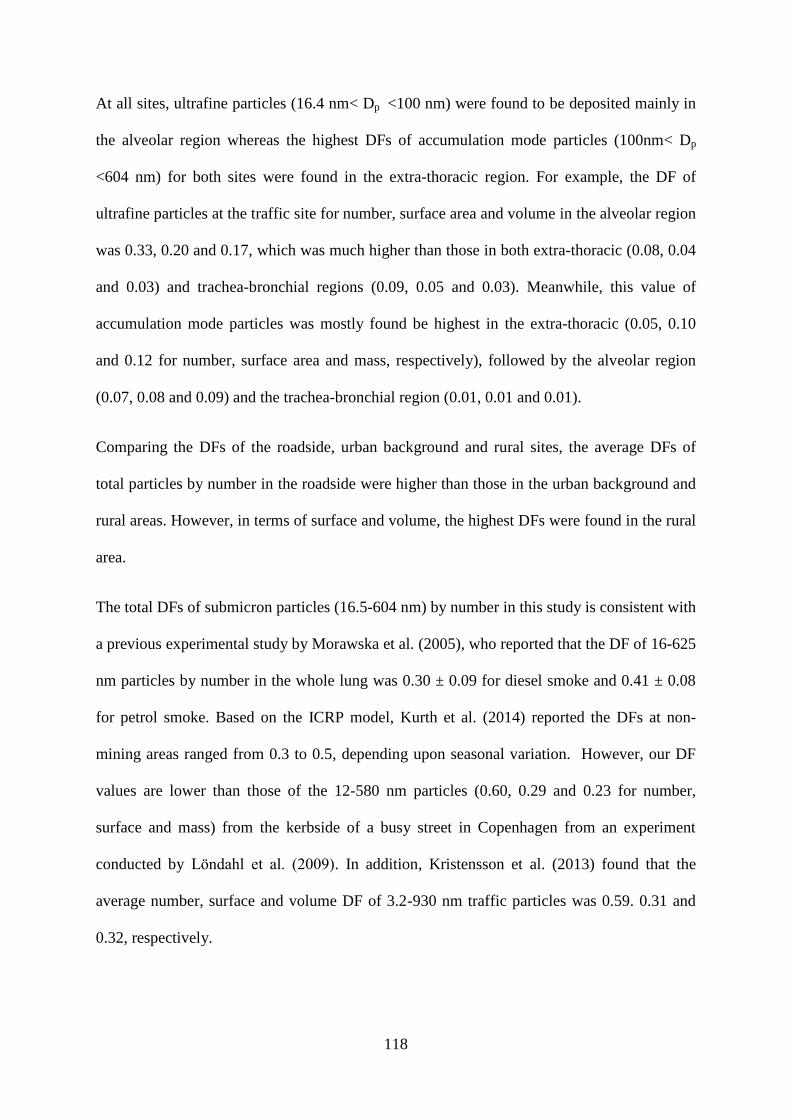
118
At all sites, ultrafine particles (16.4 nm< Dp <100 nm) were found to be deposited mainly in
the alveolar region whereas the highest DFs of accumulation mode particles (100nm< Dp
<604 nm) for both sites were found in the extra-thoracic region. For example, the DF of
ultrafine particles at the traffic site for number, surface area and volume in the alveolar region
was 0.33, 0.20 and 0.17, which was much higher than those in both extra-thoracic (0.08, 0.04
and 0.03) and trachea-bronchial regions (0.09, 0.05 and 0.03). Meanwhile, this value of
accumulation mode particles was mostly found be highest in the extra-thoracic (0.05, 0.10
and 0.12 for number, surface area and mass, respectively), followed by the alveolar region
(0.07, 0.08 and 0.09) and the trachea-bronchial region (0.01, 0.01 and 0.01).
Comparing the DFs of the roadside, urban background and rural sites, the average DFs of
total particles by number in the roadside were higher than those in the urban background and
rural areas. However, in terms of surface and volume, the highest DFs were found in the rural
area.
The total DFs of submicron particles (16.5-604 nm) by number in this study is consistent with
a previous experimental study by Morawska et al. (2005), who reported that the DF of 16-625
nm particles by number in the whole lung was 0.30 ± 0.09 for diesel smoke and 0.41 ± 0.08
for petrol smoke. Based on the ICRP model, Kurth et al. (2014) reported the DFs at non-
mining areas ranged from 0.3 to 0.5, depending upon seasonal variation. However, our DF
values are lower than those of the 12-580 nm particles (0.60, 0.29 and 0.23 for number,
surface and mass) from the kerbside of a busy street in Copenhagen from an experiment
conducted by Londahl et al. (2009). In addition, Kristensson et al. (2013) found that the
average number, surface and volume DF of 3.2-930 nm traffic particles was 0.59. 0.31 and
0.32, respectively.
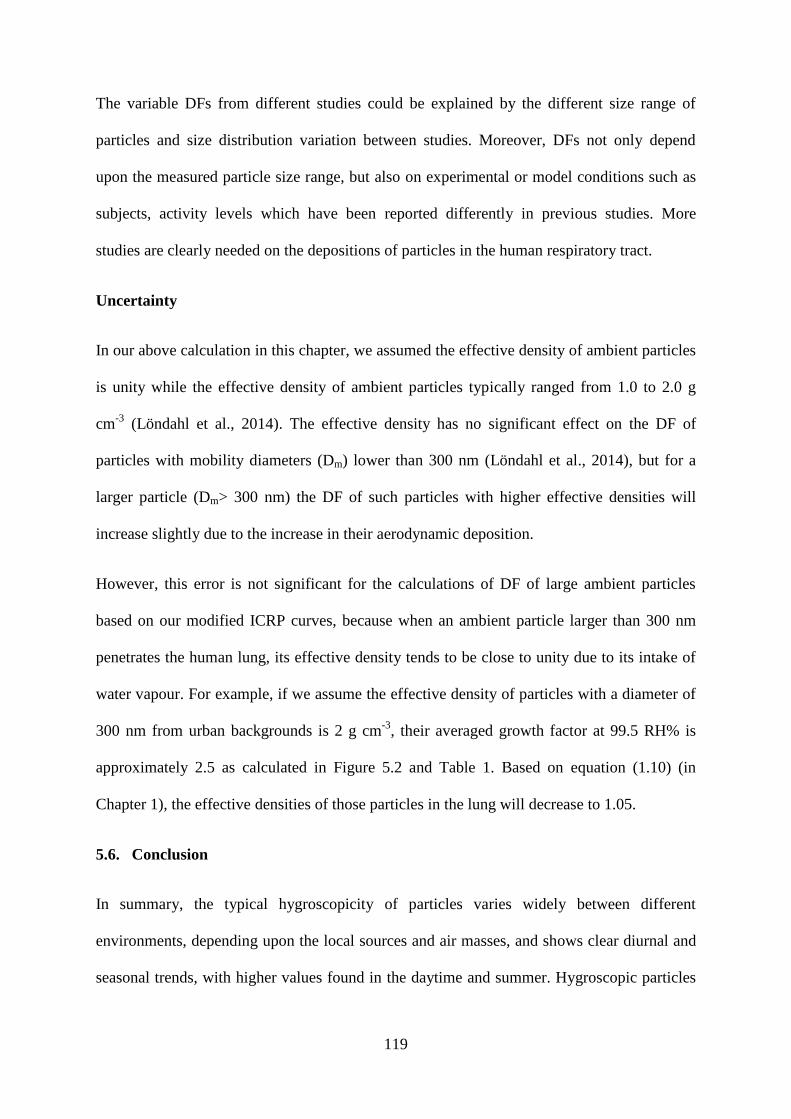
119
The variable DFs from different studies could be explained by the different size range of
particles and size distribution variation between studies. Moreover, DFs not only depend
upon the measured particle size range, but also on experimental or model conditions such as
subjects, activity levels which have been reported differently in previous studies. More
studies are clearly needed on the depositions of particles in the human respiratory tract.
Uncertainty
In our above calculation in this chapter, we assumed the effective density of ambient particles
is unity while the effective density of ambient particles typically ranged from 1.0 to 2.0 g
cm-3
(Löndahl et al., 2014). The effective density has no significant effect on the DF of
particles with mobility diameters (Dm) lower than 300 nm (Löndahl et al., 2014), but for a
larger particle (Dm> 300 nm) the DF of such particles with higher effective densities will
increase slightly due to the increase in their aerodynamic deposition.
However, this error is not significant for the calculations of DF of large ambient particles
based on our modified ICRP curves, because when an ambient particle larger than 300 nm
penetrates the human lung, its effective density tends to be close to unity due to its intake of
water vapour. For example, if we assume the effective density of particles with a diameter of
300 nm from urban backgrounds is 2 g cm-3
, their averaged growth factor at 99.5 RH% is
approximately 2.5 as calculated in Figure 5.2 and Table 1. Based on equation (1.10) (in
Chapter 1), the effective densities of those particles in the lung will decrease to 1.05.
5.6. Conclusion
In summary, the typical hygroscopicity of particles varies widely between different
environments, depending upon the local sources and air masses, and shows clear diurnal and
seasonal trends, with higher values found in the daytime and summer. Hygroscopic particles
120
emitted from different sources were investigated. Freshly emitted traffic particles and
biomass burning particles are hydrophobic or less-hygroscopic, whilst growth factors are
found to increase during ageing. Finally, the hygroscopic properties of particles have marked
effects, not only on total lung deposition but also on the regional lung deposition of particles,
causing a variation in DFs between sampling environments. For ultrafine particles (Dp <100
nm), the DF of these in kerbside areas was 1.2-1.6 times higher than those in urban
background and rural areas.
The ICRP model seems to predict well DF values for small ambient particles in the extra-
thoracic and tracheo-bronchial regions, but not the alveolar region, where they are
overestimated. However for larger particles (Dp >200 nm) the ICRP model underestimates the
DF values, with the extra-thoracic region the most affected of the three. As a consequence,
the DF values of ambient particles larger than 200 nm in the total lung were much higher than
the hydrophobic particles due to their hygroscopic growth, while total lung DF was lower
than predicted by the ICRP model for smaller particles in rural and urban background areas,
but not in roadside areas.
Based on the modified ICRP model, the deposition fractions of particles in traffic, urban
background and rural areas were calculated. The average number DFs of particles in the
roadside site were higher than those in the urban background and rural areas, whereas in
terms of surface and volume the highest DFs were in the rural area. The DF values not only
depend upon the particle size, but also on its hygroscopic properties.
121
Chapter 6: SOURCE APPORTIONMENT OF THE LUNG DOSE OF
AMBIENT SUBMICROMETRE PARTICULATE MATTER
This chapter aims to apportion the sources of submicron particles measured at an urban
background area in London and identify which source is most responsible for particles
deposited in the human lung. Particle number size distributions (PNSD) measured by a
Scanning Mobility Particle Sizer (TSI, USA), covering the size range of 16.5-604 nm at the
London North Kensington background sampling site during 2012 were used in a Positive
Matrix Factorization (PMF) model to apportion to six dominant sources of particles. These
included local traffic emissions (26.6% by number), aged traffic emissions (29.9%), urban
accumulation mode (28.3%), nucleation (6.5 %), inorganic secondary aerosols (1.7%) and
mixed secondary aerosols (6.9%). Based on the ICRP model, the total deposition fractions of
submicron particles for the aforementioned sources in the human respiratory tract were 0.57,
0.41, 0.24, 0.62, 0.24 and 0.24, respectively. In terms of source apportionment of particles
deposited in the lung, traffic emissions represent the main source of particles deposited by
number in both the regional and total lung, accounting for 59 to 71% of total deposited
particles, followed by regional accumulation mode (17%) and nucleation (10%) particles.
Secondary aerosols only account for 5.1 % of the total deposited particles by number, but
they represent the main source of particles deposited in the lung expressed as surface area
(44.6%) and volume (72.3%) of total deposition.
This chapter contains some sections of verbatim text adapted from Vu et al. (2016) published
as part of this PhD. The author’s contribution: writing, contribution of ideas and numerical
calculations.
122
6.1. Introduction
Particles in urban ambient air are released from various anthropogenic activities, such as the
combustion of fuels and from natural sources such as atmospheric nucleation (Ogulei et al.,
2007). Exposure to ambient aerosols is consistently associated in numerous scientific studies
with adverse health effects (Pope and Dockery, 2006). Very small particles such as ultrafine
particles (Dp <100 nm) are able to penetrate deep into the respiratory tract (e.g. reaching the
pulmonary epithelium), causing serious health problems such as respiratory morbidity and
mortality (Donaldson et al., 1998). Moreover, different types of sources generate particles
with different size distributions, chemical compositions and concentration characteristics
(Lighty et al., 2000). This results in particles from different sources behaving differently
during the process of inhalation, showing different penetration through the respiratory tract
and depositing with different fractions in different regions of the lungs. For example, Londahl
et al. (2009) estimated the total lung deposition fraction of particles by number emitted from
traffic exhaust was 0.68, which was three times higher than those of particles released from
biomass burning (0.22). Therefore a detailed identification of the most relevant sources of
atmospheric particles and the association between a particle source and lung deposition could
play a vital role not only for risk assessment of air pollution in epidemiological studies, but
also for policymakers to introduce optimal legislation for air quality control.
In order to identify and apportion the most relevant sources of ambient particles, applying
Positive Matrix Factorization (PMF) to particle number size distributions (PNSD) has
become a widely used tool in recent years (Viana et al., 2008). PMF considers each size bin
in the PNSD dataset as an input variable. Additional variables such as ion species, heavy
metals, gaseous pollutants, meteorological parameters and traffic data can be very valuable to
separate and identify the sources of particles as demonstrated in previous studies (Harrison et
al., 2011; Ogulei et al., 2006b; Thimmaiah et al., 2009).
123
The advantage of this method is that it can identify specific sources of very small particles,
such as nucleation. It can also separate sources of particles such as brake- and tyre-wear,
which are generally difficult to separate using PMF on particle composition data only. In
addition to source identification and apportionment of concentrations measured in ambient
air, and considering the different deposition fractions of particles generated from different
sources, there is still the need for evaluation of which sources are most responsible for
particles deposited in the human respiratory tract.
This study aims to estimate the lung deposition of particles generated from specific sources
contributing to particle size distribution in North Kensington, an urban background area of
London, United Kingdom. In order to do so, we first apportioned the sources of submicron
particles in the area using PMF. Subsequently, we estimated the lung deposition fraction of
particles generated from each specific source by applying the ICRP model on the PMF factor
profiles. Finally, we investigated which source may be most relevant to health outcomes by
comparing the results of the source apportionment of particle deposited in the human
respiratory tract.
6.2. Materials and Methods
6.2.1. Site Description and Data Measurement
Particle number size distributions and concentrations of other air pollutants were measured in
North Kensington, London, UK. This monitoring station, which is located in the grounds of
Sion Manning School, is representative of the typical urban background area of London. The
site location and pollution climate have been described by Bigi and Harrison (2010).
Particle number size distributions (PNSDs) were measured during 2012 by a Scanning
Mobility Particle Sizer (SMPS) operated by the Department for Environment, Food and Rural
Affairs (DEFRA) as part of the UK national network. This SMPS system comprised an
124
Electrostatic Classifier (EC, TSI model 3080) and a Condensation Particle Counter (CPC,
TSI model 3775) and was set up at a 15 minute time resolution with six scans of 2.5 minutes
covering the size range 16.6-604 nm.
Air pollutants (CO, NO, NO2 , SO2, BC, O3, PM2.5 and PM10), aerosol chemical composition
data (Na+, Mg
2+, NH4
+, Ca
2+, Cl
-, PO4
2- and SO4
2-) and meteorological data (wind speed and
direction) were extracted from the DEFRA website (see http://uk-air.defra.gov.uk/ for more
detailed information).
6.2.2. Data Handling, PMF and ICRP Models
6.2.2.1. Data handling
Data statistical analysis, polar plots and concentration weighted trajectories were performed
in the R program (Version 3.1.5) using the “Open-air” package developed by Carslaw and
Ropkins (2012). Missing data was linearly interpolated between the values from the nearest
size bins. Air pollutant concentrations, SMPS data and meteorological data were averaged on
an hourly basis.
6.2.2.2. PMF models
In this study, a profile of 6,098 hourly PNSDs comprising 51 size bins ranging from 16.6 to
604 nm were input into the PMF US EPA model version 3. Each size bin in the PNSD was
considered as an input variable. Since uncertainties were not provided by the experimental
instruments, these were estimated based on an empirical method introduced by Ogulei et al.
(2006; 2007).
The method for determining the correct number of factors in the PMF analysis has been
described by Lee et al. (1999) and Yakovleva et al. (1999). PMF factors were interpreted
based on (1) modal structure of number and volume size distributions, (2) the diurnal patterns
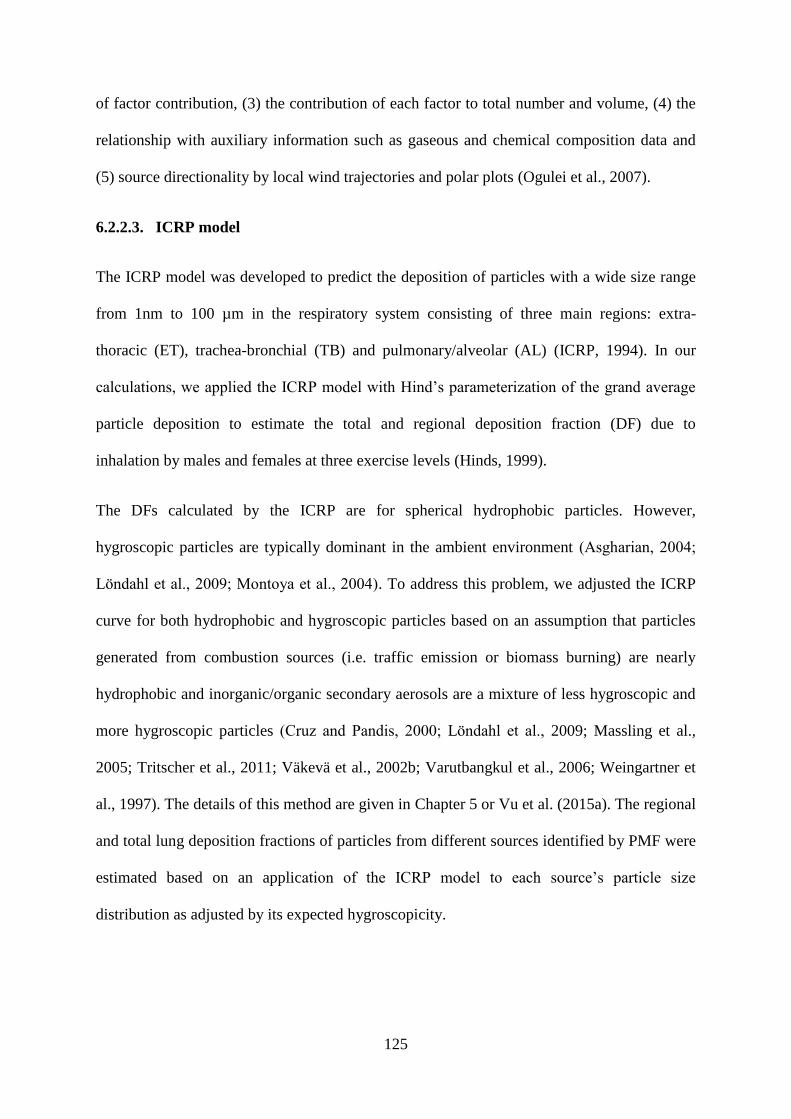
125
of factor contribution, (3) the contribution of each factor to total number and volume, (4) the
relationship with auxiliary information such as gaseous and chemical composition data and
(5) source directionality by local wind trajectories and polar plots (Ogulei et al., 2007).
6.2.2.3. ICRP model
The ICRP model was developed to predict the deposition of particles with a wide size range
from 1nm to 100 µm in the respiratory system consisting of three main regions: extra-
thoracic (ET), trachea-bronchial (TB) and pulmonary/alveolar (AL) (ICRP, 1994). In our
calculations, we applied the ICRP model with Hind’s parameterization of the grand average
particle deposition to estimate the total and regional deposition fraction (DF) due to
inhalation by males and females at three exercise levels (Hinds, 1999).
The DFs calculated by the ICRP are for spherical hydrophobic particles. However,
hygroscopic particles are typically dominant in the ambient environment (Asgharian, 2004;
Londahl et al., 2009; Montoya et al., 2004). To address this problem, we adjusted the ICRP
curve for both hydrophobic and hygroscopic particles based on an assumption that particles
generated from combustion sources (i.e. traffic emission or biomass burning) are nearly
hydrophobic and inorganic/organic secondary aerosols are a mixture of less hygroscopic and
more hygroscopic particles (Cruz and Pandis, 2000; Londahl et al., 2009; Massling et al.,
2005; Tritscher et al., 2011; Väkevä et al., 2002b; Varutbangkul et al., 2006; Weingartner et
al., 1997). The details of this method are given in Chapter 5 or Vu et al. (2015a). The regional
and total lung deposition fractions of particles from different sources identified by PMF were
estimated based on an application of the ICRP model to each source’s particle size
distribution as adjusted by its expected hygroscopicity.
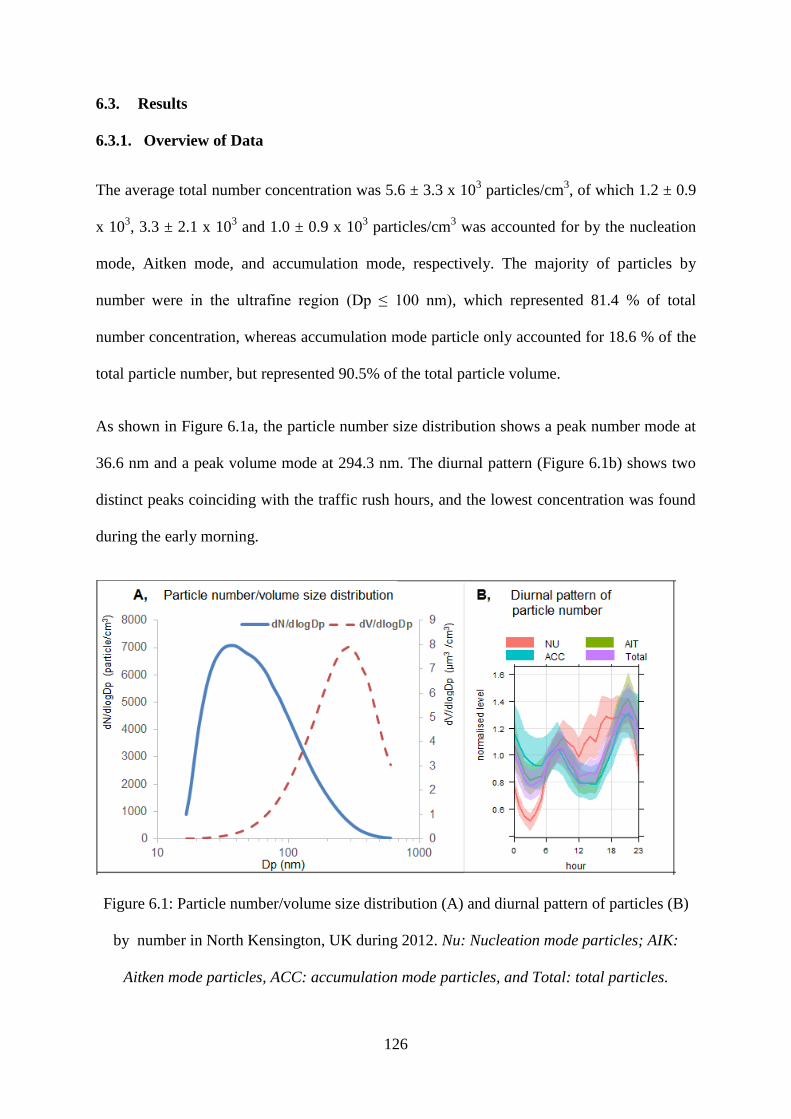
126
6.3. Results
6.3.1. Overview of Data
The average total number concentration was 5.6 ± 3.3 x 10³ particles/cm
3, of which 1.2 ± 0.9
x 103, 3.3 ± 2.1 x 10
3 and 1.0 ± 0.9 x 10
3 particles/cm
3 was accounted for by the nucleation
mode, Aitken mode, and accumulation mode, respectively. The majority of particles by
number were in the ultrafine region (Dp ≤ 100 nm), which represented 81.4 % of total
number concentration, whereas accumulation mode particle only accounted for 18.6 % of the
total particle number, but represented 90.5% of the total particle volume.
As shown in Figure 6.1a, the particle number size distribution shows a peak number mode at
36.6 nm and a peak volume mode at 294.3 nm. The diurnal pattern (Figure 6.1b) shows two
distinct peaks coinciding with the traffic rush hours, and the lowest concentration was found
during the early morning.
Figure 6.1: Particle number/volume size distribution (A) and diurnal pattern of particles (B)
by number in North Kensington, UK during 2012. Nu: Nucleation mode particles; AIK:
Aitken mode particles, ACC: accumulation mode particles, and Total: total particles.
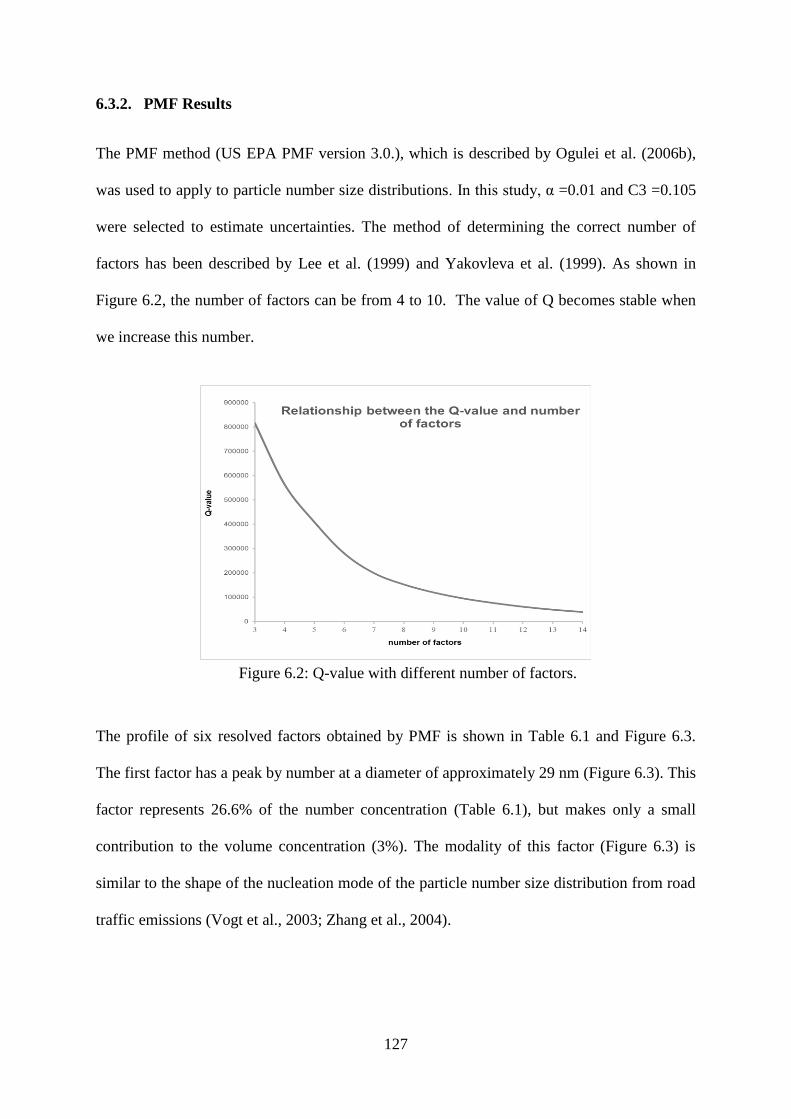
127
6.3.2. PMF Results
The PMF method (US EPA PMF version 3.0.), which is described by Ogulei et al. (2006b),
was used to apply to particle number size distributions. In this study, α =0.01 and C3 =0.105
were selected to estimate uncertainties. The method of determining the correct number of
factors has been described by Lee et al. (1999) and Yakovleva et al. (1999). As shown in
Figure 6.2, the number of factors can be from 4 to 10. The value of Q becomes stable when
we increase this number.
Figure 6.2: Q-value with different number of factors.
The profile of six resolved factors obtained by PMF is shown in Table 6.1 and Figure 6.3.
The first factor has a peak by number at a diameter of approximately 29 nm (Figure 6.3). This
factor represents 26.6% of the number concentration (Table 6.1), but makes only a small
contribution to the volume concentration (3%). The modality of this factor (Figure 6.3) is
similar to the shape of the nucleation mode of the particle number size distribution from road
traffic emissions (Vogt et al., 2003; Zhang et al., 2004).
128
These particles could be emitted directly from gasoline cars or from the growth of nucleation
particles released from diesel cars (Ristovski et al., 2006; Wehner et al., 2009). This factor
has a weak correlation with NO2 (r2
=0.43), as shown in Table 6.2. In addition, the strong
diurnal pattern shows two dominant peaks corresponding to morning and evening rush hours,
suggesting that this factor represents the exhaust nucleation particle mode (Harrison et al.,
2011). The polar plot shows no dominant direction, and therefore this factor can be attributed
to local traffic emissions.
Table 6.1: Statistics of the particle number and volume concentrations for six factors.
%N %V N-peak V-peak
%N-
NU
%N-
AIT
%N-
ACC
% V-
NU
% V-
AIT
% V-
ACC
F1 26.6 3.2 29 nm 48 nm;
191 nm 47.1 50.6 2.4 3.9 25.6 70.5
F2 29.9 8.6 52 nm 80 nm;
294 nm 8.0 88.9 3.1 0.3 39.0 60.7
F3 6.5 1.0 20 nm 237 nm 87.2 9.3 3.5 3.8 6.9 89.3
F4 1.7 23.4 86 nm;
216 nm 392 nm 2.2 42.8 55.0 0.0 0.9 99.0
F5 6.9 34.0 27 nm;
205 nm 274 nm 12.6 14.6 72.8 0.0 0.5 99.4
F6 28.3 29.7 93 nm 165 nm 1.4 60.0 38.6 0.0 15.6 84.4
Note, % N: percentage of particles by number; % V: percentage of particles by volume; N-
peak: peak number mode; V-peak: peak volume mode; NU: nucleation mode (Dp <30 nm);
AIT: Aitken mode (30 nm< Dp <100 nm); ACC: accumulation mode (100 nm< Dp<600 nm).
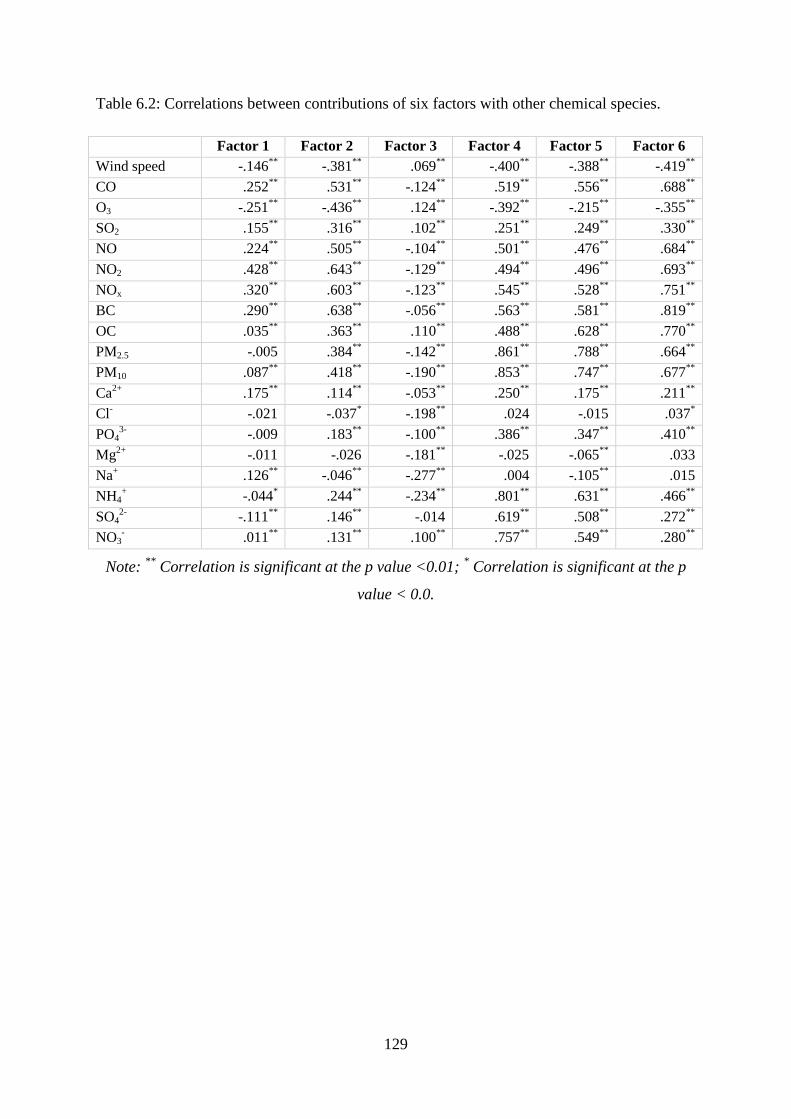
129
Table 6.2: Correlations between contributions of six factors with other chemical species.
Factor 1 Factor 2 Factor 3 Factor 4 Factor 5 Factor 6
Wind speed -.146**
-.381**
.069**
-.400**
-.388**
-.419**
CO .252**
.531**
-.124**
.519**
.556**
.688**
O3 -.251**
-.436**
.124**
-.392**
-.215**
-.355**
SO2 .155**
.316**
.102**
.251**
.249**
.330**
NO .224**
.505**
-.104**
.501**
.476**
.684**
NO2 .428**
.643**
-.129**
.494**
.496**
.693**
NOx .320**
.603**
-.123**
.545**
.528**
.751**
BC .290**
.638**
-.056**
.563**
.581**
.819**
OC .035**
.363**
.110**
.488**
.628**
.770**
PM2.5 -.005 .384**
-.142**
.861**
.788**
.664**
PM10 .087**
.418**
-.190**
.853**
.747**
.677**
Ca2+
.175**
.114**
-.053**
.250**
.175**
.211**
Cl-
-.021 -.037* -.198
** .024 -.015 .037
*
PO43-
-.009 .183**
-.100**
.386**
.347**
.410**
Mg2+
-.011 -.026 -.181**
-.025 -.065**
.033
Na+ .126
** -.046
** -.277
** .004 -.105
** .015
NH4+ -.044
* .244
** -.234
** .801
** .631
** .466
**
SO42-
-.111**
.146**
-.014 .619**
.508**
.272**
NO3- .011
** .131
** .100
** .757
** .549
** .280
**
Note: **
Correlation is significant at the p value <0.01; * Correlation is significant at the p
value < 0.0.
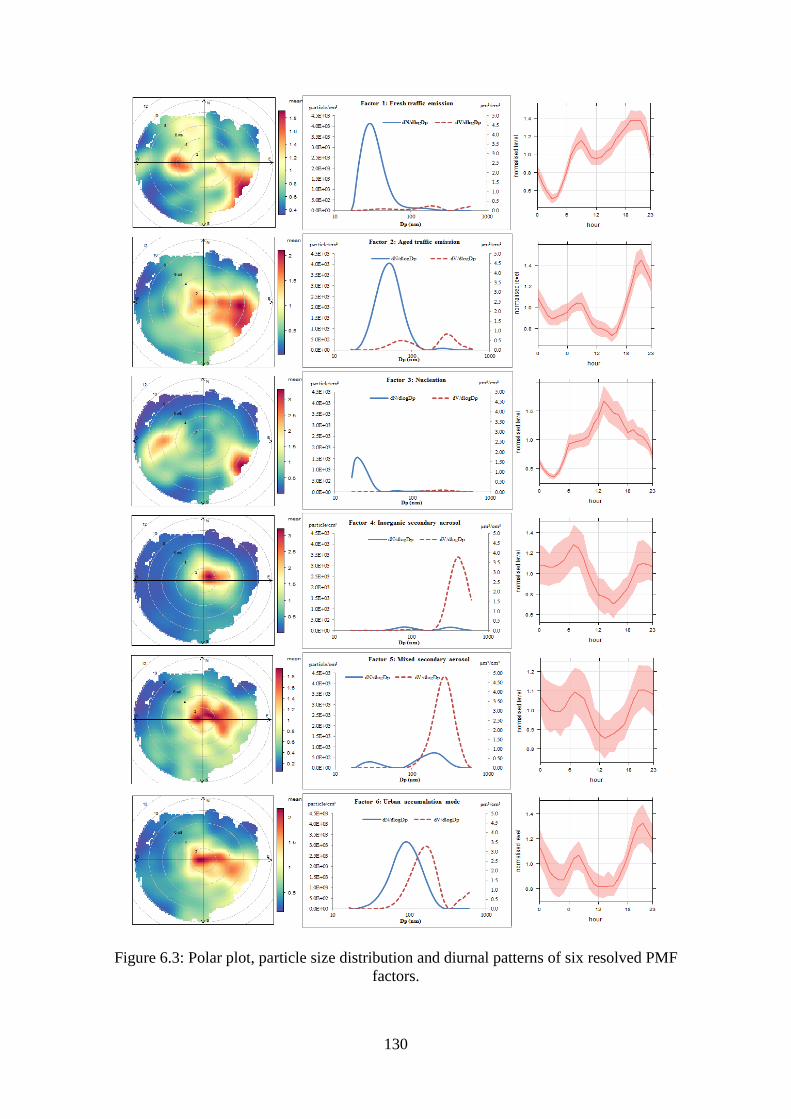
130
Figure 6.3: Polar plot, particle size distribution and diurnal patterns of six resolved PMF
factors.
131
The second factor shows the main particle number distribution in the size range between 20
nm and 100 nm, with the peak diameter around 52 nm, corresponding to solid carbonaceous
particles from diesel exhaust (Shi et al., 2000). This factor contributes 29.9% of the total
number concentration and only 8.6% of total volume concentration. The diurnal variation
shows obvious morning and evening peaks. In addition, this factor contribution has strong
correlations with other air pollutants (CO, NO, NO2 and BC) and a moderate correlation with
PM10 (see Table 6.2). Hence, this factor mainly comprises traffic emission sources, but unlike
factor 1, the polar plot shows that this source dominantly comes from easterly and south-
easterly directions. Therefore, it could be aged traffic emissions (Zhou et al., 2004),
transported from central London. There was an increase in the factor contribution in the
winter and on weekend days, and therefore this factor may also contain domestic combustion
sources, such as biomass burning or cooking.
The particle number size distribution of factor 3 is dominated by nucleation size range
particles, with 87% of the total number concentration being within this range (see footnote to
Table 6.1 for definitions of size ranges). This factor possesses small particle number
concentrations (6.5%) and small volume concentration (1%). The diurnal pattern shows a
major peak around noon, which is attributed to regional photochemical nucleation events.
The seasonal variation shows that this factor is mostly found from June to September, and the
polar plot shows marked directionality from the western sector as shown in Figure 6.3. This
could suggest that factor 3 is aged nucleation particles with an origin in the westerly sector.
This is supported by a study on new particle formation at a rural site in southeast England
which found that nucleation events occur predominantly with westerly maritime air masses,
high wind speed, and low PM2.5 and NOx concentrations (Charron et al., 2007; Charron et al.,
132
2008). There is a smaller contribution of factor 3 from the south-easterly sector, which is less
easily explained.
The fourth factor accounts for only around 2% of total particle number, but accounts for
nearly 25% of total particle volume. The size distribution of this factor shows a bimodal
distribution with two peaks at 86 nm and 216 nm, and more than 95% of total particle number
in the Aitken and accumulation ranges, while 99% of total particle volume is within the
accumulation mode. Factor 4 is strongly correlated with PM2.5 (r2 =0.86), PM10 (r
2 =0.85),
NH4+ (r
2 =0.80), NO3
- (r
2 =0.76) and SO4
2- (r
2 =0.62), and has an inverse correlation with
ozone. The obvious directionality shows that this factor originates from the east and northeast
sectors, and the diurnal variation shows a significant decrease in the afternoon. This
behaviour suggests that this factor represents regional inorganic secondary aerosols. This is
consistent with results from cluster analysis conducted by Beddows et al. (2009), who
associated regional air pollutant transport with clusters of concentrations showing a
correlation with PM10, an inverse correlation with ozone and a decreasing concentration in
the afternoon.
Factor 5 shows a main accumulation mode at 205 nm and a smaller peak at 27 nm. This
factor has a similar diurnal pattern to factor 4. The main directionality is from the northeastly,
southeastly and easterly sectors. This factor also has high and moderate correlations with
other air pollutants (PM2.5 (r2 =0.79), PM10 (r
2 =0.75), NH4
+ (r
2 =0.63), NO3
- (r
2 =0.55) and
SO42-
(r2 =0.51), although weaker correlations than those of factor 4. In addition, this factor
shows a moderate correlation with total organic carbon (r2 =0.63). Therefore, it also suggests
an association with secondary aerosol, but to a mixture of inorganic and organic aerosols.
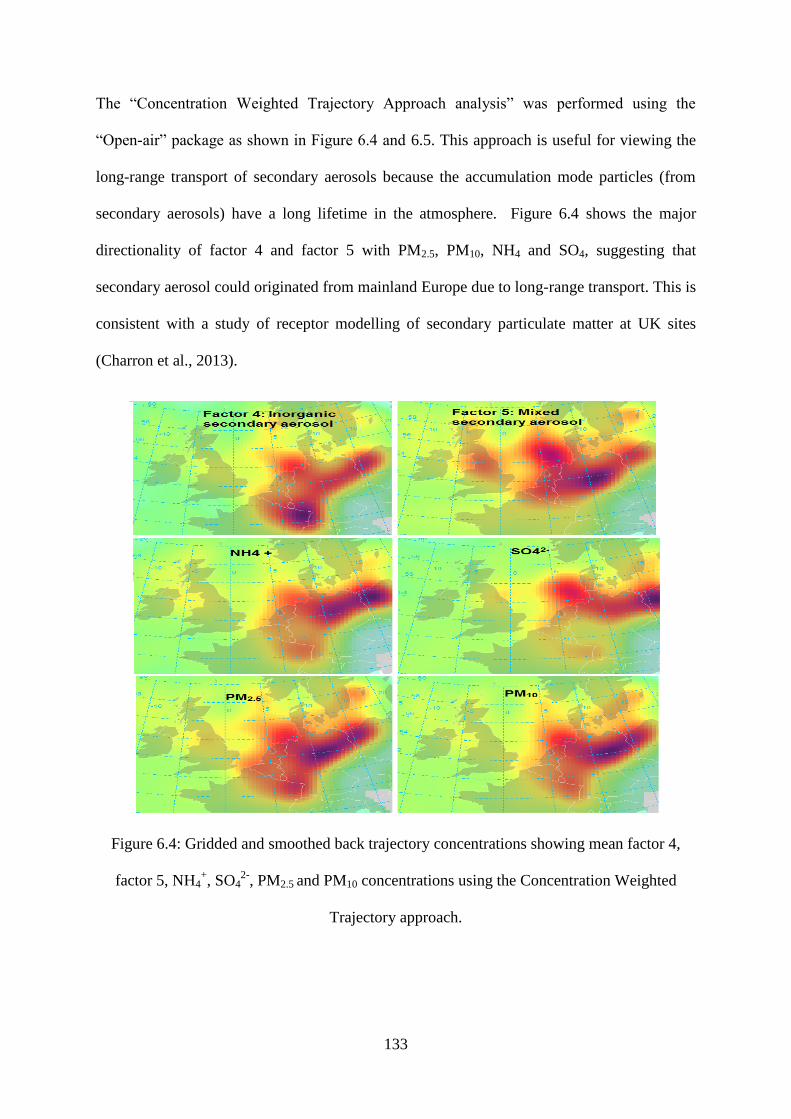
133
The “Concentration Weighted Trajectory Approach analysis” was performed using the
“Open-air” package as shown in Figure 6.4 and 6.5. This approach is useful for viewing the
long-range transport of secondary aerosols because the accumulation mode particles (from
secondary aerosols) have a long lifetime in the atmosphere. Figure 6.4 shows the major
directionality of factor 4 and factor 5 with PM2.5, PM10, NH4 and SO4, suggesting that
secondary aerosol could originated from mainland Europe due to long-range transport. This is
consistent with a study of receptor modelling of secondary particulate matter at UK sites
(Charron et al., 2013).
Figure 6.4: Gridded and smoothed back trajectory concentrations showing mean factor 4,
factor 5, NH4+, SO4
2-, PM2.5 and PM10 concentrations using the Concentration Weighted
Trajectory approach.
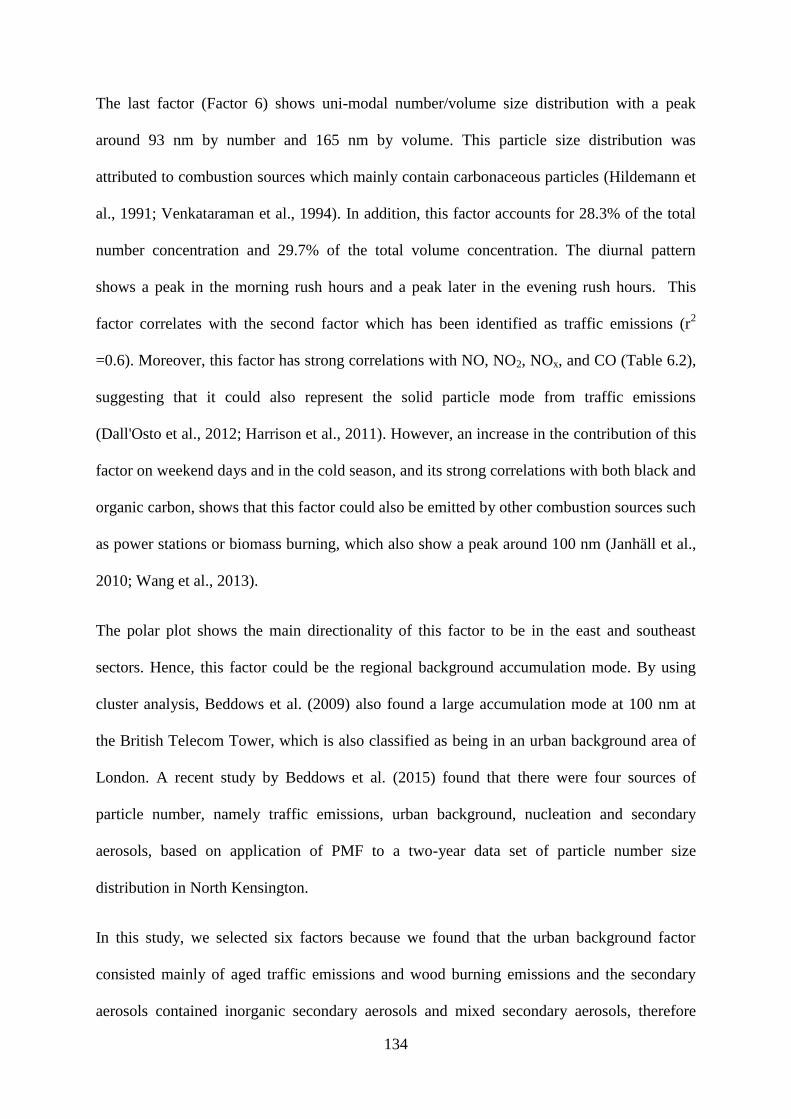
134
The last factor (Factor 6) shows uni-modal number/volume size distribution with a peak
around 93 nm by number and 165 nm by volume. This particle size distribution was
attributed to combustion sources which mainly contain carbonaceous particles (Hildemann et
al., 1991; Venkataraman et al., 1994). In addition, this factor accounts for 28.3% of the total
number concentration and 29.7% of the total volume concentration. The diurnal pattern
shows a peak in the morning rush hours and a peak later in the evening rush hours. This
factor correlates with the second factor which has been identified as traffic emissions (r2
=0.6). Moreover, this factor has strong correlations with NO, NO2, NOx, and CO (Table 6.2),
suggesting that it could also represent the solid particle mode from traffic emissions
(Dall'Osto et al., 2012; Harrison et al., 2011). However, an increase in the contribution of this
factor on weekend days and in the cold season, and its strong correlations with both black and
organic carbon, shows that this factor could also be emitted by other combustion sources such
as power stations or biomass burning, which also show a peak around 100 nm (Janhäll et al.,
2010; Wang et al., 2013).
The polar plot shows the main directionality of this factor to be in the east and southeast
sectors. Hence, this factor could be the regional background accumulation mode. By using
cluster analysis, Beddows et al. (2009) also found a large accumulation mode at 100 nm at
the British Telecom Tower, which is also classified as being in an urban background area of
London. A recent study by Beddows et al. (2015) found that there were four sources of
particle number, namely traffic emissions, urban background, nucleation and secondary
aerosols, based on application of PMF to a two-year data set of particle number size
distribution in North Kensington.
In this study, we selected six factors because we found that the urban background factor
consisted mainly of aged traffic emissions and wood burning emissions and the secondary
aerosols contained inorganic secondary aerosols and mixed secondary aerosols, therefore
135
these two factors (urban background and secondary) could split into four. This separation
increased the best fit between modelled and measured data by reducing the total residual;
however, we noted that this separation was not totally clean since the traffic emissions and
other combustion such as wood burning could share a common size distribution profile.
Figure 6.5: Gridded and smoothed back trajectory concentrations showing mean 4 factor
contributions using the CWT approach.
To conclude, the dominant source contribution of particles by number in the London urban
background area was attributed to traffic emissions (56.6 %). This was followed by the urban
accumulation mode (28.3%), which could mainly originate from combustion sources such as
136
wood burning. The highest contribution of traffic emissions to total particle number in urban
areas was also found in the previous studies by Ogulei et al. (2007), Pey et al. (2009), Gu et
al. (2011) and Wang et al. (2013). Gu et al. (2011) reported that traffic and combustion
emissions represented 65.2 and 26.1% of total particles number in Augsburg, Germany.
Particles from combustion- related sources (aged traffic and urban accumulation mode) have
strong correlations with black and organic carbon, suggesting that these sources mainly
comprise carbonaceous particles. Secondary aerosols accounted for a small fraction of the
particles number (8.6%), but they were the main contribution source of submicron particles
by volume (57.4%). These particles were considered to contain mainly ammonium nitrate and
sulfate, and organic aerosols. The urban accumulation mode accounted for 29.7% of particles
by volume, while those of traffic emissions and nucleation were 11.8 and 1.0%, respectively.
In terms of particle surface area, the urban accumulation mode was the most domination
fraction (39.2 %), following by mixed secondary aerosol (26.9%), aged traffic emission
(14.2%), inorganic secondary aerosol (13.2%), fresh traffic emission (6%) and nucleation
(1.3%).
Differences between the PMF results of this study and the PMF results from Beddows et
al. (2015)
Beddows et al. (2015) applied PMF model to two-year PNSD data sets collected at North
Kensington and found that there were four main sources of particles: traffic emissions (44.8%
by number), urban background (43.0%), nucleation (7.8%) and secondary aerosols (4.4 %).
The differences between the PMF results of this study and from Beddows et al. (2015) are
due to the following reasons:
In this study, the PMF analysis used a one-year particle number size distribution while
Beddows et al. (2015) ran PMF on a combined 2011 and 2012 data sets. The PNSD from
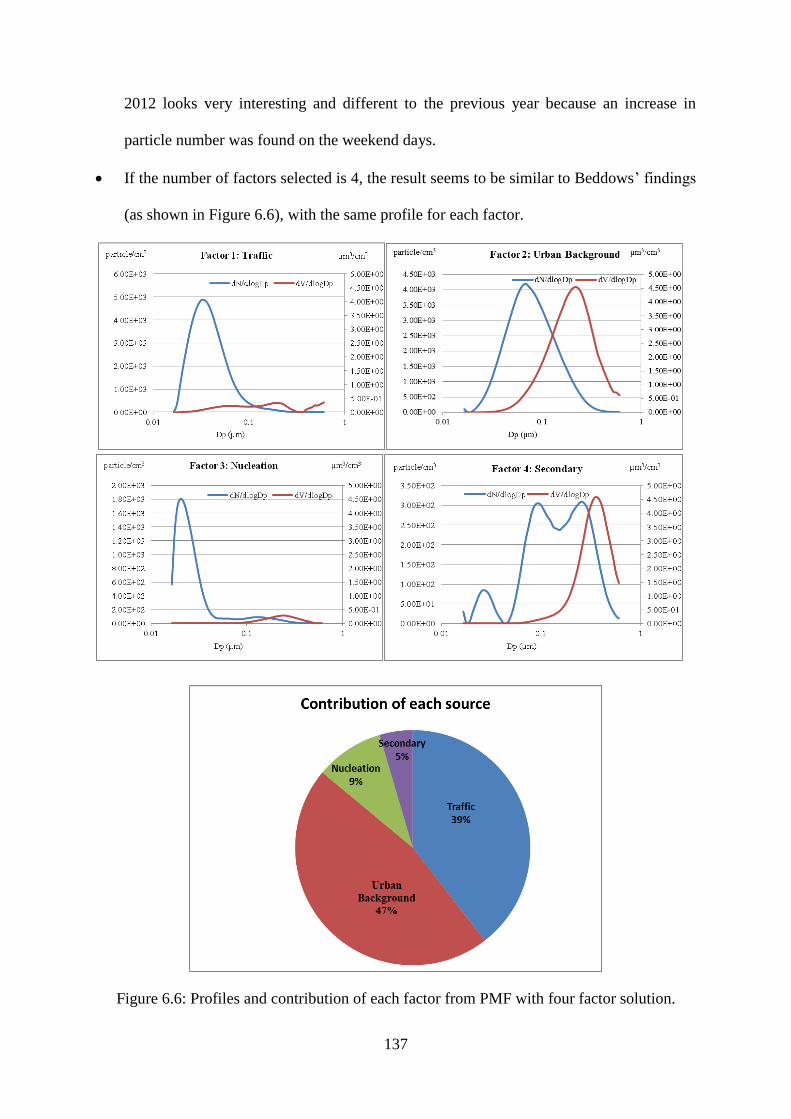
137
2012 looks very interesting and different to the previous year because an increase in
particle number was found on the weekend days.
If the number of factors selected is 4, the result seems to be similar to Beddows’ findings
(as shown in Figure 6.6), with the same profile for each factor.
Figure 6.6: Profiles and contribution of each factor from PMF with four factor solution.
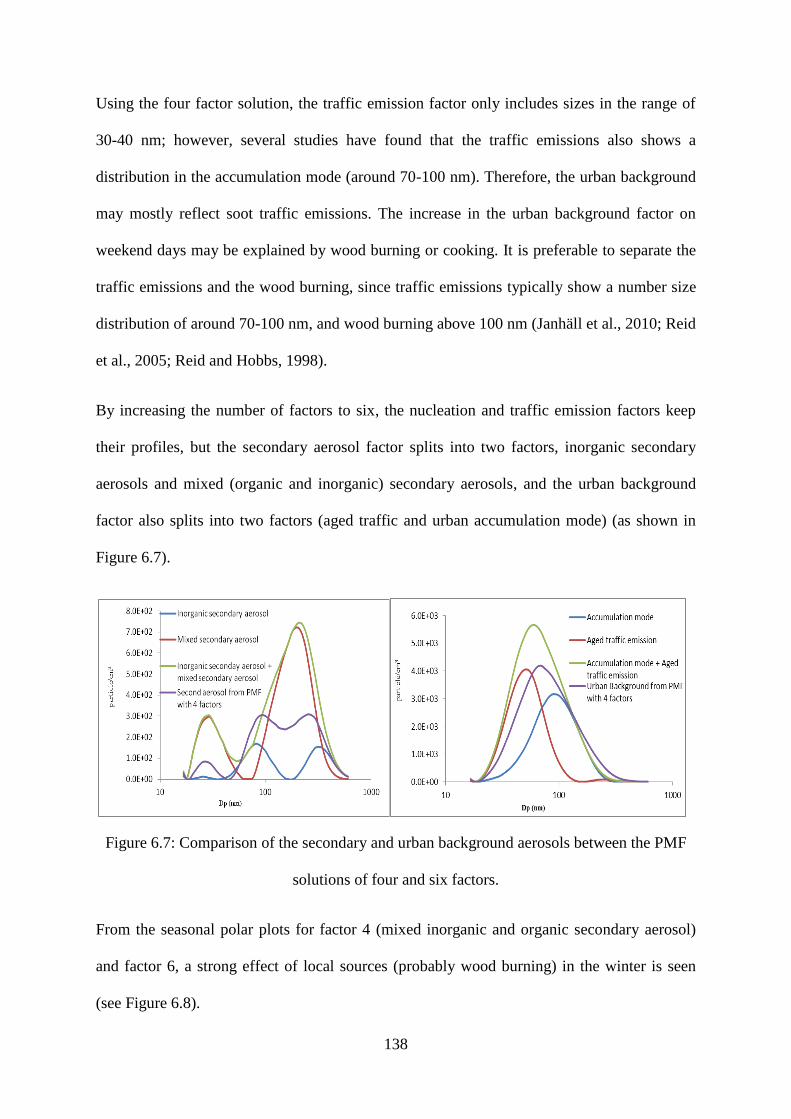
138
Using the four factor solution, the traffic emission factor only includes sizes in the range of
30-40 nm; however, several studies have found that the traffic emissions also shows a
distribution in the accumulation mode (around 70-100 nm). Therefore, the urban background
may mostly reflect soot traffic emissions. The increase in the urban background factor on
weekend days may be explained by wood burning or cooking. It is preferable to separate the
traffic emissions and the wood burning, since traffic emissions typically show a number size
distribution of around 70-100 nm, and wood burning above 100 nm (Janhäll et al., 2010; Reid
et al., 2005; Reid and Hobbs, 1998).
By increasing the number of factors to six, the nucleation and traffic emission factors keep
their profiles, but the secondary aerosol factor splits into two factors, inorganic secondary
aerosols and mixed (organic and inorganic) secondary aerosols, and the urban background
factor also splits into two factors (aged traffic and urban accumulation mode) (as shown in
Figure 6.7).
Figure 6.7: Comparison of the secondary and urban background aerosols between the PMF
solutions of four and six factors.
From the seasonal polar plots for factor 4 (mixed inorganic and organic secondary aerosol)
and factor 6, a strong effect of local sources (probably wood burning) in the winter is seen
(see Figure 6.8).
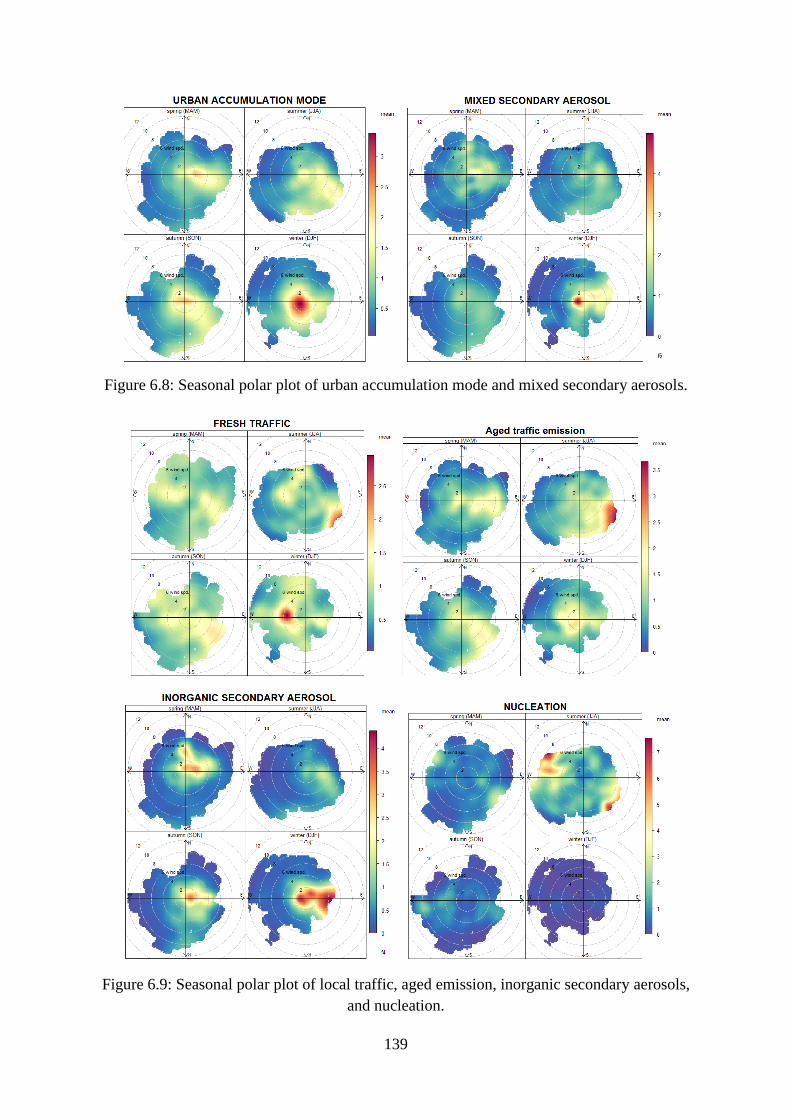
139
Figure 6.8: Seasonal polar plot of urban accumulation mode and mixed secondary aerosols.
Figure 6.9: Seasonal polar plot of local traffic, aged emission, inorganic secondary aerosols,
and nucleation.
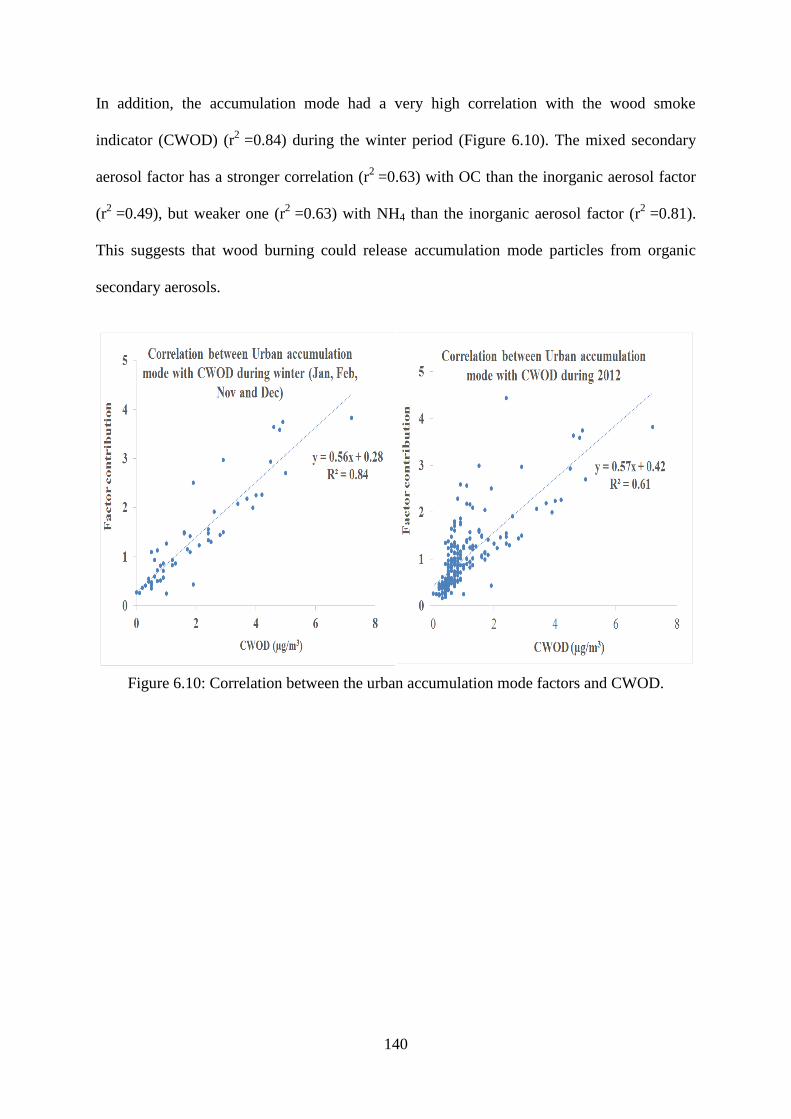
140
In addition, the accumulation mode had a very high correlation with the wood smoke
indicator (CWOD) (r2
=0.84) during the winter period (Figure 6.10). The mixed secondary
aerosol factor has a stronger correlation (r2
=0.63) with OC than the inorganic aerosol factor
(r2
=0.49), but weaker one (r2
=0.63) with NH4 than the inorganic aerosol factor (r2
=0.81).
This suggests that wood burning could release accumulation mode particles from organic
secondary aerosols.
Figure 6.10: Correlation between the urban accumulation mode factors and CWOD.
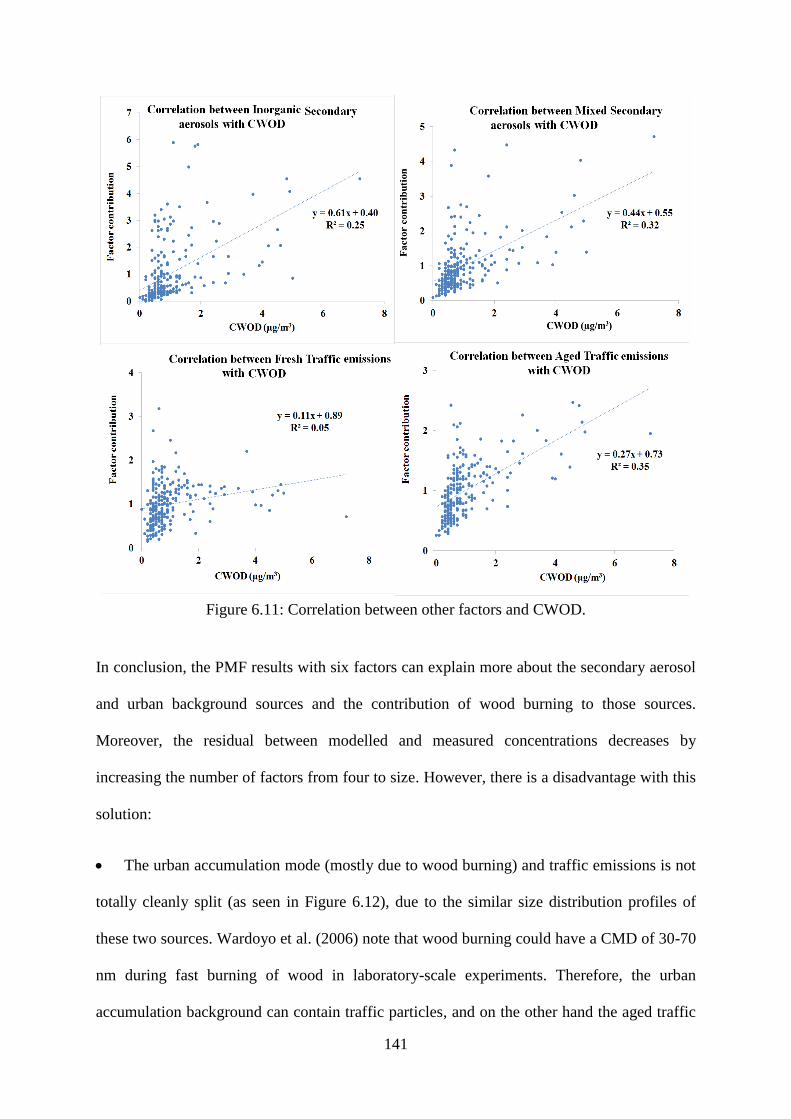
141
Figure 6.11: Correlation between other factors and CWOD.
In conclusion, the PMF results with six factors can explain more about the secondary aerosol
and urban background sources and the contribution of wood burning to those sources.
Moreover, the residual between modelled and measured concentrations decreases by
increasing the number of factors from four to size. However, there is a disadvantage with this
solution:
The urban accumulation mode (mostly due to wood burning) and traffic emissions is not
totally cleanly split (as seen in Figure 6.12), due to the similar size distribution profiles of
these two sources. Wardoyo et al. (2006) note that wood burning could have a CMD of 30-70
nm during fast burning of wood in laboratory-scale experiments. Therefore, the urban
accumulation background can contain traffic particles, and on the other hand the aged traffic
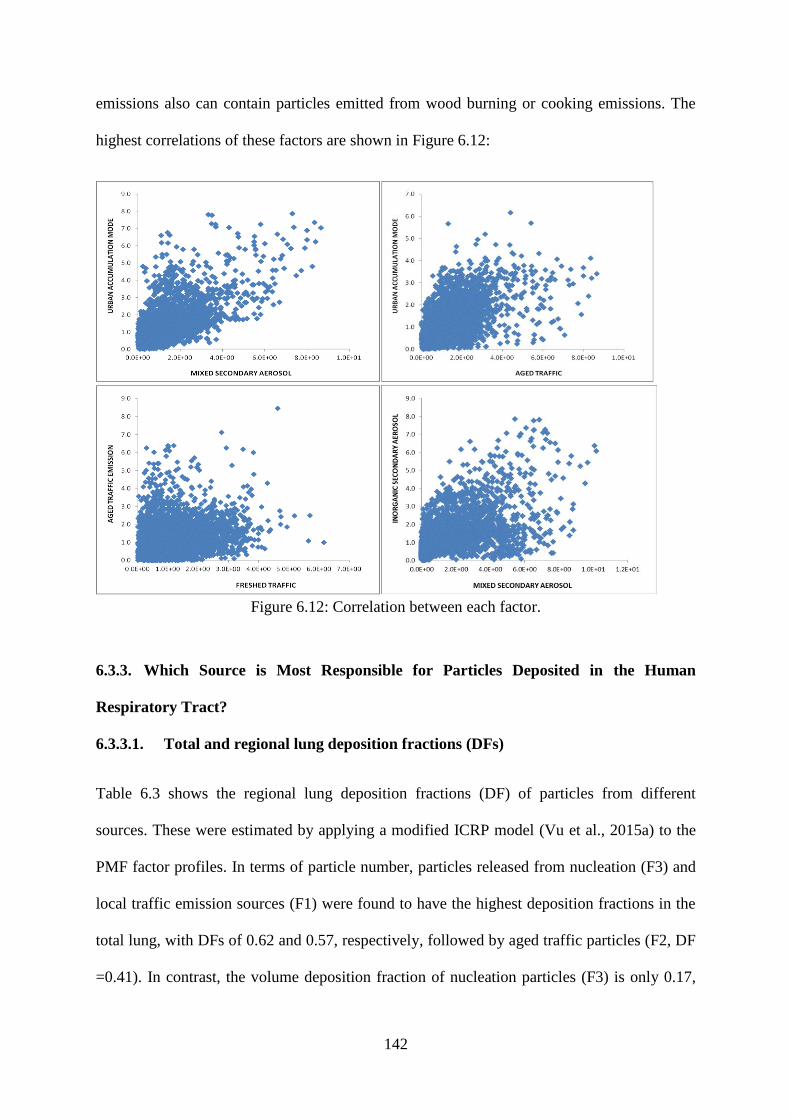
142
emissions also can contain particles emitted from wood burning or cooking emissions. The
highest correlations of these factors are shown in Figure 6.12:
Figure 6.12: Correlation between each factor.
6.3.3. Which Source is Most Responsible for Particles Deposited in the Human
Respiratory Tract?
6.3.3.1. Total and regional lung deposition fractions (DFs)
Table 6.3 shows the regional lung deposition fractions (DF) of particles from different
sources. These were estimated by applying a modified ICRP model (Vu et al., 2015a) to the
PMF factor profiles. In terms of particle number, particles released from nucleation (F3) and
local traffic emission sources (F1) were found to have the highest deposition fractions in the
total lung, with DFs of 0.62 and 0.57, respectively, followed by aged traffic particles (F2, DF
=0.41). In contrast, the volume deposition fraction of nucleation particles (F3) is only 0.17,
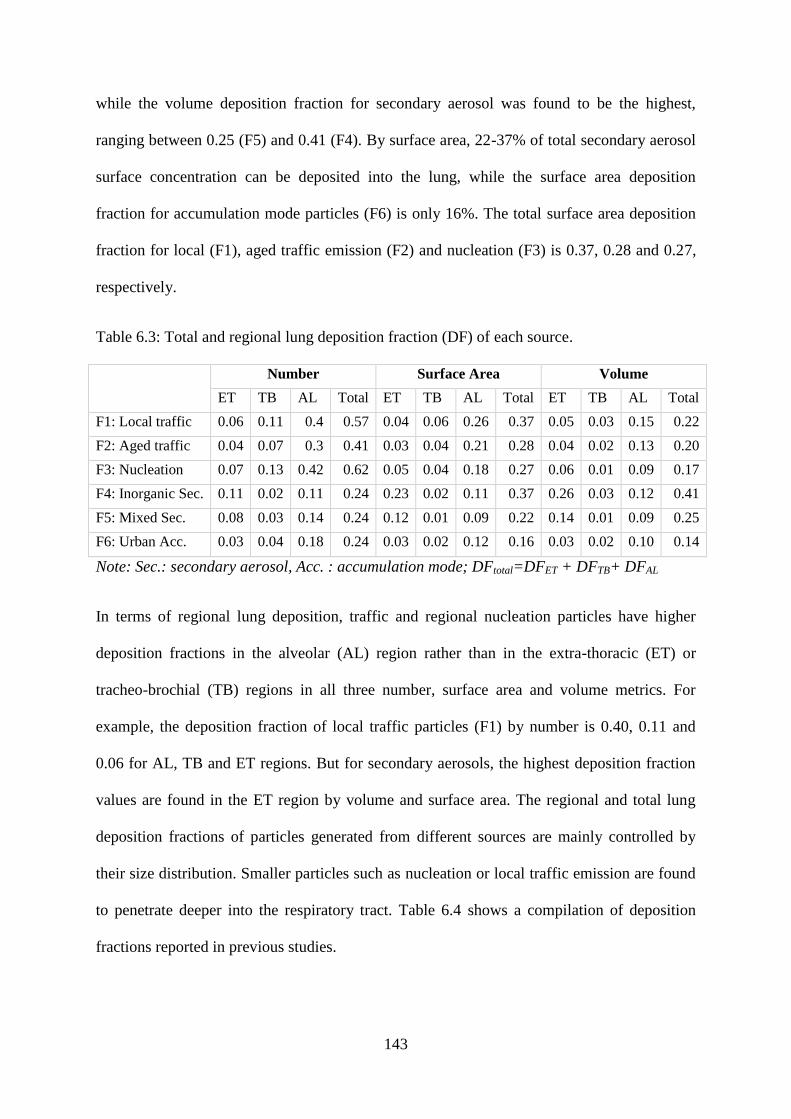
143
while the volume deposition fraction for secondary aerosol was found to be the highest,
ranging between 0.25 (F5) and 0.41 (F4). By surface area, 22-37% of total secondary aerosol
surface concentration can be deposited into the lung, while the surface area deposition
fraction for accumulation mode particles (F6) is only 16%. The total surface area deposition
fraction for local (F1), aged traffic emission (F2) and nucleation (F3) is 0.37, 0.28 and 0.27,
respectively.
Table 6.3: Total and regional lung deposition fraction (DF) of each source.
Number Surface Area Volume
ET TB AL Total ET TB AL Total ET TB AL Total
F1: Local traffic 0.06 0.11 0.4 0.57 0.04 0.06 0.26 0.37 0.05 0.03 0.15 0.22
F2: Aged traffic 0.04 0.07 0.3 0.41 0.03 0.04 0.21 0.28 0.04 0.02 0.13 0.20
F3: Nucleation 0.07 0.13 0.42 0.62 0.05 0.04 0.18 0.27 0.06 0.01 0.09 0.17
F4: Inorganic Sec. 0.11 0.02 0.11 0.24 0.23 0.02 0.11 0.37 0.26 0.03 0.12 0.41
F5: Mixed Sec. 0.08 0.03 0.14 0.24 0.12 0.01 0.09 0.22 0.14 0.01 0.09 0.25
F6: Urban Acc. 0.03 0.04 0.18 0.24 0.03 0.02 0.12 0.16 0.03 0.02 0.10 0.14
Note: Sec.: secondary aerosol, Acc. : accumulation mode; DFtotal=DFET + DFTB+ DFAL
In terms of regional lung deposition, traffic and regional nucleation particles have higher
deposition fractions in the alveolar (AL) region rather than in the extra-thoracic (ET) or
tracheo-brochial (TB) regions in all three number, surface area and volume metrics. For
example, the deposition fraction of local traffic particles (F1) by number is 0.40, 0.11 and
0.06 for AL, TB and ET regions. But for secondary aerosols, the highest deposition fraction
values are found in the ET region by volume and surface area. The regional and total lung
deposition fractions of particles generated from different sources are mainly controlled by
their size distribution. Smaller particles such as nucleation or local traffic emission are found
to penetrate deeper into the respiratory tract. Table 6.4 shows a compilation of deposition
fractions reported in previous studies.
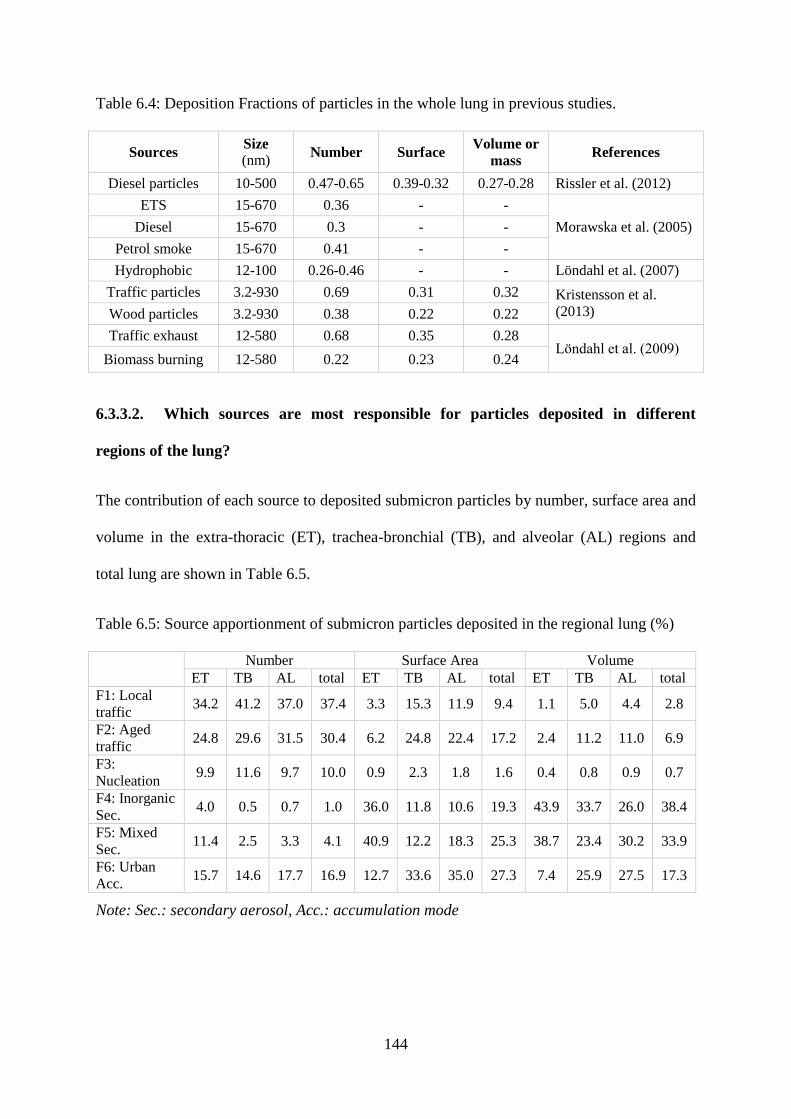
144
Table 6.4: Deposition Fractions of particles in the whole lung in previous studies.
Sources Size
(nm) Number Surface
Volume or
mass References
Diesel particles 10-500 0.47-0.65 0.39-0.32 0.27-0.28 Rissler et al. (2012)
ETS 15-670 0.36 - -
Morawska et al. (2005) Diesel 15-670 0.3 - -
Petrol smoke 15-670 0.41 - -
Hydrophobic 12-100 0.26-0.46 - - Löndahl et al. (2007)
Traffic particles 3.2-930 0.69 0.31 0.32 Kristensson et al.
(2013) Wood particles 3.2-930 0.38 0.22 0.22
Traffic exhaust 12-580 0.68 0.35 0.28 Londahl et al. (2009)
Biomass burning 12-580 0.22 0.23 0.24
6.3.3.2. Which sources are most responsible for particles deposited in different
regions of the lung?
The contribution of each source to deposited submicron particles by number, surface area and
volume in the extra-thoracic (ET), trachea-bronchial (TB), and alveolar (AL) regions and
total lung are shown in Table 6.5.
Table 6.5: Source apportionment of submicron particles deposited in the regional lung (%)
Number Surface Area Volume
ET TB AL total ET TB AL total ET TB AL total
F1: Local
traffic 34.2 41.2 37.0 37.4 3.3 15.3 11.9 9.4 1.1 5.0 4.4 2.8
F2: Aged
traffic 24.8 29.6 31.5 30.4 6.2 24.8 22.4 17.2 2.4 11.2 11.0 6.9
F3:
Nucleation 9.9 11.6 9.7 10.0 0.9 2.3 1.8 1.6 0.4 0.8 0.9 0.7
F4: Inorganic
Sec. 4.0 0.5 0.7 1.0 36.0 11.8 10.6 19.3 43.9 33.7 26.0 38.4
F5: Mixed
Sec. 11.4 2.5 3.3 4.1 40.9 12.2 18.3 25.3 38.7 23.4 30.2 33.9
F6: Urban
Acc. 15.7 14.6 17.7 16.9 12.7 33.6 35.0 27.3 7.4 25.9 27.5 17.3
Note: Sec.: secondary aerosol, Acc.: accumulation mode
145
6.3.3.3. By number
The majority of particles by number deposited in the total and regional lung are found to be
related to combustion sources, in which traffic emissions were found to be the main
contributor. Local and aged traffic particles are responsible for 67.8% of particle number
deposited in the total lung. In terms of lung regions, traffic emissions are dominant and
account for 68.5% of particle deposition in the AL region and up to 70.8% in the TB region.
Regional accumulation mode and nucleation particles account for approximately 17% and
10% of particle number deposited in the total lung while secondary aerosols only account for
around 5.1%. The dominant contribution to particles deposited in the total lung is traffic
emissions because they are the main source of particles by number in an urban area. In
addition, traffic particle size distributions were found predominantly in the ultrafine size
range (<100 nm), with high deposition fractions. Therefore, traffic emission particles can
easily penetrate and to be deposited in the human respiratory tract.
6.3.3.4. By surface area
Both combustion and secondary aerosols account for the majority of particles by surface area
deposited in the lung. Secondary aerosols contribute nearly half of the particle surface area
deposited in the total lung (44.6%), while regional accumulation mode particles and traffic
particles account for 27.3% and 26.6%, respectively. In the AL and TB regions, regional
accumulation mode particles, traffic emissions and secondary aerosols share around one third
of total deposited particles. However, in the ET region secondary aerosols account for more
than 76% of the total particle surface area, while accumulation mode particles and traffic
emissions account for 12.7 and 9.5%. Only 1.6% of the particle surface area deposited in the
total lung is attributed to nucleation particles.
6.3.3.5. By volume
146
Secondary aerosols are identified as the main source of submicron particles by volume
deposited in the total and regional lung. They represent approximately 71.4% of particle
volume deposited in the total lung and up to 82.6% in the ET regional. This can be explained
by the major contribution of secondary aerosols to particle volume. In addition, due to their
more hygroscopic properties, their lung deposition fractions are much higher than those from
hydrophobic particles with the same initial dry diameter (Vu et al., 2015a). Accumulation
mode particles account for 7.4%, 25.9%, 27.5% and 17.3% of total particle volume deposited
in the ET, TB, AL and total lung, respectively. Traffic emissions only represent around 10%
of the particle volume deposited in the total lung. Traffic emission particles mainly penetrate
and are deposited into the TB and AL regions, where they account for around 15-16%, while
they only contribute to 3.5% of particle volume deposited in the ET region. Nucleation
particles do not make a significant contribution to total submicron particle deposition by
volume in the lung (<1%).
Some studies suggest that ultrafine particles that are most commonly measured in terms of
their number concentrations could have higher toxicity compared to corresponding masses of
fine particles due to their large surface area, oxidative capacity and radical species formation,
which can lead to cellular DNA damage or induce inflammatory effects (Atkinson et al.,
2010; Kreyling et al., 2004). In addition, Harrison et al. (2010) indicate that relating health
outcomes to measured particle concentrations is likely to underestimate the public health
impacts and emphasizes that the regional dose, not pollutant exposure, probably drives health
outcomes. Therefore, our findings of the various source contributions of particles in the
different regional lung and particle metrics can be useful in addressing part of the question of
what the most important metric linked to health effects in epidemiology studies is. It also
helps policy makers to make decisions on controlling particulate matter. For example, if we
plan to reduce particles by number in urban areas, we should first consider traffic emissions
147
because of their greatest contribution (59.0-70.8%) in both the whole and regional lung. But
if the target is to reduce submicron particles by mass, we need to first consider the secondary
aerosols and urban accumulation mode (mostly urban combustion).
6.4. Conclusions
This study found that traffic emissions were the most relevant ambient source of submicron
particles deposited by number into the human respiratory tract, accounting for 67.8% of
particles deposited in the total lung by number at the North Kensington site. This can be
explained by considering local and aged traffic sources as major sources of submicron
particles by number (56.5%) in this urban background area in conjunction with their high
lung deposition fraction (0.41-0.57). Moreover, traffic particles can penetrate deeper into the
lung with deposition fractions of 0.3-0.4 in the AL region and 0.07-0.11 in the TB region.
Considering the high concentrations by number attributed to traffic emissions in the PMF
analysis, local and aged traffic emissions represent 68.5% and 70.8% of the total particle
number deposited in the TB and AL regions, respectively. Urban accumulation mode
particles and regional nucleation particles were also found to contribute significantly to the
increased number of particles deposited in the lung (16.9% and 10% respectively). Secondary
aerosols contribute only approximately 5.1% of submicron particles deposited in the total
lung by number, but they represent a major source of particles deposited in the regions and
total lung by volume (56.2-82.6%), followed by urban accumulation mode (7.4-27.5%),
traffic emissions (3.5-16.2%) and nucleation (0.4-0.9%). In terms of deposited particles by
surface area, secondary aerosols were found to be most dominant in the ET region (76.9%),
while the main contribution in the TB region was from traffic emissions (40.1%) and urban
accumulation mode (33.6%). In the AL region, urban accumulation mode was the highest
contributor of particle surface area (35.0%), followed by traffic emissions (34.3%), secondary
aerosols (28.9%) and nucleation (1.8%).

148
Chapter 7: PHYSICAL PROPERTIES AND LUNG DEPOSITION OF
PARTICLES EMITTED FROM FIVE MAJOR INDOOR SOURCES
This chapter studies the physical properties of indoor particles were measured with an SMPS
system an APS and an H-TDMA in a flat located in an urban background site in Prague
(Czech Republic) from 15th
August to 8th
September, 2014. Particles emitted from cleaning
activities showed unimodal number size distributions, with the majority of particles (>98.2%)
in the ultrafine size range (Dp <100 nm) and modes at a diameter of 19.8 nm for vacuum
cleaning and 30.6 nm for soap/W5 cleaning. Smoking and incense burning predominantly
generated particles in the accumulation mode with a count median diameter around 90-150
nm while cooking emissions showed a bimodal structure with a main mode at 47.8 nm.
Particles from vacuum cleaning, incense burning, smoking and cooking emissions were found
to be “nearly hydrophobic” with averaged growth factor (Gf) around 1.01-1.10, while
particles emitted from desk cleaning using organic compounds were found to be “less-
hygroscopic” (Gf ~1.12-1.16). Based on an adjusted MPPD model with a consideration of
the hygroscopic properties of particles, the total lung deposition efficiencies of these particles
by number when they penetrate into the human lung were 0.73 ± 0.02, 0.62 ± 0.03, 0.37 ±
0.03, 0.32 ± 0.03 and 0.49 ± 0.02 for vacuum cleaning, desk cleaning, smoking, incense
burning and cooking, respectively.
This chapter contains some sections of verbatim text adapted from a manuscript of “Physical
properties and lung deposition of particles emitted from five major indoor sources” which
has accepted on the Air Quality, Atmosphere & Health journal. The author’s contribution:
writing, contribution of ideas and numerical calculations.
149
7.1. Introduction
People in developed countries spend the majority of their time (approximately 90%) in indoor
environments (Delgado-Saborit et al., 2011), and as consequence they may be exposed to a
range of pollutants of an indoor origin, particularly ultrafine particles which may cause
cardiovascular, respiratory, and neurological hazards to human health (Diffey, 2011;
Donaldson et al., 1998). Morawska et al. (2013) reported that 19-76% of the integrated daily
residential exposure to ultrafine particles originated from indoor generated ones.
Furthermore, their study found that particles emitted from indoor sources could represent up
to 30% of the total burden of disease caused by aerosol exposure.
In recent years, many studies have been performed to characterize a range of indoor
generated particles from various microenvironments, such as home, office, school or work
place. For example, He et al. (2004) measured the contribution from 21 different types of
indoor activities to particle number and mass concentration in 15 residential houses. Their
study found that the indoor particle number concentrations showed an increase of 1.5 to over
27 times during indoor activities, while the PM2.5 concentration was also estimated to
increase during smoking, grilling and frying activities from 3 to 90 times above the
background level. Similarly, Bhangar et al. (2011) investigated ultrafine particle
concentration in seven residences in northern California and indicated that cooking was the
most important indoor activity contributing to the indoor ultrafine particle level.
Different types of indoor activities release particles with different physical properties
including their size distribution. The majority of particles generated from indoor combustion
sources including, cooking, wood burning, candle burning, and fireplace or kerosene heating,
were found in the submicron size range (Hussein et al., 2006). On the other hand, particles
originating from resuspension from indoor surfaces due to building occupant movement are
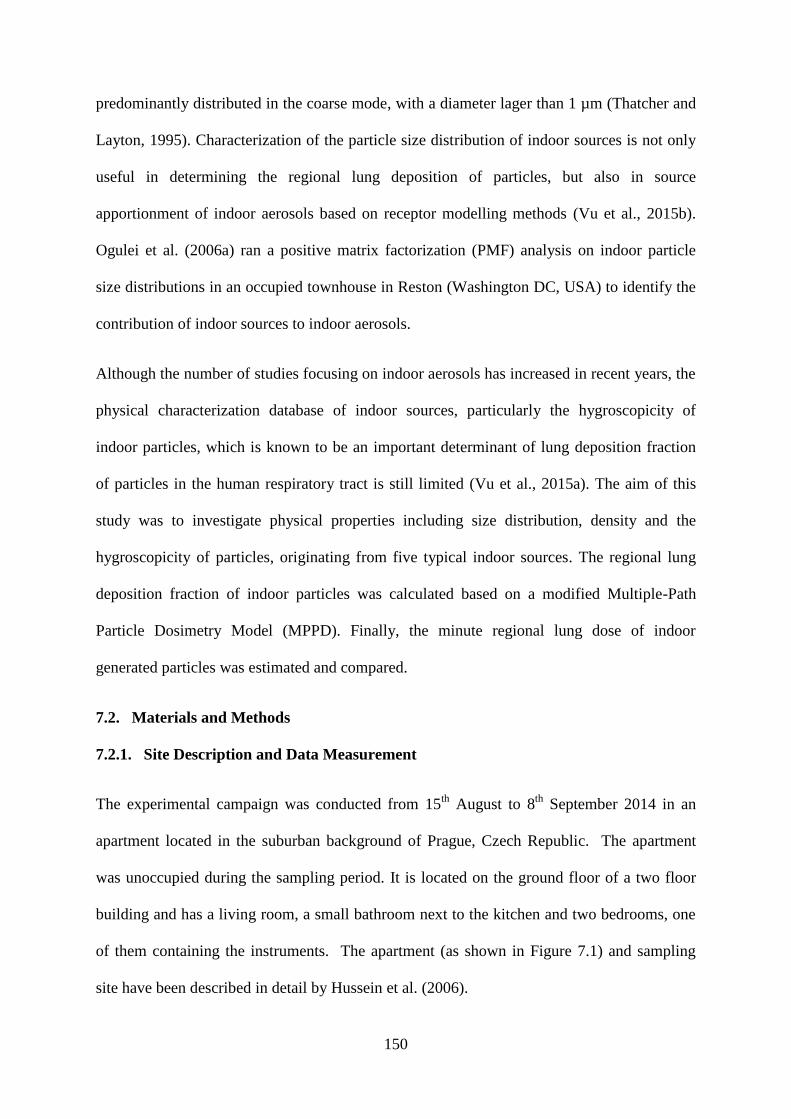
150
predominantly distributed in the coarse mode, with a diameter lager than 1 µm (Thatcher and
Layton, 1995). Characterization of the particle size distribution of indoor sources is not only
useful in determining the regional lung deposition of particles, but also in source
apportionment of indoor aerosols based on receptor modelling methods (Vu et al., 2015b).
Ogulei et al. (2006a) ran a positive matrix factorization (PMF) analysis on indoor particle
size distributions in an occupied townhouse in Reston (Washington DC, USA) to identify the
contribution of indoor sources to indoor aerosols.
Although the number of studies focusing on indoor aerosols has increased in recent years, the
physical characterization database of indoor sources, particularly the hygroscopicity of
indoor particles, which is known to be an important determinant of lung deposition fraction
of particles in the human respiratory tract is still limited (Vu et al., 2015a). The aim of this
study was to investigate physical properties including size distribution, density and the
hygroscopicity of particles, originating from five typical indoor sources. The regional lung
deposition fraction of indoor particles was calculated based on a modified Multiple-Path
Particle Dosimetry Model (MPPD). Finally, the minute regional lung dose of indoor
generated particles was estimated and compared.
7.2. Materials and Methods
7.2.1. Site Description and Data Measurement
The experimental campaign was conducted from 15th
August to 8th
September 2014 in an
apartment located in the suburban background of Prague, Czech Republic. The apartment
was unoccupied during the sampling period. It is located on the ground floor of a two floor
building and has a living room, a small bathroom next to the kitchen and two bedrooms, one
of them containing the instruments. The apartment (as shown in Figure 7.1) and sampling
site have been described in detail by Hussein et al. (2006).
151
Figure 7.1: Plan view of the apartment.
The particle number size distribution (14.6-850 nm) was measured by a Scanning Mobility
Particle Sizer system (SMPS 3696, TSI Inc., USA), comprising a TSI 3080 electrostatic
classifier, a TSI 3081 differential mobility analyzer (long DMA) and a TSI 3775
condensation particle counter (CPC). Larger particles and their number size distribution
(0.54-18 µm) were measured by an Aerodynamic Particle Sizer (APS 3321, TSI Inc., USA).
The SMPS system was operated at a low aerosol flow rate of 0.3 L min−1
and the APS flow
rate was 5 L min-1
, with a 5 minute time resolution. A Hygroscopic Tandem Differential
Mobility Analyzer (HTDMA) developed by the Laboratory of Aerosol Chemistry and
Physics, Institute of Chemical Process Fundamentals of the ASCR, (ICPF, Czech Republic)
was installed to measure the hygroscopic growth factors at 90% relative humidity for
particles with three selected initial dry sizes with diameters of 50, 100 and 200 nm.
Indoor particles were generated in a closed kitchen, except cooking activity with opened
door. The cleaning, smoking, incense burning and cooking activities were conducted during a
period of approximately 10, 5, 60 and 20 minutes. There are two persons smoked with two
152
cigarettes inside the kitchen during smoking experiments. Cooking experiments were
conducted by frying sausages with sunflower oil, and toasting breads. Sampling inlet was put
in breathable zone. All SMPS/APS datasets were corrected for particle loss inside the tube
(the length of the tube ~ 1.2 m) before analysis.
7.2.2. Data Handling
Merging SMPS/APS data
Two types of data sets (aerodynamic and mobility) collected from the APS and SMPS
instruments were merged into one particle size spectrum matrix (mobility diameter from
14.9-10000 nm) using an enhanced algorithm which was developed in CRAN R by Beddows
et al. (2010). The effective density of the particles was estimated based on the best fit
between two instrument (APS/SMPS) datasets for number, surface area and volume spectra.
The final diameter type obtained by this enhanced merging algorithm was mobility diameter,
and it can be converted to aerodynamic diameter models using the following equations:
𝐷𝑎 = 𝑥. 𝐷𝑚. √𝐶(𝐷𝑚)
𝐶(𝐷𝑎) (7.1)
𝑥 = √𝜌𝑒
𝜌0 (7.2)
where, 𝐷𝑎 and, 𝐷𝑚 are aerodynamic and mobility diameters (nm), respectively; C is the
Cunningham slip correction factor and 𝑥is known as the free parameter that is determined by
giving the best fit between the APS/SMPS spectra. 𝜌0 is unit density and 𝜌𝑒 is the estimated
transition-regime effective density (g cm-3
). Particles were assumed to be spherical, therefore
mobility diameter equals to equivalent volume diameter. PM mass concentrations were
estimated from the merged size distribution and effective density.
153
7.2.3. Estimation of hygroscopic growth factors in regions of the lung
To analyse the growth factors from the HTDMA, a TDMAinv conversion approach provided
by the Laboratory of Atmospheric Chemistry, Paul Scherrer Institute (PSI, Switzerland), was
applied (Gysel et al., 2009). The TDMAinv toolkit was run on the Igor Wave Metric software
version 6.1. This algorithm retrieved the actual growth factor probability density function
(GF-PDF) as a piecewise linear function from the measurement distribution function of the
HTDMA. The GF-PDF is defined as the growth factor probability density function, c(g,D)
for particles with dry diameter D=D0 to present a growth factor (GF) is g, and the total
probability of the presented GF is unity: ∫ 𝑐(𝑔, 𝐷0)𝑑𝑔 = 1∞
0 (Gysel et al., 2009). In this
study, the HTDMA measured the mean growth factor at 90% RH:
𝐺𝐹𝑚𝑒𝑎𝑛 = ∫ 𝑔𝑐(𝑔, 𝐷0)𝑑𝑔∞
0.
To calculate the growth factors at 99.5% RH, which is assumed as the RH in the respiratory
tract, from the observed growth factor at 90% RH from our TDMA measurements, we
applied an approach provided by Rissler et al. (2010) using the following calculation:
Gf-99.5% = √1 +99.5
90(𝐺𝑓−90%
3 − 1)(𝐶𝑘 𝑎𝑡 90 % 𝑅𝐻−0.90)
(𝐶𝑘 𝑎𝑡 99.5 % 𝑅𝐻−0.95)
3 (7.3)
where, Ck is the Kelvin curvature correction factor
Ck at a% RH = exp(4𝑀𝑊𝜎𝑠
𝑅𝑇.𝜌𝑤𝐷𝑝−𝑎𝑡 𝑎% 𝑅𝐻) (7.4)
Mw (18 g mol-1
) and, ρw(1 g cm-3
) are the molecular weight and density of water; σs is the
surface tension of the solution (assuming a surface tension of 0.072 J m-2
); R (8.314 J mol-1
)
and T (298 K) are the ideal gas constant and temperature respectively, and Dp is the particle
diameter (nm).
154
In this study, the HTMA only measured particles at three selected dry sizes of 50, 100 and
200 nm at 90% RH. For particles of below 50 nm and over 200 nm, this study assumed that
the soluble volume fraction of particles at a diameter of 50 nm is also descriptive of those
smaller than 50 nm, while that of particles with a diameter of 200 nm also describes those
larger than 200 nm. In our measurements, particle size distributions were collected using
SMPS/APS instruments without a dryer. It is therefore necessary to calculate the effects of
ambient humidity on the size distribution measured by the SMPS/APS before using the data
for the lung dose calculation.
The dry diameter of a particle can be estimated by the ratio of particle size measured by
SMPS and the growth factor of that dry particle in the ambient relative humidity (RH). The
RH for the indoor environment during vacuum cleaning, soap cleaning, smoking, incense
burning and cooking was 47.9, 57.2, 47.3, 66.2 and 72.8%, respectively. According to our
calculation, the effect of ambient relative humidity on the measured size distributions is not
significant since the growth factors of particles were approximately unity under these low RH
conditions. When a particle penetrates into the lung, its growth not only depends on particle
size but also upon its residence time. To address the particle growth dependence upon time,
we used an approach provided by Ferron (1977) as equation (5.2) and (5.3) as introduced in
Chapter 5.
7.2.4. Modelling Particle Deposition in the Human Respiratory System.
Many mathematical models have been developed in recent decades to estimate the total and
regional lung deposition of particles; for example, the ICRP model (International
Commission on Radiological Protection), the NCRP model (National Council on Radiation
Protection and Measurement), the IDEAL model (Inhalation, Deposition and Exhalation of
Aerosols in/from the Lung) or the MPPD model (Multiple-Path Particle Dosimetry)
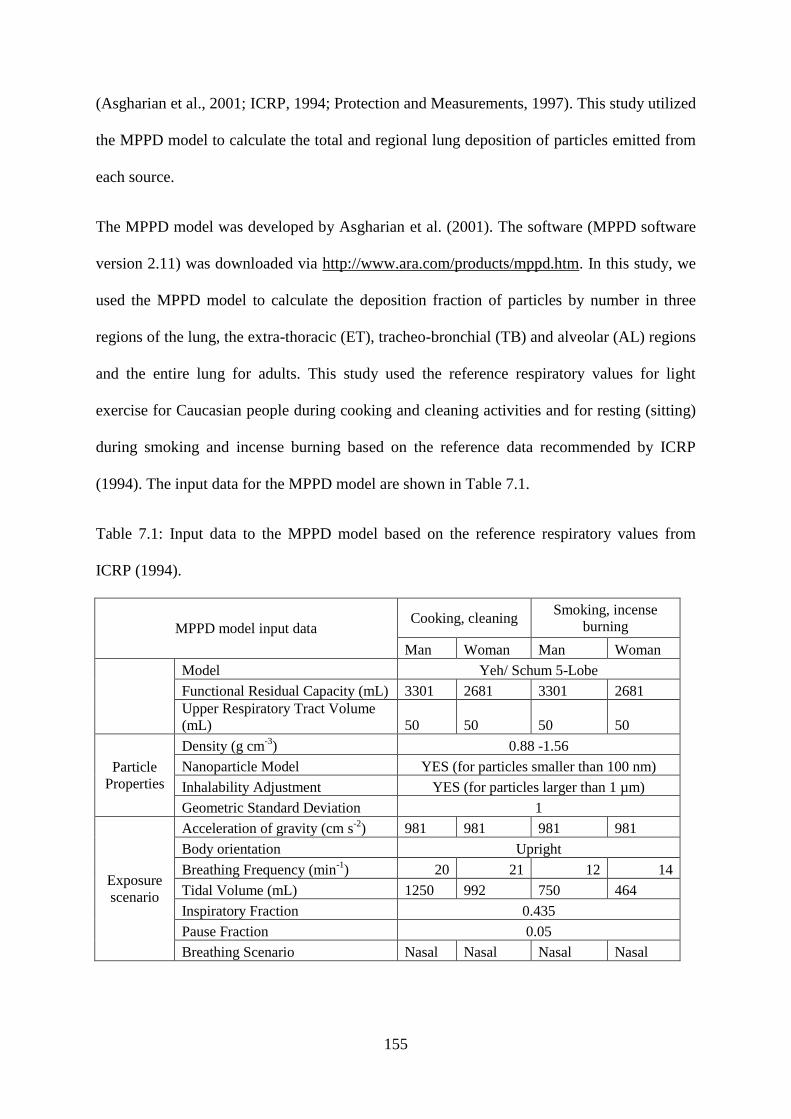
155
(Asgharian et al., 2001; ICRP, 1994; Protection and Measurements, 1997). This study utilized
the MPPD model to calculate the total and regional lung deposition of particles emitted from
each source.
The MPPD model was developed by Asgharian et al. (2001). The software (MPPD software
version 2.11) was downloaded via http://www.ara.com/products/mppd.htm. In this study, we
used the MPPD model to calculate the deposition fraction of particles by number in three
regions of the lung, the extra-thoracic (ET), tracheo-bronchial (TB) and alveolar (AL) regions
and the entire lung for adults. This study used the reference respiratory values for light
exercise for Caucasian people during cooking and cleaning activities and for resting (sitting)
during smoking and incense burning based on the reference data recommended by ICRP
(1994). The input data for the MPPD model are shown in Table 7.1.
Table 7.1: Input data to the MPPD model based on the reference respiratory values from
ICRP (1994).
MPPD model input data Cooking, cleaning
Smoking, incense
burning
Man Woman Man Woman
Model Yeh/ Schum 5-Lobe
Functional Residual Capacity (mL) 3301 2681 3301 2681
Upper Respiratory Tract Volume
(mL) 50 50 50 50
Particle
Properties
Density (g cm-3
) 0.88 -1.56
Nanoparticle Model YES (for particles smaller than 100 nm)
Inhalability Adjustment YES (for particles larger than 1 µm)
Geometric Standard Deviation 1
Exposure
scenario
Acceleration of gravity (cm s-2
) 981 981 981 981
Body orientation Upright
Breathing Frequency (min-1
) 20 21 12 14
Tidal Volume (mL) 1250 992 750 464
Inspiratory Fraction 0.435
Pause Fraction 0.05
Breathing Scenario Nasal Nasal Nasal Nasal
156
However, the MPPD model may under-estimate the lung deposition of ambient particles if
their hygroscopic properties are not taken into account (Vu et al., 2015a). In order to correct
for the influence of particle hygroscopicity, the MPPD curves were modified for both indoor
and outdoor particles with consideration of their hygroscopicity according to an approach
introduced by previous studies (Kristensson et al., 2013; Londahl et al., 2009; Vu et al.,
2015a).
In this approach, submicron particles which have increased to their equilibrium size by their
growth in the regional lung have the same deposition fraction in the respiratory system as
hydrophobic particles with an identical size. Because no information was available for the
hygroscopic growth factor for coarse particles, this study only calculated the deposition
fraction of submicron particles (Dp <1 µm) by number. However, the deposition fraction of
submicron particles by number is not significantly different to that of total particles since the
submicron particles accounted for more than 99% of total particles by number.
7.3. Results and discussion
7.3.1. Particle Size Distributions
7.3.1.1. Outdoor/indoor background levels
The total number concentration for outdoor and indoor levels (with no indoor sources) was
4.2 ± 2.1 × 10³ and 3.3 ± 1.3 × 10
3 particles cm
-3, respectively. As shown in Figure 7.2, the
particle number size distribution of both outdoor and indoor particles appears to be the sum
of log-normal size modes. The number mode for outdoor and indoor particle size
distributions was 22.9 and 28.4 nm, respectively. The majority of particles by number (84.0%
and 80.2% of total outdoor and indoor particles respectively) was found in the ultrafine size
range (Dp <100 nm).
157
7.3.1.2. Vacuum cleaning
The peak particle number concentration was 9.4 × 10⁴ particles cm
-3, which decreased to 7.08
× 104 particles cm
-3 by the fifteenth minute after cleaning stopped. The particle number size
distribution shows a unimodal distribution with the mode at 19.8 nm. This mode increased to
22.9 nm and 26.5 nm at 15 and 30 minutes after the activity stopped. More than 98% of total
particles by number were found in the ultrafine particle size range (Dp <100 nm) during
vacuum cleaning. This high number of ultrafine particles emitted from the vacuum cleaner is
consistent with previous studies (Géhin et al., 2008; Knibbs et al., 2011; Wu et al., 2011).
Knibbs et al. (2011) investigated particle emissions from 21 vacuum cleaners in a flow tunnel
and found that the median emission rate of ultrafine particles was 9.92 × 10⁹ particles min
-1,
with a median value of CMD (count median diameter) of 25.5 nm.
In terms of mass concentration, vacuum cleaning also generated a large fraction of coarse
particles. The peak PM1.0, PM2.5 and PM10 mass concentrations were 1.5, 22.7 and 75.4 µg
m-3
. Szymczak et al. (2007) suggest that particles are in part generated by mechanical
abrasion of the graphite brushes and copper commutator. However, the major source of
ultrafine particles may be due to the spark discharging that occurs at voltages above 100V
between two carbon electrodes within the vacuum cleaner motor (Helsper et al., 1993;
Szymczak et al., 2007). Knibbs et al. (2011) reported lower ultrafine particle emissions with
two battery-driven vacuum cleaners at lower voltages (14 and 22 V).
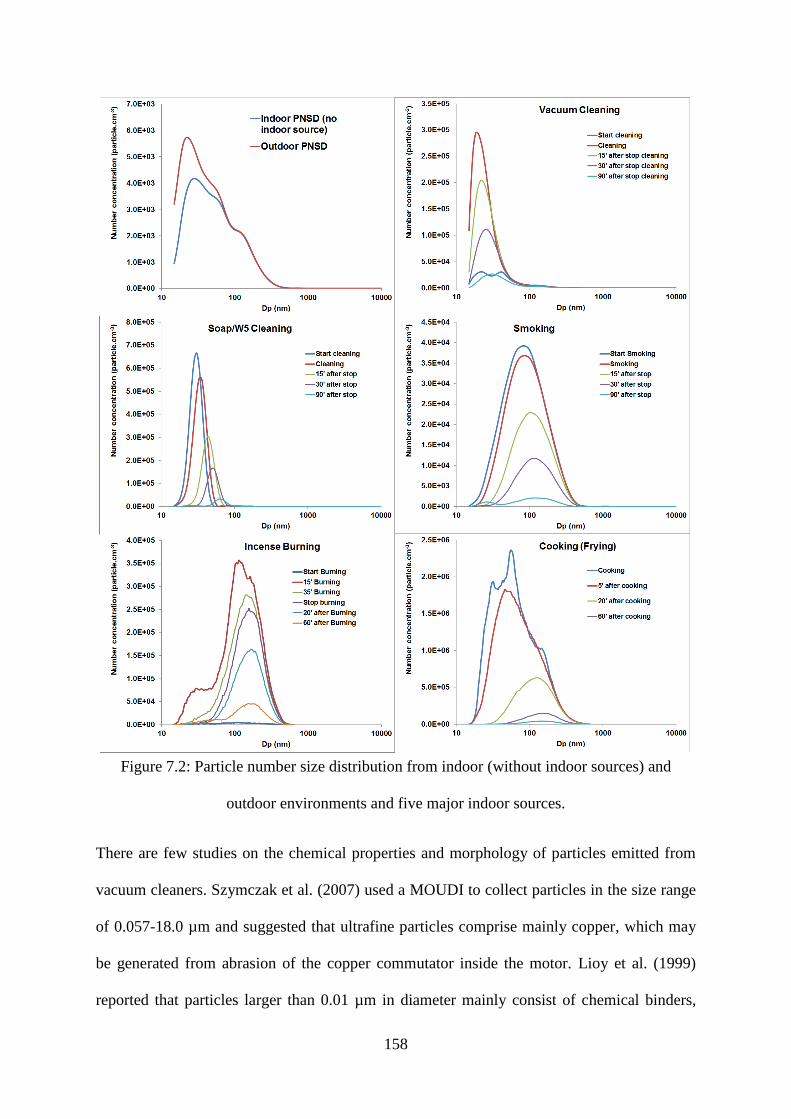
158
Figure 7.2: Particle number size distribution from indoor (without indoor sources) and
outdoor environments and five major indoor sources.
There are few studies on the chemical properties and morphology of particles emitted from
vacuum cleaners. Szymczak et al. (2007) used a MOUDI to collect particles in the size range
of 0.057-18.0 µm and suggested that ultrafine particles comprise mainly copper, which may
be generated from abrasion of the copper commutator inside the motor. Lioy et al. (1999)
reported that particles larger than 0.01 µm in diameter mainly consist of chemical binders,
159
copper and carbon (elemental and organic) which were induced by rubbing and arcing
between carbon rods and the copper commutator. In this study, the effective density of
vacuum cleaner generated particles obtained by the APS/SMPS merging algorithm was 1.16
g cm-3
which was much lower than the material density of carbon ( ~2 g cm-3
) and copper (8
g cm-3
). This finding suggests that particles released from the vacuum cleaner motor were
possibly carbon internal void aggregates (DeCarlo et al., 2004; Helsper et al., 1993; Lioy et
al., 1999) which have a lower effective density.
7.3.1.3. Kitchen cleaning by soap/W5 spray cleaner
As seen in Figure 7.2, kitchen top cleaning using organic compounds (brand name:W5
cleaner) generated predominantly ultrafine particles with a maximum concentration of 1.25 ×
105
particle cm-3
and a peak number mode of 30.6 nm. As with the vacuum cleaning, the
count median diameter CMD increased and particle number concentration decreased rapidly
due to coagulation and deposition processes after the cleaning activity finished.
Cleaning using chemical cleaners also generated both ultrafine and coarse particles. Average
PM1.0, PM2.5 and PM10 mass concentrations during cleaning activity were 2.5, 10.4 and 22.0
µg m-3
, respectively. On the other hand, nano/ultrafine particles were probably produced by
the oxidation and condensation of volatile organic compounds (VOCs) released from the
cleaning agent during the cleaning activity (Nazaroff and Weschler, 2004; Rohr, 2013; Singer
et al., 2006a; Zhu et al., 2001). Singer et al. (2006b) reported that a large amount of VOCs
were found using pine-oil cleaner. They reported a concentration measured overone hour of
10–1300 µg m-3
for individual terpenoids, including -terpinene (90–120µg m-3
), d-limonene
(1000–1100 µg m-3
), terpinolene (900–1300 µg m-3
), and -terpineol (260–700 µg m-3
). In
addition, Sarwar et al. (2004) found that terpenes from cleaning products can react with
ozone, resulting in secondary organic aerosol production in an indoor environment.
160
This study used W5 orange cleaner, which contains some surface active components (not
specified in the details on the product label), soap and limonene. In general, limonene has
been identified to play an important role in the formation of indoor nanoparticles (Langer et
al., 2008; Wainman et al., 2000; Wang et al., 2007b; Waring et al., 2011). Langer et al.
(2008) showed that the nucleation and growth of particles from the reaction of O3 and
limonene could occur even at a low concentration of reactants. The effective density obtained
by the APS/SMPS merging process was 0.88 g cm-3
, indicating that the majority of particles
generated by use of cleaning products were predominantly organic.
7.3.1.4. Tobacco smoking
The particle number size distribution from cigarette smoking showed a unimodal structure
with a mode at 90 nm and peak number concentration of 2.89 × 10⁴ particles cm
-3 (note that
two cigarettes were simultaneously smoked by regular smokers in this experiment). During
the ageing process, the CMD increased to 120 nm, as shown in Figure 7.2. These results are
consistent with previous studies (Hussein et al., 2006; Wu et al., 2011). Wu et al. (2011)
measured the submicron particle number size distribution emitted from five brands of
cigarettes and found that the number mode ranged from 102.9 to 116.7 nm with the
maximum number concentration of 1.38 × 10⁶ particles cm
-3. The number concentration of
particles is not only dependent on the emission rate of the source, but also the volume of the
chamber or the indoor environment where the smoking takes place, and the ventilation.
Fine particles (Dp< 2.5 µm) emitted from cigarette smoking were found to make a dominant
contribution to mass concentration, with an averaged fraction of more than 82% of total PM10
mass. Averaged PM1.0, PM2.5 and PM10 concentrations were 3.2, 133.6 and 149.6 µg m-3
,
respectively. In a review of indoor particles, Wallace (1996) indicated that the most important
indoor source of fine and coarse particles in the US was tobacco smoking, with an estimated
161
increase of up to 45 µg m-3
in homes with smokers. The effective density of cigarette smoke
particles was 1.56 g cm-3
based on APS/SMPS merging results. This value was slightly lower
than the material density of black carbon (~2g cm-3
) and similar to the effective density of
humic acids and humic-like substances (1.54-1.77 g cm-3
) from wood burning (Dinar et al.,
2006).
7.3.1.5. Incense burning and cooking
Incense burning generated the majority of particles in the accumulation mode, with a CMD of
around 110-150 nm. The total number concentration was up to 2.25 × 10⁵ particles cm
-3. In
the first scan of incense burning, it showed a distinct mode at 30.5 nm, suggesting that some
nanoparticles were formed in the first few minutes of burning.
The number size distribution of particles released during incense burning was in agreement
with previous studies. Wu et al. (2011) measured particle number size distributions from five
types of incense stick and found that four of them had a CMD ranging from 124.1 to 148.9
nm and the other had a CMD of 75.5 nm. A similar study conducted by Ji et al. (2010)
reported that the peak number mode of incense smoke was 136 nm, which was found to have
a larger size distribution in comparison to other combustion processes such as diesel, wood or
biomass burning. Unfortunately, the APS sampler had a problem with its inlet during
measurement of particle size for incense burning and cooking, hence this study could not
measure the coarse size for incense burning and cooking emissions. In this study, we adopted
an effective density of 1.1 and 1.0 g cm-3
to convert the mobility to aerodynamic diameter for
incense burning and cooking particles respectively based upon (Buonanno et al., 2009; Ji et
al., 2010).
Cooking emissions showed a tri-modal distribution, with a peak mode at 47.8 nm. After
cooking, the peak mode quickly increased to 135.8 nm. The reason is probably related to the
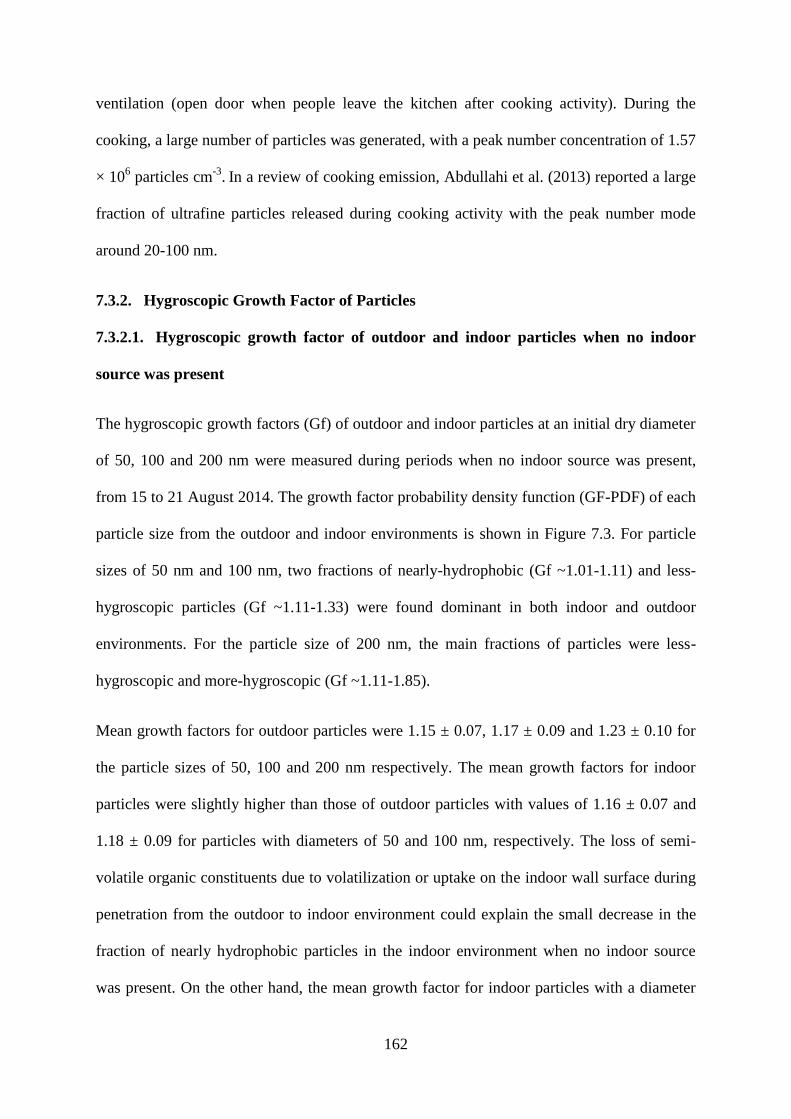
162
ventilation (open door when people leave the kitchen after cooking activity). During the
cooking, a large number of particles was generated, with a peak number concentration of 1.57
× 106 particles cm
-3. In a review of cooking emission, Abdullahi et al. (2013) reported a large
fraction of ultrafine particles released during cooking activity with the peak number mode
around 20-100 nm.
7.3.2. Hygroscopic Growth Factor of Particles
7.3.2.1. Hygroscopic growth factor of outdoor and indoor particles when no indoor
source was present
The hygroscopic growth factors (Gf) of outdoor and indoor particles at an initial dry diameter
of 50, 100 and 200 nm were measured during periods when no indoor source was present,
from 15 to 21 August 2014. The growth factor probability density function (GF-PDF) of each
particle size from the outdoor and indoor environments is shown in Figure 7.3. For particle
sizes of 50 nm and 100 nm, two fractions of nearly-hydrophobic (Gf ~1.01-1.11) and less-
hygroscopic particles (Gf ~1.11-1.33) were found dominant in both indoor and outdoor
environments. For the particle size of 200 nm, the main fractions of particles were less-
hygroscopic and more-hygroscopic (Gf ~1.11-1.85).
Mean growth factors for outdoor particles were 1.15 ± 0.07, 1.17 ± 0.09 and 1.23 ± 0.10 for
the particle sizes of 50, 100 and 200 nm respectively. The mean growth factors for indoor
particles were slightly higher than those of outdoor particles with values of 1.16 ± 0.07 and
1.18 ± 0.09 for particles with diameters of 50 and 100 nm, respectively. The loss of semi-
volatile organic constituents due to volatilization or uptake on the indoor wall surface during
penetration from the outdoor to indoor environment could explain the small decrease in the
fraction of nearly hydrophobic particles in the indoor environment when no indoor source
was present. On the other hand, the mean growth factor for indoor particles with a diameter
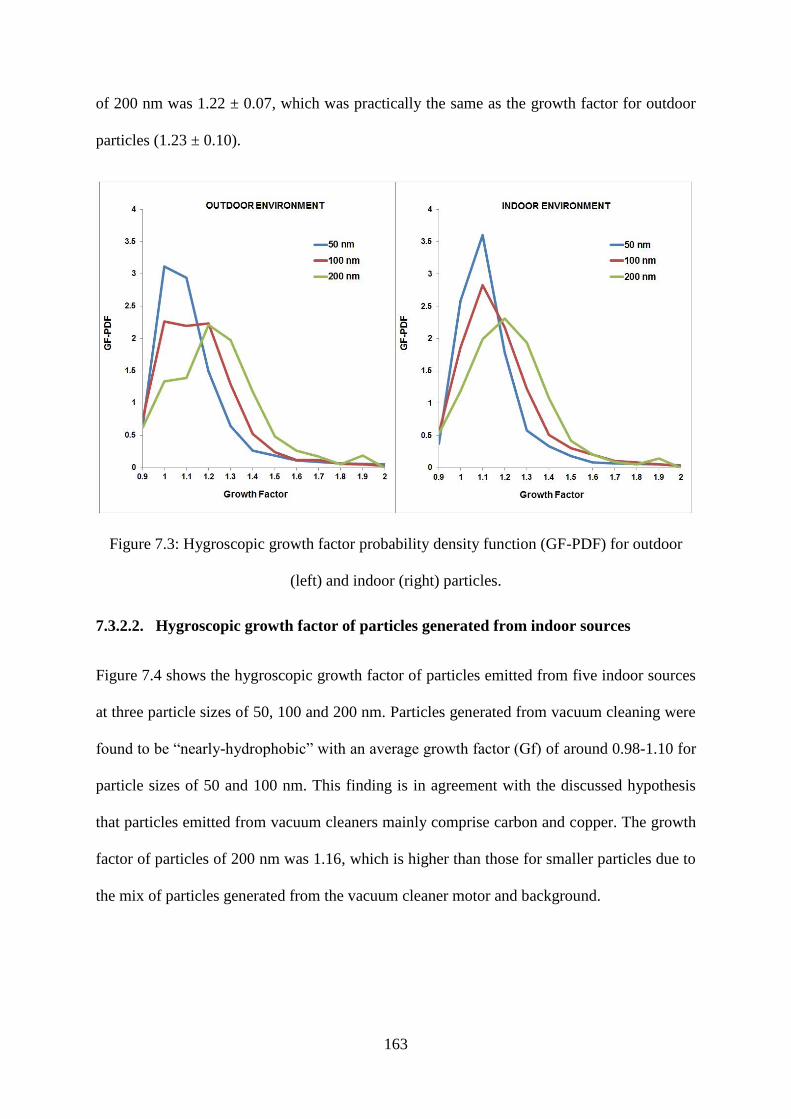
163
of 200 nm was 1.22 ± 0.07, which was practically the same as the growth factor for outdoor
particles (1.23 ± 0.10).
Figure 7.3: Hygroscopic growth factor probability density function (GF-PDF) for outdoor
(left) and indoor (right) particles.
7.3.2.2. Hygroscopic growth factor of particles generated from indoor sources
Figure 7.4 shows the hygroscopic growth factor of particles emitted from five indoor sources
at three particle sizes of 50, 100 and 200 nm. Particles generated from vacuum cleaning were
found to be “nearly-hydrophobic” with an average growth factor (Gf) of around 0.98-1.10 for
particle sizes of 50 and 100 nm. This finding is in agreement with the discussed hypothesis
that particles emitted from vacuum cleaners mainly comprise carbon and copper. The growth
factor of particles of 200 nm was 1.16, which is higher than those for smaller particles due to
the mix of particles generated from the vacuum cleaner motor and background.
164
Figure 7.4: Hygroscopic growth factor of particles generated from different indoor sources.
Particles emitted from soap/W5 cleaner were found to be “less-hygroscopic” (Gf ~1.12-1.15
for particles at 50 and 100 nm). This finding is consistent with the above suggestion that the
ultrafine particles generated by cleaning activities using soap/W5 cleaner predominantly
consist of organic compounds such as the products of oxidation of limonene. Virkkula et al.
(1999)conducted a measurement of the hygroscopic properties of aerosol formed by
oxidation of limonene, α-pinene, and β-pinene, and found that the hygroscopic growth factor
was approximately 1.10 at 84% RH, consistent with our results. The hygroscopic growth
factor of particles of 200 nm was 1.22. This high growth factor could also be explained by the
mix of particles generated from cleaning activities and background in the large size range,
while the majority of particles during this activity were found in the ultrafine size range.
The average hygroscopic growth factors of particles emitted from cigarette smoking were
approximately 1.01- 1.04 for all sizes of 50, 100 and 200 nm. This hygroscopic growth factor
is found slightly to be higher than diesel combustion (Gf ~1.01), but lower than biomass
burning (Gf ~1.04-1.10). This low hygroscopic growth factor is probably due to the chemical
properties of particles generated from combustion, which mainly comprise black carbon and
organic compounds. Morawska et al. (2005) found a similar count median diameter for both
inhaled and exhaled submicron particles, suggesting that the change in particle size after its
165
travel into the lung is not significant. However, the lack of growth of particles cannot be
concluded with certainty due to different temperature and humidity regimes between the
chamber and the lung. Li and Hopke (1993) found the hygroscopic growth factor of cigarette
mainstream and sidestream smoke particles at 200 nm was approximately 1.40-1.42 at RH
99.5%, which was slightly higher than the estimated growth factor value in our study (Gf
~1.3 for Dp =200 nm at 99.5% humidity calculated from Gf ~1.04 at 90% measured by
HTDMA).
Similarly, particles emitted from incense burning were found to be nearly hydrophobic with
the hygroscopic growth factors ranging from 1.01 to 1.05 for all particle sizes of 50, 100 and
200 nm. A dominance of carbonaceous particles released from incense burning can explain
those low hygroscopic growth factors. Wang et al. (2007a) measured the characteristics of air
pollutants from incense burning in two temples in Hong Kong and found that the organic and
elemental carbon accounted for around 60% of PM2.5 mass, while inorganic ion species only
accounted for 12% of PM2.5 mass. Li and Hopke (1993) predicted that the hygroscopic
growth factor of particles at 99.5% RH from the burning of incense was around 1.45 and 1.7
for particle sizes of 100 and 200 nm, while the values in our estimation were much lower (Gf
~1.16 and 1.31 for particles of 100 and 200 nm at 99.5% RH). Li and Hopke (1993) indicated
that 8% errors were found in their estimation of the hygroscopic growth ratio mainly due to
the humidity uncertainty in their HTDMA system. Furthermore, variations in particle
composition and influences of the local environment may account for differences when
measuring the hygroscopic growth factor of combustion aerosols.
Particles generated from cooking activity were found to be nearly-hydrophobic (Gf ~1.0-1.02
for all particle sizes of 50, 100 and 200 nm). In our study, we performed the cooking
experiments by frying sausages with sunflower oil and toasting bread. This result is
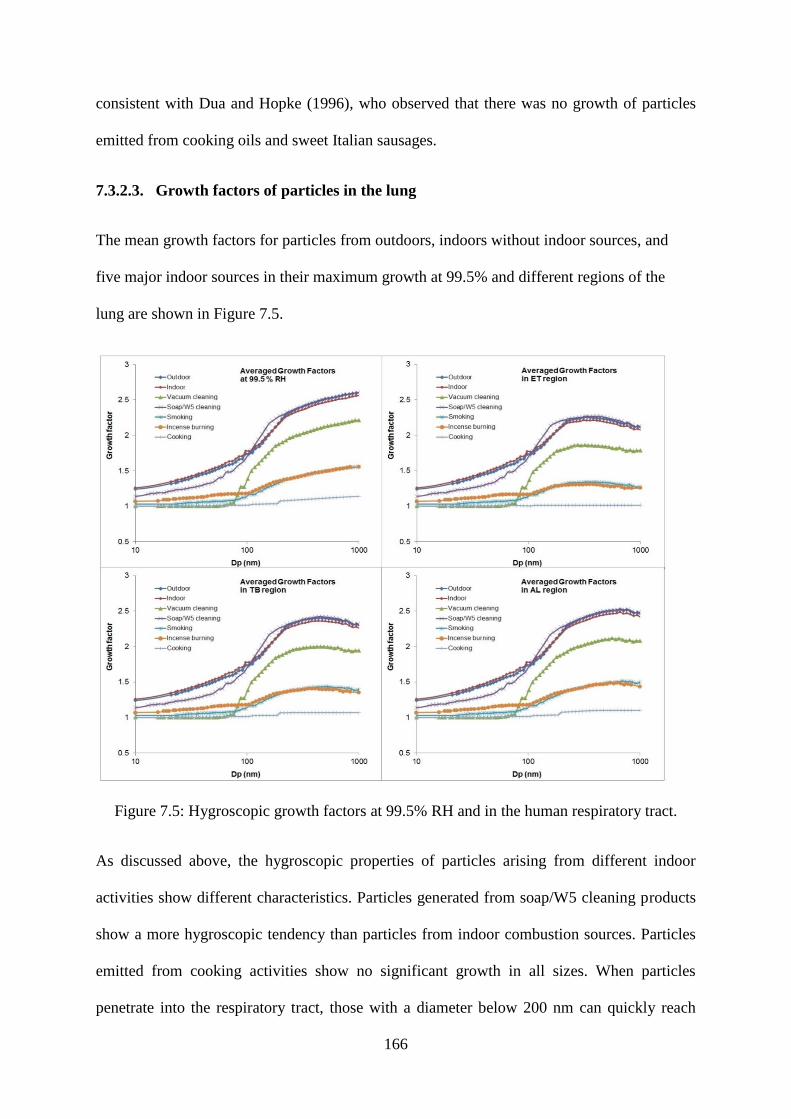
166
consistent with Dua and Hopke (1996), who observed that there was no growth of particles
emitted from cooking oils and sweet Italian sausages.
7.3.2.3. Growth factors of particles in the lung
The mean growth factors for particles from outdoors, indoors without indoor sources, and
five major indoor sources in their maximum growth at 99.5% and different regions of the
lung are shown in Figure 7.5.
Figure 7.5: Hygroscopic growth factors at 99.5% RH and in the human respiratory tract.
As discussed above, the hygroscopic properties of particles arising from different indoor
activities show different characteristics. Particles generated from soap/W5 cleaning products
show a more hygroscopic tendency than particles from indoor combustion sources. Particles
emitted from cooking activities show no significant growth in all sizes. When particles
penetrate into the respiratory tract, those with a diameter below 200 nm can quickly reach
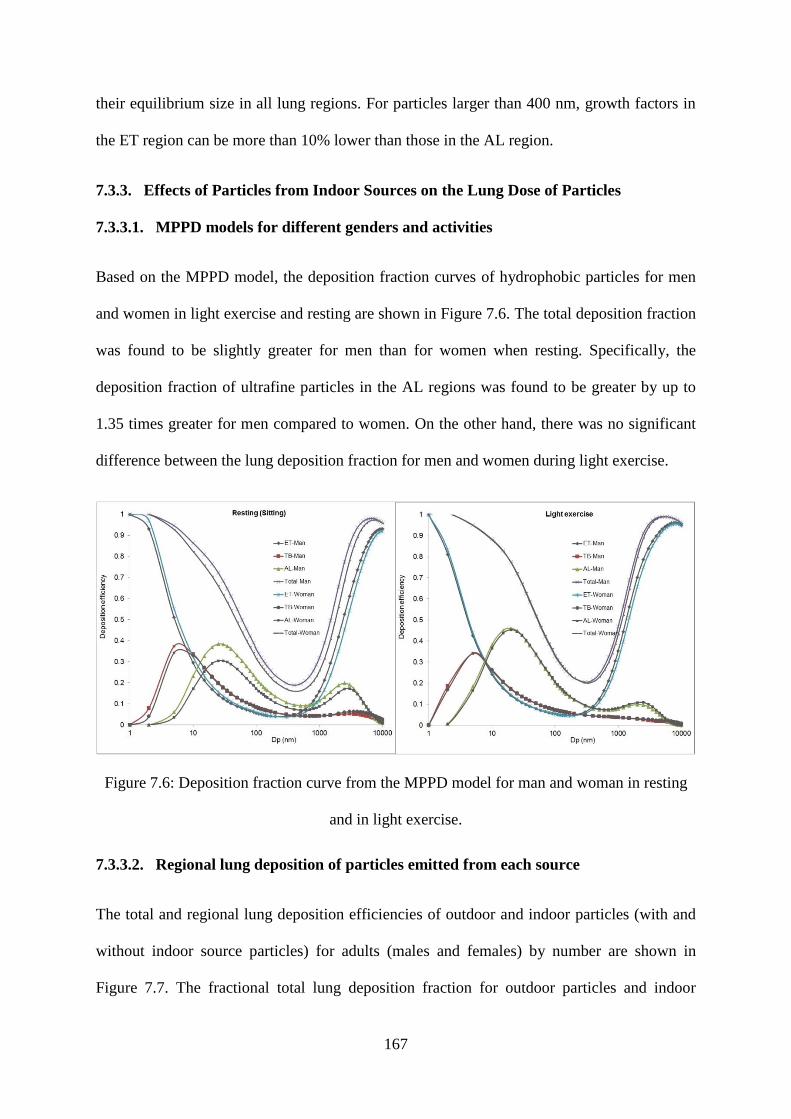
167
their equilibrium size in all lung regions. For particles larger than 400 nm, growth factors in
the ET region can be more than 10% lower than those in the AL region.
7.3.3. Effects of Particles from Indoor Sources on the Lung Dose of Particles
7.3.3.1. MPPD models for different genders and activities
Based on the MPPD model, the deposition fraction curves of hydrophobic particles for men
and women in light exercise and resting are shown in Figure 7.6. The total deposition fraction
was found to be slightly greater for men than for women when resting. Specifically, the
deposition fraction of ultrafine particles in the AL regions was found to be greater by up to
1.35 times greater for men compared to women. On the other hand, there was no significant
difference between the lung deposition fraction for men and women during light exercise.
Figure 7.6: Deposition fraction curve from the MPPD model for man and woman in resting
and in light exercise.
7.3.3.2. Regional lung deposition of particles emitted from each source
The total and regional lung deposition efficiencies of outdoor and indoor particles (with and
without indoor source particles) for adults (males and females) by number are shown in
Figure 7.7. The fractional total lung deposition fraction for outdoor particles and indoor
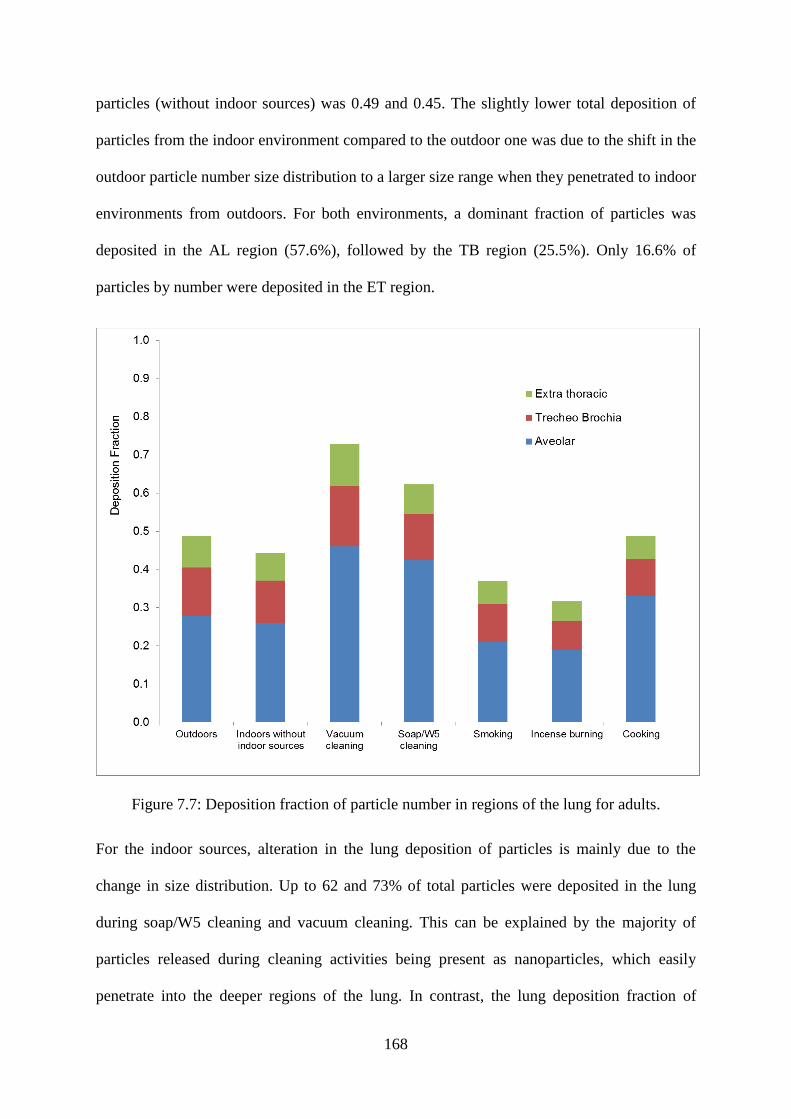
168
particles (without indoor sources) was 0.49 and 0.45. The slightly lower total deposition of
particles from the indoor environment compared to the outdoor one was due to the shift in the
outdoor particle number size distribution to a larger size range when they penetrated to indoor
environments from outdoors. For both environments, a dominant fraction of particles was
deposited in the AL region (57.6%), followed by the TB region (25.5%). Only 16.6% of
particles by number were deposited in the ET region.
Figure 7.7: Deposition fraction of particle number in regions of the lung for adults.
For the indoor sources, alteration in the lung deposition of particles is mainly due to the
change in size distribution. Up to 62 and 73% of total particles were deposited in the lung
during soap/W5 cleaning and vacuum cleaning. This can be explained by the majority of
particles released during cleaning activities being present as nanoparticles, which easily
penetrate into the deeper regions of the lung. In contrast, the lung deposition fraction of
169
particles emitted from indoor combustion sources such as cooking, incense burning or
smoking was lower because the main fraction of particles by number was found in the larger
size range, particularly in the Aitken range, for cooking and the accumulation mode for
incense burning or cigarette smoking. The total lung deposition fractions were 0.49, 0.32 and
0.37 for indoor particles generated during cooking, incense burning and smoking. For these
particles, a predominance of deposited particles by number was found in the AL region (56.7-
68.1%), followed by the TB region (19.5-27.0%). Only 12.2-16.2% of total deposited
particles by number were found in the ET region.
7.3.3.3. Discussion of the contribution of indoor sources to the lung dose of aerosols
In order to determine and compare the effects of indoor sources upon human exposure, this
study has compared the lung dose rate of particles by number in the indoor environment with
and without indoor activities. The lung dose of particle number in different regions of the
lung (i) within a specific particle size range was calculated based on the following equation
(Hussein et al., 2013):
Dosei, = VE*DFi*CN*Δt (7.7)
where, VE is the minute ventilation (m3/min); DFi is the deposited fraction of particles in the
different regions of the human respiratory tract; CN is the total number concentration (particle
cm-3
); and Δt is the exposure time period (minutes). The respiratory tract deposition particle
dose rate, which is defined as the total particle number deposited in the respiratory system
during a specific time period (in this study, Δt was set up to 1 minute), can be estimated from:
Minute dose ratei, = VE*DFi*CN (7.8)
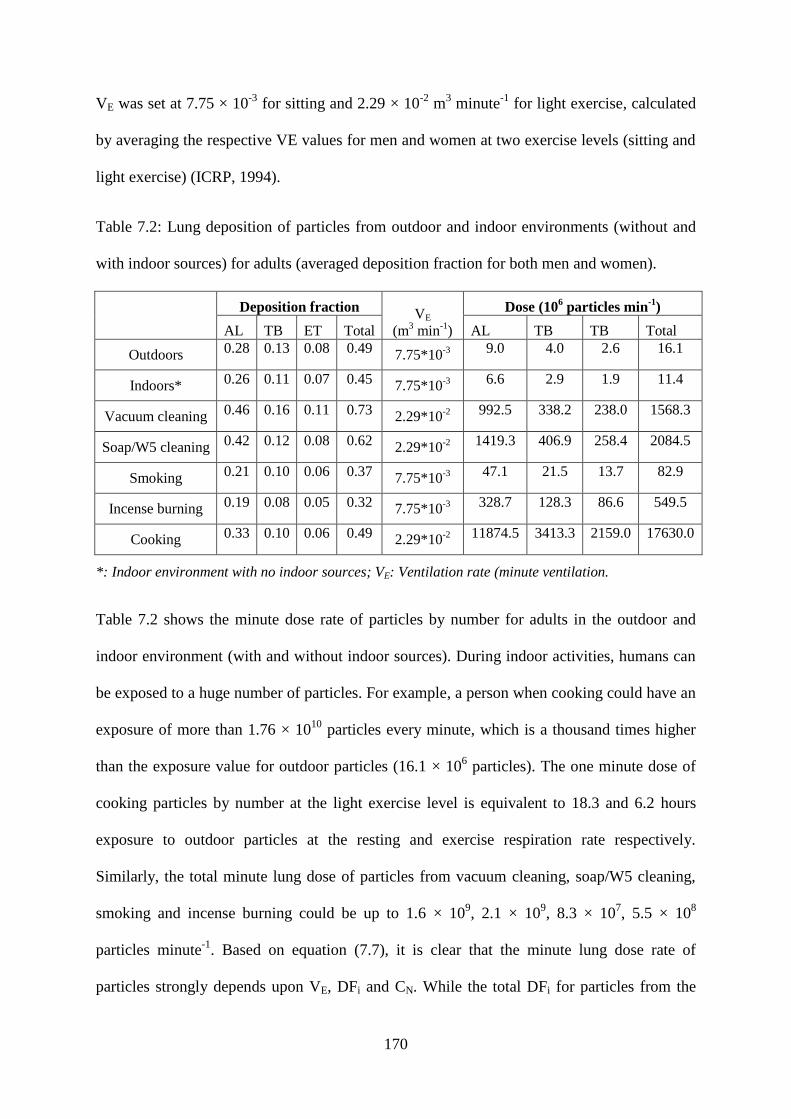
170
VE was set at 7.75 × 10⁻³
for sitting and 2.29 × 10⁻²
m3 minute
-1 for light exercise, calculated
by averaging the respective VE values for men and women at two exercise levels (sitting and
light exercise) (ICRP, 1994).
Table 7.2: Lung deposition of particles from outdoor and indoor environments (without and
with indoor sources) for adults (averaged deposition fraction for both men and women).
Deposition fraction VE
(m3 min
-1)
Dose (106 particles min
-1)
AL TB ET Total AL TB TB Total
Outdoors 0.28 0.13 0.08 0.49
7.75*10-3 9.0 4.0 2.6 16.1
Indoors* 0.26 0.11 0.07 0.45
7.75*10-3 6.6 2.9 1.9 11.4
Vacuum cleaning 0.46 0.16 0.11 0.73
2.29*10-2 992.5 338.2 238.0 1568.3
Soap/W5 cleaning 0.42 0.12 0.08 0.62
2.29*10-2 1419.3 406.9 258.4 2084.5
Smoking 0.21 0.10 0.06 0.37
7.75*10-3 47.1 21.5 13.7 82.9
Incense burning 0.19 0.08 0.05 0.32 7.75*10-3 328.7 128.3 86.6 549.5
Cooking 0.33 0.10 0.06 0.49 2.29*10-2 11874.5 3413.3 2159.0 17630.0
*: Indoor environment with no indoor sources; VE: Ventilation rate (minute ventilation.
Table 7.2 shows the minute dose rate of particles by number for adults in the outdoor and
indoor environment (with and without indoor sources). During indoor activities, humans can
be exposed to a huge number of particles. For example, a person when cooking could have an
exposure of more than 1.76 × 10¹⁰
particles every minute, which is a thousand times higher
than the exposure value for outdoor particles (16.1 × 10⁶ particles). The one minute dose of
cooking particles by number at the light exercise level is equivalent to 18.3 and 6.2 hours
exposure to outdoor particles at the resting and exercise respiration rate respectively.
Similarly, the total minute lung dose of particles from vacuum cleaning, soap/W5 cleaning,
smoking and incense burning could be up to 1.6 × 10⁹, 2.1 × 10
9, 8.3 × 10
7, 5.5 × 10
8
particles minute-1
. Based on equation (7.7), it is clear that the minute lung dose rate of
particles strongly depends upon VE, DFi and CN. While the total DFi for particles from the
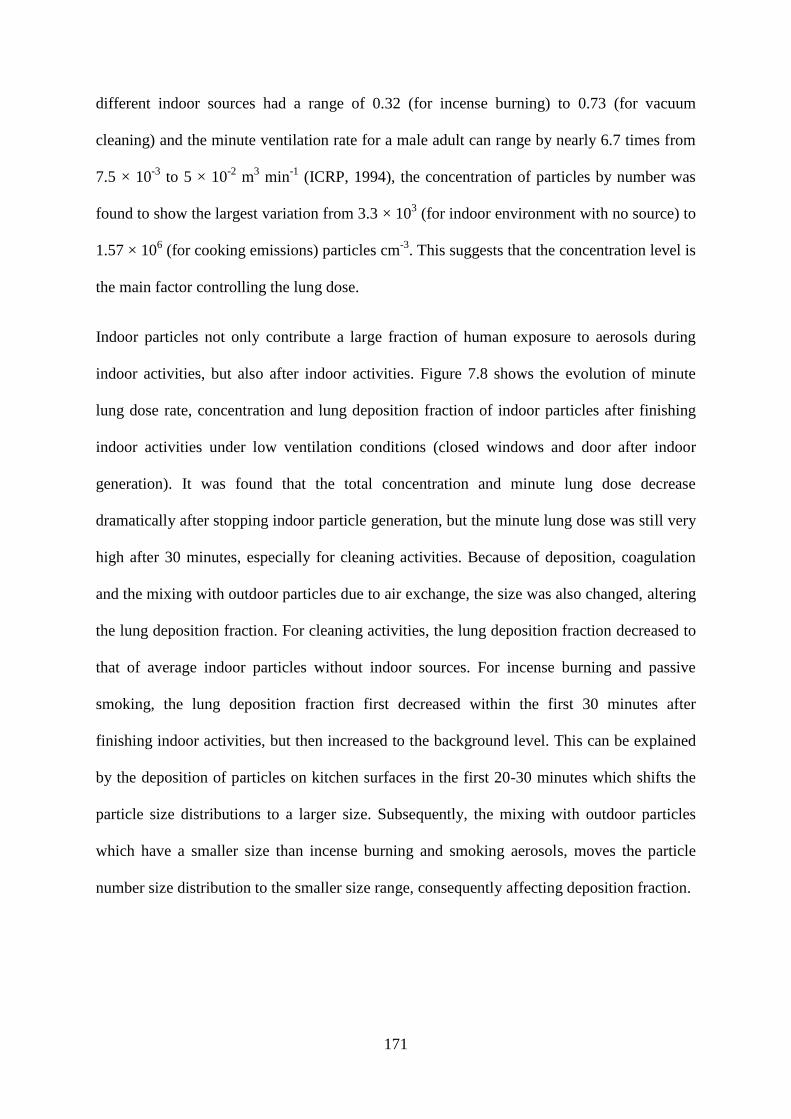
171
different indoor sources had a range of 0.32 (for incense burning) to 0.73 (for vacuum
cleaning) and the minute ventilation rate for a male adult can range by nearly 6.7 times from
7.5 × 10⁻³
to 5 × 10⁻²
m3 min
-1 (ICRP, 1994), the concentration of particles by number was
found to show the largest variation from 3.3 × 10³ (for indoor environment with no source) to
1.57 × 10⁶ (for cooking emissions) particles cm
-3. This suggests that the concentration level is
the main factor controlling the lung dose.
Indoor particles not only contribute a large fraction of human exposure to aerosols during
indoor activities, but also after indoor activities. Figure 7.8 shows the evolution of minute
lung dose rate, concentration and lung deposition fraction of indoor particles after finishing
indoor activities under low ventilation conditions (closed windows and door after indoor
generation). It was found that the total concentration and minute lung dose decrease
dramatically after stopping indoor particle generation, but the minute lung dose was still very
high after 30 minutes, especially for cleaning activities. Because of deposition, coagulation
and the mixing with outdoor particles due to air exchange, the size was also changed, altering
the lung deposition fraction. For cleaning activities, the lung deposition fraction decreased to
that of average indoor particles without indoor sources. For incense burning and passive
smoking, the lung deposition fraction first decreased within the first 30 minutes after
finishing indoor activities, but then increased to the background level. This can be explained
by the deposition of particles on kitchen surfaces in the first 20-30 minutes which shifts the
particle size distributions to a larger size. Subsequently, the mixing with outdoor particles
which have a smaller size than incense burning and smoking aerosols, moves the particle
number size distribution to the smaller size range, consequently affecting deposition fraction.
172
Figure 7.8: Minute lung dose rates, concentrations and lung deposition fractions of particles
after different indoor activities.
173
Uncertainty for minute dose rate calculation
As shown in equation (8), the uncertainty for minute dose rate calculation depends upon the
variation of minute ventilation (VE), deposition fraction (DF), and particle number
concentration (CN). In this study, the minute ventilation is assumed as a constant value for
each activity. Therefore, the uncertainty in the minute dose rate calculation can be estimated
from the uncertainties in the lung deposition fraction and particle number concentration. The
relative standard error of lung deposition fractions of particles generated from each indoor
source mainly depends on the variation of input size distribution, and subject difference such
as gender, and lung structure. Since the MPPD model does not provide estimates of
uncertainty, this study could only estimate the errors caused by the variation of particle
number size distribution and gender. The estimated relative standard deviations of total lung
deposition fraction calculated for vacuum cleaning, soap/W5 cleaning, smoking, incense
burning and cooking particles were 2.7, 4.8, 8.1, 9.4 and 4.1%, respectively.
The uncertainty in particle number concentrations measured for each source depends on the
variation of particle number concentrations obtained by each SMPS measurement scan during
the period of indoor source generation. The cleaning, smoking, incense burning and cooking
experiments were performed during a period of approximately 10, 5, 60 and 20 minutes
respectively. Each SMPS measurement combined two SMPS scans during 5 minutes. The
relative standard deviation was estimated by dividing the standard deviation by the average
number concentration of particles measured during each activity. The estimated relative
standard deviation for particle number concentration measurement was 17.4, 9.4, 7.1, 22.3,
14.4% for vacuum cleaning, soap/W5 cleaning, smoking, incense burning and cooking
measurements. By combination of the relative standard deviation for lung deposition
fractions and particle number concentrations, the uncertainty in the minute lung dose rate was
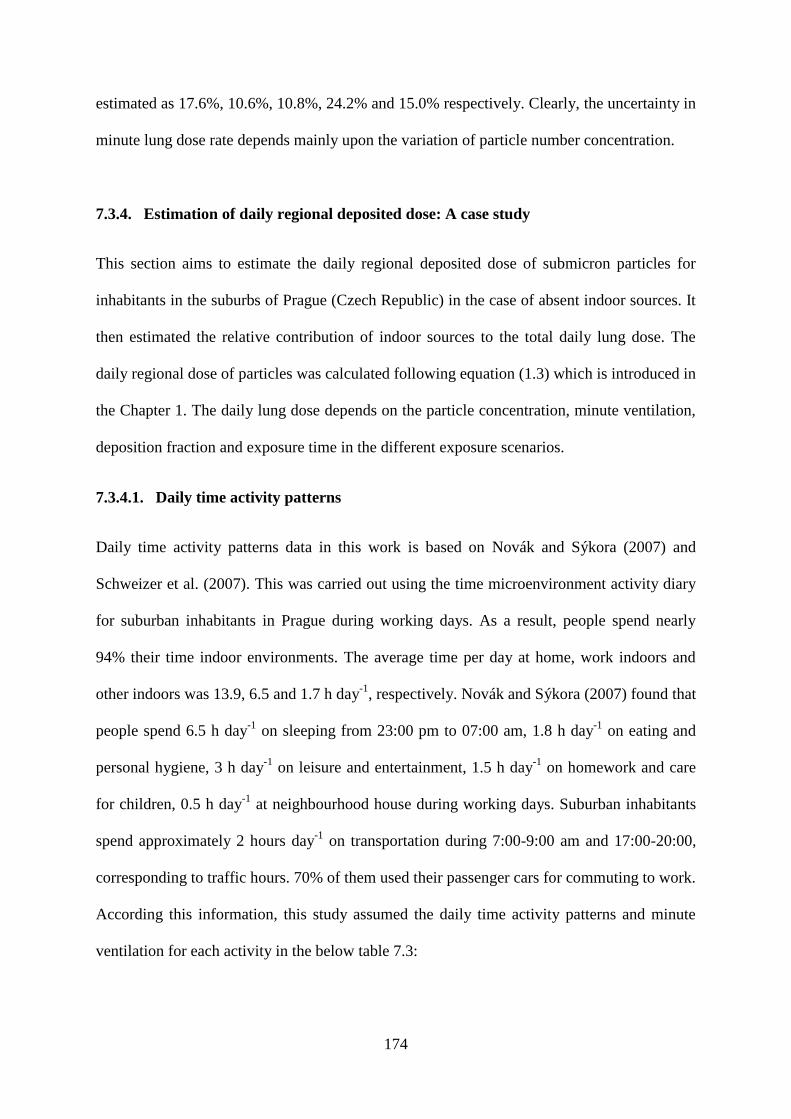
174
estimated as 17.6%, 10.6%, 10.8%, 24.2% and 15.0% respectively. Clearly, the uncertainty in
minute lung dose rate depends mainly upon the variation of particle number concentration.
7.3.4. Estimation of daily regional deposited dose: A case study
This section aims to estimate the daily regional deposited dose of submicron particles for
inhabitants in the suburbs of Prague (Czech Republic) in the case of absent indoor sources. It
then estimated the relative contribution of indoor sources to the total daily lung dose. The
daily regional dose of particles was calculated following equation (1.3) which is introduced in
the Chapter 1. The daily lung dose depends on the particle concentration, minute ventilation,
deposition fraction and exposure time in the different exposure scenarios.
7.3.4.1. Daily time activity patterns
Daily time activity patterns data in this work is based on Novák and Sýkora (2007) and
Schweizer et al. (2007). This was carried out using the time microenvironment activity diary
for suburban inhabitants in Prague during working days. As a result, people spend nearly
94% their time indoor environments. The average time per day at home, work indoors and
other indoors was 13.9, 6.5 and 1.7 h day-1
, respectively. Novák and Sýkora (2007) found that
people spend 6.5 h day-1
on sleeping from 23:00 pm to 07:00 am, 1.8 h day-1
on eating and
personal hygiene, 3 h day-1
on leisure and entertainment, 1.5 h day-1
on homework and care
for children, 0.5 h day-1
at neighbourhood house during working days. Suburban inhabitants
spend approximately 2 hours day-1
on transportation during 7:00-9:00 am and 17:00-20:00,
corresponding to traffic hours. 70% of them used their passenger cars for commuting to work.
According this information, this study assumed the daily time activity patterns and minute
ventilation for each activity in the below table 7.3:
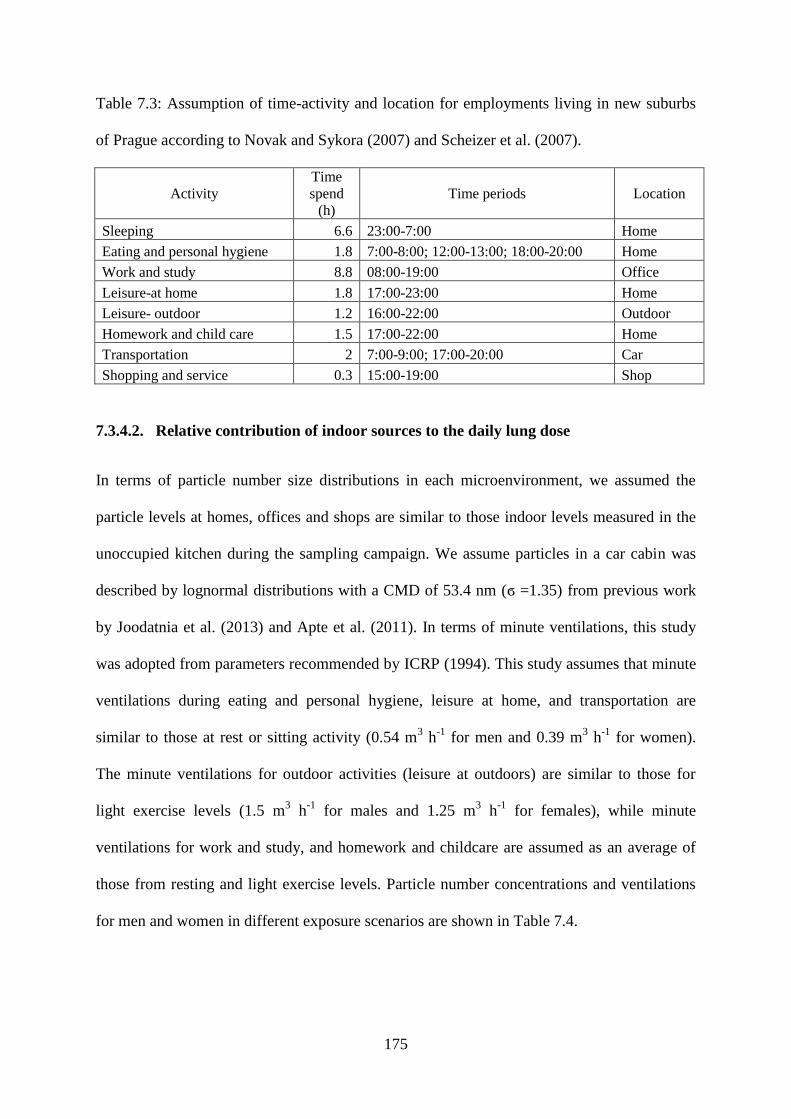
175
Table 7.3: Assumption of time-activity and location for employments living in new suburbs
of Prague according to Novak and Sykora (2007) and Scheizer et al. (2007).
Activity
Time
spend
(h)
Time periods Location
Sleeping 6.6 23:00-7:00 Home
Eating and personal hygiene 1.8 7:00-8:00; 12:00-13:00; 18:00-20:00 Home
Work and study 8.8 08:00-19:00 Office
Leisure-at home 1.8 17:00-23:00 Home
Leisure- outdoor 1.2 16:00-22:00 Outdoor
Homework and child care 1.5 17:00-22:00 Home
Transportation 2 7:00-9:00; 17:00-20:00 Car
Shopping and service 0.3 15:00-19:00 Shop
7.3.4.2. Relative contribution of indoor sources to the daily lung dose
In terms of particle number size distributions in each microenvironment, we assumed the
particle levels at homes, offices and shops are similar to those indoor levels measured in the
unoccupied kitchen during the sampling campaign. We assume particles in a car cabin was
described by lognormal distributions with a CMD of 53.4 nm (ϭ =1.35) from previous work
by Joodatnia et al. (2013) and Apte et al. (2011). In terms of minute ventilations, this study
was adopted from parameters recommended by ICRP (1994). This study assumes that minute
ventilations during eating and personal hygiene, leisure at home, and transportation are
similar to those at rest or sitting activity (0.54 m3 h
-1 for men and 0.39 m
3 h
-1 for women).
The minute ventilations for outdoor activities (leisure at outdoors) are similar to those for
light exercise levels (1.5 m3 h
-1 for males and 1.25 m
3 h
-1 for females), while minute
ventilations for work and study, and homework and childcare are assumed as an average of
those from resting and light exercise levels. Particle number concentrations and ventilations
for men and women in different exposure scenarios are shown in Table 7.4.
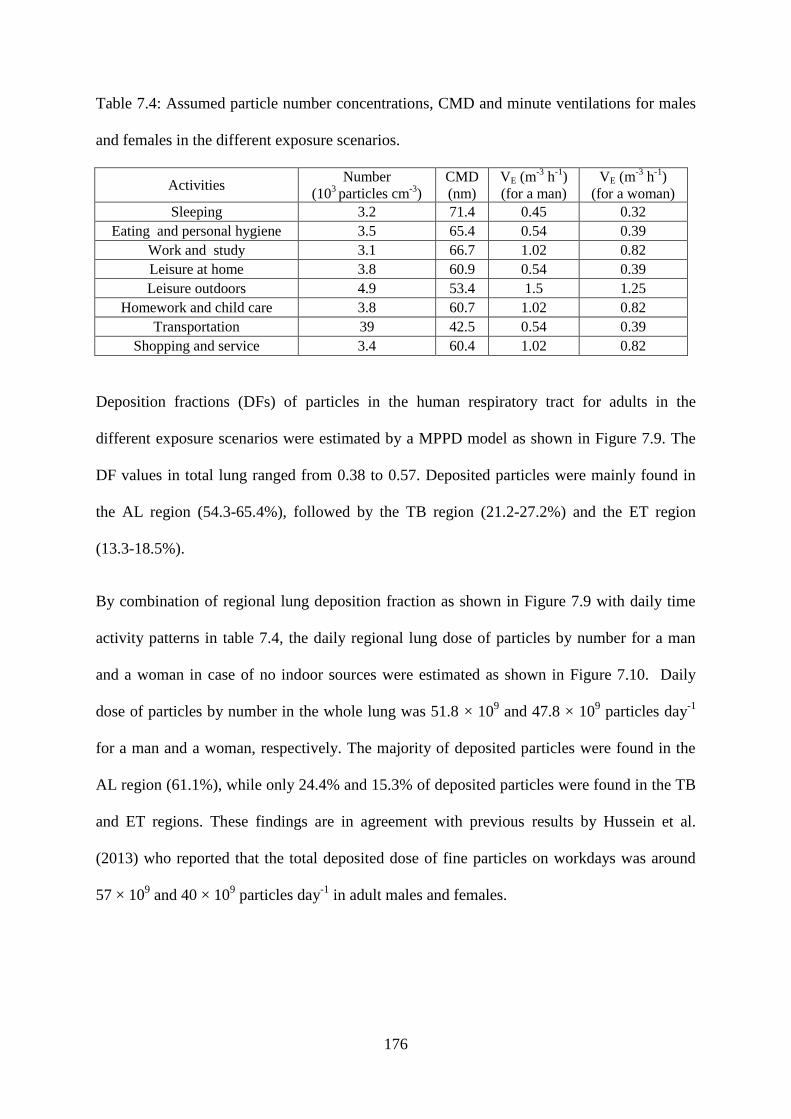
176
Table 7.4: Assumed particle number concentrations, CMD and minute ventilations for males
and females in the different exposure scenarios.
Activities Number
(103 particles cm
-3)
CMD
(nm)
VE (m-3
h-1
)
(for a man)
VE (m-3
h-1
)
(for a woman)
Sleeping 3.2
71.4 0.45 0.32
Eating and personal hygiene 3.5
65.4 0.54 0.39
Work and study 3.1
66.7 1.02 0.82
Leisure at home 3.8
60.9 0.54 0.39
Leisure outdoors 4.9
53.4 1.5 1.25
Homework and child care 3.8
60.7 1.02 0.82
Transportation 39
42.5 0.54 0.39
Shopping and service 3.4
60.4 1.02 0.82
Deposition fractions (DFs) of particles in the human respiratory tract for adults in the
different exposure scenarios were estimated by a MPPD model as shown in Figure 7.9. The
DF values in total lung ranged from 0.38 to 0.57. Deposited particles were mainly found in
the AL region (54.3-65.4%), followed by the TB region (21.2-27.2%) and the ET region
(13.3-18.5%).
By combination of regional lung deposition fraction as shown in Figure 7.9 with daily time
activity patterns in table 7.4, the daily regional lung dose of particles by number for a man
and a woman in case of no indoor sources were estimated as shown in Figure 7.10. Daily
dose of particles by number in the whole lung was 51.8 × 10⁹ and 47.8 × 10
9 particles day
-1
for a man and a woman, respectively. The majority of deposited particles were found in the
AL region (61.1%), while only 24.4% and 15.3% of deposited particles were found in the TB
and ET regions. These findings are in agreement with previous results by Hussein et al.
(2013) who reported that the total deposited dose of fine particles on workdays was around
57 × 109 and 40 × 10
9 particles day
-1 in adult males and females.
177
Figure 7.9: Deposition fractions of particles in lung regions for a man and a woman in the
different exposure scenarios.
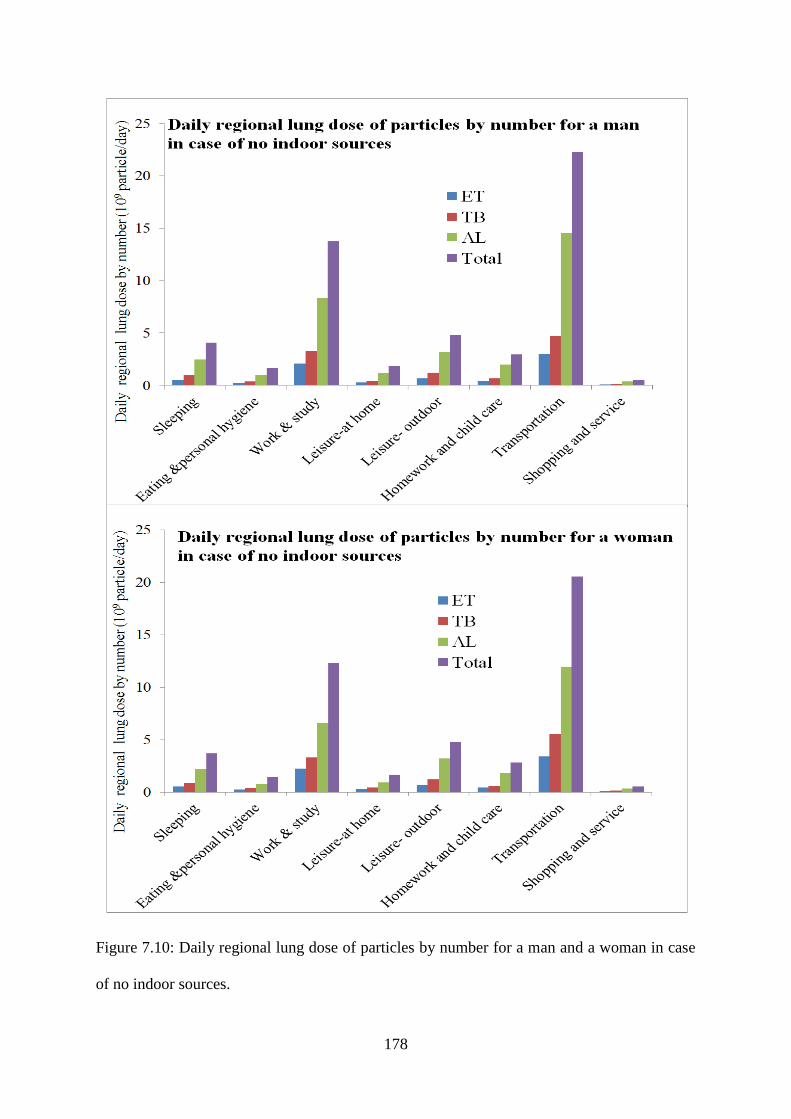
178
Figure 7.10: Daily regional lung dose of particles by number for a man and a woman in case
of no indoor sources.
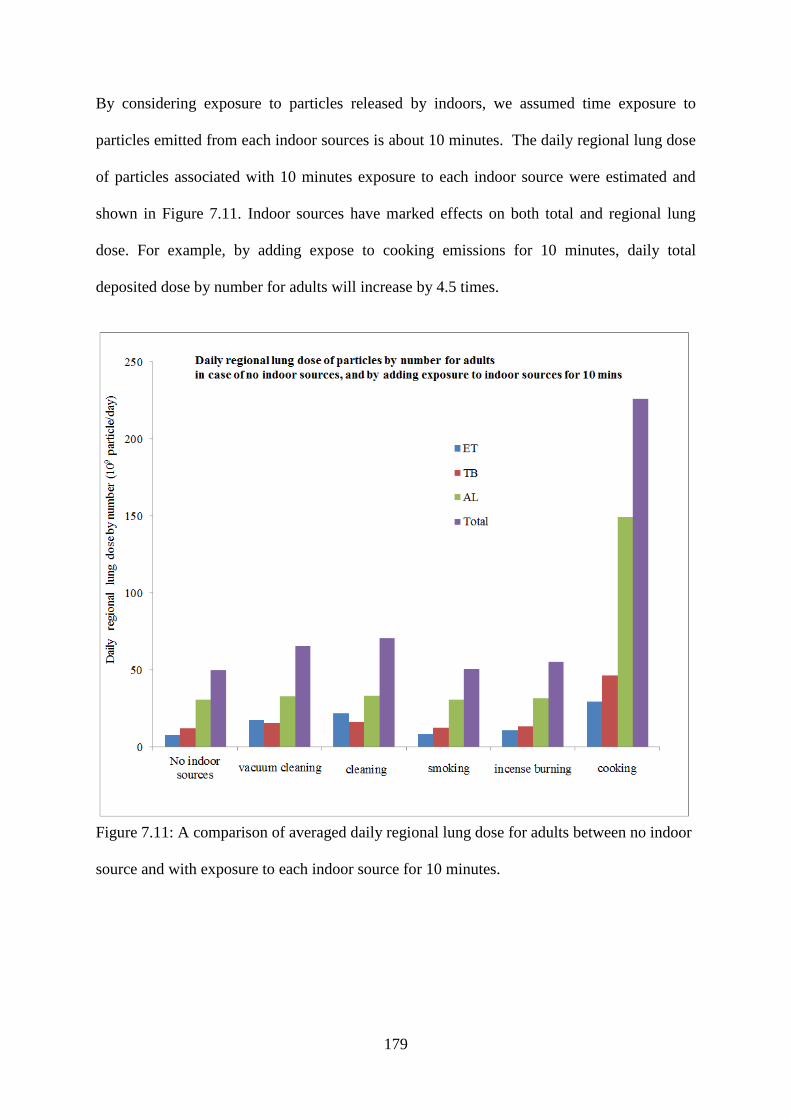
179
By considering exposure to particles released by indoors, we assumed time exposure to
particles emitted from each indoor sources is about 10 minutes. The daily regional lung dose
of particles associated with 10 minutes exposure to each indoor source were estimated and
shown in Figure 7.11. Indoor sources have marked effects on both total and regional lung
dose. For example, by adding expose to cooking emissions for 10 minutes, daily total
deposited dose by number for adults will increase by 4.5 times.
Figure 7.11: A comparison of averaged daily regional lung dose for adults between no indoor
source and with exposure to each indoor source for 10 minutes.
180
7.4. Conclusion
Particles released from indoor activities have many physical properties such as concentration,
particle size, particle density and hygroscopicity which are relevant to determining lung
deposition. Particles generated from vacuum cleaning and soap/W5 cleaning activities are
mainly distributed in the nano size range while those from incense burning and cigarette
smoking were found predominantly in the accumulation mode, and those from cooking
activity were found in the Aitken mode. Most of the particles released from indoor sources
were nearly-hydrophobic, except the particles from soap/W5 cleaning, which were less-
hygroscopic. Particles from cleaning activities showed very high total lung deposition
fraction by number. This was up to 0.73 and 0.66 for vacuum cleaner and soap/W5 cleaning
particles, respectively.
Particles are predicted to deposit by number mainly in the AL region, followed by the TB
region. This study found that people could be exposed to high aerosol concentrations due to
indoor sources. The minute lung dose of particles during indoor source episodes was found
to be much greater than the indoor background level without an indoor source. The total
minute lung dose rate of particles from vacuum cleaning, soap/W5 cleaning, smoking and
incense burning could be up to 1.6 × 10⁹, 2.2 × 10
9, 7.2 × 10
7, 5.4 × 10
8 particles minute
-1
respectively, while those for average outdoor and indoor background levels were 1.4 × 10⁷
and 1.0 × 10⁷
particles minute-1
. This suggests that indoor sources may make the main
contribution to the total lung dose of indoor particles expressed by number.
181
CHAPTER 8: CONCLUSION
8.1. Summary
In summary, this study has investigated the physical properties (particle number size
distribution, hygroscopicity and effective density) of particles measured in different
microenvironments, including both outdoor and indoor sources. These properties play very
important roles in determining the dose of particles in the human respiratory system. In
addition, this study successfully utilized particle number size distributions to apportion the
sources of particles using a PMF model. The dynamic processes of particles between outdoor
and indoor environments were addressed.
Particle number size distributions were measured at ambient sites (traffic, urban background,
and rural areas), microenvironments (a house and, a flat) and a chamber (brake rig test).
Atmospheric particle size distributions generated from multiple sources can be described as a
sum of log-normal distributions. Each source displays a characteristic modal structure such
as peak mode or count median diameter. After emission from the source, particles are subject
to various dynamic processes, such as nucleation, coagulation, deposition, condensation or
evaporation, which alter their sizes. By number, ultrafine particles, the main contributors to
particle number concentration in urban areas, accounted for the majority of particles emitted
from combustion sources. Formation of nanoparticles (Dp< 30 nm) has been found from both
outdoor sources (i.e. brake emissions) and indoor sources (i.e. cleaning activities). In
addition, a mass balance model was used to predict indoor particle size distributions from
outdoor PNSD data sets. It was found that a mass balance model can not only accurately
predict indoor PNSDs, but can also help us estimate the loss rates of particles. These loss
rates depend greatly on both particle size and concentrations. Smaller particles have higher
182
loss rates. Deposition, coagulation and evaporation play important roles in the determination
of indoor PNSDs in a house heavily affected by road traffic emissions.
The typical hygroscopicity of particles shows a wide variation of growth factors among
different environments, depending upon local sources and air masses. In urban environments,
hydrophobic and less-hygroscopic particles were dominant whereas more-hygroscopic
particles were ubiquitous in marine environments. The dominant hydrophobic and less-
hygroscopic particles in the urban environments could be explained by the sources of
particles at these sites, where traffic-related emissions were found to be the main source of
urban ultrafine particles. Freshly emitted traffic particles and biomass burning particles were
hydrophobic or less-hygroscopic, whilst growth factors were found to increase during ageing.
This study investigated the hygroscopic properties of particles measured in both outdoor and
indoor environments in Prague, Czech Republic. The hygroscopic factor of a particle was
found to be a function of its size. Large particles, which normally consist of more-
hygroscopic particles, had higher growth factors than small ones. For particles with diameters
of 50 nm and 100 nm, two fractions of nearly-hydrophobic (Gf ~1.01-1.11) and less-
hygroscopic particles (Gf ~1.11-1.33) were found to be dominant in both indoor and outdoor
environments. For particles with diameter of 200 nm, the main fractions of particles were
less-hygroscopic and more-hygroscopic particles (Gf ~1.11-1.85). The hygroscopic
properties of particles generated from five major indoor sources, including cleaning activities,
tobacco smoking, incense burning and cooking, were studied. Most of the particles released
from those sources were nearly-hydrophobic, apart from those from soap/W5 cleaning, which
were less-hygroscopic. Based on the merger of SMPS and APS data sets, the effective
densities of particles from outdoor and indoor environments, and five indoor sources were
also investigated. Effective density has no significant effects on the regional lung dose of
ultrafine particles because the main deposition mechanism of these particles is diffusion.
183
This study developed an approach to calculating the dose of particles by considering particle
growth in the human respiratory tract due to its hygroscopic properties. It was found that the
hygroscopic properties of particles have marked effects, not only on total lung deposition but
also on the regional lung deposition of particles, leading to a variation in DFs between the
sampling environments. This study estimated the lung deposition fractions of submicron
particles emitted from different environments and sources. By number, the lung deposition
fractions of particles released from cleaning activities were much higher than those of
particles from combustion sources (cooking, incense burning or tobacco smoking). Indoor
sources were major contributors to the total daily lung dose of particles by number.
Furthermore, the study combined the PMF and ICRP models to apportion the sources of the
lung dose of ambient submicron particles in the human respiratory system (Figure 8.1). It
was found that traffic emissions were the most common ambient source of submicron
particles deposited by number into the human respiratory tract. They accounted for 67.8% of
particles deposited in the total lung by number at the North Kensington site. In terms of
regional lung dose, they represented 59%, 68.5% and 70.8% of the total particle number
deposited in the ET, TB and AL regions, respectively. Secondary aerosols contributed only
approximately 5.1% of submicron particles deposited in the total lung by number, but they
represented a major source of particles deposited in the regions and total lung by volume. In
terms of deposited particles by surface area, secondary aerosols were found most dominant in
the ET region, while the main contributors in the TB, and AL regions were traffic emissions
and urban accumulation mode.
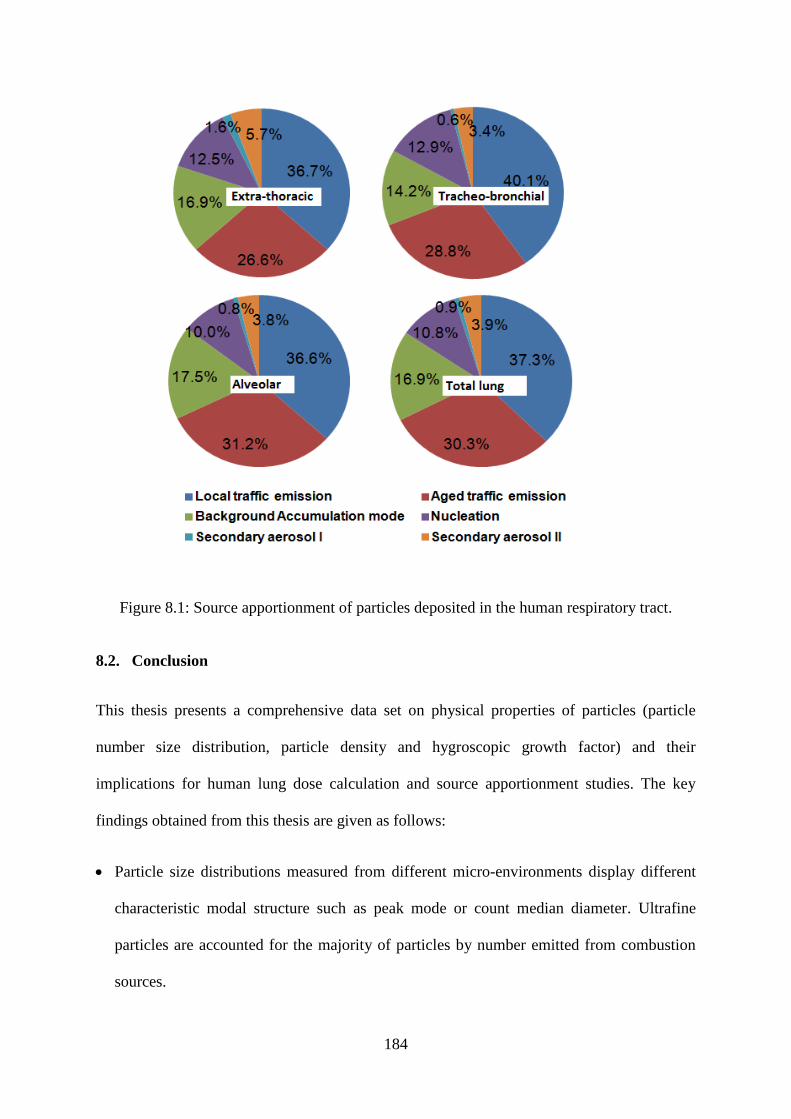
184
Figure 8.1: Source apportionment of particles deposited in the human respiratory tract.
8.2. Conclusion
This thesis presents a comprehensive data set on physical properties of particles (particle
number size distribution, particle density and hygroscopic growth factor) and their
implications for human lung dose calculation and source apportionment studies. The key
findings obtained from this thesis are given as follows:
Particle size distributions measured from different micro-environments display different
characteristic modal structure such as peak mode or count median diameter. Ultrafine
particles are accounted for the majority of particles by number emitted from combustion
sources.
185
Hygroscopic properties of particles plays an important role for the calculation of the
human regional lung dose of particles, particularly for larger particles (Dp >200 nm).
Most of the particles released from major indoor sources (vacuum cleaning, smoking,
incense burning and cooking) were nearly-hydrophobic, apart from those from
soap/W5 cleaning, which were less-hygroscopic.
The sources of ambient particles deposited in the human respiratory system were
successfully estimated by application of both PMF and ICRP models on the PNSD
data set. It concludes that traffic emissions were the most common ambient source of
submicron particles deposited by number into the human respiratory tract at urban
background area.
Indoor sources have marked effects on daily lung dose of particles in the human
respiratory system. For example, daily total deposited dose by number for adults will
increase by 4.5 times by adding exposure to cooking emissions for only 10 minutes.
8.3. Implications
This work has made an extensive study of the physical properties of particles. These
properties not only provide us with information on atmospheric processes, but they also play
vital roles in source apportionment and human exposure studies.
In terms of the source apportionment studies of particles, it has been shown that the sources
of particles can be identified by running a PMF model on their number size distributions. In
addition, we can apportion the sources of particles in the human respiratory tract based on an
application of lung dose models to the PMF results. These findings are useful in identifying
which sources are most relevant for deposited particles in the human respiratory tract by
different metrics (number, surface area and volume). This therefore helps policy makers to
186
make decisions on the control of particulate matter. For instance, we should consider traffic
emissions first in order to reduce ambient particles by number due their predominant
contribution (59.0 - 70.8 %) in both the total and regional lung, whereas we need to consider
secondary aerosols and urban accumulation mode mostly urban combustion, if the reduction
target is submicron particles by mass.
In terms of human exposure studies, it has been shown that the deposition fraction of particles
depends greatly on their size and hygroscopic properties. As a result, particles emitted from
different sources shows different deposition fractions in the human respiratory system due to
their different size distribution and hygroscopic properties. Estimating the total and regional
lung dose of particles can help people control the risk of aerosols. Moreover, this work can be
utilized in the toxicology of aerosols.
8.4. Limitations and Future directions
In the study, we have estimated the regional lung dose of particles from ambient
environments and indoor sources using the ICRP and MPPD models with consideration of
their hygroscopic properties and densities. However, one limitation of the work is that the
analysis of size distributions is limited to those within the range of the SMPS. In addition, the
H-TDMA system can measure the hygroscopic properties of submicron particles only and
therefore particle dose (especially for volume/mass) due to the larger size fractions is not
considered. In future studies, the lung dose of large particles should be estimated. (Harrison
et al., 2010) suggest that lung dose, not mass metrics (PM2.5 and PM10), is the key metric to
determine the health outcomes of particle exposure. Hence, this could be usefully linked to
epidemiological studies in order to evaluate the consequences of the doses estimated.
Another limitation of this work is that the effects of morphology and the composition of
particles on their deposition fraction in the human respiratory tract have not fully considered.
187
In future studies, a new deposition approach with consideration of particle shape and
chemical composition, is needed to estimate the regional lung dose of non-spherical aerosols.
In the brake rig test experiments, this study used a closed chamber. However, the PNSD of
brake ware particles could be changed due to the dilution with different air ventilation by
wind in the real scenarios. And the temperature of pad should be higher in the real scenarios
than the lab experiments by the heat transfer from car engine through the shaft. Therefore, in
the next experiments PNSD of brake ware particles should be measured in an open chamber
with well control of air ventilation and temperature. In addition, more particle number size
distributions in other microenvironments such as offices, schools or other working places
should be collected in order to estimate the daily lung dose. The lung dose calculation of
chemical species associated with aerosols, which can maybe help us understand the toxicity
of aerosols, should be addressed in future work.
188
LIST OF RESEARCH PAPERS AND PRESENTATIONS
Peer-reviewed Articles
[1] Vu, T.V., J., Ondráček, V., Ždímal, Delgado-Saborit, J.M., Harrison, R. M. (2016).
Physical properties and lung deposition of particles emitted from five major indoor sources.
Air Quality, Atmosphere & Health journal (accepted).
[2] Vu, T. V., Beddows, D.C.S, Delgado-Saborit, J. M., Harrison, R. M. (2016). Source
apportionment of the lung dose of ambient submicrometre particulate matter. Aerosol and Air
Quality Research, DOI: 10.4209/aaqr.2015.09.0553.
[3] Masiol, M., Vu, T.V., Beddows, D.C.S, Harrison, R.M. (2016). Source apportionment of
wide range particle size spectra and black carbon collected at the airport of Venice (Italy).
Atmospheric Environment (accepted).
[4] Vu, T. V., Delgado-Saborit, J. M., Harrison, R. M. (2015). A review of hygroscopic
growth factors of submicron aerosols from different sources and its implication for
calculation of lung deposition efficiency of ambient aerosols. Air Quality, Atmosphere &
Health, 8 (5), 429 - 440.
[5] Vu, T. V., Delgado-Saborit, J. M., Harrison, R. M. (2015). A review of particle number
size distributions from seven major sources and implications for source apportionment
studies. Atmospheric Environment, 122, 114-132.
Peer-Reviewed Journal Articles in Progress
[6] Vu, T.V., Zauli-Sajani, S., Delgado-Saborit, J.M., Harrison, R. M. Loss processes
affecting submicrometre particles in a house heavily affected by road traffic emissions (In
manuscript preparation).
189
Conferences Presentation
[1] Vu, T.V., Delgado-Saborit, J.M., Sajani, S.Z, Harrison, R. M. Evaluation of a mass
balance model for predicting the penetration, deposition and infiltration rate of submicron
particles to the indoor environment. The 4th UK & Ireland Exposure Science Conference,
Buxton, UK.
[2] Fonseca, A.S., Talbot, N., Schwarz, J., Ondráček, J., Ždímal, V., Kozáková, J., Viana M.,
Karanasiou, A., Querol, X., Alastuey, A., Vu, T.V., Delgado-Saborit, J.M., Harrison, R. M.
(2016). Intercomparison of four different cascade impactors for fine and ultrafine particle
sampling in two European locations. European Aerosol Conference (EAC), Milan, Italy
[3] Vu, T.V., Beddows, D.C.S., Sanderson, P., Delgado-Saborit, J.M., Olatunbosun, O.,
Crooks M.,Harrison, R.M (2015). An investigation into the particle size distribution collected
from an automotive brake caliper test rig. European Aerosol Conference (EAC), Milan, Italy.
[4] Masiol, M., Harrison, R.M., Vu, T.V., Squizzato, S., Visin, F (2015) Source
apportionment of chemically resolved PM2.5 and particle size spectra collected downwind of
London Heathrow (UK): Preliminary results. European Aerosol Conference (EAC), Milan,
Italy.
[5] Masiol, M., Vu, T.V., Harrison, R.M (2015) Black carbon and particle number size
distributions collected at an international airport located in an area affected by a complex
emission scenario. European Aerosol Conference (EAC), Milan, Italy.
[6] Vu, T. V.,Ondracek, J., Zdimal, V., Delgado-Saborit, J. M. and Harrison, R. M. Physical
properties and lung deposition of particles emitted from five major indoor sources (2015).
UK Review Meeting on Outdoor and Indoor Air Pollution Research, Solihull, UK.
190
[7] Vu, T.V., Masiol, M., Harrison, R.M (2014). Traffic and marine-influenced submicron
particle number size distribution in the Venice mainland, Italy. Aerosol Society Annual
Conference, Birmingham, UK.
[8] Vu, T.V., Delgado-Saborit J.M., Harrison, R.M (2014). Regional lung dose of submicron
aerosol particles in urban background, roadside and rural atmospheres. International Aerosol
Conference, Busan, Korea.
[9] Vu, T.V., Beddows D.C.S., Harrison, R.M (2014). Source apportionment of submicron
particles deposited in the human respiratory system measured at an urban background site in
London. Annual Review Meeting: Outdoor and Indoor Air Pollution Research, Solihull, UK.
191
REFERENCES
Abbasi, S., Jansson, A., Olander, L., Olofsson, U., Sellgren, U., 2012a. A pin-on-disc study
of the rate of airborne wear particle emissions from railway braking materials. Wear 284, 18-
29.
Abbasi, S., Olander, L., Larsson, C., Olofsson, U., Jansson, A., Sellgren, U., 2012b. A field
test study of airborne wear particles from a running regional train. Proceedings of the
Institution of Mechanical Engineers, Part F: Journal of Rail and Rapid Transit 226, 95-109.
Abdullahi, K.L., Delgado-Saborit, J.M., Harrison, R.M., 2013. Emissions and indoor
concentrations of particulate matter and its specific chemical components from cooking: A
review. Atmospheric Environment 71, 260-294.
Alam, M.K., 1987. The effect of van der Waals and viscous forces on aerosol coagulation.
Aerosol Science and Technology 6, 41-52.
Aleksandropoulou, V., Lazaridis, M., 2013. Development and application of a model
(ExDoM) for calculating the respiratory tract dose and retention of particles under variable
exposure conditions. Air Quality, Atmosphere & Health 6, 13-26.
Anderson, P., Wilson, J., Hiller, F., 1990. Respiratory tract deposition of ultrafine particles in
subjects with obstructive or restrictive lung disease. CHEST Journal 97, 1115-1120.
Apte, J.S., Kirchstetter, T.W., Reich, A.H., Deshpande, S.J., Kaushik, G., Chel, A., Marshall,
J.D., Nazaroff, W.W., 2011. Concentrations of fine, ultrafine, and black carbon particles in
auto-rickshaws in New Delhi, India. Atmospheric Environment 45, 4470-4480.
Asgharian, B., 2004. A model of deposition of hygroscopic particles in the human lung.
Aerosol Science and Technology 38, 938-947.
Asgharian, B., Hofmann, W., Bergmann, R., 2001. Particle deposition in a multiple-path
model of the human lung. Aerosol Science and Technology 34, 332-339.
Atkinson, R.W., Fuller, G.W., Anderson, H.R., Harrison, R.M., Armstrong, B., 2010. Urban
ambient particle metrics and health: a time-series analysis. Epidemiology 21, 501-511.
192
Baltensperger, U., Streit, N., Weingartner, E., Nyeki, S., Prévôt, A., Van Dingenen, R.,
Virkkula, A., Putaud, J.P., Even, A., Ten Brink, H., 2002. Urban and rural aerosol
characterization of summer smog events during the PIPAPO field campaign in Milan, Italy.
Journal of Geophysical Research: Atmospheres (1984–2012) 107, LOP 6-1-LOP 6-14.
Beddows, D., Harrison, R., Green, D., Fuller, G., 2015. Receptor modelling of both particle
composition and size distribution from a background site in London, UK. Atmospheric
Chemistry and Physics Discussions 15, 10123-10162.
Beddows, D.C., Dall’Osto, M., Harrison, R.M., 2009. Cluster analysis of rural, urban, and
curbside atmospheric particle size data. Environmental science & technology 43, 4694-4700.
Beddows, D.C.S., Dall'osto, M., Harrison, R.M., 2010. An Enhanced Procedure for the
Merging of Atmospheric Particle Size Distribution Data Measured Using Electrical Mobility
and Time-of-Flight Analysers. Aerosol Science and Technology 44, 930-938.
Bennett, D., Koutrakis, P., 2006. Determining the infiltration of outdoor particles in the
indoor environment using a dynamic model. Journal of Aerosol Science 37, 766-785.
Bennett, W.D., Zeman, K.L., Kim, C., 1996. Variability of fine particle deposition in healthy
adults: effect of age and gender. American journal of respiratory and critical care medicine
153, 1641-1647.
Bhangar, S., Mullen, N., Hering, S., Kreisberg, N., Nazaroff, W., 2011. Ultrafine particle
concentrations and exposures in seven residences in northern California. Indoor Air 21, 132-
144.
Bigi, A., Harrison, R.M., 2010. Analysis of the air pollution climate at a central urban
background site. Atmospheric Environment 44, 2004-2012.
Boy, M., Petäjä, T., Maso, M.D., Rannik, Ü., Rinne, J., Aalto, P., Laaksonen, A.,
Vaattovaara, P., Joutsensaari, J., Hoffmann, T., 2004. Overview of the field measurement
campaign in Hyytiälä, August 2001 in the framework of the EU project OSOA. Atmospheric
Chemistry and Physics 4, 657-678.
Broday, D.M., Georgopoulos, P.G., 2001. Growth and deposition of hygroscopic particulate
matter in the human lungs. Aerosol Science and Technology 34, 144-159.
193
Brown, J.S., Zeman, K.L., Bennett, W.D., 2002. Ultrafine particle deposition and clearance in
the healthy and obstructed lung. American Journal of Respiratory and Critical Care Medicine
166, 1240-1247.
Buonanno, G., Giovinco, G., Morawska, L., Stabile, L., 2011. Tracheobronchial and alveolar
dose of submicrometer particles for different population age groups in Italy. Atmospheric
Environment 45, 6216-6224.
Buonanno, G., Morawska, L., Stabile, L., 2009. Particle emission factors during cooking
activities. Atmospheric Environment 43, 3235-3242.
Busch, B., Kandler, K., Schütz, L., Neusüß, C., 2002. Hygroscopic properties and water‐
soluble volume fraction of atmospheric particles in the diameter range from 50 nm to 3.8 μm
during LACE 98. Journal of Geophysical Research: Atmospheres (1984–2012) 107, LAC 2-
1-LAC 2-11.
Buzorius, G., McNaughton, C., Clarke, A., Covert, D., Blomquist, B., Nielsen, K., Brechtel,
F., 2004. Secondary aerosol formation in continental outflow conditions during ACE‐Asia.
Journal of Geophysical Research: Atmospheres (1984–2012) 109.
Carpenter, L., Sturges, W., Penkett, S., Liss, P., Alicke, B., Hebestreit, K., Platt, U., 1999.
Short‐lived alkyl iodides and bromides at Mace Head, Ireland: Links to biogenic sources and
halogen oxide production. Journal of Geophysical Research: Atmospheres (1984–2012) 104,
1679-1689.
Carslaw, D.C., Ropkins, K., 2012. Openair—an R package for air quality data analysis.
Environmental Modelling & Software 27, 52-61.
Chalupa, D.C., Morrow, P.E., Oberdörster, G., Utell, M.J., Frampton, M.W., 2004. Ultrafine
particle deposition in subjects with asthma. Environmental Health Perspectives 112, 879.
Chan, H.-K., Eberl, S., Daviskas, E., Constable, C., Young, I., 2002. Changes in lung
deposition of aerosols due to hygroscopic growth: a fast SPECT study. Journal of Aerosol
Medicine 15, 307-311.
Chao, C.Y., Wan, M., Cheng, E.C., 2003. Penetration coefficient and deposition rate as a
function of particle size in non-smoking naturally ventilated residences. Atmospheric
Environment 37, 4233-4241.
194
Charron, A., Birmili, W., Harrison, R.M., 2007. Factors influencing new particle formation at
the rural site, Harwell, United Kingdom. Journal of Geophysical Research: Atmospheres
(1984–2012) 112.
Charron, A., Birmili, W., Harrison, R.M., 2008. Fingerprinting particle origins according to
their size distribution at a UK rural site. Journal of Geophysical Research: Atmospheres
(1984–2012) 113.
Charron, A., Degrendele, C., Laongsri, B., Harrison, R.M., 2013. Receptor modelling of
secondary and carbonaceous particulate matter at a southern UK site. Atmospheric Chemistry
and Physics 13, 1879-1894.
Charron, A., Harrison, R.M., 2003. Primary particle formation from vehicle emissions during
exhaust dilution in the roadside atmosphere. Atmospheric Environment 37, 4109-4119.
Chen, C., Zhao, B., 2011. Review of relationship between indoor and outdoor particles: I/O
ratio, infiltration factor and penetration factor. Atmospheric Environment 45, 275-288.
Chen, L.-Y., Jeng, F.-T., Chen, C.-C., Hsiao, T.-C., 2003. Hygroscopic behavior of
atmospheric aerosol in Taipei. Atmospheric Environment 37, 2069-2075.
Cruz, C.N., Pandis, S.N., 2000. Deliquescence and hygroscopic growth of mixed inorganic-
organic atmospheric aerosol. Environmental Science and Technology 34, 4313-4319.
Daigle, C.C., Chalupa, D.C., Gibb, F.R., Morrow, P.E., Oberdörster, G., Utell, M.J.,
Frampton, M.W., 2003. Ultrafine particle deposition in humans during rest and exercise.
Inhalation Toxicology 15, 539-552.
Dall'Osto, M., Beddows, D., Pey, J., Rodriguez, S., Alastuey, A., Harrison, R.M., Querol, X.,
2012. Urban aerosol size distributions over the Mediterranean city of Barcelona, NE Spain.
Atmospheric Chemistry and Physics 12, 10693-10707.
DeCarlo, P.F., Slowik, J.G., Worsnop, D.R., Davidovits, P., Jimenez, J.L., 2004. Particle
morphology and density characterization by combined mobility and aerodynamic diameter
measurements. Part 1: Theory. Aerosol Science and Technology 38, 1185-1205.
Decesari, S., Facchini, M., Matta, E., Mircea, M., Fuzzi, S., Chughtai, A., Smith, D., 2002.
Water soluble organic compounds formed by oxidation of soot. Atmospheric Environment
36, 1827-1832.
195
Delgado-Saborit, J.M., Aquilina, N.J., Meddings, C., Baker, S., Harrison, R.M., 2011.
Relationship of personal exposure to volatile organic compounds to home, work and fixed
site outdoor concentrations. Science of the Total Environment 409, 478-488.
Diffey, B.L., 2011. An overview analysis of the time people spend outdoors. British Journal
of Dermatology 164, 848-854.
Dinar, E., Mentel, T.F., Rudich, Y., 2006. The density of humic acids and humic like
substances (HULIS) from fresh and aged wood burning and pollution aerosol particles.
Atmospheric Chemistry and Physics 6, 5213-5224.
Donaldson, K., Li, X., MacNee, W., 1998. Ultrafine (nanometre) particle mediated lung
injury. Journal of Aerosol Science 29, 553-560.
Donaldson, K., Stone, V., Seaton, A., MacNee, W., 2001. Ambient particle inhalation and the
cardiovascular system: potential mechanisms. Environmental Health Perspect 109 Suppl 4,
523-527.
Dua, S., Hopke, P., 1996. Hygroscopic growth of assorted indoor aerosols. Aerosol Science
and Technology 24, 151-160.
Dua, S., Hopke, P., Raunemaa, T., 1999. Hygroscopicity of diesel aerosols. Water, Air, and
Soil Pollution 112, 247-257.
Dusek, U., Frank, G., Massling, A., Zeromskiene, K., Iinuma, Y., Schmid, O., Helas, G.,
Hennig, T., Wiedensohler, A., Andreae, M., 2011. Water uptake by biomass burning aerosol
at sub-and supersaturated conditions: closure studies and implications for the role of organics.
Atmospheric Chemistry and Physics 11, 9519-9532.
Ehn, M., Petäjä, T., Aufmhoff, H., Aalto, P., Hämeri, K., Arnold, F., Laaksonen, A.,
Kulmala, M., 2007. Hygroscopic properties of ultrafine aerosol particles in the boreal forest:
diurnal variation, solubility and the influence of sulfuric acid. Atmospheric Chemistry and
Physics 7, 211-222.
Elihn, K., Berg, P., Lidén, G., 2011. Correlation between airborne particle concentrations in
seven industrial plants and estimated respiratory tract deposition by number, mass and
elemental composition. Journal of Aerosol Science 42, 127-141.
196
EPA, U.S. Environmental Protection Agency, 2009. Metabolically derived human ventilation
rates: A revised approach based upon oxygen consumption rates. National Center for
Environmental Assessment, Office of Research and Development (2009) EPA/600/R-
06/129F
Ferron, G., 1977. The size of soluble aerosol particles as a function of the humidity of the air.
Application to the human respiratory tract. Journal of Aerosol Science 8, 251-267.
Ferron, G., Karg, E., Busch, B., Heyder, J., 2005. Ambient particles at an urban, semi-urban
and rural site in Central Europe: hygroscopic properties. Atmospheric Environment 39, 343-
352.
Ferron, G., Kreyling, W., Haider, B., 1988. Inhalation of salt aerosol particles—II. Growth
and deposition in the human respiratory tract. Journal of Aerosol Science 19, 611-631.
Finlay, W., Stapleton, K., 1995. The effect on regional lung deposition of coupled heat and
mass transfer between hygroscopic droplets and their surrounding phase. Journal of Aerosol
Science 26, 655-670.
Fors, E., Swietlicki, E., Svenningsson, B., Kristensson, A., Frank, G., Sporre, M., 2011.
Hygroscopic properties of the ambient aerosol in southern Sweden–a two year study.
Atmospheric Chemistry and Physics 11, 8343-8361.
Garg, B.D., Cadle, S.H., Mulawa, P.A., Groblicki, P.J., Laroo, C., Parr, G.A., 2000. Brake
wear particulate matter emissions. Environmental science & technology 34, 4463-4469.
Géhin, E., Ramalho, O., Kirchner, S., 2008. Size distribution and emission rate measurement
of fine and ultrafine particle from indoor human activities. Atmospheric Environment 42,
8341-8352.
Grigoratos, T., Martini, G., 2015. Brake wear particle emissions: a review. Environmental
Science and Pollution Research 22, 2491-2504.
Gu, J., Pitz, M., Schnelle-Kreis, J., Diemer, J., Reller, A., Zimmermann, R., Soentgen, J.,
Stoelzel, M., Wichmann, H.E., Peters, A., Cyrys, J., 2011. Source apportionment of ambient
particles: Comparison of positive matrix factorization analysis applied to particle size
distribution and chemical composition data. Atmospheric Environment 45, 1849-1857.
197
Gysel, M., McFiggans, G., Coe, H., 2009. Inversion of tandem differential mobility analyser
(TDMA) measurements. Journal of Aerosol Science 40, 134-151.
Hallquist, M., Wenger, J., Baltensperger, U., Rudich, Y., Simpson, D., Claeys, M., Dommen,
J., Donahue, N., George, C., Goldstein, A., 2009. The formation, properties and impact of
secondary organic aerosol: current and emerging issues. Atmospheric Chemistry and Physics
9, 5155-5236.
Hämeri, K., Väkevä, M., Aalto, P., Kulmala, M., Swietlicki, E., Zhou, J., Seidl, W., Becker,
E., O'dowd, C., 2001. Hygroscopic and CCN properties of aerosol particles in boreal forests.
Tellus B 53, 359-379.
Happonen, M., Heikkilä, J., Aakko-Saksa, P., Murtonen, T., Lehto, K., Rostedt, A.,
Sarjovaara, T., Larmi, M., Keskinen, J., Virtanen, A., 2013. Diesel exhaust emissions and
particle hygroscopicity with HVO fuel-oxygenate blend. Fuel 103, 380-386.
Harrison, R.M., Beddows, D.C., Dall’Osto, M., 2011. PMF analysis of wide-range particle
size spectra collected on a major highway. Environmental Science and Technology 45, 5522-
5528.
Harrison, R.M., Delgado-Saborit, J.M., Baker, S.J., Aquilina, N., Meddings, C., Harrad, S.,
Matthews, I., Vardoulakis, S., Anderson, H., 2009. Measurement and modeling of exposure
to selected air toxics for health effects studies and verification by biomarkers. Research report
(Health Effects Institute), 3-96; discussion 97-100.
Harrison, R.M., Giorio, C., Beddows, D.C., Dall'Osto, M., 2010. Size distribution of airborne
particles controls outcome of epidemiological studies. Science of the Total Environment 409,
289-293.
He, C., Morawska, L., Hitchins, J., Gilbert, D., 2004. Contribution from indoor sources to
particle number and mass concentrations in residential houses. Atmospheric Environment 38,
3405-3415.
Held, A., Zerrath, A., McKeon, U., Fehrenbach, T., Niessner, R., Plass-Dülmer, C.,
Kaminski, U., Berresheim, H., Pöschl, U., 2008. Aerosol size distributions measured in
urban, rural and high-alpine air with an electrical low pressure impactor (ELPI). Atmospheric
Environment 42, 8502-8512.
198
Helsper, C., Mölter, W., Löffler, F., Wadenpohl, C., Kaufmann, S., Wenninger, G., 1993.
Investigations of a new aerosol generator for the production of carbon aggregate particles.
Atmospheric Environment. Part A. General Topics 27, 1271-1275.
Hildemann, L.M., Markowski, G.R., Cass, G.R., 1991. Chemical composition of emissions
from urban sources of fine organic aerosol. Environmental Science and Technology 25, 744-
759.
Hiller, F.C., 1991. Health implications of hygroscopic particle growth in the human
respiratory tract. Journal of Aerosol Medicine 4, 1-23.
Hinds, W.C., 1999. Aerosol Technology: Properties. Behavior, and Measurement of airborne
Particles (2nd
). Wiley Interscience.
Hofmann, W., 2011. Modelling inhaled particle deposition in the human lung—a review.
Journal of Aerosol Science 42, 693-724.
Hofmann, W., Martonen, T., Graham, R., 1989. Predicted deposition of nonhygroscopic
aerosols in the human lung as a function of subject age. Journal of Aerosol Medicine 2, 49-
68.
Hussein, T., Glytsos, T., Ondráček, J., Dohányosová, P., Ždímal, V., Hämeri, K., Lazaridis,
M., Smolík, J., Kulmala, M., 2006. Particle size characterization and emission rates during
indoor activities in a house. Atmospheric Environment 40, 4285-4307.
Hussein, T., Londahl, J., Paasonen, P., Koivisto, A.J., Petaja, T., Hameri, K., Kulmala, M.,
2013. Modeling regional deposited dose of submicron aerosol particles. Science of the Total
Environment 458-460, 140-149.
Hussein, T., Wierzbicka, A., Löndahl, J., Lazaridis, M., Hänninen, O., 2015. Indoor aerosol
modeling for assessment of exposure and respiratory tract deposited dose. Atmospheric
Environment 106, 402-411.
ICRP, 1994. ICRP Publication 66: Human Respiratory Tract Model for Radiological
Protection. Elsevier Health Sciences.
Iijima, A., Sato, K., Yano, K., Tago, H., Kato, M., Kimura, H., Furuta, N., 2007. Particle size
and composition distribution analysis of automotive brake abrasion dusts for the evaluation of
antimony sources of airborne particulate matter. Atmospheric Environment 41, 4908-4919.
199
Ingham, D., 1975. Diffusion of aerosols from a stream flowing through a cylindrical tube.
Journal of Aerosol Science 6, 125-132.
Jacobson, M.Z., 1994. Developing, Coupling, and Applying a Gas, Aerosol, Transport, and
Radiation Model to Study Urban and Regional Air Pollution. PhD thesis. Univesity of
California, Los Angeles.
Jacobson, M.Z., 2005. Fundamentals of atmospheric modeling. Cambridge University Press.
Jacobson, M.Z., Seinfeld, J.H., 2004. Evolution of nanoparticle size and mixing state near the
point of emission. Atmospheric Environment 38, 1839-1850.
Janhäll, S., Andreae, M.O., Pöschl, U., 2010. Biomass burning aerosol emissions from
vegetation fires: particle number and mass emission factors and size distributions.
Atmospheric Chemistry and Physics 10, 1427-1439.
Jeong, C.-H., Evans, G.J., 2009. Inter-comparison of a fast mobility particle sizer and a
scanning mobility particle sizer incorporating an ultrafine water-based condensation particle
counter. Aerosol Science and Technology 43, 364-373.
Ji, X., Le Bihan, O., Ramalho, O., Mandin, C., D’Anna, B., Martinon, L., Nicolas, M., Bard,
D., Pairon, J.C., 2010. Characterization of particles emitted by incense burning in an
experimental house. Indoor Air 20, 147-158.
Jimenez, J., Canagaratna, M., Donahue, N., Prevot, A., Zhang, Q., Kroll, J., DeCarlo, P.,
Allan, J., Coe, H., Ng, N., 2009. Evolution of organic aerosols in the atmosphere. Science
326, 1525-1529.
Joodatnia, P., Kumar, P., Robins, A., 2013. Fast response sequential measurements and
modelling of nanoparticles inside and outside a car cabin. Atmospheric Environment 71, 364-
375.
Jung, J., Adams, P.J., Pandis, S.N., 2006. Simulating the size distribution and chemical
composition of ultrafine particles during nucleation events. Atmospheric Environment 40,
2248-2259.
Kamilli, K., Poulain, L., Held, A., Nowak, A., Birmili, W., Wiedensohler, A., 2014.
Hygroscopic properties of the Paris urban aerosol in relation to its chemical composition.
Atmospheric Chemistry and Physics 14, 737-749.
200
Kaminski, H., Kuhlbusch, T.A., Rath, S., Götz, U., Sprenger, M., Wels, D., Polloczek, J.,
Bachmann, V., Dziurowitz, N., Kiesling, H.-J., 2013. Comparability of mobility particle
sizers and diffusion chargers. Journal of Aerosol Science 57, 156-178.
Kasumba, J., Hopke, P.K., Chalupa, D.C., Utell, M.J., 2009. Comparison of sources of
submicron particle number concentrations measured at two sites in Rochester, NY. Science of
the Total Environment 407, 5071-5084.
Kim, C.S., Kang, T.C., 1997. Comparative measurement of lung deposition of inhaled fine
particles in normal subjects and patients with obstructive airway disease. American Journal of
Respiratory and Critical Care Medicine 155, 899-905.
Kim, E., Hopke, P.K., Larson, T.V., Covert, D.S., 2003. Analysis of ambient particle size
distributions using unmix and positive matrix factorization. Environmental Science and
Technology 38, 202-209.
Kittelson, D.B., 1998. Engines and nanoparticles: a review. Journal of Aerosol Science 29,
575-588.
Knibbs, L.D., He, C., Duchaine, C., Morawska, L., 2011. Vacuum cleaner emissions as a
source of indoor exposure to airborne particles and bacteria. Environmental Science and
Technology 46, 534-542.
Koblinger, L., Hofmann, W., 1990. Monte Carlo modeling of aerosol deposition in human
lungs. Part I: Simulation of particle transport in a stochastic lung structure. Journal of Aerosol
Science 21, 661-674.
Kotchenruther, R.A., Hobbs, P.V., 1998. Humidification factors of aerosols from biomass
burning in Brazil. Journal of Geophysical Research: Atmospheres (1984–2012) 103, 32081-
32089.
Kotzick, R., Niessner, R., 1999. The effects of aging processes on critical supersaturation
ratios of ultrafine carbon aerosols. Atmospheric Environment 33, 2669-2677.
Kreyling, W.G., Semmler, M., Möller, W., 2004. Dosimetry and toxicology of ultrafine
particles. Journal of Aerosol Medicine 17, 140-152.
201
Kristensson, A., Rissler, J., Löndahl, J., Johansson, C., Swietlicki, E., 2013. Size-resolved
respiratory tract deposition of sub-micrometer aerosol particles in a residential area with
wintertime wood combustion. Aerosol and Air Quality Research 13, 24-35.
Kuhn, T., Krudysz, M., Zhu, Y., Fine, P.M., Hinds, W.C., Froines, J., Sioutas, C., 2005.
Volatility of indoor and outdoor ultrafine particulate matter near a freeway. Journal of
Aerosol Science 36, 291-302.
Kukutschová, J., Moravec, P., Tomášek, V., Matějka, V., Smolík, J., Schwarz, J., Seidlerová,
J., Šafářová, K., Filip, P., 2011. On airborne nano/micro-sized wear particles released from
low-metallic automotive brakes. Environmental Pollution 159, 998-1006.
Kumar, P., Morawska, L., Birmili, W., Paasonen, P., Hu, M., Kulmala, M., Harrison, R.M.,
Norford, L., Britter, R., 2014. Ultrafine particles in cities. Environment International 66, 1-
10.
Kumar, P., Morawska, L., Harrison, R.M., 2013. Nanoparticles in European cities and
associated health impacts, Urban Air Quality in Europe. Springer, pp. 339-365.
Kumar, P., Robins, A., Vardoulakis, S., Britter, R., 2010. A review of the characteristics of
nanoparticles in the urban atmosphere and the prospects for developing regulatory controls.
Atmospheric Environment 44, 5035-5052.
Kurth, L.M., McCawley, M., Hendryx, M., Lusk, S., 2014. Atmospheric particulate matter
size distribution and concentration in West Virginia coal mining and non-mining areas.
Journal of Exposure Science and Environmental Epidemiology 24, 405-411.
Kwak, J., Lee, S., Lee, S., 2014. On-road and laboratory investigations on non-exhaust
ultrafine particles from the interaction between the tire and road pavement under braking
conditions. Atmospheric Environment 97, 195-205.
Lai, A.C., Nazaroff, W.W., 2000. Modeling indoor particle deposition from turbulent flow
onto smooth surfaces. Journal of Aerosol Science 31, 463-476.
Langer, S., Moldanová, J., Arrhenius, K., Ljungström, E., Ekberg, L., 2008. Ultrafine
particles produced by ozone/limonene reactions in indoor air under low/closed ventilation
conditions. Atmospheric Environment 42, 4149-4159.
202
Lee, E., Chan, C.K., Paatero, P., 1999. Application of positive matrix factorization in source
apportionment of particulate pollutants in Hong Kong. Atmospheric Environment 33, 3201-
3212.
Lelieveld, J., Evans, J., Fnais, M., Giannadaki, D., Pozzer, A., 2015. The contribution of
outdoor air pollution sources to premature mortality on a global scale. Nature 525, 367-371.
Li, W., Hopke, P., 1993. Initial size distributions and hygroscopicity of indoor combustion
aerosol particles. Aerosol Science and Technology 19, 305-316.
Lighty, J.S., Veranth, J.M., Sarofim, A.F., 2000. Combustion aerosols: factors governing
their size and composition and implications to human health. Journal of the Air & Waste
Management Association 50, 1565-1618.
Lioy, P.J., Wainman, T., Zhang, J., Goldsmith, S., 1999. Typical household vacuum cleaners:
the collection efficiency and emissions characteristics for fine particles. Journal of the Air &
Waste Management Association 49, 200-206.
Liu, D.-L., Nazaroff, W.W., 2003. Particle penetration through building cracks. Aerosol
Science and Technology 37, 565-573.
Löndahl, J., Massling, A., Pagels, J., Swietlicki, E., Vaclavik, E., Loft, S., 2007. Size-
resolved respiratory-tract deposition of fine and ultrafine hydrophobic and hygroscopic
aerosol particles during rest and exercise. Inhalation Toxicology 19, 109-116.
Londahl, J., Massling, A., Swietlicki, E., Bräuner, E.V., Ketzel, M., Pagels, J., Loft, S., 2009.
Experimentally determined human respiratory tract deposition of airborne particles at a busy
street. Environmental science & technology 43, 4659-4664.
Löndahl, J., Möller, W., Pagels, J.H., Kreyling, W.G., Swietlicki, E., Schmid, O., 2014.
Measurement techniques for respiratory tract deposition of airborne nanoparticles: A critical
review. Journal of Aerosol Medicine and Pulmonary Drug Delivery 27, 229-254.
Londahl, J., Swietlicki, E., Rissler, J., Bengtsson, A., Boman, C., Blomberg, A., Sandstrom,
T., 2012. Experimental determination of the respiratory tract deposition of diesel combustion
particles in patients with chronic obstructive pulmonary disease. Part Fibre Toxicol 9, 23.
203
Long, C.M., Suh, H.H., Catalano, P.J., Koutrakis, P., 2001. Using time-and size-resolved
particulate data to quantify indoor penetration and deposition behavior. Environmental
Science and Technology 35, 2089-2099.
Martin, M., Tritscher, T., Juranyi, Z., Heringa, M.F., Sierau, B., Weingartner, E., Chirico, R.,
Gysel, M., Prévôt, A.S., Baltensperger, U., 2013. Hygroscopic properties of fresh and aged
wood burning particles. Journal of Aerosol Science 56, 15-29.
Martonen, T., Rosati, J., Isaacs, K., 2005. Modeling deposition of inhaled particles. Aerosols
Handbook. Measurement, Dosimetry and Health Effects. CRC Press, Boca Raton, 113-155.
Massling, A., Stock, M., Wehner, B., Wu, Z., Hu, M., Brüggemann, E., Gnauk, T.,
Herrmann, H., Wiedensohler, A., 2009. Size segregated water uptake of the urban
submicrometer aerosol in Beijing. Atmospheric Environment 43, 1578-1589.
Massling, A., Stock, M., Wiedensohler, A., 2005. Diurnal, weekly, and seasonal variation of
hygroscopic properties of submicrometer urban aerosol particles. Atmospheric Environment
39, 3911-3922.
Mathissen, M., Scheer, V., Vogt, R., Benter, T., 2011. Investigation on the potential
generation of ultrafine particles from the tire–road interface. Atmospheric Environment 45,
6172-6179.
Meier, J., Wehner, B., Massling, A., Birmili, W., Nowak, A., Gnauk, T., Brüggemann, E.,
Herrmann, H., Min, H., Wiedensohler, A., 2009. Hygroscopic growth of urban aerosol
particles in Beijing (China) during wintertime: a comparison of three experimental methods.
Atmospheric Chemistry and Physics 9, 6865-6880.
Mochida, M., Kawamura, K., 2004. Hygroscopic properties of levoglucosan and related
organic compounds characteristic to biomass burning aerosol particles. Journal of
Geophysical Research: Atmospheres (1984–2012) 109.
Montoya, L., Lawrence, J., Murthy, G.K., Sarnat, J., Godleski, J., Koutrakis, P., 2004.
Continuous measurements of ambient particle deposition in human subjects. Aerosol Science
and Technology 38, 980-990.
204
Morawska, L., Afshari, A., Bae, G., Buonanno, G., Chao, C., Hänninen, O., Hofmann, W.,
Isaxon, C., Jayaratne, E., Pasanen, P., 2013. Indoor aerosols: from personal exposure to risk
assessment. Indoor Air 23, 462-487.
Morawska, L., Hofmann, W., Hitchins-Loveday, J., Swanson, C., Mengersen, K., 2005.
Experimental study of the deposition of combustion aerosols in the human respiratory tract.
Journal of Aerosol Science 36, 939-957.
Morawska, L., Ristovski, Z., Jayaratne, E., Keogh, D.U., Ling, X., 2008. Ambient nano and
ultrafine particles from motor vehicle emissions: Characteristics, ambient processing and
implications on human exposure. Atmospheric Environment 42, 8113-8138.
Morrow, P.E., 1986. Factors determining hygroscopic aerosol deposition in airways. Physiol.
Rev 66, 330-376.
Mortensen, J., Stout, L., Bagley, B., Burkart, J., Schaap, R., Crapo, J., Smolko, E., Miller, F.,
Graham, J., Hayes, A., 1989. Age related morphometric analysis of human lung casts.
Extrapolation of Dosimetric Relationships for Inhaled Particles and Gases, 59-68.
Mortensen, J., Young, J.D., Stout, L., Stout, A., Bagley, B., Schaap, R.N., 1983. A numerical
identification syterm for airways in the lung. The Anatomical Record 206, 103-114.
Mosleh, M., Blau, P.J., Dumitrescu, D., 2004. Characteristics and morphology of wear
particles from laboratory testing of disk brake materials. Wear 256, 1128-1134.
Müller, H., 1928. Zur allgemeinen Theorie ser raschen Koagulation. Fortschrittsberichte über
Kolloide und Polymere 27, 223-250.
Nazaroff, W.W., Weschler, C.J., 2004. Cleaning products and air fresheners: exposure to
primary and secondary air pollutants. Atmospheric Environment 38, 2841-2865.
Novák, J., Sýkora, L., 2007. A city in Motion: Time-space activity and mobility patterns of
suberban inhabitants and the structration of the spatial organization of the Prague
metropolitan area. Geografiska Annaler: Series B, Human Geography 89, 147-168.
O'Dowd, C.D., Hämeri, K., Mäkelä, J.M., Pirjola, L., Kulmala, M., Jennings, S.G.,
Berresheim, H., Hansson, H.C., de Leeuw, G., Kunz, G.J., 2002a. A dedicated study of New
Particle Formation and Fate in the Coastal Environment (PARFORCE): Overview of
205
objectives and achievements. Journal of Geophysical Research: Atmospheres (1984–2012)
107, PAR 1-1-PAR 1-16.
O'Dowd, C.D., Jimenez, J.L., Bahreini, R., Flagan, R.C., Seinfeld, J.H., Hämeri, K., Pirjola,
L., Kulmala, M., Jennings, S.G., Hoffmann, T., 2002b. Marine aerosol formation from
biogenic iodine emissions. Nature 417, 632-636.
Olofsson, U., 2011. A study of airborne wear particles generated from the train traffic—
Block braking simulation in a pin-on-disc machine. Wear 271, 86-91.
Ogulei, D., Hopke, P., Wallace, L., 2006a. Analysis of indoor particle size distributions in an
occupied townhouse using positive matrix factorization. Indoor Air 16, 204-215.
Ogulei, D., Hopke, P.K., Chalupa, D.C., Utell, M.J., 2007. Modeling source contributions to
submicron particle number concentrations measured in Rochester, New York. Aerosol
Science and Technology 41, 179-201.
Ogulei, D., Hopke, P.K., Zhou, L., Pancras, J.P., Nair, N., Ondov, J.M., 2006b. Source
apportionment of Baltimore aerosol from combined size distribution and chemical
composition data. Atmospheric Environment 40, 396-410.
Park, K., Kim, J.-S., Park, S.H., 2009. Measurements of hygroscopicity and volatility of
atmospheric ultrafine particles during ultrafine particle formation events at urban, industrial,
and coastal sites. Environmental science & technology 43, 6710-6716.
Petäjä, T., Kerminen, V.-M., Maso, M.D., Junninen, H., Koponen, I., Hussein, T., Aalto, P.,
Andronopoulos, S., Robin, D., Hämeri, K., 2007. Sub-micron atmospheric aerosols in the
surroundings of Marseille and Athens: physical characterization and new particle formation.
Atmospheric Chemistry and Physics 7, 2705-2720.
Peters, A., Wichmann, H.E., Tuch, T., Heinrich, J., Heyder, J., 1997. Respiratory effects are
associated with the number of ultrafine particles. American Journal of Respiratory and
Critical Care Medicine 155, 1376-1383.
Petters, M., Kreidenweis, S., 2007. A single parameter representation of hygroscopic growth
and cloud condensation nucleus activity. Atmospheric Chemistry and Physics 7, 1961-1971.
206
Pey, J., Querol, X., Alastuey, A., Rodríguez, S., Putaud, J.P., Van Dingenen, R., 2009. Source
apportionment of urban fine and ultra-fine particle number concentration in a Western
Mediterranean city. Atmospheric Environment 43, 4407-4415.
Pope, C.A., Dockery, D.W., 2006. Health Effects of Fine Particulate Air Pollution: Lines that
Connect. Journal of the Air & Waste Management Association 56, 709-742.
Protection, N.C.o.R., Measurements, 1997. Deposition, Retention, and Dosimetry of Inhaled
Radioactive Substances: Recommendations of the National Council on Radiation Protection
and Measurements. National Council on Radiation Protection and Measurements.
Reid, J., Koppmann, R., Eck, T., Eleuterio, D., 2005. A review of biomass burning emissions
part II: intensive physical properties of biomass burning particles. Atmospheric Chemistry
and Physics 5, 799-825.
Reid, J.S., Hobbs, P.V., 1998. Physical and optical properties of young smoke from
individual biomass fires in Brazil. Journal of Geophysical Research: Atmospheres (1984–
2012) 103, 32013-32030.
Reutter, P., Su, H., Trentmann, J., Simmel, M., Rose, D., Gunthe, S., Wernli, H., Andreae,
M., Pöschl, U., 2009. Aerosol-and updraft-limited regimes of cloud droplet formation:
influence of particle number, size and hygroscopicity on the activation of cloud condensation
nuclei (CCN). Atmospheric Chemistry and Physics 9, 7067-7080.
Rissler, J., Svenningsson, B., Fors, E.O., Bilde, M., Swietlicki, E., 2010. An evaluation and
comparison of cloud condensation nucleus activity models: Predicting particle critical
saturation from growth at subsaturation. Journal of Geophysical Research: Atmospheres
(1984–2012) 115.
Rissler, J., Swietlicki, E., Bengtsson, A., Boman, C., Pagels, J., Sandström, T., Blomberg, A.,
Löndahl, J., 2012. Experimental determination of deposition of diesel exhaust particles in the
human respiratory tract. Journal of Aerosol Science 48, 18-33.
Rissler, J., Vestin, A., Swietlicki, E., Fisch, G., Zhou, J., Artaxo, P., Andreae, M., 2006. Size
distribution and hygroscopic properties of aerosol particles from dry-season biomass burning
in Amazonia. Atmospheric Chemistry and Physics 6, 471-491.
207
Ristovski, Z., Jayaratne, E., Lim, M., Ayoko, G.A., Morawska, L., 2006. Influence of diesel
fuel sulfur on nanoparticle emissions from city buses. Environmental science & technology
40, 1314-1320.
Rogers, C., Hudson, J., Zielinska, B., Tanner, R., Hallett, J., Watson, J., 1991. Cloud
condensation nuclei from biomass burning, Global biomass burning. Atmospheric, Climatic,
and Biospheric Implications.
Rohr, A.C., 2013. The health significance of gas- and particle-phase terpene oxidation
products: A review. Environment International 60, 145-162.
Rose, D., Nowak, A., Achtert, P., Wiedensohler, A., Hu, M., Shao, M., Zhang, Y., Andreae,
M., Pöschl, U., 2008. Cloud condensation nuclei in polluted air and biomass burning smoke
near the mega-city Guangzhou, China–Part 1: Size-resolved measurements and implications
for the modeling of aerosol particle hygroscopicity and CCN activity. Atmospheric
Chemistry and Physics Discussions 8, 17343-17392.
Rudolf, G., Köbrich, R., Stahlhofen, W., 1990. Modelling and algebraic formulation of
regional aerosol deposition in man. Journal of Aerosol Science 21, S403-S406.
Ruzer, L.S., Harley, N.H., 2012. Aerosols handbook: measurement, dosimetry, and health
effects. CRC press.
Sajani, S.Z., Ricciardelli, I., Trentini, A., Bacco, D., Maccone, C., Castellazzi, S., Lauriola,
P., Poluzzi, V., Harrison, R.M., 2015. Spatial and indoor/outdoor gradients in urban
concentrations of ultrafine particles and PM 2.5 mass and chemical components.
Atmospheric Environment 103, 307-320.
Sakurai, H., Fink, M.A., McMurry, P.H., Mauldin, L., Moore, K.F., Smith, J.N., Eisele, F.L.,
2005. Hygroscopicity and volatility of 4–10 nm particles during summertime atmospheric
nucleation events in urban Atlanta. Journal of Geophysical Research: Atmospheres (1984–
2012) 110.
Sanders, P.G., Xu, N., Dalka, T.M., Maricq, M.M., 2003. Airborne brake wear debris: size
distributions, composition, and a comparison of dynamometer and vehicle tests.
Environmental Science and Technology 37, 4060-4069.
208
Sarwar, G., Olson, D.A., Corsi, R.L., Weschler, C.J., 2004. Indoor Fine Particles: The Role of
Terpene Emissions from Consumer Products. Journal of the Air & Waste Management
Association 54, 367-377.
Sceats, M.G., 1989. Brownian coagulation in aerosols—the role of long range forces. Journal
of Colloid and Interface Science 129, 105-112.
Schiller-Scotland, C.F., Hlawa, R., Gebhart, J., 1994. Experimental data for total deposition
in the respiratory tract of children. Toxicology Letters 72, 137-144.
Schweizer, C., Edwards, R.D., Bayer-Oglesby, L., Gauderman, W.J., Ilacqua, V., Jantunen,
M.J., Lai, H.K., Nieuwenhuijsen, M., Künzli, N., 2007. Indoor time–microenvironment–
activity patterns in seven regions of Europe. Journal of Exposure Science and Environmental
Epidemiology 17, 170-181.
Seinfeld, J.H., Pandis, S.N., 2012. Atmospheric chemistry and physics: from air pollution to
climate change. John Wiley & Sons.
Shi, J.P., Mark, D., Harrison, R.M., 2000. Characterization of particles from a current
technology heavy-duty diesel engine. Environmental Science and Technology 34, 748-755.
Singer, B.C., Coleman, B.K., Destaillats, H., Hodgson, A.T., Lunden, M.M., Weschler, C.J.,
Nazaroff, W.W., 2006a. Indoor secondary pollutants from cleaning product and air freshener
use in the presence of ozone. Atmospheric Environment 40, 6696-6710.
Singer, B.C., Destaillats, H., Hodgson, A.T., Nazaroff, W.W., 2006b. Cleaning products and
air fresheners: emissions and resulting concentrations of glycol ethers and terpenoids. Indoor
Air 16, 179-191.
Stanier, C.O., Khlystov, A.Y., Pandis, S.N., 2004. Ambient aerosol size distributions and
number concentrations measured during the Pittsburgh Air Quality Study (PAQS).
Atmospheric Environment 38, 3275-3284.
Svenningsson, I., Hansson, H.C., Wiedensohler, A., Ogren, J., Noone, K., Hallberg, A., 1992.
Hygroscopic growth of aerosol particles in the Po Valley. Tellus B 44, 556-569.
Swietlicki, E., Hansson, H.C., Hämeri, K., Svenningsson, B., Massling, A., McFiggans, G.,
McMurry, P., Petäjä, T., Tunved, P., Gysel, M., 2008. Hygroscopic properties of
209
submicrometer atmospheric aerosol particles measured with H‐TDMA instruments in various
environments—A review. Tellus B 60, 432-469.
Swietlicki, E., Zhou, J., Berg, O.H., Martinsson, B.G., Frank, G., Cederfelt, S.-I., Dusek, U.,
Berner, A., Birmili, W., Wiedensohler, A., 1999. A closure study of sub-micrometer aerosol
particle hygroscopic behaviour. Atmospheric Research 50, 205-240.
Szymczak, W., Menzel, N., Keck, L., 2007. Emission of ultrafine copper particles by
universal motors controlled by phase angle modulation. Journal of Aerosol Science 38, 520-
531.
Tan, H., Yin, Y., Gu, X., Li, F., Chan, P., Xu, H., Deng, X., Wan, Q., 2013. An observational
study of the hygroscopic properties of aerosols over the Pearl River Delta region.
Atmospheric Environment 77, 817-826.
Tang, I., Wong, W., Munkelwitz, H., 1981. The relative importance of atmospheric sulfates
and nitrates in visibility reduction. Atmospheric Environment (1967) 15, 2463-2471.
Thatcher, T.L., Layton, D.W., 1995. Deposition, resuspension, and penetration of particles
within a residence. Atmospheric Environment 29, 1487-1497.
Thimmaiah, D., Hovorka, J., Hopke, P.K., 2009. Source apportionment of winter submicron
Prague aerosols from combined particle number size distribution and gaseous composition
data. Aerosol and Air Quality Research 9, 209-236.
Thorpe, A., Harrison, R.M., 2008. Sources and properties of non-exhaust particulate matter
from road traffic: a review. Science of the Total Environment 400, 270-282.
Tritscher, T., Jurányi, Z., Martin, M., Chirico, R., Gysel, M., Heringa, M.F., DeCarlo, P.F.,
Sierau, B., Prévôt, A.S., Weingartner, E., 2011. Changes of hygroscopicity and morphology
during ageing of diesel soot. Environmental Research Letters 6, 034026.
Tschiersch, J., Busch, B., Fogh, C.L., 1997. Measurements of concentration, size distribution
and hygroscopicity of Munich winter aerosol. Journal of Aerosol Science 28, S209-S210.
TSI, 2005. Engine Exhaust Particle Sizer Spectrometer.
TSI, 2006. Aerosol Instrument Manager Software for Aerodynamic Particle Sizer (APS)
Spectrometers
210
TSI, 2007. Condensation Particle Counter Model 3775 Operation and Service Manual.
TSI, 2010. Scanning Mobility Particle Sizer (SMPS) Spectrometer Operation and Service
Manual.
Tu, K., Knutson, E., 1984. Total deposition of ultrafine hydrophobic and hygroscopic
aerosols in the human respiratory system. Aerosol Science and Technology 3, 453-465.
Väkevä, M., Hämeri, K., Aalto, P., 2002a. Hygroscopic properties of nucleation mode and
Aitken mode particles during nucleation bursts and in background air on the west coast of
Ireland. Journal of Geophysical Research: Atmospheres (1984–2012) 107, PAR 9-1-PAR 9-
11.
Väkevä, M., Kulmala, M., Stratmann, F., Hämeri, K., 2002b. Field measurements of
hygroscopic properties and state of mixing of nucleation mode particles. Atmospheric
Chemistry and Physics 2, 55-66.
Varutbangkul, V., Brechtel, F., Bahreini, R., Ng, N., Keywood, M., Kroll, J., Flagan, R.,
Seinfeld, J., Lee, A., Goldstein, A., 2006. Hygroscopicity of secondary organic aerosols
formed by oxidation of cycloalkenes, monoterpenes, sesquiterpenes, and related compounds.
Atmospheric Chemistry and Physics 6, 2367-2388.
Venkataraman, C., Lyons, J.M., Friedlander, S.K., 1994. Size distributions of polycyclic
aromatic hydrocarbons and elemental carbon. 1. Sampling, measurement methods, and source
characterization. Environmental Science and Technology 28, 555-562.
Viana, M., Kuhlbusch, T., Querol, X., Alastuey, A., Harrison, R., Hopke, P., Winiwarter, W.,
Vallius, M., Szidat, S., Prevot, A., 2008. Source apportionment of particulate matter in
Europe: a review of methods and results. Journal of Aerosol Science 39, 827-849.
Virkkula, A., Van Dingenen, R., Raes, F., Hjorth, J., 1999. Hygroscopic properties of aerosol
formed by oxidation of limonene, α-pinene, and β-pinene. Journal of Geophysical Research:
Atmospheres 104, 3569-3579.
Vogt, R., Scheer, V., Casati, R., Benter, T., 2003. On-road measurement of particle emission
in the exhaust plume of a diesel passenger car. Environmental Science and Technology 37,
4070-4076.
211
Von Bismarck-Osten, C., Birmili, W., Ketzel, M., Massling, A., Petäjä, T., Weber, S., 2013.
Characterization of parameters influencing the spatio-temporal variability of urban particle
number size distributions in four European cities. Atmospheric Environment 77, 415-429.
Vu, T.V., Delgado-Saborit, J.M., Harrison, R.M., 2015a. A review of hygroscopic growth
factors of submicron aerosols from different sources and its implication for calculation of
lung deposition efficiency of ambient aerosols. Air Quality, Atmosphere & Health, 1-12.
Vu, T.V., Delgado-Saborit, J.M., Harrison, R.M., 2015b. Review: Particle number size
distributions from seven major sources and implications for source apportionment studies.
Atmospheric Environment 122, 114-132.
Wahlström, J., Olofsson, U., 2014. A field study of airborne particle emissions from
automotive disc brakes. Proceedings of the Institution of Mechanical Engineers, Part D:
Journal of Automobile Engineering, 0954407014550053.
Wahlström, J., Olander, L., Olofsson, U., 2010a. Size, shape, and elemental composition of
airborne wear particles from disc brake materials. Tribology Letters 38, 15-24.
Wahlström, J., Söderberg, A., Olander, L., Jansson, A., Olofsson, U., 2010b. A pin-on-disc
simulation of airborne wear particles from disc brakes. Wear 268, 763-769.
Wahlström, J., Söderberg, A., Olander, L., Olofsson, U., 2009. A disc brake test stand for
measurement of airborne wear particles. Lubrication Science 21, 241-252.
Wainman, T., Zhang, J., Weschler, C.J., Lioy, P.J., 2000. Ozone and Limonene in Indoor Air:
A Source of Submicron Particle Exposure. Environmental Health Perspectives 108, 1139-
1145.
Wallace, L., 1996. Indoor particles: a review. Journal of the Air & Waste Management
Association 46, 98-126.
Wang, B., Lee, S.C., Ho, K.F., Kang, Y.M., 2007a. Characteristics of emissions of air
pollutants from burning of incense in temples, Hong Kong. Science of the Total Environment
377, 52-60.
Wang, C.-S., 1975. Gravitational deposition of particles from laminar flows in inclined
channels. Journal of Aerosol Science 6, 191-204.
212
Wang, S., Ang, H.M., Tade, M.O., 2007b. Volatile organic compounds in indoor
environment and photocatalytic oxidation: State of the art. Environment International 33,
694-705.
Wang, Y.-F., Tsai, P.-J., Chen, C.-W., Chen, D.-R., Dai, Y.-T., 2011a. Size distributions and
exposure concentrations of nanoparticles associated with the emissions of oil mists from
fastener manufacturing processes. Journal of Hazardous Materials 198, 182-187.
Wang, Y.-F., Tsai, P.-J., Chen, C.-W., Chen, D.-R., Hsu, D.-J., 2010. Using a modified
electrical aerosol detector to predict nanoparticle exposures to different regions of the
respiratory tract for workers in a carbon black manufacturing industry. Environmental
Science and Technology 44, 6767-6774.
Wang, Y., Hopke, P.K., Chalupa, D.C., Utell, M.J., 2011b. Long-term study of urban
ultrafine particles and other pollutants. Atmospheric Environment 45, 7672-7680.
Wang, Z., Hu, M., Wu, Z., Yue, D., He, L., Huang, X., Liu, X., Wiedensohler, A., 2013.
Long-term measurements of particle number size distributions and the relationships with air
mass history and source apportionment in the summer of Beijing. Atmospheric Chemistry
and Physics 13, 10159-10170.
Wardoyo, A.Y.P., Morawska, L., Ristovski, Z.D., Marsh, J., 2006. Quantification of particle
number and mass emission factors from combustion of Queensland trees. Environmental
Science and Technology 40, 5696-5703.
Waring, M.S., Wells, J.R., Siegel, J.A., 2011. Secondary organic aerosol formation from
ozone reactions with single terpenoids and terpenoid mixtures. Atmospheric Environment 45,
4235-4242.
Wehner, B., Uhrner, U., Von Löwis, S., Zallinger, M., Wiedensohler, A., 2009. Aerosol
number size distributions within the exhaust plume of a diesel and a gasoline passenger car
under on-road conditions and determination of emission factors. Atmospheric Environment
43, 1235-1245.
Weijers, E., Khlystov, A., Kos, G., Erisman, J., 2004. Variability of particulate matter
concentrations along roads and motorways determined by a moving measurement unit.
Atmospheric Environment 38, 2993-3002.
213
Weingartner, E., Baltensperger, U., Burtscher, H., 1995. Growth and structural change of
combustion aerosols at high relative humidity. Environmental Science and Technology 29,
2982-2986.
Weingartner, E., Burtscher, H., Baltensperger, U., 1993. Hygroscopic behavior of combustion
aerosols. Journal of Aerosol Science 24, S371-S372.
Weingartner, E., Burtscher, H., Baltensperger, U., 1997. Hygroscopic properties of carbon
and diesel soot particles. Atmospheric Environment 31, 2311-2327.
Wentzel, M., Gorzawski, H., Naumann, K.-H., Saathoff, H., Weinbruch, S., 2003.
Transmission electron microscopical and aerosol dynamical characterization of soot aerosols.
Journal of Aerosol Science 34, 1347-1370.
Winkler-Heil, R., Ferron, G., Hofmann, W., 2014. Calculation of hygroscopic particle
deposition in the human lung. Inhalation Toxicology 26, 193-206.
Wong, J., Lee, A., Slowik, J., Cziczo, D., Leaitch, W., Macdonald, A., Abbatt, J., 2011.
Oxidation of ambient biogenic secondary organic aerosol by hydroxyl radicals: Effects on
cloud condensation nuclei activity. Geophysical Research Letters 38.
Wu, C., Chao, C.Y., Sze-To, G., Wan, M., Chan, T., 2011. Ultrafine particle emissions from
cigarette smouldering, incense burning, vacuum cleaner motor operation and cooking. Indoor
and Built Environment, 1420326X11421356.
Xu, G., Yu, C., 1986. Effects of age on deposition of inhaled aerosols in the human lung.
Aerosol Science and Technology 5, 349-357.
Yakovleva, E., Hopke, P.K., Wallace, L., 1999. Receptor modeling assessment of particle
total exposure assessment methodology data. Environmental Science and Technology 33,
3645-3652.
Ye, X., Tang, C., Yin, Z., Chen, J., Ma, Z., Kong, L., Yang, X., Gao, W., Geng, F., 2013.
Hygroscopic growth of urban aerosol particles during the 2009 Mirage-Shanghai Campaign.
Atmospheric Environment 64, 263-269.
Yeh, H.-C., Schum, G., 1980. Models of human lung airways and their application to inhaled
particle deposition. Bulletin of Mathematical Biology 42, 461-480.
214
Yue, D.L., Hu, M., Wang, Z.B., Wen, M.T., Guo, S., Zhong, L.J., Wiedensohler, A., Zhang,
Y.H., 2013. Comparison of particle number size distributions and new particle formation
between the urban and rural sites in the PRD region, China. Atmospheric Environment 76,
181-188.
Zeman, W.D.B.K.L., 1998. Deposition of fine particles in children spontaneously breathing
at rest. Inhalation Toxicology 10, 831-842.
Zhang, K.M., Wexler, A.S., Zhu, Y.F., Hinds, W.C., Sioutas, C., 2004. Evolution of particle
number distribution near roadways. Part II: the ‘Road-to-Ambient’process. Atmospheric
Environment 38, 6655-6665.
Zhang, L., Asgharian, B., Anjilvel, S., 1997. Inertial deposition of particles in the human
upper airway bifurcations. Aerosol Science and Technology 26, 97-110.
Zhou, J., Swietlicki, E., Berg, O.H., Aalto, P.P., Hämeri, K., Nilsson, E.D., Leck, C., 2001.
Hygroscopic properties of aerosol particles over the central Arctic Ocean during summer.
Journal of Geophysical Research: Atmospheres (1984–2012) 106, 32111-32123.
Zhou, L., Kim, E., Hopke, P.K., Stanier, C., Pandis, S.N., 2005. Mining airborne particulate
size distribution data by positive matrix factorization. Journal of Geophysical Research:
Atmospheres 110, D07S19.
Zhou, L., Kim, E., Hopke, P.K., Stanier, C.O., Pandis, S., 2004. Advanced factor analysis on
Pittsburgh particle size-distribution data special issue of aerosol science and technology on
findings from the Fine Particulate Matter Supersites Program. Aerosol Science and
Technology 38, 118-132.
Zhu, J., Cao, X.-L., Beauchamp, R., 2001. Determination of 2-butoxyethanol emissions from
selected consumer products and its application in assessment of inhalation exposure
associated with cleaning tasks. Environment International 26, 589-597.
Zhu, Y., Hinds, W.C., Krudysz, M., Kuhn, T., Froines, J., Sioutas, C., 2005. Penetration of
freeway ultrafine particles into indoor environments. Journal of Aerosol Science 36, 303-322.