photogrammetry and archaeological knowledge: toaw … · journal ”archeologia...
TRANSCRIPT
PHOTOGRAMMETRY AND ARCHAEOLOGICAL KNOWLEDGE: TOWARD A3DINFORMATION SYSTEM DEDICATED TO MEDIEVAL ARCHAEOLOGY: A CASE
STUDY OF SHAWBAK CASTLE IN JORDAN
Pierre Drap1, Anne Durand1, Malika Nedir1, Julien Seinturier1, Odile Papini1,Roberto Gabrielli2, Daniela Peloso2, Rieko Kadobayashi3, Gilles Gaillard4, Paul Chapman5,
Warren Viant5, Guido Vannini6, Michele Nucciotti6
1 LSIS umr CNRS 6168, Marseille, France,([email protected])2 Institute for Technologies Applied to Cultural Heritage CNR, Rome, Italy,([email protected])
3 National Institute of Information and Communications Technology, Kyoto, Japan,([email protected])4 Stratos Documentation, Cadenet, France,([email protected])
5 SIMVIS Department of Computer Science, University of Hull,UK, (name.surname@ hull.ac.uk)6 Dipartimento di Studi storici e Geografici dell’Universit degli Studi, Florence, Italy,([email protected])
KEY WORDS: Photogrammetry, Virtual Reality, Archaeology, Cultural Heritage, Aerial, Surveying, Imagery, Digitalisation
ABSTRACT:
The paper presents an interdisciplinary project which is the first step towards a 3D Geographical Information System (GIS) dedicatedto Cultural Heritage with a specific focus application on theCastle of Shawbak, also known as the ”Crac de Montral” in Jordan.The project continues to grow thanks to a synergy between a set of laboratories: The LSIS laboratory, France in charge of the pho-togrammetric survey phase connected with the knowledge based approach; ITABC, CNR lab in Roma, Italy in charge of the topometricsurvey, with DGPS and aerial photography with gas balloon, National Institute of Information and Communications Technology, Kyoto,Japan for the 3D view point seek connected to the database, the image processing aspect managed by Stratos documentation, SimVisfrom The Department of Computer Science, University of Hull, UK, for the virtual reality aspect and of course the Dipartimento diStudi storici e Geografici from the University of Florence, Italy, in charge of the archaeological part.Our project focuses on a building scale encompassing its atomic elements such as ashlars blocks, cement, stratigraphicunits and archi-tectonic elements. At this scale we need a full 3D interface in order to manage accurate measurements, a huge quantity of observationsand a mainly heterogeneous archaeological documentation.This project described in this paper is work in progress. After four photogrammetric campaigns in Jordan the first results are availableon the project web site: http://www.shawbak.net
1 THE ARCHAEOLOGICAL CONTEXT: SUBJECT,OBJECTIVES AND METHODS
The ’Medieval Petra – Shawbak Project’ archaeological mission,promoted by the Department of Historical and Geographical Stud-ies of the University of Florence, is part of a programme of theItalian Ministry for Foreign Affairs (’PilotProject’ from1999),Italian Ministry of University and Research (’Scientific Projectof National Interest’ from 1987; ’FIRB Project’ 2005-8) andiscarried out by researchers coming also from the Universities ofUdine, Urbino, Venezia, ITABC-CNR of Rome, CNRS- LSIS ofMarseille, University of Hull.The mission operates, since 1999, within the ’Athenaeum Strate-gic Project’ (”The Mediterranean feudal society: archaeologicalprofiles. Apogee and decline, at the origins of Modern Europe”)directed by the chair of Medieval Archaeology and dedicatedtothe archaeological study of material structures of the feudal soci-ety – by means of settlement-patterns analyses in Mediterraneanterritorial sample areas – at the time when the above is a protag-onist of prolonged comparison with new political realitieswhich,from Western European Christianity to the Mediterranean IslamicMiddle East (with the new Ayyubid and Mamluk ’empires’), layat the origin of modern state-nations (Vannini et al., 2007).In such a picture, the Archaeological Mission – ’Medieval Pe-tra’ Archaeology of the Crusader-Ayyubid settlement in Transjor-dan. The Shawbak Project – is engaged for a project devotedto analyze characteristics and forms of the Crusader ”incastella-mento” in the area corresponding to the Lordship of Transjor-dan in 12th century, in its structural aspects but also as ’observa-tory’ on the Crusader-Muslim frontier of Holy-Land, in relation
with the Ayyubid settlement patterns. The research proposes todocument the ’original material characters’ of the first phase ofCrusader occupation of ”Outremer”, where these charactersarebetter preserved and stratigraphically readable, after the total anddefinitive abandonment caused by the consequences of the battleof Hattin (1187).Major results of almost two decades of research include the iden-tification of the renewed central role of Petra in 12th centuryTransjordan, as well as of the classical system of ”Incastella-mento” of its valley – al-Habis, Jabal Atuff, al-Wu’ayra, Hormuz,up to Ash-Shawbak (”Crack de Montral”). Such a settlement sys-tem appears to have been aimed at controlling ’the Kings’ High-way’ (connecting Syria and Jazeera to Hijaz and Egypt) and thestrategic natural resources of the pre-desertic belt of springs andexploitable lands (Vannini et al., 2007).Since 2002, the ’Medieval Petra’ project has been focused onar-chaeological analyses (excavations as well as researches of ’lightarchaeology’) at the castle of Shawbak, within the frame of aspecific programme (integrated with conservative restoration andvalorisation) which is the object of an international agreementof Italian-Jordanian scientific and cultural cooperation betweenthe University of Florence and the Department of Antiquities ofJordan. Such an agreement aims at using the results obtainedbymeans of the stratigraphic analyses in order to complete a restora-tion project.The methodology of analyses which has been adopted for the’Medieval Petra – Shawbak Project’ integrates excavationswith aprogramme of non-invasive investigations of ’light archaeology’.Stratigraphic analyses of upstanding buildings hold a key rolewithin the aforementioned the system of archaeological studies.
In particular, the outstanding stratigraphical availability and vis-ibility of the preserved architectures of Shawbak allow ’archae-ology of architecture’ to play the role of interpretative barycen-tre in the reconstruction of the site’s material history. Moreoverthe very presence of medieval stratified architectures surviving toa great extent above the ground makes of Shawbak a wonderfulcase-study for the development of an integrated managementsys-tem of heterogeneous data such the one proposed hereafter. As tostratigraphic analysis of upstanding buildings, it first developedwithin Italian Medieval Archaeology in the 1970s, though a con-sistent methodological approach was implemented between mid1980s and mid 1990s and the first issue of the dedicated scientificjournal ”Archeologia dell’Architettura” (/Archaeology of Archi-tecture/) was published in 1996. In contrast with other (andear-lier) traditions of archaeological study of architectures, the focustheoretical concept of this recent Italian approach is to considerupstanding structures as a special type of stratified archaeologi-cal deposits. In so doing architectures can be reduced to a seriesof stratigraphic units whose relationships can be assessedand ex-pressed by means of Harris Matrix. Such an approach has giventhe opportunity to fully integrate architectural records and archae-ological analyses in the excavation practice as well as to producestratigraphic datasets for the analysis of historical upstanding ar-chitectures even without excavation: the so-called ’lightarchae-ology’ approach.In order to fully exploit the archaeological dataset (whichat themoment includes stratigraphic analyses of 36 buildings ”Corpi diFabbrica” with a concentration in the southern area of the forti-fied settlement) common GIS systems proved unable to deal withcomplex 3D architectural objects with relevant information posi-tioned and georeferred on non-parallel planes. Moreover distinctdocumental procedures were needed for recording: archaeolog-ical data (database), Harris Matrixes, topographic geometry andexcavation plans/sections (laser total station and directsurvey),vertical stratigraphy (ortho-rectified photographs), Digital Eleva-tion Models (D-GPS and motorised laser total station), etc.; thusmaking it virtually impossible to contextually manage the wholedataset and also multiplying the recording activities on single ob-jects according to what kind of representation was requiredtimeby time.Such needs, though particularly difficult to solve at a first glance,provided indeed the opportunity to set up a large and multidisci-plinary team whose aim is to project and implement an integratedmanagement system able to deal with representation and surveyissues common to many territorial-archaeological research inves-tigating the dynamic modifications of ancient historic landscapesin a given region. The results so far achieved are briefly exposedin the next paragraphs.
2 A TWO STEP PHOTOGRAMMETRY CAMPAIGN
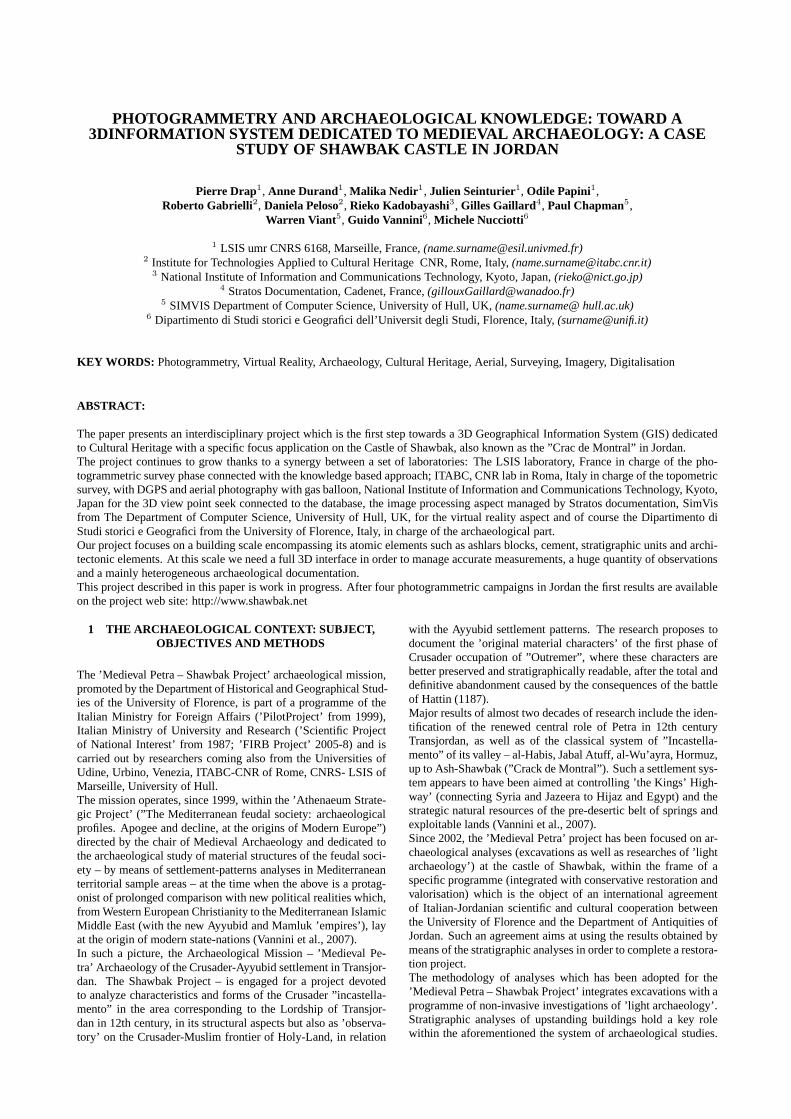
We define a network of 3D points georeferenced by DGPS, inthe entire castle in order to orient all the photograph taken. Twokinds of photographic survey are required: the first one dedicatedat wall survey is done from the ground; hand made by a photog-rapher; the second one is aerial photography from a gas baloon(figure 1).The gas balloons can reach maximum height of 50-60 meters.In addition, the ashlars block survey and wall stratigraphic unitstudy, aerial photogrammetry is used to evaluate the traditionalexcavation and can also be used to follow the castle restorationproject.
2.1 Measuring 3D Blocks
Once all the photographs are oriented The I-MAGE process stand-ing for Image processing and Measure Assisted by GEometrical
Figure 1: The gas baloon used during the aerial photogrammetricsurvey.
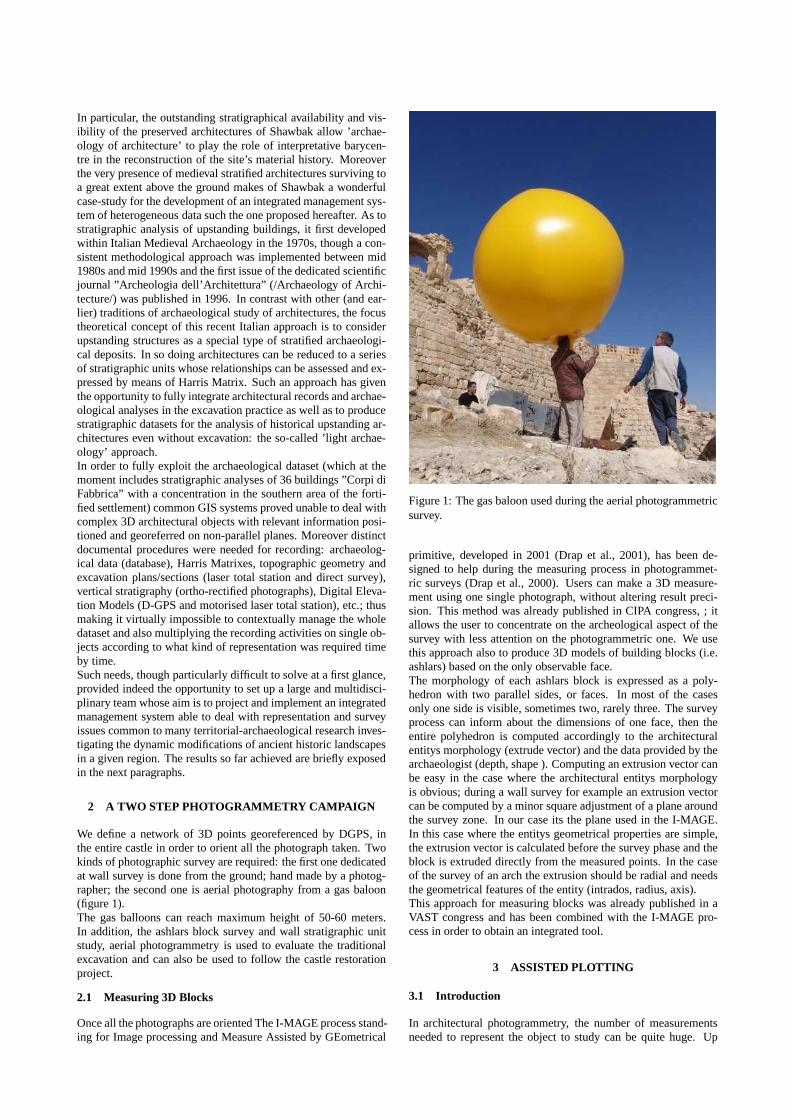
primitive, developed in 2001 (Drap et al., 2001), has been de-signed to help during the measuring process in photogrammet-ric surveys (Drap et al., 2000). Users can make a 3D measure-ment using one single photograph, without altering result preci-sion. This method was already published in CIPA congress, ; itallows the user to concentrate on the archeological aspect of thesurvey with less attention on the photogrammetric one. We usethis approach also to produce 3D models of building blocks (i.e.ashlars) based on the only observable face.The morphology of each ashlars block is expressed as a poly-hedron with two parallel sides, or faces. In most of the casesonly one side is visible, sometimes two, rarely three. The surveyprocess can inform about the dimensions of one face, then theentire polyhedron is computed accordingly to the architecturalentitys morphology (extrude vector) and the data provided by thearchaeologist (depth, shape ). Computing an extrusion vector canbe easy in the case where the architectural entitys morphologyis obvious; during a wall survey for example an extrusion vectorcan be computed by a minor square adjustment of a plane aroundthe survey zone. In our case its the plane used in the I-MAGE.In this case where the entitys geometrical properties are simple,the extrusion vector is calculated before the survey phase and theblock is extruded directly from the measured points. In the caseof the survey of an arch the extrusion should be radial and needsthe geometrical features of the entity (intrados, radius, axis).This approach for measuring blocks was already published inaVAST congress and has been combined with the I-MAGE pro-cess in order to obtain an integrated tool.
3 ASSISTED PLOTTING
3.1 Introduction
In architectural photogrammetry, the number of measurementsneeded to represent the object to study can be quite huge. Up
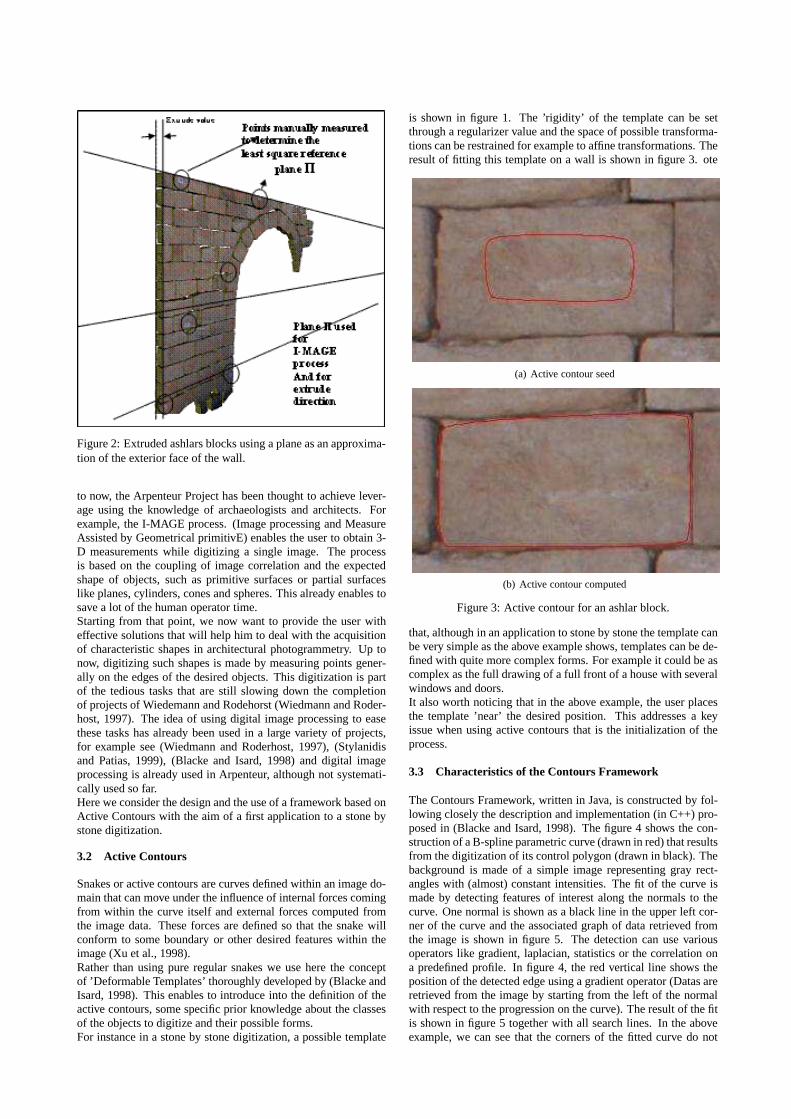
Figure 2: Extruded ashlars blocks using a plane as an approxima-tion of the exterior face of the wall.
to now, the Arpenteur Project has been thought to achieve lever-age using the knowledge of archaeologists and architects. Forexample, the I-MAGE process. (Image processing and MeasureAssisted by Geometrical primitivE) enables the user to obtain 3-D measurements while digitizing a single image. The processis based on the coupling of image correlation and the expectedshape of objects, such as primitive surfaces or partial surfaceslike planes, cylinders, cones and spheres. This already enables tosave a lot of the human operator time.Starting from that point, we now want to provide the user witheffective solutions that will help him to deal with the acquisitionof characteristic shapes in architectural photogrammetry. Up tonow, digitizing such shapes is made by measuring points gener-ally on the edges of the desired objects. This digitization is partof the tedious tasks that are still slowing down the completionof projects of Wiedemann and Rodehorst (Wiedmann and Roder-host, 1997). The idea of using digital image processing to easethese tasks has already been used in a large variety of projects,for example see (Wiedmann and Roderhost, 1997), (Stylanidisand Patias, 1999), (Blacke and Isard, 1998) and digital imageprocessing is already used in Arpenteur, although not systemati-cally used so far.Here we consider the design and the use of a framework based onActive Contours with the aim of a first application to a stone bystone digitization.
3.2 Active Contours
Snakes or active contours are curves defined within an image do-main that can move under the influence of internal forces comingfrom within the curve itself and external forces computed fromthe image data. These forces are defined so that the snake willconform to some boundary or other desired features within theimage (Xu et al., 1998).Rather than using pure regular snakes we use here the conceptof ’Deformable Templates’ thoroughly developed by (BlackeandIsard, 1998). This enables to introduce into the definition of theactive contours, some specific prior knowledge about the classesof the objects to digitize and their possible forms.For instance in a stone by stone digitization, a possible template
is shown in figure 1. The ’rigidity’ of the template can be setthrough a regularizer value and the space of possible transforma-tions can be restrained for example to affine transformations. Theresult of fitting this template on a wall is shown in figure 3. ote
(a) Active contour seed
(b) Active contour computed
Figure 3: Active contour for an ashlar block.
that, although in an application to stone by stone the template canbe very simple as the above example shows, templates can be de-fined with quite more complex forms. For example it could be ascomplex as the full drawing of a full front of a house with severalwindows and doors.It also worth noticing that in the above example, the user placesthe template ’near’ the desired position. This addresses a keyissue when using active contours that is the initializationof theprocess.
3.3 Characteristics of the Contours Framework
The Contours Framework, written in Java, is constructed by fol-lowing closely the description and implementation (in C++)pro-posed in (Blacke and Isard, 1998). The figure 4 shows the con-struction of a B-spline parametric curve (drawn in red) thatresultsfrom the digitization of its control polygon (drawn in black). Thebackground is made of a simple image representing gray rect-angles with (almost) constant intensities. The fit of the curve ismade by detecting features of interest along the normals to thecurve. One normal is shown as a black line in the upper left cor-ner of the curve and the associated graph of data retrieved fromthe image is shown in figure 5. The detection can use variousoperators like gradient, laplacian, statistics or the correlation ona predefined profile. In figure 4, the red vertical line shows theposition of the detected edge using a gradient operator (Datas areretrieved from the image by starting from the left of the normalwith respect to the progression on the curve). The result of the fitis shown in figure 5 together with all search lines. In the aboveexample, we can see that the corners of the fitted curve do not
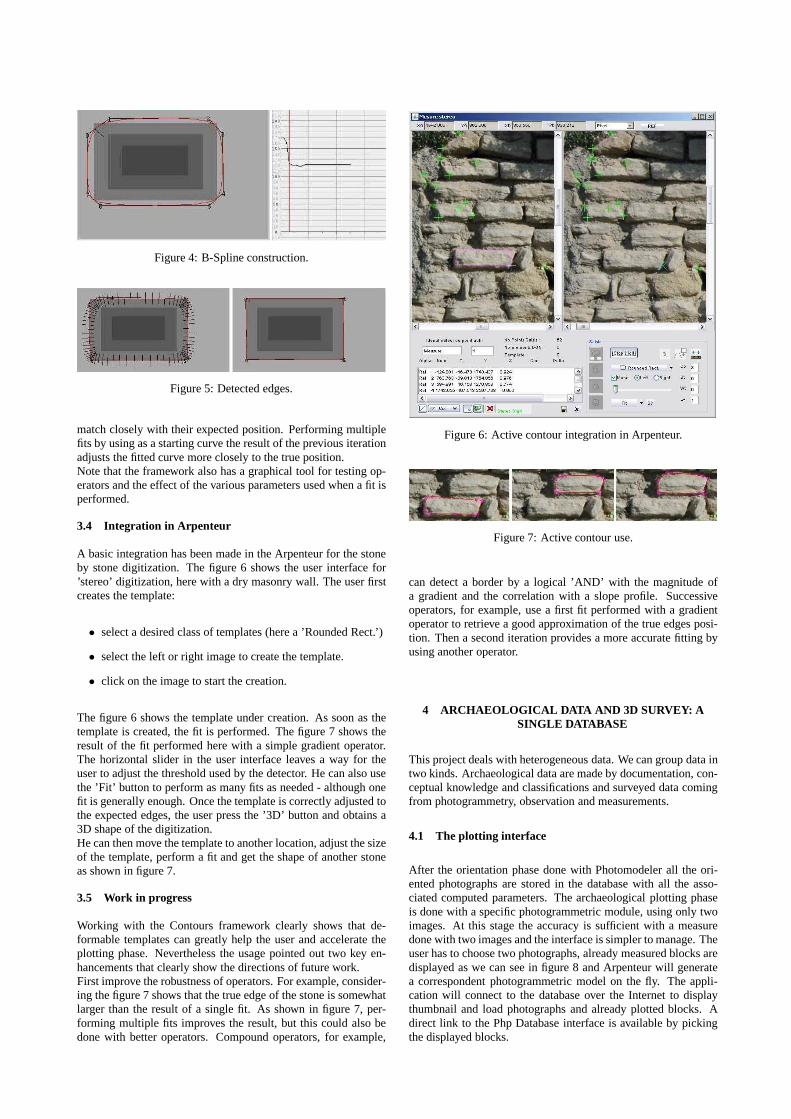
Figure 4: B-Spline construction.
Figure 5: Detected edges.
match closely with their expected position. Performing multiplefits by using as a starting curve the result of the previous iterationadjusts the fitted curve more closely to the true position.Note that the framework also has a graphical tool for testingop-erators and the effect of the various parameters used when a fit isperformed.
3.4 Integration in Arpenteur
A basic integration has been made in the Arpenteur for the stoneby stone digitization. The figure 6 shows the user interface for’stereo’ digitization, here with a dry masonry wall. The user firstcreates the template:
• select a desired class of templates (here a ’Rounded Rect.’)
• select the left or right image to create the template.
• click on the image to start the creation.
The figure 6 shows the template under creation. As soon as thetemplate is created, the fit is performed. The figure 7 shows theresult of the fit performed here with a simple gradient operator.The horizontal slider in the user interface leaves a way for theuser to adjust the threshold used by the detector. He can alsousethe ’Fit’ button to perform as many fits as needed - although onefit is generally enough. Once the template is correctly adjusted tothe expected edges, the user press the ’3D’ button and obtains a3D shape of the digitization.He can then move the template to another location, adjust thesizeof the template, perform a fit and get the shape of another stoneas shown in figure 7.
3.5 Work in progress
Working with the Contours framework clearly shows that de-formable templates can greatly help the user and acceleratetheplotting phase. Nevertheless the usage pointed out two key en-hancements that clearly show the directions of future work.First improve the robustness of operators. For example, consider-ing the figure 7 shows that the true edge of the stone is somewhatlarger than the result of a single fit. As shown in figure 7, per-forming multiple fits improves the result, but this could also bedone with better operators. Compound operators, for example,
Figure 6: Active contour integration in Arpenteur.
Figure 7: Active contour use.
can detect a border by a logical ’AND’ with the magnitude ofa gradient and the correlation with a slope profile. Successiveoperators, for example, use a first fit performed with a gradientoperator to retrieve a good approximation of the true edges posi-tion. Then a second iteration provides a more accurate fitting byusing another operator.
4 ARCHAEOLOGICAL DATA AND 3D SURVEY: ASINGLE DATABASE
This project deals with heterogeneous data. We can group data intwo kinds. Archaeological data are made by documentation, con-ceptual knowledge and classifications and surveyed data comingfrom photogrammetry, observation and measurements.
4.1 The plotting interface
After the orientation phase done with Photomodeler all the ori-ented photographs are stored in the database with all the asso-ciated computed parameters. The archaeological plotting phaseis done with a specific photogrammetric module, using only twoimages. At this stage the accuracy is sufficient with a measuredone with two images and the interface is simpler to manage. Theuser has to choose two photographs, already measured blocksaredisplayed as we can see in figure 8 and Arpenteur will generatea correspondent photogrammetric model on the fly. The appli-cation will connect to the database over the Internet to displaythumbnail and load photographs and already plotted blocks.Adirect link to the Php Database interface is available by pickingthe displayed blocks.
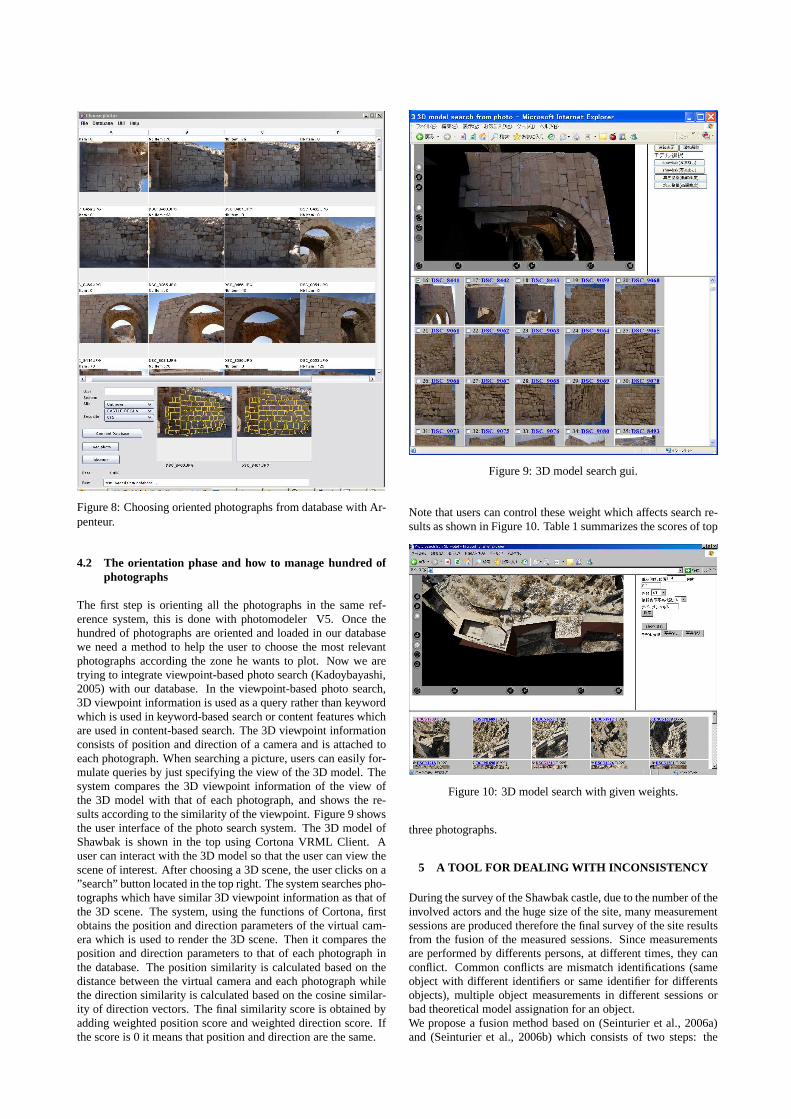
Figure 8: Choosing oriented photographs from database withAr-penteur.
4.2 The orientation phase and how to manage hundred ofphotographs
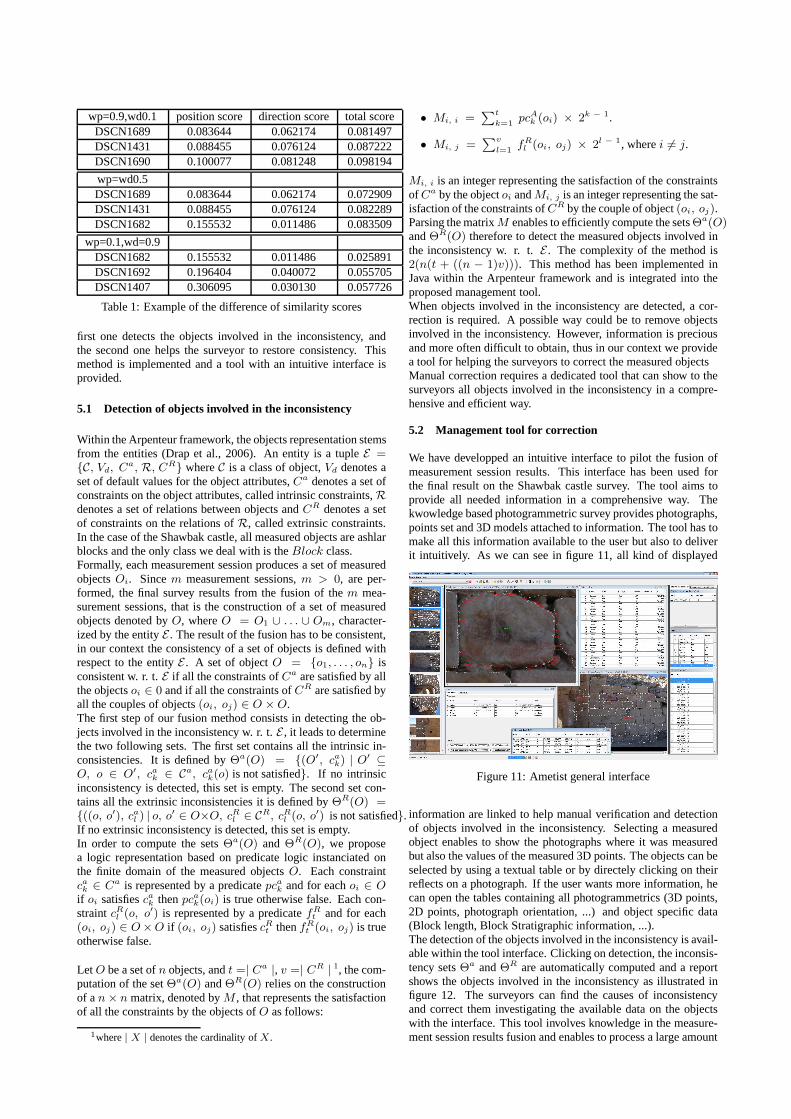
The first step is orienting all the photographs in the same ref-erence system, this is done with photomodeler V5. Once thehundred of photographs are oriented and loaded in our databasewe need a method to help the user to choose the most relevantphotographs according the zone he wants to plot. Now we aretrying to integrate viewpoint-based photo search (Kadoybayashi,2005) with our database. In the viewpoint-based photo search,3D viewpoint information is used as a query rather than keywordwhich is used in keyword-based search or content features whichare used in content-based search. The 3D viewpoint informationconsists of position and direction of a camera and is attached toeach photograph. When searching a picture, users can easilyfor-mulate queries by just specifying the view of the 3D model. Thesystem compares the 3D viewpoint information of the view ofthe 3D model with that of each photograph, and shows the re-sults according to the similarity of the viewpoint. Figure 9showsthe user interface of the photo search system. The 3D model ofShawbak is shown in the top using Cortona VRML Client. Auser can interact with the 3D model so that the user can view thescene of interest. After choosing a 3D scene, the user clickson a”search” button located in the top right. The system searches pho-tographs which have similar 3D viewpoint information as that ofthe 3D scene. The system, using the functions of Cortona, firstobtains the position and direction parameters of the virtual cam-era which is used to render the 3D scene. Then it compares theposition and direction parameters to that of each photograph inthe database. The position similarity is calculated based on thedistance between the virtual camera and each photograph whilethe direction similarity is calculated based on the cosine similar-ity of direction vectors. The final similarity score is obtained byadding weighted position score and weighted direction score. Ifthe score is 0 it means that position and direction are the same.
Figure 9: 3D model search gui.
Note that users can control these weight which affects search re-sults as shown in Figure 10. Table 1 summarizes the scores of top
Figure 10: 3D model search with given weights.
three photographs.
5 A TOOL FOR DEALING WITH INCONSISTENCY
During the survey of the Shawbak castle, due to the number of theinvolved actors and the huge size of the site, many measurementsessions are produced therefore the final survey of the site resultsfrom the fusion of the measured sessions. Since measurementsare performed by differents persons, at different times, they canconflict. Common conflicts are mismatch identifications (sameobject with different identifiers or same identifier for differentsobjects), multiple object measurements in different sessions orbad theoretical model assignation for an object.We propose a fusion method based on (Seinturier et al., 2006a)and (Seinturier et al., 2006b) which consists of two steps: the
wp=0.9,wd0.1 position score direction score total scoreDSCN1689 0.083644 0.062174 0.081497DSCN1431 0.088455 0.076124 0.087222DSCN1690 0.100077 0.081248 0.098194
wp=wd0.5DSCN1689 0.083644 0.062174 0.072909DSCN1431 0.088455 0.076124 0.082289DSCN1682 0.155532 0.011486 0.083509
wp=0.1,wd=0.9DSCN1682 0.155532 0.011486 0.025891DSCN1692 0.196404 0.040072 0.055705DSCN1407 0.306095 0.030130 0.057726
Table 1: Example of the difference of similarity scores
first one detects the objects involved in the inconsistency,andthe second one helps the surveyor to restore consistency. Thismethod is implemented and a tool with an intuitive interfaceisprovided.
5.1 Detection of objects involved in the inconsistency
Within the Arpenteur framework, the objects representation stemsfrom the entities (Drap et al., 2006). An entity is a tupleE ={C, Vd, Ca, R, CR} whereC is a class of object,Vd denotes aset of default values for the object attributes,Ca denotes a set ofconstraints on the object attributes, called intrinsic constraints,Rdenotes a set of relations between objects andCR denotes a setof constraints on the relations ofR, called extrinsic constraints.In the case of the Shawbak castle, all measured objects are ashlarblocks and the only class we deal with is theBlock class.Formally, each measurement session produces a set of measuredobjectsOi. Sincem measurement sessions,m > 0, are per-formed, the final survey results from the fusion of them mea-surement sessions, that is the construction of a set of measuredobjects denoted byO, whereO = O1 ∪ . . . ∪ Om, character-ized by the entityE . The result of the fusion has to be consistent,in our context the consistency of a set of objects is defined withrespect to the entityE . A set of objectO = {o1, . . . , on} isconsistent w. r. t.E if all the constraints ofCa are satisfied by allthe objectsoi ∈ 0 and if all the constraints ofCR are satisfied byall the couples of objects(oi, oj) ∈ O × O.The first step of our fusion method consists in detecting the ob-jects involved in the inconsistency w. r. t.E , it leads to determinethe two following sets. The first set contains all the intrinsic in-consistencies. It is defined byΘa(O) = {(O′, ca
k) | O′ ⊆O, o ∈ O′, ca
k ∈ Ca, cak(o) is not satisfied}. If no intrinsic
inconsistency is detected, this set is empty. The second setcon-tains all the extrinsic inconsistencies it is defined byΘR(O) ={((o, o′), ca
l ) | o, o′ ∈ O×O, cRl ∈ CR, cR
l (o, o′) is not satisfied}.If no extrinsic inconsistency is detected, this set is empty.In order to compute the setsΘa(O) and ΘR(O), we proposea logic representation based on predicate logic instanciated onthe finite domain of the measured objectsO. Each constraintcak ∈ Ca is represented by a predicatepca
k and for eachoi ∈ O
if oi satisfiescak thenpca
k(oi) is true otherwise false. Each con-straintcR
l (o, o′) is represented by a predicatefRt and for each
(oi, oj) ∈ O ×O if (oi, oj) satisfiescRt thenfR
t (oi, oj) is trueotherwise false.
Let O be a set ofn objects, andt =| Ca |, v =| CR | 1, the com-putation of the setΘa(O) andΘR(O) relies on the constructionof an × n matrix, denoted byM , that represents the satisfactionof all the constraints by the objects ofO as follows:
1where| X | denotes the cardinality ofX.
• Mi, i =∑t
k=1pcA
k (oi) × 2k − 1.
• Mi, j =∑v
l=1fR
l (oi, oj) × 2l − 1, wherei 6= j.
Mi, i is an integer representing the satisfaction of the constraintsof Ca by the objectoi andMi, j is an integer representing the sat-isfaction of the constraints ofCR by the couple of object(oi, oj).Parsing the matrixM enables to efficiently compute the setsΘa(O)andΘR(O) therefore to detect the measured objects involved inthe inconsistency w. r. t.E . The complexity of the method is2(n(t + ((n − 1)v))). This method has been implemented inJava within the Arpenteur framework and is integrated into theproposed management tool.When objects involved in the inconsistency are detected, a cor-rection is required. A possible way could be to remove objectsinvolved in the inconsistency. However, information is preciousand more often difficult to obtain, thus in our context we providea tool for helping the surveyors to correct the measured objectsManual correction requires a dedicated tool that can show tothesurveyors all objects involved in the inconsistency in a compre-hensive and efficient way.
5.2 Management tool for correction
We have developped an intuitive interface to pilot the fusion ofmeasurement session results. This interface has been used forthe final result on the Shawbak castle survey. The tool aims toprovide all needed information in a comprehensive way. Thekwowledge based photogrammetric survey provides photographs,points set and 3D models attached to information. The tool has tomake all this information available to the user but also to deliverit intuitively. As we can see in figure 11, all kind of displayed
Figure 11: Ametist general interface
information are linked to help manual verification and detectionof objects involved in the inconsistency. Selecting a measuredobject enables to show the photographs where it was measuredbut also the values of the measured 3D points. The objects canbeselected by using a textual table or by directely clicking ontheirreflects on a photograph. If the user wants more information,hecan open the tables containing all photogrammetrics (3D points,2D points, photograph orientation, ...) and object specificdata(Block length, Block Stratigraphic information, ...).The detection of the objects involved in the inconsistency is avail-able within the tool interface. Clicking on detection, the inconsis-tency setsΘa andΘR are automatically computed and a reportshows the objects involved in the inconsistency as illustrated infigure 12. The surveyors can find the causes of inconsistencyand correct them investigating the available data on the objectswith the interface. This tool involves knowledge in the measure-ment session results fusion and enables to process a large amount
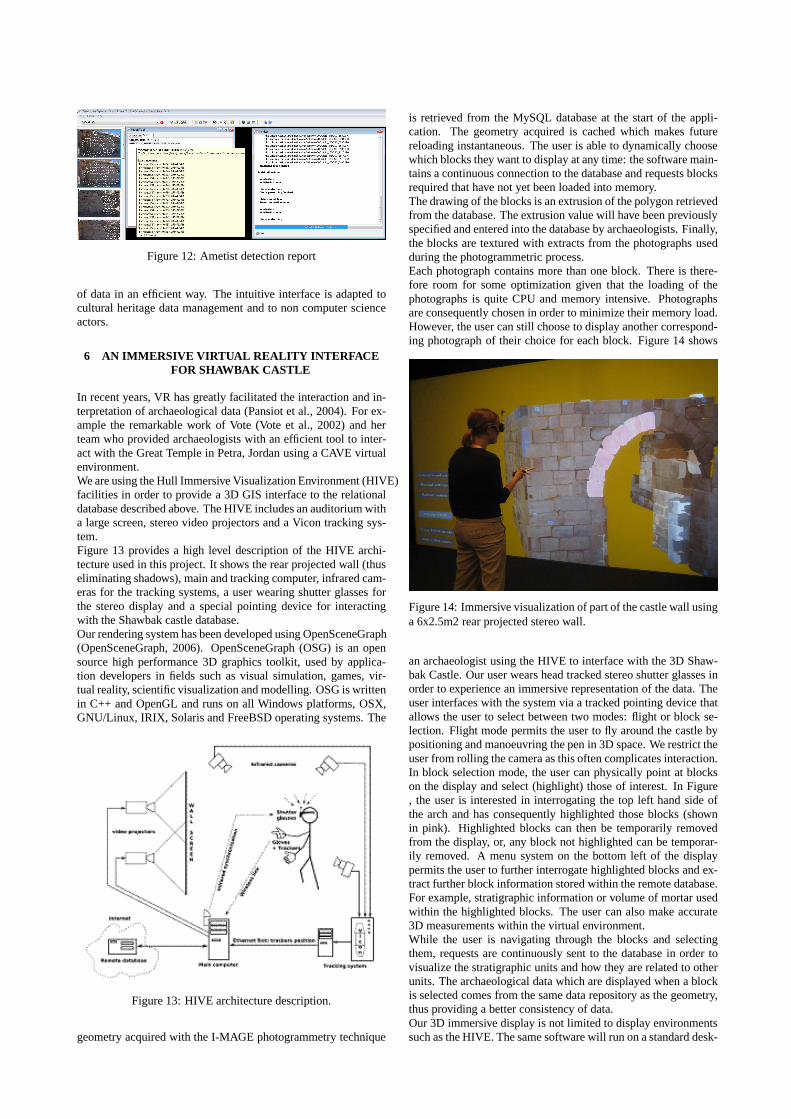
Figure 12: Ametist detection report
of data in an efficient way. The intuitive interface is adapted tocultural heritage data management and to non computer scienceactors.
6 AN IMMERSIVE VIRTUAL REALITY INTERFACEFOR SHAWBAK CASTLE
In recent years, VR has greatly facilitated the interactionand in-terpretation of archaeological data (Pansiot et al., 2004). For ex-ample the remarkable work of Vote (Vote et al., 2002) and herteam who provided archaeologists with an efficient tool to inter-act with the Great Temple in Petra, Jordan using a CAVE virtualenvironment.We are using the Hull Immersive Visualization Environment (HIVE)facilities in order to provide a 3D GIS interface to the relationaldatabase described above. The HIVE includes an auditorium witha large screen, stereo video projectors and a Vicon trackingsys-tem.Figure 13 provides a high level description of the HIVE archi-tecture used in this project. It shows the rear projected wall (thuseliminating shadows), main and tracking computer, infrared cam-eras for the tracking systems, a user wearing shutter glasses forthe stereo display and a special pointing device for interactingwith the Shawbak castle database.Our rendering system has been developed using OpenSceneGraph(OpenSceneGraph, 2006). OpenSceneGraph (OSG) is an opensource high performance 3D graphics toolkit, used by applica-tion developers in fields such as visual simulation, games, vir-tual reality, scientific visualization and modelling. OSG is writtenin C++ and OpenGL and runs on all Windows platforms, OSX,GNU/Linux, IRIX, Solaris and FreeBSD operating systems. The
Figure 13: HIVE architecture description.
geometry acquired with the I-MAGE photogrammetry technique
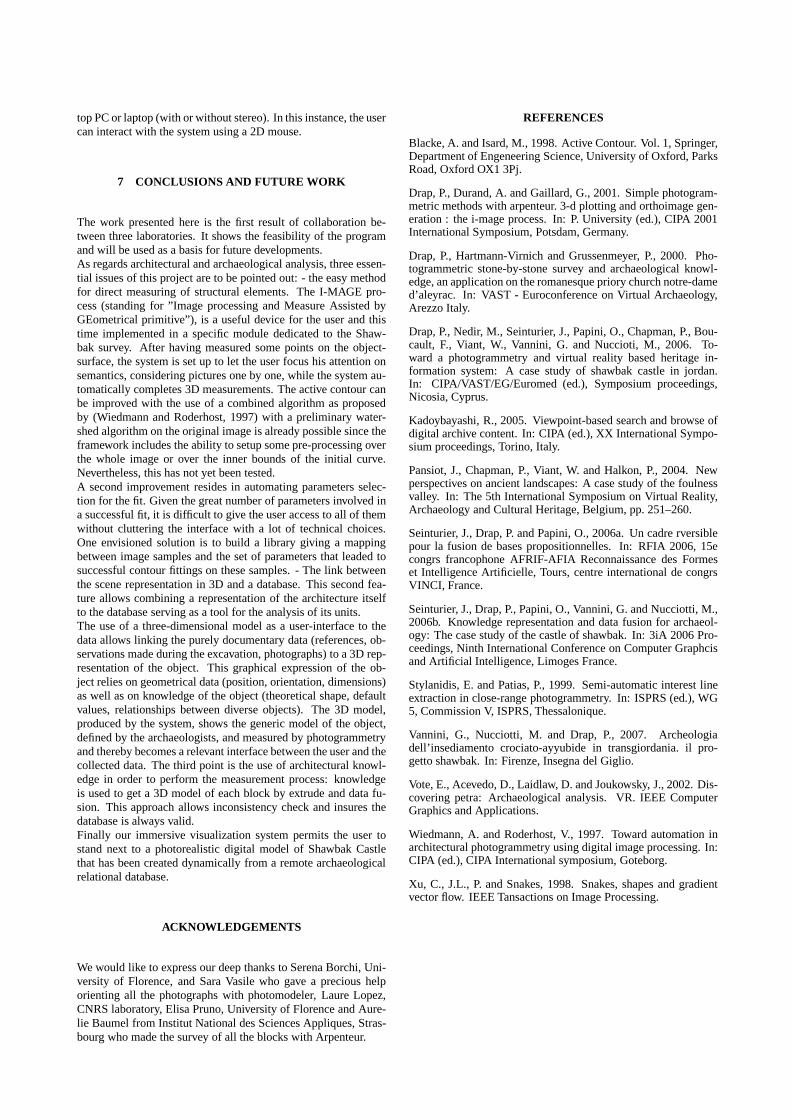
is retrieved from the MySQL database at the start of the appli-cation. The geometry acquired is cached which makes futurereloading instantaneous. The user is able to dynamically choosewhich blocks they want to display at any time: the software main-tains a continuous connection to the database and requests blocksrequired that have not yet been loaded into memory.The drawing of the blocks is an extrusion of the polygon retrievedfrom the database. The extrusion value will have been previouslyspecified and entered into the database by archaeologists. Finally,the blocks are textured with extracts from the photographs usedduring the photogrammetric process.Each photograph contains more than one block. There is there-fore room for some optimization given that the loading of thephotographs is quite CPU and memory intensive. Photographsare consequently chosen in order to minimize their memory load.However, the user can still choose to display another correspond-ing photograph of their choice for each block. Figure 14 shows
Figure 14: Immersive visualization of part of the castle wall usinga 6x2.5m2 rear projected stereo wall.
an archaeologist using the HIVE to interface with the 3D Shaw-bak Castle. Our user wears head tracked stereo shutter glasses inorder to experience an immersive representation of the data. Theuser interfaces with the system via a tracked pointing device thatallows the user to select between two modes: flight or block se-lection. Flight mode permits the user to fly around the castlebypositioning and manoeuvring the pen in 3D space. We restricttheuser from rolling the camera as this often complicates interaction.In block selection mode, the user can physically point at blockson the display and select (highlight) those of interest. In Figure, the user is interested in interrogating the top left hand side ofthe arch and has consequently highlighted those blocks (shownin pink). Highlighted blocks can then be temporarily removedfrom the display, or, any block not highlighted can be temporar-ily removed. A menu system on the bottom left of the displaypermits the user to further interrogate highlighted blocksand ex-tract further block information stored within the remote database.For example, stratigraphic information or volume of mortarusedwithin the highlighted blocks. The user can also make accurate3D measurements within the virtual environment.While the user is navigating through the blocks and selectingthem, requests are continuously sent to the database in order tovisualize the stratigraphic units and how they are related to otherunits. The archaeological data which are displayed when a blockis selected comes from the same data repository as the geometry,thus providing a better consistency of data.Our 3D immersive display is not limited to display environmentssuch as the HIVE. The same software will run on a standard desk-
top PC or laptop (with or without stereo). In this instance, the usercan interact with the system using a 2D mouse.
7 CONCLUSIONS AND FUTURE WORK
The work presented here is the first result of collaboration be-tween three laboratories. It shows the feasibility of the programand will be used as a basis for future developments.As regards architectural and archaeological analysis, three essen-tial issues of this project are to be pointed out: - the easy methodfor direct measuring of structural elements. The I-MAGE pro-cess (standing for ”Image processing and Measure Assisted byGEometrical primitive”), is a useful device for the user andthistime implemented in a specific module dedicated to the Shaw-bak survey. After having measured some points on the object-surface, the system is set up to let the user focus his attention onsemantics, considering pictures one by one, while the system au-tomatically completes 3D measurements. The active contourcanbe improved with the use of a combined algorithm as proposedby (Wiedmann and Roderhost, 1997) with a preliminary water-shed algorithm on the original image is already possible since theframework includes the ability to setup some pre-processing overthe whole image or over the inner bounds of the initial curve.Nevertheless, this has not yet been tested.A second improvement resides in automating parameters selec-tion for the fit. Given the great number of parameters involved ina successful fit, it is difficult to give the user access to all of themwithout cluttering the interface with a lot of technical choices.One envisioned solution is to build a library giving a mappingbetween image samples and the set of parameters that leaded tosuccessful contour fittings on these samples. - The link betweenthe scene representation in 3D and a database. This second fea-ture allows combining a representation of the architectureitselfto the database serving as a tool for the analysis of its units.The use of a three-dimensional model as a user-interface to thedata allows linking the purely documentary data (references, ob-servations made during the excavation, photographs) to a 3Drep-resentation of the object. This graphical expression of theob-ject relies on geometrical data (position, orientation, dimensions)as well as on knowledge of the object (theoretical shape, defaultvalues, relationships between diverse objects). The 3D model,produced by the system, shows the generic model of the object,defined by the archaeologists, and measured by photogrammetryand thereby becomes a relevant interface between the user and thecollected data. The third point is the use of architectural knowl-edge in order to perform the measurement process: knowledgeis used to get a 3D model of each block by extrude and data fu-sion. This approach allows inconsistency check and insuresthedatabase is always valid.Finally our immersive visualization system permits the user tostand next to a photorealistic digital model of Shawbak Castlethat has been created dynamically from a remote archaeologicalrelational database.
ACKNOWLEDGEMENTS
We would like to express our deep thanks to Serena Borchi, Uni-versity of Florence, and Sara Vasile who gave a precious helporienting all the photographs with photomodeler, Laure Lopez,CNRS laboratory, Elisa Pruno, University of Florence and Aure-lie Baumel from Institut National des Sciences Appliques, Stras-bourg who made the survey of all the blocks with Arpenteur.
REFERENCES
Blacke, A. and Isard, M., 1998. Active Contour. Vol. 1, Springer,Department of Engeneering Science, University of Oxford, ParksRoad, Oxford OX1 3Pj.
Drap, P., Durand, A. and Gaillard, G., 2001. Simple photogram-metric methods with arpenteur. 3-d plotting and orthoimagegen-eration : the i-mage process. In: P. University (ed.), CIPA 2001International Symposium, Potsdam, Germany.
Drap, P., Hartmann-Virnich and Grussenmeyer, P., 2000. Pho-togrammetric stone-by-stone survey and archaeological knowl-edge, an application on the romanesque priory church notre-damed’aleyrac. In: VAST - Euroconference on Virtual Archaeology,Arezzo Italy.
Drap, P., Nedir, M., Seinturier, J., Papini, O., Chapman, P., Bou-cault, F., Viant, W., Vannini, G. and Nuccioti, M., 2006. To-ward a photogrammetry and virtual reality based heritage in-formation system: A case study of shawbak castle in jordan.In: CIPA/VAST/EG/Euromed (ed.), Symposium proceedings,Nicosia, Cyprus.
Kadoybayashi, R., 2005. Viewpoint-based search and browseofdigital archive content. In: CIPA (ed.), XX International Sympo-sium proceedings, Torino, Italy.
Pansiot, J., Chapman, P., Viant, W. and Halkon, P., 2004. Newperspectives on ancient landscapes: A case study of the foulnessvalley. In: The 5th International Symposium on Virtual Reality,Archaeology and Cultural Heritage, Belgium, pp. 251–260.
Seinturier, J., Drap, P. and Papini, O., 2006a. Un cadre rversiblepour la fusion de bases propositionnelles. In: RFIA 2006, 15econgrs francophone AFRIF-AFIA Reconnaissance des Formeset Intelligence Artificielle, Tours, centre internationalde congrsVINCI, France.
Seinturier, J., Drap, P., Papini, O., Vannini, G. and Nucciotti, M.,2006b. Knowledge representation and data fusion for archaeol-ogy: The case study of the castle of shawbak. In: 3iA 2006 Pro-ceedings, Ninth International Conference on Computer Graphcisand Artificial Intelligence, Limoges France.
Stylanidis, E. and Patias, P., 1999. Semi-automatic interest lineextraction in close-range photogrammetry. In: ISPRS (ed.), WG5, Commission V, ISPRS, Thessalonique.
Vannini, G., Nucciotti, M. and Drap, P., 2007. Archeologiadell’insediamento crociato-ayyubide in transgiordania.il pro-getto shawbak. In: Firenze, Insegna del Giglio.
Vote, E., Acevedo, D., Laidlaw, D. and Joukowsky, J., 2002. Dis-covering petra: Archaeological analysis. VR. IEEE ComputerGraphics and Applications.
Wiedmann, A. and Roderhost, V., 1997. Toward automation inarchitectural photogrammetry using digital image processing. In:CIPA (ed.), CIPA International symposium, Goteborg.
Xu, C., J.L., P. and Snakes, 1998. Snakes, shapes and gradientvector flow. IEEE Tansactions on Image Processing.