photobioreactor ethanol quantitation and optimization...
TRANSCRIPT
Photobioreactor ethanol quantitation and optimization using the Thermo Scientific Prima BT bench top mass spectrometerKevin Hettenbach and Kari Paisley-Flango, Joule Unlimited Technologies, Inc., Bedford, MA, USARobert Wright, Thermo Fisher Scientific, Winsford, Chesire, UK
Key WordsMagnetic sector, modified ion source, photobioreactor, ethanol quantitation,
Carbon dioxide (CO2) utilization, oxygen generation, sampling frequency,
process mass spectrometer
AbstractOn-line mass spectrometry (MS) was implemented and developed as a tool to
monitor and quantify ethanol vapor productivity from multiple laboratory
photobioreactors. Oxygen generation and carbon dioxide utilization profiles
were measured for increased process understanding and optimization. A
magnetic sector MS was found to provide enhanced stability and accuracy
relative to a quadrupole MS. A modified ion source with glass lined entrance
was utilized to enhance ethanol response and reduce detector settling time.
Ethanol mass balance values, comparing on-line vapor MS measurements to
liquid gas chromatography samples, were within 7%. Measured ethanol vapor
concentration correlated well with values predicted by an ethanol-water
vapor-liquid equilibrium model (Aspen Plus ®). The MS technique is relatively
simple to interface to equipment, requires no direct sample contact, requires
minimal maintenance, allows sampling of multiple components simultaneously,
and provides fast measurement for increased sampling frequency from multiple
reactors. Use of MS significantly reduced process development time for
effective strain selection and ethanol productivity optimization.
On-Line Mass SpectrometryOn-line or process mass spectrometers perform multi-component and multi-stream gas analysis with fast measurement rates (seconds) over a wide dynamic range (100% down to ppm). The mass spectrometer (MS) switches from one sample stream to another using a multi-port stream selector. The instrument is controlled by an embedded processor that also provides Modbus RTU communication to an external control/data acquisition system (DAS). MS application software runs on a computer connected to the instrument via a serial link. This computer provides data logging, trending, review and OPC communications. The computer also enables method configurations, tuning and diagnostics.
The sample gas conditioning requirements for an MS are similar to those of other process gas analyzers. The gas needs filtering and pressure regulation to provide sufficient flow (typically between 0.2 and 1.0 L/min) of clean sample gas to the mass spectrometer; water is not a problem for the analyzer, unless it starts to condense. To avoid condensation of water, heated sample lines are utilized to maintain a temperature above the photobioreactor process temperature
(typically 80°C). The maintenance requirements of the MS are not high - service intervals are typically annual with normal uptime at greater than 99.8%. There are a few basic elements that are common to all mass spectrometers:
• An inlet to introduce the sample gas into the vacuum of the mass spectrometer
• An ion source to convert the sample gas molecules into positively charged ions
• A mass filter to separate the ions using magnetic or electric fields
• A detector to quantify the amounts of ions at different masses and a vacuum system
The inlet of the MS typically introduces a small flow, approximately 0.2 μL/sec into the ion source. Such a small sample flow is essential to maintain a high vacuum in the MS, otherwise excessive ionization and ion-molecule interactions would degrade the linearity and resolution. In the ion source, a very small fraction, about one in a million, sample molecules are ionized by electron impact using a heated cathode filament. Extraction lens voltages accelerate and direct the resulting positively charged ions as a beam (ca. 1×10⁻⁹ amps) into the mass filter.
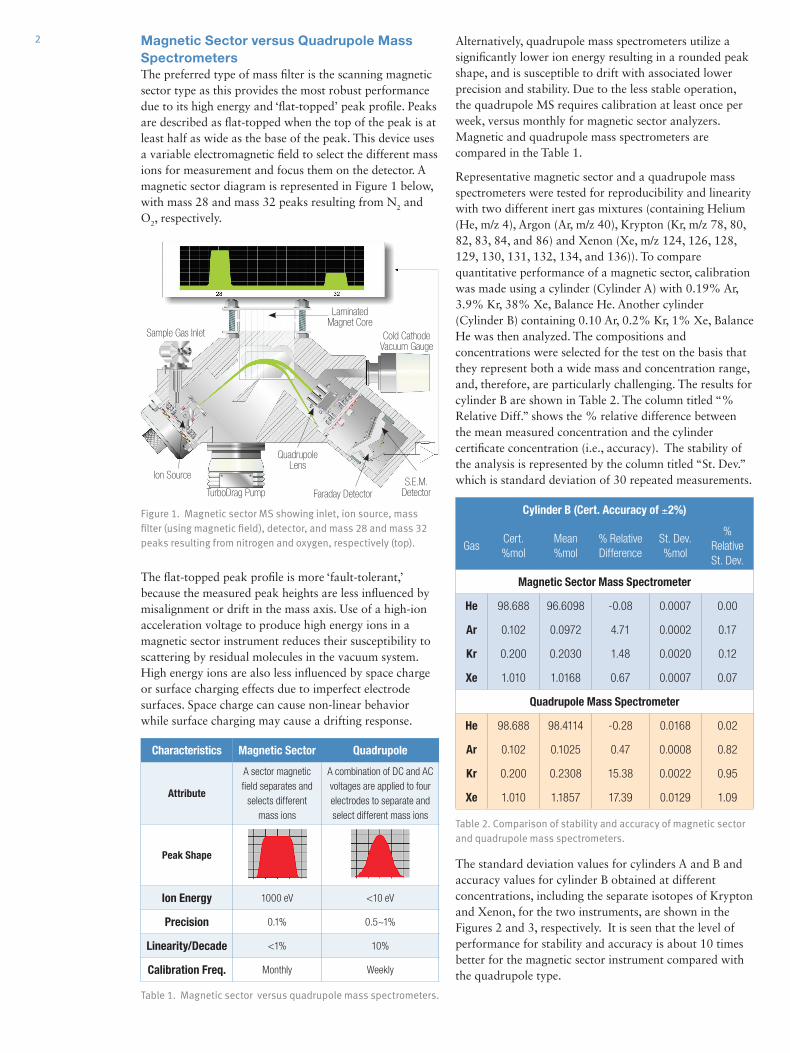
2 Alternatively, quadrupole mass spectrometers utilize a significantly lower ion energy resulting in a rounded peak shape, and is susceptible to drift with associated lower precision and stability. Due to the less stable operation, the quadrupole MS requires calibration at least once per week, versus monthly for magnetic sector analyzers.Magnetic and quadrupole mass spectrometers are compared in the Table 1.
Representative magnetic sector and a quadrupole mass spectrometers were tested for reproducibility and linearity with two different inert gas mixtures (containing Helium (He, m/z 4), Argon (Ar, m/z 40), Krypton (Kr, m/z 78, 80, 82, 83, 84, and 86) and Xenon (Xe, m/z 124, 126, 128, 129, 130, 131, 132, 134, and 136)). To compare quantitative performance of a magnetic sector, calibration was made using a cylinder (Cylinder A) with 0.19% Ar, 3.9% Kr, 38% Xe, Balance He. Another cylinder (Cylinder B) containing 0.10 Ar, 0.2% Kr, 1% Xe, Balance He was then analyzed. The compositions and concentrations were selected for the test on the basis that they represent both a wide mass and concentration range, and, therefore, are particularly challenging. The results for cylinder B are shown in Table 2. The column titled “% Relative Diff.” shows the % relative difference between the mean measured concentration and the cylinder certificate concentration (i.e., accuracy). The stability of the analysis is represented by the column titled “St. Dev.” which is standard deviation of 30 repeated measurements.
Cylinder B (Cert. Accuracy of ±2%)
GasCert. %mol
Mean %mol
% Relative Difference
St. Dev. %mol
% Relative St. Dev.
Magnetic Sector Mass Spectrometer
He 98.688 96.6098 -0.08 0.0007 0.00
Ar 0.102 0.0972 4.71 0.0002 0.17
Kr 0.200 0.2030 1.48 0.0020 0.12
Xe 1.010 1.0168 0.67 0.0007 0.07
Quadrupole Mass Spectrometer
He 98.688 98.4114 -0.28 0.0168 0.02
Ar 0.102 0.1025 0.47 0.0008 0.82
Kr 0.200 0.2308 15.38 0.0022 0.95
Xe 1.010 1.1857 17.39 0.0129 1.09
The standard deviation values for cylinders A and B and accuracy values for cylinder B obtained at different concentrations, including the separate isotopes of Krypton and Xenon, for the two instruments, are shown in the Figures 2 and 3, respectively. It is seen that the level of performance for stability and accuracy is about 10 times better for the magnetic sector instrument compared with the quadrupole type.
Magnetic Sector versus Quadrupole Mass SpectrometersThe preferred type of mass filter is the scanning magnetic sector type as this provides the most robust performance due to its high energy and ‘flat-topped’ peak profile. Peaks are described as flat-topped when the top of the peak is at least half as wide as the base of the peak. This device uses a variable electromagnetic field to select the different mass ions for measurement and focus them on the detector. A magnetic sector diagram is represented in Figure 1 below, with mass 28 and mass 32 peaks resulting from N2 and O2, respectively.
The flat-topped peak profile is more ‘fault-tolerant,’ because the measured peak heights are less influenced by misalignment or drift in the mass axis. Use of a high-ion acceleration voltage to produce high energy ions in a magnetic sector instrument reduces their susceptibility to scattering by residual molecules in the vacuum system. High energy ions are also less influenced by space charge or surface charging effects due to imperfect electrode surfaces. Space charge can cause non-linear behavior while surface charging may cause a drifting response.
Characteristics Magnetic Sector Quadrupole
Attribute
A sector magnetic field separates and
selects different mass ions
A combination of DC and AC voltages are applied to four electrodes to separate and select different mass ions
Peak Shape
Ion Energy 1000 eV <10 eV
Precision 0.1% 0.5~1%
Linearity/Decade <1% 10%
Calibration Freq. Monthly Weekly
Laminated Magnet Core
Cold Cathode Vacuum Gauge
Sample Gas Inlet
Ion Source
Quadrupole Lens
TurboDrag Pump Faraday DetectorS.E.M.
Detector
Figure 1. Magnetic sector MS showing inlet, ion source, mass filter (using magnetic field), detector, and mass 28 and mass 32 peaks resulting from nitrogen and oxygen, respectively (top).
Table 1. Magnetic sector versus quadrupole mass spectrometers.
Table 2. Comparison of stability and accuracy of magnetic sector and quadrupole mass spectrometers.
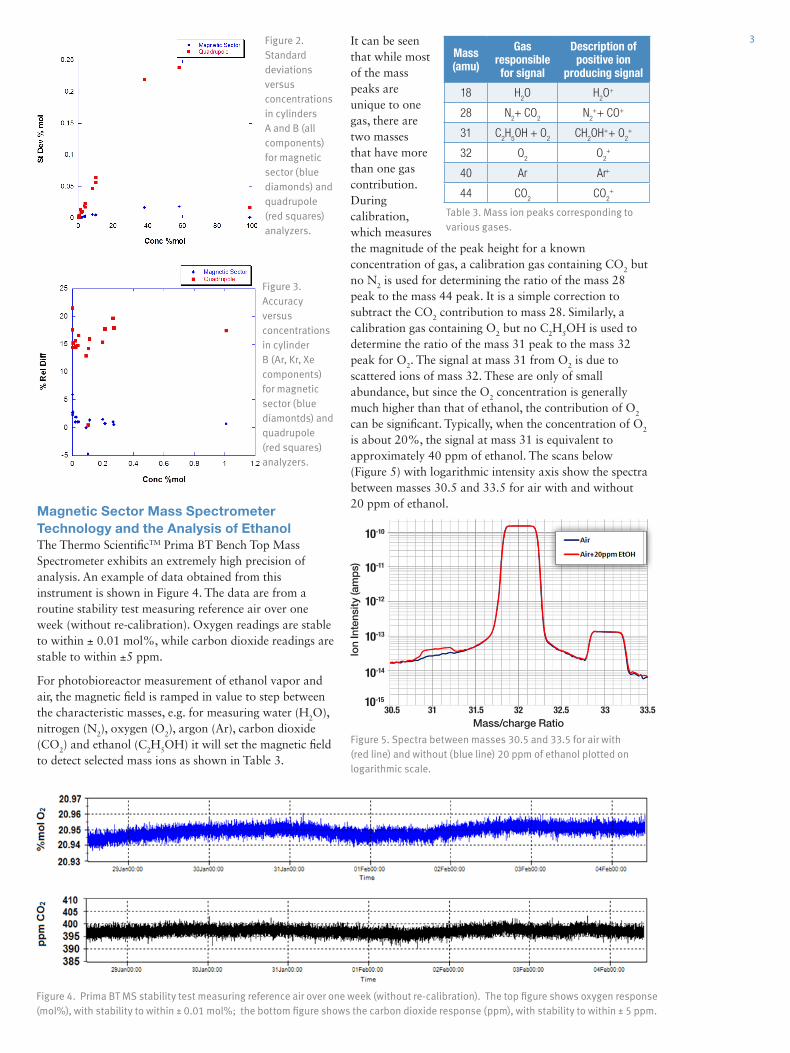
3It can be seen that while most of the mass peaks are unique to one gas, there are two masses that have more than one gas contribution. During calibration, which measures the magnitude of the peak height for a known concentration of gas, a calibration gas containing CO2 but no N2 is used for determining the ratio of the mass 28 peak to the mass 44 peak. It is a simple correction to subtract the CO2 contribution to mass 28. Similarly, a calibration gas containing O2 but no C2H5OH is used to determine the ratio of the mass 31 peak to the mass 32 peak for O2. The signal at mass 31 from O2 is due to scattered ions of mass 32. These are only of small abundance, but since the O2 concentration is generally much higher than that of ethanol, the contribution of O2 can be significant. Typically, when the concentration of O2 is about 20%, the signal at mass 31 is equivalent to approximately 40 ppm of ethanol. The scans below (Figure 5) with logarithmic intensity axis show the spectra between masses 30.5 and 33.5 for air with and without 20 ppm of ethanol.
Magnetic Sector Mass Spectrometer Technology and the Analysis of EthanolThe Thermo ScientificTM Prima BT Bench Top Mass Spectrometer exhibits an extremely high precision of analysis. An example of data obtained from this instrument is shown in Figure 4. The data are from a routine stability test measuring reference air over one week (without re-calibration). Oxygen readings are stable to within ± 0.01 mol%, while carbon dioxide readings are stable to within ±5 ppm.
For photobioreactor measurement of ethanol vapor and air, the magnetic field is ramped in value to step between the characteristic masses, e.g. for measuring water (H2O), nitrogen (N2), oxygen (O2), argon (Ar), carbon dioxide (CO2) and ethanol (C2H5OH) it will set the magnetic field to detect selected mass ions as shown in Table 3.
Figure 4. Prima BT MS stability test measuring reference air over one week (without re-calibration). The top figure shows oxygen response (mol%), with stability to within ± 0.01 mol%; the bottom figure shows the carbon dioxide response (ppm), with stability to within ± 5 ppm.
Table 3. Mass ion peaks corresponding to various gases.
Figure 2. Standard deviations versus concentrations in cylinders A and B (all components) for magnetic sector (blue diamonds) and quadrupole (red squares) analyzers.
Figure 3. Accuracy versus concentrations in cylinder B (Ar, Kr, Xe components) for magnetic sector (blue diamontds) and quadrupole (red squares) analyzers.
Mass (amu)
Gas responsible for signal
Description of positive ion
producing signal
18 H2O H
2O+
28 N2+ CO
2N
2++ CO+
31 C2H
5OH + O
2CH
2OH++ O
2+
32 O2
O2+
40 Ar Ar+
44 CO2
CO2+
Figure 5. Spectra between masses 30.5 and 33.5 for air with (red line) and without (blue line) 20 ppm of ethanol plotted on logarithmic scale.
10-10
10-11
10-12
10-13
10-15
10-14
Ion
Inte
nsity
(am
ps)
30.5 31 31.5 32 32.5 33 33.5Mass/charge Ratio
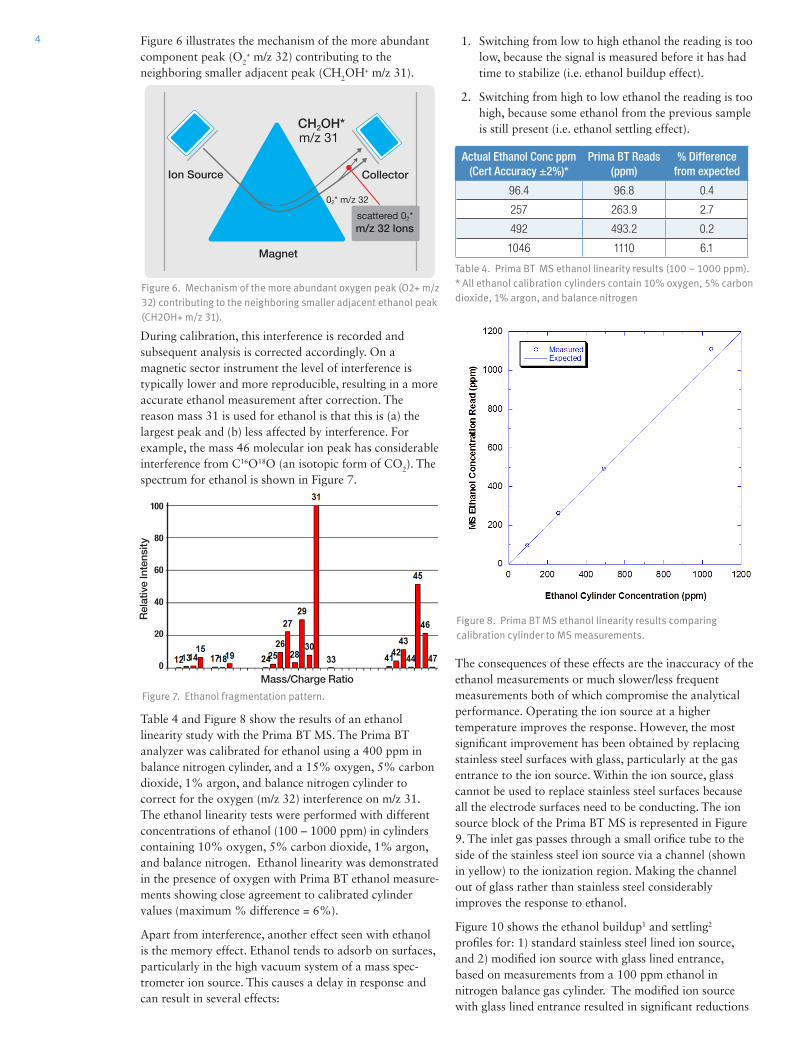
4 Figure 6 illustrates the mechanism of the more abundant component peak (O2
+ m/z 32) contributing to the neighboring smaller adjacent peak (CH2OH+ m/z 31).
During calibration, this interference is recorded and subsequent analysis is corrected accordingly. On a magnetic sector instrument the level of interference is typically lower and more reproducible, resulting in a more accurate ethanol measurement after correction. The reason mass 31 is used for ethanol is that this is (a) the largest peak and (b) less affected by interference. For example, the mass 46 molecular ion peak has considerable interference from C16O18O (an isotopic form of CO2). The spectrum for ethanol is shown in Figure 7.
Table 4 and Figure 8 show the results of an ethanol linearity study with the Prima BT MS. The Prima BT analyzer was calibrated for ethanol using a 400 ppm in balance nitrogen cylinder, and a 15% oxygen, 5% carbon dioxide, 1% argon, and balance nitrogen cylinder to correct for the oxygen (m/z 32) interference on m/z 31. The ethanol linearity tests were performed with different concentrations of ethanol (100 – 1000 ppm) in cylinders containing 10% oxygen, 5% carbon dioxide, 1% argon, and balance nitrogen. Ethanol linearity was demonstrated in the presence of oxygen with Prima BT ethanol measure-ments showing close agreement to calibrated cylinder values (maximum % difference = 6%).
Apart from interference, another effect seen with ethanol is the memory effect. Ethanol tends to adsorb on surfaces, particularly in the high vacuum system of a mass spec-trometer ion source. This causes a delay in response and can result in several effects:
1. Switching from low to high ethanol the reading is too low, because the signal is measured before it has had time to stabilize (i.e. ethanol buildup effect).
2. Switching from high to low ethanol the reading is too high, because some ethanol from the previous sample is still present (i.e. ethanol settling effect).
Actual Ethanol Conc ppm (Cert Accuracy ±2%)*
Prima BT Reads (ppm)
% Difference from expected
96.4 96.8 0.4
257 263.9 2.7
492 493.2 0.2
1046 1110 6.1
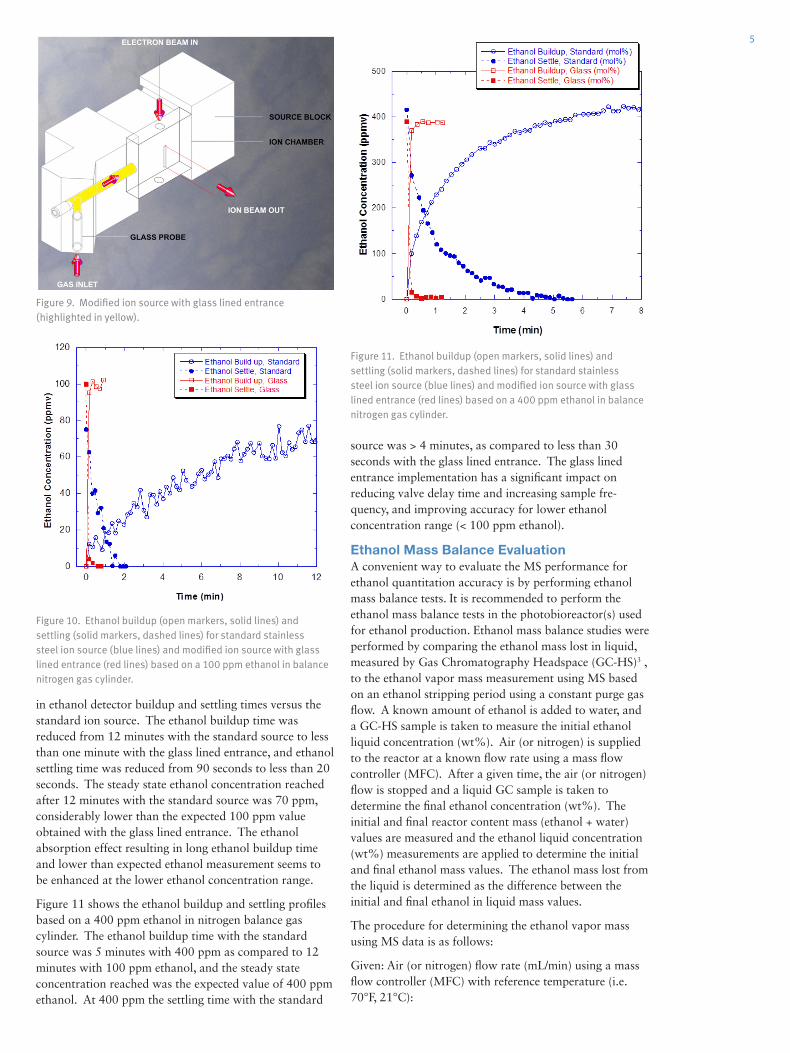
The consequences of these effects are the inaccuracy of the ethanol measurements or much slower/less frequent measurements both of which compromise the analytical performance. Operating the ion source at a higher temperature improves the response. However, the most significant improvement has been obtained by replacing stainless steel surfaces with glass, particularly at the gas entrance to the ion source. Within the ion source, glass cannot be used to replace stainless steel surfaces because all the electrode surfaces need to be conducting. The ion source block of the Prima BT MS is represented in Figure 9. The inlet gas passes through a small orifice tube to the side of the stainless steel ion source via a channel (shown in yellow) to the ionization region. Making the channel out of glass rather than stainless steel considerably improves the response to ethanol.
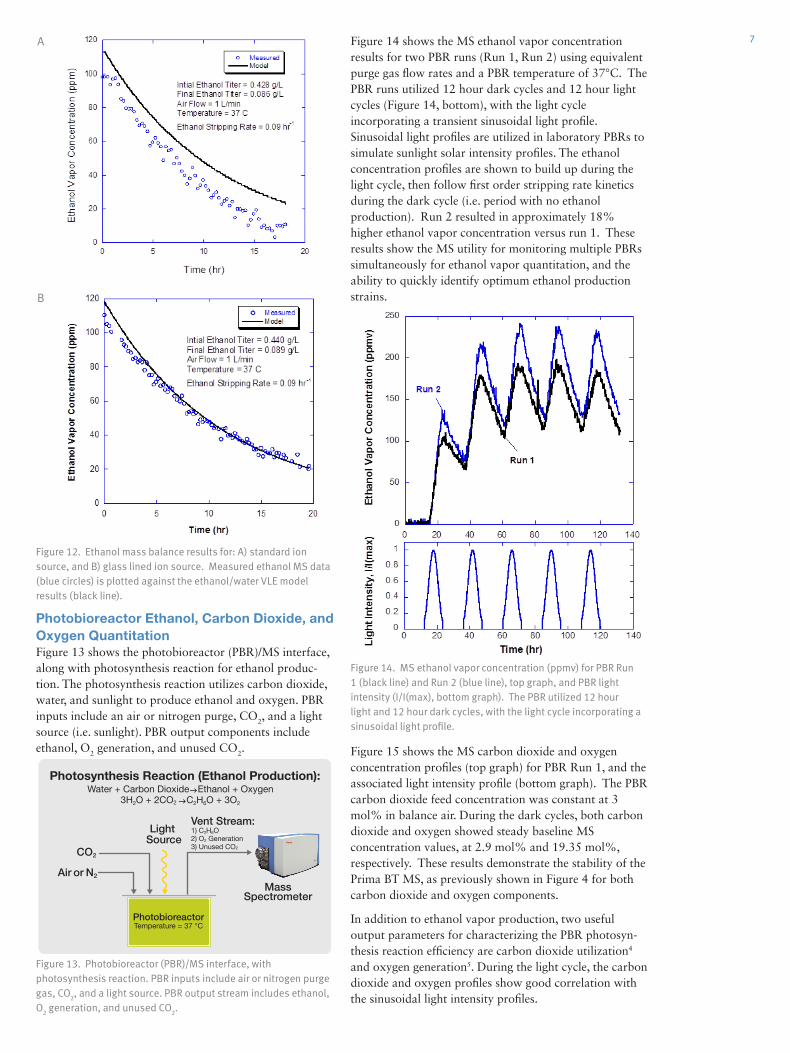
Figure 10 shows the ethanol buildup1 and settling2 profiles for: 1) standard stainless steel lined ion source, and 2) modified ion source with glass lined entrance, based on measurements from a 100 ppm ethanol in nitrogen balance gas cylinder. The modified ion source with glass lined entrance resulted in significant reductions
Table 4. Prima BT MS ethanol linearity results (100 – 1000 ppm). * All ethanol calibration cylinders contain 10% oxygen, 5% carbon dioxide, 1% argon, and balance nitrogen
Figure 7. Ethanol fragmentation pattern.
Mass/Charge Ratio
100
80
60
40
20
0
Rel
ativ
e In
tens
ity
Figure 8. Prima BT MS ethanol linearity results comparing calibration cylinder to MS measurements.
Figure 6. Mechanism of the more abundant oxygen peak (O2+ m/z 32) contributing to the neighboring smaller adjacent ethanol peak (CH2OH+ m/z 31).
Collector
Magnet
CH2OH*
scattered 02*
m/z 31
02* m/z 32
m/z 32 lons
Ion Source
5
source was > 4 minutes, as compared to less than 30 seconds with the glass lined entrance. The glass lined entrance implementation has a significant impact on reducing valve delay time and increasing sample fre-quency, and improving accuracy for lower ethanol concentration range (< 100 ppm ethanol).
Ethanol Mass Balance EvaluationA convenient way to evaluate the MS performance for ethanol quantitation accuracy is by performing ethanol mass balance tests. It is recommended to perform the ethanol mass balance tests in the photobioreactor(s) used for ethanol production. Ethanol mass balance studies were performed by comparing the ethanol mass lost in liquid, measured by Gas Chromatography Headspace (GC-HS)3 , to the ethanol vapor mass measurement using MS based on an ethanol stripping period using a constant purge gas flow. A known amount of ethanol is added to water, and a GC-HS sample is taken to measure the initial ethanol liquid concentration (wt%). Air (or nitrogen) is supplied to the reactor at a known flow rate using a mass flow controller (MFC). After a given time, the air (or nitrogen) flow is stopped and a liquid GC sample is taken to determine the final ethanol concentration (wt%). The initial and final reactor content mass (ethanol + water) values are measured and the ethanol liquid concentration (wt%) measurements are applied to determine the initial and final ethanol mass values. The ethanol mass lost from the liquid is determined as the difference between the initial and final ethanol in liquid mass values.
The procedure for determining the ethanol vapor mass using MS data is as follows:
Given: Air (or nitrogen) flow rate (mL/min) using a mass flow controller (MFC) with reference temperature (i.e. 70°F, 21°C):
in ethanol detector buildup and settling times versus the standard ion source. The ethanol buildup time was reduced from 12 minutes with the standard source to less than one minute with the glass lined entrance, and ethanol settling time was reduced from 90 seconds to less than 20 seconds. The steady state ethanol concentration reached after 12 minutes with the standard source was 70 ppm, considerably lower than the expected 100 ppm value obtained with the glass lined entrance. The ethanol absorption effect resulting in long ethanol buildup time and lower than expected ethanol measurement seems to be enhanced at the lower ethanol concentration range.
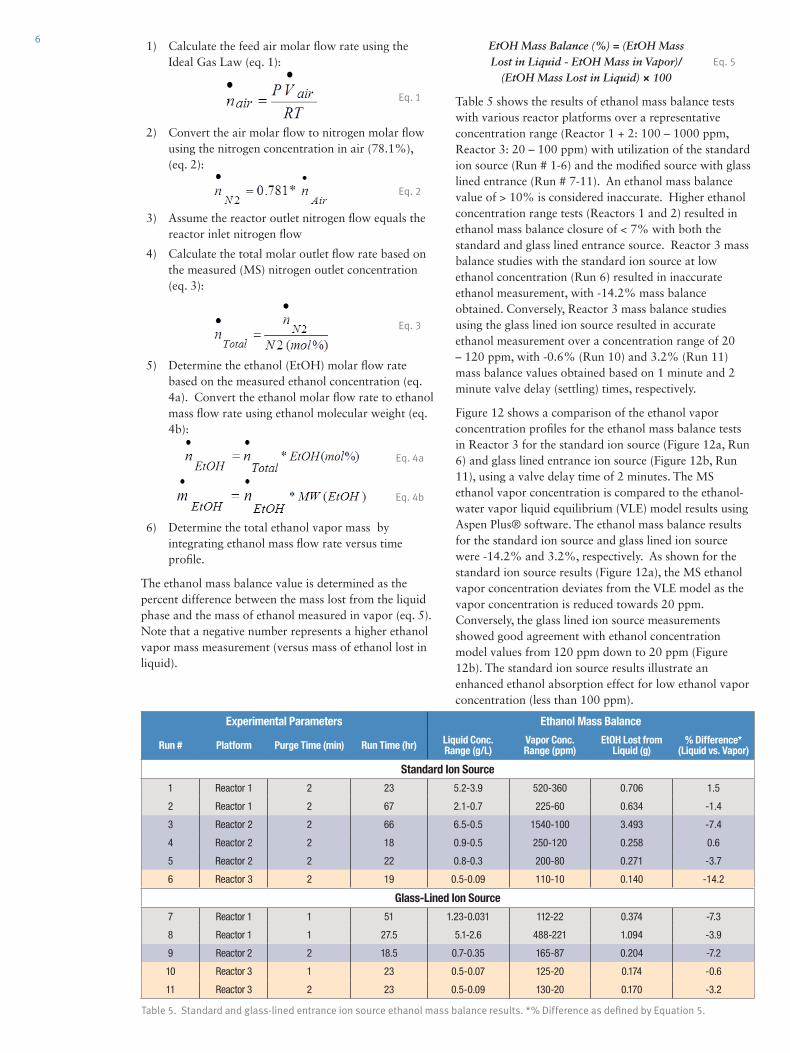
Figure 11 shows the ethanol buildup and settling profiles based on a 400 ppm ethanol in nitrogen balance gas cylinder. The ethanol buildup time with the standard source was 5 minutes with 400 ppm as compared to 12 minutes with 100 ppm ethanol, and the steady state concentration reached was the expected value of 400 ppm ethanol. At 400 ppm the settling time with the standard
Figure 9. Modified ion source with glass lined entrance (highlighted in yellow).
Figure 10. Ethanol buildup (open markers, solid lines) and settling (solid markers, dashed lines) for standard stainless steel ion source (blue lines) and modified ion source with glass lined entrance (red lines) based on a 100 ppm ethanol in balance nitrogen gas cylinder.
Figure 11. Ethanol buildup (open markers, solid lines) and settling (solid markers, dashed lines) for standard stainless steel ion source (blue lines) and modified ion source with glass lined entrance (red lines) based on a 400 ppm ethanol in balance nitrogen gas cylinder.
6EtOH Mass Balance (%) = (EtOH Mass Lost in Liquid - EtOH Mass in Vapor)/
(EtOH Mass Lost in Liquid) × 100Eq. 5
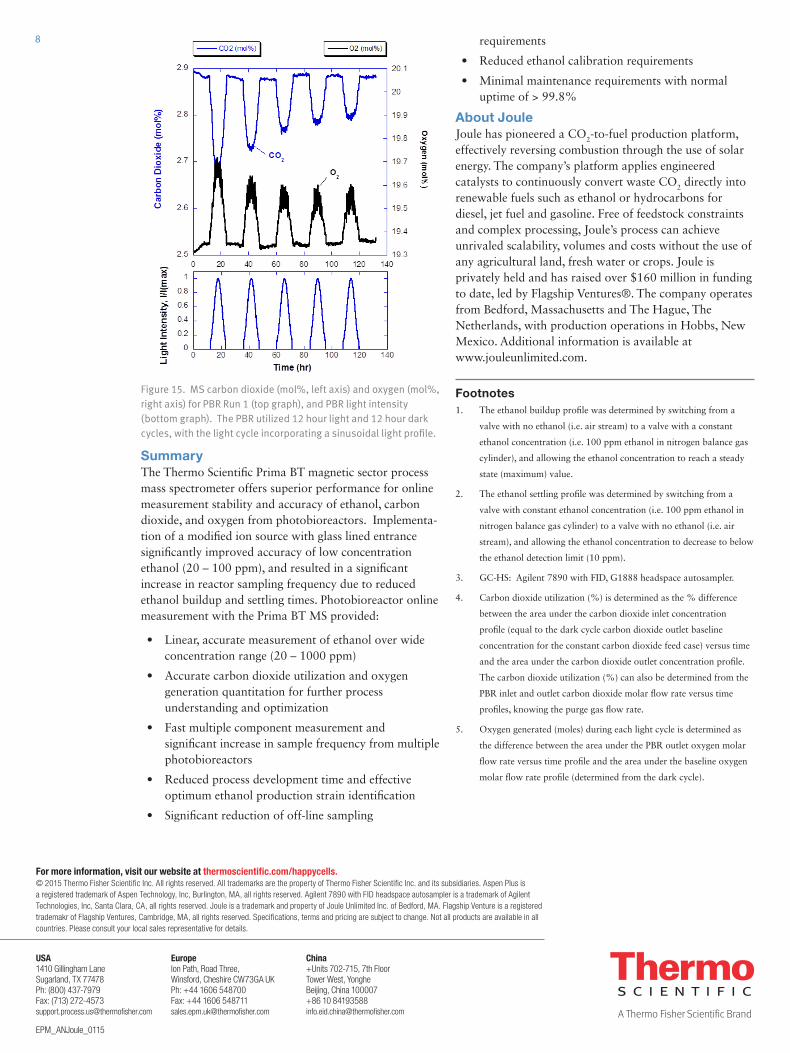
Table 5 shows the results of ethanol mass balance tests with various reactor platforms over a representative concentration range (Reactor 1 + 2: 100 – 1000 ppm, Reactor 3: 20 – 100 ppm) with utilization of the standard ion source (Run # 1-6) and the modified source with glass lined entrance (Run # 7-11). An ethanol mass balance value of > 10% is considered inaccurate. Higher ethanol concentration range tests (Reactors 1 and 2) resulted in ethanol mass balance closure of < 7% with both the standard and glass lined entrance source. Reactor 3 mass balance studies with the standard ion source at low ethanol concentration (Run 6) resulted in inaccurate ethanol measurement, with -14.2% mass balance obtained. Conversely, Reactor 3 mass balance studies using the glass lined ion source resulted in accurate ethanol measurement over a concentration range of 20 – 120 ppm, with -0.6% (Run 10) and 3.2% (Run 11) mass balance values obtained based on 1 minute and 2 minute valve delay (settling) times, respectively.
Figure 12 shows a comparison of the ethanol vapor concentration profiles for the ethanol mass balance tests in Reactor 3 for the standard ion source (Figure 12a, Run 6) and glass lined entrance ion source (Figure 12b, Run 11), using a valve delay time of 2 minutes. The MS ethanol vapor concentration is compared to the ethanol-water vapor liquid equilibrium (VLE) model results using Aspen Plus® software. The ethanol mass balance results for the standard ion source and glass lined ion source were -14.2% and 3.2%, respectively. As shown for the standard ion source results (Figure 12a), the MS ethanol vapor concentration deviates from the VLE model as the vapor concentration is reduced towards 20 ppm. Conversely, the glass lined ion source measurements showed good agreement with ethanol concentration model values from 120 ppm down to 20 ppm (Figure 12b). The standard ion source results illustrate an enhanced ethanol absorption effect for low ethanol vapor concentration (less than 100 ppm).
1) Calculate the feed air molar flow rate using the Ideal Gas Law (eq. 1):
Eq. 1
2) Convert the air molar flow to nitrogen molar flow using the nitrogen concentration in air (78.1%), (eq. 2):
Eq. 2
3) Assume the reactor outlet nitrogen flow equals the reactor inlet nitrogen flow
4) Calculate the total molar outlet flow rate based on the measured (MS) nitrogen outlet concentration (eq. 3):
Eq. 3
5) Determine the ethanol (EtOH) molar flow rate based on the measured ethanol concentration (eq. 4a). Convert the ethanol molar flow rate to ethanol mass flow rate using ethanol molecular weight (eq. 4b):
Eq. 4a
Eq. 4b
6) Determine the total ethanol vapor mass by integrating ethanol mass flow rate versus time profile.
The ethanol mass balance value is determined as the percent difference between the mass lost from the liquid phase and the mass of ethanol measured in vapor (eq. 5). Note that a negative number represents a higher ethanol vapor mass measurement (versus mass of ethanol lost in liquid).
Experimental Parameters Ethanol Mass Balance
Run # Platform Purge Time (min) Run Time (hr) Liquid Conc. Range (g/L)
Vapor Conc. Range (ppm)
EtOH Lost from Liquid (g)
% Difference* (Liquid vs. Vapor)
Standard Ion Source
1 Reactor 1 2 23 5.2-3.9 520-360 0.706 1.5
2 Reactor 1 2 67 2.1-0.7 225-60 0.634 -1.4
3 Reactor 2 2 66 6.5-0.5 1540-100 3.493 -7.4
4 Reactor 2 2 18 0.9-0.5 250-120 0.258 0.6
5 Reactor 2 2 22 0.8-0.3 200-80 0.271 -3.7
6 Reactor 3 2 19 0.5-0.09 110-10 0.140 -14.2
Glass-Lined Ion Source
7 Reactor 1 1 51 1.23-0.031 112-22 0.374 -7.3
8 Reactor 1 1 27.5 5.1-2.6 488-221 1.094 -3.9
9 Reactor 2 2 18.5 0.7-0.35 165-87 0.204 -7.2
10 Reactor 3 1 23 0.5-0.07 125-20 0.174 -0.6
11 Reactor 3 2 23 0.5-0.09 130-20 0.170 -3.2
Table 5. Standard and glass-lined entrance ion source ethanol mass balance results. *% Difference as defined by Equation 5.
7
Photobioreactor Ethanol, Carbon Dioxide, and Oxygen QuantitationFigure 13 shows the photobioreactor (PBR)/MS interface, along with photosynthesis reaction for ethanol produc-tion. The photosynthesis reaction utilizes carbon dioxide, water, and sunlight to produce ethanol and oxygen. PBR inputs include an air or nitrogen purge, CO2, and a light source (i.e. sunlight). PBR output components include ethanol, O2 generation, and unused CO2.
Figure 14 shows the MS ethanol vapor concentration results for two PBR runs (Run 1, Run 2) using equivalent purge gas flow rates and a PBR temperature of 37°C. The PBR runs utilized 12 hour dark cycles and 12 hour light cycles (Figure 14, bottom), with the light cycle incorporating a transient sinusoidal light profile. Sinusoidal light profiles are utilized in laboratory PBRs to simulate sunlight solar intensity profiles. The ethanol concentration profiles are shown to build up during the light cycle, then follow first order stripping rate kinetics during the dark cycle (i.e. period with no ethanol production). Run 2 resulted in approximately 18% higher ethanol vapor concentration versus run 1. These results show the MS utility for monitoring multiple PBRs simultaneously for ethanol vapor quantitation, and the ability to quickly identify optimum ethanol production strains.
Figure 15 shows the MS carbon dioxide and oxygen concentration profiles (top graph) for PBR Run 1, and the associated light intensity profile (bottom graph). The PBR carbon dioxide feed concentration was constant at 3 mol% in balance air. During the dark cycles, both carbon dioxide and oxygen showed steady baseline MS concentration values, at 2.9 mol% and 19.35 mol%, respectively. These results demonstrate the stability of the Prima BT MS, as previously shown in Figure 4 for both carbon dioxide and oxygen components.
In addition to ethanol vapor production, two useful output parameters for characterizing the PBR photosyn-thesis reaction efficiency are carbon dioxide utilization4 and oxygen generation5. During the light cycle, the carbon dioxide and oxygen profiles show good correlation with the sinusoidal light intensity profiles.
Figure 14. MS ethanol vapor concentration (ppmv) for PBR Run 1 (black line) and Run 2 (blue line), top graph, and PBR light intensity (I/I(max), bottom graph). The PBR utilized 12 hour light and 12 hour dark cycles, with the light cycle incorporating a sinusoidal light profile.
A
Figure 12. Ethanol mass balance results for: A) standard ion source, and B) glass lined ion source. Measured ethanol MS data (blue circles) is plotted against the ethanol/water VLE model results (black line).
B
Figure 13. Photobioreactor (PBR)/MS interface, with photosynthesis reaction. PBR inputs include air or nitrogen purge gas, CO
2, and a light source. PBR output stream includes ethanol,
O2 generation, and unused CO
2.
Photosynthesis Reaction (Ethanol Production):Water + Carbon DioxidegEthanol + Oxygen
3H2O + 2CO2 gC2H6O + 3O2
CO2
Air or N2
Light Source
Vent Stream:1) C2H6O2) O2 Generation3) Unused CO2
MassSpectrometer
PhotobioreactorTemperature = 37 °C
8 requirements
• Reduced ethanol calibration requirements
• Minimal maintenance requirements with normal uptime of > 99.8%
About Joule Joule has pioneered a CO2-to-fuel production platform, effectively reversing combustion through the use of solar energy. The company’s platform applies engineered catalysts to continuously convert waste CO2 directly into renewable fuels such as ethanol or hydrocarbons for diesel, jet fuel and gasoline. Free of feedstock constraints and complex processing, Joule’s process can achieve unrivaled scalability, volumes and costs without the use of any agricultural land, fresh water or crops. Joule is privately held and has raised over $160 million in funding to date, led by Flagship Ventures®. The company operates from Bedford, Massachusetts and The Hague, The Netherlands, with production operations in Hobbs, New Mexico. Additional information is available at www.jouleunlimited.com.
Footnotes1. The ethanol buildup profile was determined by switching from a
valve with no ethanol (i.e. air stream) to a valve with a constant
ethanol concentration (i.e. 100 ppm ethanol in nitrogen balance gas
cylinder), and allowing the ethanol concentration to reach a steady
state (maximum) value.
2. The ethanol settling profile was determined by switching from a
valve with constant ethanol concentration (i.e. 100 ppm ethanol in
nitrogen balance gas cylinder) to a valve with no ethanol (i.e. air
stream), and allowing the ethanol concentration to decrease to below
the ethanol detection limit (10 ppm).
3. GC-HS: Agilent 7890 with FID, G1888 headspace autosampler.
4. Carbon dioxide utilization (%) is determined as the % difference
between the area under the carbon dioxide inlet concentration
profile (equal to the dark cycle carbon dioxide outlet baseline
concentration for the constant carbon dioxide feed case) versus time
and the area under the carbon dioxide outlet concentration profile.
The carbon dioxide utilization (%) can also be determined from the
PBR inlet and outlet carbon dioxide molar flow rate versus time
profiles, knowing the purge gas flow rate.
5. Oxygen generated (moles) during each light cycle is determined as
the difference between the area under the PBR outlet oxygen molar
flow rate versus time profile and the area under the baseline oxygen
molar flow rate profile (determined from the dark cycle).
SummaryThe Thermo Scientific Prima BT magnetic sector process mass spectrometer offers superior performance for online measurement stability and accuracy of ethanol, carbon dioxide, and oxygen from photobioreactors. Implementa-tion of a modified ion source with glass lined entrance significantly improved accuracy of low concentration ethanol (20 – 100 ppm), and resulted in a significant increase in reactor sampling frequency due to reduced ethanol buildup and settling times. Photobioreactor online measurement with the Prima BT MS provided:
• Linear, accurate measurement of ethanol over wide concentration range (20 – 1000 ppm)
• Accurate carbon dioxide utilization and oxygen generation quantitation for further process understanding and optimization
• Fast multiple component measurement and significant increase in sample frequency from multiple photobioreactors
• Reduced process development time and effective optimum ethanol production strain identification
• Significant reduction of off-line sampling
Figure 15. MS carbon dioxide (mol%, left axis) and oxygen (mol%, right axis) for PBR Run 1 (top graph), and PBR light intensity (bottom graph). The PBR utilized 12 hour light and 12 hour dark cycles, with the light cycle incorporating a sinusoidal light profile.
For more information, visit our website at thermoscientific.com/happycells.© 2015 Thermo Fisher Scientific Inc. All rights reserved. All trademarks are the property of Thermo Fisher Scientific Inc. and its subsidiaries. Aspen Plus is a registered trademark of Aspen Technology, Inc, Burlington, MA, all rights reserved. Agilent 7890 with FID headspace autosampler is a trademark of Agilent Technologies, Inc, Santa Clara, CA, all rights reserved. Joule is a trademark and property of Joule Unlimited Inc. of Bedford, MA. Flagship Venture is a registered trademakr of Flagship Ventures, Cambridge, MA, all rights reserved. Specifications, terms and pricing are subject to change. Not all products are available in all countries. Please consult your local sales representative for details.
USA 1410 Gillingham Lane Sugarland, TX 77478 Ph: (800) 437-7979 Fax: (713) 272-4573 [email protected]
Europe Ion Path, Road Three, Winsford, Cheshire CW73GA UK Ph: +44 1606 548700Fax: +44 1606 548711 [email protected]
China +Units 702-715, 7th Floor Tower West, Yonghe Beijing, China 100007 +86 10 84193588 [email protected]
EPM_ANJoule_0115