photoacoustic correlation signal-to-noise ratio enhancement by coherent averaging and optical...
TRANSCRIPT

Photoacoustic correlation signal-to-noise ratio enhancement by coherent averagingand optical waveform optimizationSergey A. Telenkov, Rudolf Alwi, and Andreas Mandelis
Citation: Review of Scientific Instruments 84, 104907 (2013); doi: 10.1063/1.4825034 View online: http://dx.doi.org/10.1063/1.4825034 View Table of Contents: http://scitation.aip.org/content/aip/journal/rsi/84/10?ver=pdfcov Published by the AIP Publishing Articles you may be interested in Dark-field third-harmonic imaging Appl. Phys. Lett. 103, 093701 (2013); 10.1063/1.4818973 X-ray–optical cross-correlator for gas-phase experiments at the Linac Coherent Light Source free-electron laser Appl. Phys. Lett. 100, 121107 (2012); 10.1063/1.3695163 Note: A signal-to-noise ratio enhancement based on wafer light irradiation system for optical modulationspectroscopy measurement Rev. Sci. Instrum. 83, 026104 (2012); 10.1063/1.3685610 Effects of exposure equalization on image signal-to-noise ratios in digital mammography: A simulation study withan anthropomorphic breast phantom Med. Phys. 38, 6489 (2011); 10.1118/1.3659709 Comparison between pulsed laser and frequency-domain photoacoustic modalities: Signal-to-noise ratio,contrast, resolution, and maximum depth detectivity Rev. Sci. Instrum. 82, 094903 (2011); 10.1063/1.3632117
This article is copyrighted as indicated in the article. Reuse of AIP content is subject to the terms at: http://scitationnew.aip.org/termsconditions. Downloaded to IP:
185.41.20.108 On: Tue, 01 Apr 2014 09:47:39

REVIEW OF SCIENTIFIC INSTRUMENTS 84, 104907 (2013)
Photoacoustic correlation signal-to-noise ratio enhancement by coherentaveraging and optical waveform optimization
Sergey A. Telenkov,a) Rudolf Alwi, and Andreas MandelisCenter for Advanced Diffusion-Wave Technologies, Department of Mechanical and Industrial Engineering,University of Toronto, Toronto, Ontario M5S 3G8, Canada
(Received 4 April 2013; accepted 30 September 2013; published online 21 October 2013)
Photoacoustic (PA) imaging of biological tissues using laser diodes instead of conventional Q-switched pulsed systems provides an attractive alternative for biomedical applications. However, therelatively low energy of laser diodes operating in the pulsed regime, results in generation of veryweak acoustic waves, and low signal-to-noise ratio (SNR) of the detected signals. This problem canbe addressed if optical excitation is modulated using custom waveforms and correlation processing isemployed to increase SNR through signal compression. This work investigates the effect of the pa-rameters of the modulation waveform on the resulting correlation signal and offers a practical meansfor optimizing PA signal detection. The advantage of coherent signal averaging is demonstrated usingtheoretical analysis and a numerical model of PA generation. It was shown that an additional 5–10 dBof SNR can be gained through waveform engineering by adjusting the parameters and profile ofoptical modulation waveforms. © 2013 AIP Publishing LLC. [http://dx.doi.org/10.1063/1.4825034]
I. INTRODUCTION
Biomedical applications of laser photoacoustics (PA)have attracted significant interest as a unique imagingmodality with high sensitivity to optical absorption contrastthat can be used to visualize anatomical structure, chemicalcomposition, and physiological activity of the targetedtissues.1, 2 The conventional method of PA imaging consistsof pulsed (nanosecond-long) excitation of a tissue specimenand detection of acoustic transients using a broadbandultrasonic transducer coupled with an appropriate imagereconstruction algorithm. The wide adoption of the pulsed PAtechnique is justified by the relatively high acoustic pressureamplitude (tens of kPa) and submillimeter axial resolutionachieved with broadband acoustic signals.3 The benefits ofthe nanosecond PA technique come with relatively bulky andexpensive laser instrumentation which may be cumbersomein a clinical setting and requires regular maintenance to keepstable performance. Additional difficulties are associated withthe need for an optical parametric oscillator (OPO) or a dyelaser for wavelength tuning in chromophore-specific imagingapplications. Furthermore, the pulse repetition rate (typically10 Hz) is rather low for real-time image acquisition. As a re-sult, the research and development community has turned itsattention to more compact and reliable optical sources, suchas laser diodes. Attempts to use laser diodes as pulsed opticalsources for PA imaging of tissue chromophores were reportedpreviously.4, 5 Although SNR can be increased by taking ad-vantage of the high pulse repetition rate of laser diodes (up to1 MHz), the overall performance of diode-based systems hasbeen below the standard technique with Q-switched lasers.Additionally, the finite acoustic time-of-flight associated
a)Author to whom correspondence should be addressed. Electronic mail:[email protected]. Present address: PHAST Imaging, 1B RichviewRoad, Toronto, Ontario M9A 4M6, Canada.
with subsurface chromophore depths limits the maximumpulse repetition rate that can be used for unambiguoussignal detection. To avoid ambiguity of the received acousticpulses, more sophisticated data processing algorithms arerequired.5 Our approach to PA imaging differs significantlyfrom the standard pulsed methods and time domain analysisof acoustic transients. The frequency domain photoacoustic(FD-PA) method was introduced6–8 as an alternative imagingmodality that employs intensity modulated continuouswave (CW) laser sources to generate a PA response. At theheart of FD-PA is a correlation signal processing algorithmwhich provides an effective mechanism to increase SNR bycompressing a sub-ms or ms-long modulated response intoa narrow correlation peak. In many respects this techniqueresembles operation of a radar system and can be called “PAradar imaging” to emphasize the specifics of signal process-ing and the resulting information which is related to the signalenergy rather than amplitude. Our previous treatment of SNRin photoacoustic measurements9 compared FD-PA modalityin relation to the conventional pulsed technique. It was shownthat despite significant gain of SNR due to matched filtercompression, resulting SNR remained approximately 10 dBbelow the time domain counterpart. Additionally, it was ob-served that potential for SNR improvement consists in betteroptimization of optical irradiation parameters under limita-tion of the ANSI laser safety standard.10 In the present paper,we investigate problem of optimization of FD-PA methodsin greater detail and provide description of various methodsthat can be employed to improve SNR of the PA correlationtechnique with a CW laser source. Specifically, we analyzethe correlation signal amplitude with respect to modulationwaveform parameters such as waveform profile, duration,and laser power under restrictions imposed by the ANSI stan-dard. The results presented herein can be used for practicalimplementation of the FD-PA method in biological imagingapplications.
0034-6748/2013/84(10)/104907/7/$30.00 © 2013 AIP Publishing LLC84, 104907-1
This article is copyrighted as indicated in the article. Reuse of AIP content is subject to the terms at: http://scitationnew.aip.org/termsconditions. Downloaded to IP:
185.41.20.108 On: Tue, 01 Apr 2014 09:47:39

104907-2 Telenkov, Alwi, and Mandelis Rev. Sci. Instrum. 84, 104907 (2013)
II. FREQUENCY-DOMAIN PA CORRELATION IMAGINGWITH A CW LASER SOURCE
The present section provides a brief description of thefrequency domain PA imaging modality and describes typi-cal instrumentation used for imaging experiments. Use of aperiodically modulated optical source for the generation ofacoustic pressure waves has been known since the discoveryof the PA phenomenon over a century ago. Despite its longhistory, the method of choice for PA imaging consists of ashort laser pulse (1–10 ns) excitation and broadband detec-tion of the generated acoustic transients. The current com-mercial availability of high-power laser diodes with averageoutput power greater than 10 W, their relatively low cost andrugged packaging makes them an attractive alternative for de-signing PA imaging instrumentation. However, the generationof diode laser bursts with duration less than 100 ns resultsin pulse energies of several μJ as opposed to ∼10 mJ of Q-switched lasers. Obviously, such difference in optical exci-tation energy creates serious challenges for signal detectionthat can be partially alleviated by averaging a large numberof pulses. An alternative use of laser diodes for spatially re-solved imaging consists in modulating the laser source ac-cording to a prescribed temporal function and, at the detectionstage, using matched filter or cross-correlation processing tocompress the received signal. For example, the application oflinearly frequency-swept waveforms (chirps) for laser mod-ulation with duration 1 ms and correlation processing yieldsnearly 40 dB SNR gain.9 At the same time, the axial reso-lution is defined by the chirp bandwidth which can be lessthan 1 mm for bandwidths greater than 2 MHz. A typical set-up for FD-PA imaging and the associated signal processingalgorithm is shown in Fig. 1.
In our experimental setup, we use a near-IR laser diodemodel 8800 (Laser Light Solutions, Somerset, NJ) with thewavelength of 808 nm and maximum average power of12 W. The 1-ms long modulation chirps are continuously gen-erated by an arbitrary function generator (PXI 5442, NationalInstruments, Austin, TX). The chirped analog signal in theform
r (t) = Arcos(2πf1t + πbt2), (1)
FIG. 1. Schematic of PA imaging with chirped optical excitation and the as-sociated block-diagram of matched filter signal compression (Tr – ultrasonictransducer, FFT – Fast Fourier transform, C.C. – complex conjugate, B(t) –cross-correlation function).
where Ar is a constant amplitude, f1 is the chirp starting fre-quency, and b [Hz/s] is the chirp sweep rate, is sent to thelaser diode driver. A copy of the modulation waveform isstored in the computer memory and is used as a referencesignal in correlation processing. The laser diode output ismodulated according to r(t) and is delivered to the tissue sur-face through an optical fiber. Choice of the chirp frequencysweep range depends on several factors including: transducerspectral sensitivity (transfer function), estimated dimensionsof the targeted chromophores, and the chromophore depth.Instead of a single element transducer, an ultrasonic trans-ducer array probe can be used in connection with appropri-ate multi-channel data acquisition hardware and a beamform-ing algorithm for image reconstruction.11 Cross-correlationprocessing is implemented in the frequency domain usingcomputationally efficient fast Fourier transforms (FFT). Ini-tially, the received transducer signal v(t) and the modulationwaveform r(t) are FFT transformed, then the cross-correlationis computed as a product of the signal Fourier spectrum V(ω)and the complex conjugate of the reference, R∗(ω). In the fi-nal stage, the inverse FFT (IFFT) is computed to yield thetime domain cross-correlation function B(t). This processingalgorithm can be written in a continuous form as
B (t) = 1
2π
∫ ∞
−∞W (ω)R∗ (ω) V (ω) eiωtdω, (2)
where W(ω) is a spectral windowing function applied to thecorrelation spectrum to reduce range sidelobes. In the idealcase of exact matching, i.e., V (ω) = R (ω) and a uniformwindow, Eq. (2) yields an auto-correlation function, with thepeak B(t = 0) being equal to the total energy EV of the chirp
B (t = 0) = 1
2π
∫ ∞
−∞|V (ω) |2dω = EV . (3)
The correlation processing (2) of a coded PA responseprovides a simple way of compressing the entire energy ofthe chirped signal into a correlation peak with the width�t = 1/�f, where �f is the chirp bandwidth. For example,the total optical energy of 1-ms chirps emitted by a 10 Wlaser source is 10 mJ, which is similar to a single pulse ofa Q-switched laser. The laser diode output power is an impor-tant characteristic that has direct impact on the acoustic waveamplitude and the detection SNR. In biomedical applicationslaser irradiation is regulated by the safety standard and is lim-ited by the maximum permissible exposure (MPE) measuredin J/cm2. Therefore, PA generation and detection optimizationanalysis must include the MPE as a limiting factor. Takinginto account the MPE for human skin as a function of expo-sure duration T(10−7 s ≤ T ≤ 10 s), the following empiricalexpression defines maximum optical energy per unit of area:
EMPE = CA · T 1/4 [J/cm2], (4)
where the constant CA depends on the excitation wavelength;for example, CA = 1.81 for λ = 800 nm and CA = 5.5 forλ = 1064 nm. Considering a 10-W laser diode as an opticalsource with chirp duration Tch = 1 ms irradiating a circular
This article is copyrighted as indicated in the article. Reuse of AIP content is subject to the terms at: http://scitationnew.aip.org/termsconditions. Downloaded to IP:
185.41.20.108 On: Tue, 01 Apr 2014 09:47:39

104907-3 Telenkov, Alwi, and Mandelis Rev. Sci. Instrum. 84, 104907 (2013)
spot 5 mm in diameter, the produced optical exposure isequal to 50 mJ/cm2, which is much lower than the MPE level(322 mJ/cm2 at λ = 808 nm and 978 mJ/cm2 at 1064 nm).Assuming that optical chirps are emitted continuously, thenthe MPE level will be reached at time
T = Nch · Tch, (5)
where Nch is the number of chirps, each of duration Tch. Us-ing Eq. (5) for the maximum exposure time, Eq. (4) for theMPE can be recast in terms of Nch for given laser irradianceIL [W/cm2] and Tch,
CA(TchNch)1/4 = ILTchNch
or
Nch = T −1ch
(CA
IL
)4/3
. (6)
The above equation defines the maximum number oflaser chirps that can be used within the biological laser safetylimit. The number of Nch received signals can be averaged toincrease the detection SNR. Two possibilities for data averag-ing are applicable to FD-PA measurements and are consideredbelow.
III. SNR IMPROVEMENT THROUGH COHERENTAVERAGING
Averaging multiple signals is the standard technique forreducing the random noise level and increasing SNR. Sincethe frequency of acoustic waves is relatively low and ul-trasonic transducers are capable of phase-resolved measure-ments of the PA response, two alternative averaging schemescan be employed: (1) the raw pressure signals can be aver-aged coherently prior to signal processing; or (2) each of thereceived chirps is processed independently and the resultingcorrelation amplitudes are averaged. The latter technique doesnot take into account the phases of individual chirps and con-stitutes incoherent averaging during post-processing. Thesetwo methods define the logistics of data acquisition and mayinfluence design of system hardware and software for efficientsignal processing. The former technique demands strict phaseconsistency of multiple excitation chirps and accumulationof multiple waveforms, while the latter allows for rapid pro-cessing of incoming chirps and summation of the final prod-ucts to reduce noise. Both methods of signal conditioning arewell known and have been thoroughly analyzed in the the-ory of radar detection.12 The difference of the two averag-ing modes on the resulting correlation SNR can be shownconsidering an ideal matched filter with the frequency re-sponse H (ω) = V ∗ (ω) . Initially, we consider SNR gain dueto matched filter processing of a single chirp. Defining SNRas a ratio of instantaneous signal power to noise variance σ N
2,the SNR at the receiver input can be written as
SNRIN = v2
σ 2N
. (7a)
Following the processing algorithm (2), the correlation outputSNR is given by
SNROUT = B2(0)
σ 2B
= E2V
σ 2B
, (7b)
where σ B2 is the variance of the correlation noise. As-
suming that input noise can be modeled by a zero-meanGaussian distribution, the output noise power can be com-puted using a linear system transfer function H(ω). It isconvenient to use analytic signal with ω ≥ 0 that canbe formed by shaping spectrum with the window func-tion W(ω). The result of the matched filter processingis a complex valued cross-correlation function B(t) withthe real and imaginary parts equivalent to the in-phaseand quadrature components of the processed signal. Theresulting correlation noise power PN contained in bothcomponents as a result of the input noise σ N
2 can beestimated as
PN = SN
2· 1
2π
∫ ∞
0
∣∣H̃ (ω)∣∣2
dω = SN
2· EV = σ 2
N
fs
EV ,
(8)where the one-sided noise power spectral density SN/2= σ N
2/fs, and fs is the signal sampling rate. In the final sig-nal processing stage, the cross-correlation amplitude is com-puted as |B (t)| =
√Re2 {B (t)} + Im2{B (t)}. Since the am-
plitude computation is a nonlinear operation, the correlationnoise is no longer Gaussian but is distributed according to theRayleigh probability density function.12 Therefore, the corre-lation noise expectation value and variance are given by
E {|BN |} = σN
√πEV
2fs
, (9a)
σ 2B = 0.43
σ 2NEV
fs
. (9b)
According to (9a) and (9b), after matched filter processingthe receiver input noise is translated into an elevated base-line (9a) and the noise mean power is given by (9b). UsingEq. (7b) and subtracting the noise offset (9a), the correlationSNR of a single chirp can be computed as
SNRB =(EV − σN
√πEV
2fs
)2
0.43σ 2NEV
· fs. (10)
In the case of coherent averaging of Nch chirps, the sig-nal amplitude remains the same, while the input noise is re-duced by
√Nch. Replacing σ N in Eq. (10) by σN/
√Nch, the
resulting correlation SNR can be written as
SNRcohB =
(EV − σN
√πEV
2fsNch
)2
0.43σ 2NEV
· fsNch. (11)
In the case of incoherent or post-processing averaging ofNch chirps, the resulting correlation function can be written as
Bav(t) = BV (t) + 1
Nch
∑Nch
i=1βi(t), (12)
This article is copyrighted as indicated in the article. Reuse of AIP content is subject to the terms at: http://scitationnew.aip.org/termsconditions. Downloaded to IP:
185.41.20.108 On: Tue, 01 Apr 2014 09:47:39

104907-4 Telenkov, Alwi, and Mandelis Rev. Sci. Instrum. 84, 104907 (2013)
where BV (t) is the correlation function of the received chirpand β i(t) is the Rayleigh-distributed amplitude noise. Calcu-lating the mean and variance of the noise term results in theincoherent SNR,
SNRincohB =
(EV − σN
√πEV
2fs
)2
0.43σ 2NEV
· fsNch. (13)
The main difference between the SNRs of the two averag-ing modes becomes clear upon inspection of Eqs. (11) and(13). Although in both cases the noise power is reduced byNch, coherent averaging further reduces the correlation base-line by
√Nch, whereas incoherent averaging does not affect
the dc noise level which is proportional to σ N. The advan-tage of coherent averaging is demonstrated in Fig. 2 using aone-dimensional numerical model of PA generation and thecorrelation processing algorithm.
In this numerical example, a laterally infinite plane ab-sorbing layer 5 mm thick with optical absorption coefficientμa = 4 cm−1 was located 4.5 cm from the detection positionand 100 consecutive chirps with the frequency sweep range1–5 MHz (1 ms each) were numerically generated and pro-cessed. The computed PA signals were mixed with zero-meanGaussian noise to simulate an input SNR = −40 dB. The in-coherently averaged result of matched filter processing of all100 chirps is shown in Fig. 2(a). The correlation peak appearsat the correct delay time of 30 μs but significant dc offsetmasks a substantial portion of the correlation signal. This re-sult is consistent with the theoretical prediction Eq. (13) andthe baseline level cannot be reduced by increasing the numberof averaged signals. Alternatively, coherent averaging of theraw data followed by correlation processing of single aver-aged chirps is shown in Fig. 2(b). In agreement with Eq. (11)the resultant noise power is the same as in Fig. 2(a), but thelatter plot has the dc background reduced by
√Nch. The base-
line difference between the two averaging modes is importantwhen the PA signals are weak and SNR is very poor, which isusually the case with a modulated CW laser source. In sum-mary, to maximize the SNR of correlation measurements it isadvantageous to fix the phases of the optical chirps and coher-ently average as many of them as allowed by the laser safetylimit before processing the output signals.
IV. OPTIMIZATION OF OPTICAL MODULATIONWAVEFORM PARAMETERS
Another way of improving the SNR of PA correlationimaging is through optimization of the laser modulationwaveform parameters. There are several parameters related tooptical chirps including modulation frequency sweep range,chirp duration, and amplitude related to the laser power.These parameters can be adjusted in order to increase theSNR and improve the overall image quality. With respect tochirp frequency range optimization, any a priori availableinformation about tissue optical absorption and scatteringcoefficient, depth of targeted chromophores and frequencyresponse (transfer function) of the ultrasonic transduceris important. Assuming that the chirp frequency range isdetermined by an ultrasonic transducer and fixed, furtheroptimization of the correlation SNR with respect to the laserpower, chirp duration, and waveform profile can be made. Thepreviously used 1-ms duration was set from empirical consid-erations and it is not guaranteed to be optimal with respect tothe resulting SNR. Equations (3) and (10) suggest that longerchirp duration results in greater signal energy content EV andshould yield a higher correlation peak and better SNR. Simi-larly, an increase of the optical power will produce higher PAresponse and SNR. However, it has been mentioned that PAimaging of biological tissues in-vivo must consider the lasersafety restriction (4) that relates laser irradiance to exposuretime. Taking into account Eqs. (4)–(6) we analyze the effectof chirp duration Tch on correlation SNR, assuming that thelaser irradiance IL(TL), where the laser exposure time TL
= TchNch is maintained at the safety limit. The correlationSNR dependence on chirp duration was observed experi-mentally and was briefly discussed in our previous report.9
Detailed analysis confirms these observations and providesquantitative estimates on SNR optimization that can beachieved by varying the laser chirp parameters. Theoretically,the SNR dependence on chirp duration Tch can be derivedusing Eq. (3) for the correlation signal amplitude and Eqs. (7)and (8) for the noise power. Since the amplitude of the refer-ence modulation chirp Ar remains fixed, according to Eq. (8)the noise power after matched filter processing becomes
PN = 1
2π
SN
2
∫ ∞
−∞|H (ω) |2dω ∼ ER ∼ Tch, (14)
FIG. 2. Numerical analysis of incoherent and coherent averaging of multiple PA chirps showing their effects on the correlation amplitude signal. (a) incoherentand (b) coherent averaging of 100 chirps. Input SNR = −40 dB in both cases.
This article is copyrighted as indicated in the article. Reuse of AIP content is subject to the terms at: http://scitationnew.aip.org/termsconditions. Downloaded to IP:
185.41.20.108 On: Tue, 01 Apr 2014 09:47:39

104907-5 Telenkov, Alwi, and Mandelis Rev. Sci. Instrum. 84, 104907 (2013)
FIG. 3. Measurements of correlation SNR as a function of chirp duration Tch. (a) Laser safety curve (solid) and � – laser exposure used in the measurements;(b) Correlation SNR vs chirp duration (solid line ∼Tch
−1/2).
where ER is the energy of the reference signal. Furthermore,the photoacoustic wave amplitude Av is proportional to thelaser irradiance IL, which implies that the cross-correlationpeak, at time t = 0 is
B (0) ∼ ArAvTch ∼ ILTch. (15)
Since the laser irradiance must conform to the MPE limitgiven by Eqs. (4)–(6), IL must have the following Tch
dependence:
IL = CA · T−3/4ch . (16)
Substituting IL from Eq. (16) to (15), it is found that thecorrelation amplitude peak depends on Tch as B(0) ∼ Tch
1/4.Taking into account the noise power in Eq. (14), the resultingcorrelation SNR can be written as
SNRB = B2(0)
PN
∼ T−1/2ch . (17)
This analysis confirms our earlier observation9 and ex-plains the relation between correlation SNR and the durationof laser chirps. Equation (17) shows that, with respect to cor-relation SNR, shorter chirp duration is preferred when thelaser irradiance varies strictly according to the safety curveIL(Tch) given by Eq. (16). On the other hand, shorter chirpshave smaller time-bandwidth product and, as a result, themagnitude of the correlation peak is reduced. Since any de-crease of chirp duration must be accompanied by a com-pensating increase of laser irradiance, the feasibility of thisoptimization method is limited by the available power ofcommercial laser diodes.
To verify the theoretical predictions, a series of rigorousmeasurements was conducted using a planar chromophore(μa = 2 cm−1) immersed in light-scattering Intralipid solu-tion (reduced scattering coefficient μs
′ = 10 cm−1) at 15-mmdepth.
To generate PA signals, the laser source was modu-lated by chirped sine waveforms with frequency sweep rangef = 1–5 MHz. The experimental setup was similar to thatshown in Fig. 1 with a single-element focused transducer (fo-cal distance 2.5 cm, maximum response at 3.5 MHz). The
number of signal chirps acquired and averaged was computedfrom Eq. (6) taking into account the maximum irradiance IL
available from the laser. In this experiment, the number ofacquired chirps was set to Nch = 256 and was kept fixed. Thechirp duration was varied from 100 μs to 1 ms, while the laserirradiance IL ranged between 12.9 and 72.5 W/cm2. The to-tal exposure time TL = TchNch was consistent with the MPElimit. The experimental results are shown in Fig. 3. The plotin Fig. 3(a) shows the safety curve (solid line), while trianglesindicate the exposure level for each chirp duration. Measure-ments of the correlation peak and noise power were carriedout for each IL value and the corresponding Tch. Results ofthe SNR measurements are shown in Fig. 3(b). In agreementwith the theoretical analysis predicting SNR ∼Tch
−1/2 (solidline in Fig. 3(b)), it was observed that SNR could be increasedapproximately by 5 dB when chirp duration was reduced byan order of magnitude. At the same time, the peak magnitudedecreased by a factor of 10. This may be detrimental to signalquality and reliable detection, if PA signals are accompaniedby strong coherent interference. Typically, coherent interfer-ence signals result from direct exposure of the transducer tolaser beam and is frequently observed in experiments wherethe same surface is used for irradiation and detection (“reflec-tion” geometry). In our experiments with the current instru-mentation, the range Tch = 500 μs −1 ms was identified asmost appropriate for imaging applications.
V. SNR OPTIMIZATION BY THE LASER MODULATIONWAVEFORM PROFILE
In addition to adjusting chirp duration and amplitude, thewaveform profile can also be changed from sine-wave to a dif-ferent function of time. The modulation method and specificinstruments used in an experiment define the modulated opti-cal output. For example, rapid chopping of the optical beamwill produce a nearly square wave profile, while pumping alaser diode with repetitive pulsed current can generate a trainof laser pulses with high repetition rate but low duty cycle.In order to quantify the effect of a specific modulation pat-tern on the correlation amplitude for SNR optimization, wecompleted a series of measurements with a planar absorber
This article is copyrighted as indicated in the article. Reuse of AIP content is subject to the terms at: http://scitationnew.aip.org/termsconditions. Downloaded to IP:
185.41.20.108 On: Tue, 01 Apr 2014 09:47:39
104907-6 Telenkov, Alwi, and Mandelis Rev. Sci. Instrum. 84, 104907 (2013)
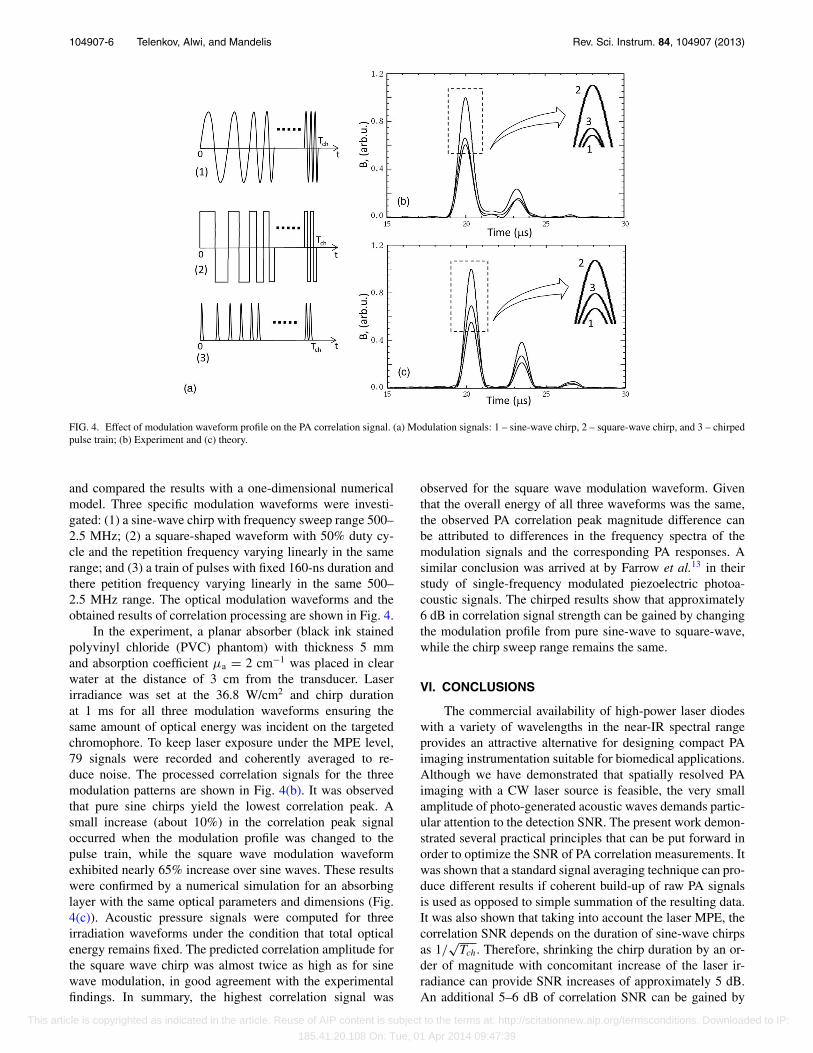
FIG. 4. Effect of modulation waveform profile on the PA correlation signal. (a) Modulation signals: 1 – sine-wave chirp, 2 – square-wave chirp, and 3 – chirpedpulse train; (b) Experiment and (c) theory.
and compared the results with a one-dimensional numericalmodel. Three specific modulation waveforms were investi-gated: (1) a sine-wave chirp with frequency sweep range 500–2.5 MHz; (2) a square-shaped waveform with 50% duty cy-cle and the repetition frequency varying linearly in the samerange; and (3) a train of pulses with fixed 160-ns duration andthere petition frequency varying linearly in the same 500–2.5 MHz range. The optical modulation waveforms and theobtained results of correlation processing are shown in Fig. 4.
In the experiment, a planar absorber (black ink stainedpolyvinyl chloride (PVC) phantom) with thickness 5 mmand absorption coefficient μa = 2 cm−1 was placed in clearwater at the distance of 3 cm from the transducer. Laserirradiance was set at the 36.8 W/cm2 and chirp durationat 1 ms for all three modulation waveforms ensuring thesame amount of optical energy was incident on the targetedchromophore. To keep laser exposure under the MPE level,79 signals were recorded and coherently averaged to re-duce noise. The processed correlation signals for the threemodulation patterns are shown in Fig. 4(b). It was observedthat pure sine chirps yield the lowest correlation peak. Asmall increase (about 10%) in the correlation peak signaloccurred when the modulation profile was changed to thepulse train, while the square wave modulation waveformexhibited nearly 65% increase over sine waves. These resultswere confirmed by a numerical simulation for an absorbinglayer with the same optical parameters and dimensions (Fig.4(c)). Acoustic pressure signals were computed for threeirradiation waveforms under the condition that total opticalenergy remains fixed. The predicted correlation amplitude forthe square wave chirp was almost twice as high as for sinewave modulation, in good agreement with the experimentalfindings. In summary, the highest correlation signal was
observed for the square wave modulation waveform. Giventhat the overall energy of all three waveforms was the same,the observed PA correlation peak magnitude difference canbe attributed to differences in the frequency spectra of themodulation signals and the corresponding PA responses. Asimilar conclusion was arrived at by Farrow et al.13 in theirstudy of single-frequency modulated piezoelectric photoa-coustic signals. The chirped results show that approximately6 dB in correlation signal strength can be gained by changingthe modulation profile from pure sine-wave to square-wave,while the chirp sweep range remains the same.
VI. CONCLUSIONS
The commercial availability of high-power laser diodeswith a variety of wavelengths in the near-IR spectral rangeprovides an attractive alternative for designing compact PAimaging instrumentation suitable for biomedical applications.Although we have demonstrated that spatially resolved PAimaging with a CW laser source is feasible, the very smallamplitude of photo-generated acoustic waves demands partic-ular attention to the detection SNR. The present work demon-strated several practical principles that can be put forward inorder to optimize the SNR of PA correlation measurements. Itwas shown that a standard signal averaging technique can pro-duce different results if coherent build-up of raw PA signalsis used as opposed to simple summation of the resulting data.It was also shown that taking into account the laser MPE, thecorrelation SNR depends on the duration of sine-wave chirpsas 1/
√Tch. Therefore, shrinking the chirp duration by an or-
der of magnitude with concomitant increase of the laser ir-radiance can provide SNR increases of approximately 5 dB.An additional 5–6 dB of correlation SNR can be gained by
This article is copyrighted as indicated in the article. Reuse of AIP content is subject to the terms at: http://scitationnew.aip.org/termsconditions. Downloaded to IP:
185.41.20.108 On: Tue, 01 Apr 2014 09:47:39

104907-7 Telenkov, Alwi, and Mandelis Rev. Sci. Instrum. 84, 104907 (2013)
changing the modulation temporal waveform from sine-waveto square-wave chirp. More complex modulation signals suchas phase-coded waveforms can also be used but their main dis-advantage is their relatively short duration and, as a result, therelatively small compression ratio which can seriously limitSNR.
ACKNOWLEDGMENTS
This work was supported by the Natural Sciences and En-gineering Council of Canada (NSERC) though Discovery andStrategic grants; by the Premier’s Discovery Award, Ministryof Research and Innovation (MRI), Ontario; by the CanadaFoundation for innovation (CFI) and the Ontario ResearchFund (ORF); and by the Canada Research Chairs (CRC).
1C. Li and L. V. Wang, “Photoacoustic tomography and sensing inbiomedicine,” Phys. Med. Biol. 54, R59 (2009).
2P. Beard, “Beomedical photoacoustic imaging,” Interface Focus 1, 602(2011).
3K. Maslov, H. F. Zhang, S. Hu, and L. V. Wang, “Optical-resolution pho-toacoustic microscopy for in vivo imaging of single capillaries,” Opt. Lett.33, 929 (2008).
4T. J. Allen and P. C. Beard, “Pulsed near-infrared laser diode excitationsystem for biomedical photoacoustic imaging,” Opt. Lett. 31, 3462 (2006).
5M. P. Mienkina, C. S. Friedrich, N. C. Gerhardt, W. G. Wilkening, M.R. Hofmann, and G. Schmitz, “Experimental evaluation of photoacousticcoded excitation using unipolar Golay codes,” IEEE Trans. Ultrason. Fer-roelectr. Freq. Control 57, 1583 (2010).
6Y. Fan, A. Mandelis, G. Spirou, and I. A. Vitkin, “Development of alaser photothermoacoustic frequency-swept system for subsurface imag-ing: Theory and experiment,” J. Acoust. Soc. Am. 116, 3523 (2004).
7S. Telenkov and A. Mandelis, “Fourier-domain biophotoacoustic subsur-face depth selective amplitude and phase imaging of turbid phantoms andbiological tissue,” J. Biomed. Opt. 11, 044006 (2006).
8S. Telenkov and A. Mandelis, “Frequency-domain photothermoacoustics:Alternative imaging modality of biological tissues,” J. Appl. Phys. 105,102029 (2009).
9S. Telenkov and A. Mandelis, “Signal-to-noise analysis of biomedical pho-toacoustic measurements in time and frequency domains,” Rev. Sci. In-strum. 81, 124901 (2010).
10American National Standard for safe use of lasers, ANSI Z136.1, 2007.11S. Telenkov, R. Alwi, A. Mandelis, and A. Worthington, “Frequency-
domain photoacoustic phased array probe for biomedical imaging appli-cations,” Opt. Lett. 36, 4560 (2011).
12J. Minkoff, Signals, Noise and Active Sensors: Radars, Sonars, LaserRadars (Wiley-Interscience, New York, 1992).
13M. M. Farrow, R. K. Burnham, M. Auzanneau, S. L. Olsen, N. Purdie,and E. M. Eyring, “Piezoelectric detection of photoacoustic signals,” Appl.Opt. 17, 1093 (1978).
This article is copyrighted as indicated in the article. Reuse of AIP content is subject to the terms at: http://scitationnew.aip.org/termsconditions. Downloaded to IP:
185.41.20.108 On: Tue, 01 Apr 2014 09:47:39