pharmacokinetics of ssri antidepressants€¦ · pharmacokinetics of ssri antidepressants alphonse...
TRANSCRIPT
PHARMACOKINETICS OF SSRI ANTIDEPRESSANTS
Alphonse Poklis, Ph.D., ABFTProfessor, Pathology
Pharmacology & ToxicologyChemistry & Forensic Science
School of MedicineVirginia Commonwealth UniversityRichmond, VA 23298-0165
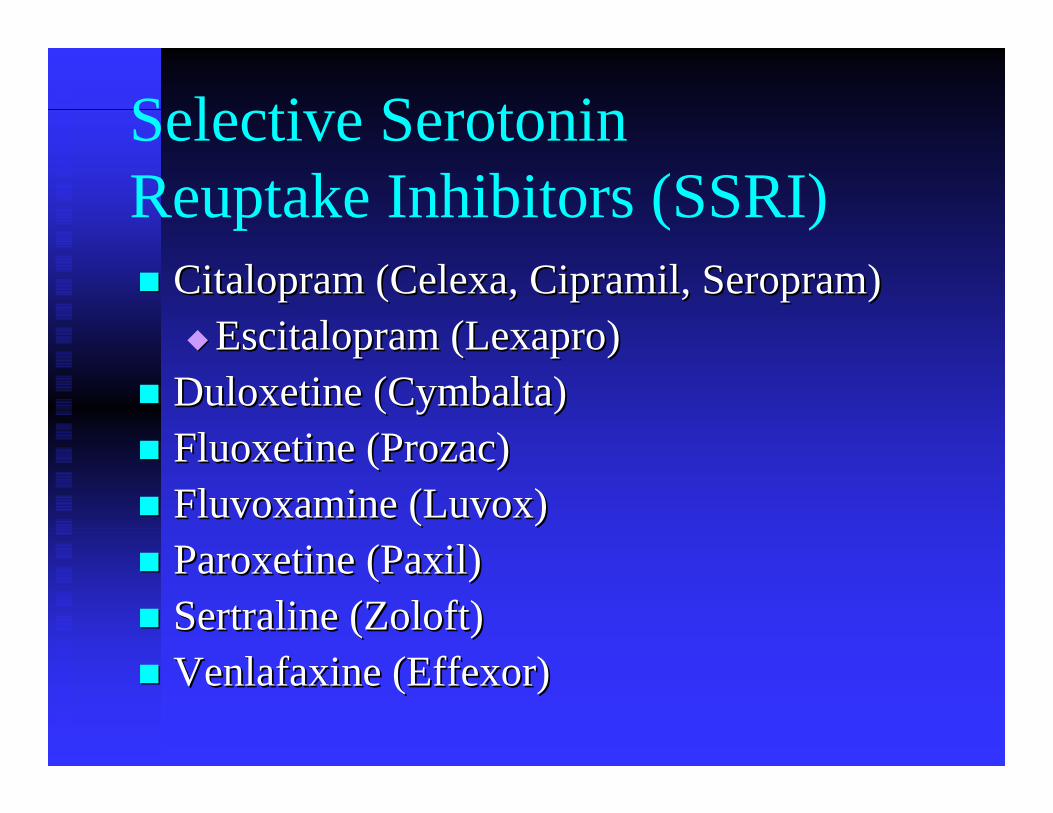
Selective Serotonin Reuptake Inhibitors (SSRI)
Citalopram Citalopram ((CelexaCelexa, , CipramilCipramil, , SeropramSeropram))EscitalopramEscitalopram ((LexaproLexapro))
DuloxetineDuloxetine ((CymbaltaCymbalta))Fluoxetine (Prozac)Fluoxetine (Prozac)FluvoxamineFluvoxamine ((LuvoxLuvox))Paroxetine Paroxetine ((PaxilPaxil))Sertraline Sertraline (Zoloft)(Zoloft)Venlafaxine Venlafaxine ((EffexorEffexor))
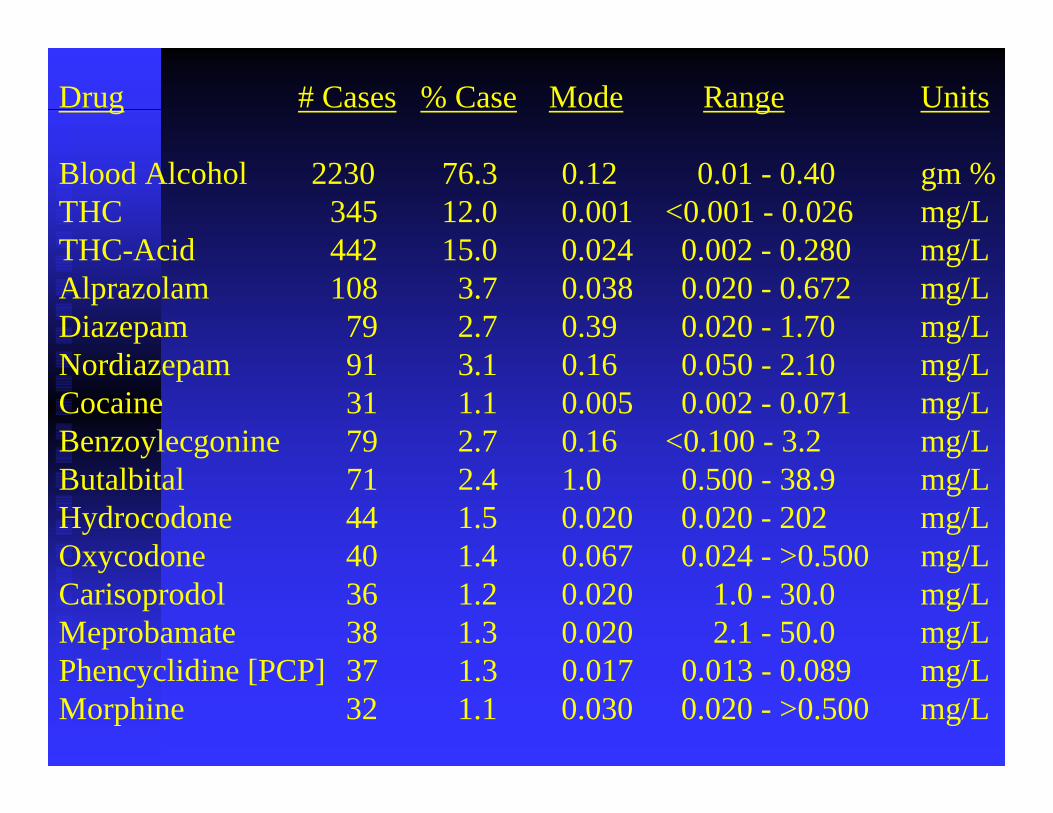
Drug # Cases % Case Mode Range Units
Blood Alcohol 2230 76.3 0.12 0.01 - 0.40 gm %THC 345 12.0 0.001 <0.001 - 0.026 mg/LTHC-Acid 442 15.0 0.024 0.002 - 0.280 mg/LAlprazolam 108 3.7 0.038 0.020 - 0.672 mg/LDiazepam 79 2.7 0.39 0.020 - 1.70 mg/LNordiazepam 91 3.1 0.16 0.050 - 2.10 mg/LCocaine 31 1.1 0.005 0.002 - 0.071 mg/LBenzoylecgonine 79 2.7 0.16 <0.100 - 3.2 mg/LButalbital 71 2.4 1.0 0.500 - 38.9 mg/LHydrocodone 44 1.5 0.020 0.020 - 202 mg/LOxycodone 40 1.4 0.067 0.024 - >0.500 mg/LCarisoprodol 36 1.2 0.020 1.0 - 30.0 mg/LMeprobamate 38 1.3 0.020 2.1 - 50.0 mg/LPhencyclidine [PCP] 37 1.3 0.017 0.013 - 0.089 mg/LMorphine 32 1.1 0.030 0.020 - >0.500 mg/L
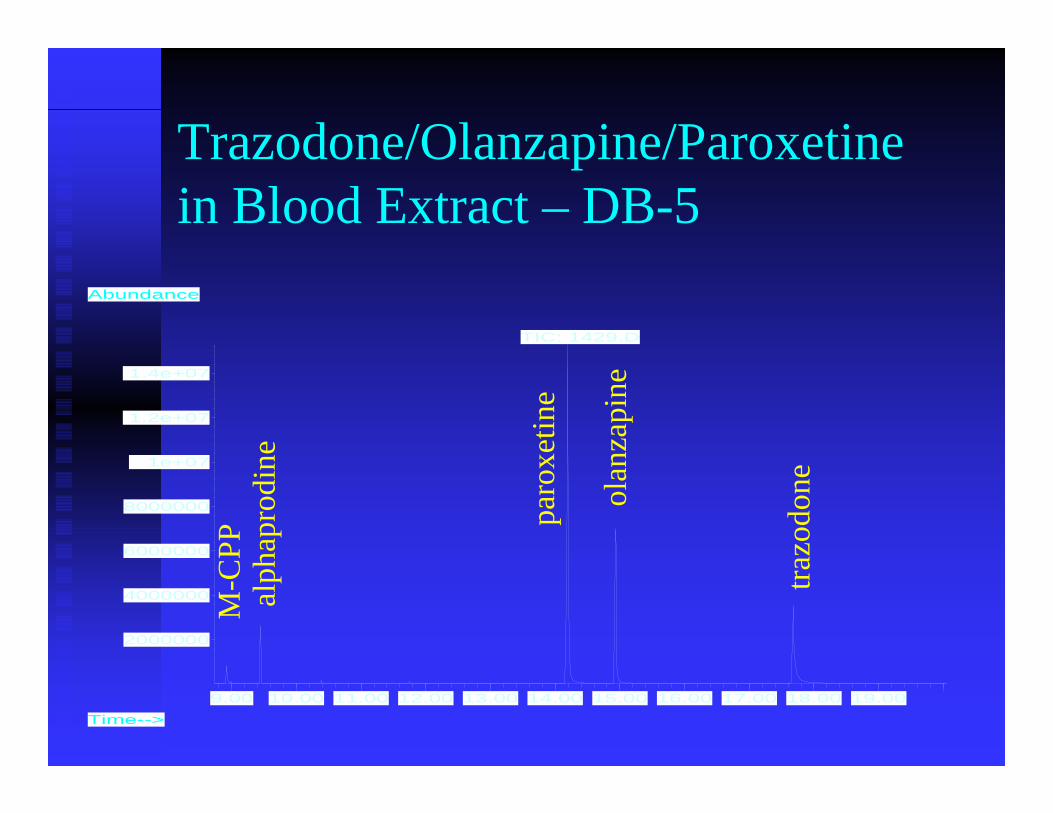
Trazodone/Olanzapine/Paroxetinein Blood Extract – DB-5
9.00 10.00 11.00 12.00 13.00 14.00 15.00 16.00 17.00 18.00 19.00
2000000
4000000
6000000
8000000
1e+07
1.2e+07
1.4e+07
Time-->
Abundance
TIC: 1429.D
M-C
PPal
phap
rodi
ne
paro
xetin
e
olan
zapi
ne
trazo
done
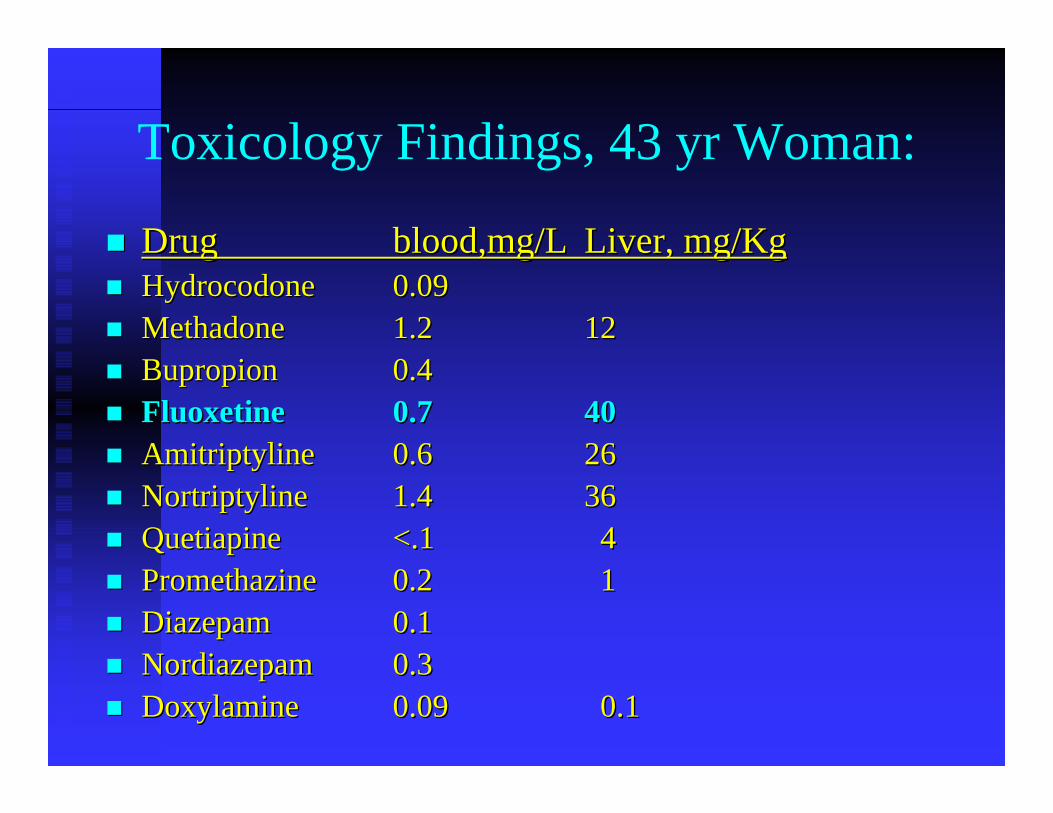
Toxicology Findings, 43 yr Woman:
DrugDrug blood,mg/Lblood,mg/L Liver, mg/KgLiver, mg/KgHydrocodoneHydrocodone 0.090.09MethadoneMethadone 1.21.2 1212BupropionBupropion 0.40.4FluoxetineFluoxetine 0.70.7 4040AmitriptylineAmitriptyline 0.60.6 2626NortriptylineNortriptyline 1.41.4 3636QuetiapineQuetiapine <.1<.1 44PromethazinePromethazine 0.20.2 11DiazepamDiazepam 0.10.1NordiazepamNordiazepam 0.30.3DoxylamineDoxylamine 0.090.09 0.10.1

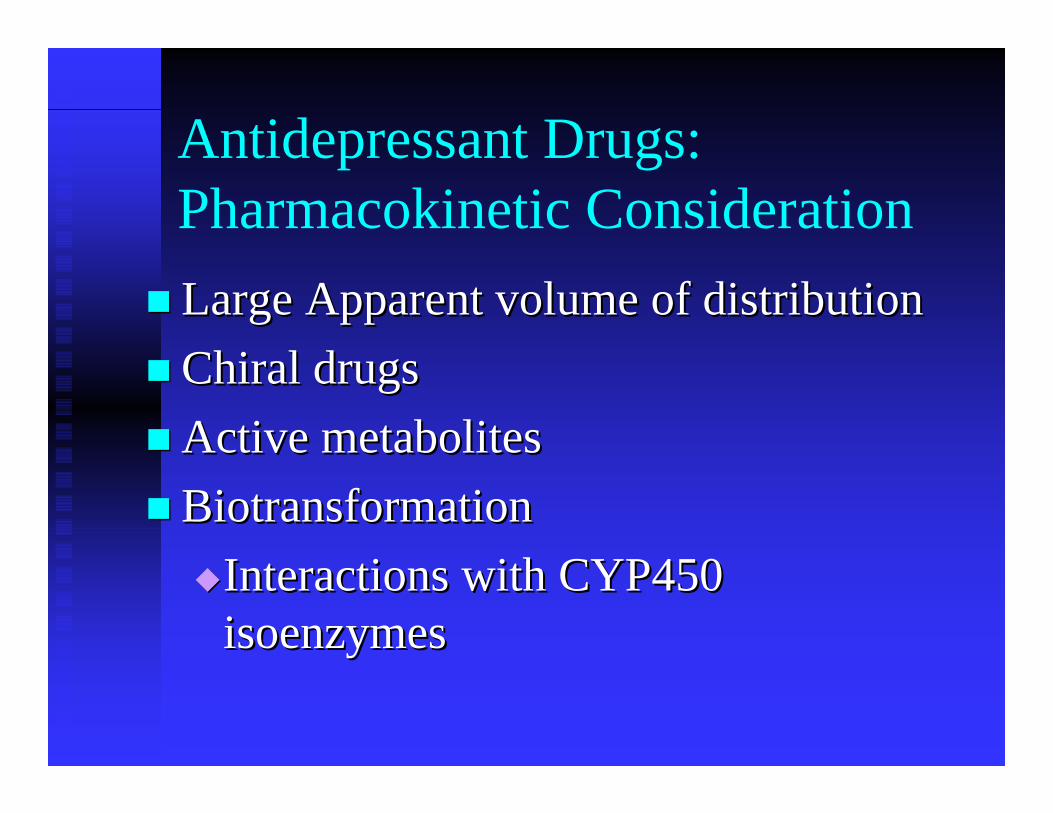
Antidepressant Drugs:Pharmacokinetic ConsiderationLarge Apparent volume of distributionLarge Apparent volume of distributionChiral Chiral drugsdrugsActive metabolitesActive metabolitesBiotransformationBiotransformation
Interactions with CYP450 Interactions with CYP450 isoenzymesisoenzymes
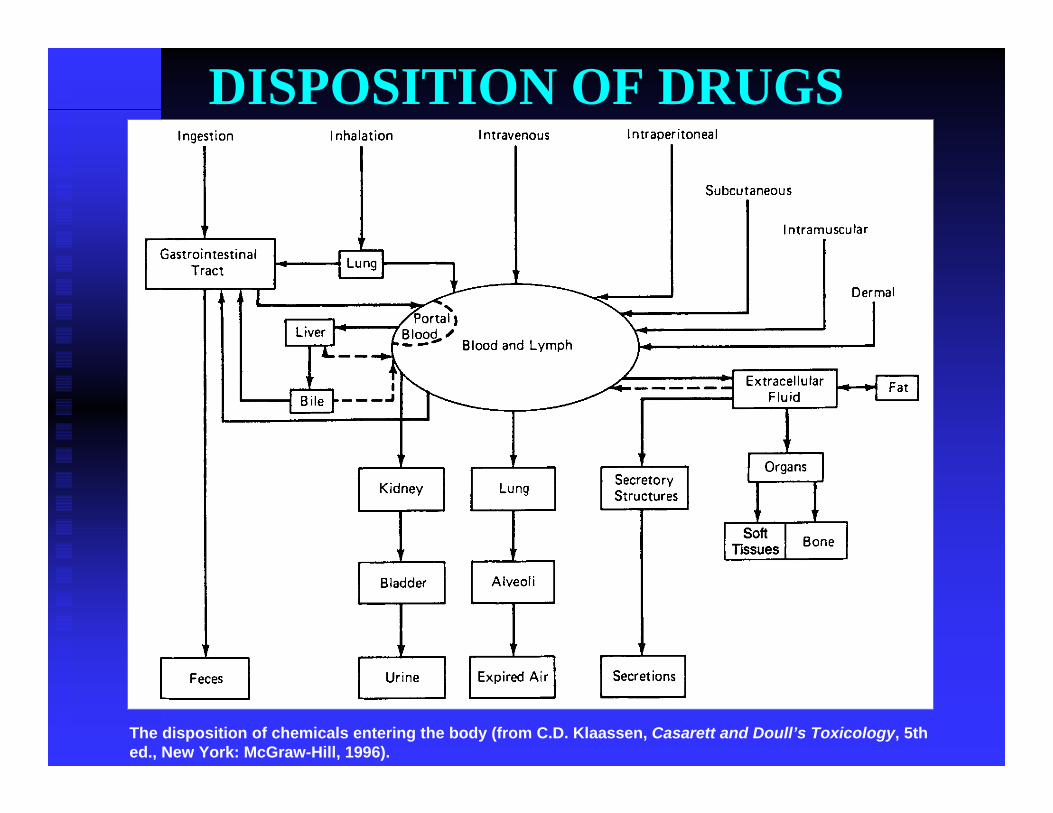
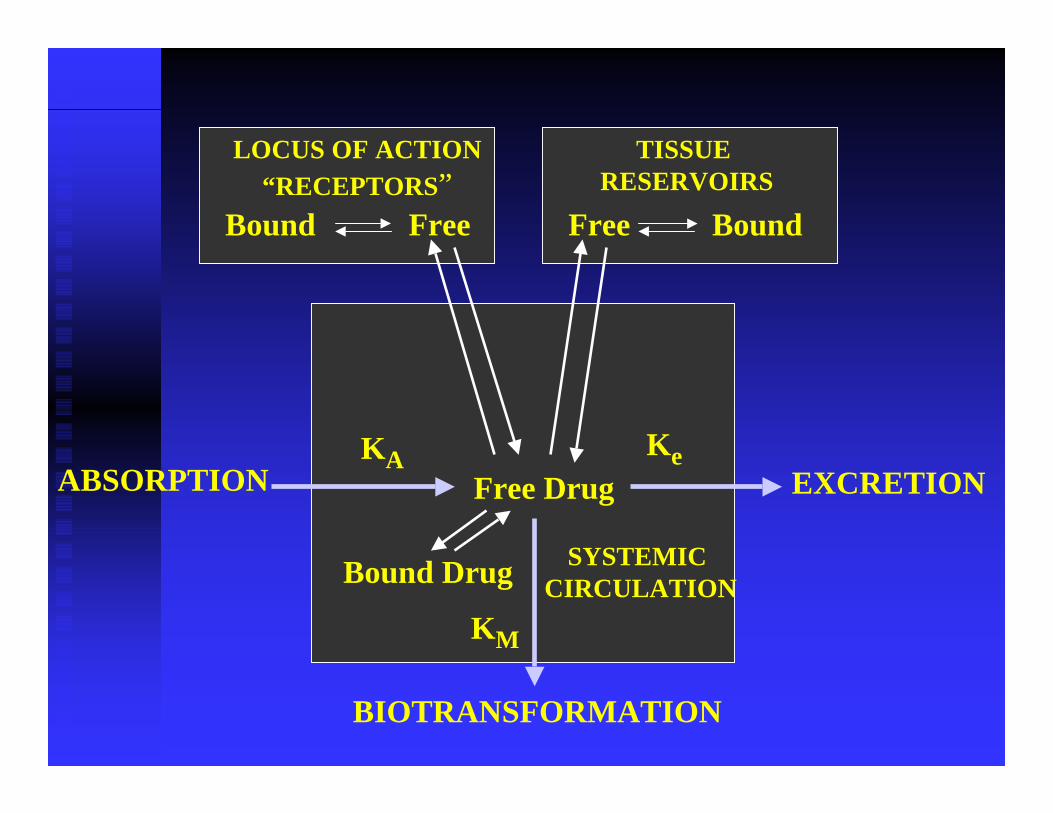
DISPOSITION OF DRUGS
The disposition of chemicals entering the body (from C.D. Klaassen, Casarett and Doull’s Toxicology, 5th ed., New York: McGraw-Hill, 1996).
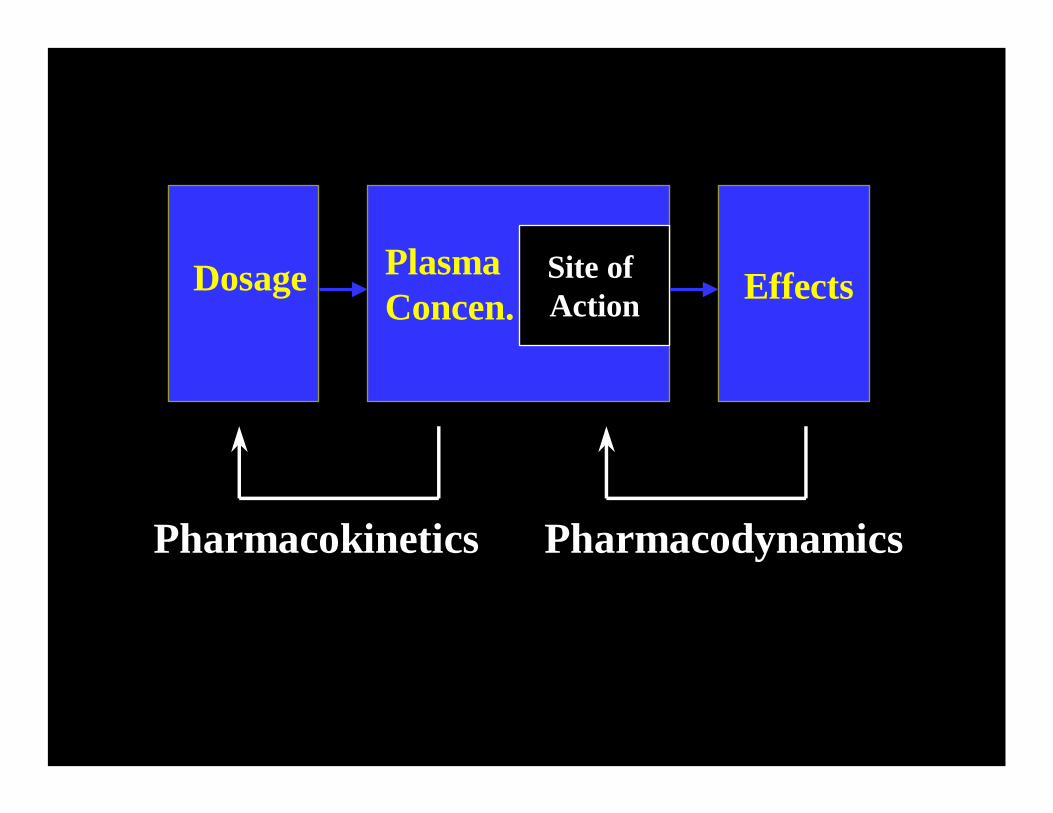
Site of Action
Dosage EffectsPlasmaConcen.
Pharmacokinetics Pharmacodynamics
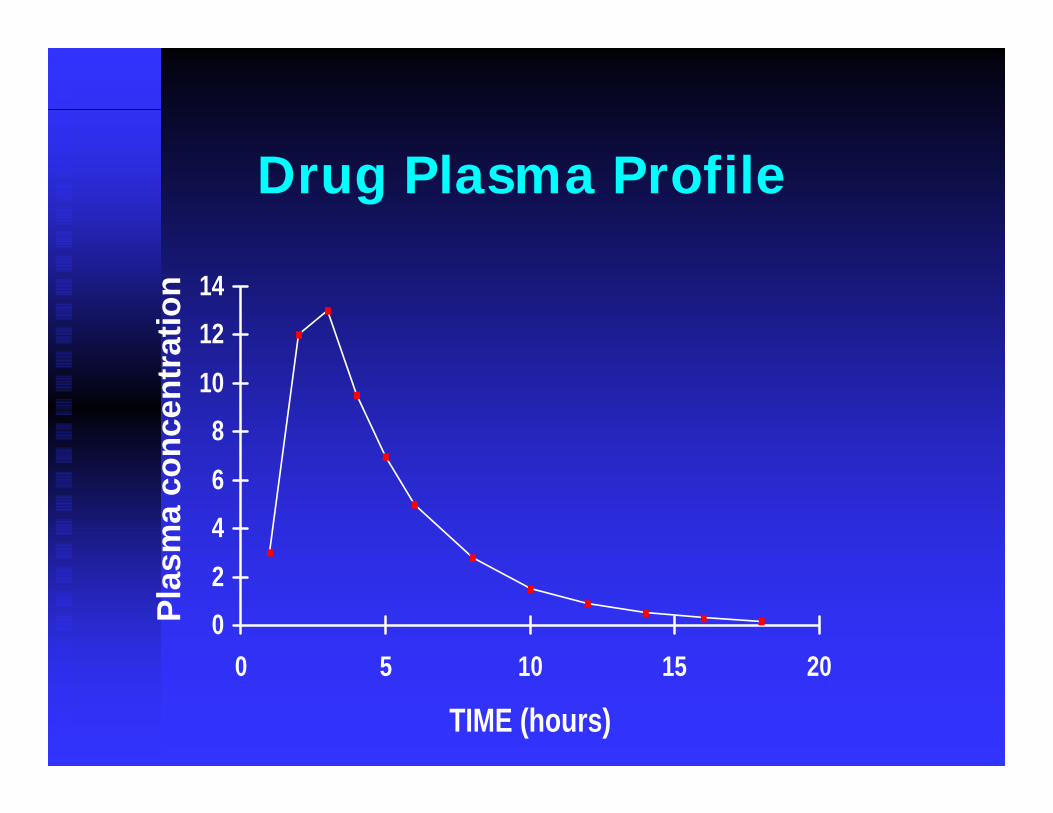
02
46
810
1214
0 5 10 15 20
TIME (hours)
Plas
ma
conc
entr
atio
nDrug Plasma Profile
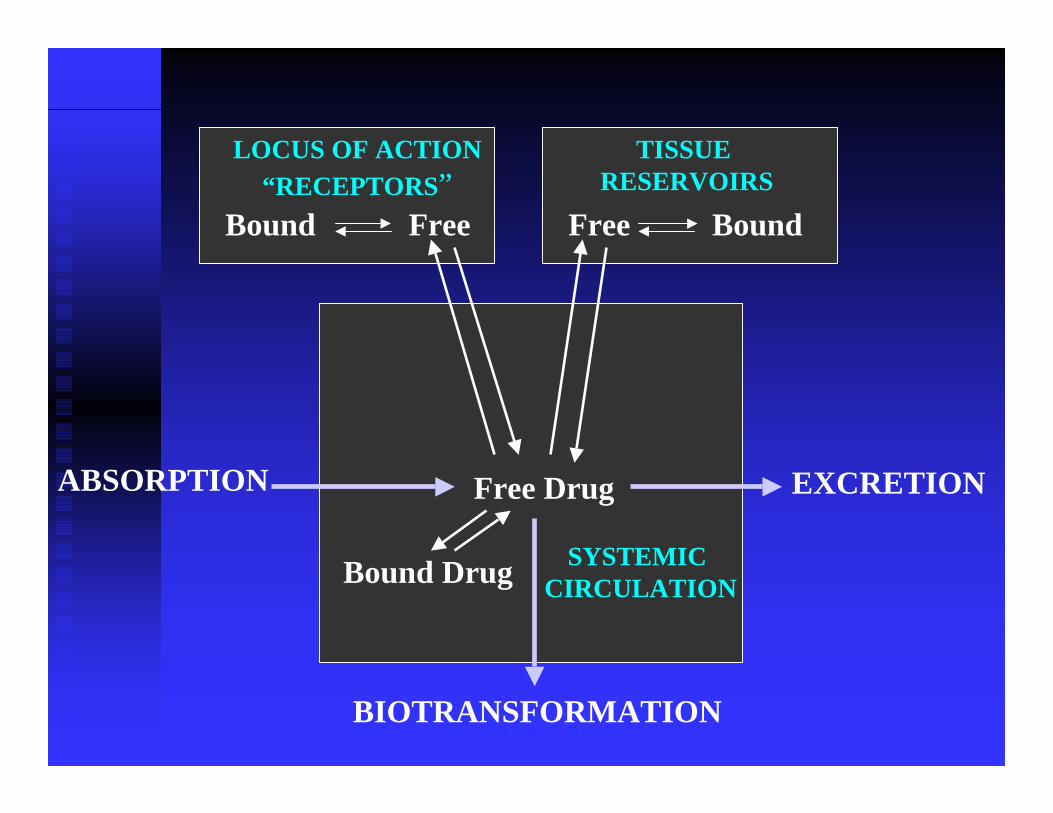
Bound Free Free Bound
LOCUS OF ACTION“RECEPTORS”
TISSUE RESERVOIRS
SYSTEMIC CIRCULATION
Free Drug
Bound Drug
ABSORPTION EXCRETION
BIOTRANSFORMATION
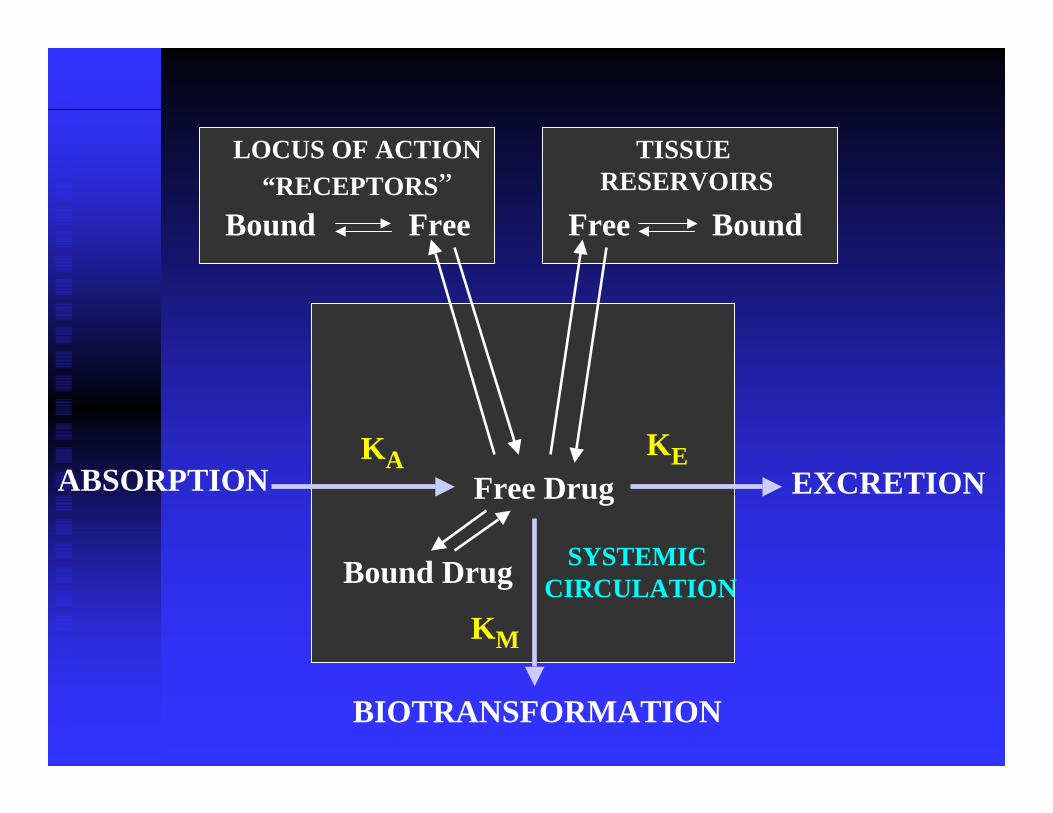
Bound Free Free Bound
LOCUS OF ACTION“RECEPTORS”
TISSUE RESERVOIRS
SYSTEMIC CIRCULATION
Free Drug
Bound Drug
ABSORPTION EXCRETION
BIOTRANSFORMATION
KA KE
KM
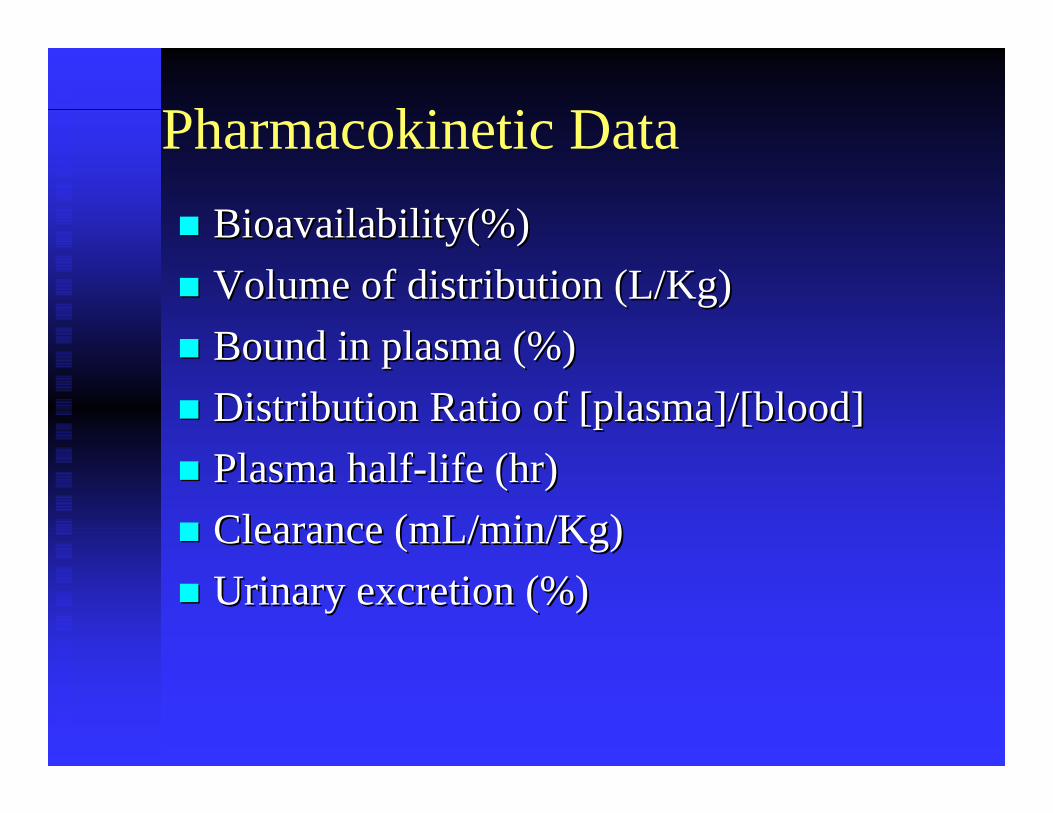
Pharmacokinetic DataBioavailability(%)Bioavailability(%)Volume of distribution (L/Kg)Volume of distribution (L/Kg)Bound in plasma (%)Bound in plasma (%)Distribution Ratio of [plasma]/[blood]Distribution Ratio of [plasma]/[blood]Plasma halfPlasma half--life (hr)life (hr)Clearance (mL/min/Kg)Clearance (mL/min/Kg)Urinary excretion (%)Urinary excretion (%)
Pharmacokinetic Data
Single dose peak plasma concentrationSingle dose peak plasma concentrationEffective steady state plasma concentrationEffective steady state plasma concentrationToxic plasma concentrationToxic plasma concentrationLife threatening or lethal blood Life threatening or lethal blood concentrationconcentration
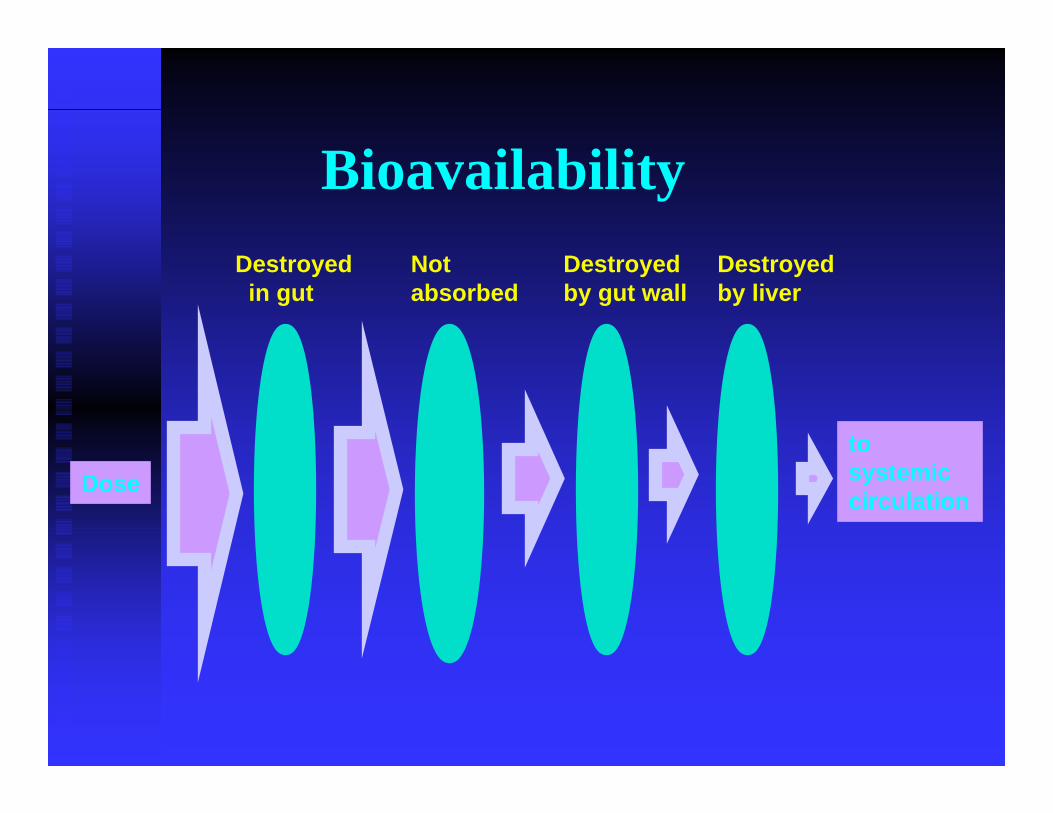
Dose
Destroyedin gut
Notabsorbed
Destroyed by gut wall
Destroyedby liver
tosystemiccirculation
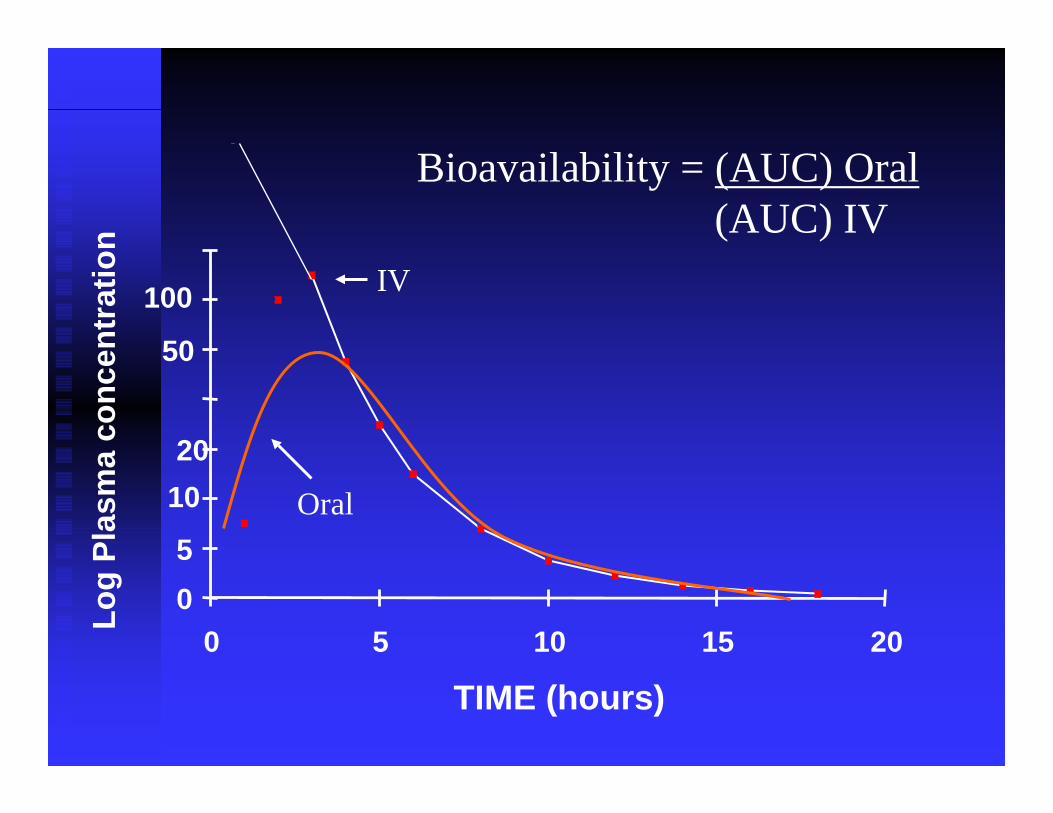
Bioavailability
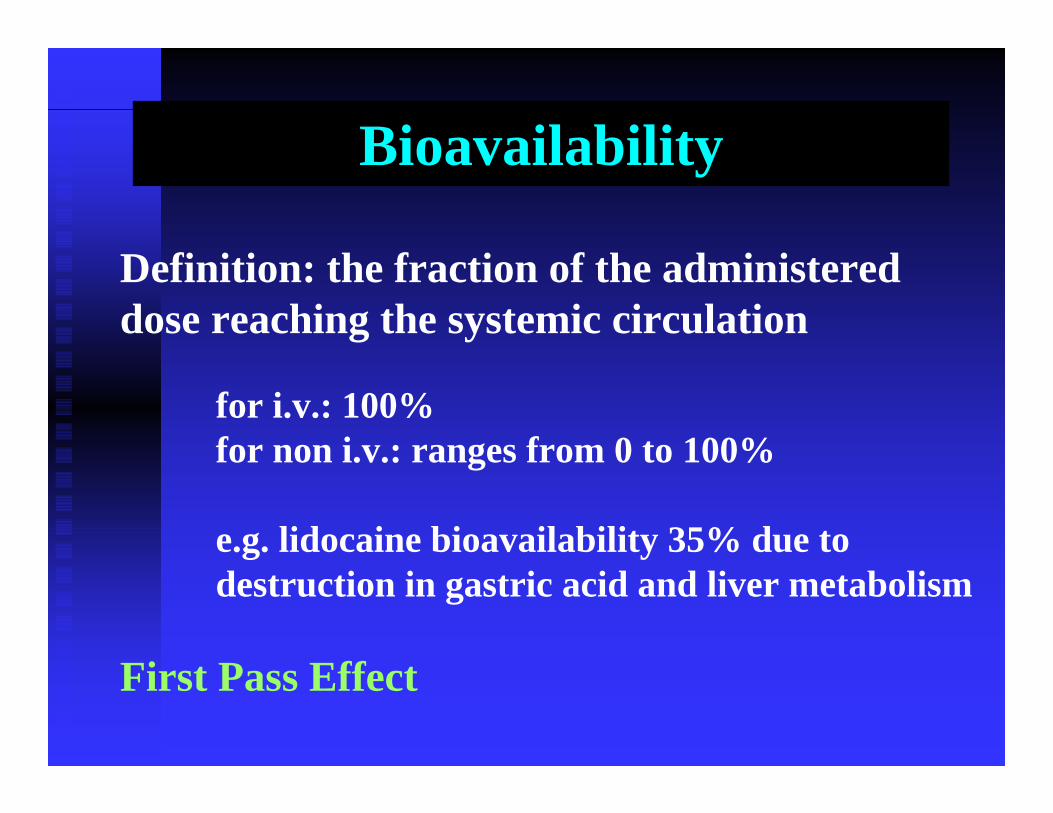
Bioavailability
Definition: the fraction of the administered dose reaching the systemic circulation
for i.v.: 100%for non i.v.: ranges from 0 to 100%
e.g. lidocaine bioavailability 35% due to destruction in gastric acid and liver metabolism
First Pass Effect
05
1020
50
100
0 5 10 15 20
TIME (hours)
Log
Plas
ma
conc
entr
atio
n
IV
Oral
Bioavailability = (AUC) Oral(AUC) IV
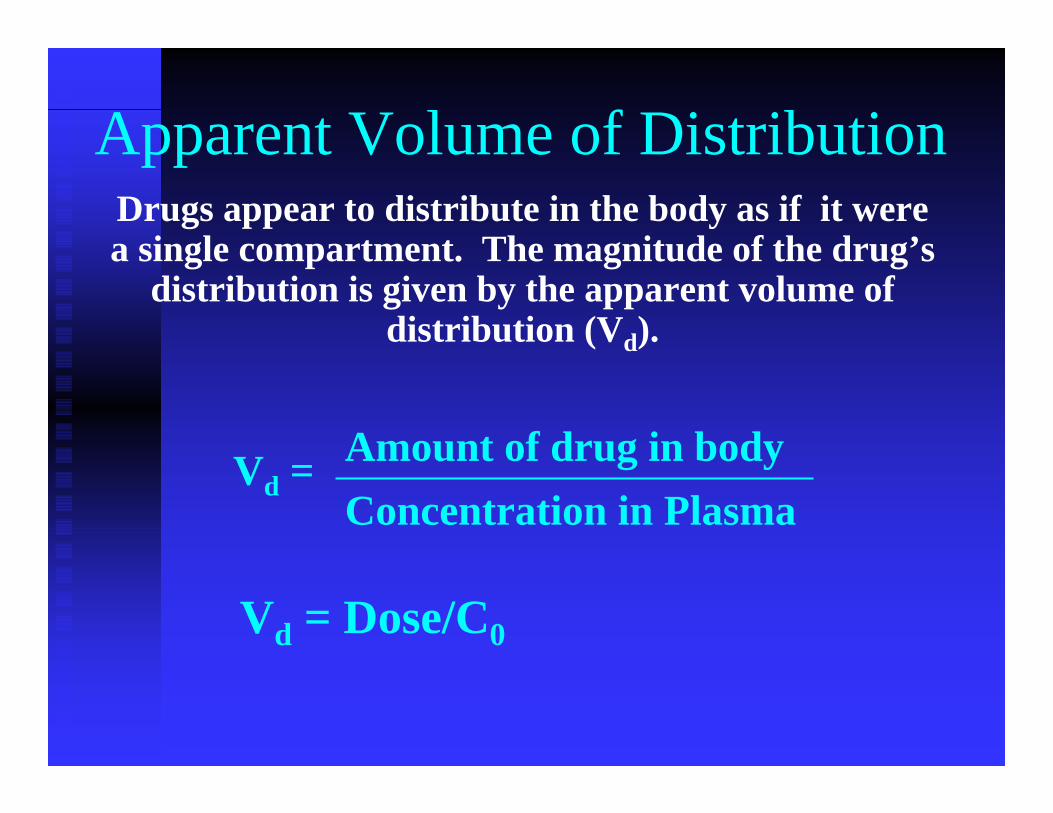
Drugs appear to distribute in the body as if it were a single compartment. The magnitude of the drug’s
distribution is given by the apparent volume of distribution (Vd).
Amount of drug in bodyConcentration in Plasma
Vd =
Apparent Volume of Distribution
Vd = Dose/C0
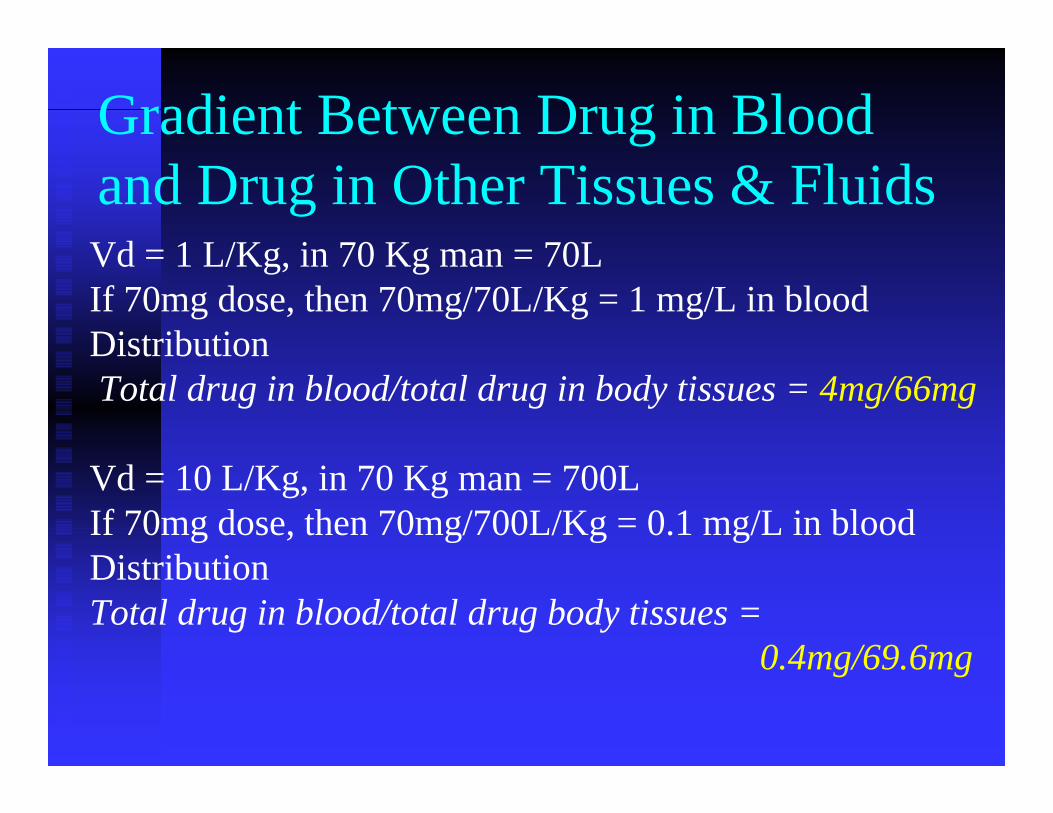
Gradient Between Drug in Blood and Drug in Other Tissues & FluidsVd = 1 L/Kg, in 70 Kg man = 70LIf 70mg dose, then 70mg/70L/Kg = 1 mg/L in bloodDistribution Total drug in blood/total drug in body tissues = 4mg/66mg
Vd = 10 L/Kg, in 70 Kg man = 700LIf 70mg dose, then 70mg/700L/Kg = 0.1 mg/L in bloodDistribution Total drug in blood/total drug body tissues =
0.4mg/69.6mg
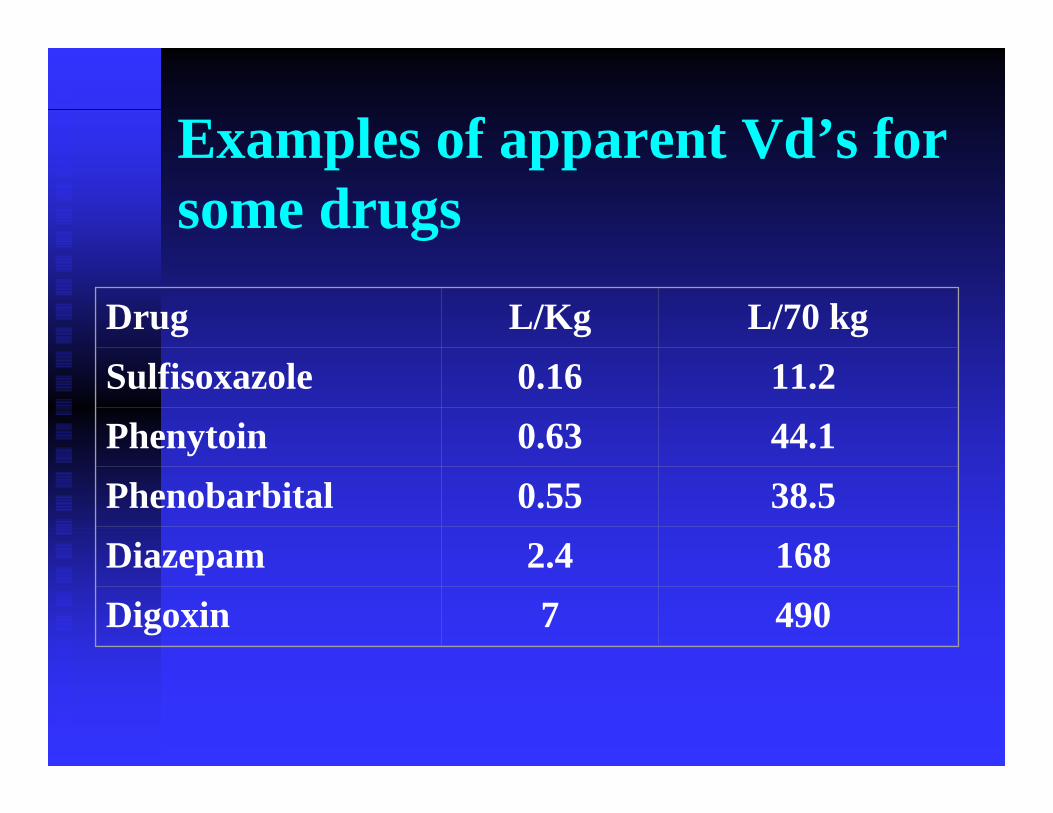
Drug L/Kg L/70 kgSulfisoxazole 0.16 11.2 Phenytoin 0.63 44.1 Phenobarbital 0.55 38.5 Diazepam 2.4 168 Digoxin 7 490
Examples of apparent Vd’s for some drugs
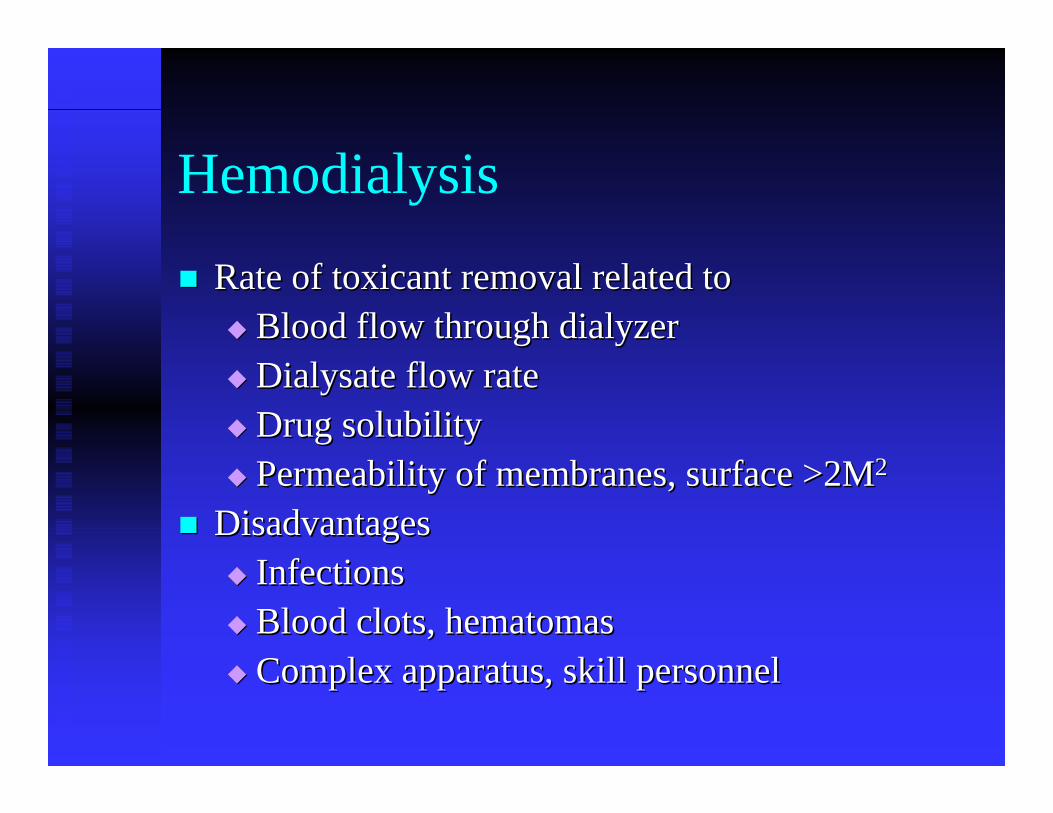
Hemodialysis
Rate of toxicant removal related toRate of toxicant removal related toBlood flow through Blood flow through dialyzerdialyzerDialysate Dialysate flow rateflow rateDrug solubilityDrug solubilityPermeability of membranes, surface >2MPermeability of membranes, surface >2M22
DisadvantagesDisadvantagesInfectionsInfectionsBlood clots, Blood clots, hematomashematomasComplex apparatus, skill personnelComplex apparatus, skill personnel
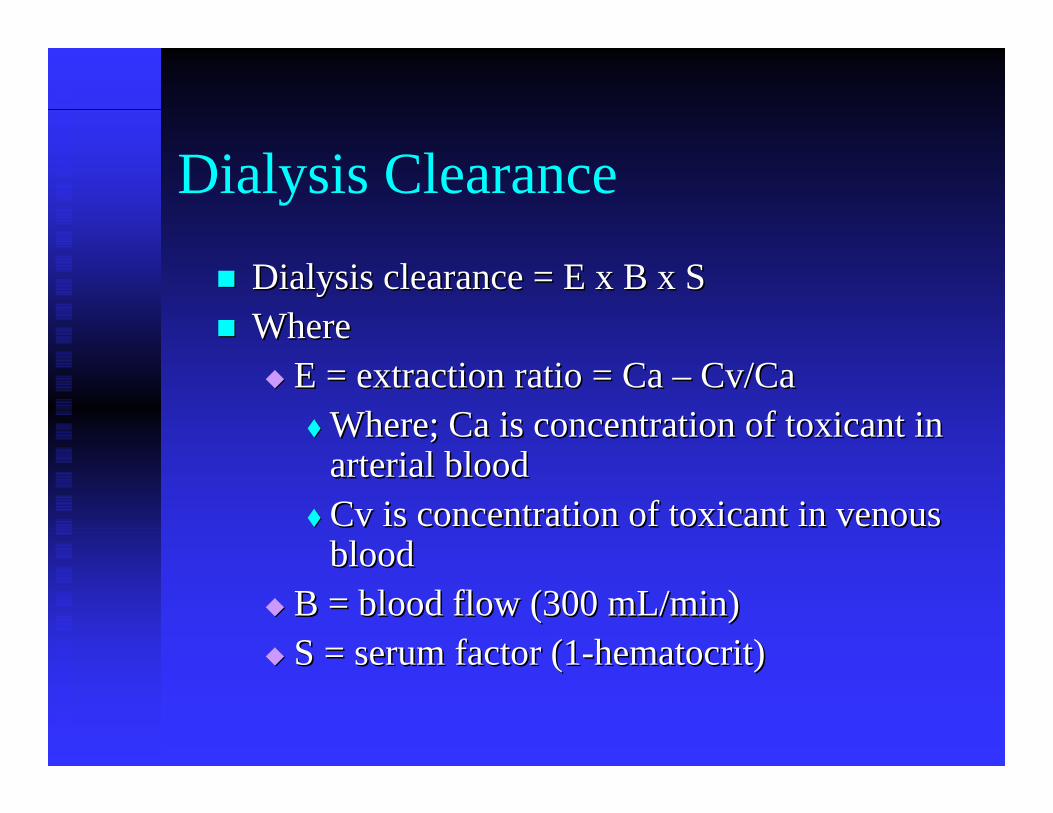
Dialysis Clearance
Dialysis clearance = E x B x SDialysis clearance = E x B x SWhereWhere
E = extraction ratio = Ca E = extraction ratio = Ca –– CvCv/Ca/CaWhere; Ca is concentration of toxicant in Where; Ca is concentration of toxicant in arterial bloodarterial bloodCv Cv is concentration of toxicant in venous is concentration of toxicant in venous bloodblood
B = blood flow (300 mL/min)B = blood flow (300 mL/min)S = serum factor (1S = serum factor (1--hematocrithematocrit) )
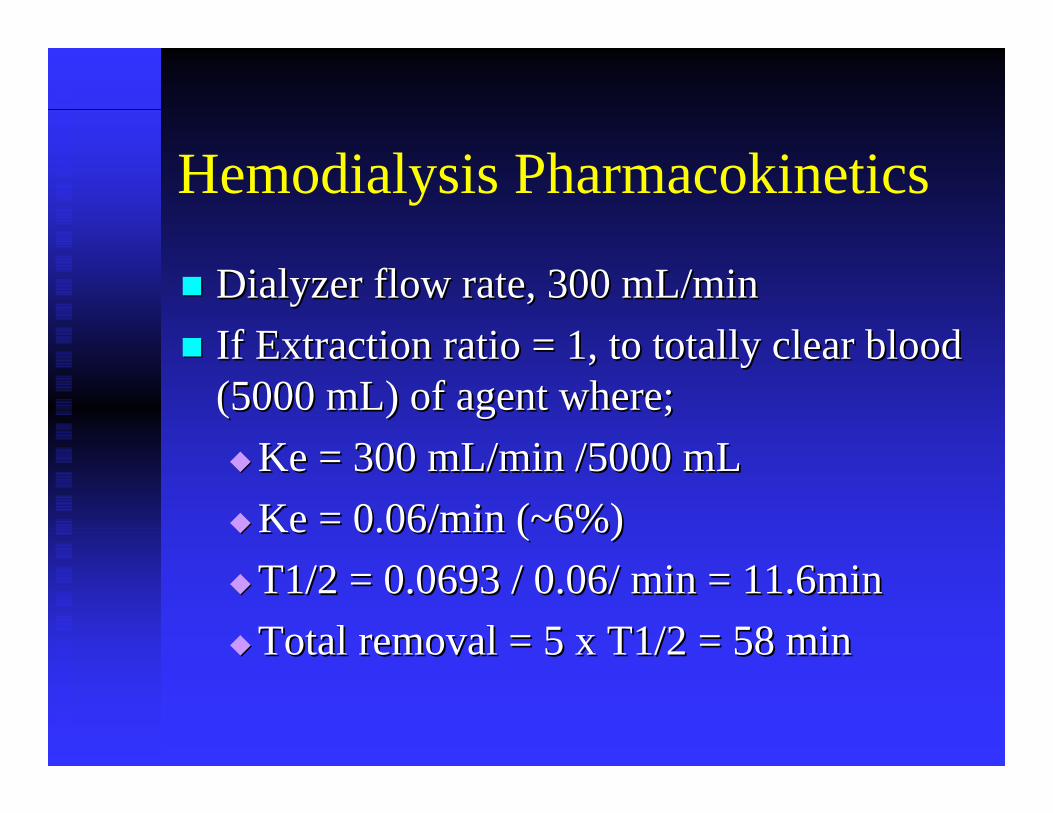
Hemodialysis Pharmacokinetics
Dialyzer Dialyzer flow rate, 300 mL/minflow rate, 300 mL/minIf Extraction ratio = 1, to totally clear blood If Extraction ratio = 1, to totally clear blood (5000 mL) of agent where;(5000 mL) of agent where;
Ke Ke = 300 mL/min /5000 mL= 300 mL/min /5000 mLKe Ke = 0.06/min (~6%)= 0.06/min (~6%)T1/2 = 0.0693 / 0.06/ min = 11.6minT1/2 = 0.0693 / 0.06/ min = 11.6minTotal removal = 5 x T1/2 = 58 minTotal removal = 5 x T1/2 = 58 min

Hemodialysis PharmacokineticsClearance of Methanol
Dialyzer Dialyzer flow rate, 300 mL/minflow rate, 300 mL/minIf Extraction ratio = 1, to totally clear blood (5000 If Extraction ratio = 1, to totally clear blood (5000 mL) of agent where;mL) of agent where;
Vd Vd = 0.6L/Kg, 70Kg man= 0.6L/Kg, 70Kg manKe Ke = 300 mL/min /42000 mL= 300 mL/min /42000 mLKe Ke = 0.007/min (~0.7%)= 0.007/min (~0.7%)T1/2 = 0.0693 / 0.007/ min = 99minT1/2 = 0.0693 / 0.007/ min = 99minTotal removal = 5 x T1/2 = 495 min (~8 hours)Total removal = 5 x T1/2 = 495 min (~8 hours)
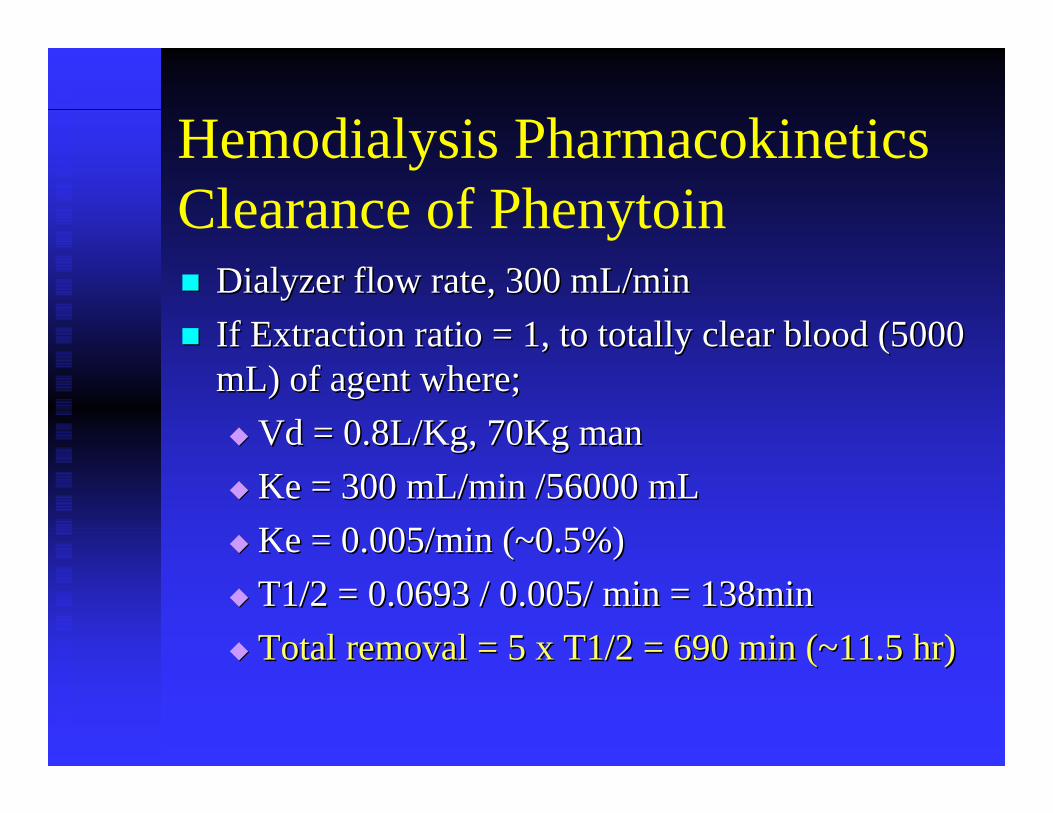
Hemodialysis PharmacokineticsClearance of Phenytoin
Dialyzer Dialyzer flow rate, 300 mL/minflow rate, 300 mL/minIf Extraction ratio = 1, to totally clear blood (5000 If Extraction ratio = 1, to totally clear blood (5000 mL) of agent where;mL) of agent where;
Vd Vd = 0.8L/Kg, 70Kg man= 0.8L/Kg, 70Kg manKe Ke = 300 mL/min /56000 mL= 300 mL/min /56000 mLKe Ke = 0.005/min (~0.5%)= 0.005/min (~0.5%)T1/2 = 0.0693 / 0.005/ min = 138minT1/2 = 0.0693 / 0.005/ min = 138minTotal removal = 5 x T1/2 = 690 min (~11.5 hr)Total removal = 5 x T1/2 = 690 min (~11.5 hr)
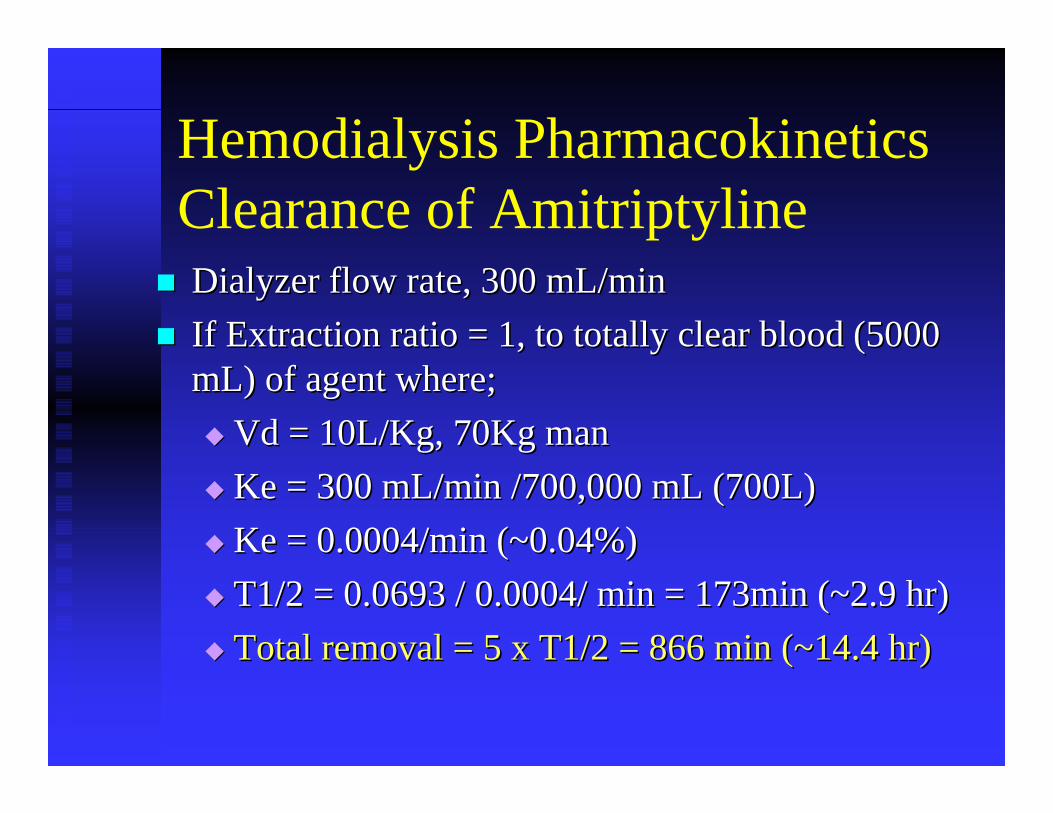
Hemodialysis PharmacokineticsClearance of AmitriptylineDialyzer Dialyzer flow rate, 300 mL/minflow rate, 300 mL/minIf Extraction ratio = 1, to totally clear blood (5000 If Extraction ratio = 1, to totally clear blood (5000 mL) of agent where;mL) of agent where;
Vd Vd = 10L/Kg, 70Kg man= 10L/Kg, 70Kg manKe Ke = 300 mL/min /700,000 mL (700L)= 300 mL/min /700,000 mL (700L)Ke Ke = 0.0004/min (~0.04%)= 0.0004/min (~0.04%)T1/2 = 0.0693 / 0.0004/ min = 173min (~2.9 hr)T1/2 = 0.0693 / 0.0004/ min = 173min (~2.9 hr)Total removal = 5 x T1/2 = 866 min (~14.4 hr)Total removal = 5 x T1/2 = 866 min (~14.4 hr)
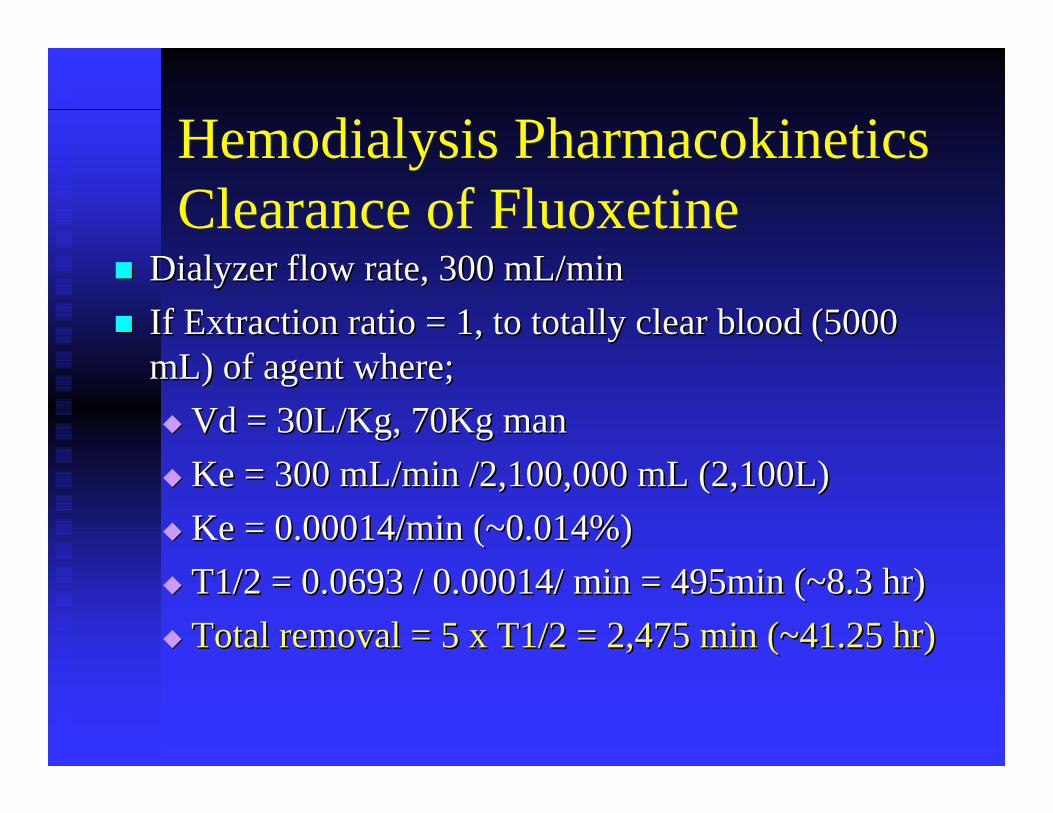
Hemodialysis PharmacokineticsClearance of Fluoxetine
Dialyzer Dialyzer flow rate, 300 mL/minflow rate, 300 mL/minIf Extraction ratio = 1, to totally clear blood (5000 If Extraction ratio = 1, to totally clear blood (5000 mL) of agent where;mL) of agent where;
Vd Vd = 30L/Kg, 70Kg man= 30L/Kg, 70Kg manKe Ke = 300 mL/min /2,100,000 mL (2,100L)= 300 mL/min /2,100,000 mL (2,100L)Ke Ke = 0.00014/min (~0.014%)= 0.00014/min (~0.014%)T1/2 = 0.0693 / 0.00014/ min = 495min (~8.3 hr)T1/2 = 0.0693 / 0.00014/ min = 495min (~8.3 hr)Total removal = 5 x T1/2 = 2,475 min (~41.25 hr)Total removal = 5 x T1/2 = 2,475 min (~41.25 hr)
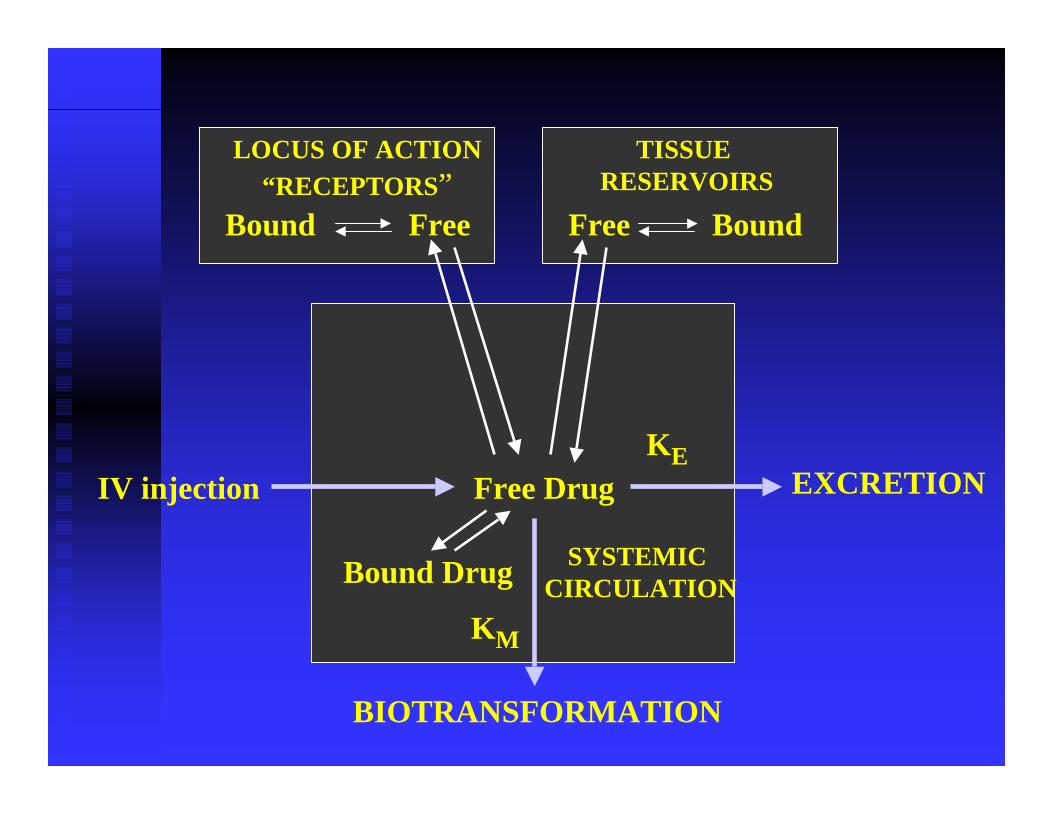
Bound Free Free Bound
LOCUS OF ACTION“RECEPTORS”
TISSUE RESERVOIRS
SYSTEMIC CIRCULATION
Free Drug
Bound Drug
IV injection EXCRETION
BIOTRANSFORMATION
KE
KM
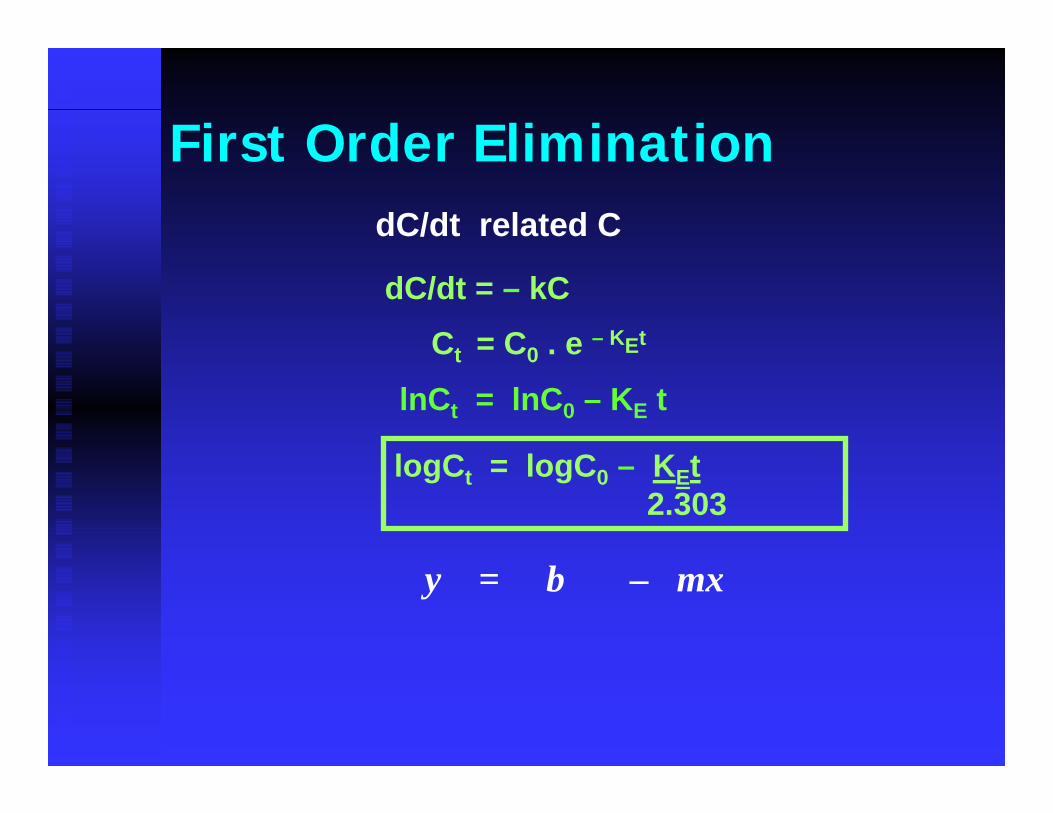
Ct = C0 . e – KEt
lnCt = lnC0 – KE t
logCt = logC0 – KEt 2.303
dC/dt = – kC
y = b – mx
dC/dt related C
First Order Elimination
T im e
Log
Plas
ma
Con
cent
ratio
n
0 1 2 3 4 5 61
1 0
1 0 0
1 0 0 0
1 0 0 0 0
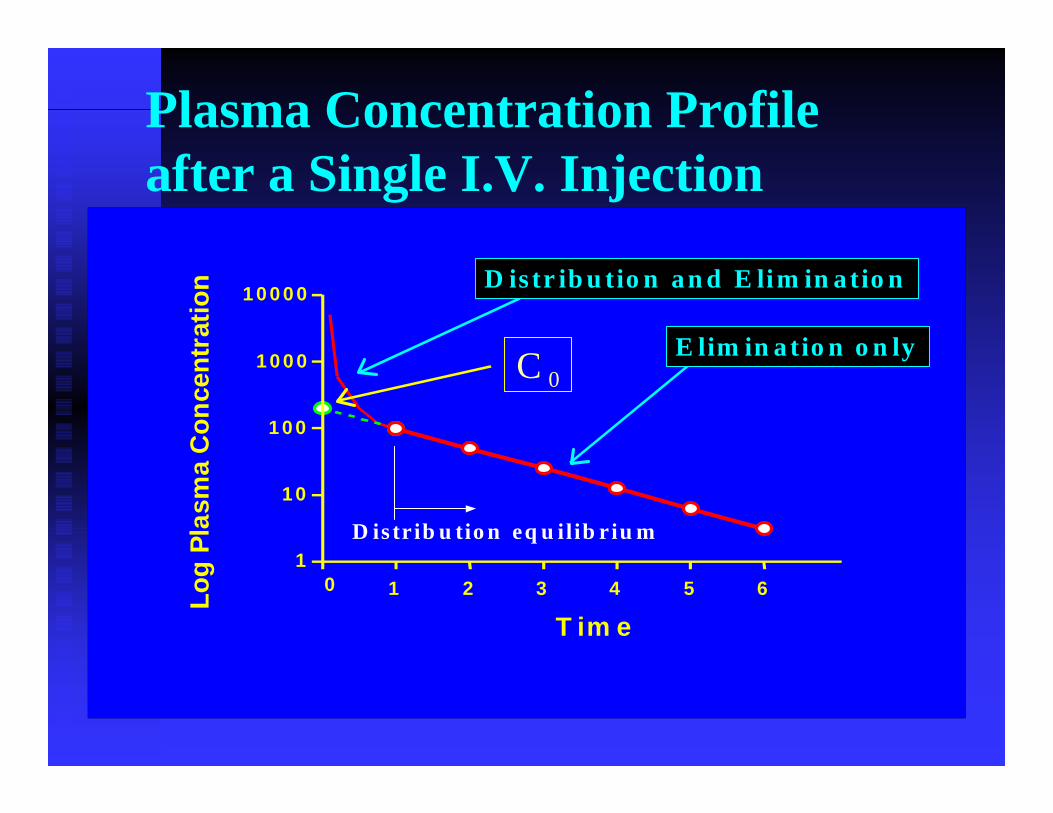
C 0
D is tr ib u tio n eq u ilib r iu m
E lim in a tio n o n ly
D is tr ib u tio n a n d E lim in a tio n
Plasma Concentration Profile after a Single I.V. Injection
Time
Log
Plas
ma
Con
cent
ratio
n
0 1 2 3 4 5 61
10
100
1000
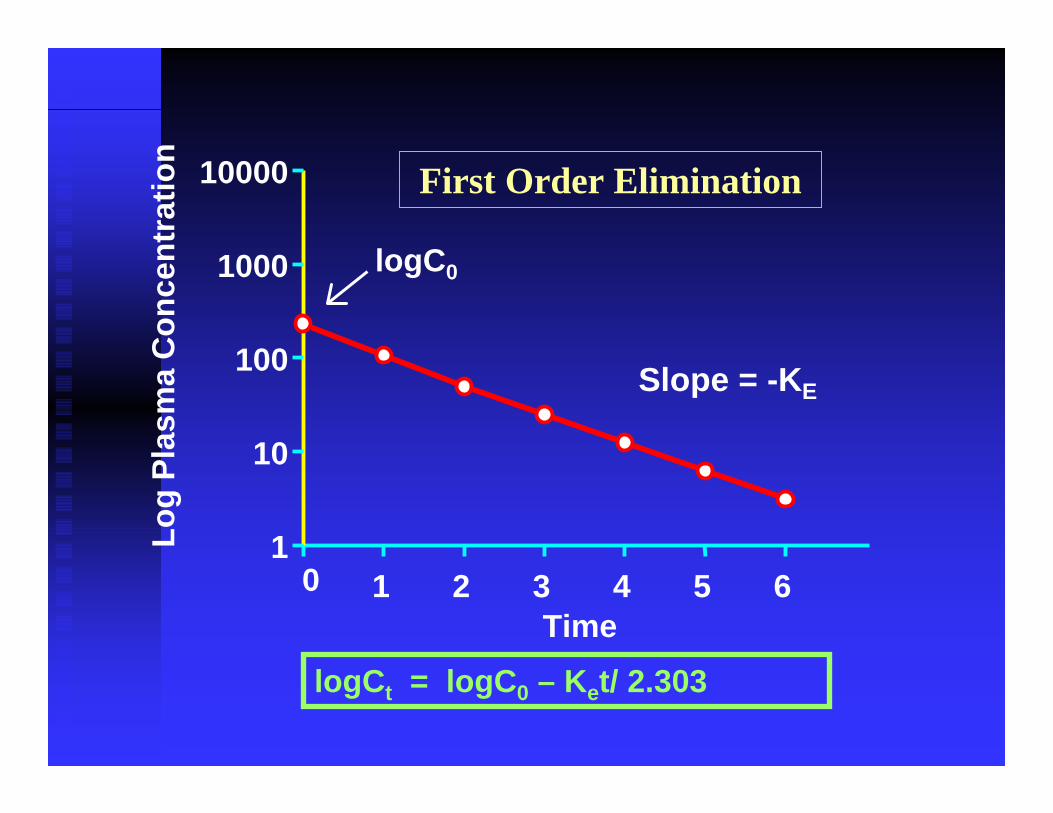
10000 First Order Elimination
logCt = logC0 – Ket/ 2.303
Slope = -KE
logC0
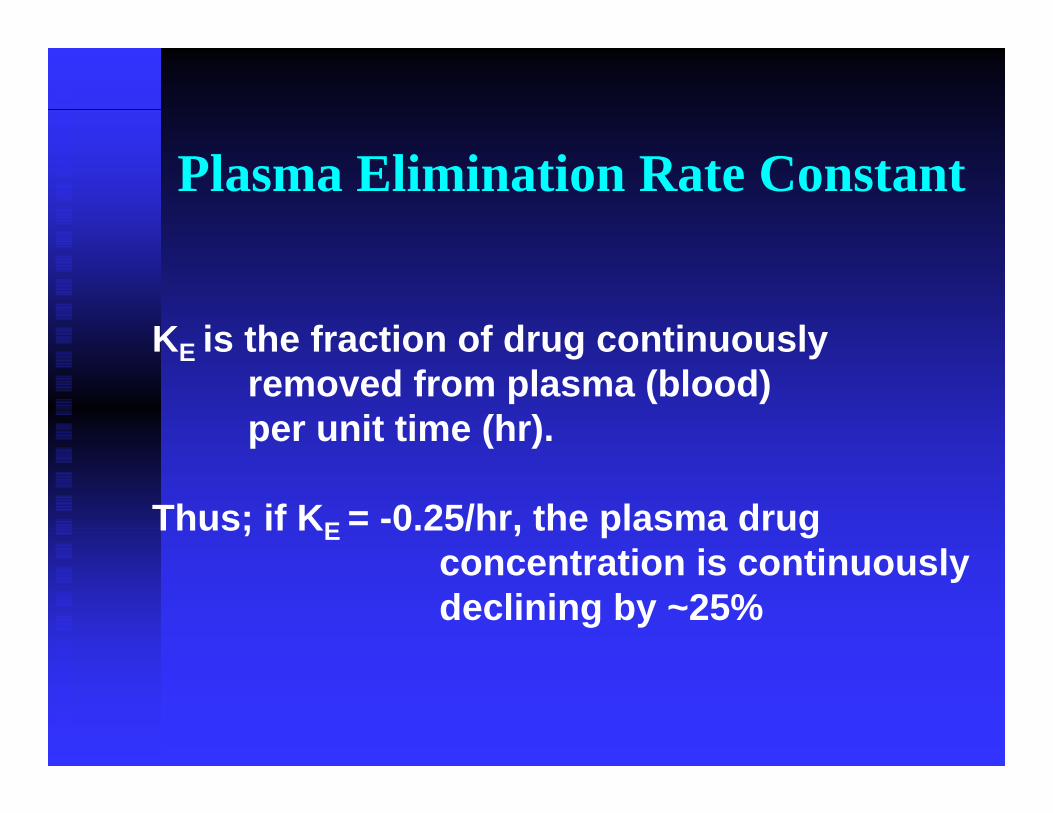
Plasma Elimination Rate Constant
KE is the fraction of drug continuously removed from plasma (blood) per unit time (hr).
Thus; if KE = -0.25/hr, the plasma drug concentration is continuouslydeclining by ~25%
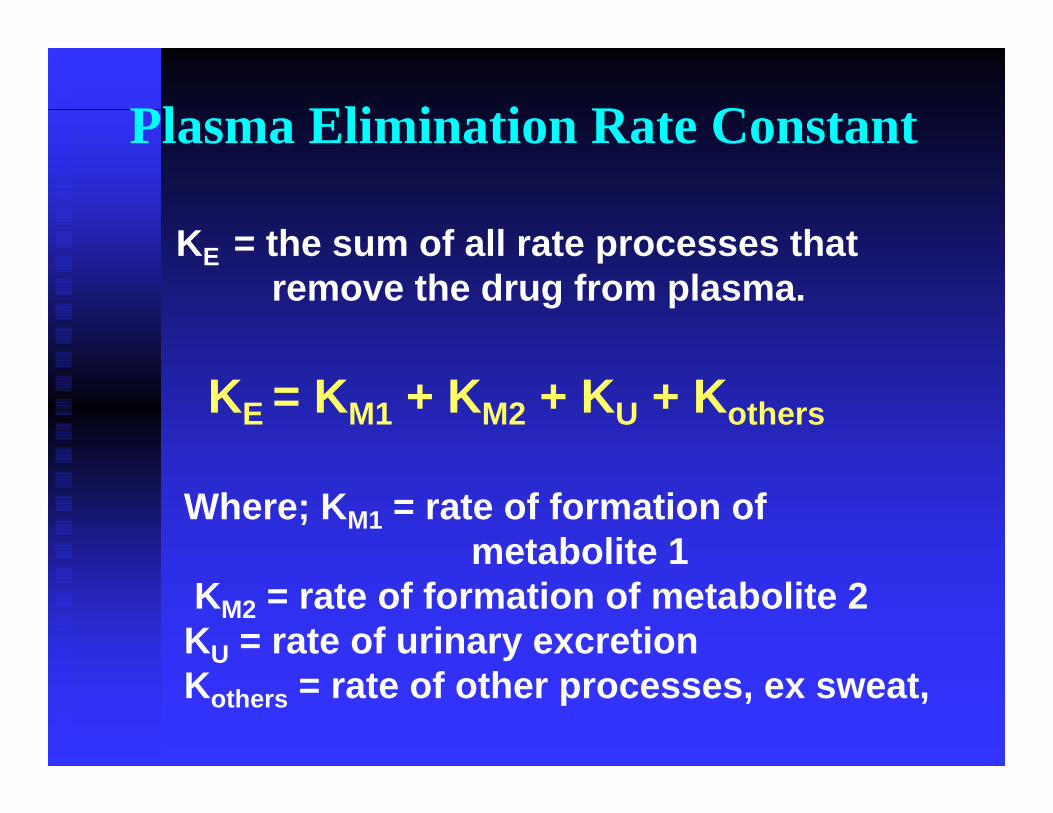
Plasma Elimination Rate Constant
KE = the sum of all rate processes that remove the drug from plasma.
KE = KM1 + KM2 + KU + Kothers
Where; KM1 = rate of formation of metabolite 1
KM2 = rate of formation of metabolite 2KU = rate of urinary excretionKothers = rate of other processes, ex sweat,
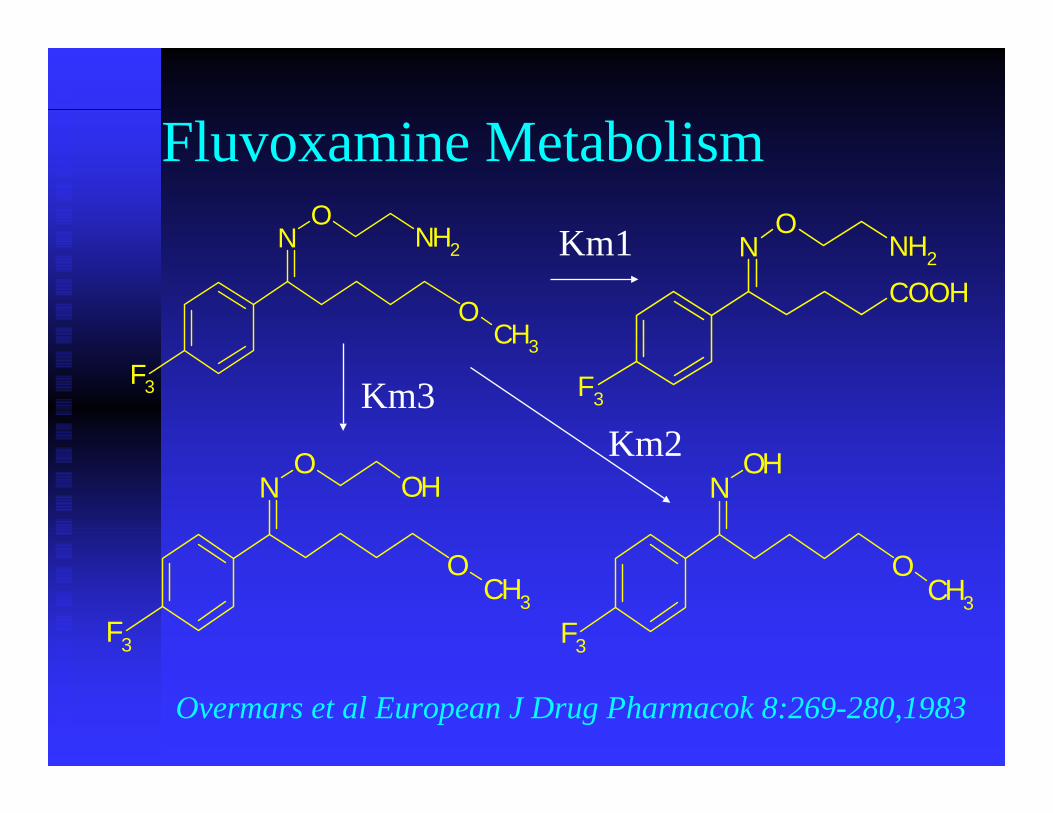
Fluvoxamine Metabolism
F3
NO
NH2
OCH3
F3
NO
OH
OCH3
F3
NOH
OCH3
F3
NO
NH2
COOH
Overmars et al European J Drug Pharmacok 8:269-280,1983
Km1
Km2Km3
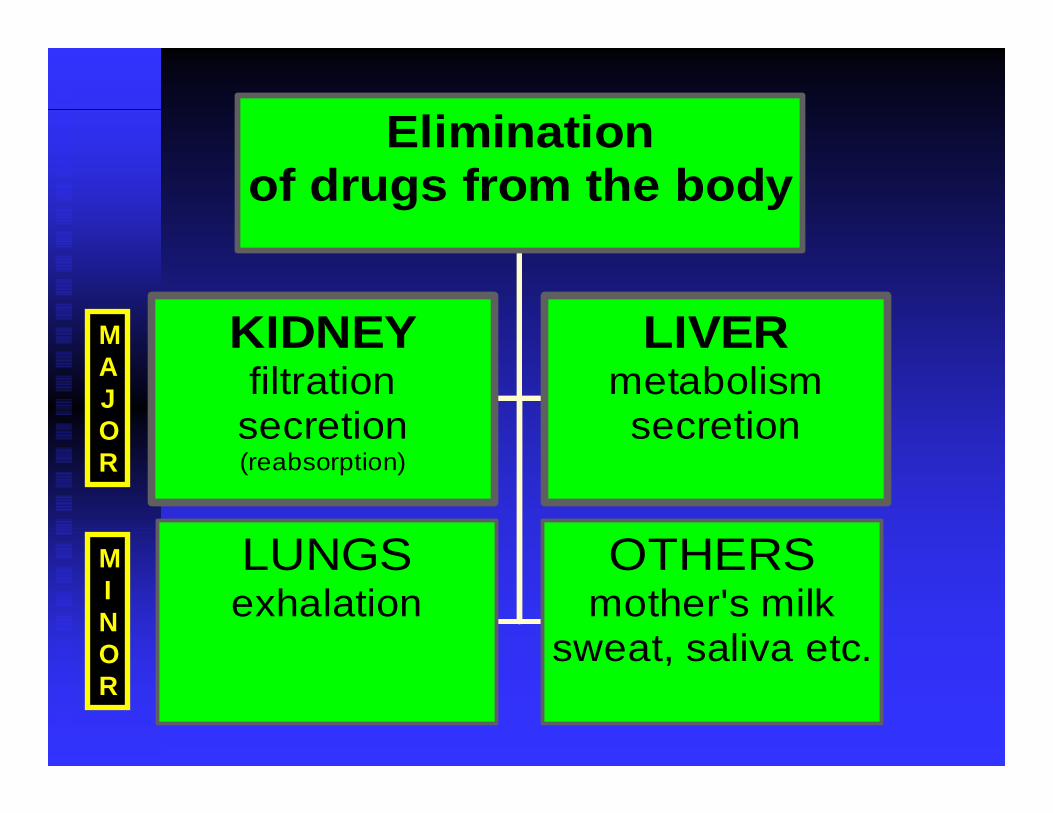
KIDNEYfiltrationsecretion(reabsorption)
LIVERmetabolismsecretion
LUNGSexhalation
OTHERSmother's milk
sweat, saliva etc.
Eliminationof drugs from the body
MAJOR
MINOR
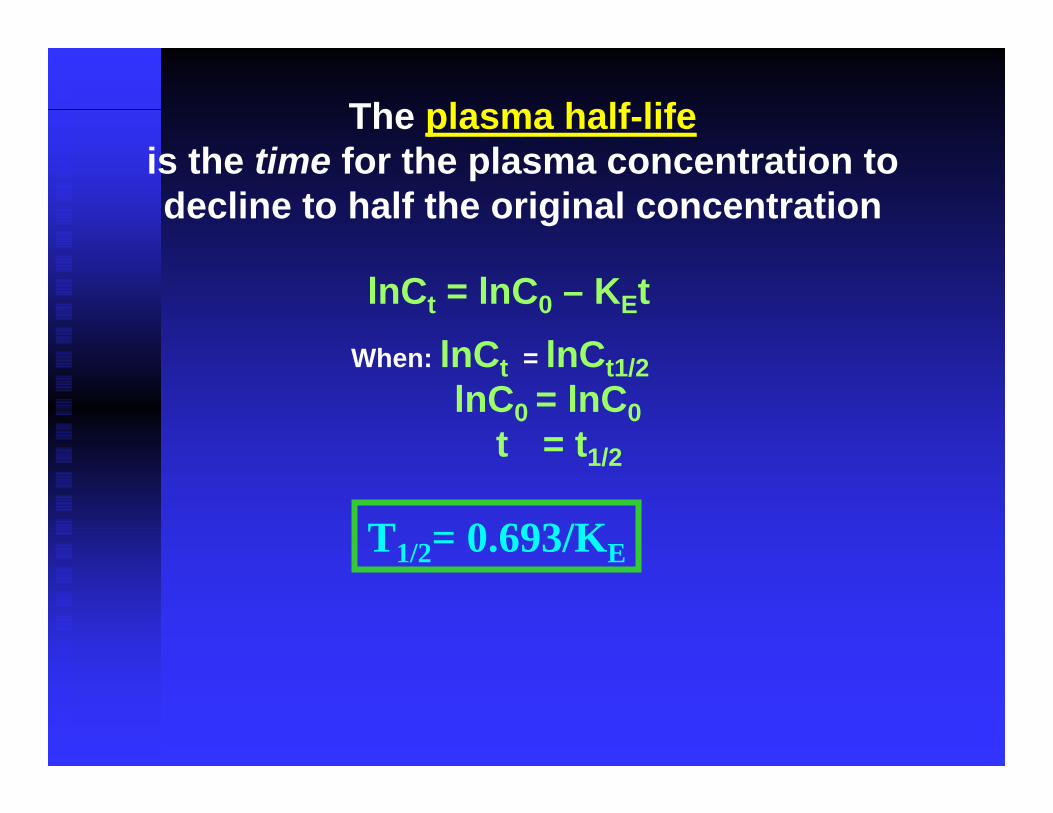
lnCt = lnC0 – KEt
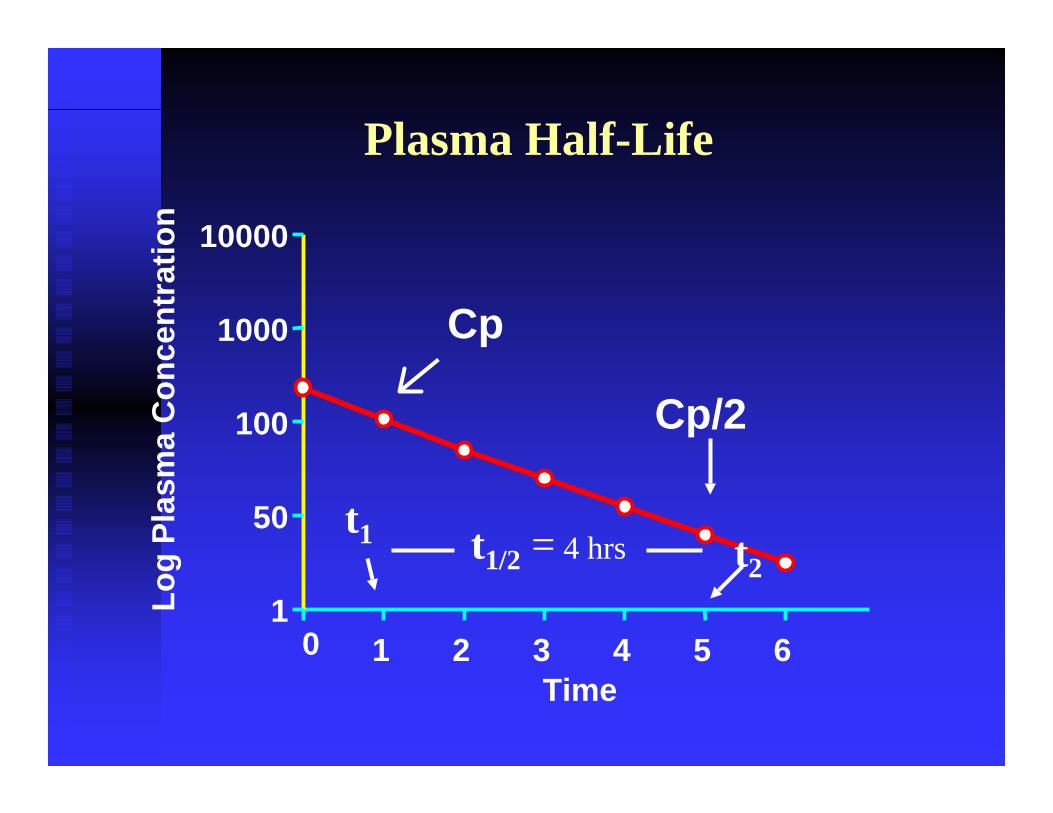
The plasma half-lifeis the time for the plasma concentration to decline to half the original concentration
T1/2= 0.693/KE
When: lnCt = lnCt1/2lnC0 = lnC0
t = t1/2
Time
Log
Plas
ma
Con
cent
ratio
n
0 1 2 3 4 5 61
50
100
1000
10000
Plasma Half-Life
Cp/2
Cp
t1 t2t1/2 = 4 hrs
First Order Elimination
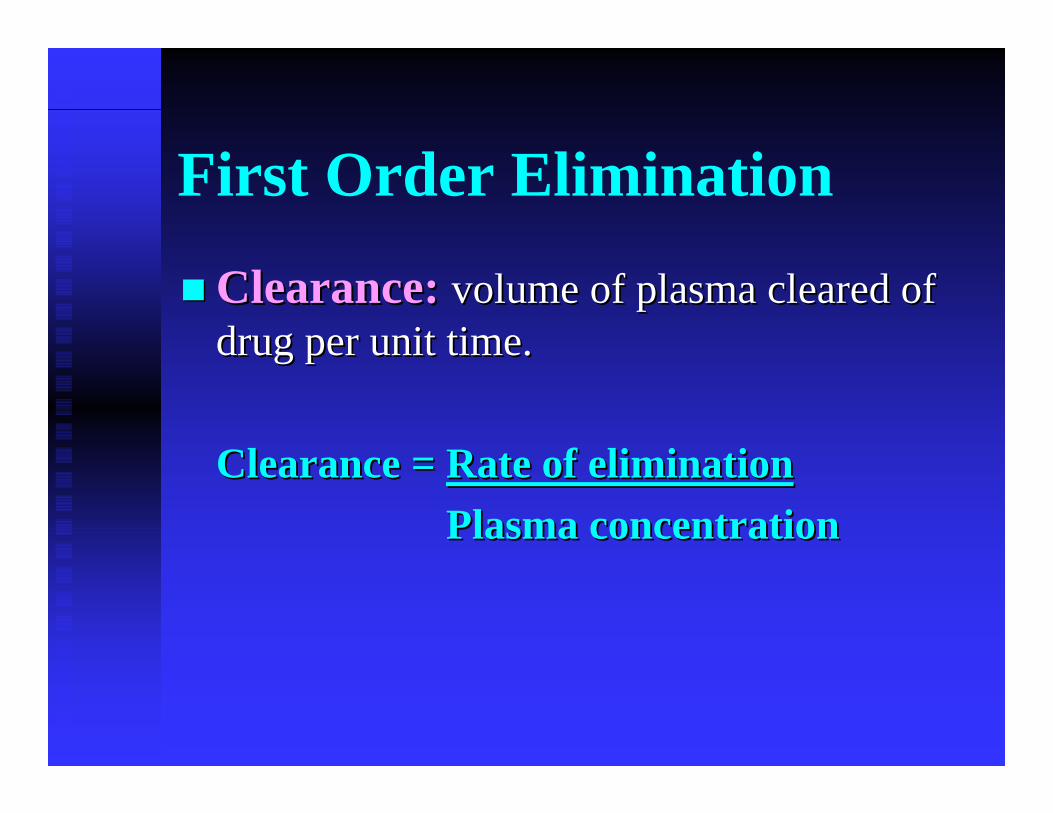
Clearance:Clearance: volume of plasma cleared of volume of plasma cleared of drug per unit time.drug per unit time.
Clearance = Clearance = Rate of eliminationRate of eliminationPlasma concentrationPlasma concentration
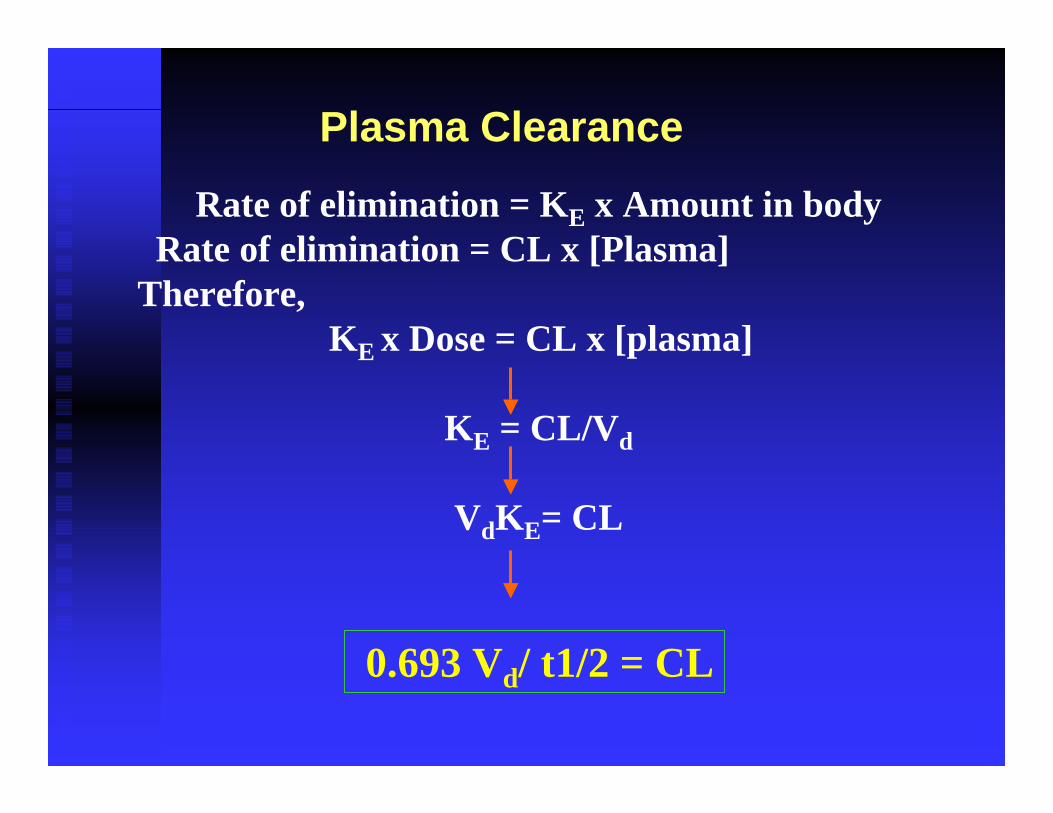
Rate of elimination = KE x Amount in bodyRate of elimination = CL x [Plasma]
Therefore,KE x Dose = CL x [plasma]
KE = CL/Vd
VdKE= CL
0.693 Vd/ t1/2 = CL
Plasma Clearance
Plasma Clearance
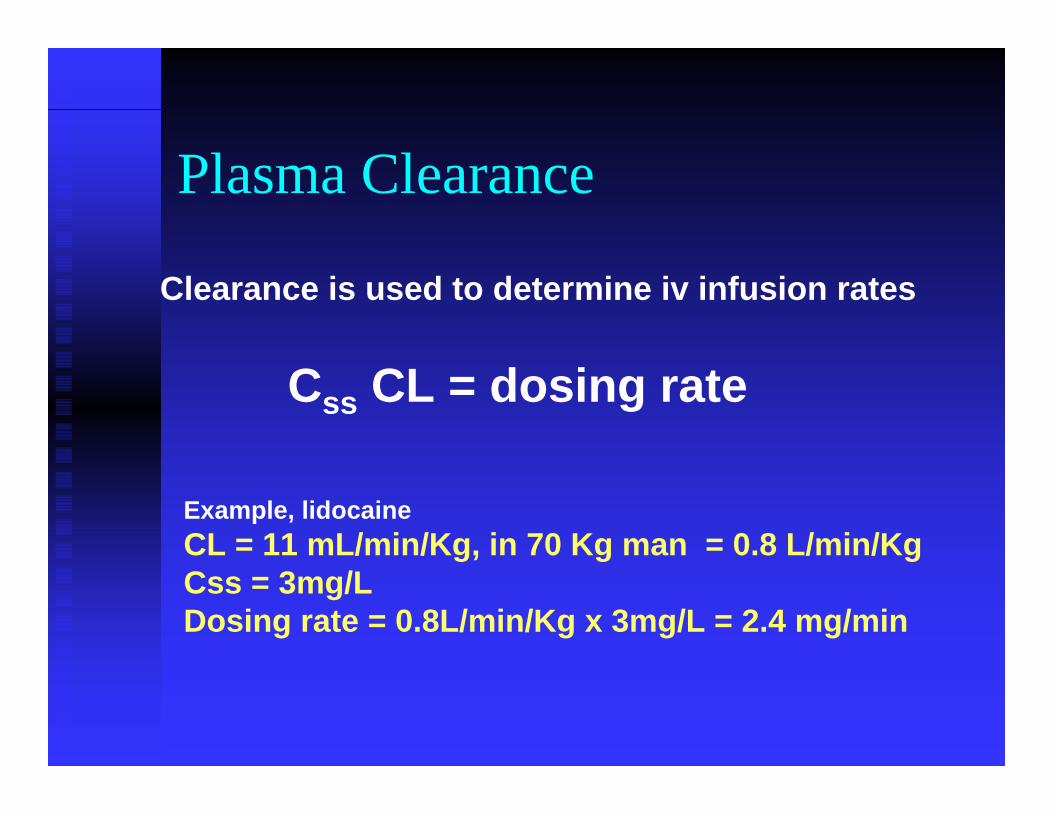
Clearance is used to determine iv infusion rates
Css CL = dosing rate
Example, lidocaine CL = 11 mL/min/Kg, in 70 Kg man = 0.8 L/min/KgCss = 3mg/LDosing rate = 0.8L/min/Kg x 3mg/L = 2.4 mg/min
Bound Free Free Bound
LOCUS OF ACTION“RECEPTORS”
TISSUE RESERVOIRS
SYSTEMIC CIRCULATION
Free Drug
Bound Drug
ABSORPTION EXCRETION
BIOTRANSFORMATION
KA Ke
KM
Multiple dosing
On continuous steady administration of a drug, On continuous steady administration of a drug, plasma concentration will rise fast at first then plasma concentration will rise fast at first then more slowly and reach a plateau, where:more slowly and reach a plateau, where:
rate ofrate of administration administration = rate of = rate of eliminationelimination
ieie. steady state is reached.. steady state is reached.
0
1
2
4
8
16
32
64
0 5 10 15 20 25 30
Time
Plas
ma
Con
cent
ratio
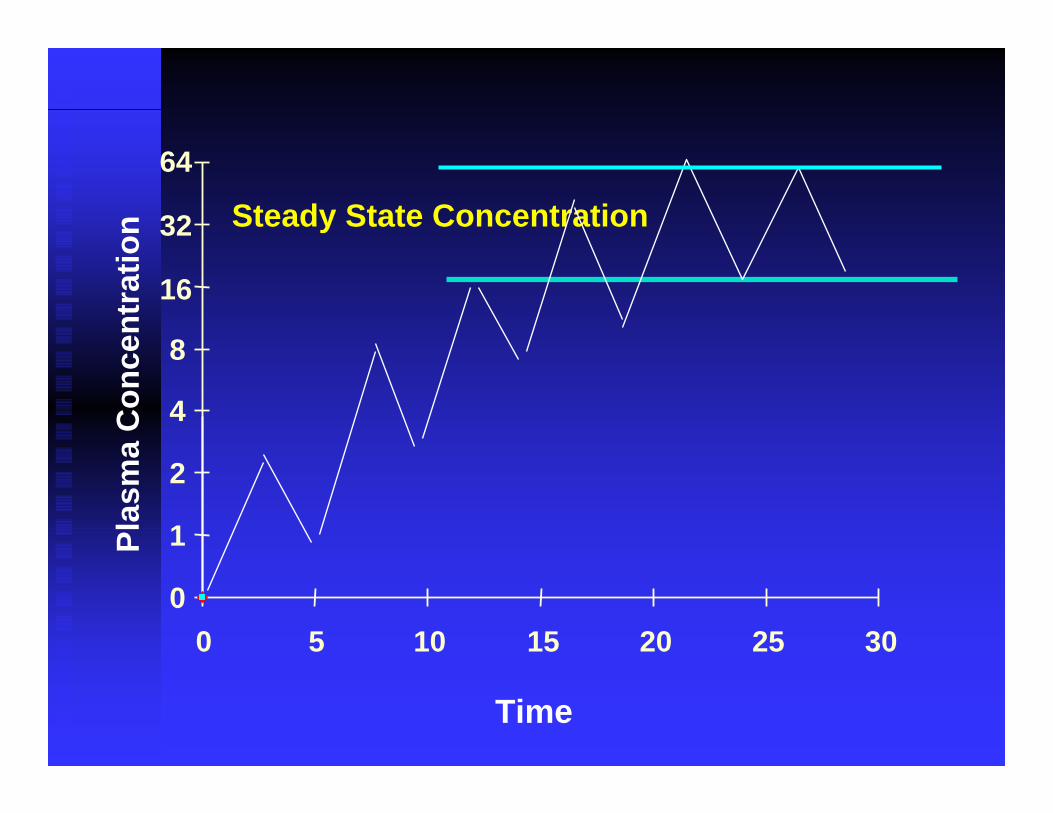
n Steady State Concentration
Steady State Plasma ConcentrationsObtained after dosing for 5 halfObtained after dosing for 5 half--liveslivesAfter drug administration is stopped, After drug administration is stopped, requires 5 halfrequires 5 half--lives to decline to zerolives to decline to zero
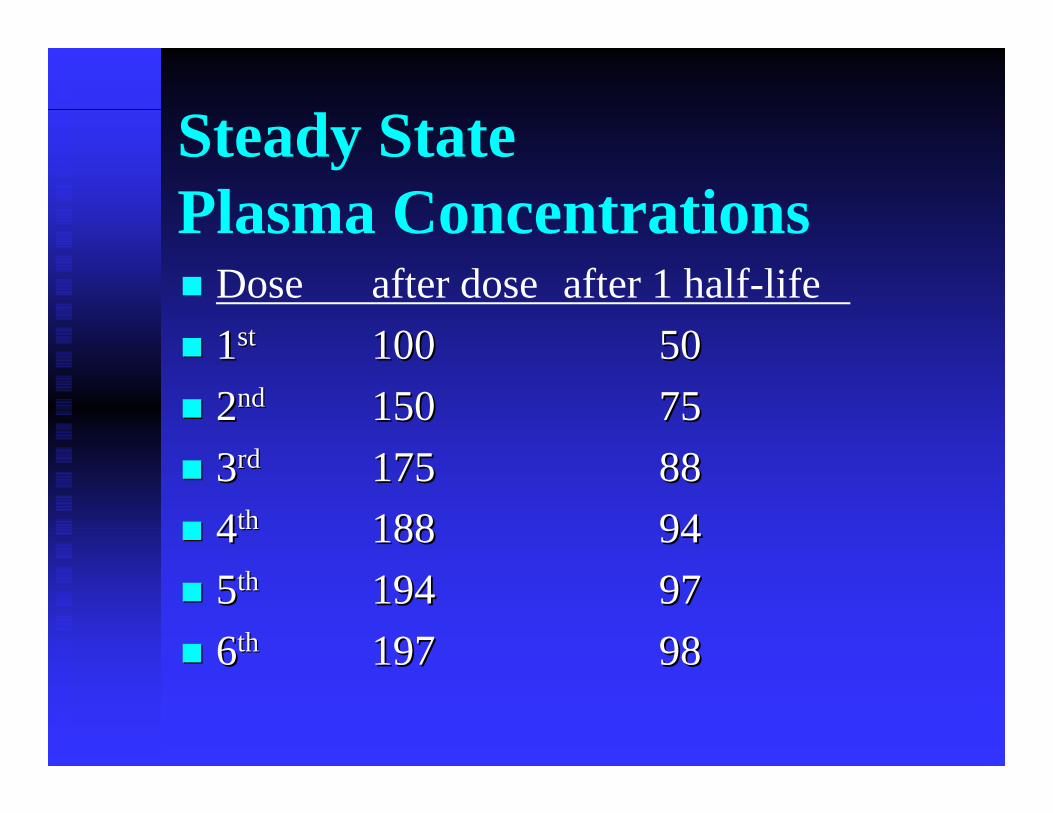
Steady State Plasma Concentrations
Dose after dose after 1 half-life11stst 100100 505022ndnd 150150 757533rdrd 175175 888844thth 188188 949455thth 194194 979766thth 197197 9898
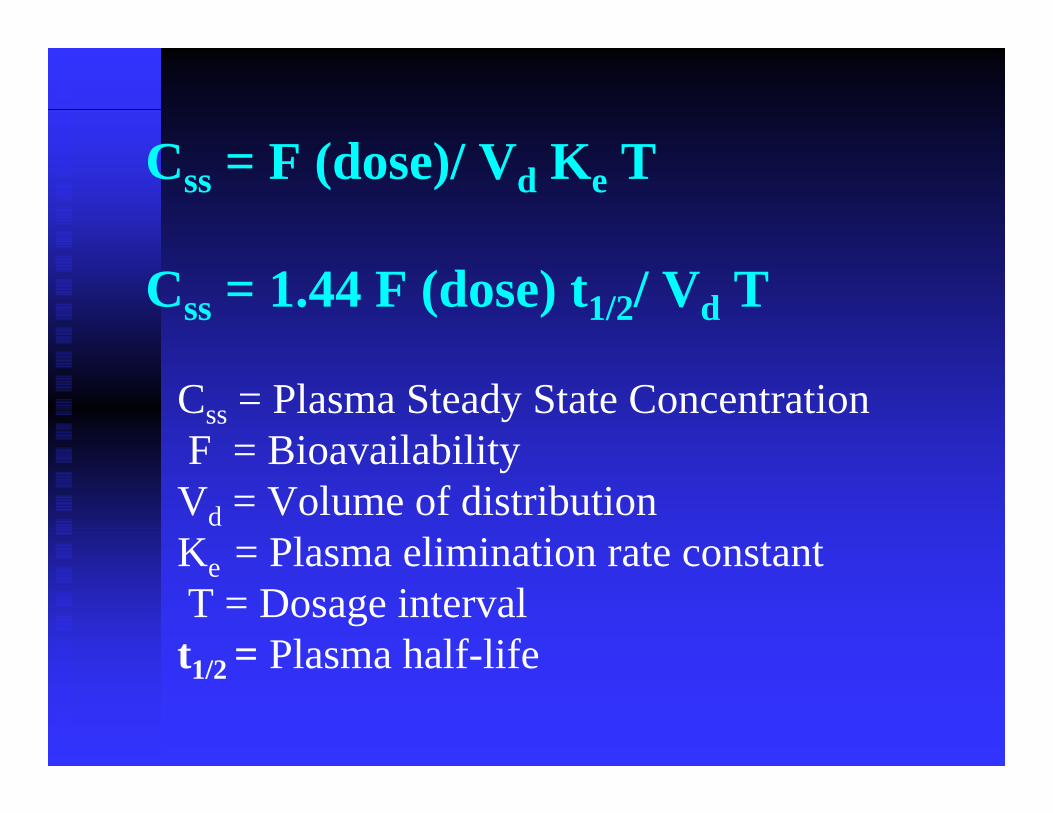
Css = F (dose)/ Vd Ke T
Css = 1.44 F (dose) t1/2/ Vd T
Css = Plasma Steady State ConcentrationF = BioavailabilityVd = Volume of distributionKe = Plasma elimination rate constantT = Dosage intervalt1/2 = Plasma half-life
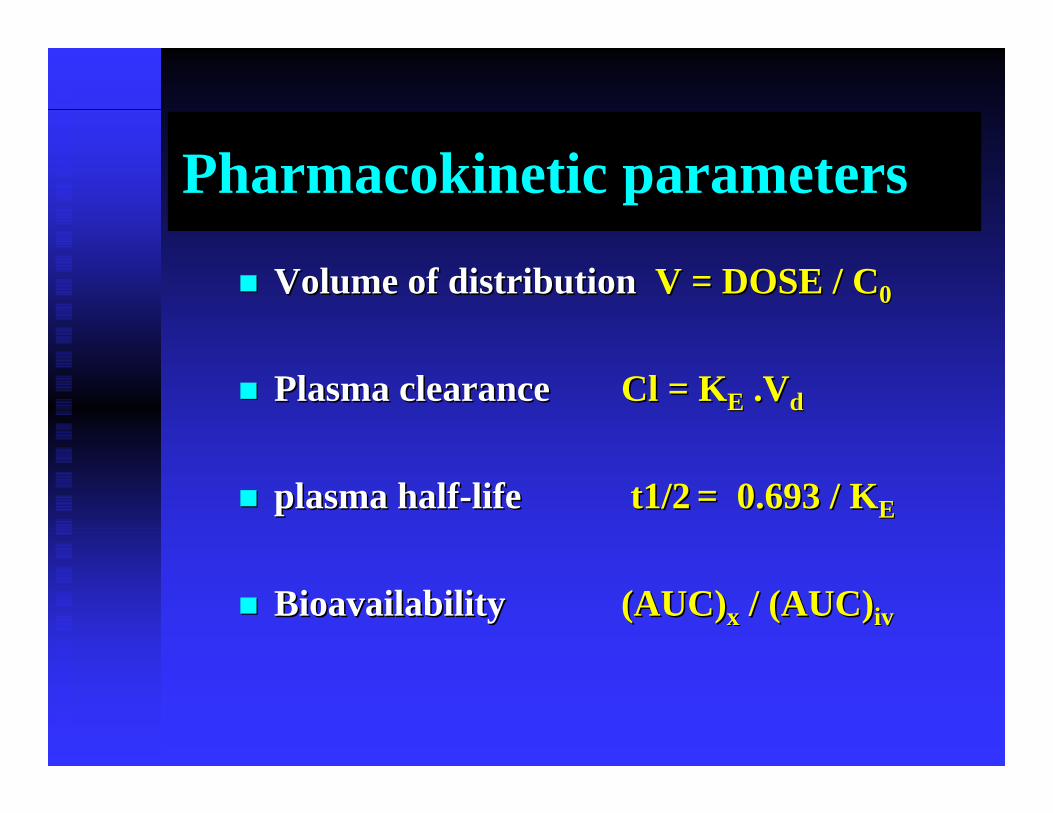
Pharmacokinetic parameters
Volume of distribution Volume of distribution V = DOSE / CV = DOSE / C00
Plasma clearancePlasma clearance ClCl = K= KEE ..VVdd
plasma halfplasma half--life life t1/2t1/2 = 0.693 / K= 0.693 / KEE
BioavailabilityBioavailability (AUC)(AUC)xx / (AUC)/ (AUC)iviv

Daily Dose (mg/kg)
Plas
ma
Dru
gC
once
ntra
tion
(mg/
L)
0 5 10 150
10
20
30
40
50
60
Variability in Drug Metabolism
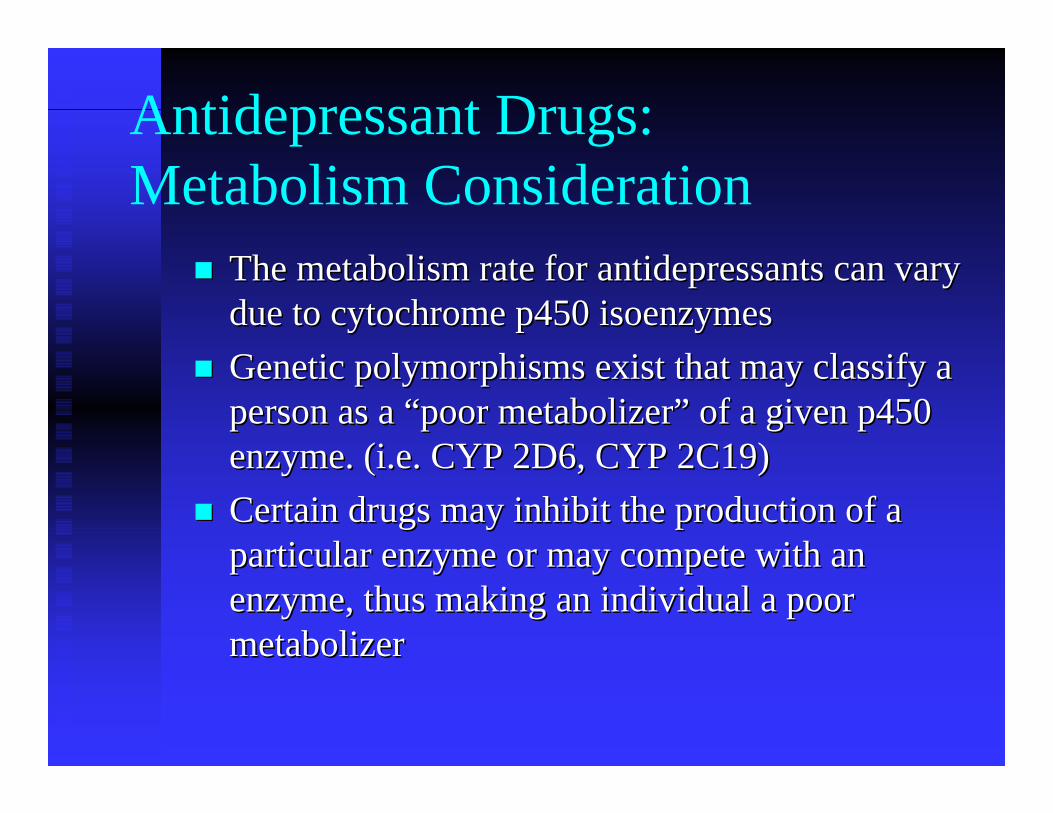
Antidepressant Drugs:Metabolism Consideration
The metabolism rate for antidepressants can vary The metabolism rate for antidepressants can vary due to cytochrome p450 due to cytochrome p450 isoenzymes isoenzymes Genetic polymorphisms exist that may classify a Genetic polymorphisms exist that may classify a person as a “poor metabolizer” of a given p450 person as a “poor metabolizer” of a given p450 enzyme. (i.e. CYP 2D6, CYP 2C19)enzyme. (i.e. CYP 2D6, CYP 2C19)Certain drugs may inhibit the production of a Certain drugs may inhibit the production of a particular enzyme or may compete with an particular enzyme or may compete with an enzyme, thus making an individual a poor enzyme, thus making an individual a poor metabolizermetabolizer
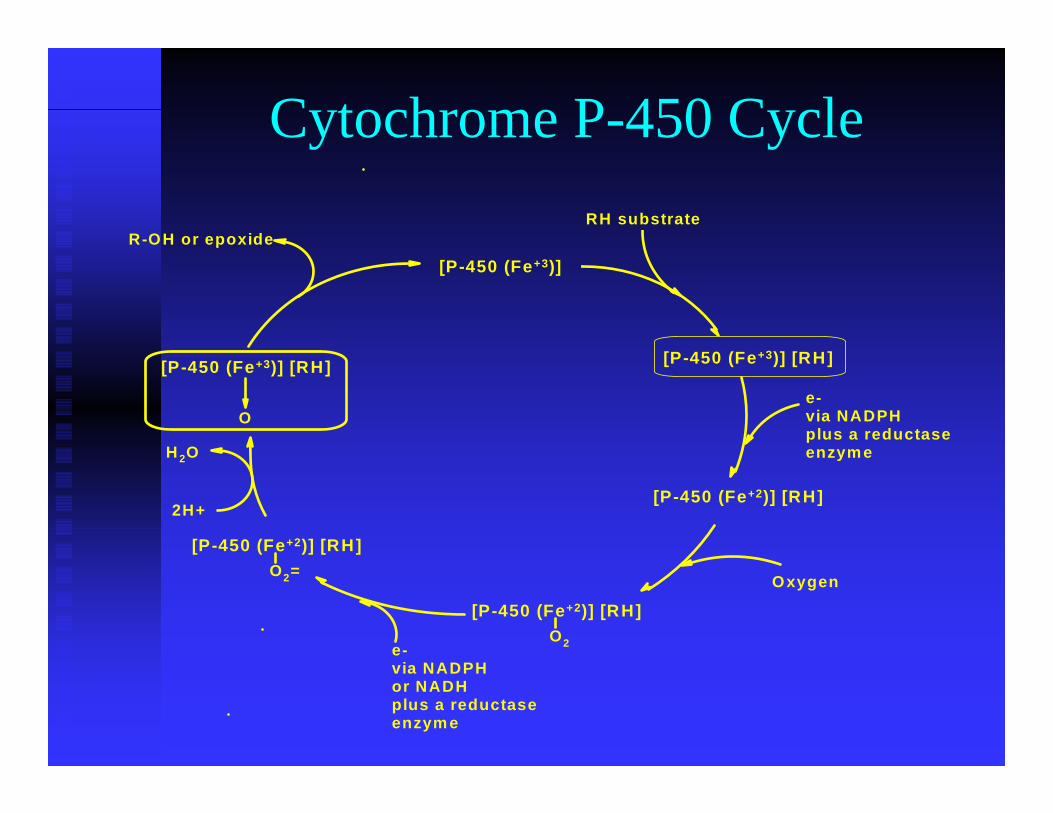
Cytochrome P-450 Cycle
[P-450 (Fe+3)]
[P-450 (Fe+2)] [RH]
[P-450 (Fe+3)] [RH][P-450 (Fe+3)] [RH]
O
[P-450 (Fe+2)] [RH]O2=
[P-450 (Fe+2)] [RH]O2
2H+
H 2O
R-OH or epoxideRH substrate
e-via NADPHplus a reductase enzyme
Oxygen
e-via NADPHor NADHplus a reductase enzyme
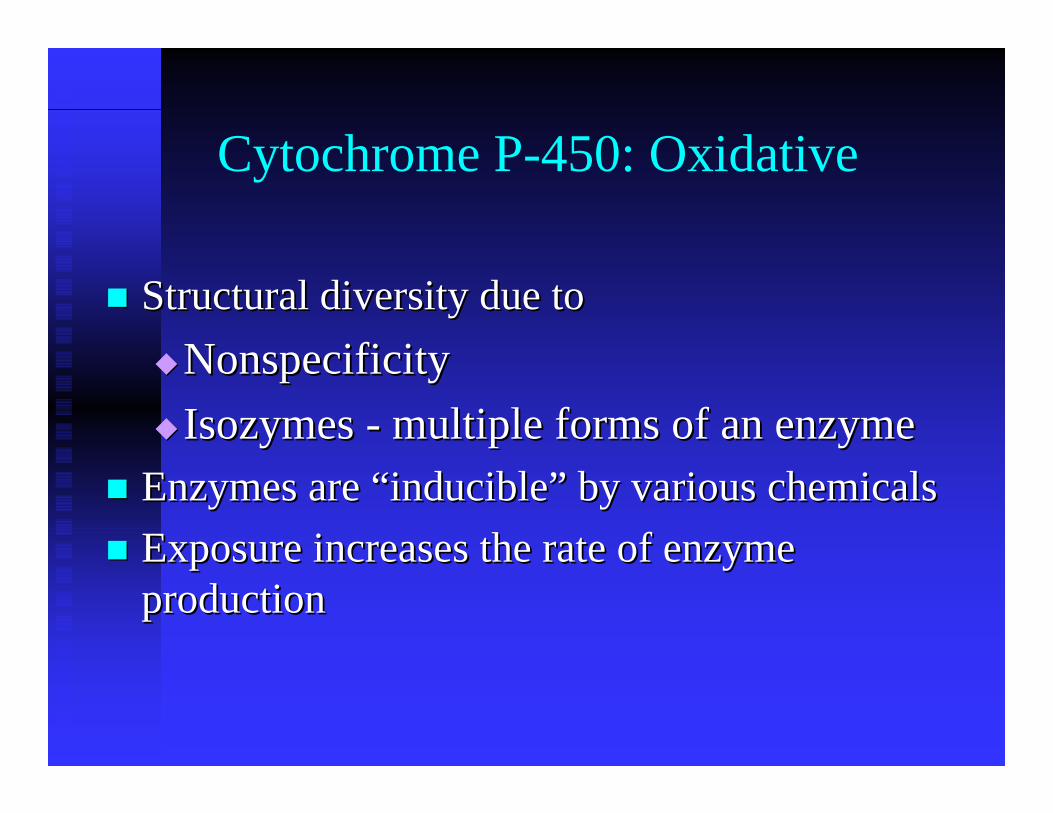
Cytochrome P-450: Oxidative
Structural diversity due toStructural diversity due toNonspecificityNonspecificityIsozymesIsozymes -- multiple forms of an enzymemultiple forms of an enzyme
Enzymes are “inducible” by various chemicalsEnzymes are “inducible” by various chemicalsExposure increases the rate of enzyme Exposure increases the rate of enzyme productionproduction
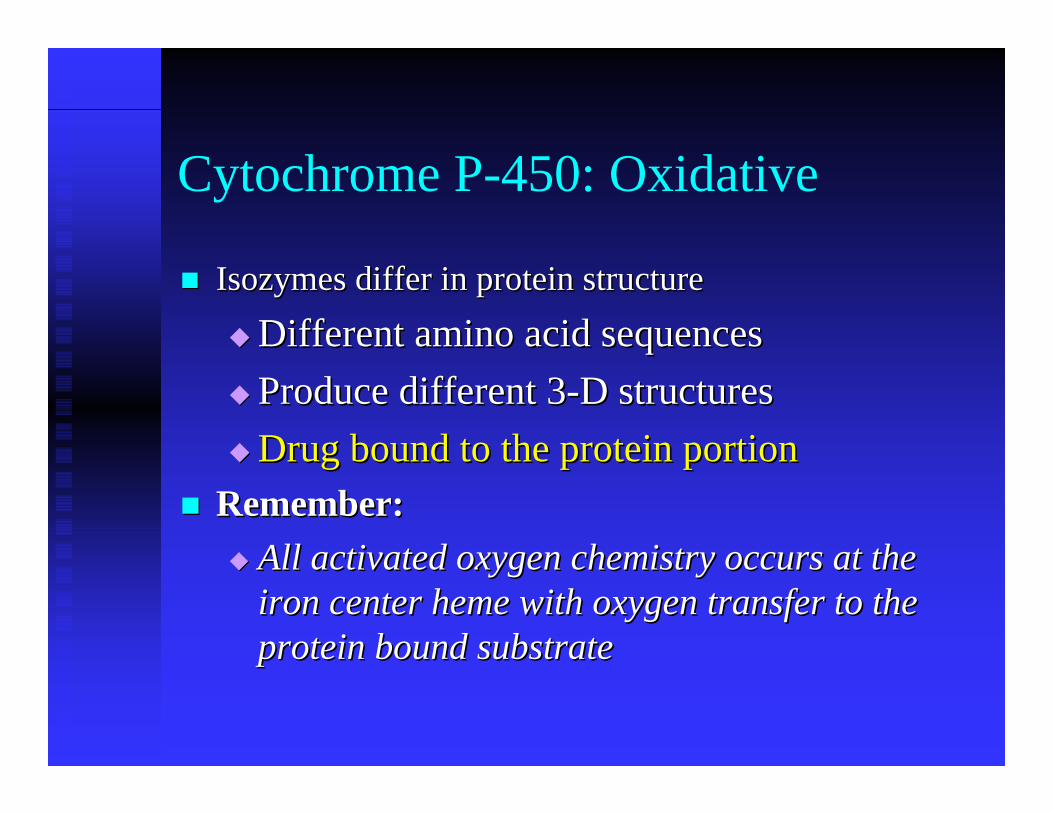
Cytochrome P-450: Oxidative
IsozymesIsozymes differ in protein structurediffer in protein structure
Different amino acid sequencesDifferent amino acid sequencesProduce different 3Produce different 3--D structuresD structuresDrug bound to the protein portionDrug bound to the protein portion
Remember: Remember: All activated oxygen chemistry occurs at the All activated oxygen chemistry occurs at the iron center iron center hemeheme with oxygen transfer to the with oxygen transfer to the protein bound substrateprotein bound substrate
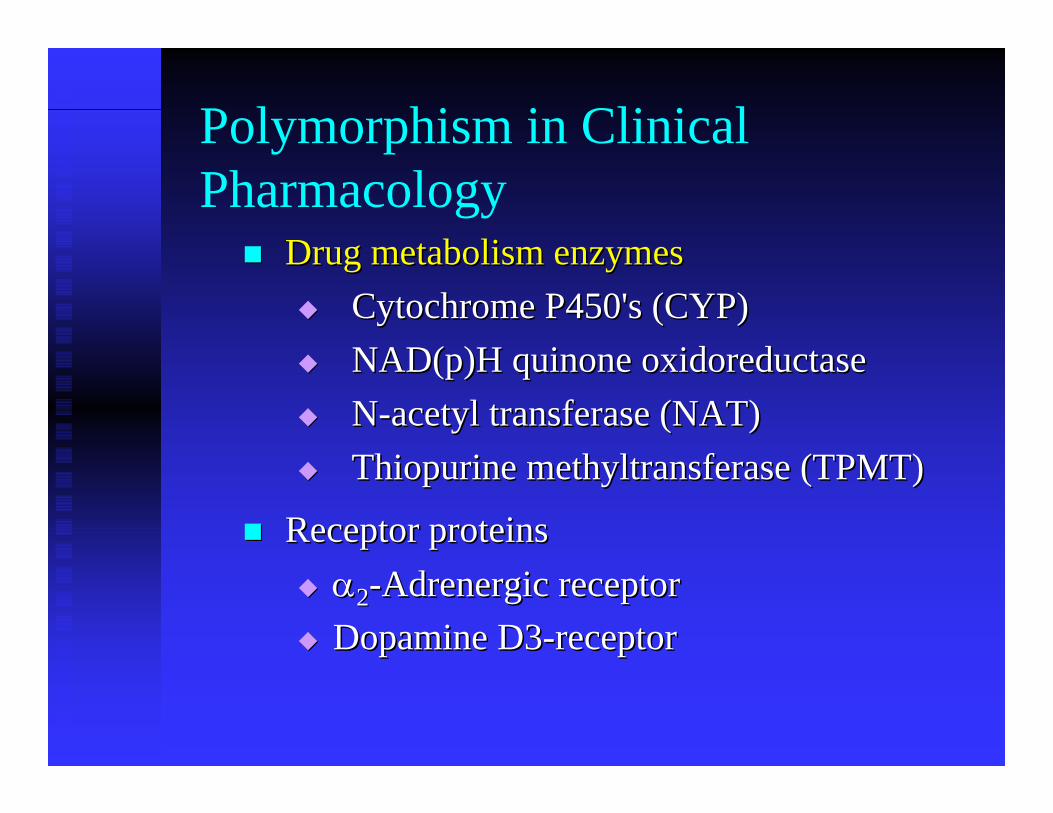
Polymorphism in Clinical Pharmacology
Drug metabolism enzymesDrug metabolism enzymesCytochromeCytochrome P450's (CYP)P450's (CYP)NAD(p)H NAD(p)H quinonequinone oxidoreductase oxidoreductase NN--acetyl transferase (NAT) acetyl transferase (NAT) Thiopurine methyltransferase (TPMT)Thiopurine methyltransferase (TPMT)
Receptor proteinsReceptor proteinsαα22--Adrenergic receptorAdrenergic receptorDopamine D3Dopamine D3--receptorreceptor
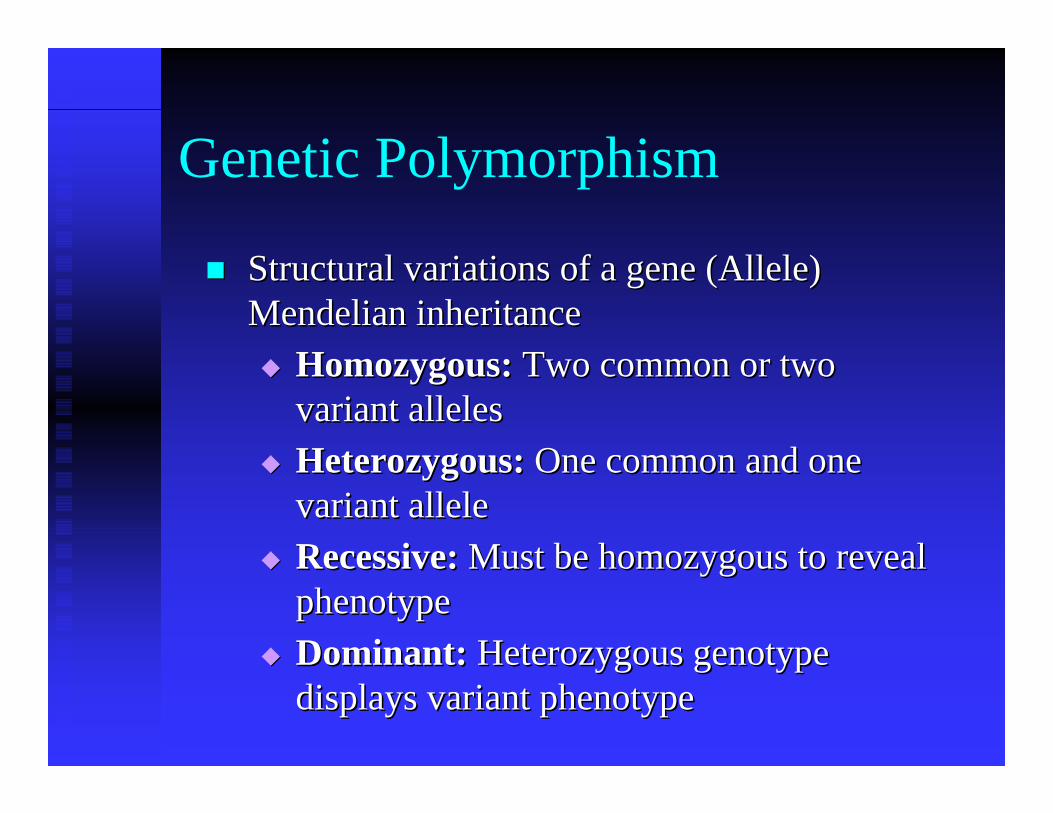
Genetic Polymorphism
Structural variations of a gene (Allele) Structural variations of a gene (Allele) MendelianMendelian inheritance inheritance
Homozygous: Homozygous: Two common or two Two common or two variant allelesvariant allelesHeterozygous: Heterozygous: One common and one One common and one variant allele variant allele Recessive: Recessive: Must be homozygous to reveal Must be homozygous to reveal phenotypephenotypeDominant: Dominant: Heterozygous genotype Heterozygous genotype displays variant phenotypedisplays variant phenotype
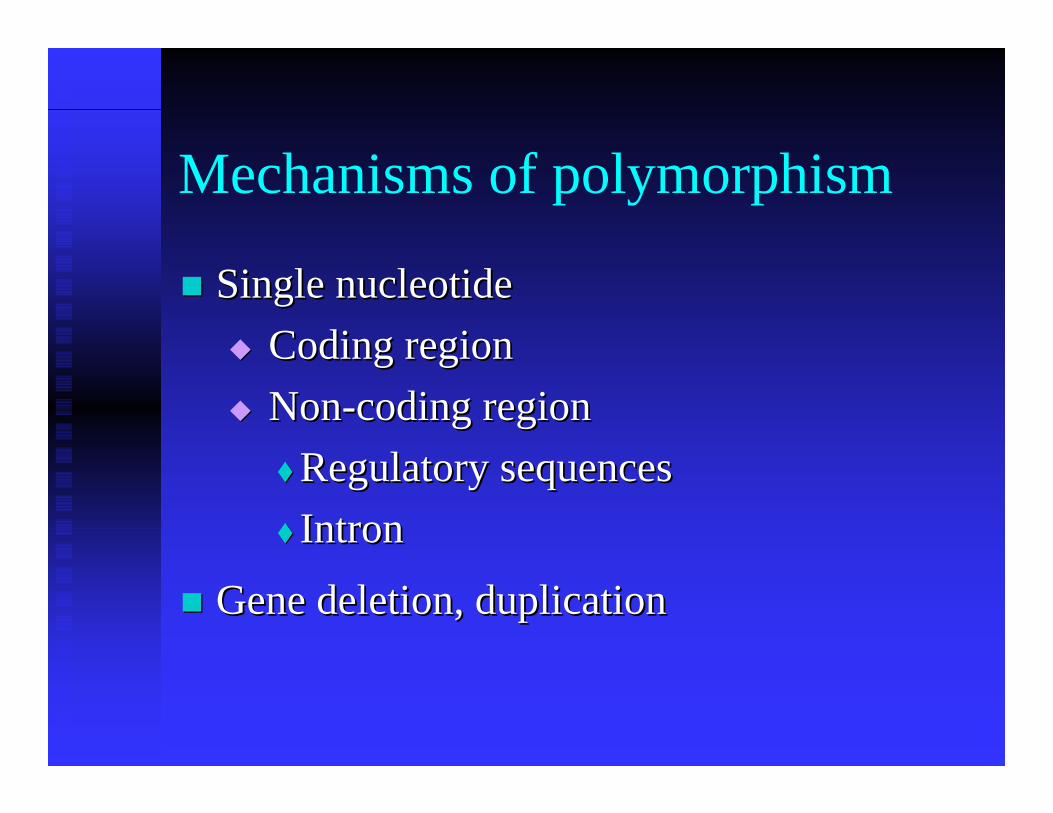
Mechanisms of polymorphism
Single nucleotideSingle nucleotideCoding region Coding region NonNon--coding region coding region
Regulatory sequencesRegulatory sequencesIntron Intron
Gene deletion, duplication Gene deletion, duplication
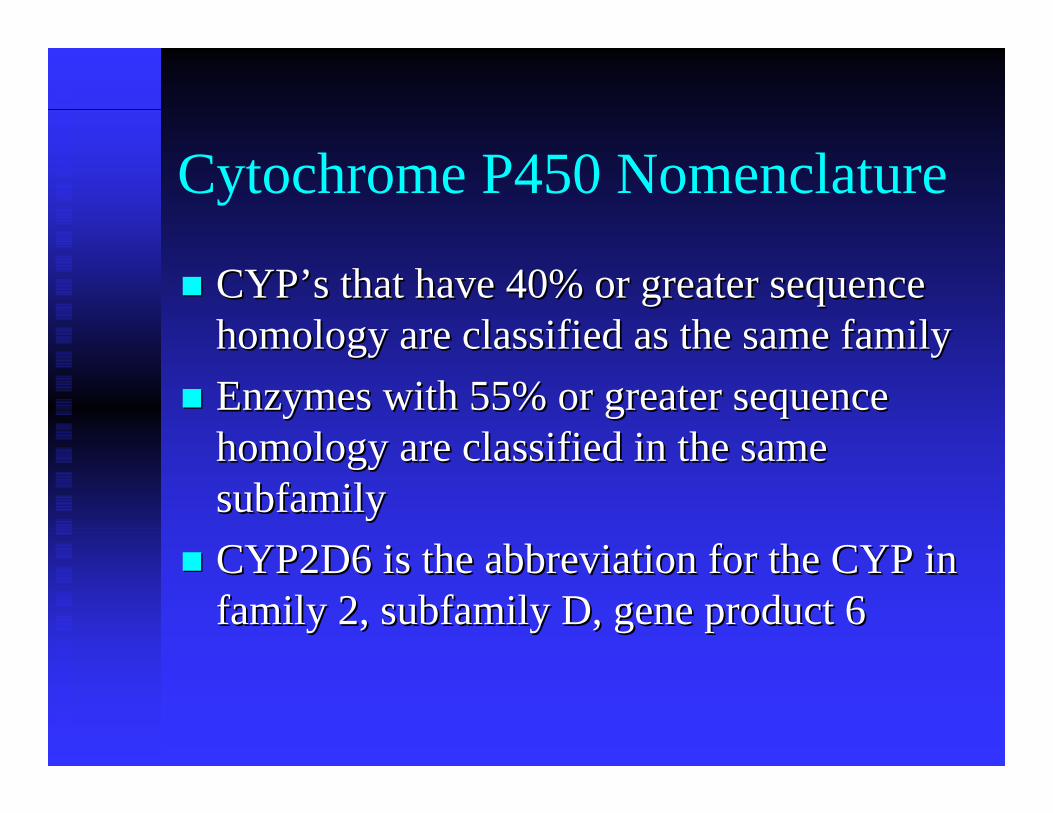
Cytochrome P450 Nomenclature
CYP’sCYP’s that have 40% or greater sequence that have 40% or greater sequence homology are classified as the same familyhomology are classified as the same familyEnzymes with 55% or greater sequence Enzymes with 55% or greater sequence homology are classified in the same homology are classified in the same subfamilysubfamilyCYP2D6 is the abbreviation for the CYP in CYP2D6 is the abbreviation for the CYP in family 2, subfamily D, gene product 6family 2, subfamily D, gene product 6
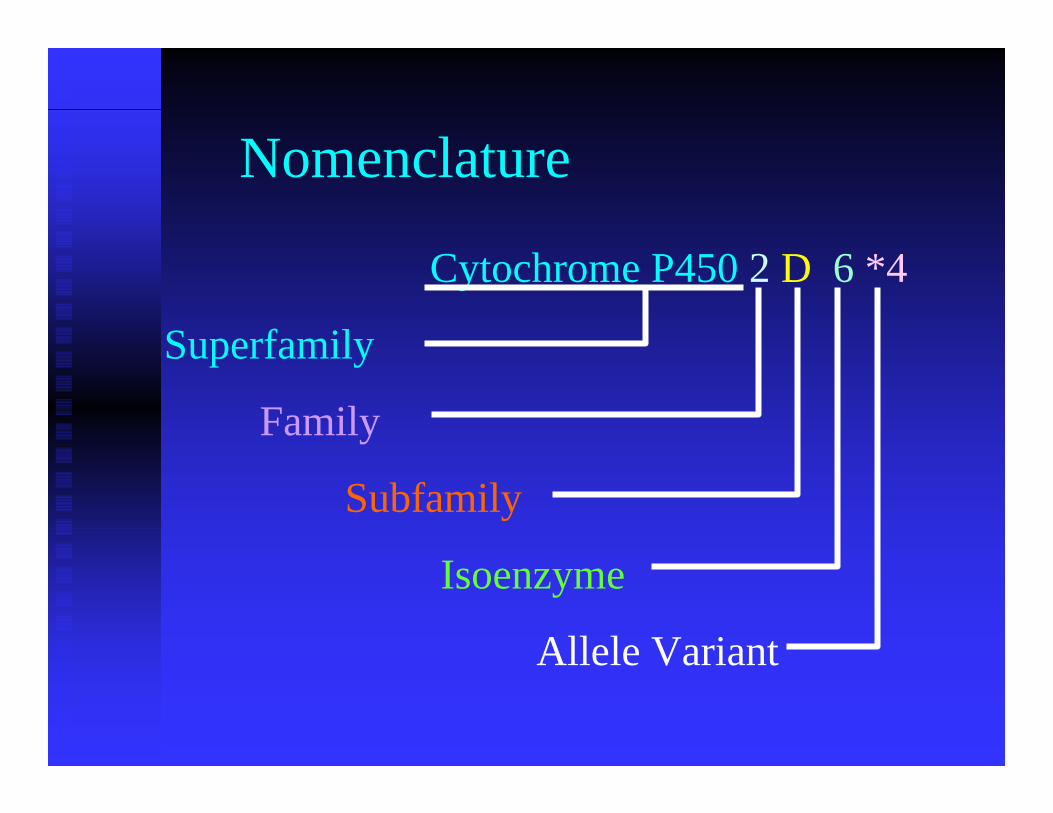
Nomenclature
Cytochrome P450 2 D 6 *4
Superfamily
Family
Subfamily
Isoenzyme
Allele Variant
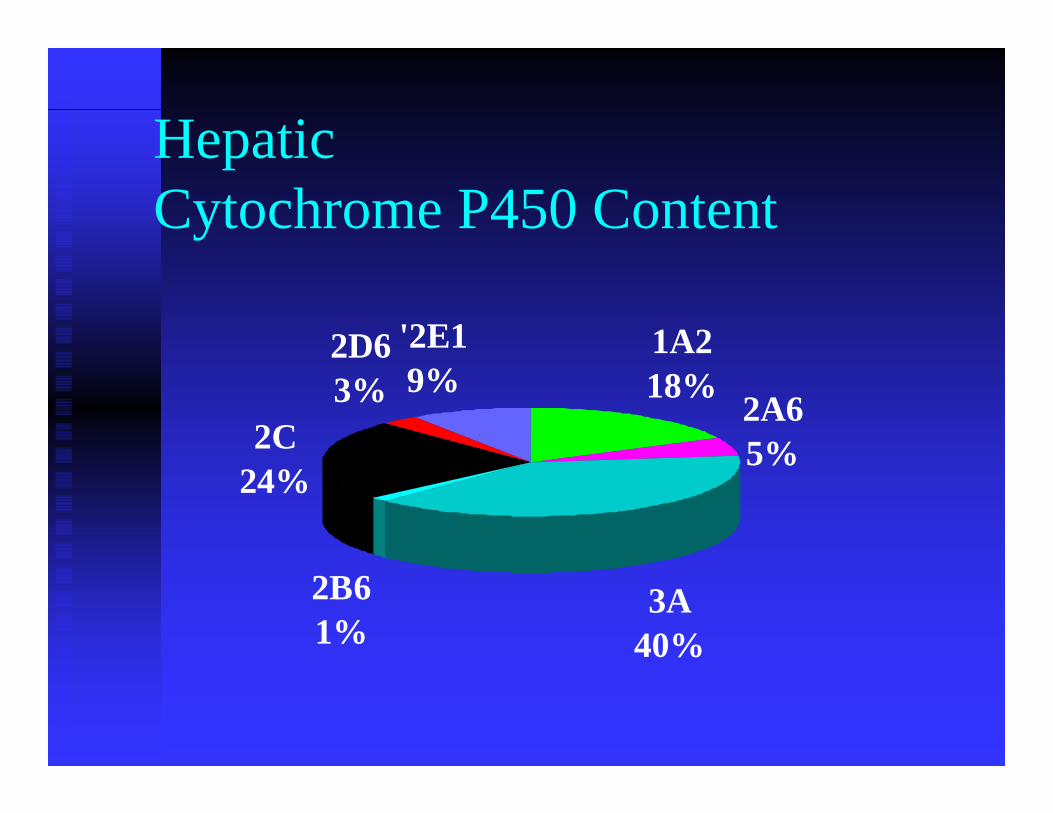
Hepatic Cytochrome P450 Content
1A218%
2A65%
3A40%
2B61%
2C24%
2D63%
'2E19%
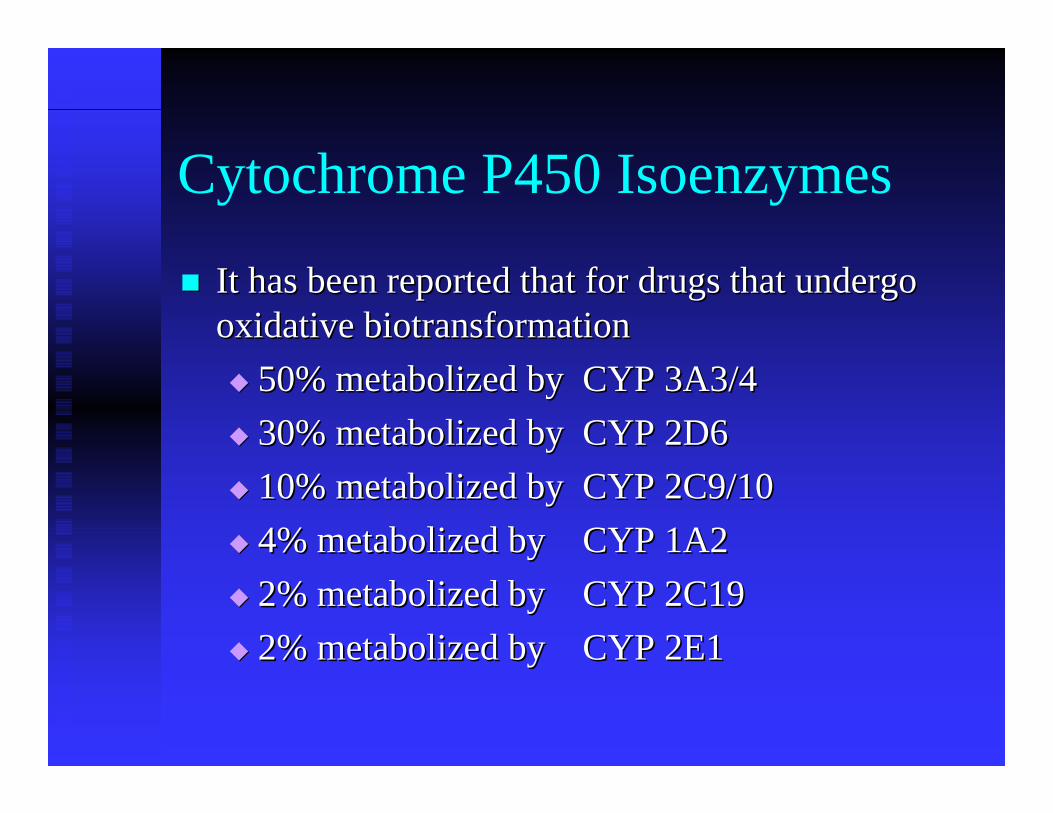
Cytochrome P450 Isoenzymes
It has been reported that for drugs that undergo It has been reported that for drugs that undergo oxidative biotransformationoxidative biotransformation
50% metabolized by CYP 3A3/450% metabolized by CYP 3A3/430% metabolized by CYP 2D630% metabolized by CYP 2D610% metabolized by CYP 2C9/1010% metabolized by CYP 2C9/104% metabolized by CYP 1A24% metabolized by CYP 1A22% metabolized by CYP 2C192% metabolized by CYP 2C192% metabolized by CYP 2E12% metabolized by CYP 2E1
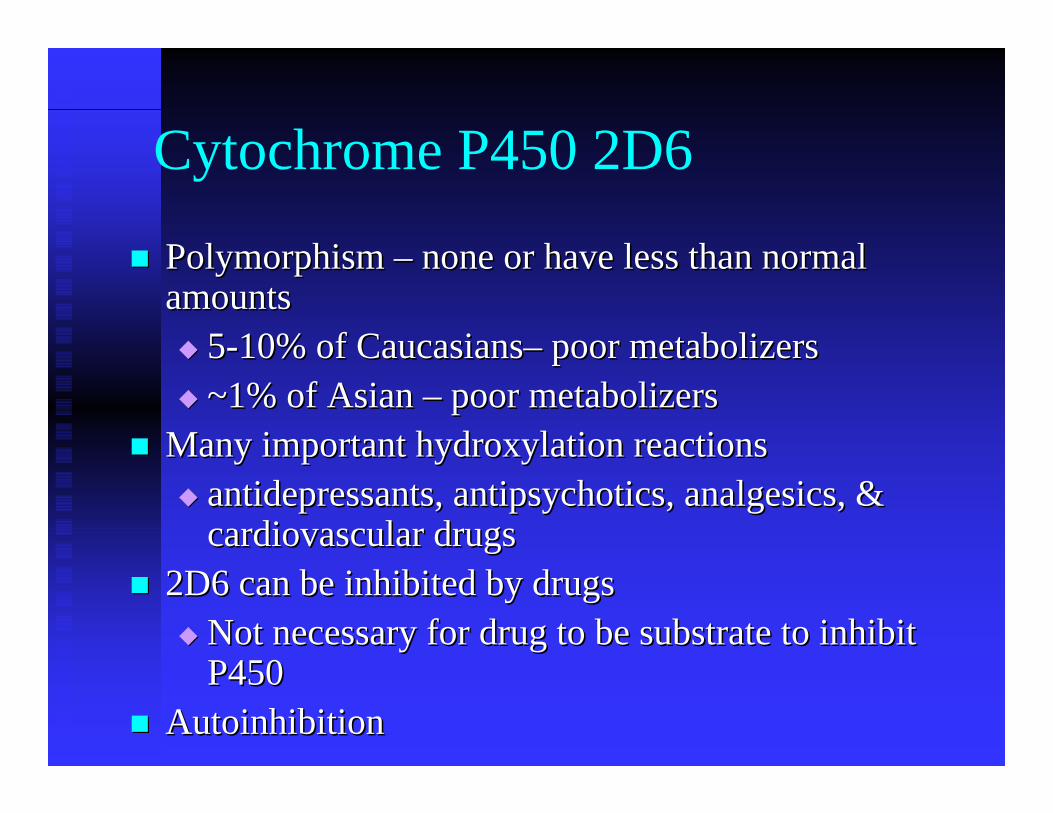
Cytochrome P450 2D6
Polymorphism Polymorphism –– none or have less than normal none or have less than normal amountsamounts
55--10% of Caucasians10% of Caucasians–– poor poor metabolizersmetabolizers~1% of Asian ~1% of Asian –– poor poor metabolizersmetabolizers
Many important hydroxylation reactionsMany important hydroxylation reactionsantidepressants, antidepressants, antipsychoticsantipsychotics, analgesics, & , analgesics, & cardiovascular drugs cardiovascular drugs
2D6 can be inhibited by drugs2D6 can be inhibited by drugsNot necessary for drug to be substrate to inhibit Not necessary for drug to be substrate to inhibit P450 P450
AutoinhibitionAutoinhibition
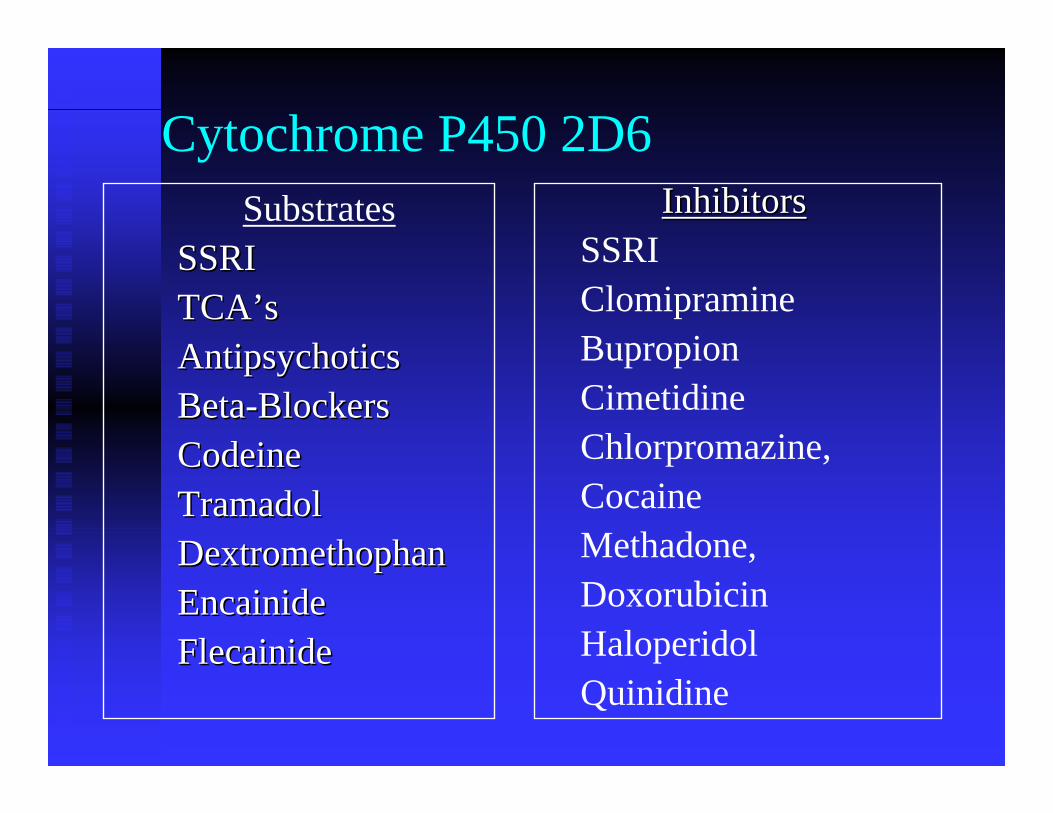
Cytochrome P450 2D6Substrates
SSRI SSRI TCA’sTCA’sAntipsychotics Antipsychotics BetaBeta--Blockers Blockers CodeineCodeineTramadolTramadolDextromethophanDextromethophanEncainideEncainideFlecainideFlecainide
InhibitorsInhibitorsSSRI ClomipramineBupropionCimetidineChlorpromazine, CocaineMethadone, DoxorubicinHaloperidolQuinidine
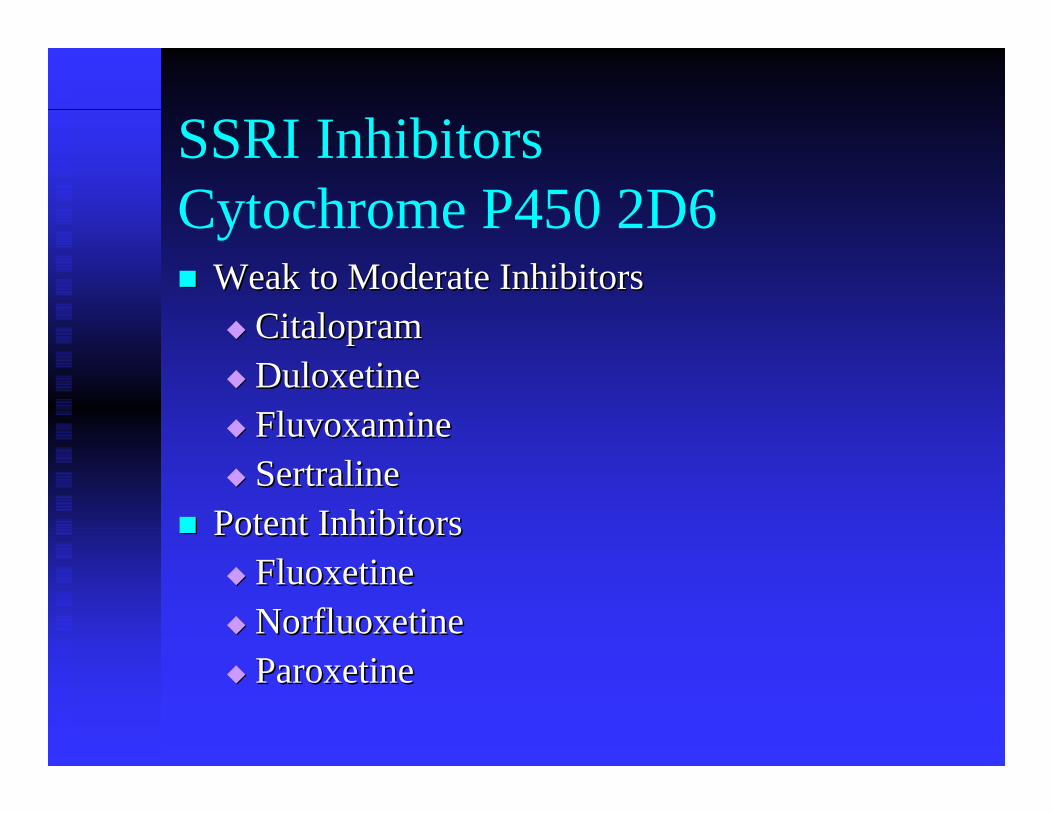
SSRI InhibitorsCytochrome P450 2D6
Weak to Moderate InhibitorsWeak to Moderate InhibitorsCitalopramCitalopramDuloxetineDuloxetineFluvoxamineFluvoxamineSertralineSertraline
Potent InhibitorsPotent InhibitorsFluoxetine Fluoxetine NorfluoxetineNorfluoxetineParoxetine Paroxetine
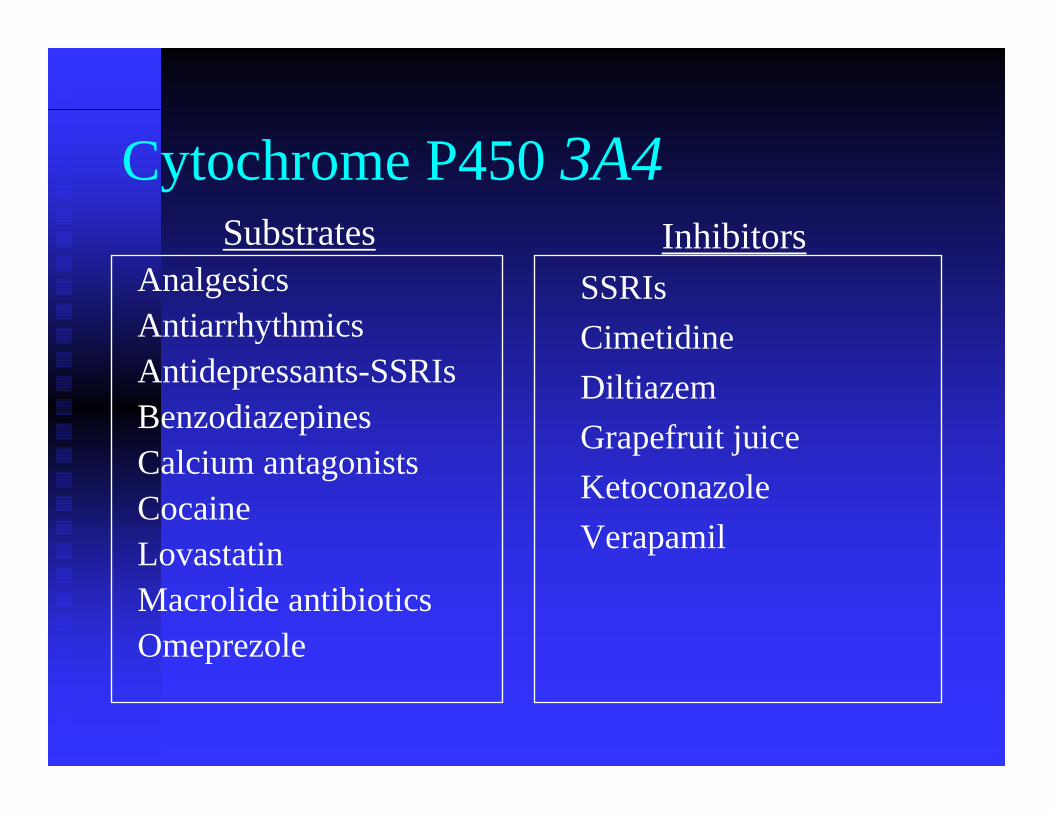
Cytochrome P450 3A4Substrates
AnalgesicsAntiarrhythmicsAntidepressants-SSRIsBenzodiazepinesCalcium antagonistsCocaineLovastatinMacrolide antibioticsOmeprezole
InhibitorsSSRIsCimetidineDiltiazemGrapefruit juiceKetoconazole Verapamil

Inducers of Cytochrome P450 3A4
BarbituratesBarbituratesCarbamazepineCarbamazepineGlucocorticoidsGlucocorticoidsPhenytoinPhenytoinRifampinRifampinSt. John’s St. John’s wortwort
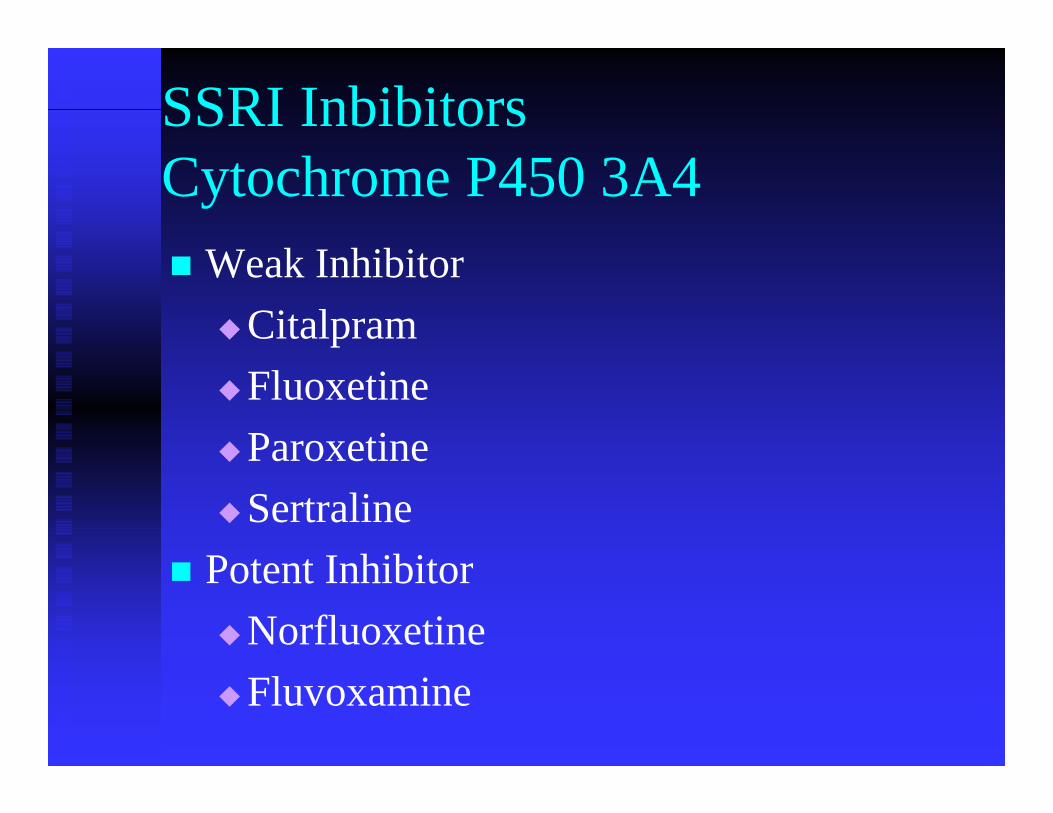
SSRI InbibitorsCytochrome P450 3A4
Weak Inhibitor CitalpramFluoxetineParoxetineSertraline
Potent InhibitorNorfluoxetineFluvoxamine
00
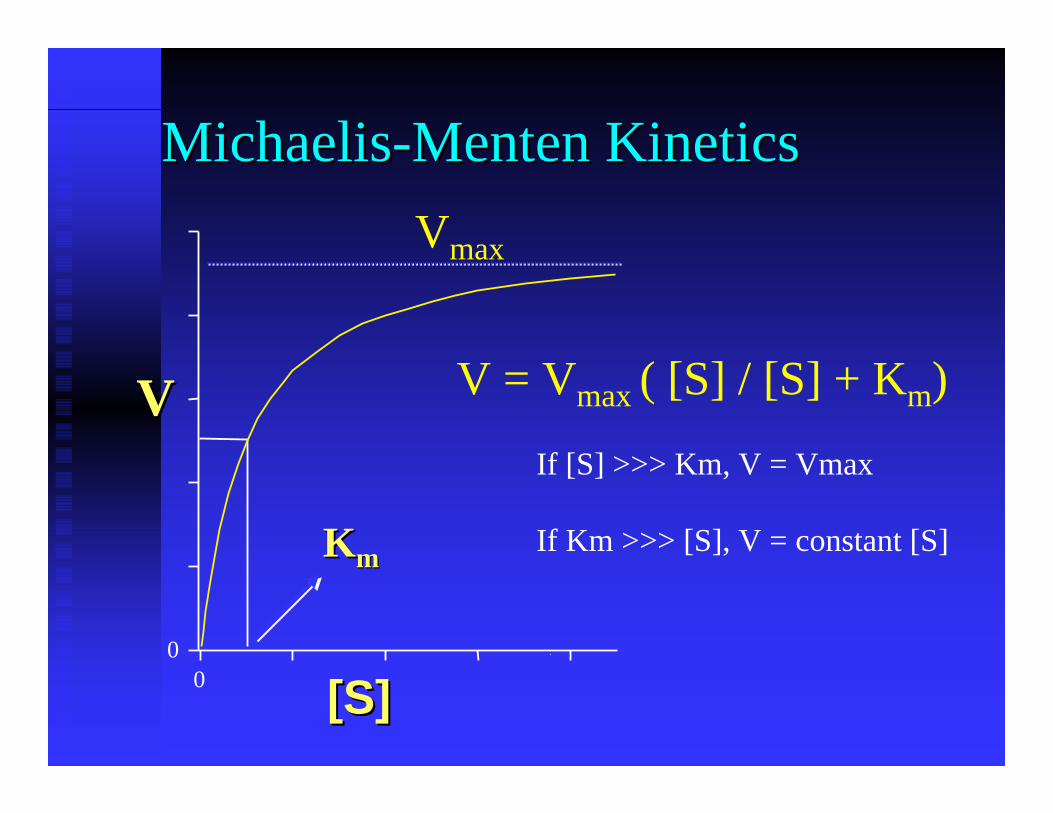
MichaelisMichaelis--Menten Menten KineticsKinetics
VV
[S][S]
KKmm
Vmax
V = Vmax ( [S] / [S] + Km)
If [S] >>> Km, V = Vmax
If Km >>> [S], V = constant [S]

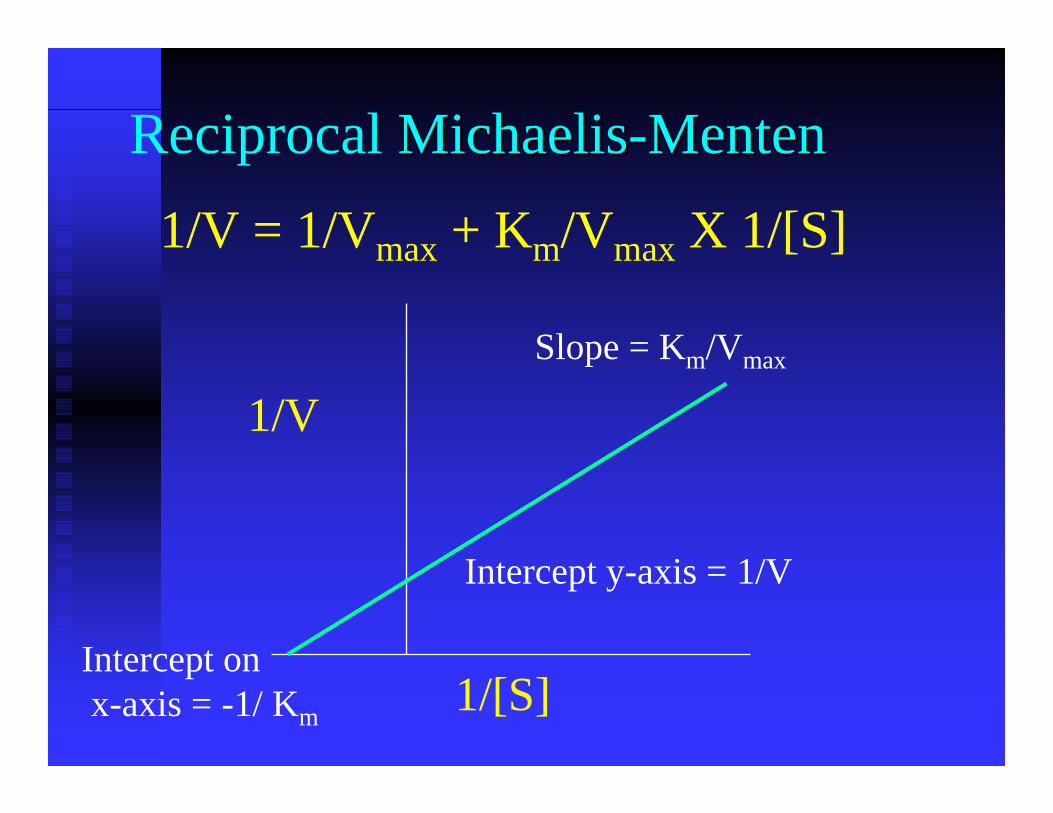
Reciprocal MichaelisMichaelis--MentenMenten
1/V
1/[S]
Intercept y-axis = 1/V
Slope = Km/Vmax
Intercept onx-axis = -1/ Km
1/V = 1/Vmax + Km/Vmax X 1/[S]
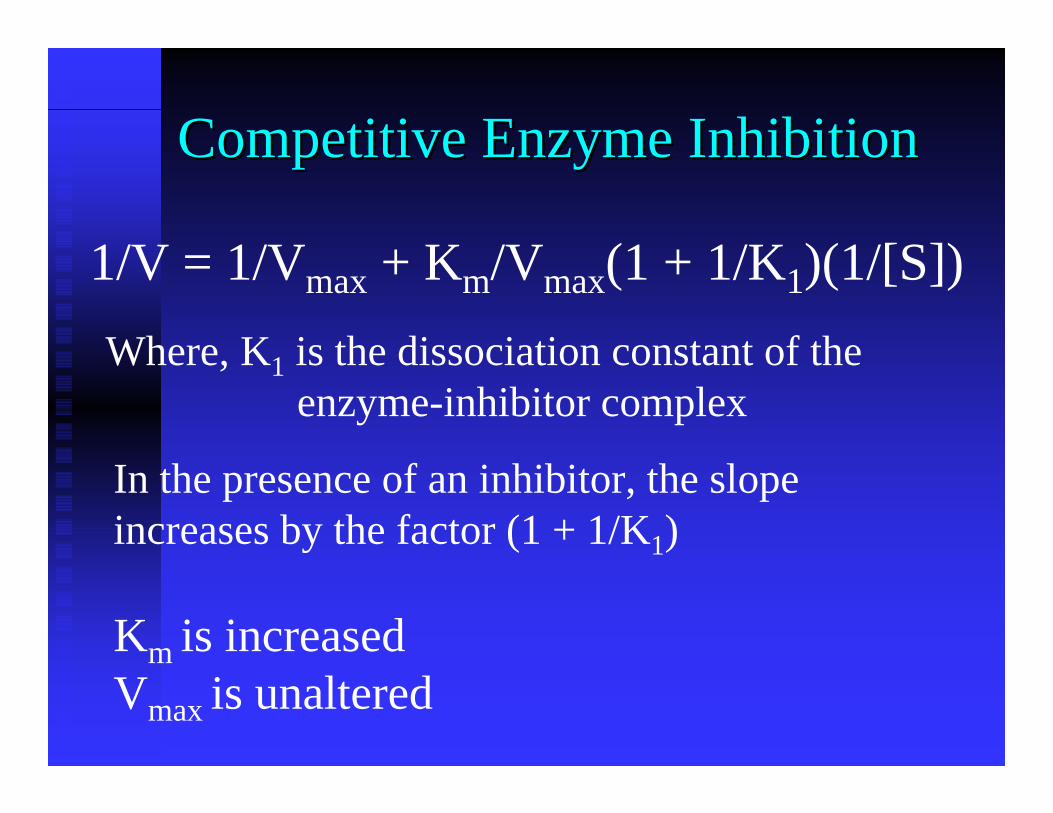
1/V = 1/Vmax + Km/Vmax(1 + 1/K1)(1/[S])
Competitive Enzyme InhibitionCompetitive Enzyme Inhibition
Where, K1 is the dissociation constant of the enzyme-inhibitor complex
In the presence of an inhibitor, the slope increases by the factor (1 + 1/K1)
Km is increasedVmax is unaltered
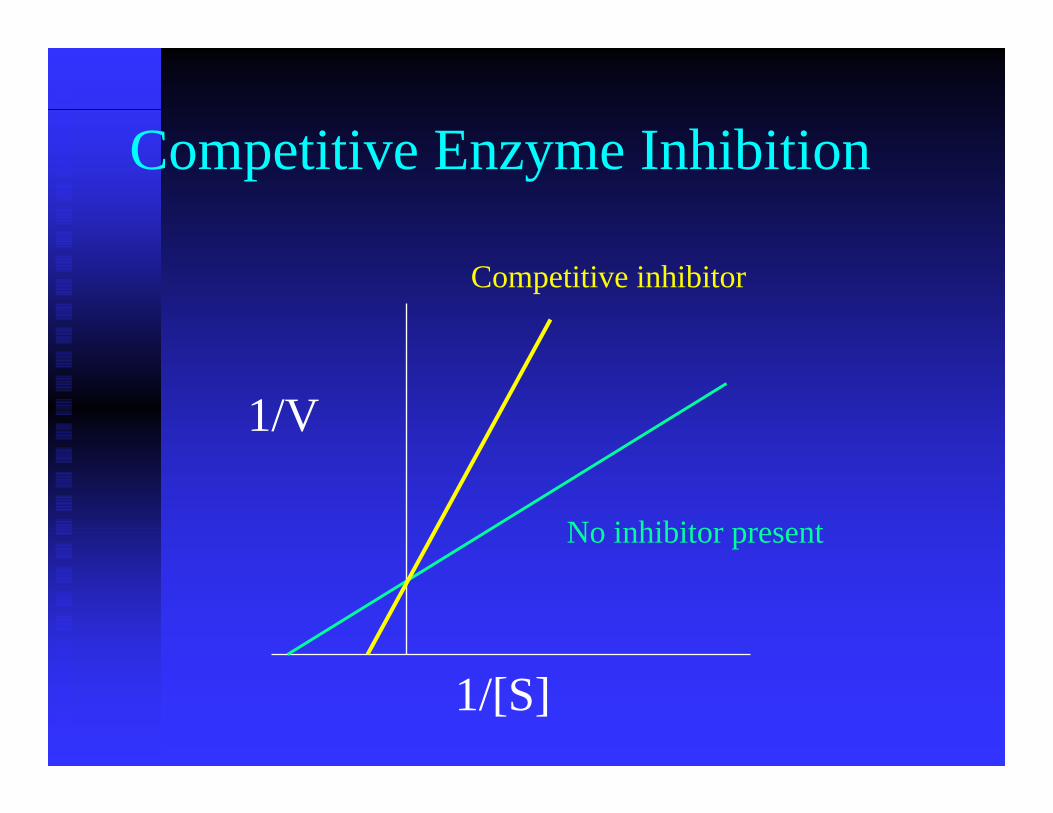
Competitive Enzyme Inhibition
1/V
1/[S]
Competitive inhibitor
No inhibitor present
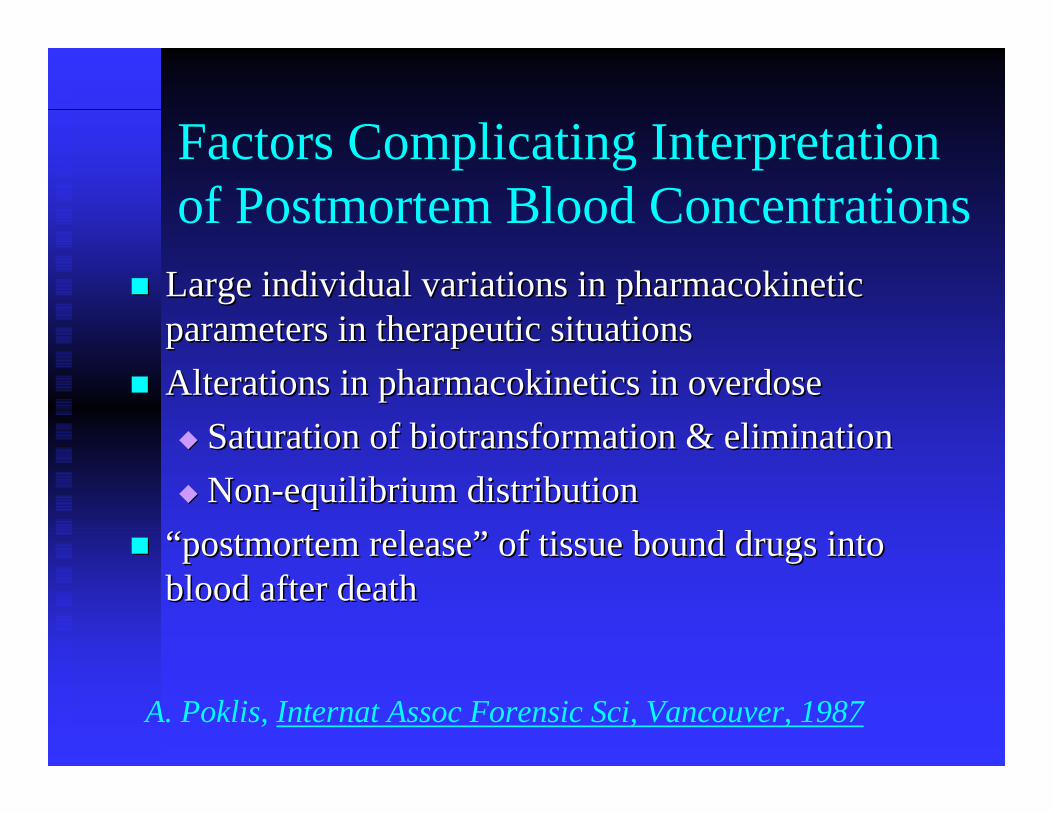
Factors Complicating Interpretation of Postmortem Blood Concentrations
Large individual variations in pharmacokinetic Large individual variations in pharmacokinetic parameters in therapeutic situationsparameters in therapeutic situationsAlterations in pharmacokinetics in overdoseAlterations in pharmacokinetics in overdose
Saturation of biotransformation & eliminationSaturation of biotransformation & eliminationNonNon--equilibrium distribution equilibrium distribution
“postmortem release” of tissue bound drugs into “postmortem release” of tissue bound drugs into blood after deathblood after death
A. Poklis, Internat Assoc Forensic Sci, Vancouver, 1987
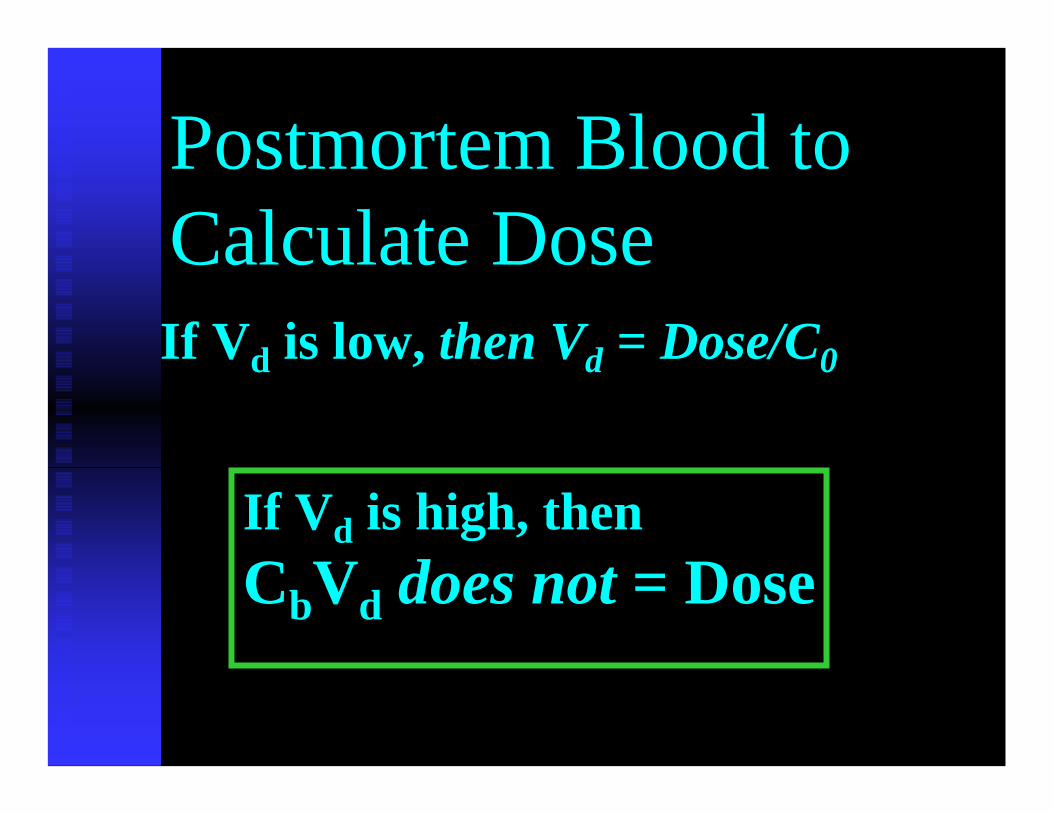
Postmortem Blood to Calculate Dose
If Vd is high, then CbVd does not = Dose
If Vd is low, then Vd = Dose/C0
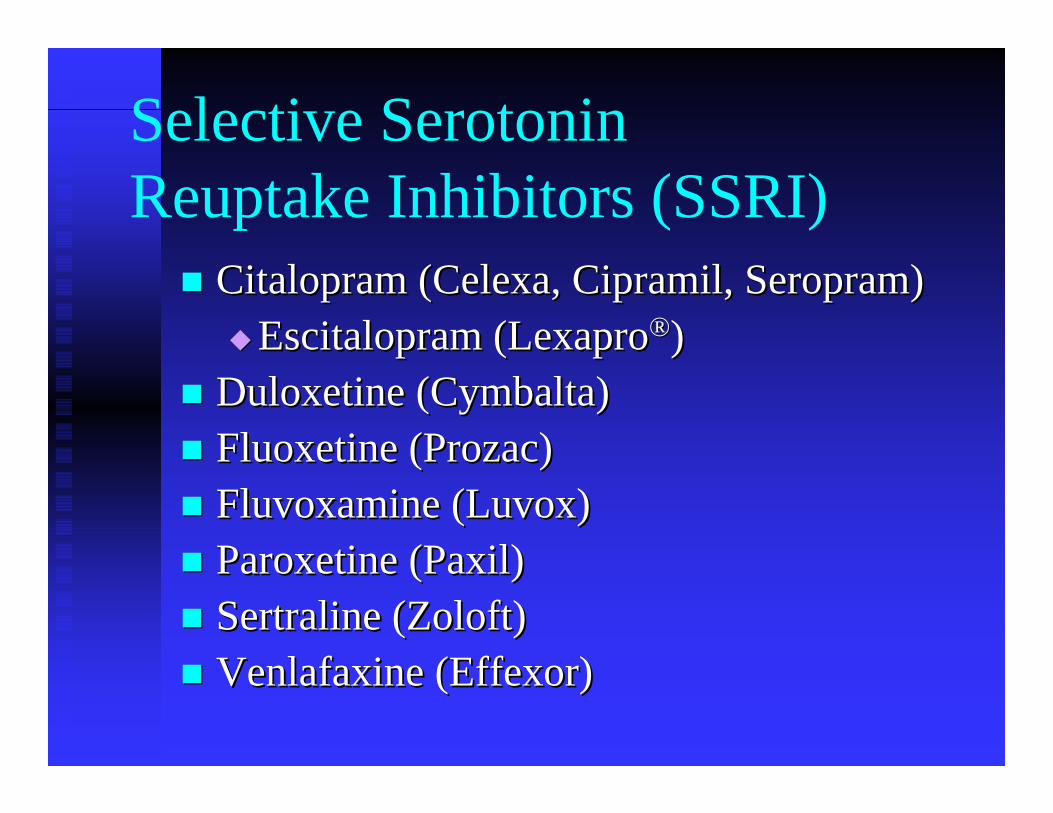
Selective Serotonin Reuptake Inhibitors (SSRI)
CitalopramCitalopram ((CelexaCelexa, , CipramilCipramil, , SeropramSeropram))EscitalopramEscitalopram ((LexaproLexapro®®))
DuloxetineDuloxetine ((CymbaltaCymbalta))Fluoxetine (Prozac)Fluoxetine (Prozac)FluvoxamineFluvoxamine ((LuvoxLuvox))Paroxetine Paroxetine ((PaxilPaxil))Sertraline Sertraline (Zoloft)(Zoloft)Venlafaxine Venlafaxine ((EffexorEffexor))
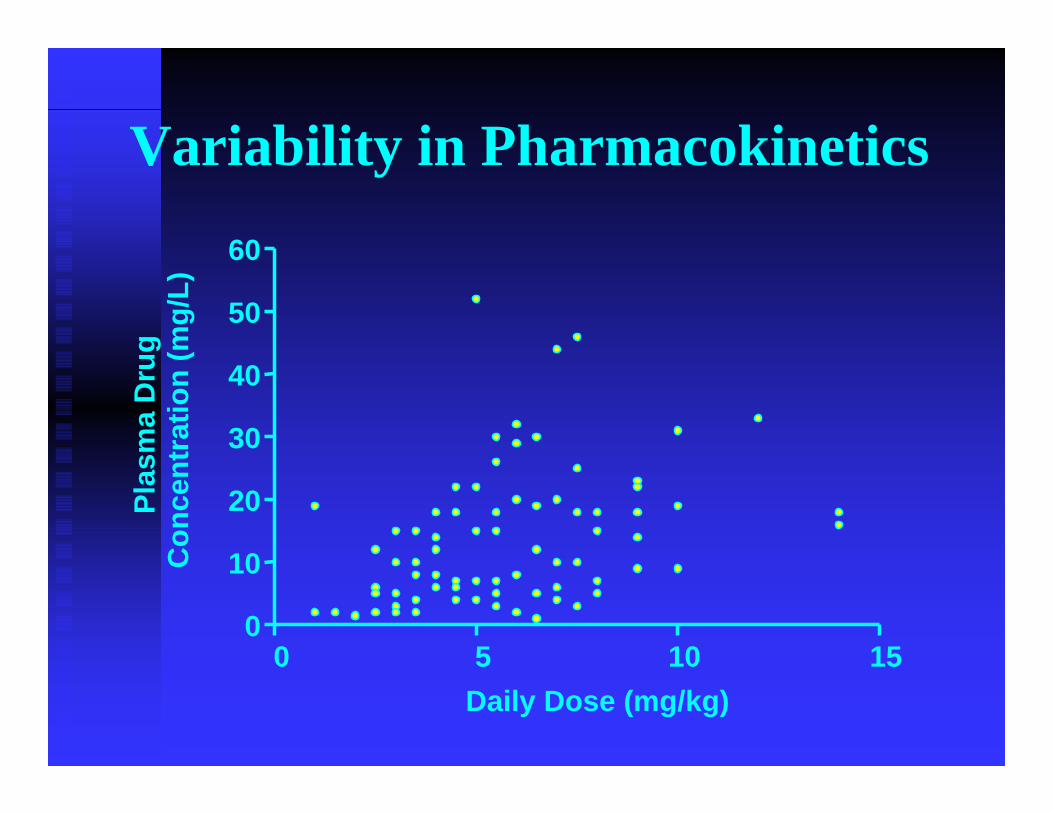
Daily Dose (mg/kg)
Plas
ma
Dru
gC
once
ntra
tion
(mg/
L)
0 5 10 150
10
20
30
40
50
60
Variability in Pharmacokinetics
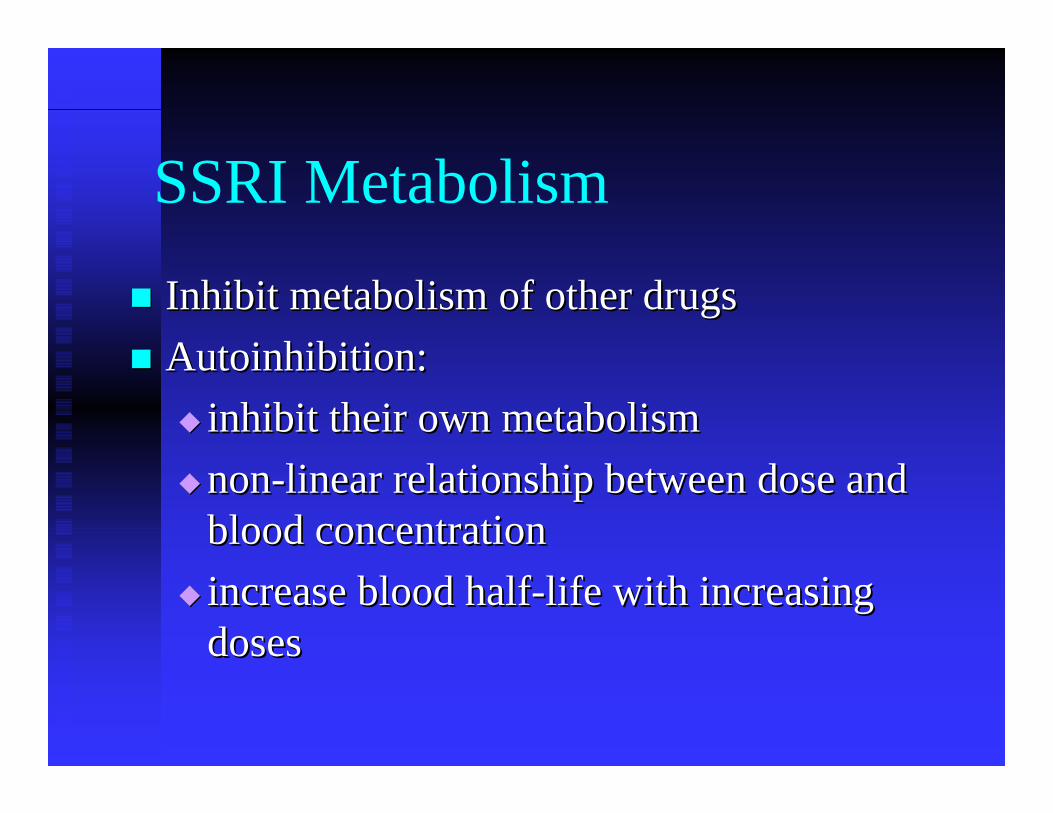
SSRI Metabolism
Inhibit metabolism of other drugsInhibit metabolism of other drugsAutoinhibitionAutoinhibition: :
inhibit their own metabolisminhibit their own metabolismnonnon--linear relationship between dose and linear relationship between dose and blood concentrationblood concentrationincrease blood halfincrease blood half--life with increasing life with increasing doses doses
SSRI’s That Exhibit Autoinhibition
Fluoxetine & Fluoxetine & norfluoxetinenorfluoxetineFluvoxamine Fluvoxamine Paroxetine Paroxetine
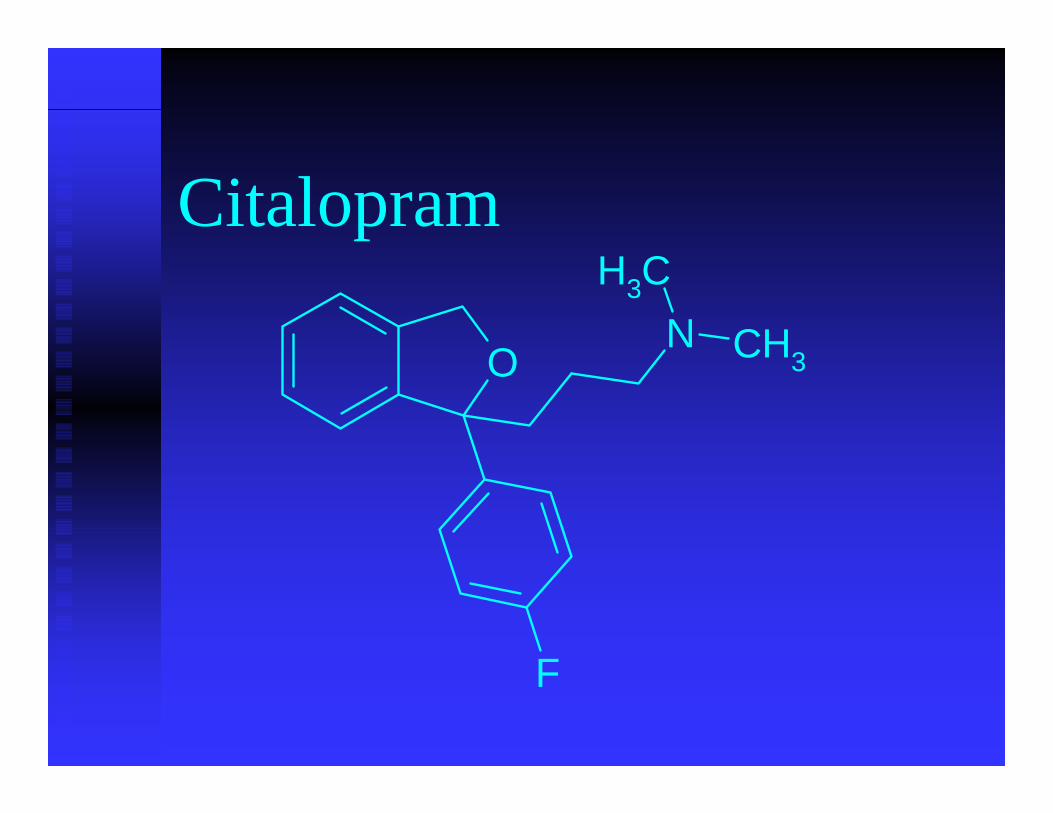
Citalopram
O
F
N CH3
CH3
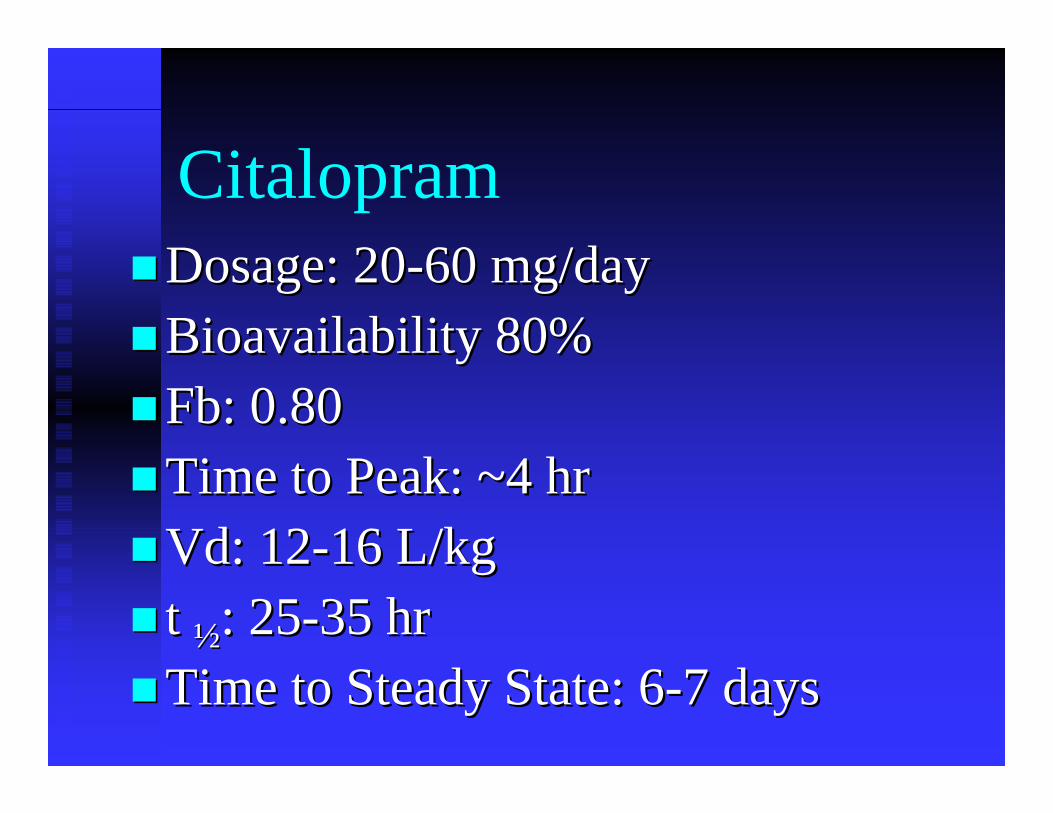
CitalopramDosage: 20Dosage: 20--60 mg/day60 mg/dayBioavailability 80%Bioavailability 80%FbFb: 0.80: 0.80Time to Peak: ~4 hrTime to Peak: ~4 hrVdVd: 12: 12--16 L/kg16 L/kgt t ½½: 25: 25--35 hr35 hrTime to Steady State: 6Time to Steady State: 6--7 days7 days
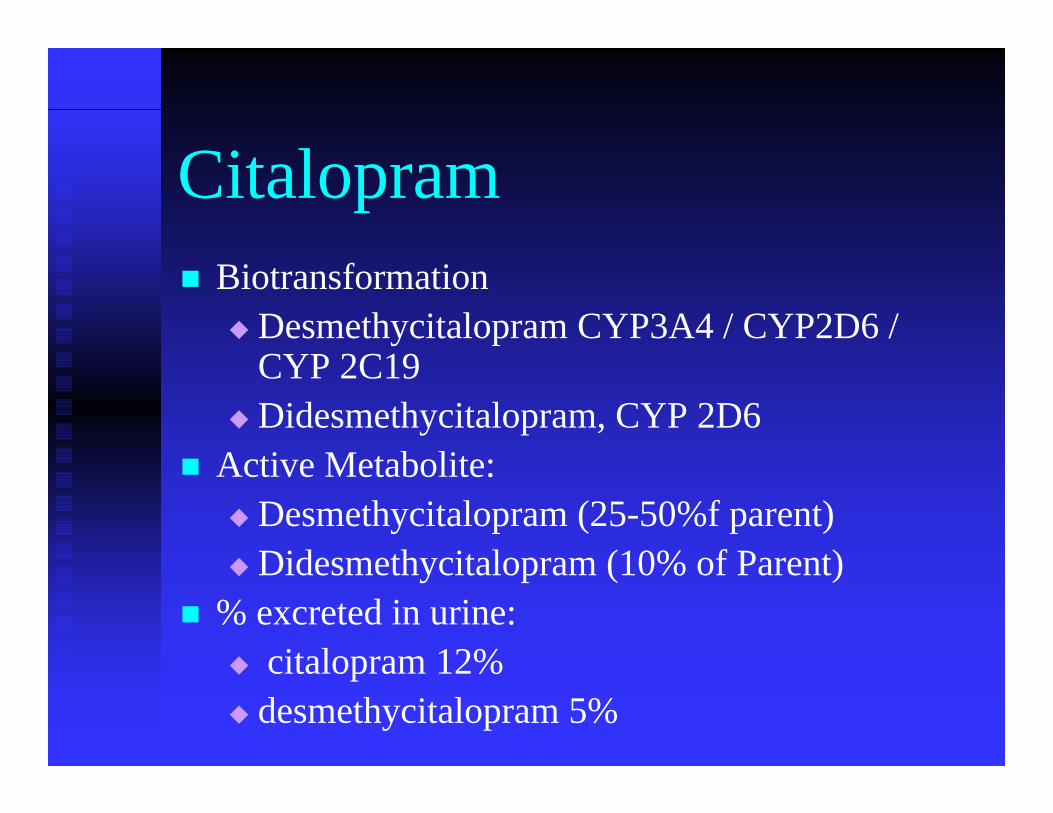
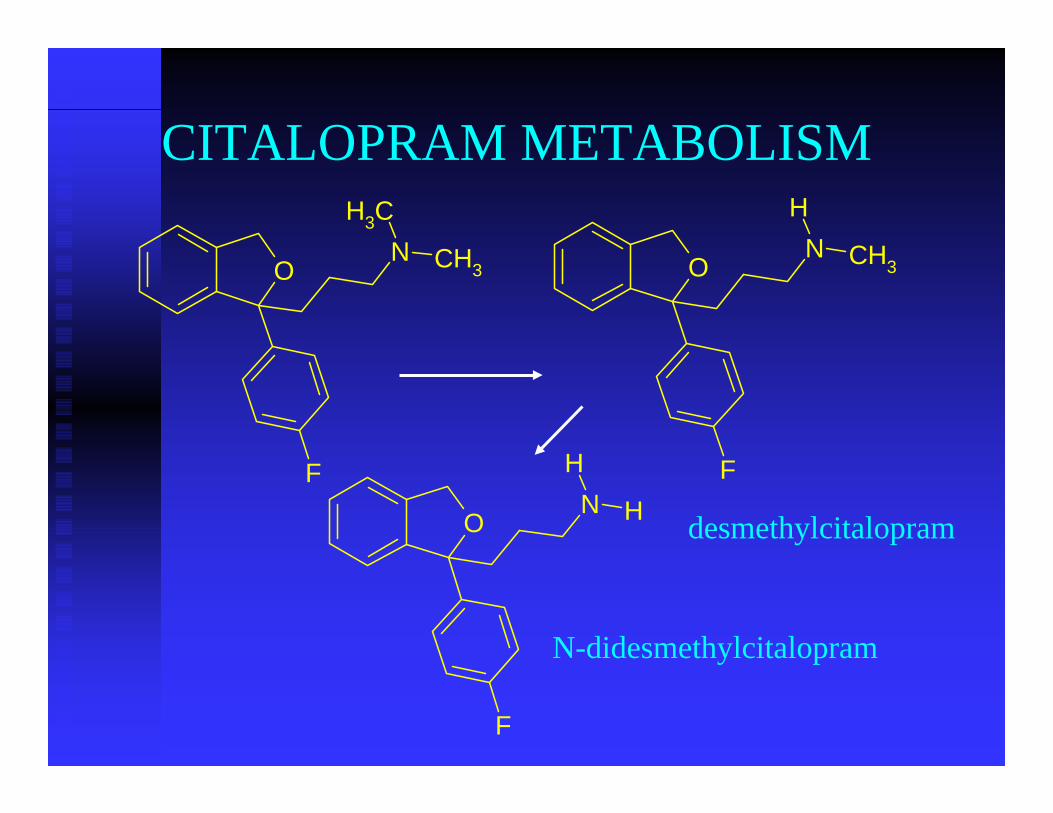
Citalopram Biotransformation
Desmethycitalopram CYP3A4 / CYP2D6 / CYP 2C19 Didesmethycitalopram, CYP 2D6
Active Metabolite:Desmethycitalopram (25-50%f parent)Didesmethycitalopram (10% of Parent)
% excreted in urine: citalopram 12%
desmethycitalopram 5%
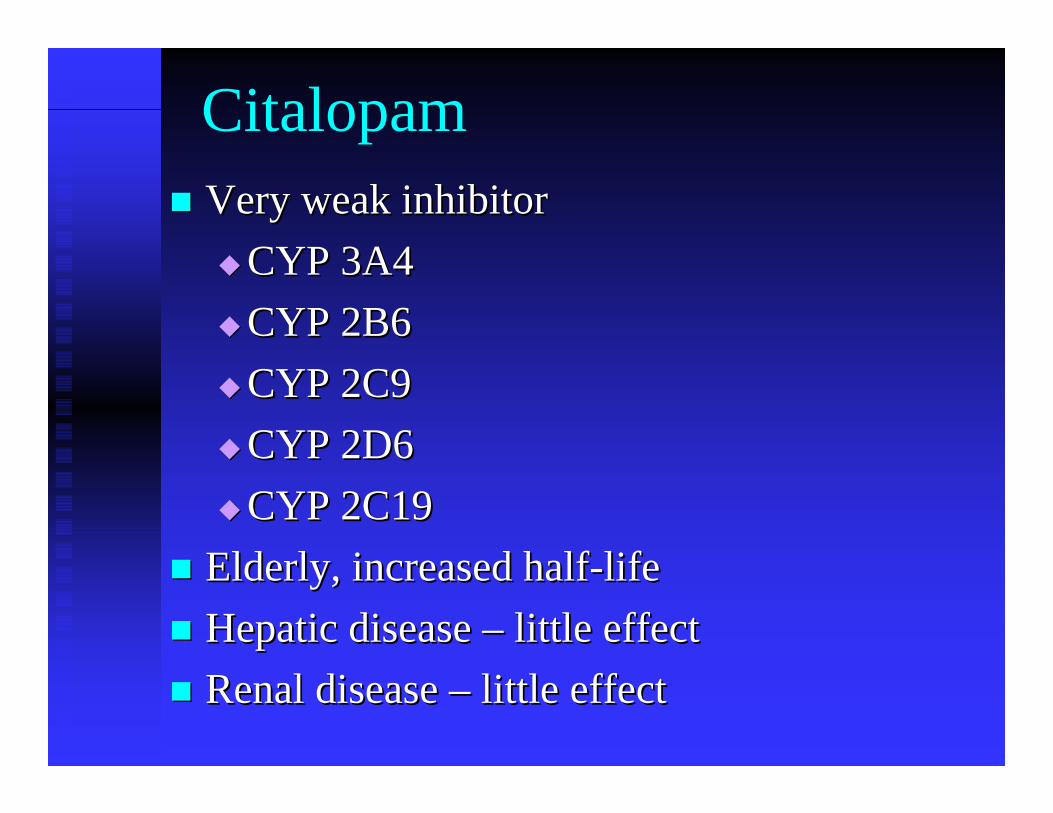
CitalopamVery weak inhibitorVery weak inhibitor
CYP 3A4CYP 3A4CYP 2B6CYP 2B6CYP 2C9CYP 2C9CYP 2D6CYP 2D6CYP 2C19 CYP 2C19
Elderly, increased halfElderly, increased half--lifelifeHepatic disease Hepatic disease –– little effectlittle effectRenal disease Renal disease –– little effectlittle effect
O
F
N CH3
CH3
O
F
N CH3
H
O
F
N H
H
desmethylcitalopram
N-didesmethylcitalopram
CITALOPRAM METABOLISM
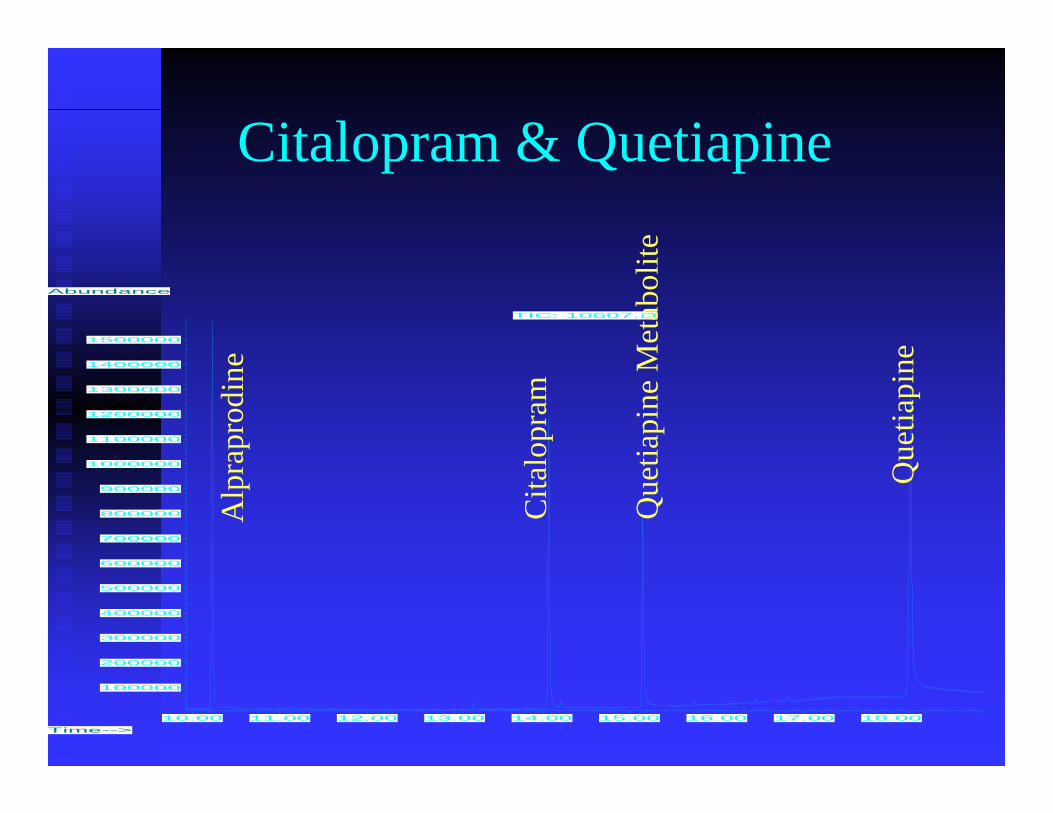
Citalopram & Quetiapine
10.00 11.00 12.00 13.00 14.00 15.00 16.00 17.00 18.00
100000
200000
300000
400000
500000
600000
700000
800000
900000
1000000
1100000
1200000
1300000
1400000
1500000
Time-->
Abundance
TIC: 10607.D
Alp
rapr
odin
e
Cita
lopr
am
Que
tiapi
ne M
etab
olite
Que
tiapi
ne
9.50 10.00 10.50 11.00 11.50 12.00 12.50 13.00 13.50 14.00
50000
100000
150000
200000
250000
300000
350000
400000
450000
500000
Time-->
Abundance
TIC: 6061.D
Istd
Caf
fein
e
Cita
lopr
amD
iaze
pam
Nor
fluox
etin
e
Nor
tript
ylin
e
Tram
adol
O-D
esm
ethl
yram
adol
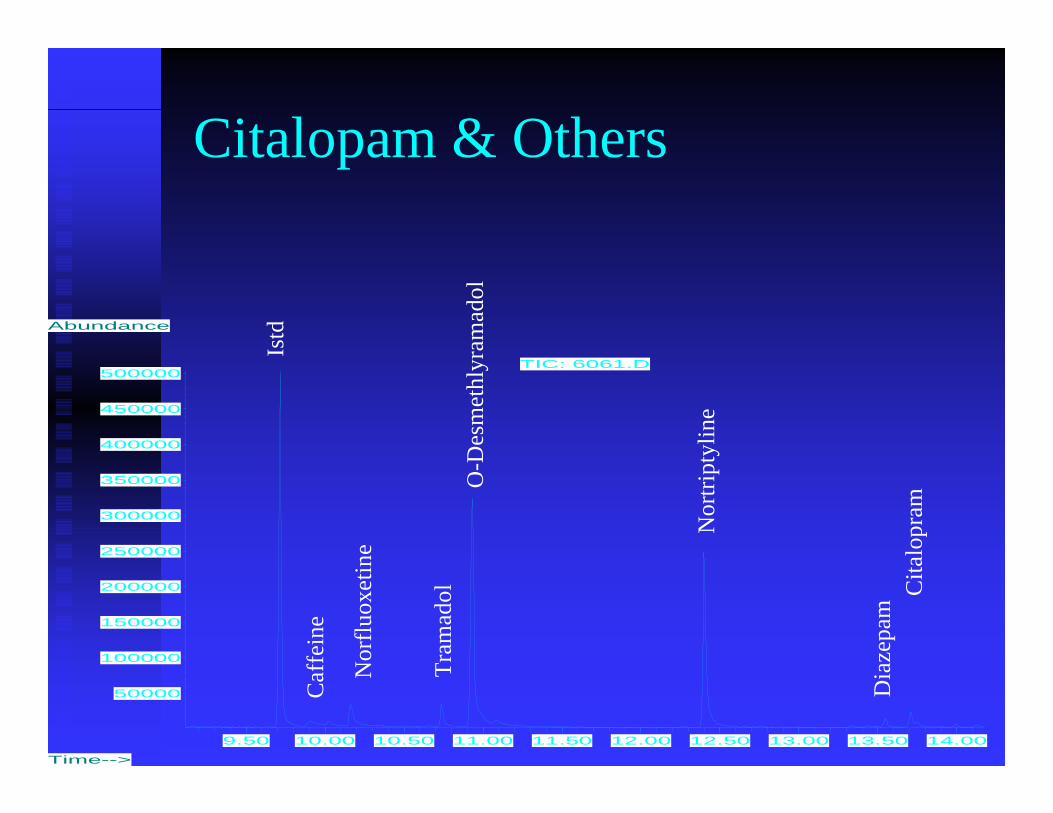
Citalopam & Others
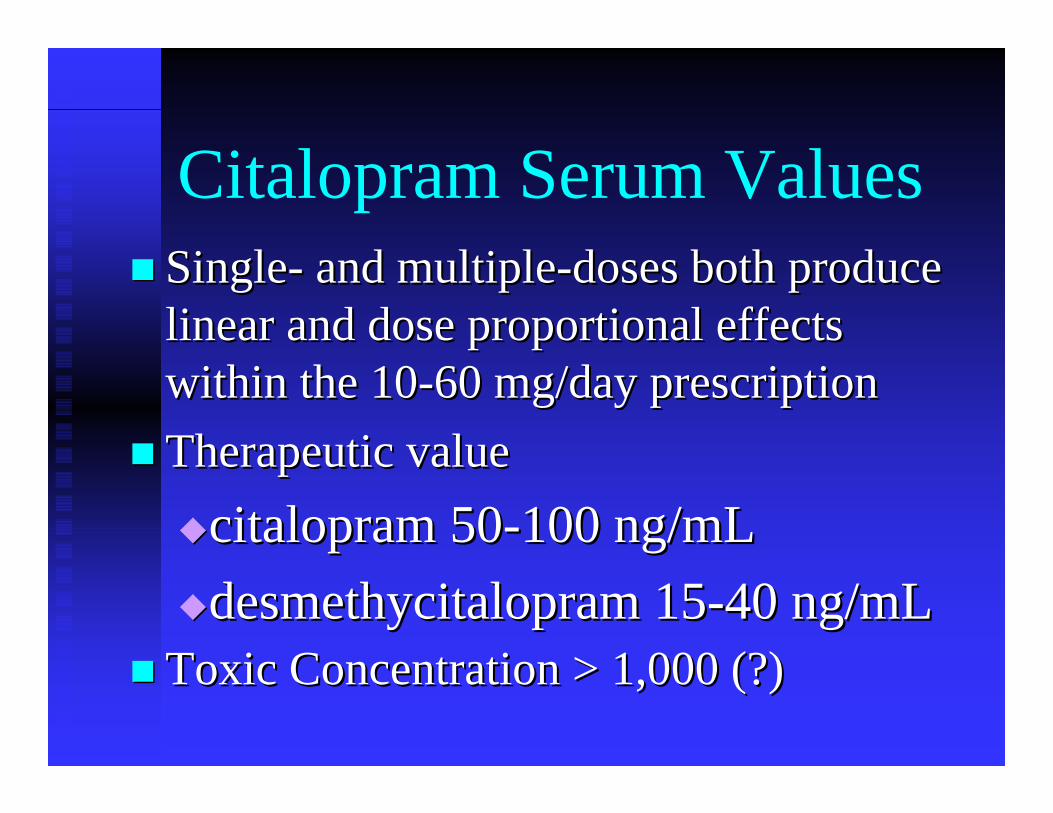
Citalopram Serum ValuesSingleSingle-- and multipleand multiple--doses both produce doses both produce linear and dose proportional effects linear and dose proportional effects within the 10within the 10--60 mg/day prescription60 mg/day prescriptionTherapeutic valueTherapeutic value
citalopram citalopram 5050--100 ng/mL100 ng/mLdesmethycitalopram desmethycitalopram 1515--40 ng/mL40 ng/mL
Toxic Concentration > 1,000 (?)Toxic Concentration > 1,000 (?)
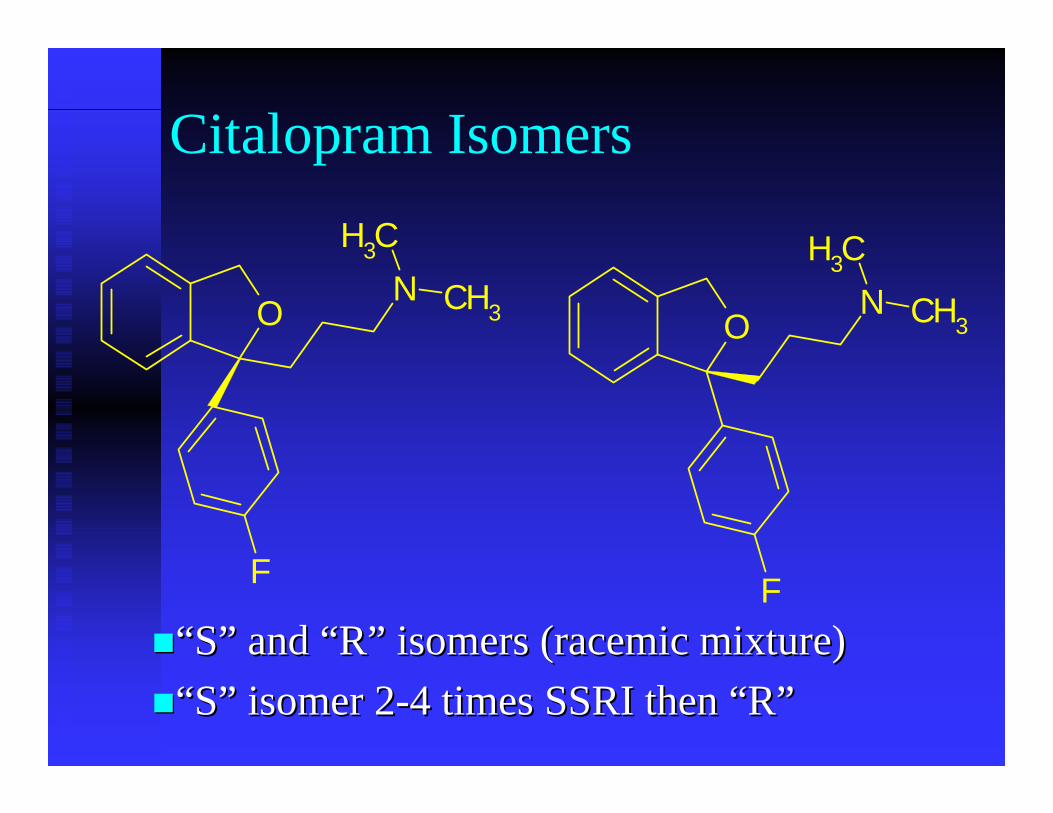
Citalopram Isomers
ON CH3
CH3
F F
ON CH3
CH3
“S” and “R” isomers (“S” and “R” isomers (racemicracemic mixture)mixture)“S” isomer 2“S” isomer 2--4 times SSRI then “R”4 times SSRI then “R”
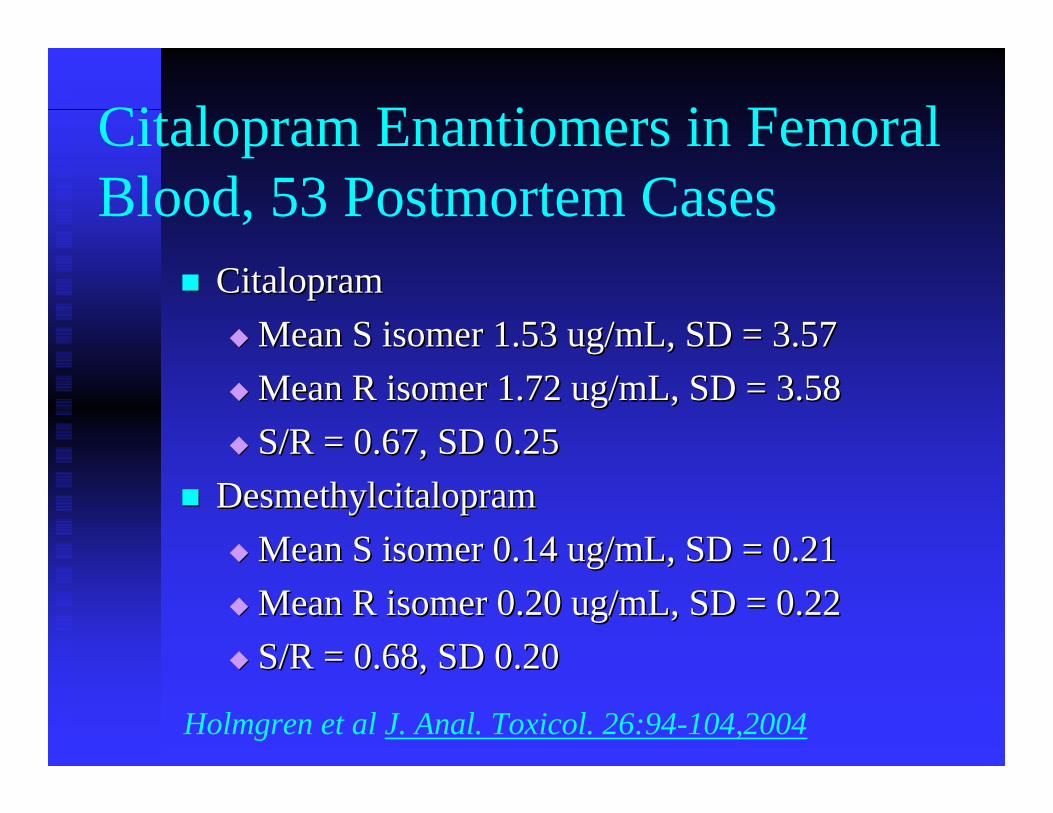
Citalopram Enantiomers in Femoral Blood, 53 Postmortem Cases
CitalopramCitalopramMean S isomer 1.53 ug/mL, SD = 3.57Mean S isomer 1.53 ug/mL, SD = 3.57Mean R isomer 1.72 ug/mL, SD = 3.58Mean R isomer 1.72 ug/mL, SD = 3.58S/R = 0.67, SD 0.25S/R = 0.67, SD 0.25
DesmethylcitalopramDesmethylcitalopramMean S isomer 0.14 ug/mL, SD = 0.21Mean S isomer 0.14 ug/mL, SD = 0.21Mean R isomer 0.20 ug/mL, SD = 0.22Mean R isomer 0.20 ug/mL, SD = 0.22S/R = 0.68, SD 0.20S/R = 0.68, SD 0.20
Holmgren et al J. Anal. Toxicol. 26:94-104,2004
Escitalopram“S” isomer “S” isomer citalopramcitalopram))10 mg = 2010 mg = 20--40 mg 40 mg citalopramcitalopram
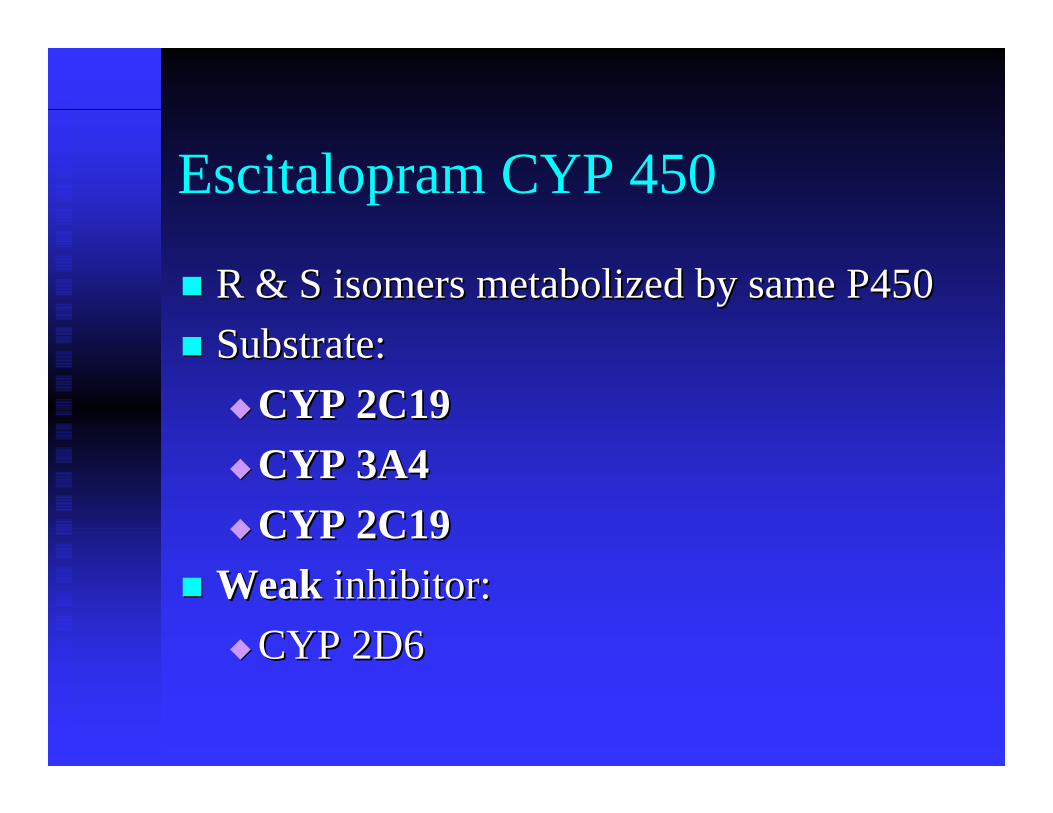
Escitalopram CYP 450
R & S isomers R & S isomers metabolizedmetabolized by same P450by same P450Substrate:Substrate:
CYP 2C19CYP 2C19CYP 3A4CYP 3A4CYP 2C19CYP 2C19
Weak Weak inhibitor: inhibitor: CYP 2D6CYP 2D6
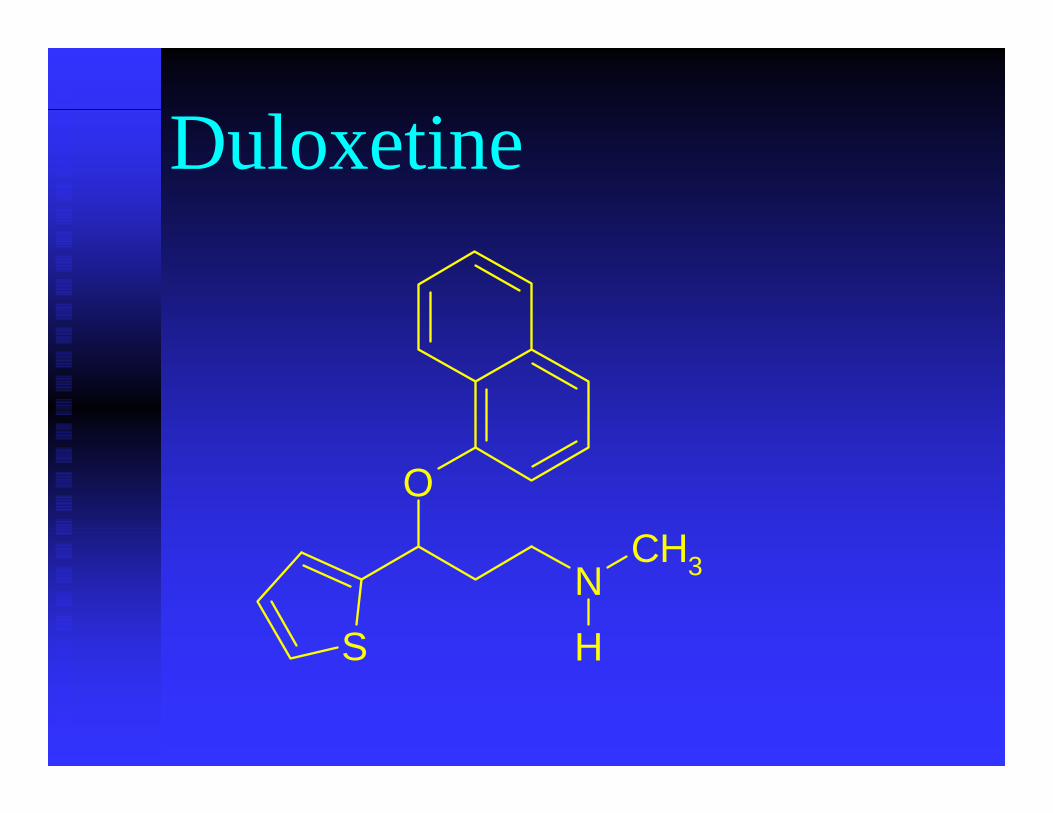
Duloxetine
O
NCH3
HS
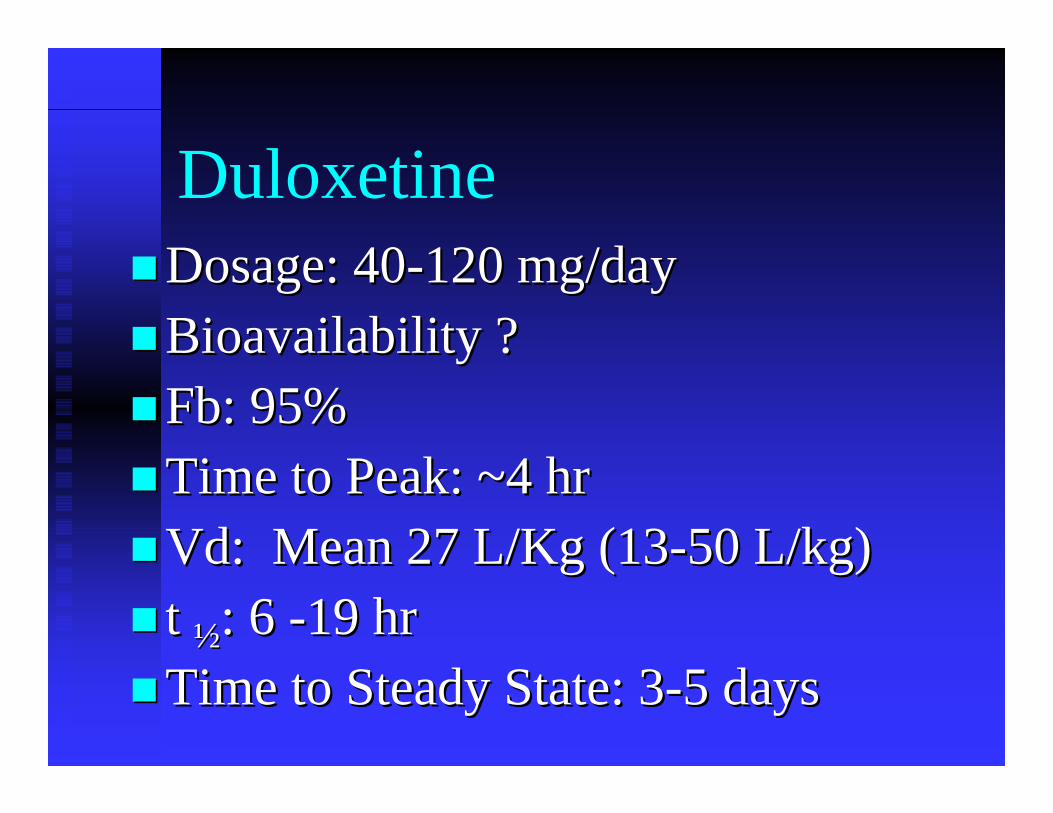
DuloxetineDosage: 40Dosage: 40--120 mg/day120 mg/dayBioavailability ?Bioavailability ?FbFb: 95%: 95%Time to Peak: ~4 hrTime to Peak: ~4 hrVdVd: Mean 27 L/Kg (13: Mean 27 L/Kg (13--50 L/kg)50 L/kg)t t ½½: 6 : 6 --19 hr19 hrTime to Steady State: 3Time to Steady State: 3--5 days5 days
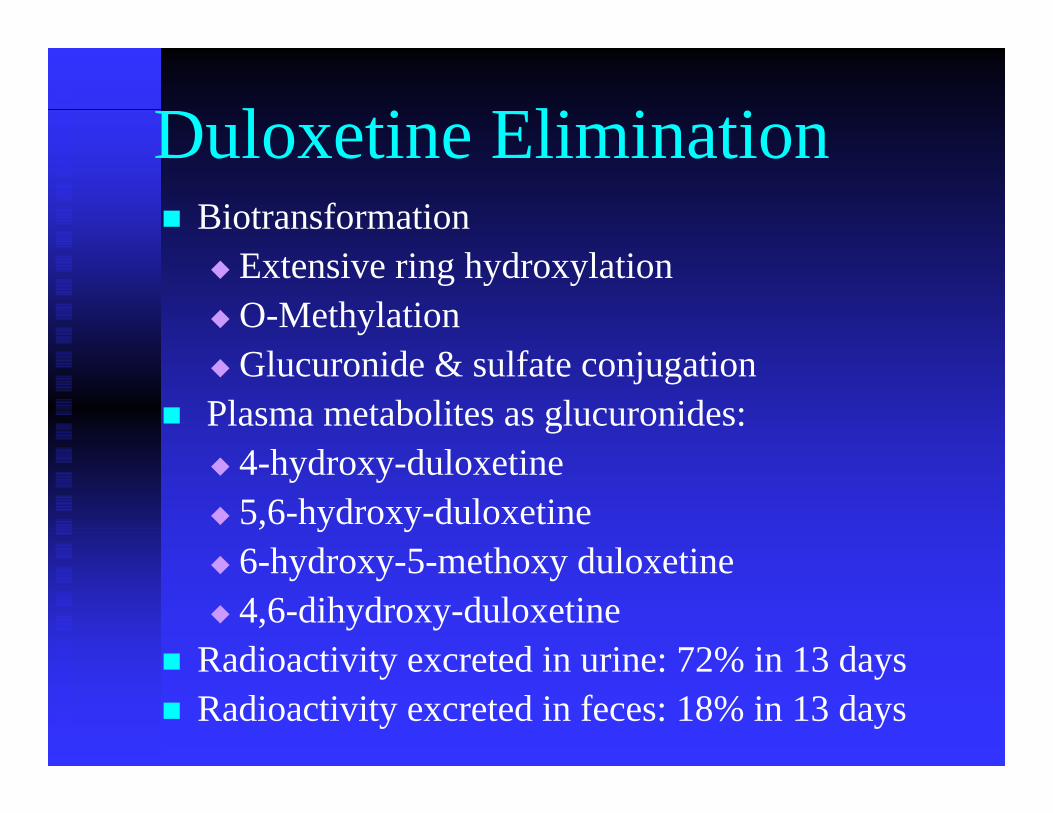
Duloxetine Elimination Biotransformation
Extensive ring hydroxylationO-Methylation Glucuronide & sulfate conjugation
Plasma metabolites as glucuronides:4-hydroxy-duloxetine5,6-hydroxy-duloxetine6-hydroxy-5-methoxy duloxetine 4,6-dihydroxy-duloxetine
Radioactivity excreted in urine: 72% in 13 daysRadioactivity excreted in feces: 18% in 13 days
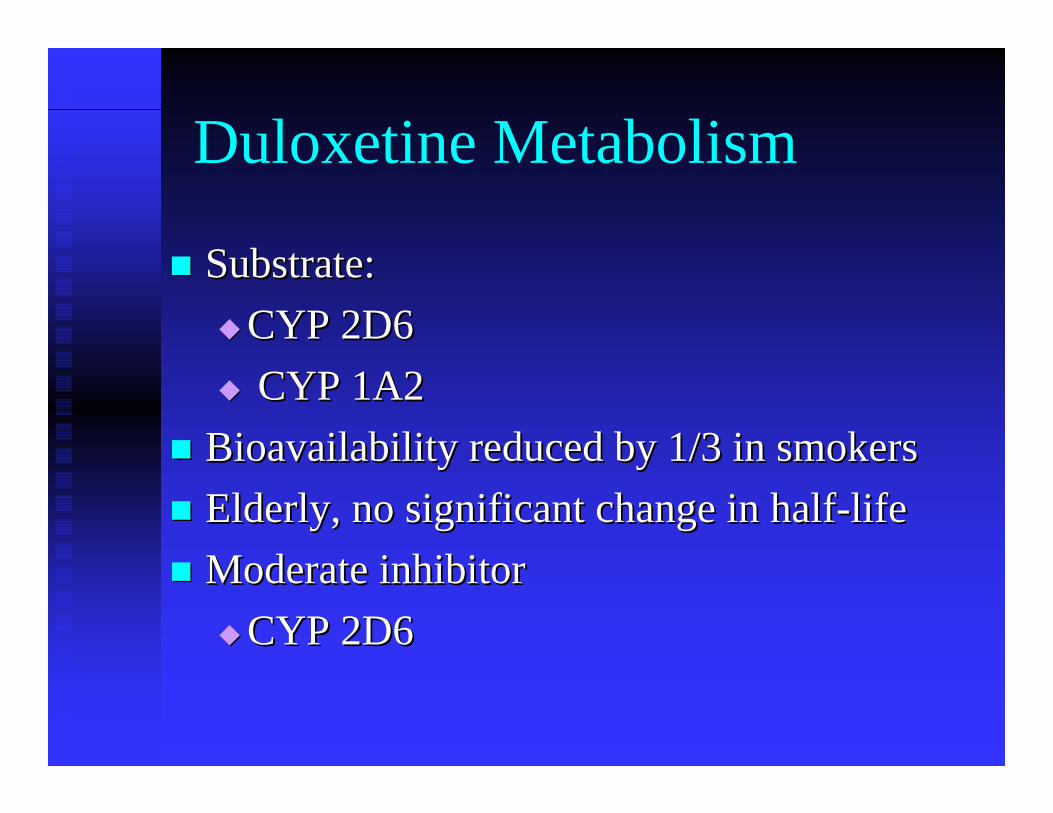
Duloxetine Metabolism
Substrate:Substrate:CYP 2D6CYP 2D6CYP 1A2CYP 1A2
Bioavailability reduced by 1/3 in smokersBioavailability reduced by 1/3 in smokersElderly, no significant change in halfElderly, no significant change in half--lifelifeModerate inhibitorModerate inhibitor
CYP 2D6CYP 2D6
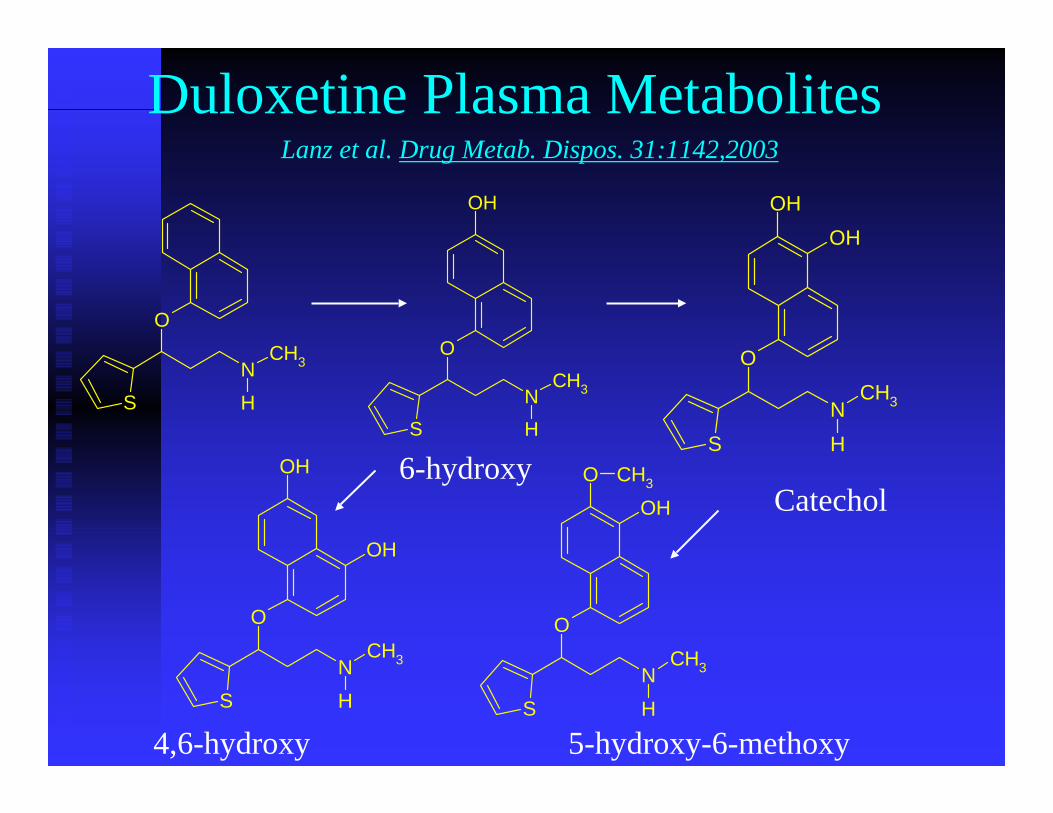
Duloxetine Plasma Metabolites
O
NCH3
HS
O
NCH3
HS
OH
O
NCH3
HS
OHOH
O
NCH3
HS
OHO CH3
O
NCH3
HS
OH
OH
6-hydroxyCatechol
4,6-hydroxy 5-hydroxy-6-methoxy
Lanz et al. Drug Metab. Dispos. 31:1142,2003
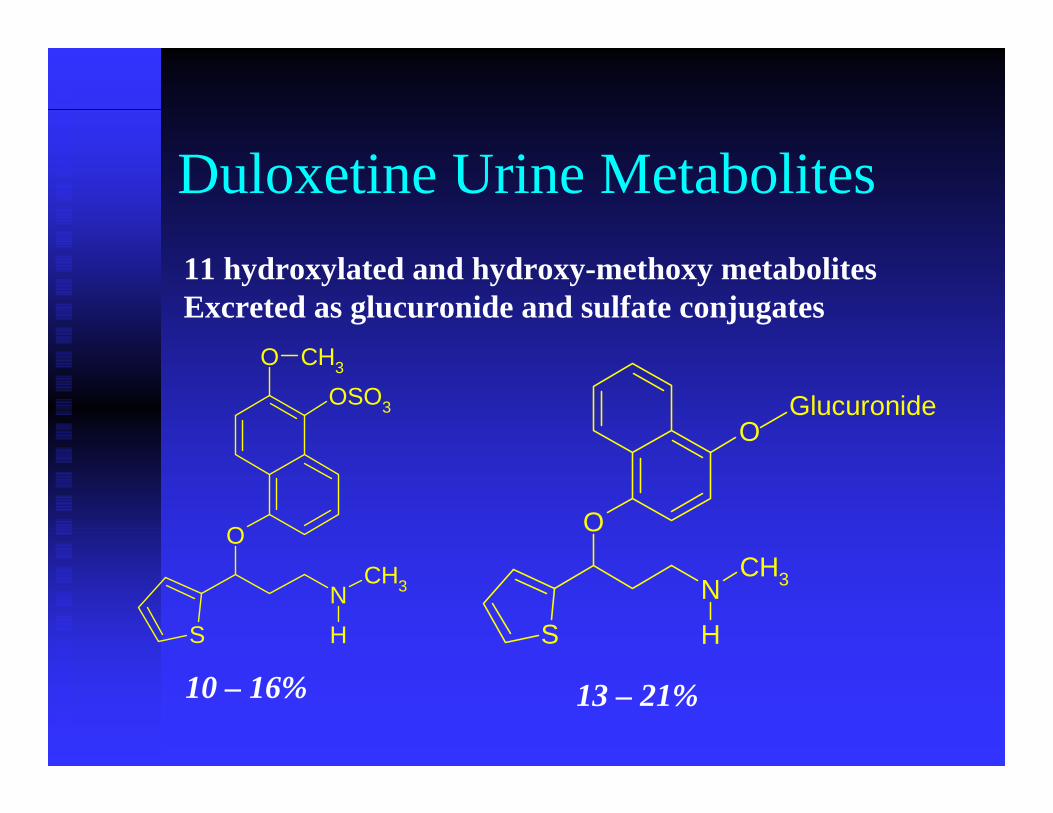
Duloxetine Urine Metabolites
O
NCH3
HS
OSO3
O CH3
O
NCH3
HS
OGlucuronide
11 hydroxylated and hydroxy-methoxy metabolites Excreted as glucuronide and sulfate conjugates
13 – 21%10 – 16%
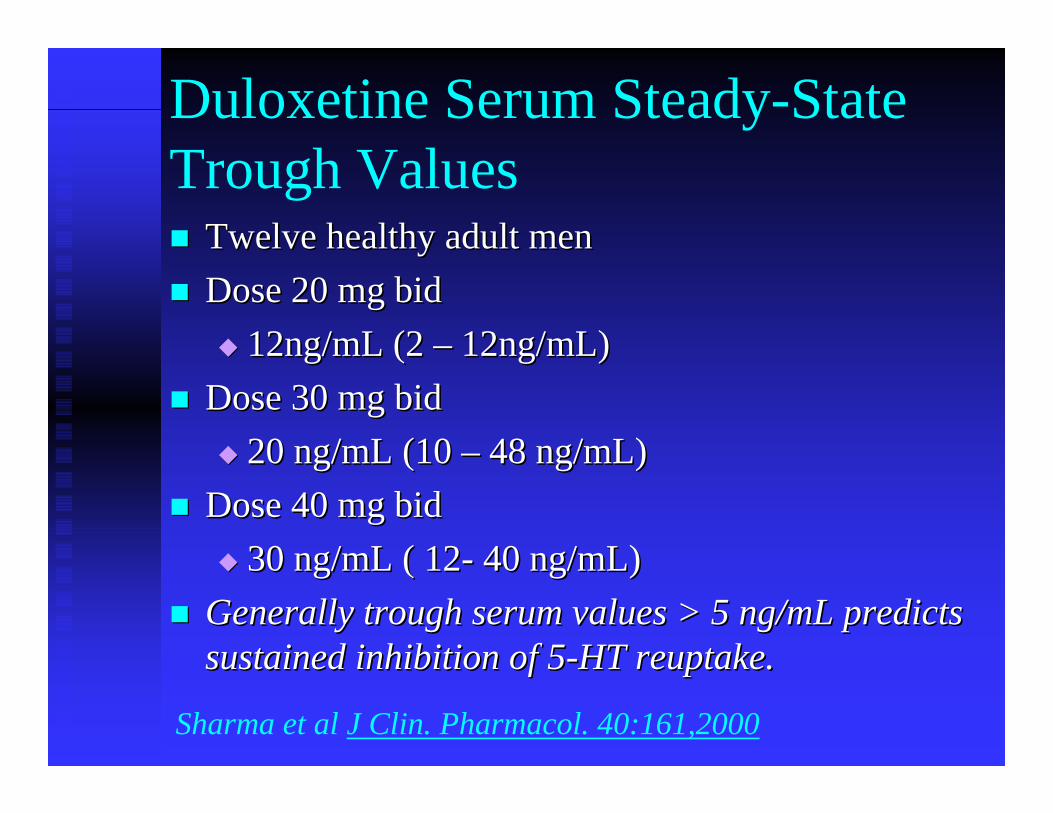
Duloxetine Serum Steady-State Trough Values
Twelve healthy adult menTwelve healthy adult menDose 20 mg bidDose 20 mg bid
12ng/mL (2 12ng/mL (2 –– 12ng/mL) 12ng/mL) Dose 30 mg bidDose 30 mg bid
20 ng/mL (10 20 ng/mL (10 –– 48 ng/mL)48 ng/mL)Dose 40 mg bidDose 40 mg bid
30 ng/mL ( 1230 ng/mL ( 12-- 40 ng/mL)40 ng/mL)Generally trough serum values > 5 ng/mL predicts Generally trough serum values > 5 ng/mL predicts sustained inhibition of 5sustained inhibition of 5--HT reuptake.HT reuptake.
Sharma et al J Clin. Pharmacol. 40:161,2000
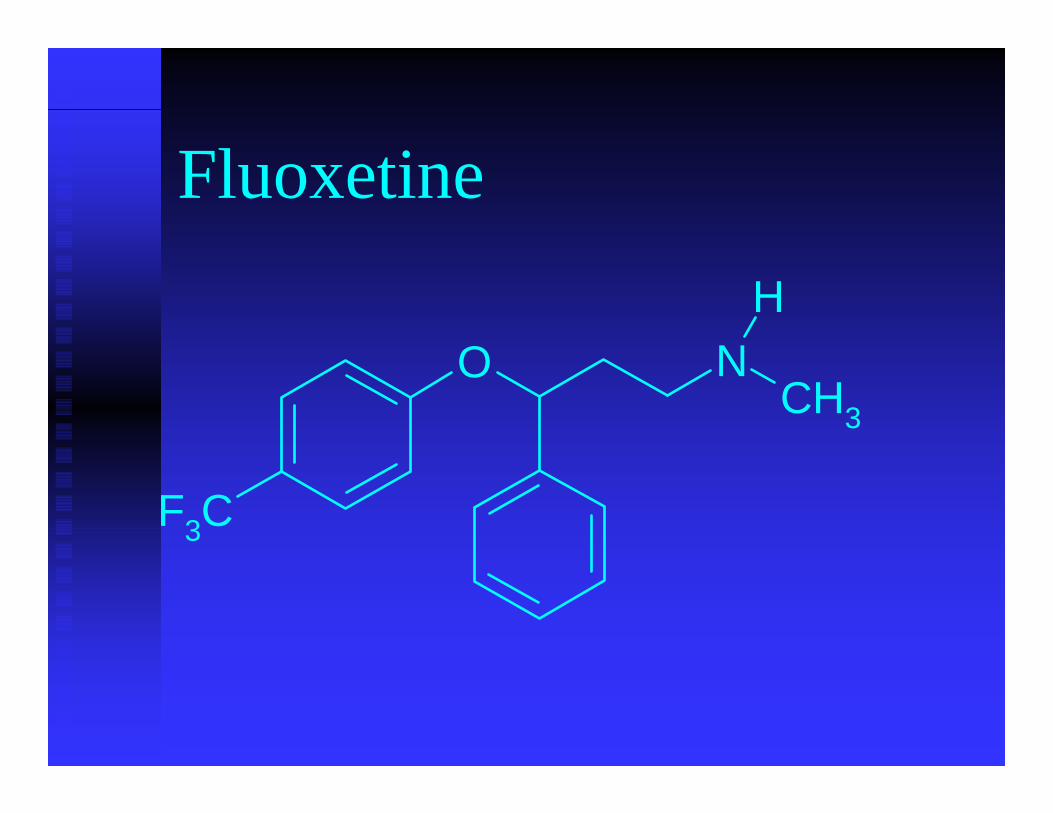
Fluoxetine
F3C
O NCH3
H
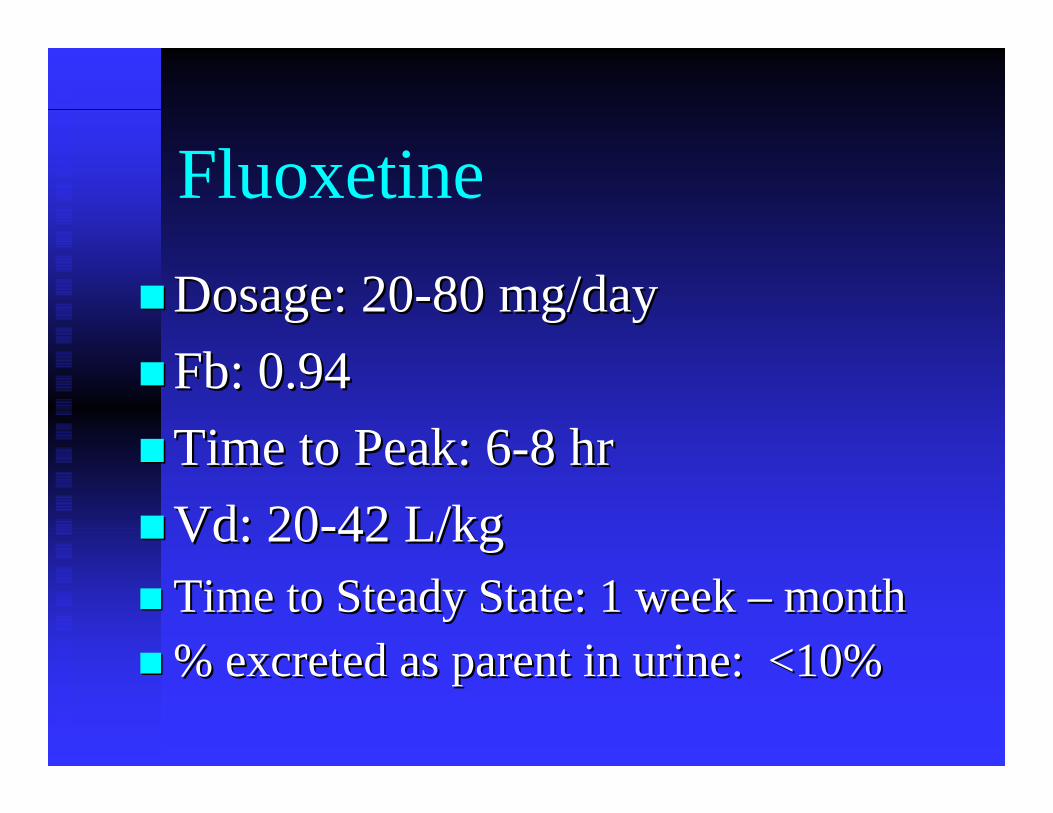
FluoxetineDosage: 20Dosage: 20--80 mg/day80 mg/dayFbFb: 0.94: 0.94Time to Peak: 6Time to Peak: 6--8 hr8 hrVdVd: 20: 20--42 L/kg42 L/kgTime to Steady State: 1 week Time to Steady State: 1 week –– monthmonth% excreted as parent in urine: <10%% excreted as parent in urine: <10%
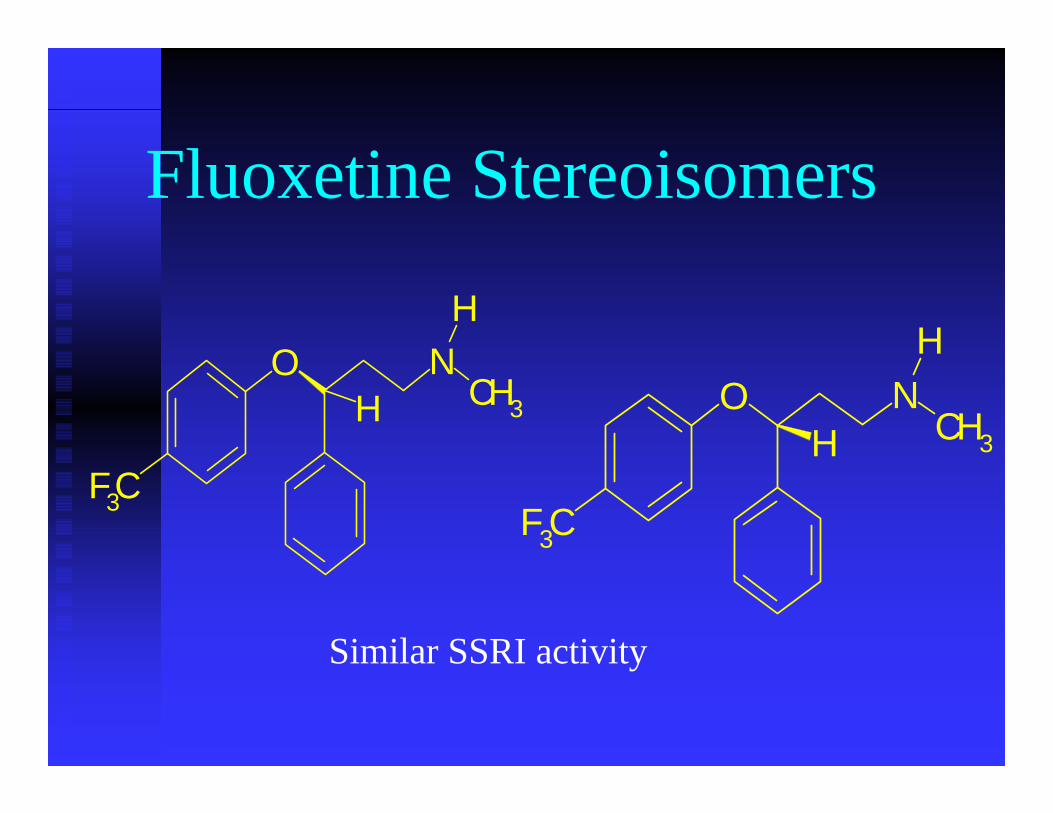
Fluoxetine Stereoisomers
F3C
O NCH3
H
H NCH3
H
HO
F3C
Similar SSRI activity
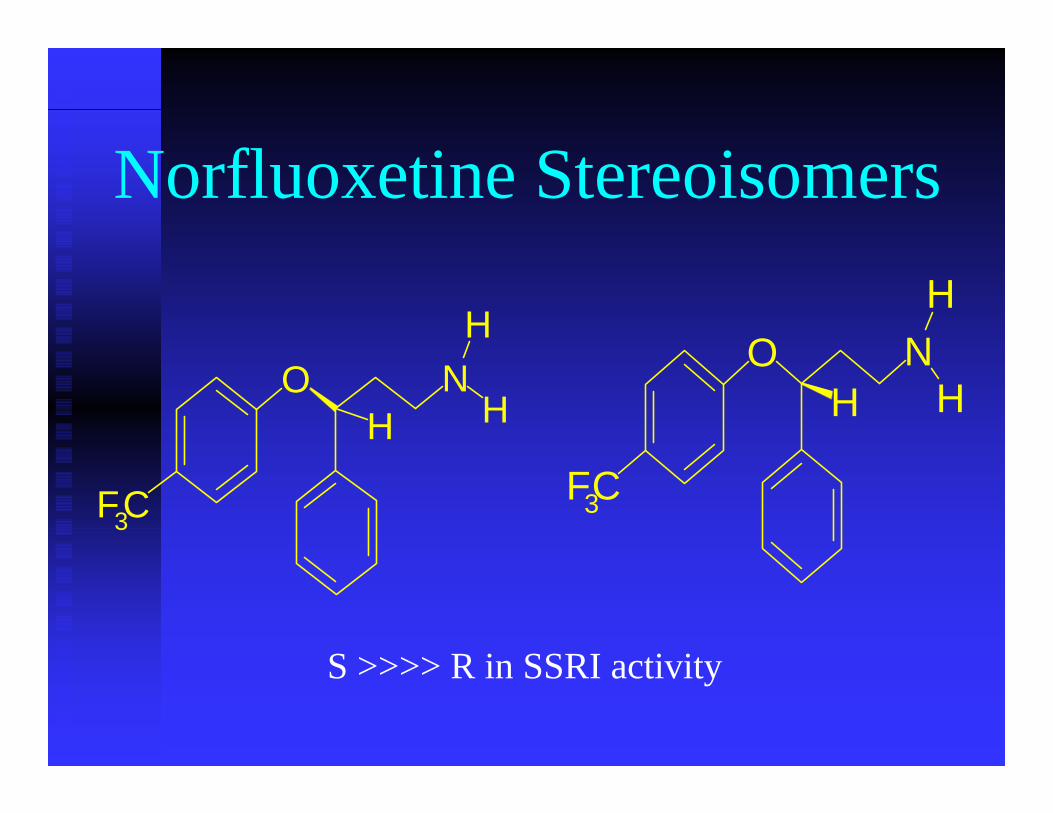
Norfluoxetine Stereoisomers
F3C
O NH
H
H
NH
HO
F3C
H
S >>>> R in SSRI activity
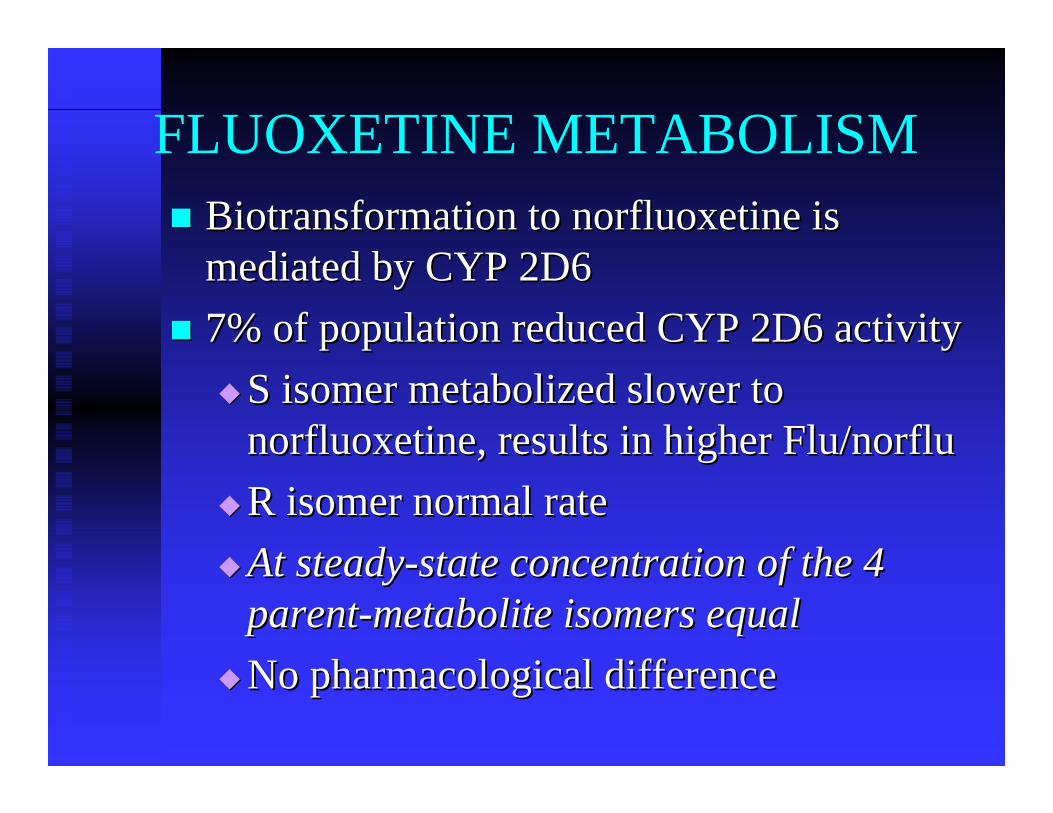
FLUOXETINE METABOLISMBiotransformation to Biotransformation to norfluoxetine norfluoxetine is is mediated by CYP 2D6mediated by CYP 2D67% of population reduced CYP 2D6 activity7% of population reduced CYP 2D6 activity
S isomer metabolized slower to S isomer metabolized slower to norfluoxetinenorfluoxetine, results in higher Flu/, results in higher Flu/norflunorfluR isomer normal rateR isomer normal rateAt steadyAt steady--state concentration of the 4 state concentration of the 4 parentparent--metabolite isomers equalmetabolite isomers equalNo pharmacological differenceNo pharmacological difference
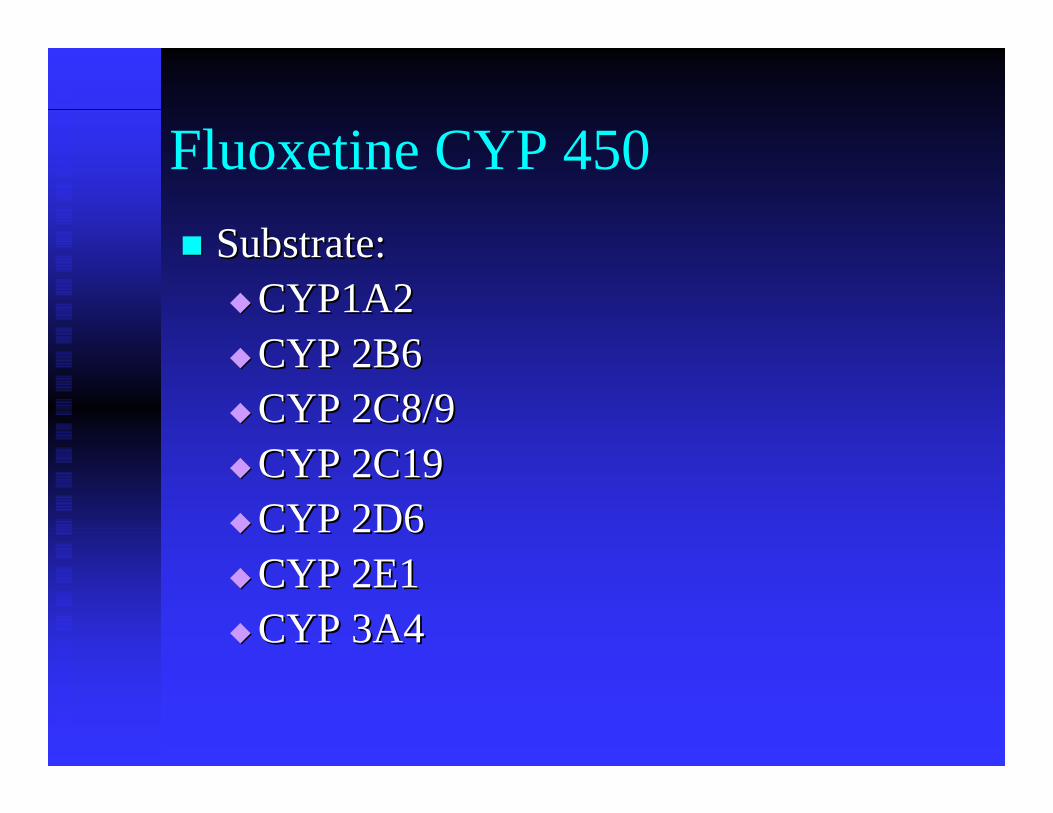
Fluoxetine CYP 450Substrate:Substrate:
CYP1A2CYP1A2CYP 2B6CYP 2B6CYP 2C8/9CYP 2C8/9CYP 2C19CYP 2C19CYP 2D6CYP 2D6CYP 2E1CYP 2E1CYP 3A4CYP 3A4
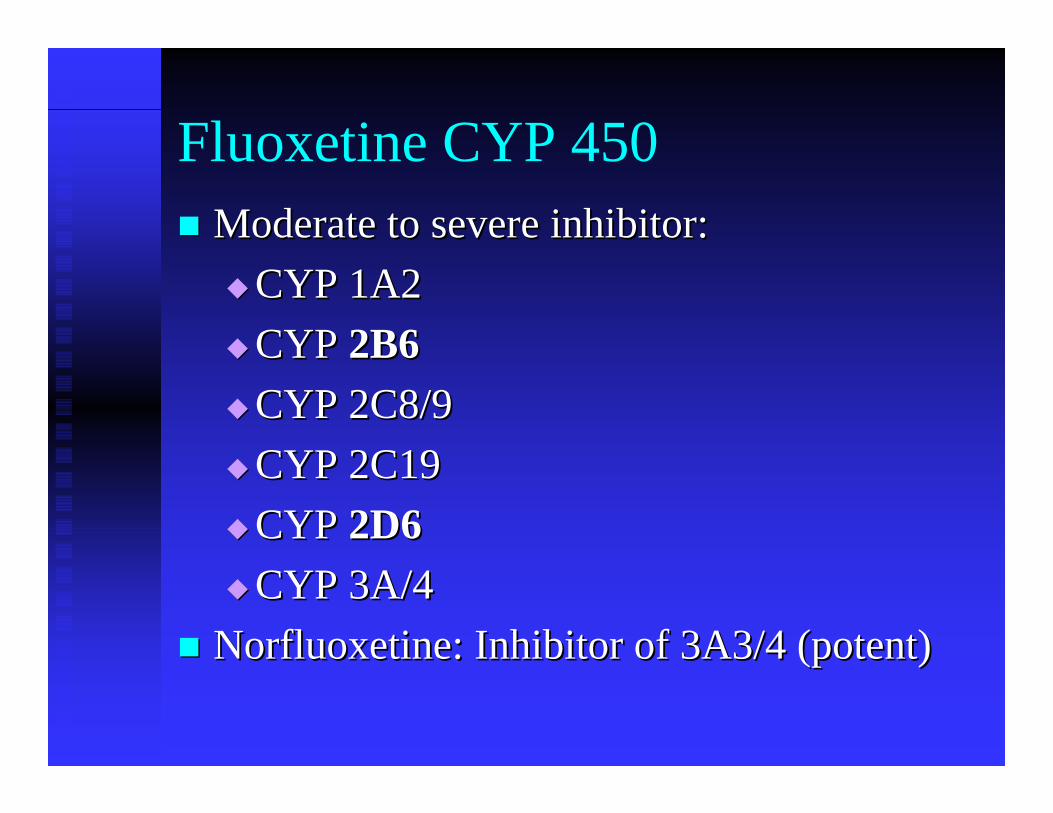
Fluoxetine CYP 450Moderate to severe inhibitor: Moderate to severe inhibitor:
CYP 1A2CYP 1A2CYP CYP 2B62B6CYP 2C8/9CYP 2C8/9CYP 2C19CYP 2C19CYP CYP 2D62D6CYP 3A/4CYP 3A/4
NorfluoxetineNorfluoxetine: Inhibitor of 3A3/4 (potent): Inhibitor of 3A3/4 (potent)
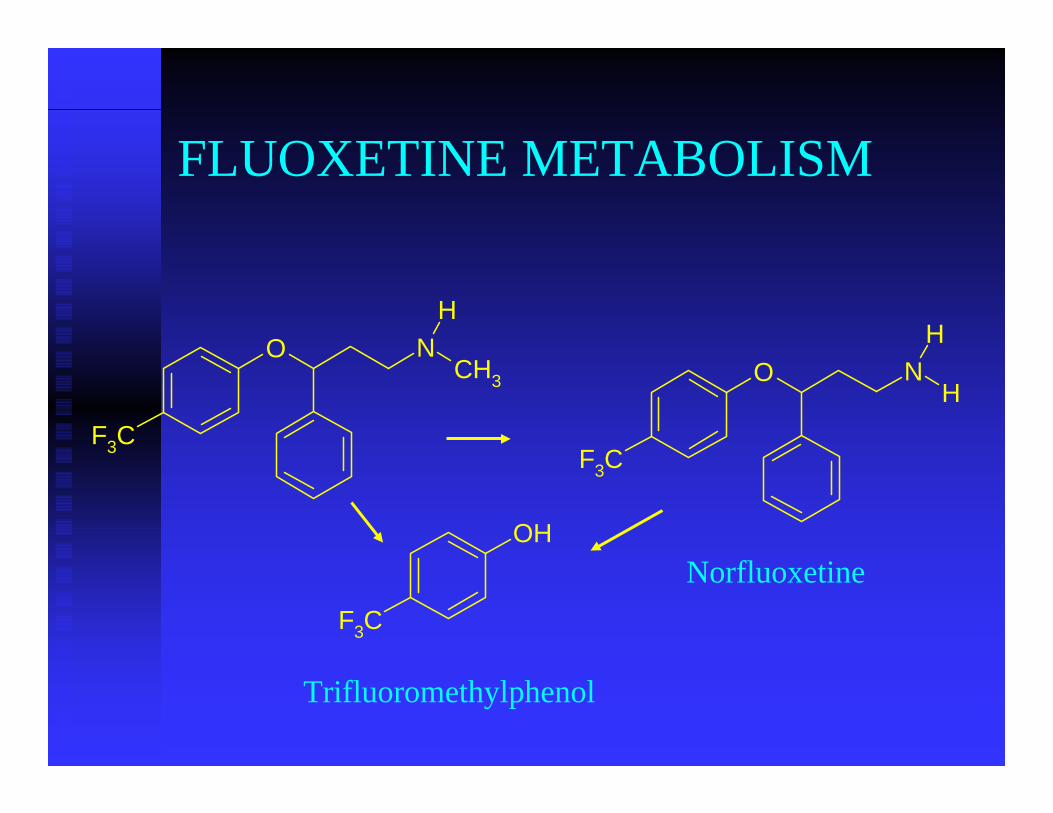
F3C
O NCH3
H
F3C
O NH
H
F3C
OH
FLUOXETINE METABOLISM
Norfluoxetine
Trifluoromethylphenol
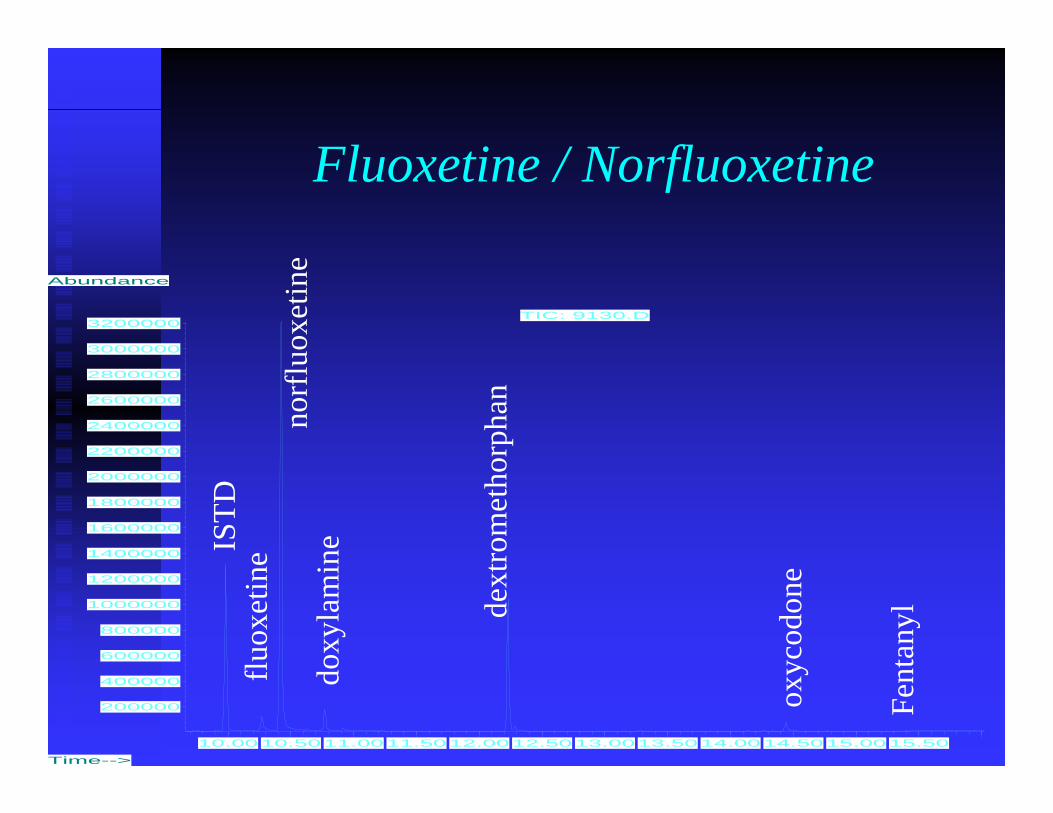
10.0010.5011.0011.5012.0012.5013.0013.5014.0014.5015.0015.50
200000
400000
600000
800000
1000000
1200000
1400000
1600000
1800000
2000000
2200000
2400000
2600000
2800000
3000000
3200000
Time-->
Abundance
TIC: 9130.D
ISTD
fluox
etin
eno
rflu
oxet
ine
doxy
lam
ine
dext
rom
etho
rpha
n
oxyc
odon
e
Fent
anyl
Fluoxetine / Norfluoxetine
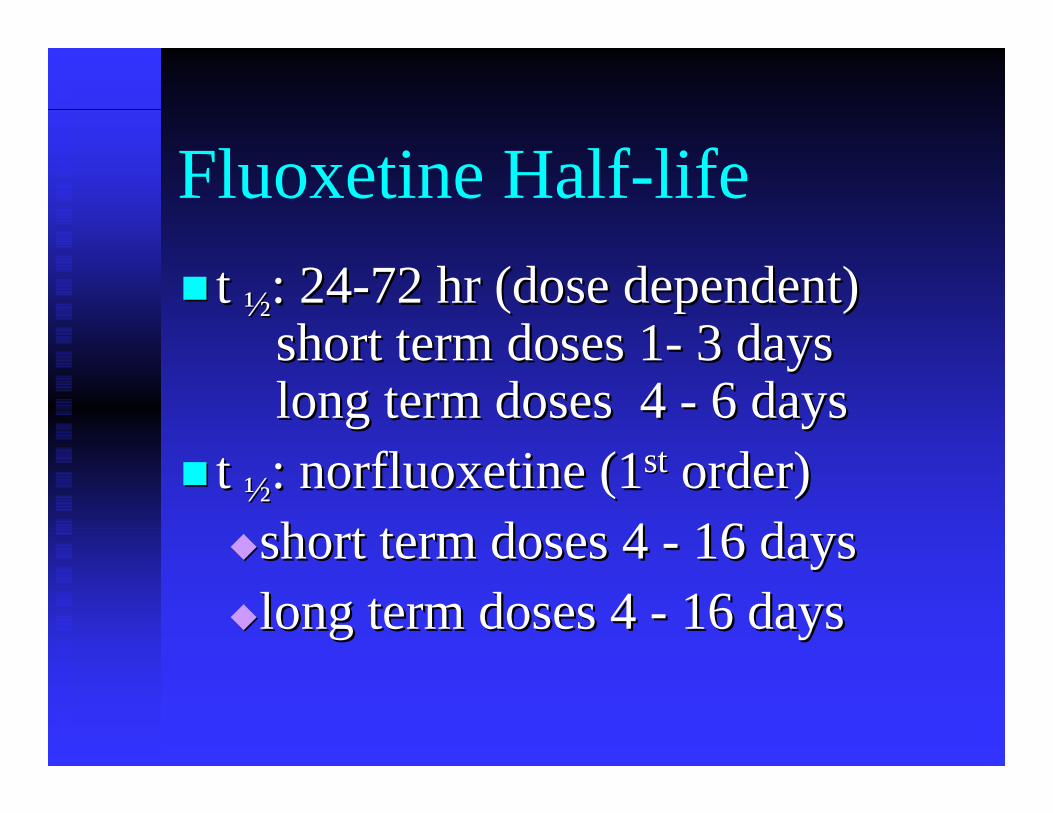
Fluoxetine Half-lifet t ½½: 24: 24--72 hr (dose dependent)72 hr (dose dependent)
short term doses 1short term doses 1-- 3 days3 dayslong term doses 4 long term doses 4 -- 6 days6 days
t t ½½: : norfluoxetine norfluoxetine (1(1stst order)order)short term doses 4 short term doses 4 -- 16 days16 dayslong term doses 4 long term doses 4 -- 16 days16 days
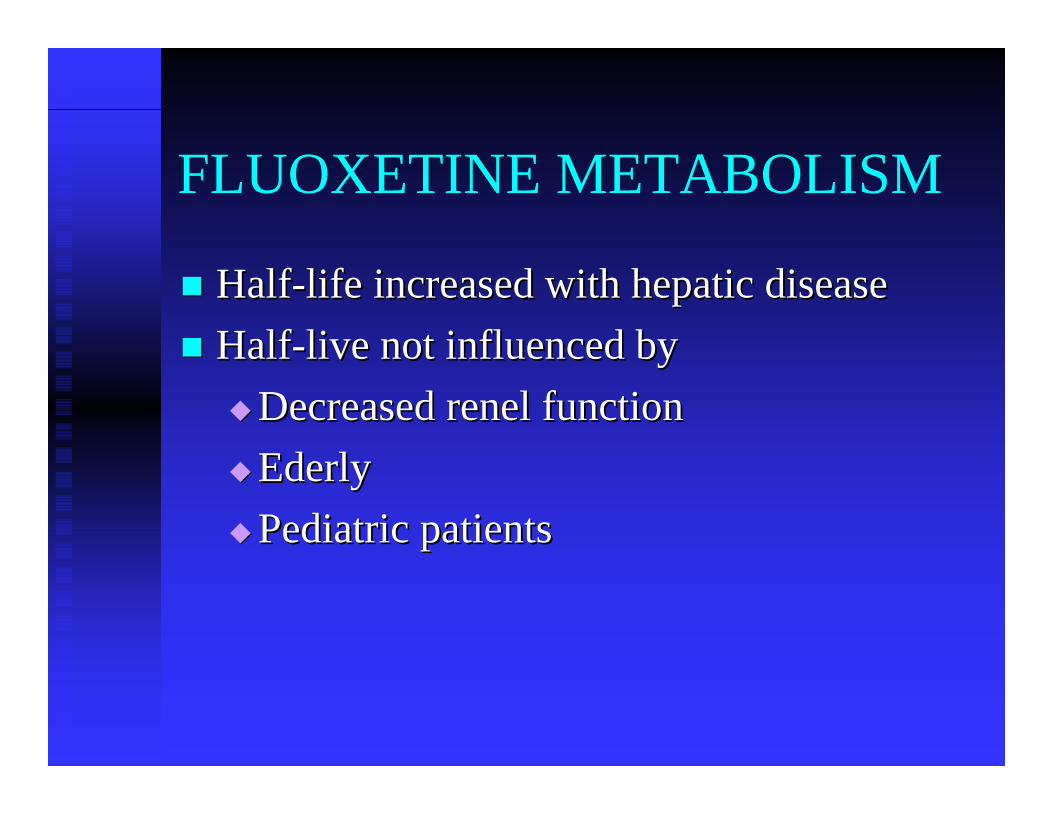
FLUOXETINE METABOLISM
HalfHalf--life increased with hepatic diseaselife increased with hepatic diseaseHalfHalf--live not influenced bylive not influenced by
Decreased Decreased renel renel functionfunctionEderlyEderlyPediatric patientsPediatric patients
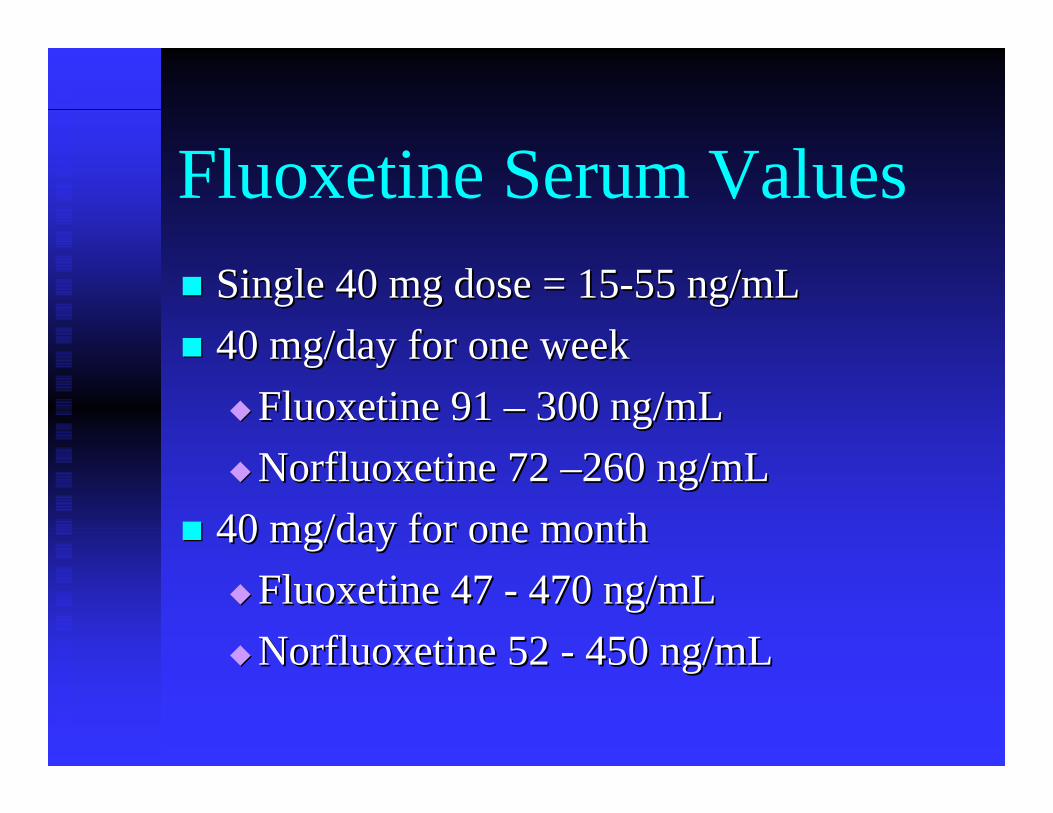
Fluoxetine Serum ValuesSingle 40 mg dose = 15Single 40 mg dose = 15--55 ng/mL55 ng/mL40 mg/day for one week40 mg/day for one week
Fluoxetine 91 Fluoxetine 91 –– 300 ng/mL300 ng/mLNorfluoxetine Norfluoxetine 72 72 ––260 ng/mL 260 ng/mL
40 mg/day for one month40 mg/day for one monthFluoxetine 47 Fluoxetine 47 -- 470 ng/mL470 ng/mLNorfluoxetineNorfluoxetine 52 52 -- 450 ng/mL 450 ng/mL
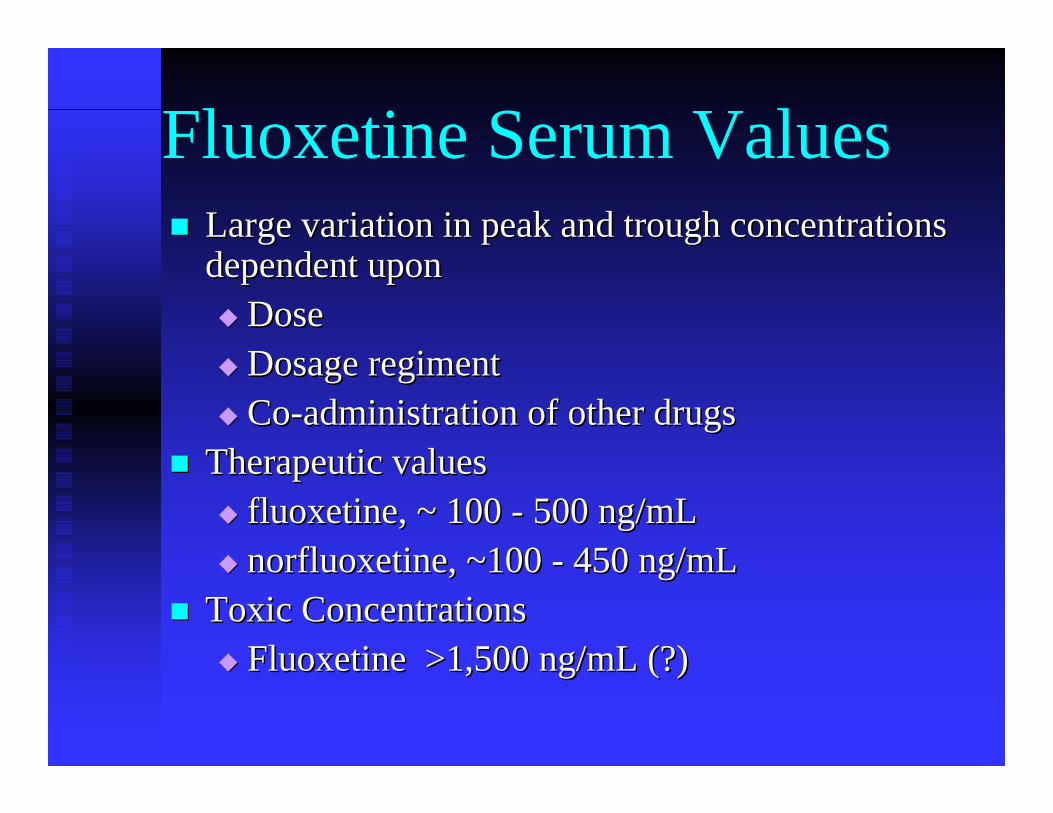
Fluoxetine Serum ValuesLarge variation in peak and trough concentrations Large variation in peak and trough concentrations dependent upondependent upon
DoseDoseDosage regimentDosage regimentCoCo--administration of other drugsadministration of other drugs
Therapeutic values Therapeutic values fluoxetinefluoxetine, ~ 100 , ~ 100 -- 500 ng/mL500 ng/mLnorfluoxetinenorfluoxetine, ~100 , ~100 -- 450 ng/mL450 ng/mL
Toxic ConcentrationsToxic ConcentrationsFluoxetine >1,500 ng/mL (?)Fluoxetine >1,500 ng/mL (?)
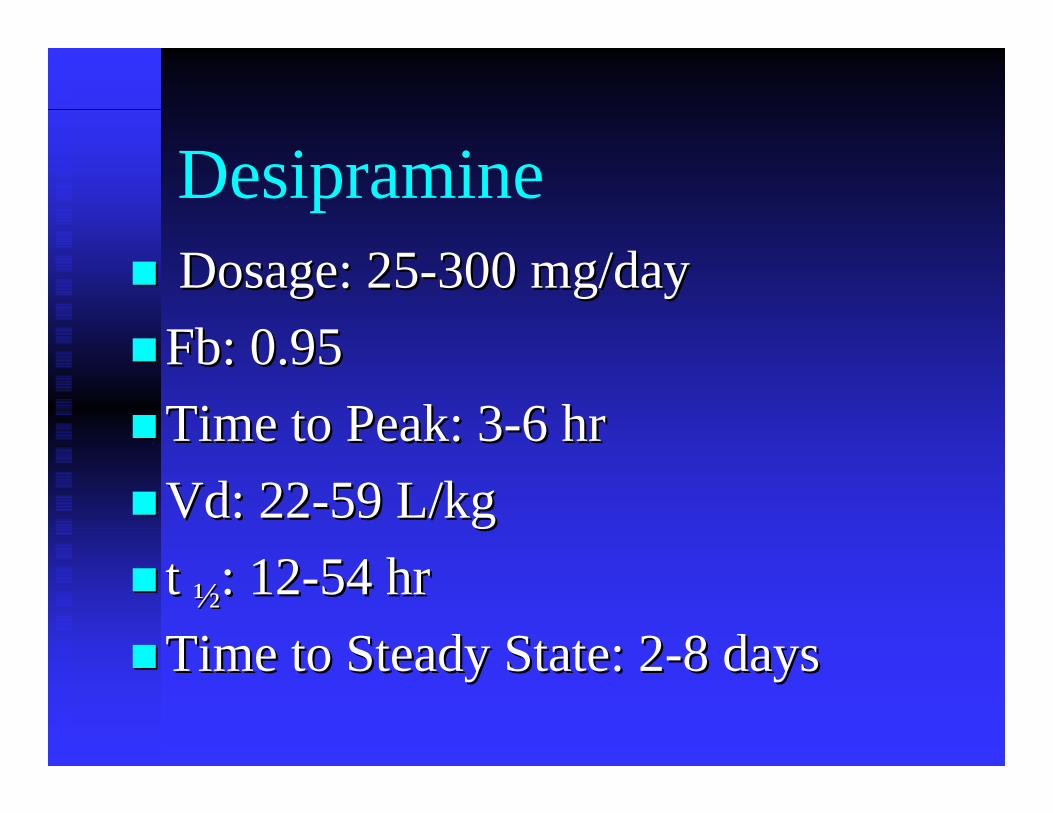
DesipramineDosage: 25Dosage: 25--300 mg/day300 mg/day
FbFb: 0.95 : 0.95 Time to Peak: 3Time to Peak: 3--6 hr6 hrVdVd: 22: 22--59 L/kg59 L/kgt t ½½: 12: 12--54 hr54 hrTime to Steady State: 2Time to Steady State: 2--8 days8 days
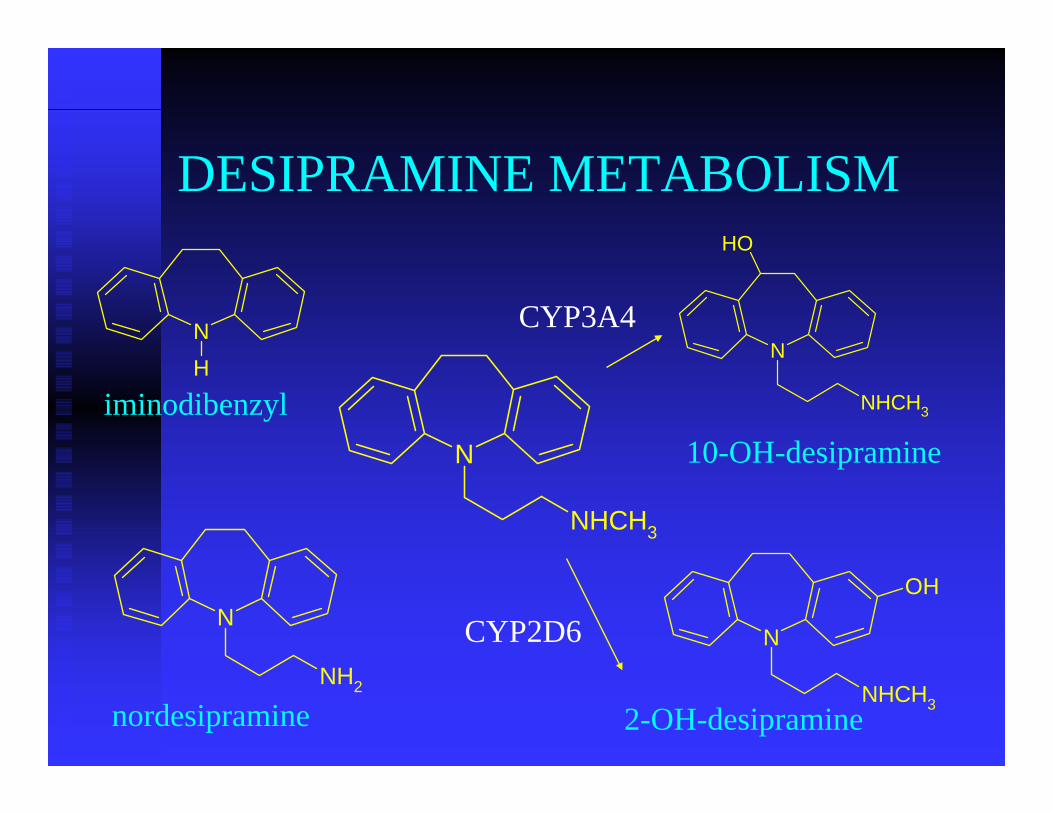
DESIPRAMINE METABOLISM
N
NHCH3
NH
N
NHCH3
OH
N
NHCH3
OHN
NH2
10-OH-desipramine
2-OH-desipraminenordesipramine
iminodibenzyl
CYP2D6
CYP3A4
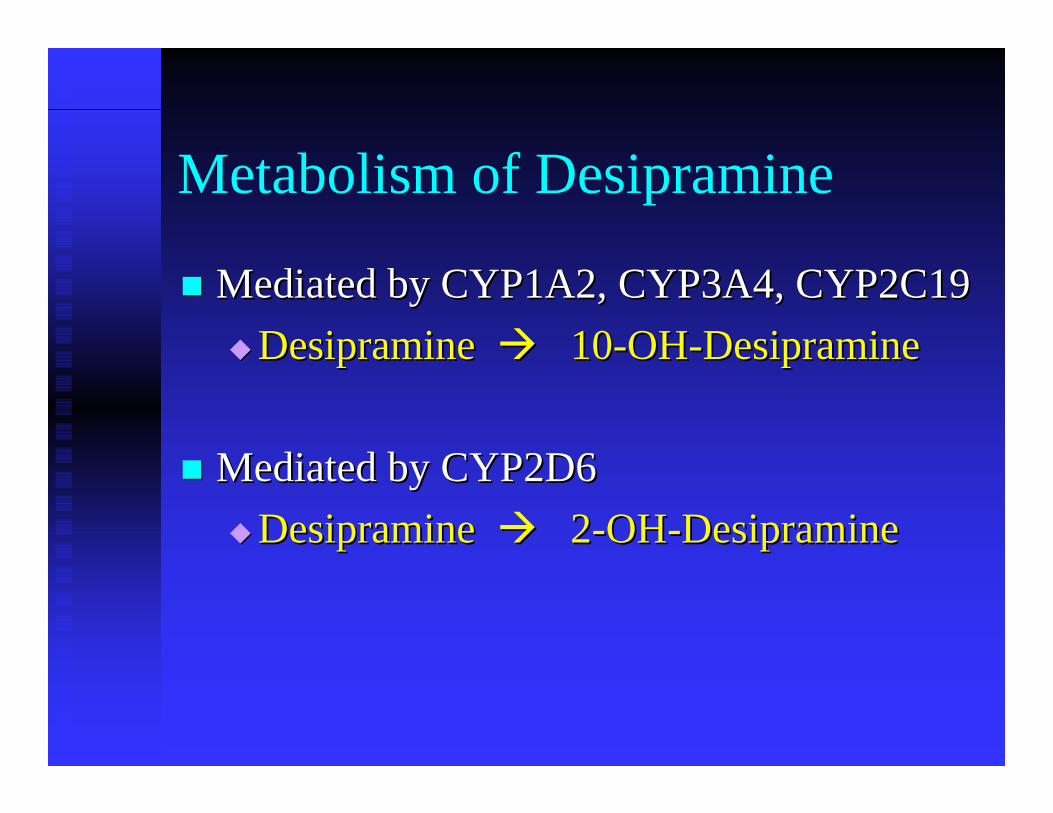
Metabolism of Desipramine
Mediated by CYP1A2, CYP3A4, CYP2C19Mediated by CYP1A2, CYP3A4, CYP2C19Desipramine Desipramine 1010--OHOH--DesipramineDesipramine
Mediated by CYP2D6Mediated by CYP2D6Desipramine Desipramine 22--OHOH--DesipramineDesipramine
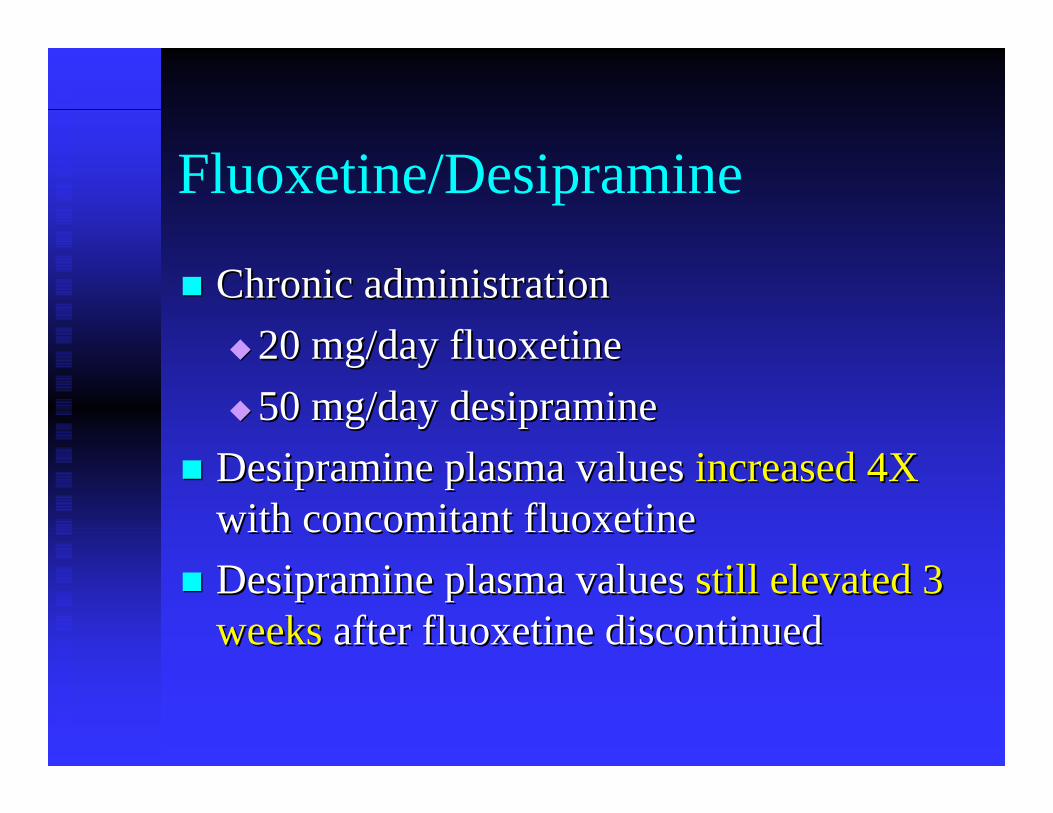
Fluoxetine/Desipramine
Chronic administrationChronic administration20 mg/day20 mg/day fluoxetinefluoxetine50 mg/day desipramine50 mg/day desipramine
Desipramine plasma values Desipramine plasma values increased 4Xincreased 4Xwith concomitantwith concomitant fluoxetine fluoxetine Desipramine plasma values Desipramine plasma values still elevated 3 still elevated 3 weeksweeks after after fluoxetine fluoxetine discontinueddiscontinued
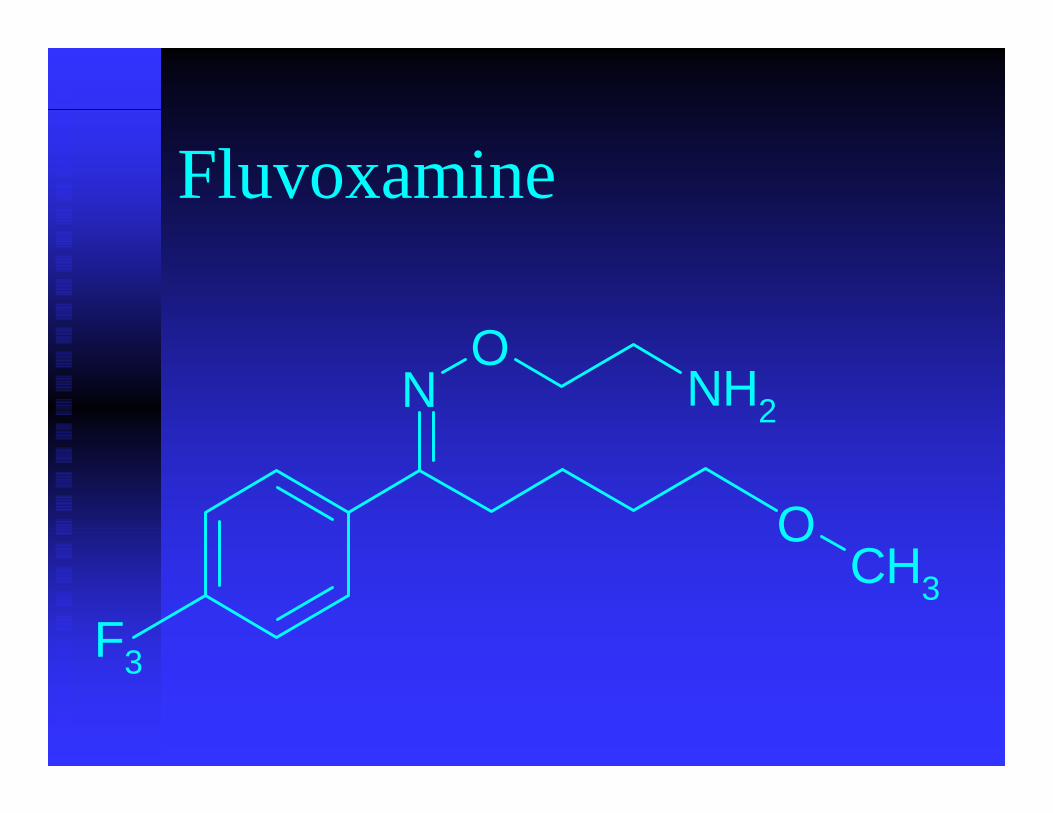
Fluvoxamine
F3
NO
NH2
OCH3
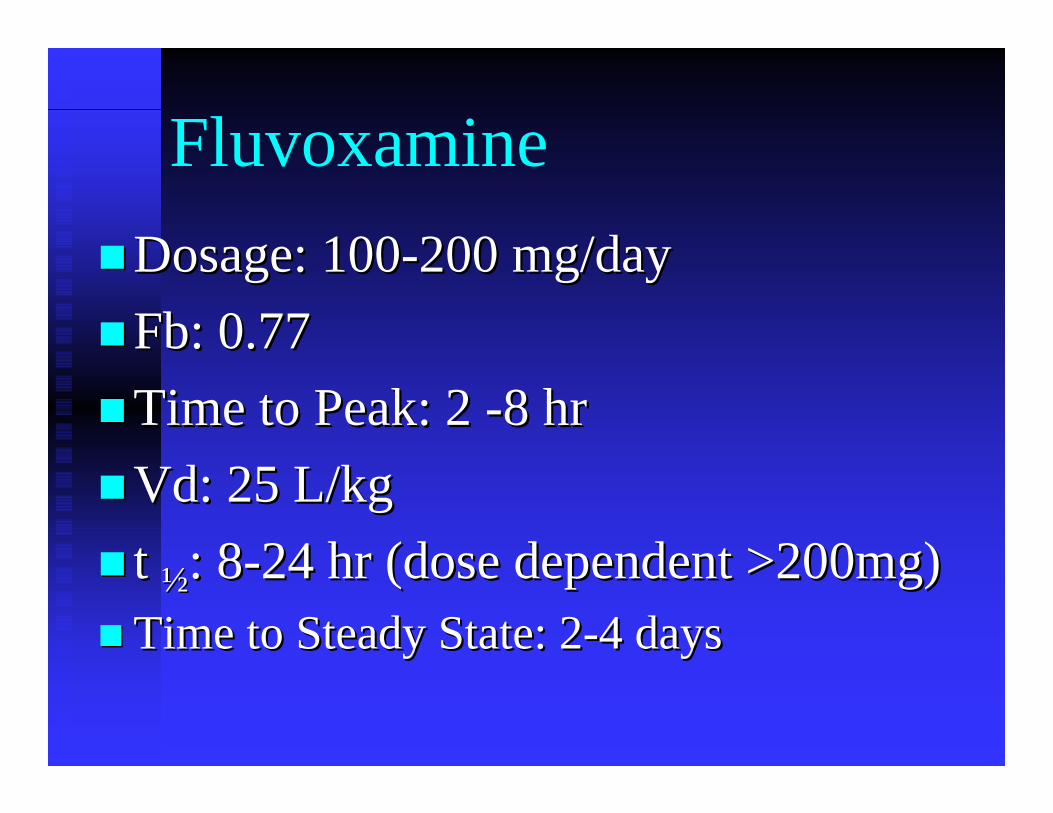
FluvoxamineDosage: 100Dosage: 100--200 mg/day200 mg/dayFbFb: 0.77: 0.77Time to Peak: 2 Time to Peak: 2 --8 hr8 hrVdVd: 25 L/kg: 25 L/kgt t ½½: 8: 8--24 hr (dose dependent >200mg)24 hr (dose dependent >200mg)Time to Steady State: 2Time to Steady State: 2--4 days4 days
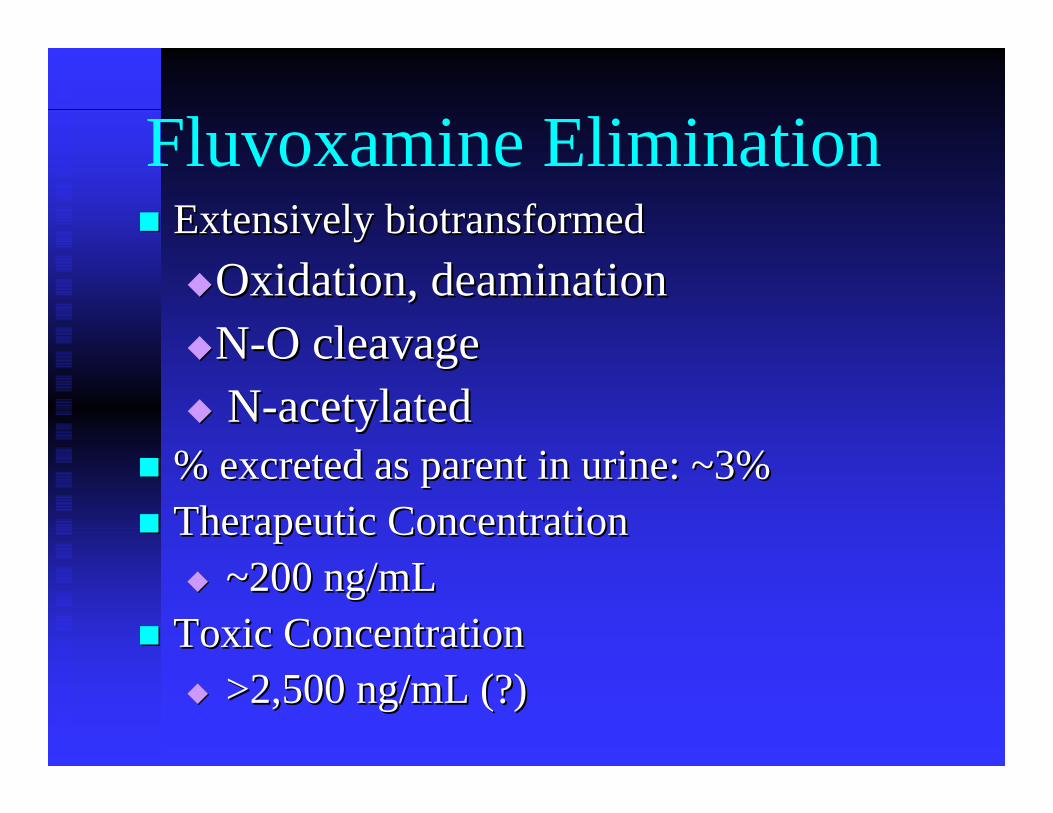
Fluvoxamine Elimination Extensively biotransformed Extensively biotransformed
Oxidation, Oxidation, deaminationdeaminationNN--O cleavageO cleavageNN--acetylated acetylated
% excreted as parent in urine: ~3%% excreted as parent in urine: ~3%Therapeutic ConcentrationTherapeutic Concentration
~200 ng/mL ~200 ng/mL Toxic ConcentrationToxic Concentration
>2,500 ng/mL (?)>2,500 ng/mL (?)
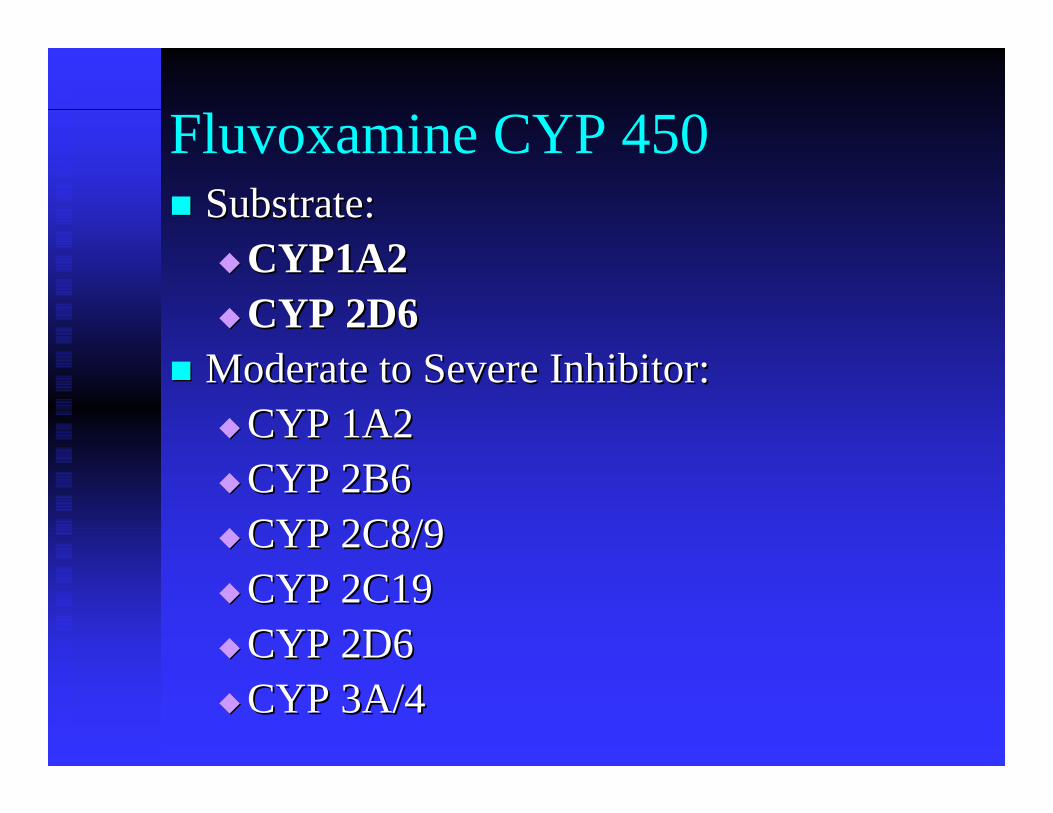
Fluvoxamine CYP 450Substrate: Substrate:
CYP1A2CYP1A2CYPCYP 2D62D6
Moderate to Severe Inhibitor: Moderate to Severe Inhibitor: CYP 1A2CYP 1A2CYP 2B6CYP 2B6CYP 2C8/9CYP 2C8/9CYP 2C19CYP 2C19CYP 2D6CYP 2D6CYP 3A/4CYP 3A/4
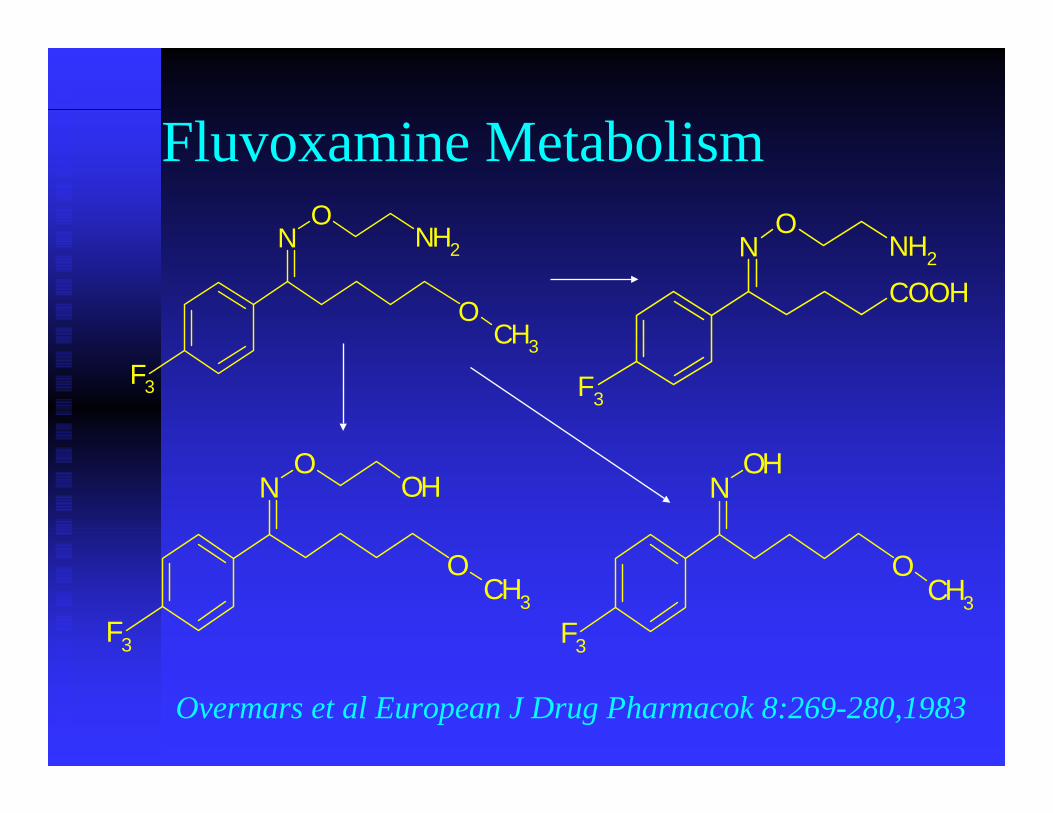
Fluvoxamine Metabolism
F3
NO
NH2
OCH3
F3
NO
OH
OCH3
F3
NOH
OCH3
F3
NO
NH2
COOH
Overmars et al European J Drug Pharmacok 8:269-280,1983
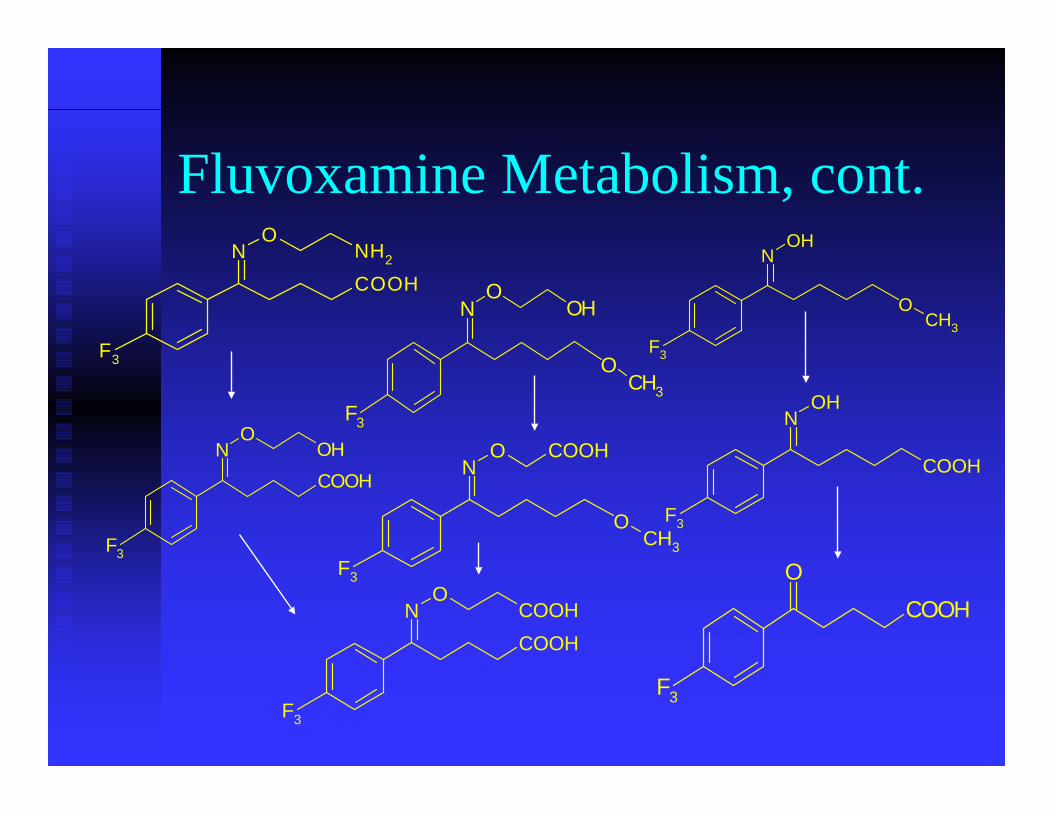
Fluvoxamine Metabolism, cont.
F3
NO
OHCOOH
F3
NO
OH
OCH3
F3
NO COOH
OCH3
F3
NOH
OCH3
F3
NOH
COOH
F3
NO
NH2
COOH
F3
NO
COOHCOOH
F3
OCOOH
10.00 11.00 12.00 13.00 14.00 15.00 16.00 17.00 18.00 19.00
50000
100000
150000
200000
250000
300000
350000
400000
450000
500000
550000
600000
650000
700000
Time-->
Abundance
TIC: 15763.D
m-C
CP
mep
erid
ine
norm
eper
idin
eIS
TDC
affe
ine
Fluv
oxam
ine
Traz
adon
e
prom
etha
zine
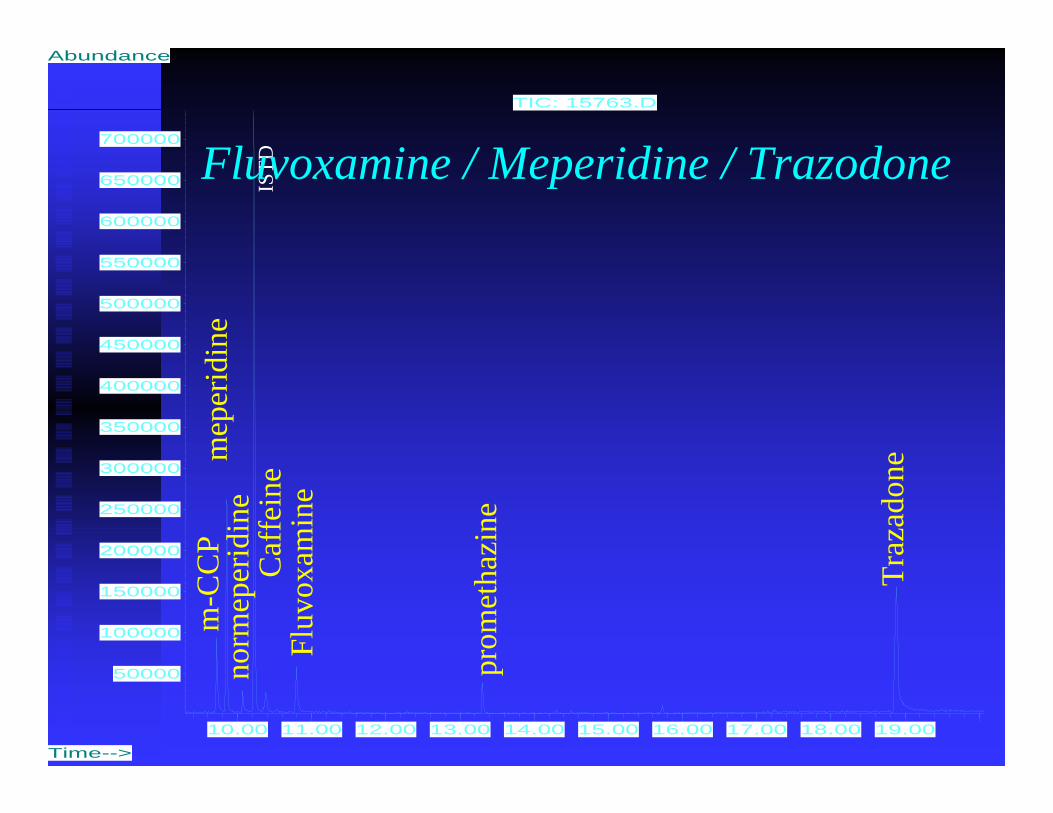
Fluvoxamine / Meperidine / Trazodone
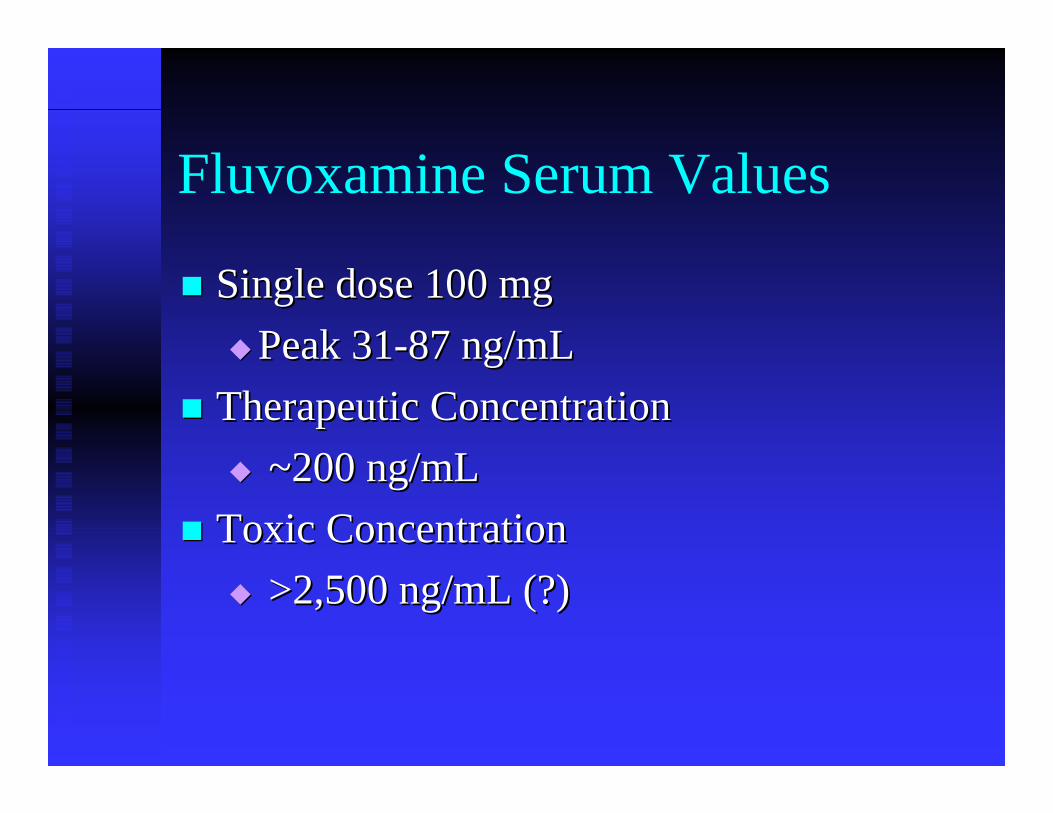
Fluvoxamine Serum Values
Single dose 100 mgSingle dose 100 mgPeak 31Peak 31--87 ng/mL87 ng/mL
Therapeutic ConcentrationTherapeutic Concentration~200 ng/mL ~200 ng/mL
Toxic ConcentrationToxic Concentration>2,500 ng/mL (?)>2,500 ng/mL (?)
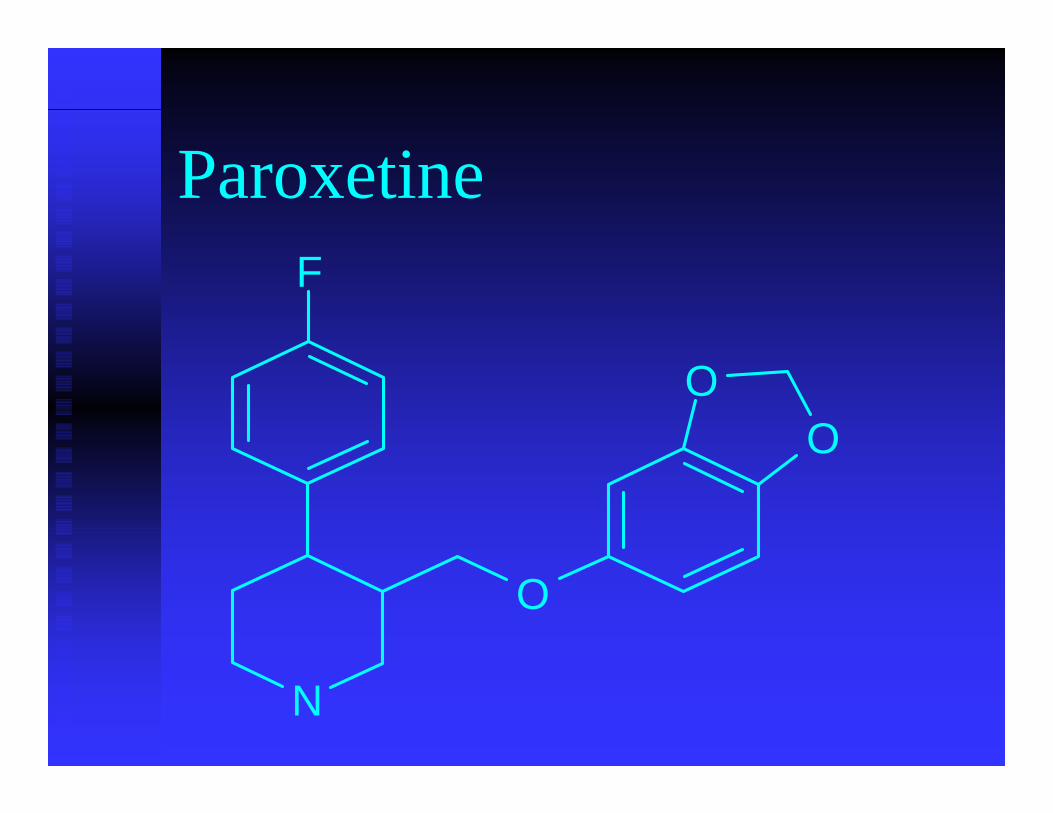
Paroxetine
OO
O
N
F
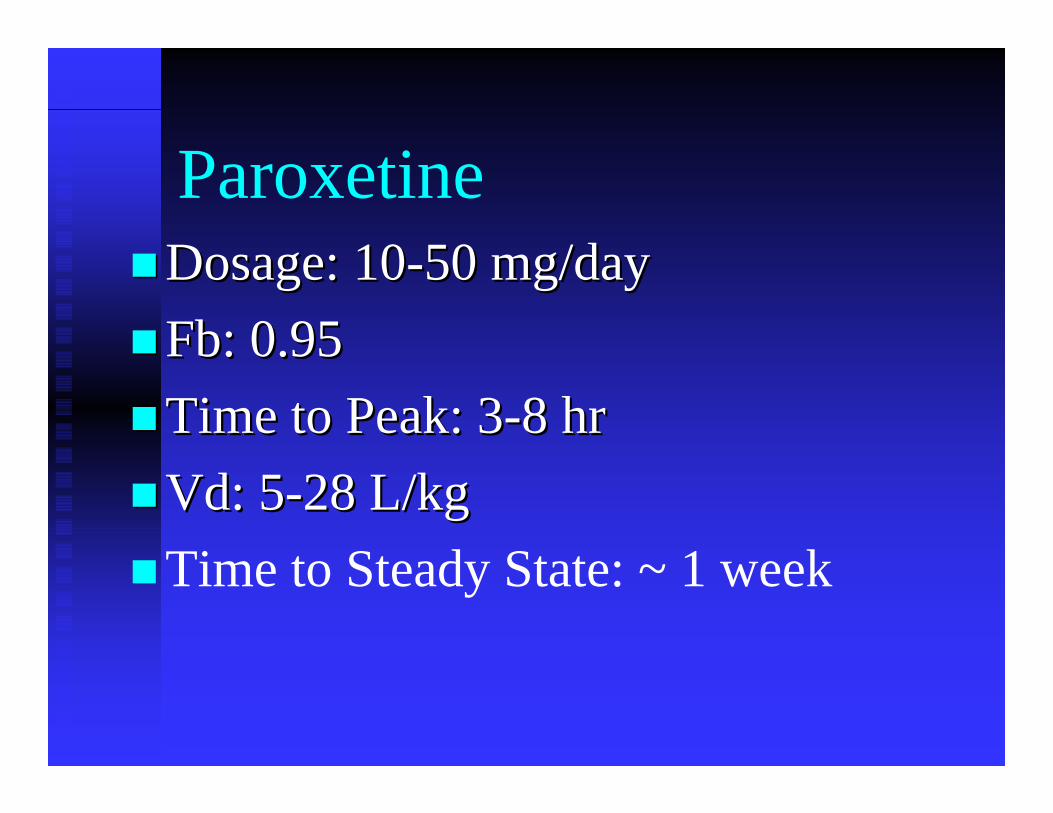
ParoxetineDosage: 10Dosage: 10--50 mg/day50 mg/dayFbFb: 0.95: 0.95Time to Peak: 3Time to Peak: 3--8 hr8 hrVdVd: 5: 5--28 L/kg28 L/kgTime to Steady State: ~ 1 week
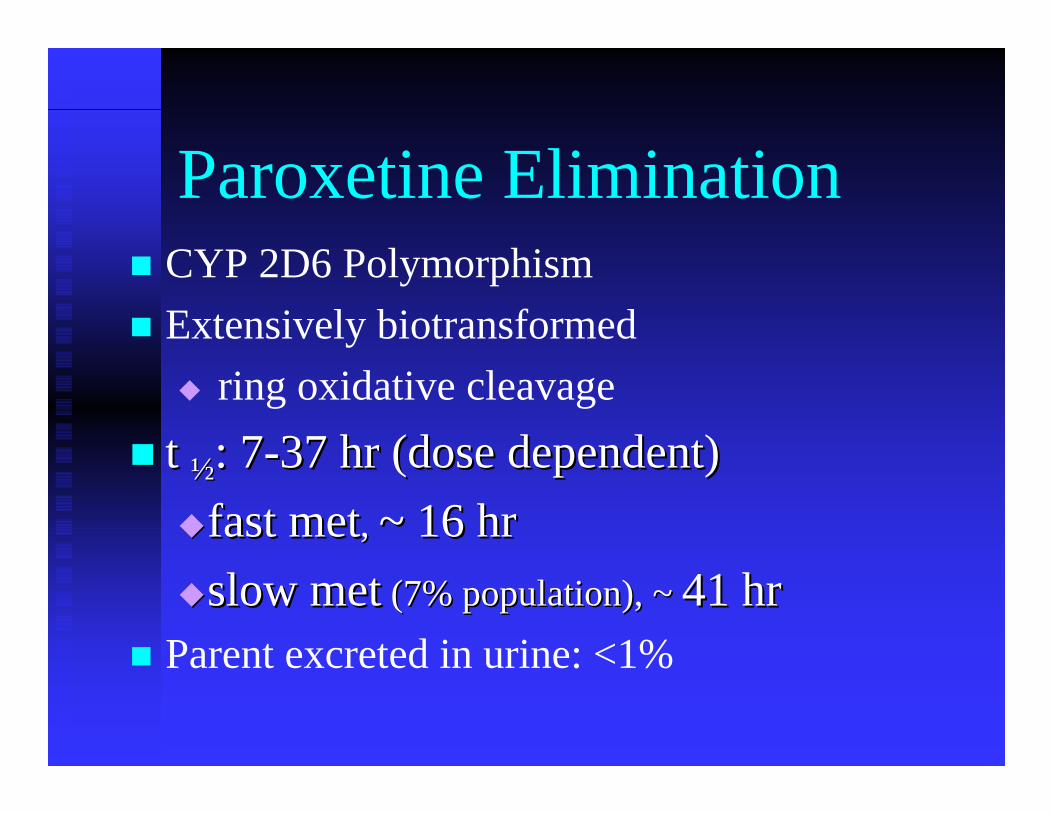
Paroxetine EliminationCYP 2D6 Polymorphism Extensively biotransformed
ring oxidative cleavage
t t ½½: 7: 7--37 hr (dose dependent) 37 hr (dose dependent) fast metfast met, , ~ 16 hr ~ 16 hr slow metslow met (7% population), ~ (7% population), ~ 41 hr41 hr
Parent excreted in urine: <1%
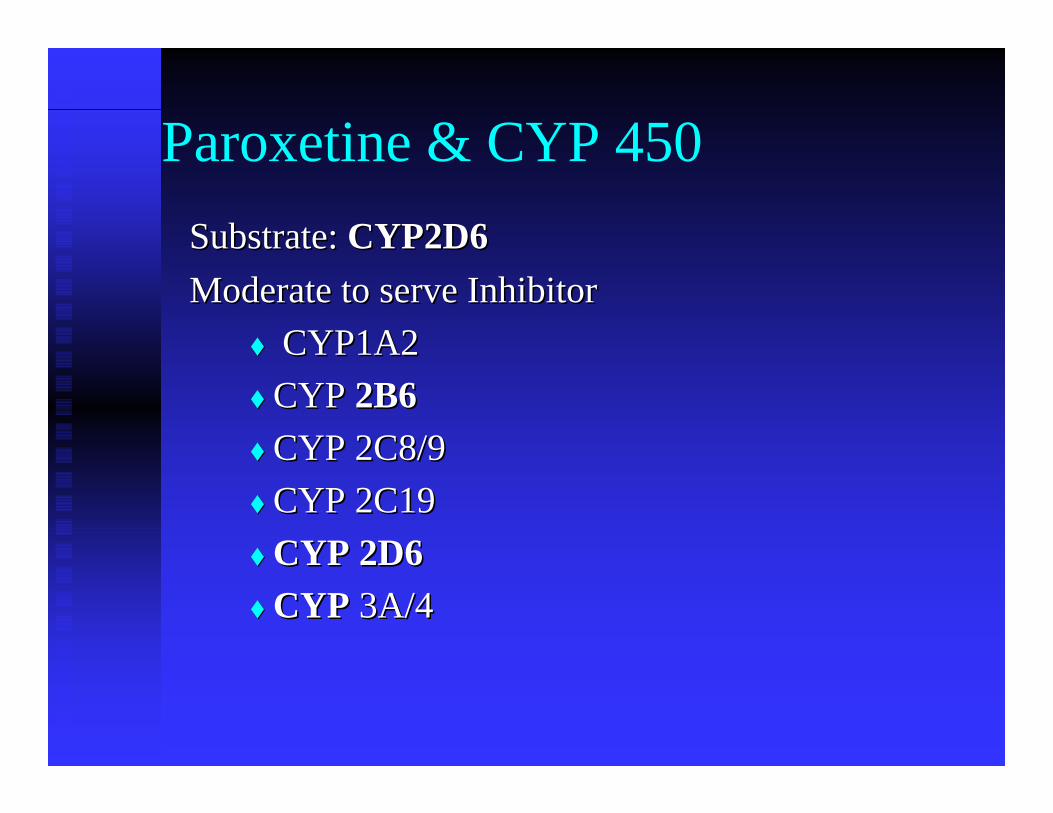
Paroxetine & CYP 450Substrate: Substrate: CYP2D6 CYP2D6 Moderate to serve InhibitorModerate to serve Inhibitor
CYP1A2 CYP1A2 CYP CYP 2B62B6CYP 2C8/9CYP 2C8/9CYP 2C19CYP 2C19CYP 2D6 CYP 2D6 CYP CYP 3A/43A/4
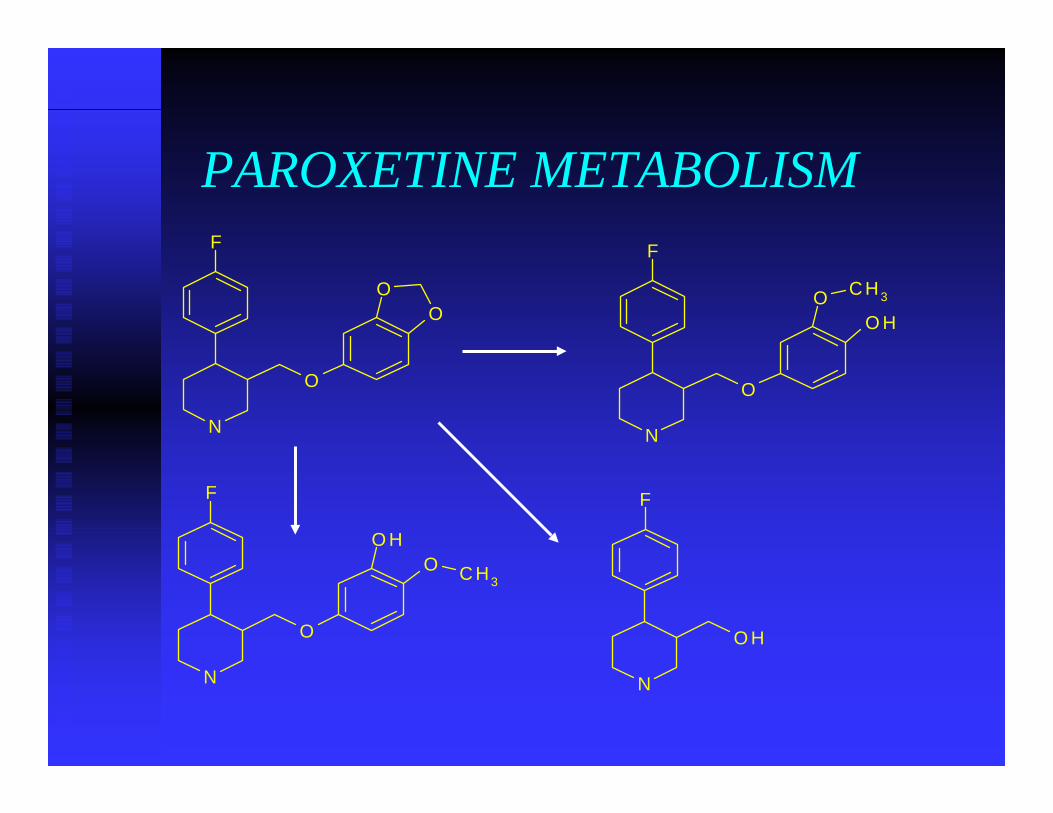
PAROXETINE METABOLISM
OO
O
N
F
O H
O
N
F
O C H3
O HO
O
N
F
C H3
O H
N
F
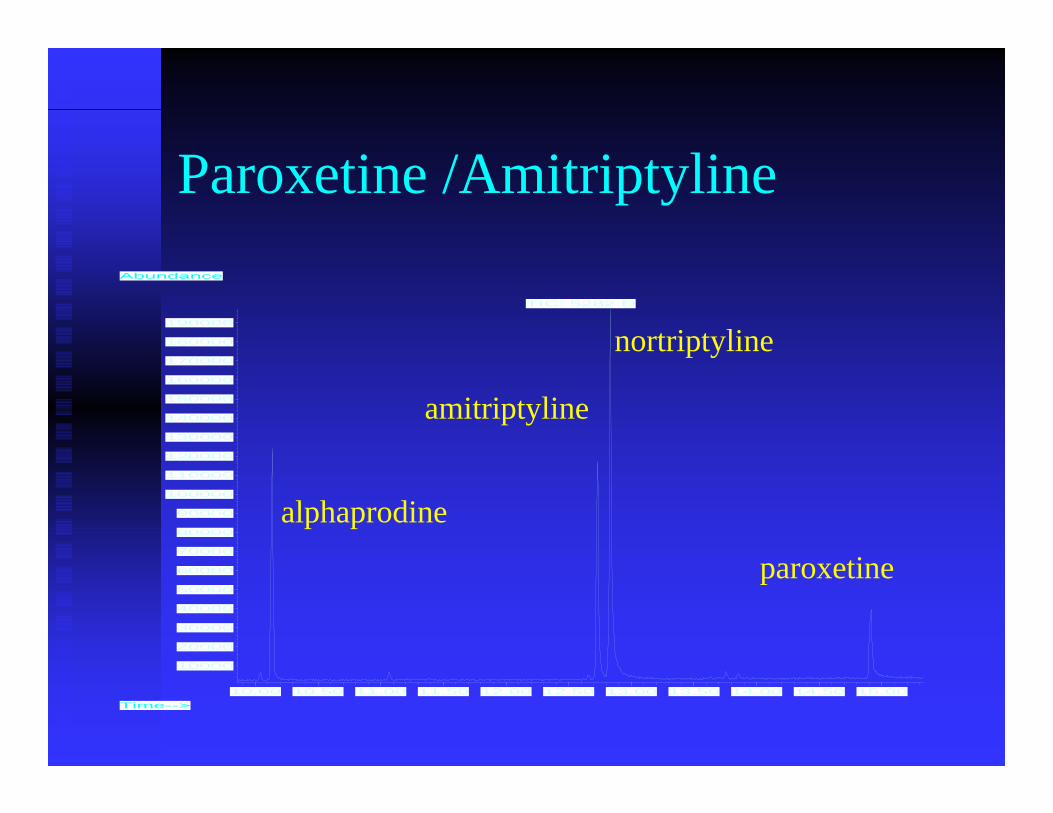
Paroxetine /Amitriptyline
10.00 10.50 11.00 11.50 12.00 12.50 13.00 13.50 14.00 14.50 15.00
10000
20000
30000
40000
50000
60000
70000
80000
90000
100000
110000
120000
130000
140000
150000
160000
170000
180000
190000
Time-->
Abundance
TIC: 5282.D
alphaprodine
amitriptyline
nortriptyline
paroxetine
9.50 10.00 10.50 11.00 11.50 12.00 12.50 13.00 13.50 14.00 14.50 15.00
50000
100000
150000
200000
250000
300000
350000
400000
450000
Time-->
Abundance
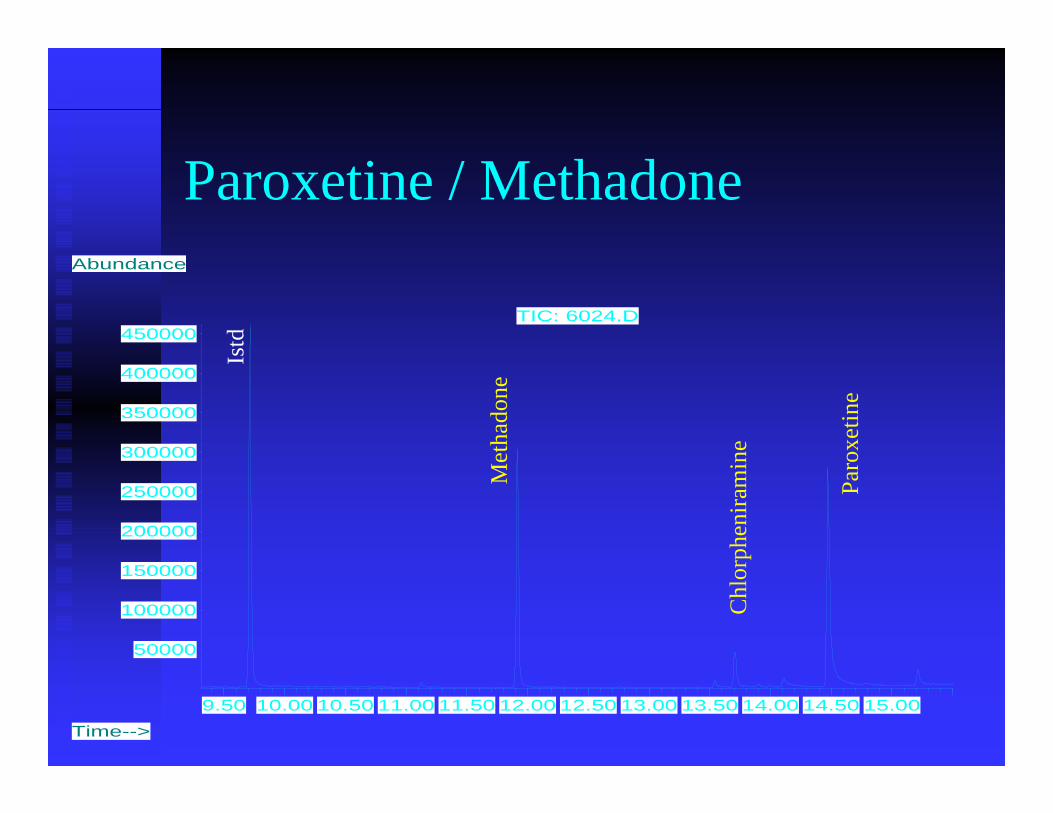
TIC: 6024.D
Istd
Met
hado
ne
Chl
orph
enira
min
e
Paro
xetin
e
Paroxetine / Methadone
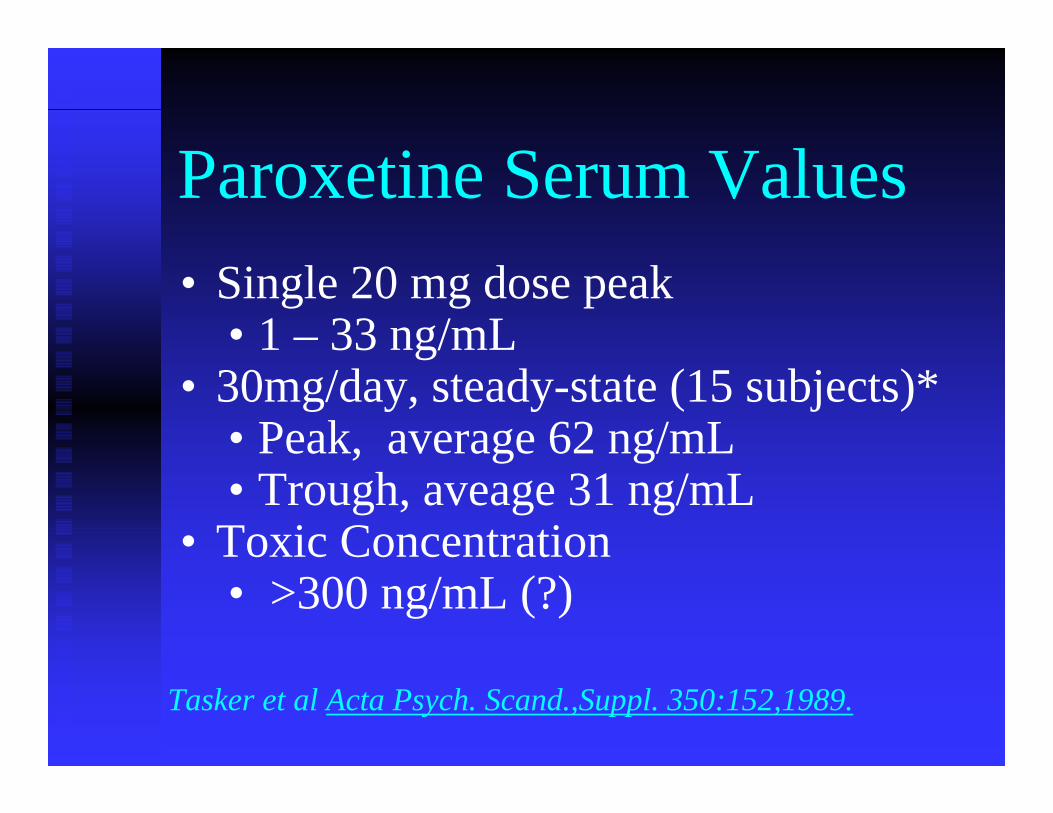
Paroxetine Serum Values• Single 20 mg dose peak
• 1 – 33 ng/mL • 30mg/day, steady-state (15 subjects)*
• Peak, average 62 ng/mL• Trough, aveage 31 ng/mL
• Toxic Concentration• >300 ng/mL (?)
Tasker et al Acta Psych. Scand.,Suppl. 350:152,1989.
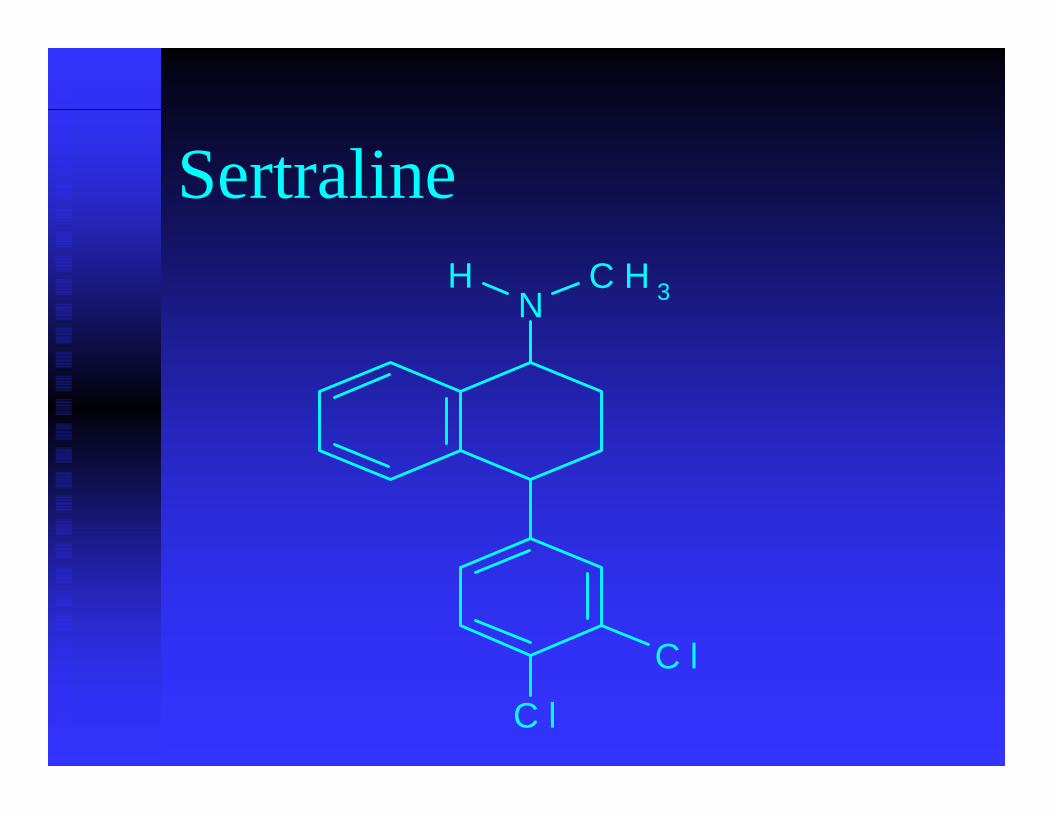
Sertraline
NC H 3
C l
C l
H
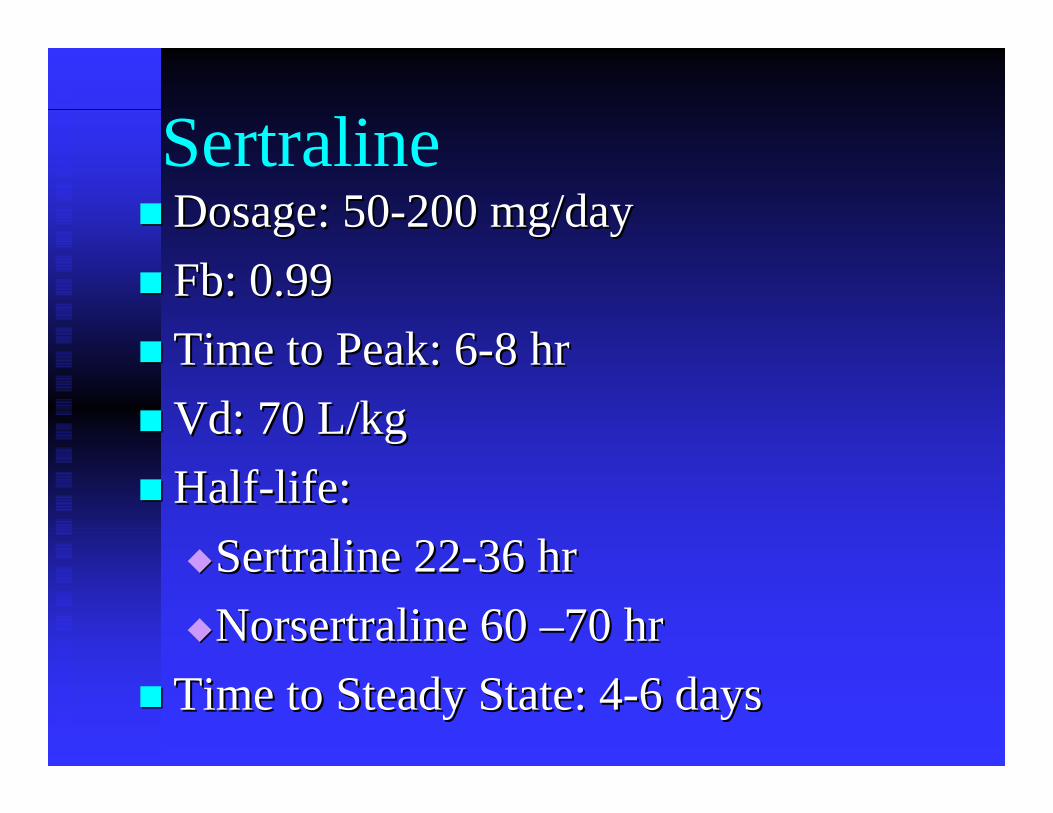
SertralineDosage: 50Dosage: 50--200 mg/day200 mg/dayFbFb: 0.99: 0.99Time to Peak: 6Time to Peak: 6--8 hr8 hrVdVd: 70 L/kg: 70 L/kgHalfHalf--life: life:
SertralineSertraline 2222--36 hr36 hrNorsertraline Norsertraline 60 60 ––70 hr 70 hr
Time to Steady State: 4Time to Steady State: 4--6 days6 days
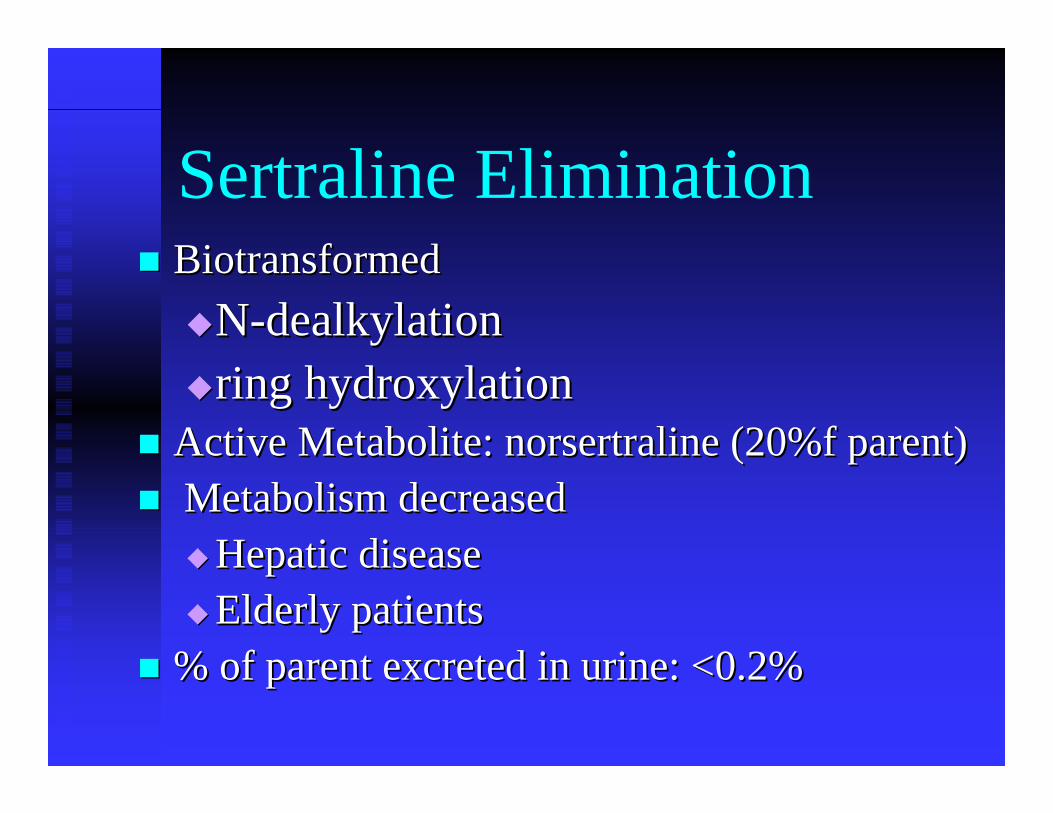
Sertraline EliminationBiotransformed Biotransformed
NN--dealkylationdealkylationring hydroxylationring hydroxylation
Active Metabolite: Active Metabolite: norsertraline norsertraline (20%f parent)(20%f parent)Metabolism decreasedMetabolism decreased
Hepatic diseaseHepatic diseaseElderly patientsElderly patients
% of parent excreted in urine: <0.2%% of parent excreted in urine: <0.2%
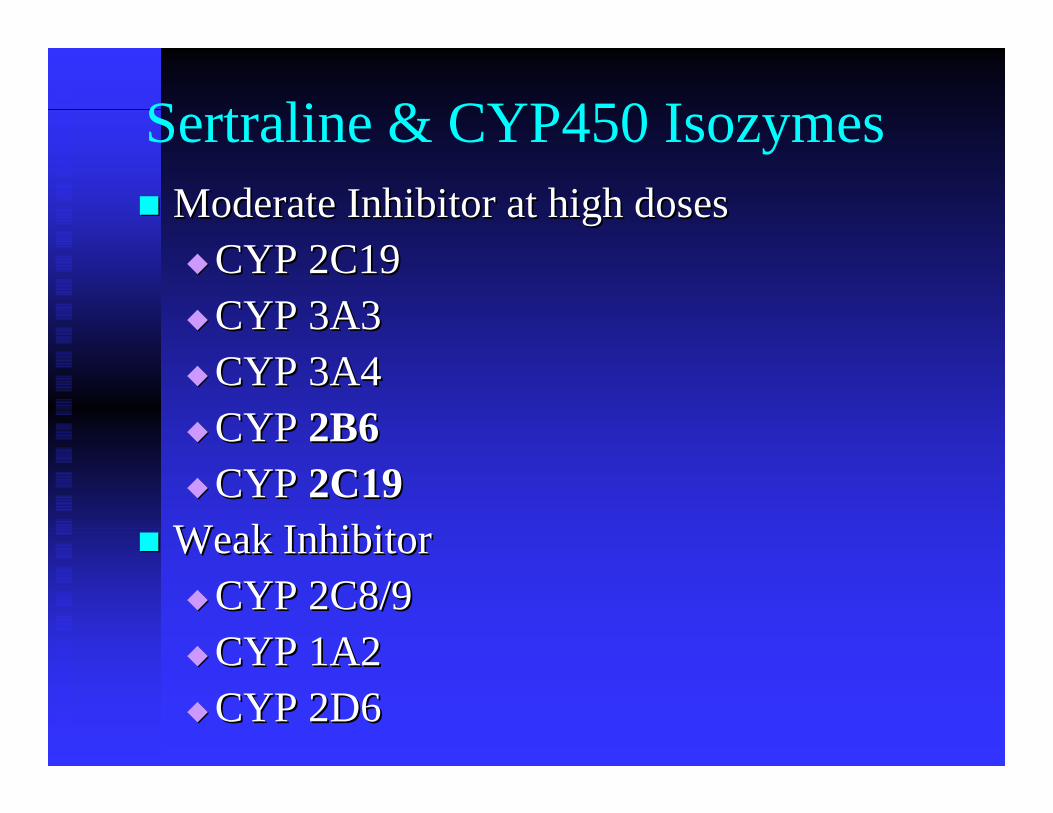
Sertraline & CYP450 IsozymesModerate Inhibitor at high dosesModerate Inhibitor at high doses
CYP 2C19CYP 2C19CYP 3A3CYP 3A3CYP 3A4 CYP 3A4 CYP CYP 2B62B6CYP CYP 2C192C19
Weak InhibitorWeak InhibitorCYP 2C8/9 CYP 2C8/9 CYP 1A2CYP 1A2CYP 2D6 CYP 2D6
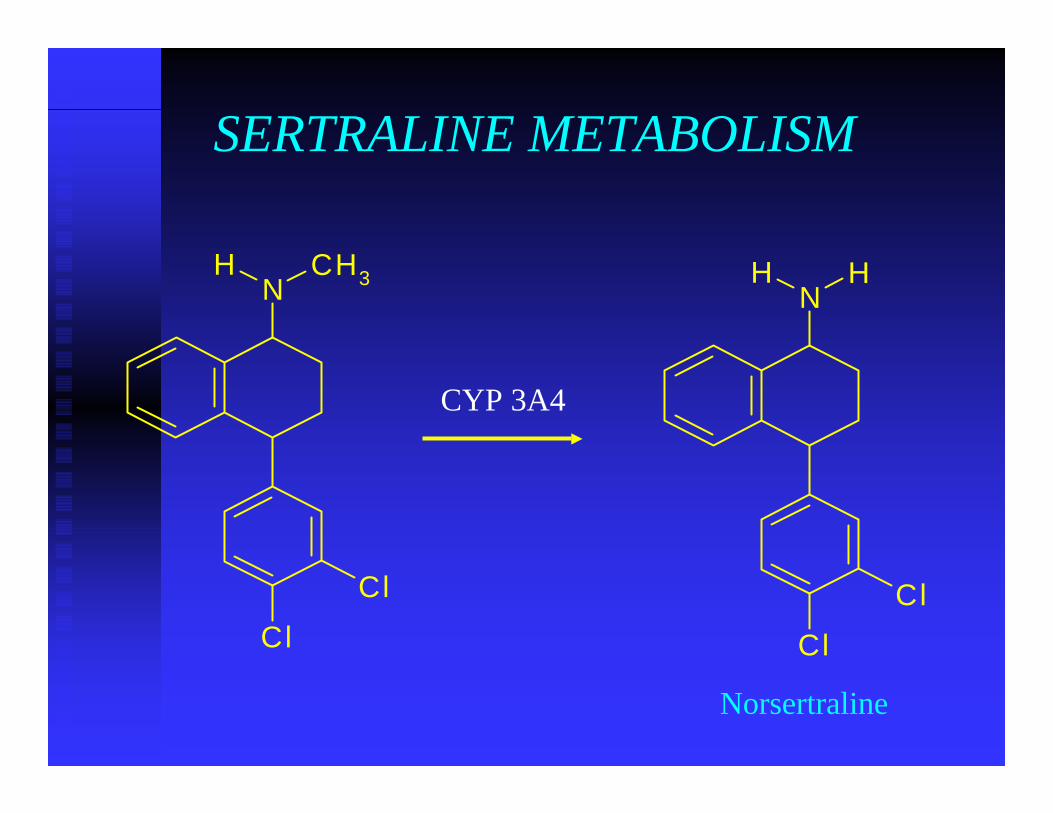
SERTRALINE METABOLISM
NCH3
Cl
Cl
HN
H
Cl
Cl
H
Norsertraline
CYP 3A4
10.00 10.50 11.00 11.50 12.00 12.50 13.00 13.50 14.00 14.50
50000
100000
150000
200000
250000
300000
350000
400000
450000
500000
550000
600000
650000
700000
Time-->
Abundance
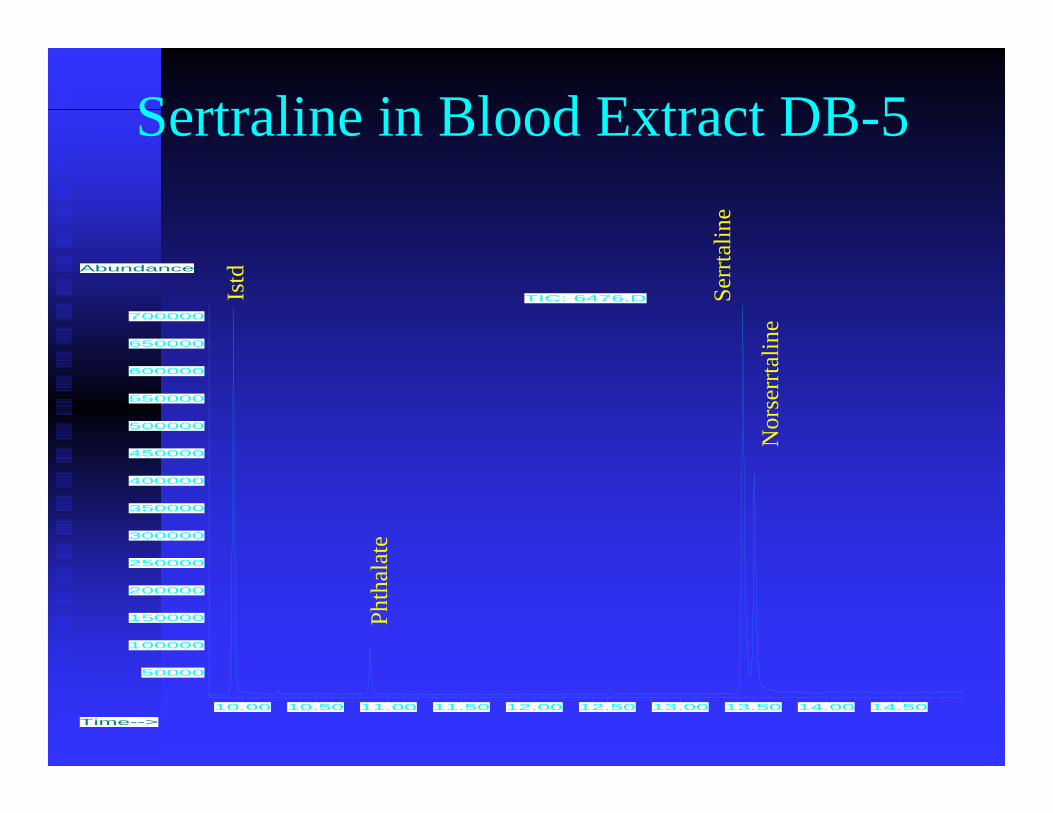
TIC: 6476.D
Phth
alat
e
Istd
Serr
talin
e
Nor
serr
talin
e
Sertraline in Blood Extract DB-5
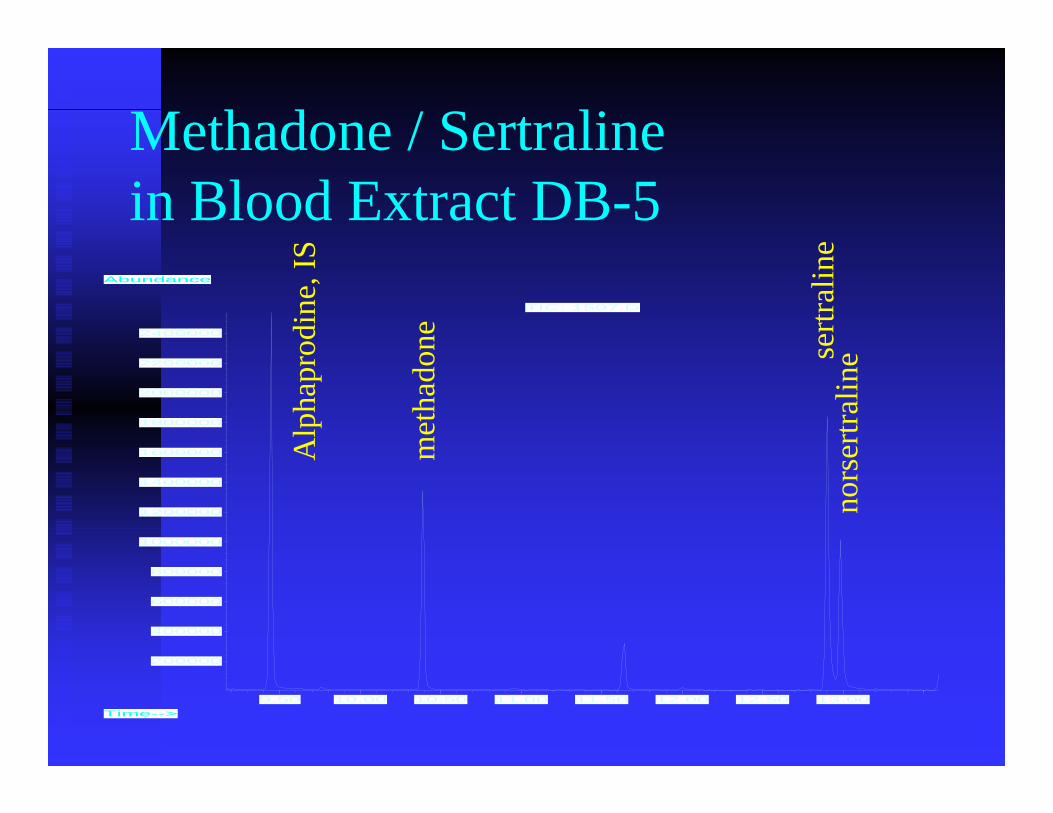
Methadone / Sertralinein Blood Extract DB-5
9.50 10.00 10.50 11.00 11.50 12.00 12.50 13.00
200000
400000
600000
800000
1000000
1200000
1400000
1600000
1800000
2000000
2200000
2400000
Time-->
Abundance
TIC: 1507.DA
lpha
prod
ine,
IS
met
hado
ne sertr
alin
eno
rser
tralin
e
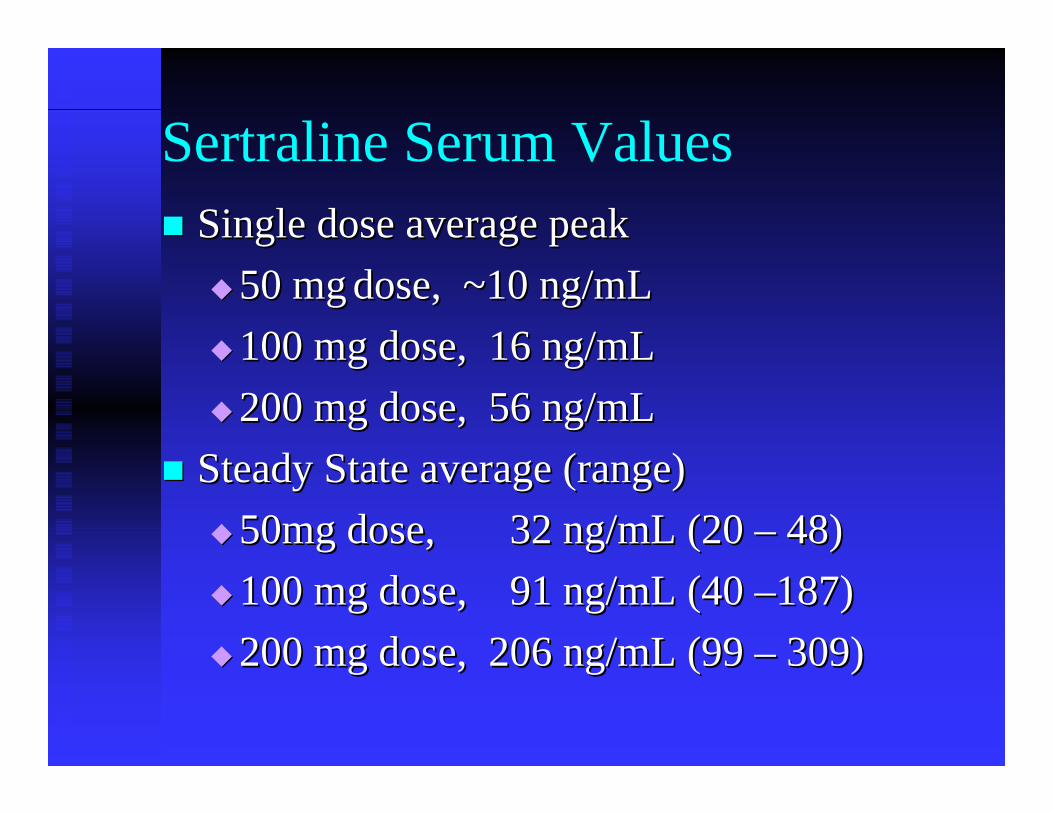
Sertraline Serum ValuesSingle dose average peakSingle dose average peak
50 mg50 mg dose, ~10 ng/mLdose, ~10 ng/mL100 mg dose, 16 ng/mL100 mg dose, 16 ng/mL200 mg dose, 56 ng/mL 200 mg dose, 56 ng/mL
Steady State average (range)Steady State average (range)50mg dose, 32 ng/mL (20 50mg dose, 32 ng/mL (20 –– 48)48)100 mg dose, 91 ng/mL (40 100 mg dose, 91 ng/mL (40 ––187)187)200 mg dose, 206 ng/mL (99 200 mg dose, 206 ng/mL (99 –– 309) 309)
N ON
F
N
N
O
CH3
N ON
F
N
N
O
CH3
OH
N OHO
F
N
N
O
CH3
N
N
O
CH3
COOH
N ON
F
N
N
O
CH3
OH
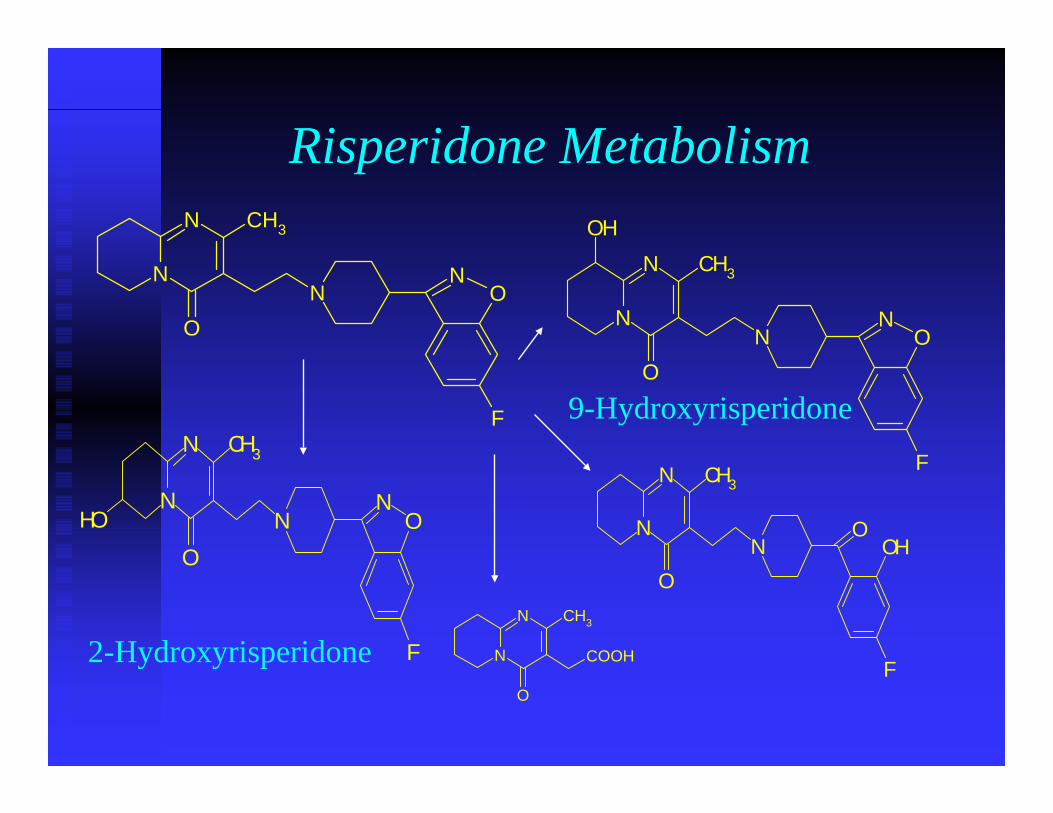
Risperidone Metabolism
2-Hydroxyrisperidone
9-Hydroxyrisperidone

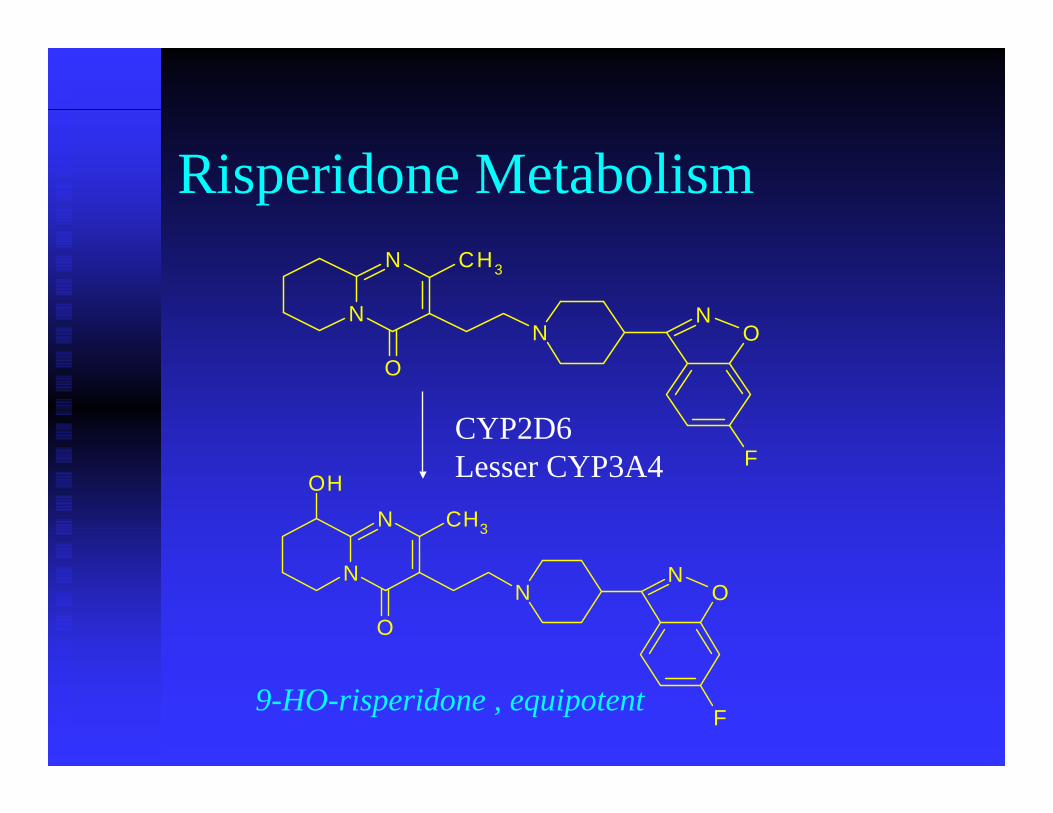
Risperidone Metabolism
N ON
F
N
N
O
CH3
N ON
F
N
N
O
CH3
OH
9-HO-risperidone , equipotent
CYP2D6Lesser CYP3A4
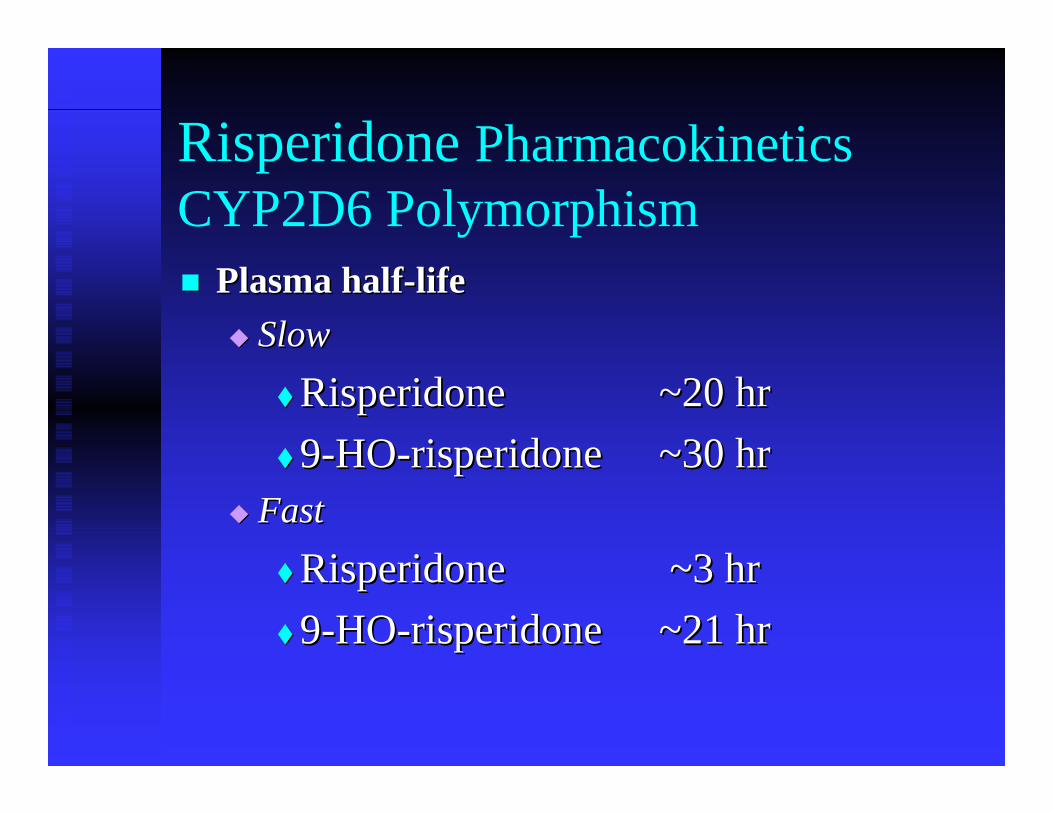
Risperidone PharmacokineticsCYP2D6 Polymorphism
Plasma halfPlasma half--lifelifeSlowSlow
RisperidoneRisperidone ~20 hr~20 hr99--HOHO--risperidonerisperidone ~30 hr ~30 hr
FastFast
RisperidoneRisperidone ~3 hr~3 hr99--HOHO--risperidonerisperidone ~21 hr~21 hr
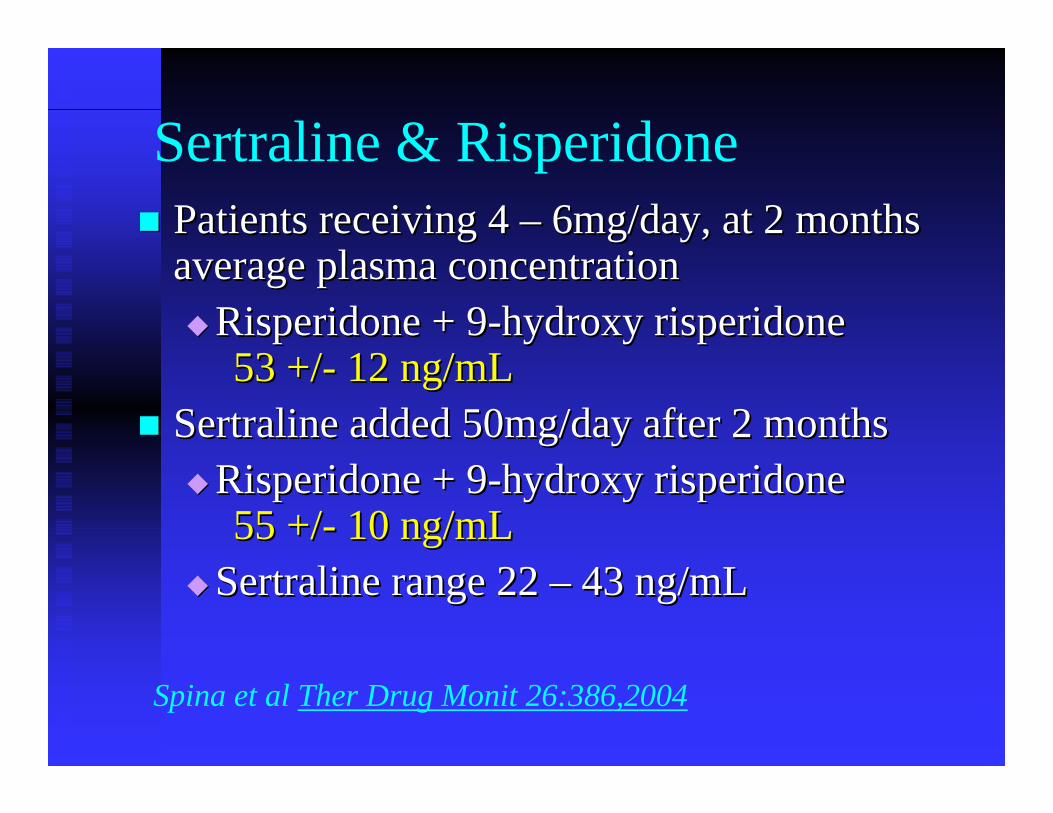
Sertraline & RisperidonePatients receiving 4 Patients receiving 4 –– 6mg/day, at 2 months 6mg/day, at 2 months average plasma concentrationaverage plasma concentration
Risperidone Risperidone + 9+ 9--hydroxy risperidonehydroxy risperidone53 +/53 +/-- 12 ng/mL12 ng/mL
Sertraline Sertraline added 50mg/day after 2 monthsadded 50mg/day after 2 monthsRisperidoneRisperidone + 9+ 9--hydroxy risperidonehydroxy risperidone55 +/55 +/-- 10 ng/mL10 ng/mL
Sertraline Sertraline range 22 range 22 –– 43 ng/mL43 ng/mL
Spina et al Ther Drug Monit 26:386,2004
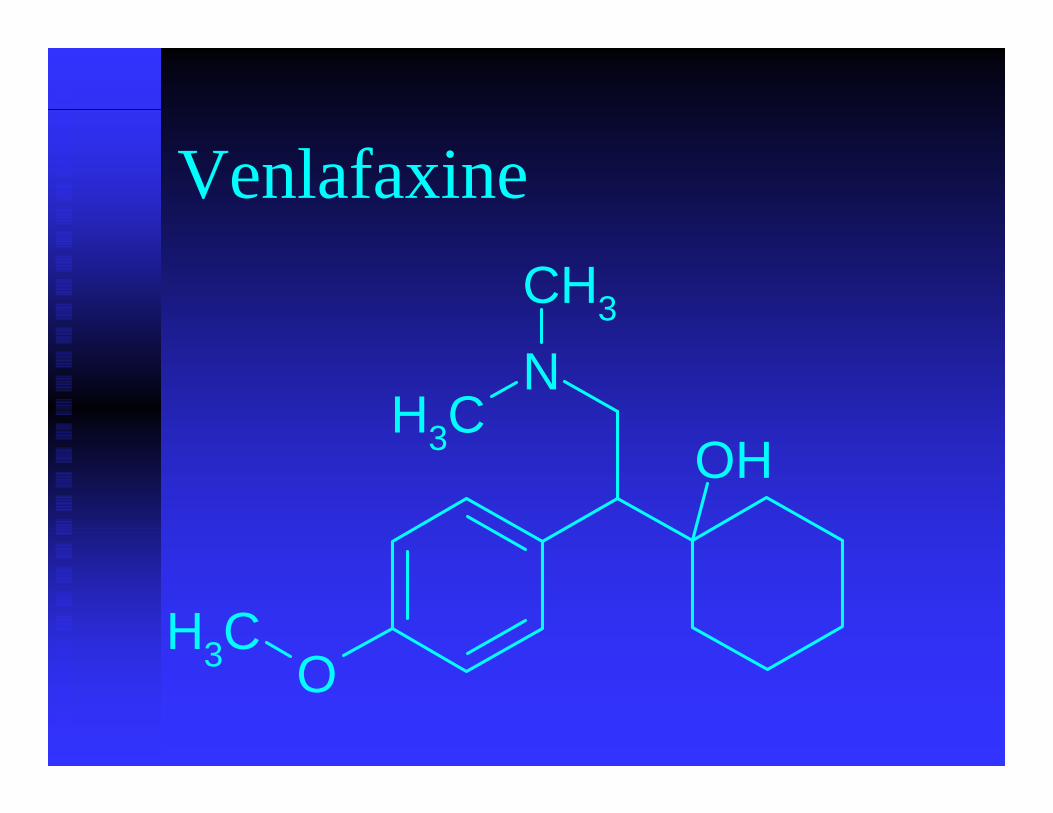
Venlafaxine
OCH3
OH
NCH3
CH3
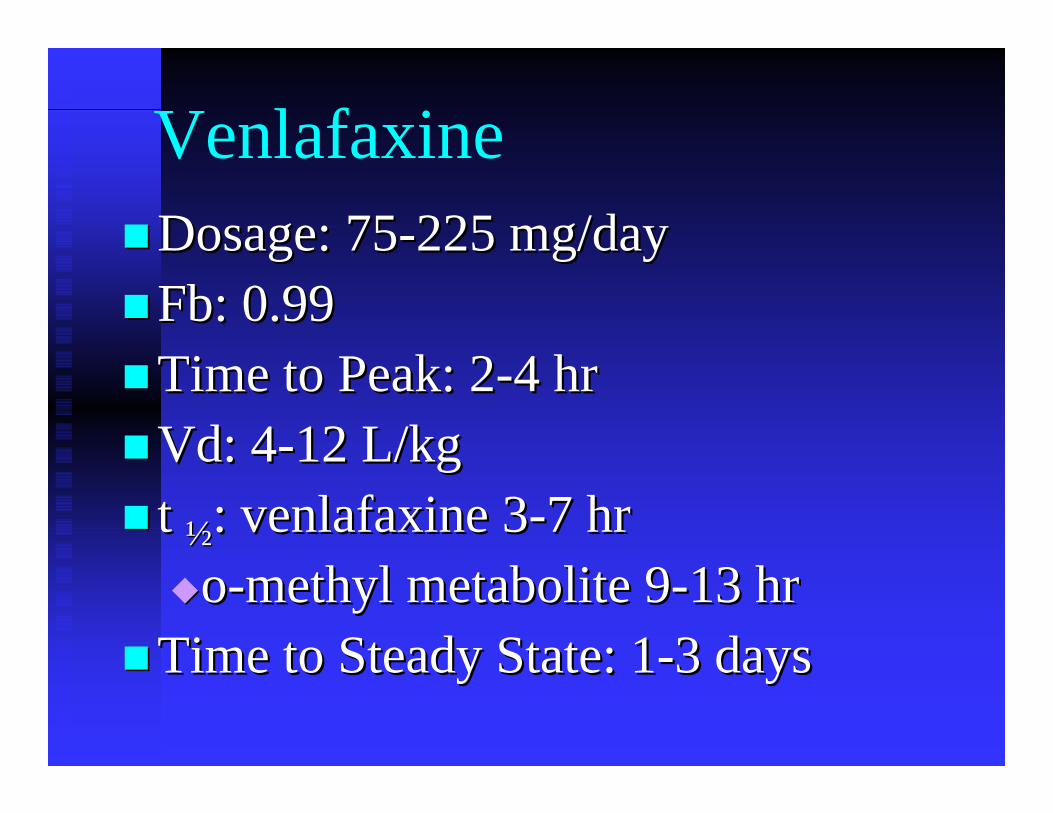
VenlafaxineDosage: 75Dosage: 75--225 mg/day225 mg/dayFbFb: 0.99: 0.99Time to Peak: 2Time to Peak: 2--4 hr4 hrVdVd: 4: 4--12 L/kg12 L/kgt t ½½: : venlafaxinevenlafaxine 33--7 hr 7 hr
oo--methyl metabolite 9methyl metabolite 9--13 hr13 hrTime to Steady State: 1Time to Steady State: 1--3 days3 days
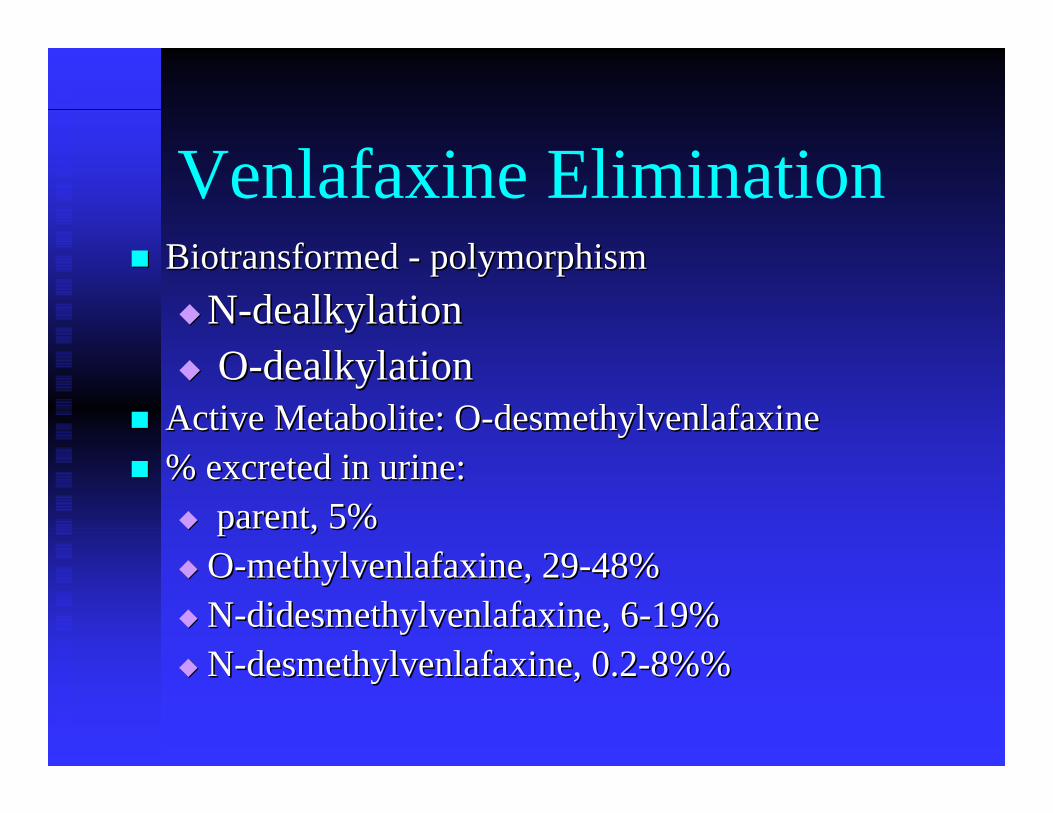
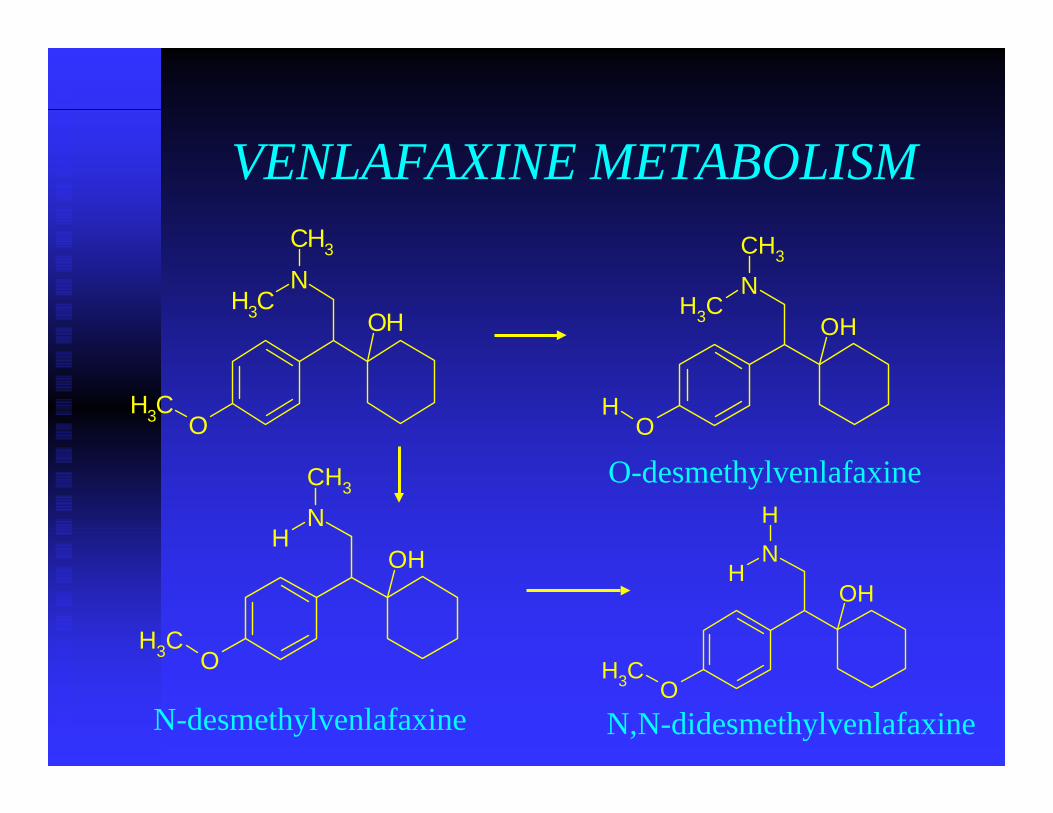
Venlafaxine EliminationBiotransformed Biotransformed -- polymorphism polymorphism
NN--dealkylationdealkylationOO--dealkylationdealkylation
Active Metabolite: OActive Metabolite: O--desmethylvenlafaxine desmethylvenlafaxine % excreted in urine: % excreted in urine:
parent, 5%parent, 5%OO--methylvenlafaxinemethylvenlafaxine, 29, 29--48%48%NN--didesmethylvenlafaxinedidesmethylvenlafaxine, 6, 6--19%19%NN--desmethylvenlafaxinedesmethylvenlafaxine, 0.2, 0.2--8%%8%%
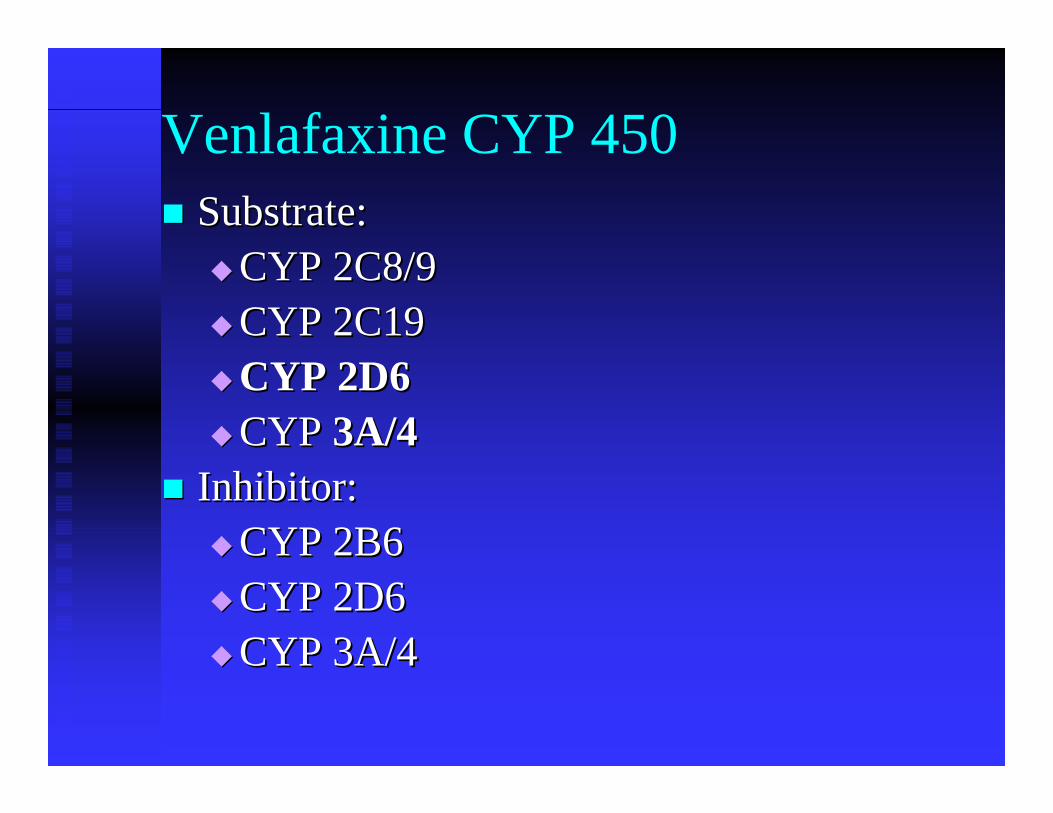
Venlafaxine CYP 450Substrate: Substrate:
CYP 2C8/9CYP 2C8/9CYP 2C19CYP 2C19CYP 2D6CYP 2D6CYP CYP 3A/43A/4
Inhibitor: Inhibitor: CYP 2B6CYP 2B6CYP 2D6CYP 2D6CYP 3A/4CYP 3A/4
VENLAFAXINE METABOLISM
OCH3
OH
NCH3
CH3
OCH3
OH
NCH3
H
OH
OH
NCH3
CH3
N-desmethylvenlafaxine
O-desmethylvenlafaxine
OCH3
OH
NH
H
N,N-didesmethylvenlafaxine
10.00 10.50 11.00 11.50 12.00 12.50 13.00 13.50 14.00 14.50
100000
200000
300000
400000
500000
600000
700000
800000
900000
1000000
1100000
Time-->
Abundance
TIC: 8811.D
ISTD
venl
afax
ine
diaz
epam
nord
iaze
pam
n-de
smet
hylv
enla
faxi
ne
o-de
smet
hylv
enla
faxi
ne
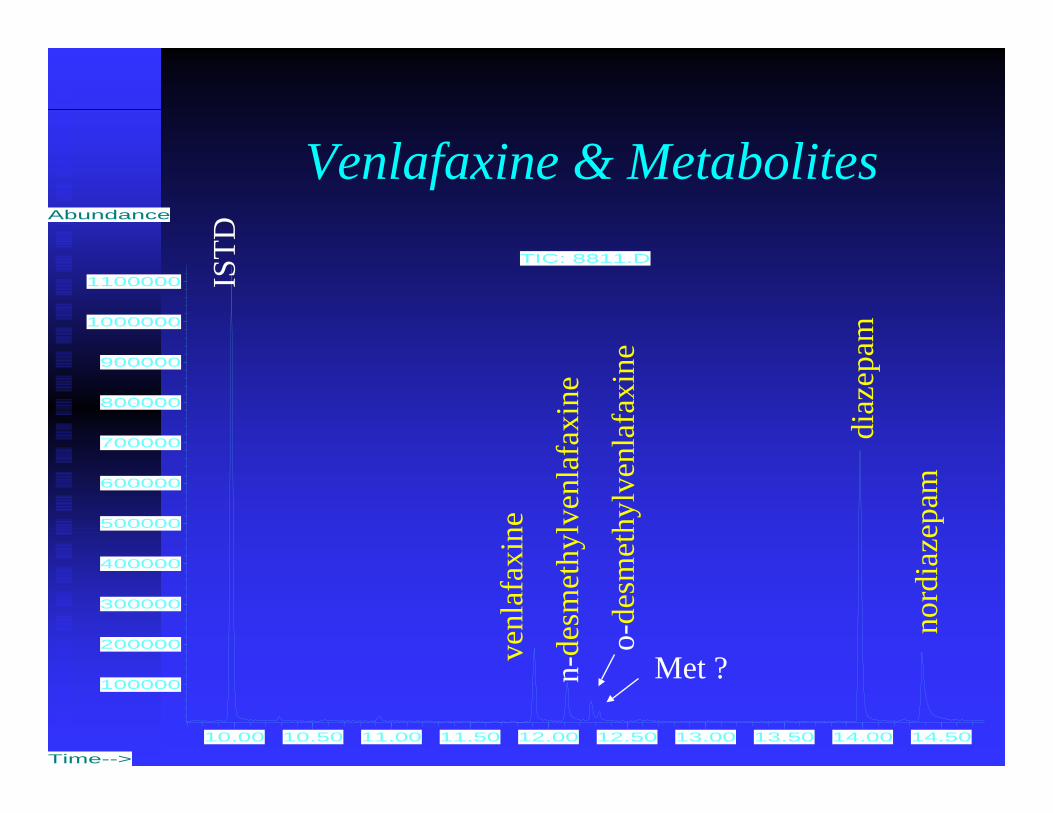
Venlafaxine & Metabolites
Met ?
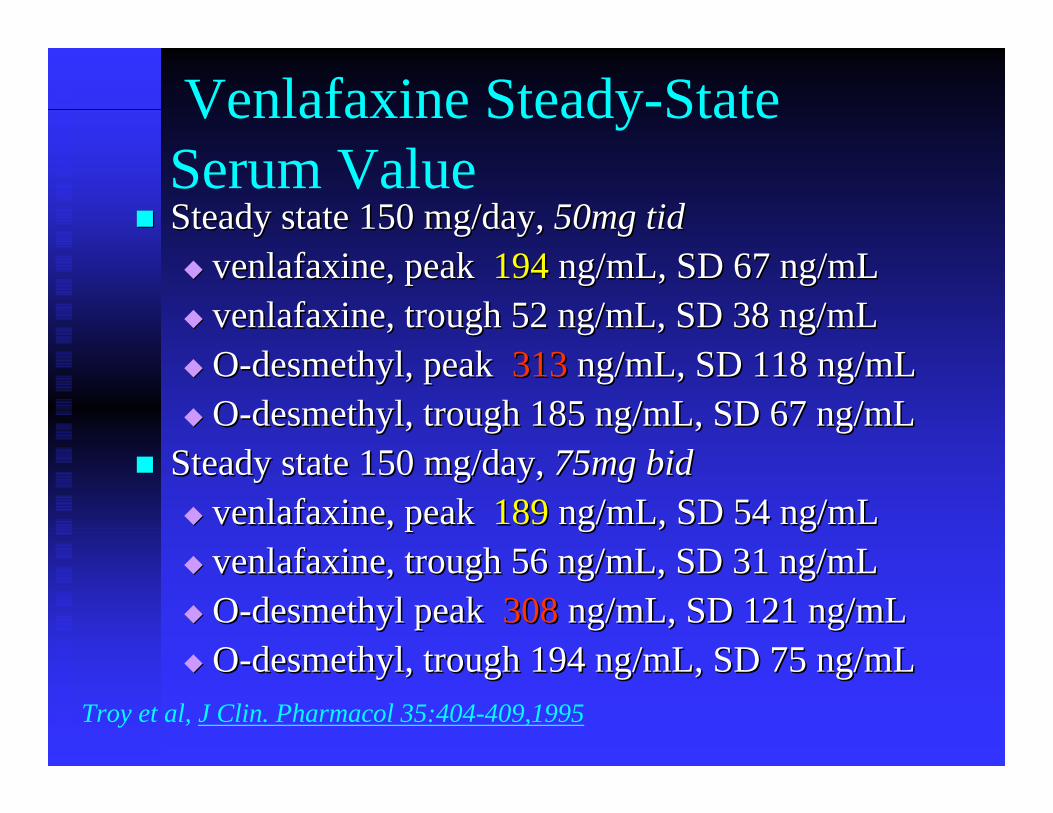
Venlafaxine Steady-State Serum ValueSteady state 150 mg/day, Steady state 150 mg/day, 50mg 50mg tidtid
venlafaxinevenlafaxine, peak , peak 194194 ng/mL, SD 67 ng/mLng/mL, SD 67 ng/mLvenlafaxinevenlafaxine, trough 52 ng/mL, SD 38 ng/mL, trough 52 ng/mL, SD 38 ng/mLOO--desmethyldesmethyl, peak , peak 313313 ng/mL, SD 118 ng/mLng/mL, SD 118 ng/mLOO--desmethyldesmethyl, trough 185 ng/mL, SD 67 ng/mL, trough 185 ng/mL, SD 67 ng/mL
Steady state 150 mg/day, Steady state 150 mg/day, 75mg bid75mg bidvenlafaxinevenlafaxine, peak , peak 189 189 ng/mL, SD 54 ng/mLng/mL, SD 54 ng/mLvenlafaxinevenlafaxine, trough 56 ng/mL, SD 31 ng/mL, trough 56 ng/mL, SD 31 ng/mLOO--desmethyldesmethyl peak peak 308308 ng/mL, SD 121 ng/mLng/mL, SD 121 ng/mLOO--desmethyldesmethyl, trough 194 ng/mL, SD 75 ng/mL, trough 194 ng/mL, SD 75 ng/mL
Troy et al, J Clin. Pharmacol 35:404-409,1995
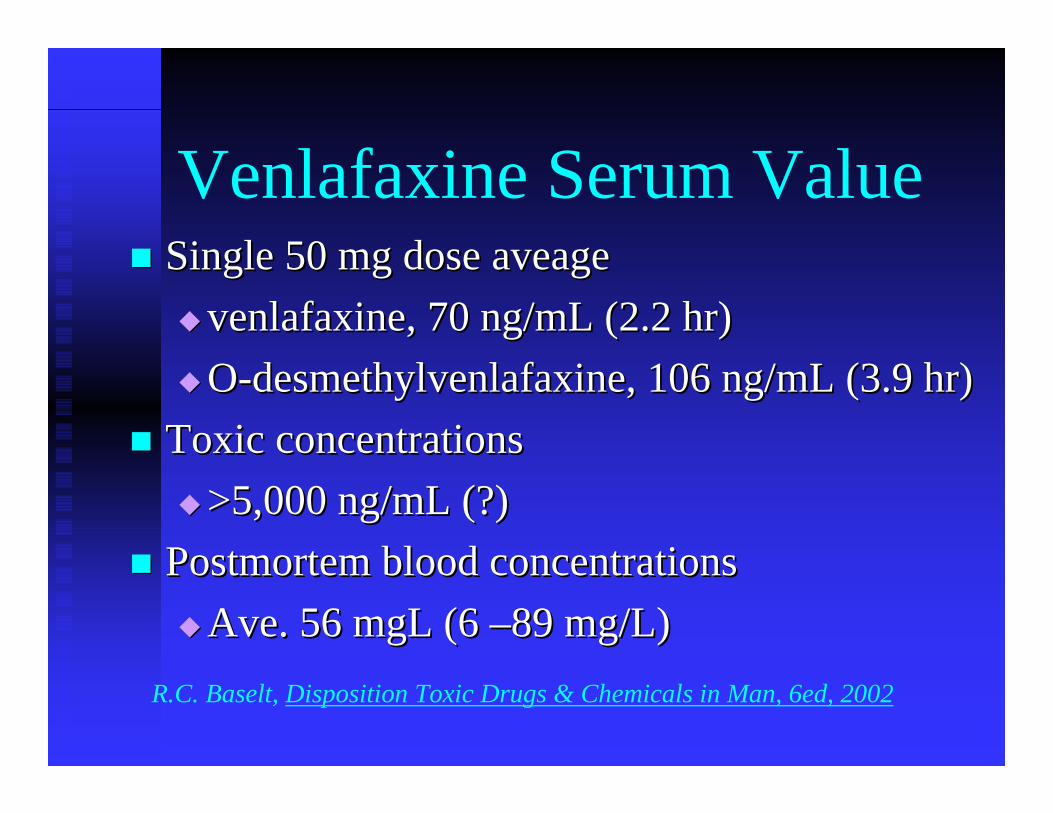
Venlafaxine Serum ValueSingle 50 mg doseSingle 50 mg dose aveageaveage
venlafaxinevenlafaxine, 70 ng/mL (2.2 hr), 70 ng/mL (2.2 hr)OO--desmethylvenlafaxinedesmethylvenlafaxine, 106 ng/mL (3.9 hr), 106 ng/mL (3.9 hr)
Toxic concentrationsToxic concentrations>5,000 ng/mL (?)>5,000 ng/mL (?)
Postmortem blood concentrationsPostmortem blood concentrationsAve. 56Ave. 56 mgLmgL (6 (6 ––89 mg/L)89 mg/L)
R.C. Baselt, Disposition Toxic Drugs & Chemicals in Man, 6ed, 2002