pharmacokinetic comparison of a combination tablet of enalapril and hydrochlorothiazide with...
TRANSCRIPT
BIOPHARMACEUTICS & DRUG DISPOSITION, VOL. 12, 4 4 7 4 5 5 (1991)
PHARMACOKINETIC COMPARISON OF A COMBINATION TABLET OF ENALAPRIL AND HYDROCHLOROTHIAZIDE WITH ENALAPRIL
AND HYDROCHLOROTHIAZIDE TABLETS ADMINISTERED TOGETHER AND
SEPARATELY
L. G. HOWES*, E. L. CONWAY, P. A . PHILLIPS, J . BROADBEAR, 0. H . DRUMMER AND W. J . LOUIS
Department of Clinical Pharmacology and Therapeutics. Austin Hospital, Heidelberg. Victoria, 3084. Australia
ABSTRACT
Enalapril and hydrochlorothiazide (HCT) are established single agent treatments for mild hypertension and cardiac failure and are a potent combination in more severe or resistant cases. We have compared the pharmacokinetics of enalaprilat (the active metabolite of enalapril) and HCT in a four-way comparison of a combination tablet of enalapril (lOmg)/HCT (25mg) with a single dose of an enalapril tablet (IOmg), a single dose of a HCT tablet (25mg) and simultaneous administration of separate tablets of enalapril(10mg) and HCT (25 mg) in normotensive volunteers (n = 12,21-26 years). Each subject received all four treatments and the study was conducted as a randomized, latin square, open design with at least 1 week washout between studies. Overall, HCT was bioequivalent under all conditions and enalaprilat was bioequivalent when given in combination with HCT either as one tablet or as two separate tablets. However, when given with HCT, the mean AUC and C,, of enalaprilat were reduced up to 20 per cent compared with enalapril administered alone. This is unlikely to be of clinical significance as the differences did not reach statistical significance and the total enalaprilat excreted in the urine over 96 h was similar after all treatments.
KEY WORDS Enalapril Hydrochlorothiaze Combination Pharmacokinetics Healthy Subjects
INTRODUCTION
Enalapril and hydrochlorothiazide (HCT) are both effective first line drugs for the treatment of hypertension and cardiac failure. However, a considerable proportion of patients treated for either of these disorders are not adequately controlled by single agent therapy. In these patients the combined use of enala- pril and HCT is very effective and has found widespread clinical A com- bination tablet comprised of enalapril and HCT would therefore be expected
* Addressee for correspondence.
0142-278219 1106044749$05.00 0 1991 by John Wiley & Sons, Ltd.
Received 1 August I990 Revised 12 February I991
448 L. G . HOWES E T A L .
to have widespread clinical application and have obvious advantages in simpli- fying therapy and aiding patient compliance. In the present study, we have compared the pharmacokinetics of enalaprilat (the active de-esterified metabo- lite of enalapril) and HCT following the acute administration of a novel enala- pril/HCT combination tablet with the pharmacokinetics of enalapril and HCT tablets given either alone or together to normal volunteers to determine the relative bioavailability of the two drugs in the new preparation.
METHODS
Subjects
The study was conducted in 12 healthy, normotensive volunteers aged between 21 and 26 years of age. All subjects underwent a full medical history and physical examination and biochemical, haematological, and ECG screening as well as urinalysis to ensure fitness for this study.
The protocol received approval from the Austin Hospital Ethics Committee and informed written consent was obtained from each participant.
Study design
This study was a randomized, latin square, open design. Each subject was studied on four occasions with a washout period of at least 7 days between studies. No additional medication was allowed from 1 week preceding the first study until after completion of all studies. On each study day, subjects attended the clinic at approximately 0800 h following an overnight (10 h) fast. According to the study design subjects took either:
A: B: Enalapril(l0 mg) only; C: HCT (25 mg) only; D:
Separate tablets of enalapril(l0 mg) and HCT (25 mg);
Enalapril(l0 mg) and HCT (25 mg) combined in the one tablet.
Subjects remained fasting for 2 h following dosing. Standardized meals were provided 4 and 8 h after dosing. No oral fluids were allowed for 2 h after dosing after which water and non-caffeinated beverages were unrestricted. However, a minimum of 250ml of water was consumed by each subject every 2 h for the first 12 h to ensure adequate urine production. No strenuous physical activity was allowed during the plasma sampling periods of the study.
During each pharmacokinetic study, blood samples for drug levels were obtained at the following points: baseline, 0-5, 1, 1.5, 2, 3, 4, 6, 8, 12, 24, 32, 48, and 72 h: a total of 14 collections. Samples taken during the first 12h were collected via an indwelling intravenous cannula in a forearm vein, while the 24,32,48, and 72 h samples were obtained by venepuncture.
ENALAPRIL 449
Blood pressure and pulse rate, each taken in both standing and supine posi- tions, were measured in duplicate using a Dinamap sphygmomanometer at the blood sampling times immediately prior to actual blood collection. Urine was collected for the intervals: - 1 4 , 0-1, 1-2, 2 4 4 4 , 6 4 3 , 8-12, 12-24, 24- 48,48-72, and 72-96 h to determine excretion rates for enalaprilat and HCT.
Freshly drawn blood (l(L15ml) was collected in heparin tubes and centri fuged at 1000 X g (5°C) to separate plasma. Blood and urine samples (not identi- fied by treatment) were assayed for enalaprilat and HCT. Enalaprilat was assayed by radioimmunoassay according to the method of Worland and Jar- r ~ t t . ~ The antibody used was highly specific for enalaprilat and lisinopril, and the detection limit of the assay was 2 ng m1-I. The assay was linear over the range 2-200 ng ml-', but concentrations greater than 100 ng ml-' were diluted in assay buffer prior to assay. The intra-assay variability (coefficient of variation) was 13.6 per cent, 4.2 per cent, and 4.6 per cent at 5 , 20, and 60ngml-', respectively. The corresponding inter-assay variability for these concentrations were 36 per cent, 18 per cent and 15.2 per cent, respectively. HCT was assayed by high performance liquid chromatography using ultraviolet detection at 229 nm according to the method of Sabarathan et aL4 The internal standard was hydroflumethazide, and the recoveries for HCT and hydroflumethazide from both plasma and urine was between 72 and 84 per cent. The sensitivity of the assay was 5 ng ml-l for plasma and 7 ng ml-' for urine. The intra-assay variability (coefficient of variation) for HCT in plasma was 8-1 per cent, 4.2 per cent, and 3.9 per cent at 15, 100, and 250ngml-', respectively. The intra- assay variability in urine was 5.5 per cent, 4-1 per cent, and 3.6 per cent at 500, 900, and 2000 ng ml-l, respectively. The inter-assay variability for plasma was 18 per cent (n = 22) and 11 per cent (n = 26) at 10 and 80ngml-', respecti- vely. The inter-assay variability for urine samples was 6.9 per cent, 7.8 per cent, and 6.9 per cent for 500,900, and 2000 ngml-', respectively.
Pharmacokinetic analysis
Pharmacokinetic parameters determined for this study were t-, C,,, AUC&,, elimination half-life (tl12) and the cumulative amount of each drug excreted in urine over 96 h. The estimates of C,, and tmax were determined from individual sets of plasma-time data; C,,, was the highest plasma concen- tration measured and t , was the time at which the blood sample corresponding to the C,, was taken. Total AUC and tI l2 were determined using a pharmacoki- netic modelling programme (MKMODEL by N. Holford (1986): Elsevier-BIO- SOFT). The area under curve (AUC) was determined using the trapezoidal method up to the last measurable plasma concentration. Added to this was an estimate of the area beyond the last measured plasma concentration which was calculated using the slope of the terminal exponential (Cht/B).
Data points below the detection limits of the assay were excluded from the analysis. Actual sampling times were used in all analyses.
450 L. G . HOWES ET AL.
Statistical analysis
All data are expressed as mean rf: SD. Prior to ANOVA C,,,, AUC,-,, and t,,2 data were tested for homogeneity of variance using Bartlett’s test.5 Provided this criterion was satisfied, comparisons of these pharmacokinetic parameters for each drug regimen were then performed using repeated measures analysis of variance (ANOVA) with treatment as the only within subjects factor. Approximate 90 per cent confidence intervals of the ratios of treatment means were calculated6 and appropriate planned comparisons were performed.
The t,,, data were analysed using the nonparametric Friedman Test. Approx- imate nonparametric 90 per cent confidence intervals were also calculated for the t,,, data.6
The maximal fall in blood pressure was also analysed by ANOVA with planned comparisons and the time of the maximal fall in blood pressure was analysed using the Friedman Test.
RESULTS
Pharmacokinetics
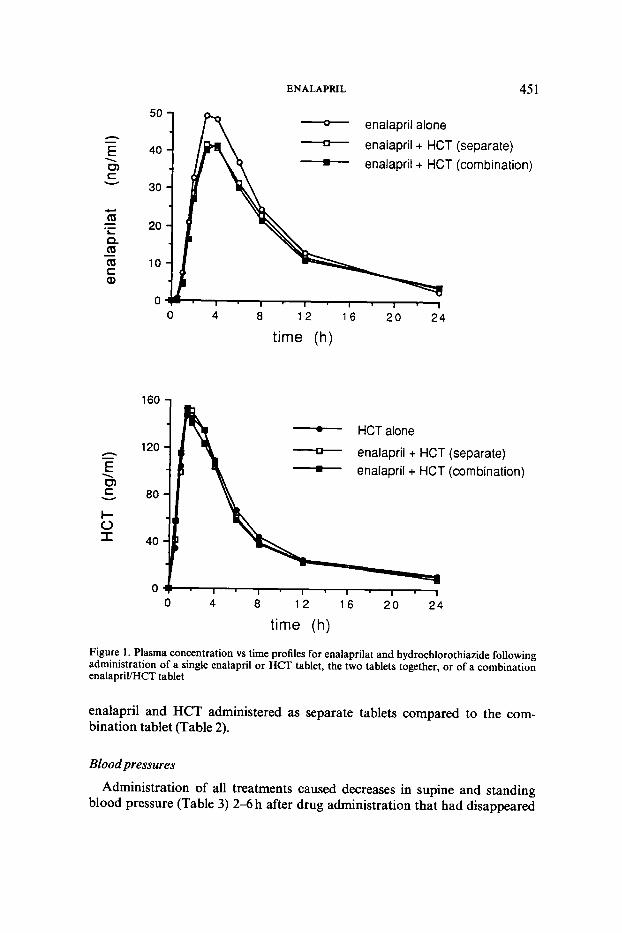
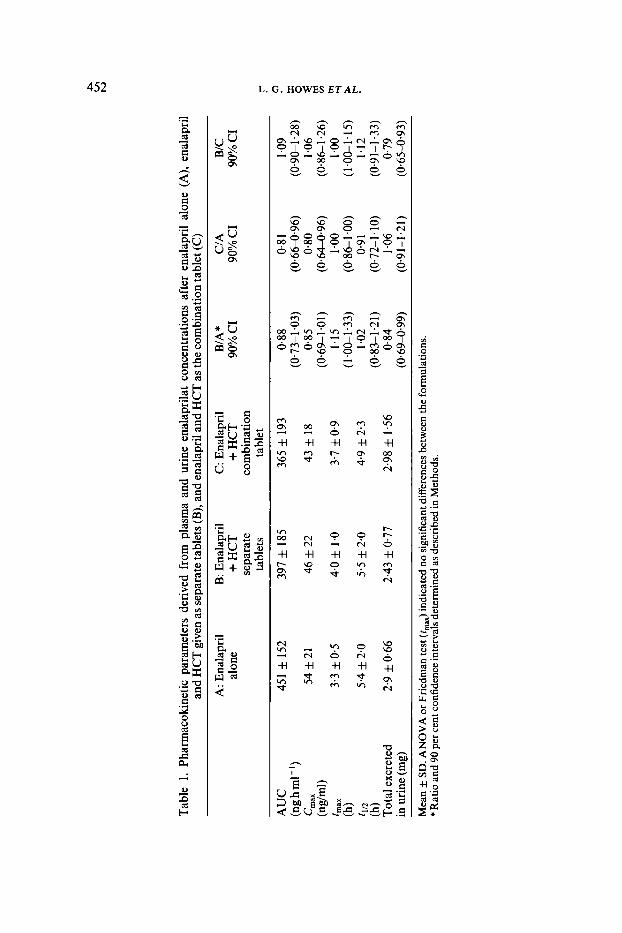
Mean plasma concentration vs time curves for enalaprilat and HCT are shown in Figure 1. Pharmacokinetic parameters calculated from the plasma concen- trations and urinary drug levels are presented in Tables 1 and 2.
C,,,, AUCsm, and t1,2 data all satisfied the criterion of homogeneity of variance and were subsequently analysed by repeated measures ANOVA.
Enalaprilat: The ANOVA indicated no significant differences between the three treatments containing enalapril on the pharmacokinetic parameters of AUC, C,,,,,, t,,, t1,2, and total amount excreted in urine derived from the plasma and urine enalaprilat concentrations. However, a planned comparison of AUC and C,,, of enalaprilat for the co-administration of enalapril and HCT either as a combination tablet or as separate tablets versus enalapril alone suggested a reduced bioavailability of enalaprilat when given together with HCT ( p = 0.053 and p = 0.054 for AUC and C,,,, respectively). Both parameters were reduced by up to 20 per cent in the combination tablet com- pared to enalapril alone; however there was no corresponding reduction in the total amount of enalapril excreted in the urine over 96 h (Table 1). There was also a tendency for the t,, of enalaprilat to be prolonged when the parent drug was co-administered in combination with HCT but, as indicated above, this effect did not reach statistical significance.
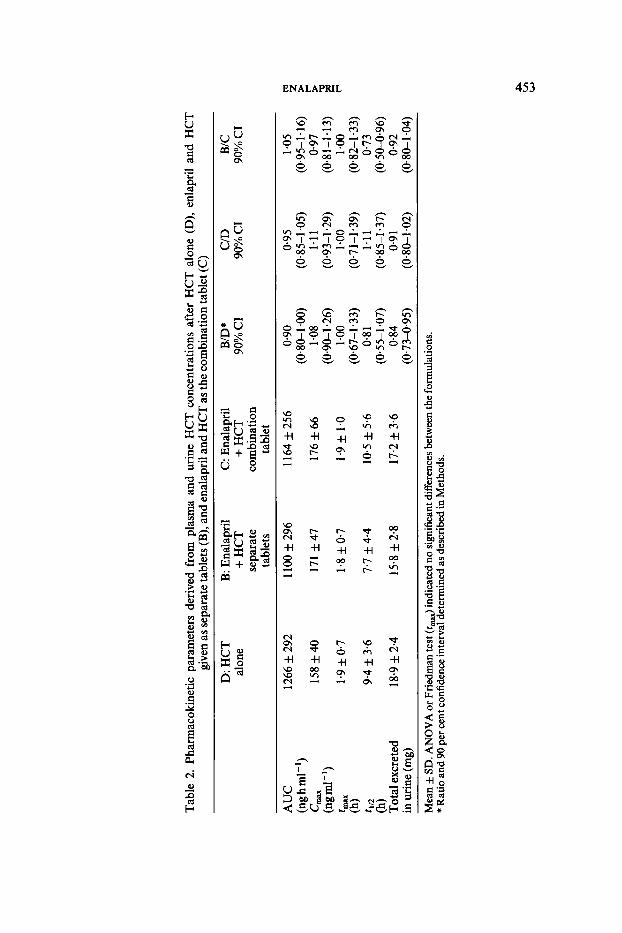
HCT: As with enalapril, the overall analysis of the pharmacokinetic para- meters derived from HCT concentrations in plasma and urine indicated no significant differences between the three treatments containing HCT. The speci- fic comparisons indicated a 27 per cent reduction in the half-life of HCT in
ENALAPRlL 45 1
h - E \ 0) c v
.- L
Q ([I
([I c Q,
-
h - E \ UI c v
l- 0 I
50
40
30
20
10
0
- enalapril alone - enalapril + HCT enalapril + HCT
0 4 8 1 2 1 6 20 24
time (h)
1 6 0 1 A 120 -
time (h)
160 - HCT alone - enalapril + HCT enalapril + HCT
120
80
40
0 0 4 8 12 1 6 2 0 2 4
time (h)
(separate) (comb i na ti0 n)
r r
(separate) (combination)
I
4
Figure 1. Plasma concentration vs time profiles for enalapnlat and hydrochlorothiazide following administration of a single enalapril or HCT tablet, the two tablets together, or of a combination enalapril/HCT tablet
enalapril and HCT administered as separate tablets compared to the com- bination tablet (Table 2).
Blood pressures
Administration of all treatments caused decreases in supine and standing blood pressure (Table 3) 2-6 h after drug administration that had disappeared
P
wl
h)
Tabl
e 1.
Phar
mac
okin
etic
par
amet
ers
deriv
ed f
rom
pla
sma
and
urin
e en
alap
rilat
con
cent
ratio
ns a
fter
ena
lapr
il al
one
(A),
enal
april
an
d H
CT
giv
en a
s sep
arat
e ta
blet
s (B
), an
d en
alap
ril a
nd H
CT
as t
he c
ombi
natio
n ta
blet
(C)
A: E
nala
pril
B: E
nala
pril
C: E
nala
pril
B/A
* C
IA
BIC
alon
e + H
CT
+ H
CT
90%
CI
90%
CI
90%
CI
sepa
rate
co
mbi
natio
n ta
blet
s ta
blet
r
(ng h
m1-
I) (0.73-1.03)
(0.664l.96)
(0.9CL1.28)
3 C,,X
54 f 21
46 f 22
43 f 18
0.85
0.80
1.06
(0.69-1.01)
(0.64496)
(0.861.26)
m
h
!- (l.OCL1.33)
(0.86-1.00)
(0.83-1.21)
(0.72-1.10)
(0.91-1.33)
Tot
al ex
cret
ed
2.9 f 0.66
2.43 f 0.77
2.98 f 1
.56
0.84
1.06
0.79
in u
rine
(mg)
(0.69499)
(0.91-1.21)
(0.65493)
AU
C
451 f 152
397 f 185
365 f 193
0.88
0.8 1
1.09
P 8 (n
g/m
l) 4
MX
3.3 f 0.
5 4.0 f 1
.0
3.7 f 0.9
1.15
I .oo
1 .oo
Y
(1.00-1.15)
k- tI
l2
5.4 f 2.0
5.5 f 2.
0 4.
9 f 2.3
1.02
0.9 1
1.12
(h)
(h)
Mea
n f S
D. A
NO
VA
or F
riedm
an te
st (f
mx)
indi
cate
d no
sign
ifica
nt d
iffer
ence
s bet
wee
n th
e fo
rmul
atio
ns.
* Rat
io a
nd 9
0 pe
r cen
t con
fiden
ce in
terv
als
dete
rmin
ed a
s des
crib
ed in
Met
hods
.
Tab
le 2
. Ph
arm
acok
inet
ic p
aram
eter
s de
rived
fro
m p
lasm
a an
d ur
ine
HC
T c
once
ntra
tions
aft
er H
CT
alo
ne (
D),
enla
pril
and
HC
T
give
n as
sepa
rate
tabl
ets (
B),
and
enal
apri
l and
HC
T a
s the
com
bina
tion
tabl
et (C
)
D: H
CT
B:
Ena
lapr
il C
: Ena
lapr
il BID*
CID
B
E
alon
e + H
CT
+ H
CT
90
% C
I 90
0, C
I 90
% C
I se
para
te
com
bina
tion
tabl
ets
tabl
et
AU
C
1266
f 2
92
1100
f 29
6 11
64 f 25
6 0.
90
(ngh
ml-
') (0
.80-
1-00
) 15
8 f 4
0 17
1 f4
7
176 f 6
6 1.
08
&%
l-')
(0.9
0-1.
26)
tmax
1.
9 f 0.
7 1.
8 f 0.
7 1.
9 f 1
.0
1.00
tl,
9-4 f 3.
6 7.
7 f 4.
4 10
.5 f 5
.6
0.8 1
(h
)
Tot
al e
xcre
ted
18.9
f 2.
4 15
.8 f 2.
8 17
.2 f 3.
6 0.
84
(h)
in u
rine
(mg)
(0
.73-
0.95
)
Mea
n f S
D. A
NO
VA
or F
ried
man
test
(c,&
indi
cate
d no
sign
ifica
nt di
ffere
nces
betw
een
the f
orm
ulat
ions
. *R
atio
and
90 p
er ce
nt co
nfid
ence
inte
rval
dete
rmin
ed as
des
crib
ed in
Met
hods
.
(0.6
7-1
'33)
(0.5
5-1
'07)
0.95
(0
.85-
1 '0
5)
1.11
(0
.93-
1 '2
9)
1 .oo
(0.7
1-1
'39)
1.
1 1
(0.8
5-1.
37)
0.9 1
(0
.8C
L1.0
2)
1.05
(0
.95-
1.16
) 0-
97
(0.8
1-1
'1 3)
1 .o
o (0
.82-
1 '3
3)
0.73
(0
.50-
0.96
) 0.
92
(0-8
CL1
.04)
P
ul w
454 L. G. HOWES ET A L .
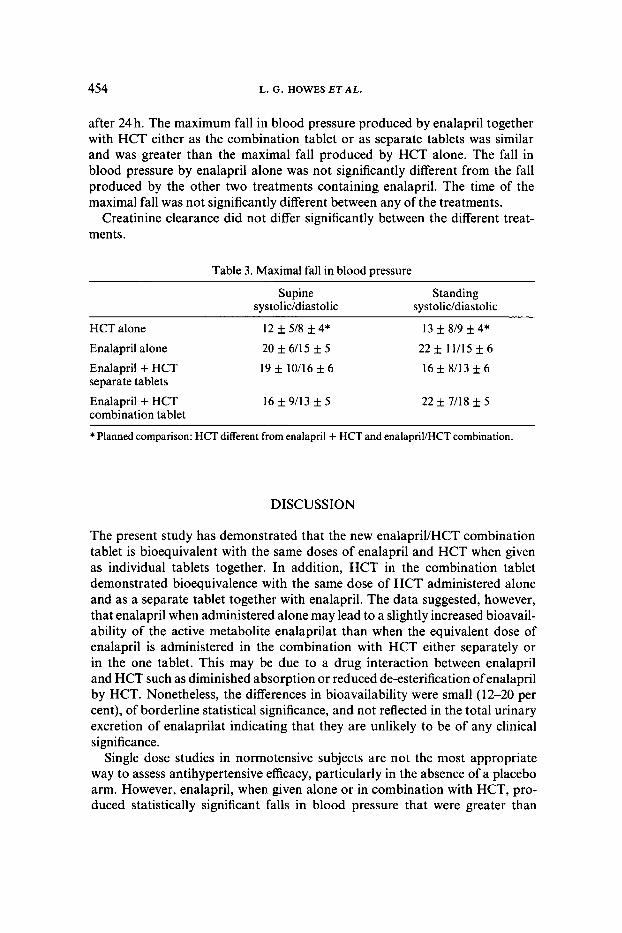
after 24 h. The maximum fall in blood pressure produced by enalapril together with HCT either as the combination tablet or as separate tablets was similar and was greater than the maximal fall produced by HCT alone. The fall in blood pressure by enalapril alone was not significantly different from the fall produced by the other two treatments containing enalapril. The time of the maximal fall was not significantly different between any of the treatments.
Creatinine clearance did not differ significantly between the different treat- ments.
Table 3. Maximal fall in blood pressure
Supine Standing systoliddiastolic systolic/diastolic
HCT alone 13 f 8/9 f 4* Enalapril alone 20 f 6/15 f 5 22f 11/15f6
Enalapril + HCT 16 f 8/13 f 6 separate tablets
Enalapril + HCT 22 f 7/18 f 5 combination tablet
12 * 5/8 f 4*
19 f 10/16 f 6
I6 f 9/13 f 5
* Planned comparison: HCT different from enalapril + HCT and enalapril/HCT combination.
DISCUSSION
The present study has demonstrated that the new enalapril/HCT combination tablet is bioequivalent with the same doses of enalapril and HCT when given as individual tablets together. In addition, HCT in the combination tablet demonstrated bioequivalence with the same dose of HCT administered alone and as a separate tablet together with enalapril. The data suggested, however, that enalapril when administered alone may lead to a slightly increased bioavail- ability of the active metabolite enalaprilat than when the equivalent dose of enalapril is administered in the combination with HCT either separately or in the one tablet. This may be due to a drug interaction between enalapril and HCT such as diminished absorption or reduced de-esterification of enalapril by HCT. Nonetheless, the differences in bioavailability were small (1 2-20 per cent), of borderline statistical significance, and not reflected in the total urinary excretion of enalaprilat indicating that they are unlikely to be of any clinical significance.
Single dose studies in normotensive subjects are not the most appropriate way to assess antihypertensive efficacy, particularly in the absence of a placebo arm. However, enalapril, when given alone or in combination with HCT, pro- duced statistically significant falls in blood pressure that were greater than
ENALAPRIL 455
those produced by HCT alone. There were no statistically significant differences between the enalapril treatments.
The t,,, C,,, AUC, and t1,2 values observed in the present study are consis- tent with previously published values for both e n a l a ~ r i l ~ - ~ and HCT.'O We could find no previous studies which have investigated whether the coadminis- tration of enalapril and hydrochlorothiazide influence each other's pharmaco- kinetics, but a lack of pharmacokinetic interaction has been previously reported for enalapril and fr~semide,~ and cilazapril and HCT."
In conclusion, the new combination enalapriUHCT tablet is bioequivalent to the administration of the same doses of each drug given simultaneously as separate tablets and will provide a simpler formulation for the management of hypertension and cardiac failure.
ACKNOWLEDGEMENTS
This work was supported by Merck Sharp and Dohme (Australia) Pty. Ltd.
REFERENCES
1. G. H. Williams, N. Engl. J. Med., 319, 1517 (1988). 2. M. Borck, S . Charlap and W. H. Frishman, Angiotensin converting enzyme inhibitors in
heart failure. Med. Clin. North Am., 73, 315 (1989). 3. P. J. Worland and B. Jarrott, Radioimmunoassay for the quantitation of lisinopril and enalapri-
lat. J. Pharm. Sci., 75,512 (1986). 4. K. Sabanathan, C. M. Castelden, H. K. Adam, J. Ryan and T. J. Fitzsimmons, Eur. J. Clin.
Pharmacol., 32,53 (1987). 5. G. W. Snedecor and W. G. Cochran, Statistical Methods, Iowa State University Press, Ames,
Iowa, USA, 1980, pp. 252-254. 6. V. W. Steinijans and E. Diletti, Eur. J. Clin. Pharmacol., 24, 127 (1983). 7. A. M. Van Harken, R. Verbesselt, A. Buntinx, V. J. Givillo and P. J . Schepper, Er. J. Clin.
8. N. Hockings, A. A. Ajayi and J. L. Reid, Er. J. Clin. Pharmacol., 21,341 (1986). 9. J. G. Kelly, G. Doyle, J. Donohue, M. Laher, M. J . Vandenberg, W. J. Currie and W. D.
10. R. L. Williams, M. D. Thornhill, R. A. Upton, C. Blume, T. S. Clark, E. Lin and L. Z.
1 1 . 0. G. Nilsen, 0. F. Sellevold, 0. S. Romfo, A. Smedsrud, B. Grynne, P. E. Williams and
Pharmacol., 23,84 (1987).
Cooper, Er. J. Clin. Pharmacol., 21,63 (1986).
Beret, Clin. Pharmacol. Ther., 40,226 (1986).
C. H. Kleinbloesen, Br. J. Clin. Pharmacol., 27, suppl. 2,3233 (1989).