petroleum engineer’s club of dallas, october 28, 2016...
TRANSCRIPT
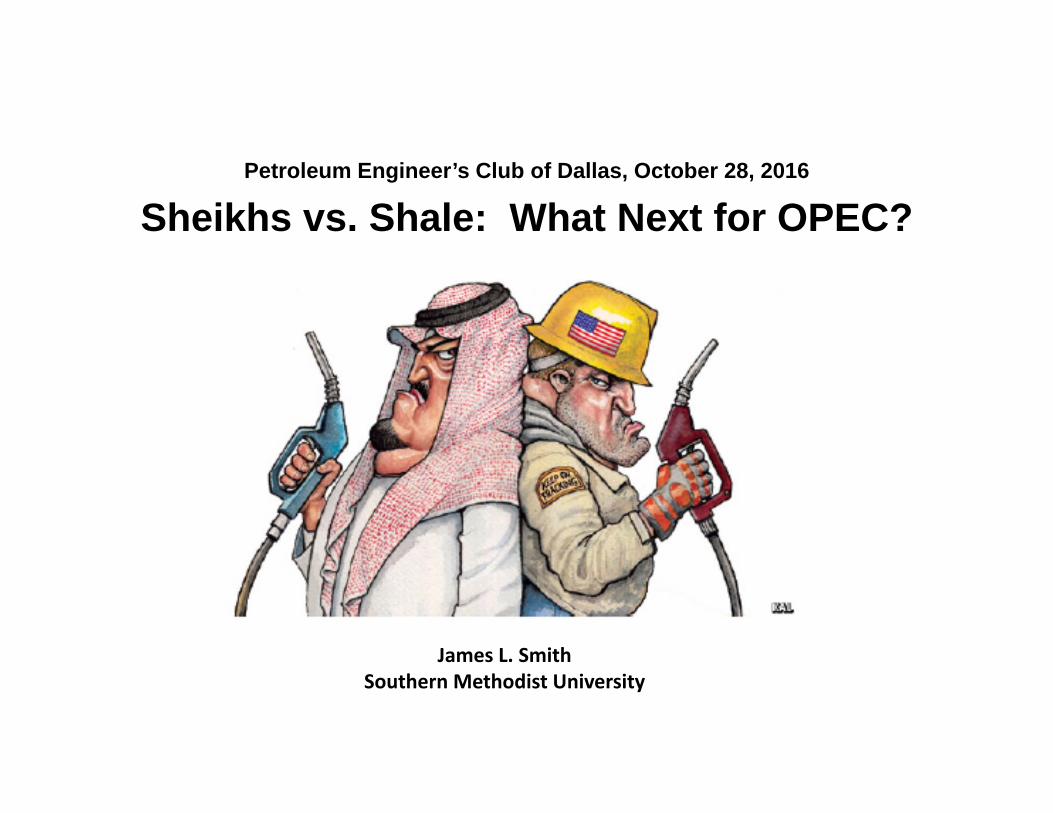
Petroleum Engineer’s Club of Dallas, October 28, 2016
Sheikhs vs. Shale: What Next for OPEC?
James L. SmithSouthern Methodist University

Multiple Choice Quiz
Which is better for society?
Multiple Choice Quiz
Which is better for society?
a. Crude Oil at $100/barrel
Multiple Choice Quiz
Which is better for society?
a. Crude Oil at $100/barrel
b. Crude Oil at $50/barrel
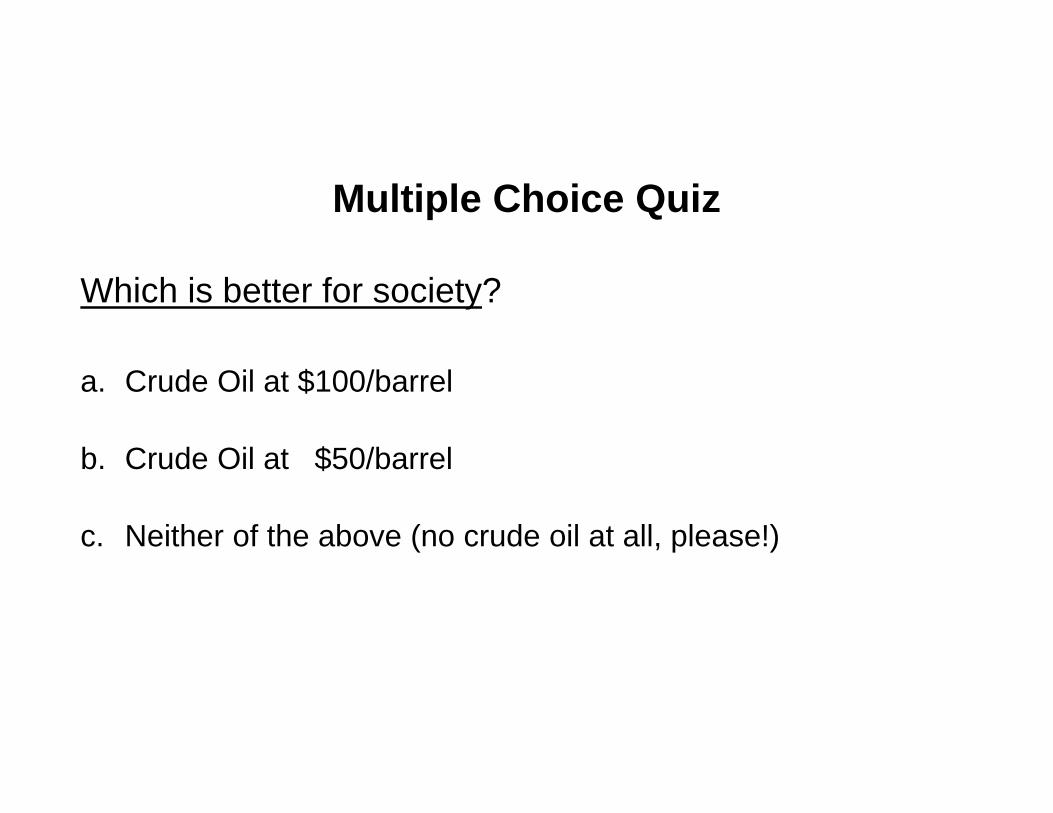
Multiple Choice Quiz
Which is better for society?
a. Crude Oil at $100/barrel
b. Crude Oil at $50/barrel
c. Neither of the above (no crude oil at all, please!)
One Key to the World Oil Market Lies in Modena

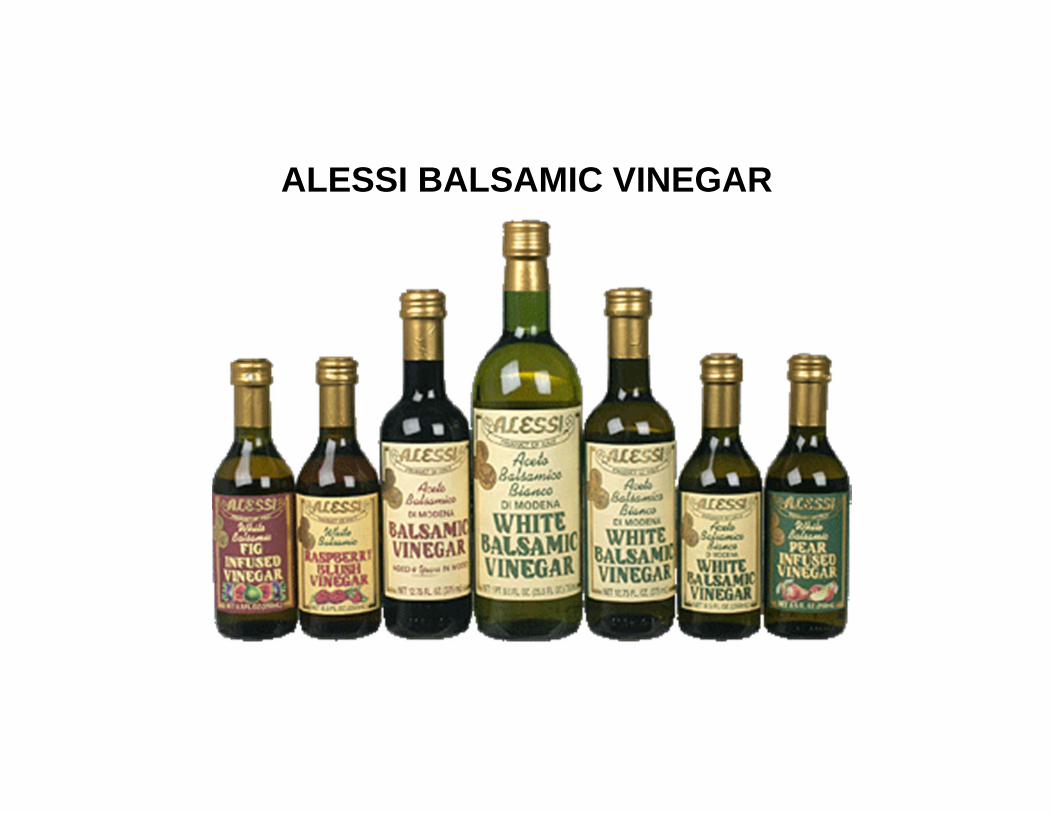
ALESSI BALSAMIC VINEGAR
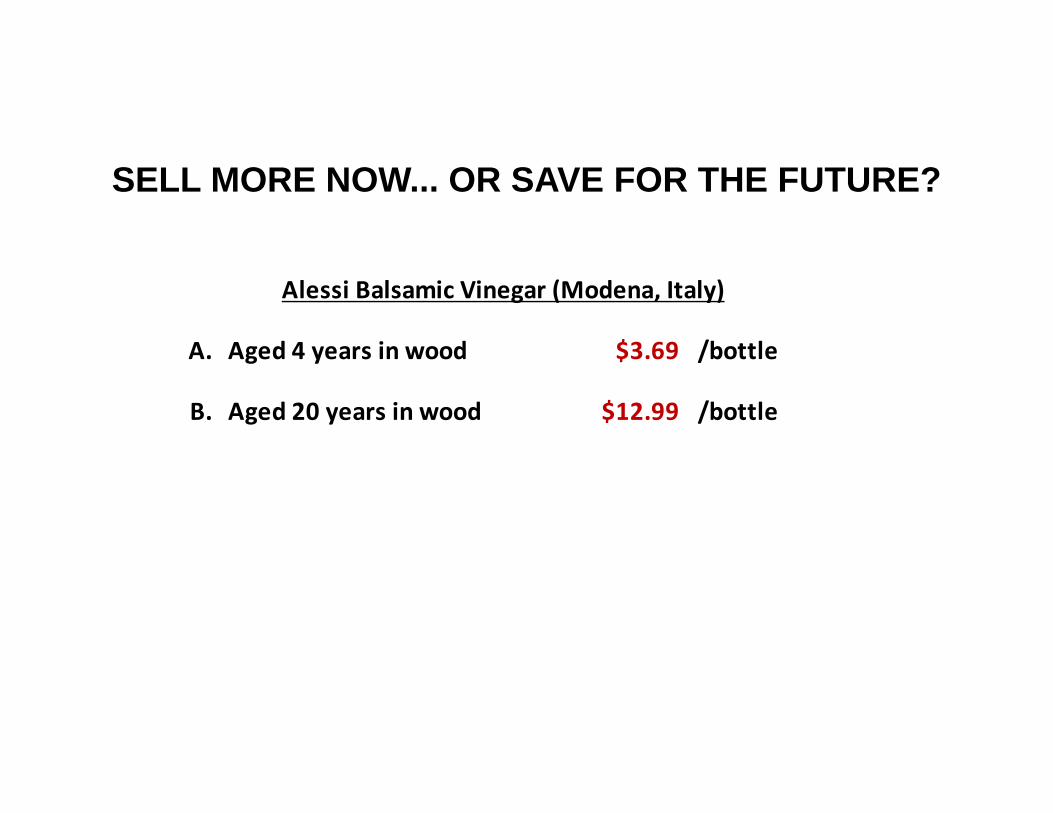
SELL MORE NOW... OR SAVE FOR THE FUTURE?
A. Aged 4 years in wood $3.69 /bottle
B. Aged 20 years in wood $12.99 /bottle
$3.69 = $12.99/(1.08)16
Current Sale = Present Value of Future Sale
Alessi Balsamic Vinegar (Modena, Italy)
Seller's Indifference:
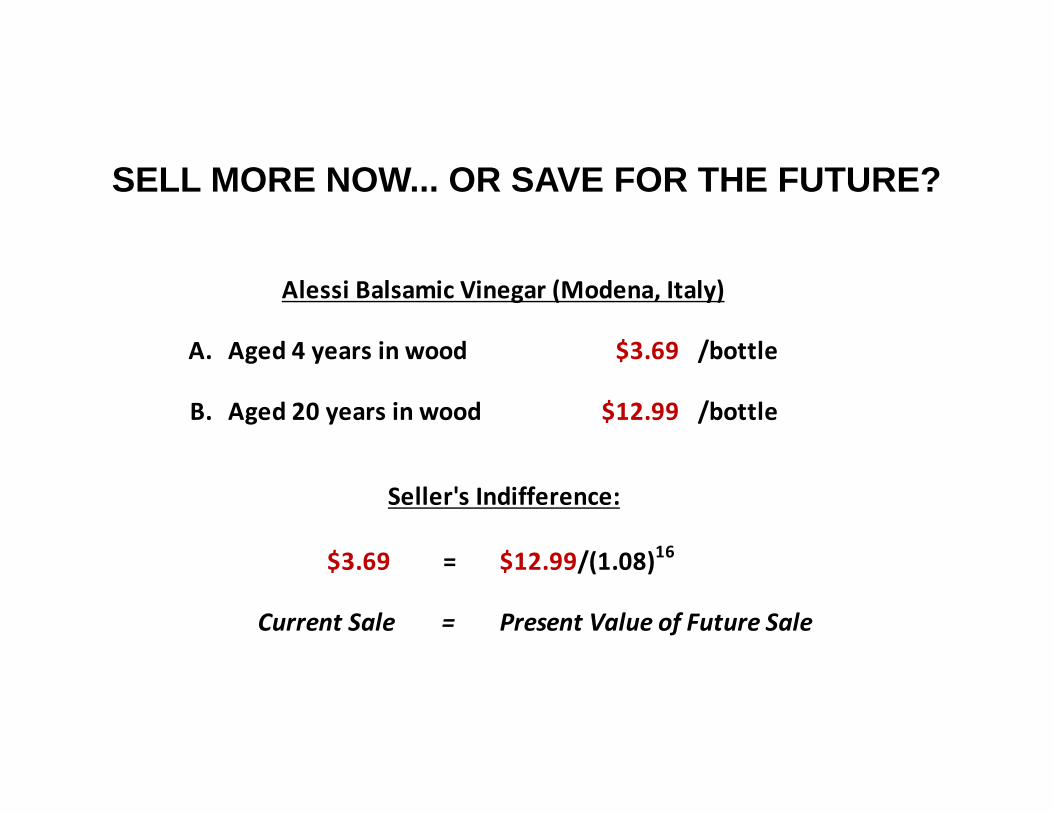
SELL MORE NOW... OR SAVE FOR THE FUTURE?
A. Aged 4 years in wood $3.69 /bottle
B. Aged 20 years in wood $12.99 /bottle
$3.69 = $12.99/(1.08)16
Current Sale = Present Value of Future Sale
Alessi Balsamic Vinegar (Modena, Italy)
Seller's Indifference:
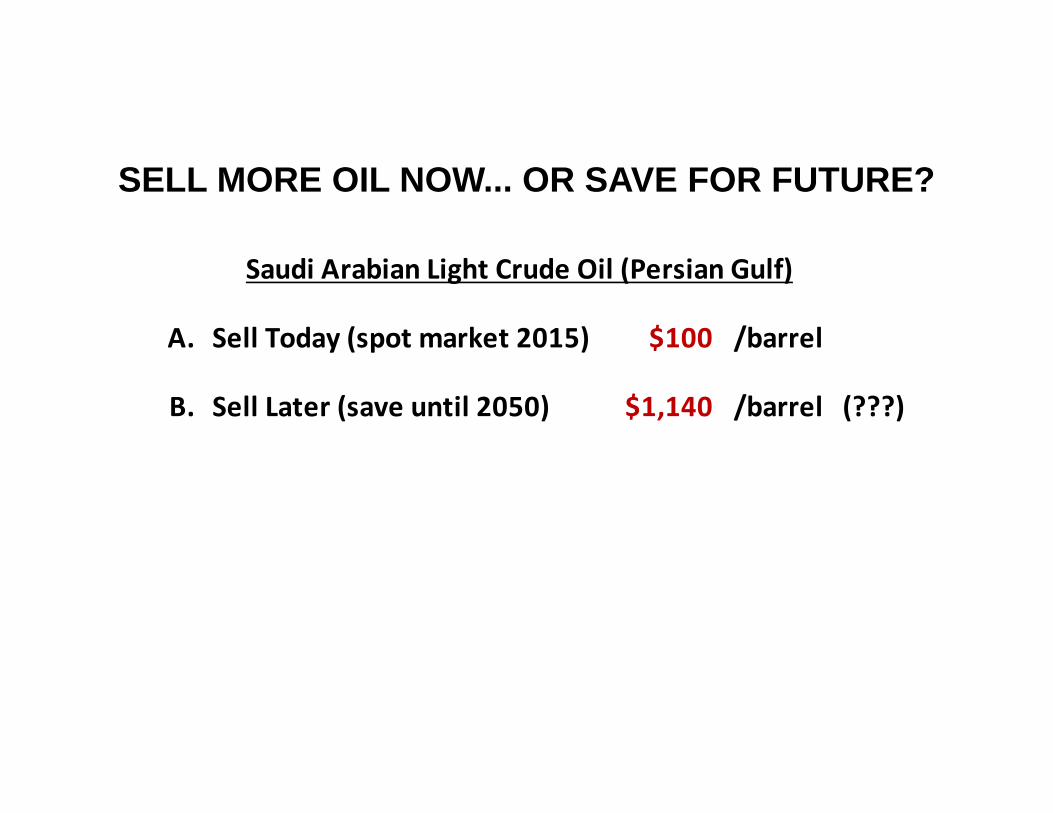
SELL MORE OIL NOW... OR SAVE FOR FUTURE?
A. Sell Today (spot market 2015) $100 /barrel
B. Sell Later (save until 2050) $1,140 /barrel (???)
$100 ‐ $5 = ($1,140 ‐ $5) / 1.0835
Current Sale = Present Value of Future Sale
Saudi Arabian Light Crude Oil (Persian Gulf)
Seller's Indifference:
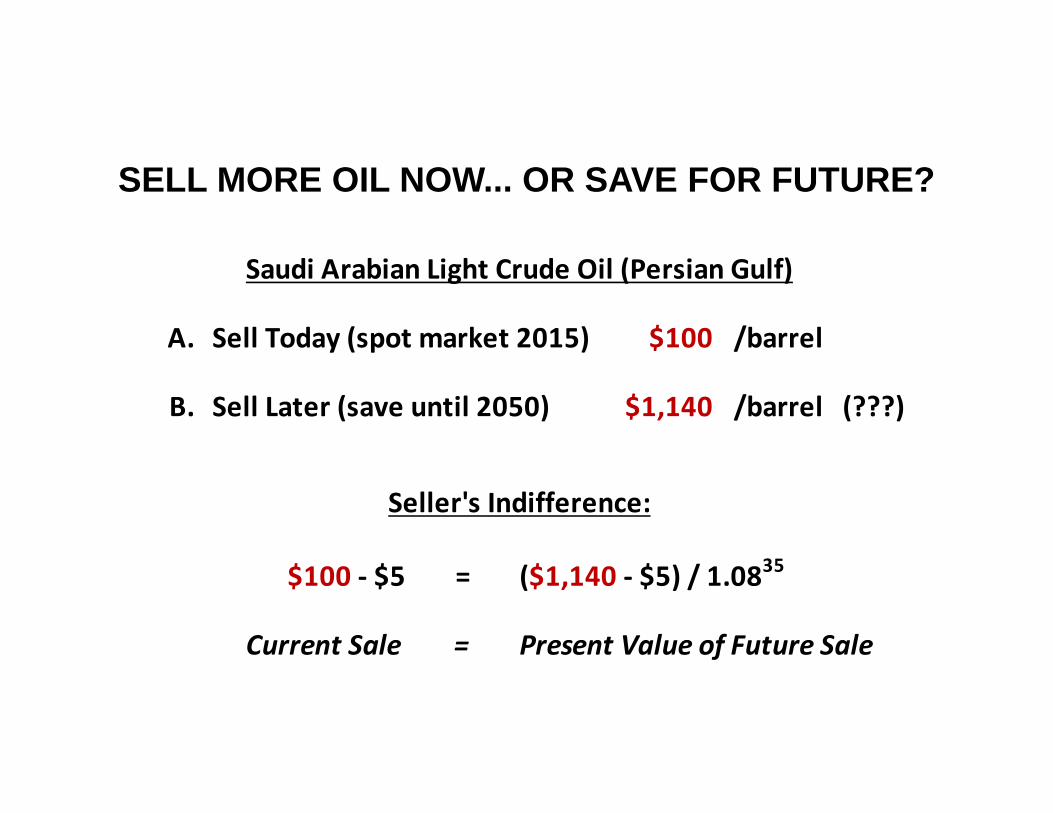
SELL MORE OIL NOW... OR SAVE FOR FUTURE?
A. Sell Today (spot market 2015) $100 /barrel
B. Sell Later (save until 2050) $1,140 /barrel (???)
$100 ‐ $5 = ($1,140 ‐ $5) / 1.0835
Current Sale = Present Value of Future Sale
Saudi Arabian Light Crude Oil (Persian Gulf)
Seller's Indifference:
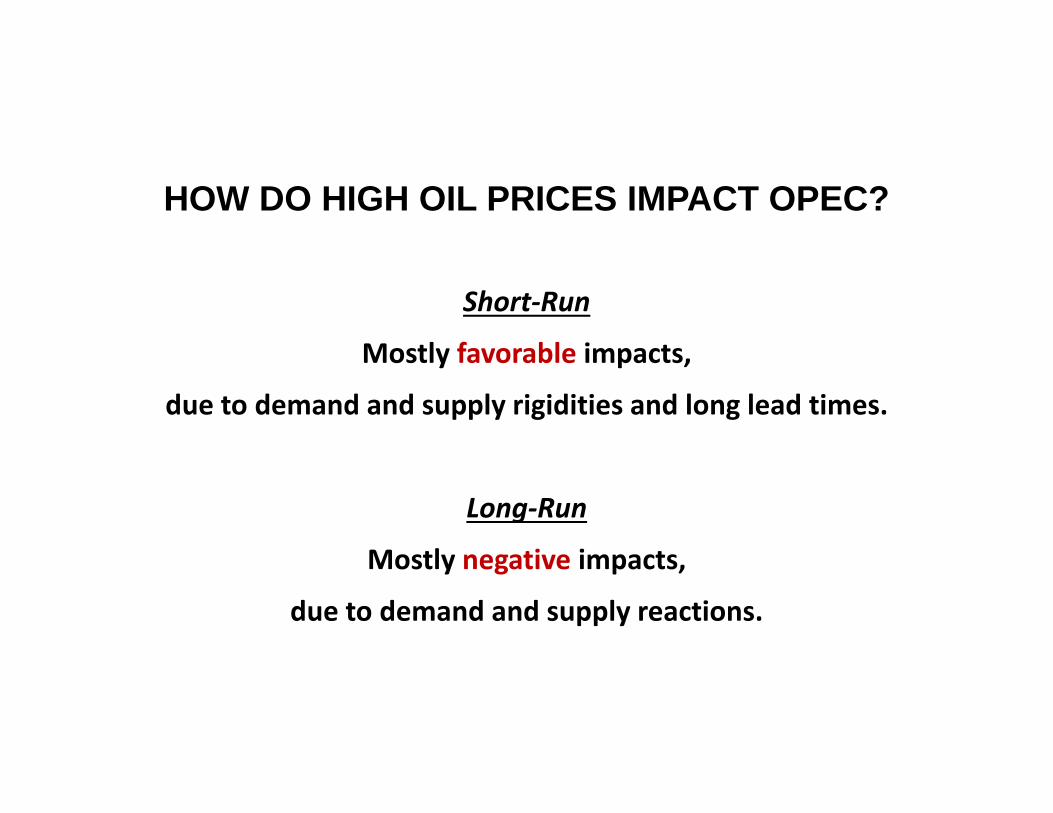
HOW DO HIGH OIL PRICES IMPACT OPEC?
Short‐Run
Mostly favorable impacts,
due to demand and supply rigidities and long lead times.
Long‐Run
Mostly negative impacts,
due to demand and supply reactions.
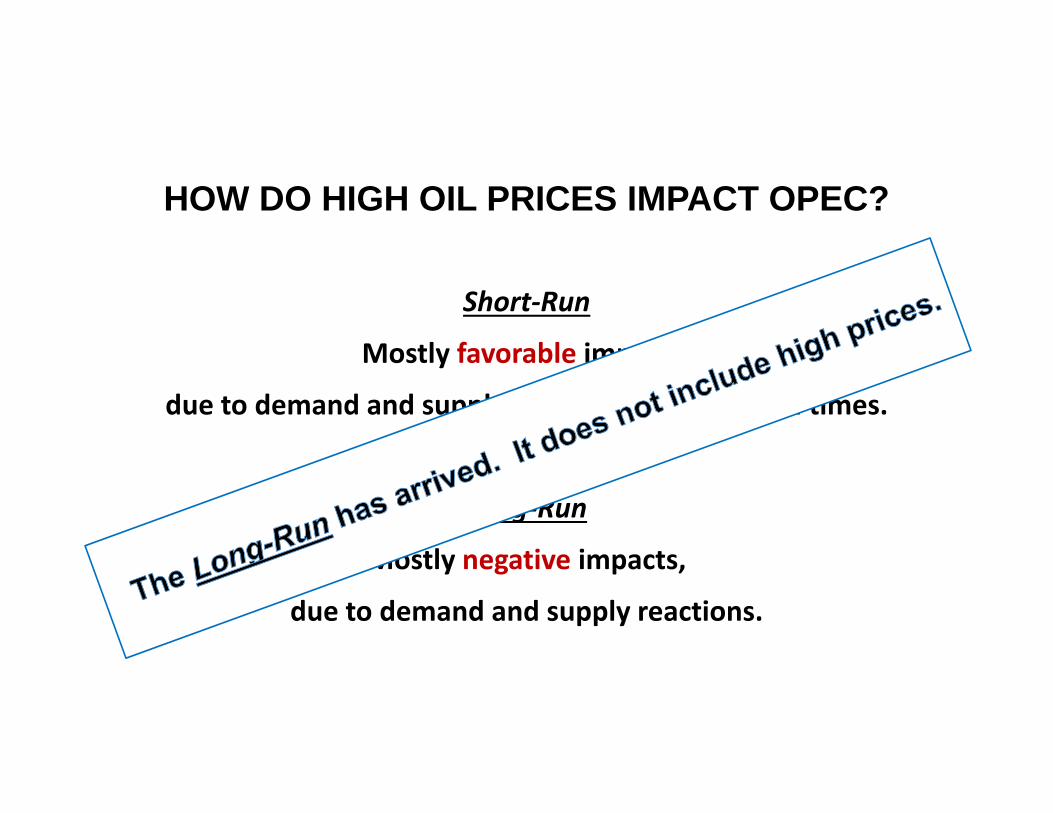
HOW DO HIGH OIL PRICES IMPACT OPEC?
Short‐Run
Mostly favorable impacts,
due to demand and supply rigidities and long lead times.
Long‐Run
Mostly negative impacts,
due to demand and supply reactions.

HOW DO HIGH OIL PRICES IMPACT OPEC?
Short‐Run
Mostly favorable impacts,
due to demand and supply rigidities and long lead times.
Long‐Run
Mostly negative impacts,
due to demand and supply reactions.

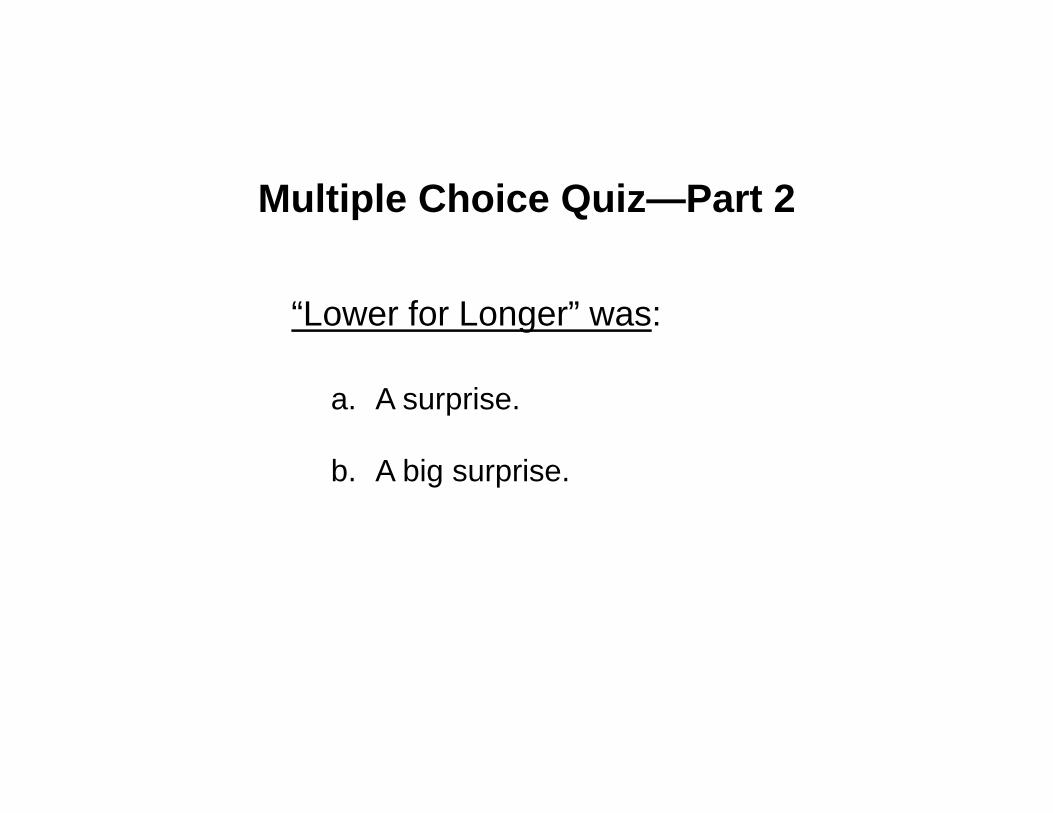
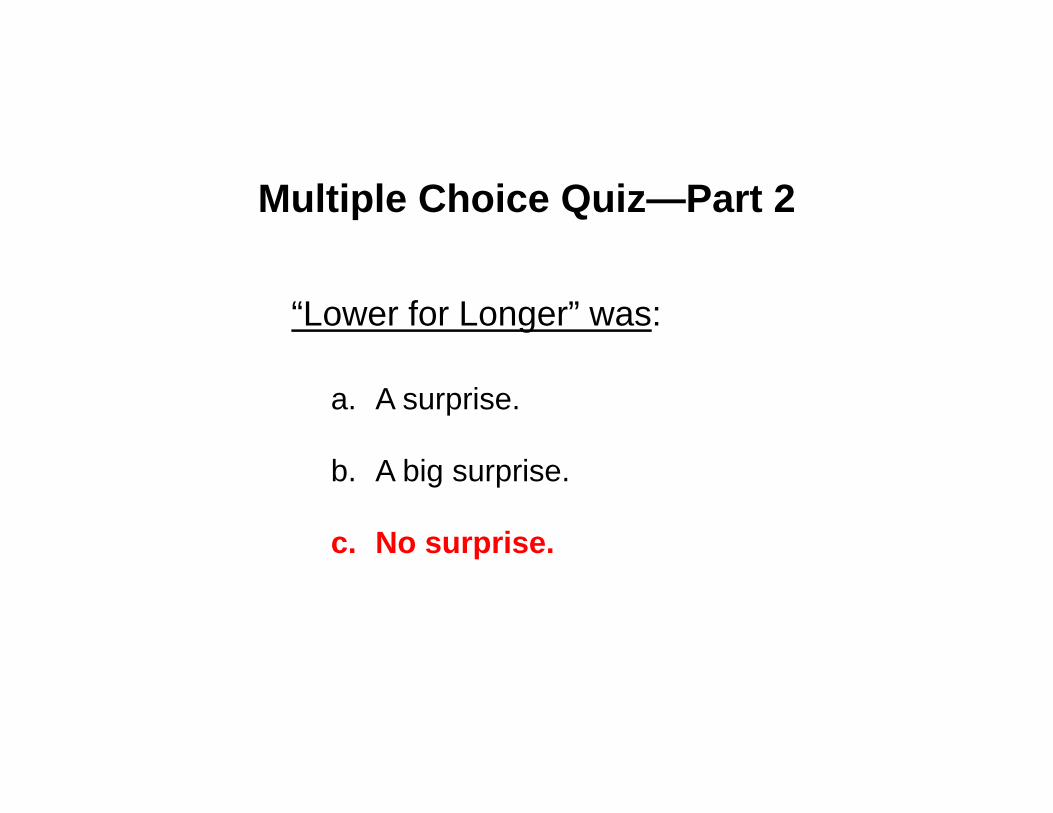
Multiple Choice Quiz—Part 2
“Lower for Longer” was:
a. A surprise.
b. A big surprise.
c. No surprise.

Multiple Choice Quiz—Part 2
“Lower for Longer” was:
a. A surprise.
b. A big surprise.
c. No surprise.
Multiple Choice Quiz—Part 2
“Lower for Longer” was:
a. A surprise.
b. A big surprise.
c. No surprise.
Multiple Choice Quiz—Part 2
“Lower for Longer” was:
a. A surprise.
b. A big surprise.
c. No surprise.
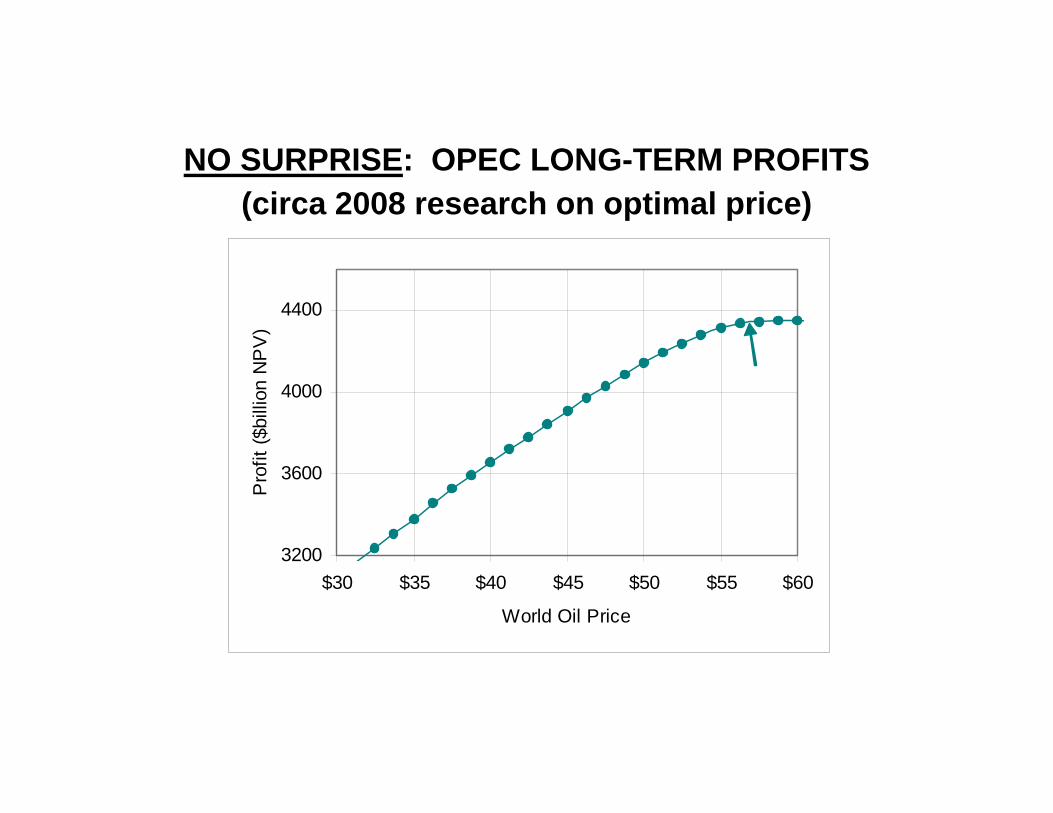
NO SURPRISE: OPEC LONG-TERM PROFITS(circa 2008 research on optimal price)
3200
3600
4000
4400
$30 $35 $40 $45 $50 $55 $60
World Oil Price
Pro
fit ($
billi
on N
PV
)
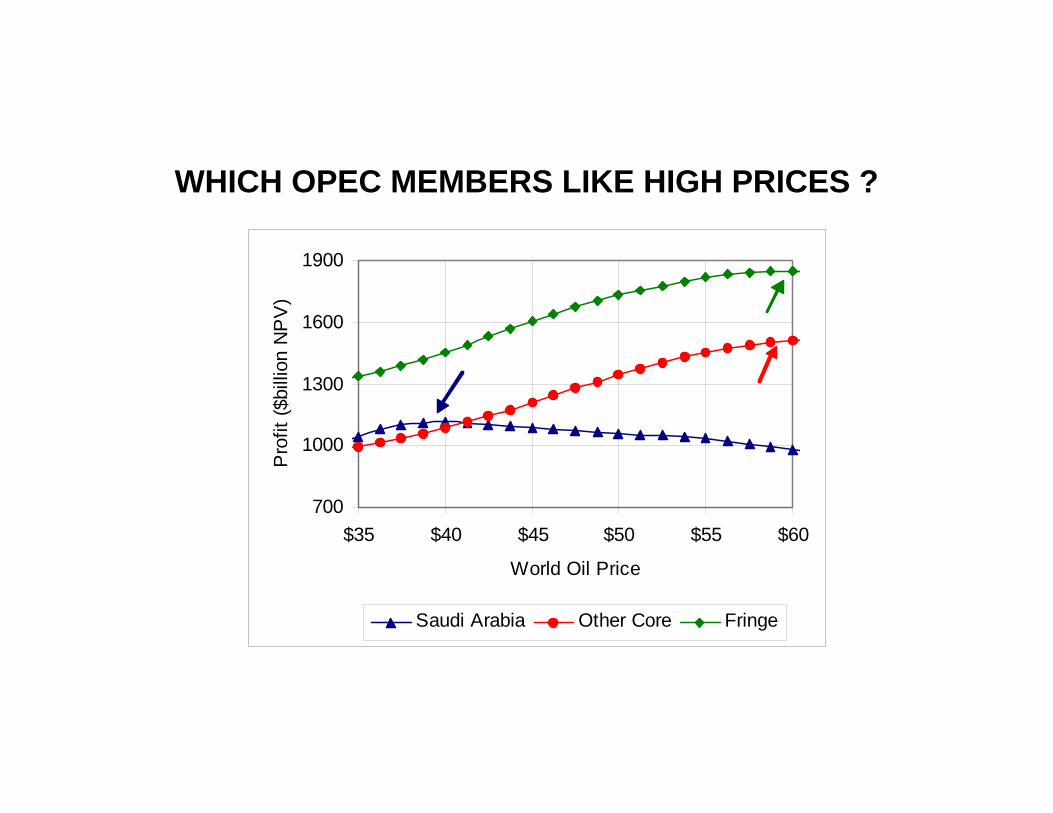
WHICH OPEC MEMBERS LIKE HIGH PRICES ?
700
1000
1300
1600
1900
$35 $40 $45 $50 $55 $60
World Oil Price
Pro
fit ($
billi
on N
PV
)
Saudi Arabia Other Core Fringe
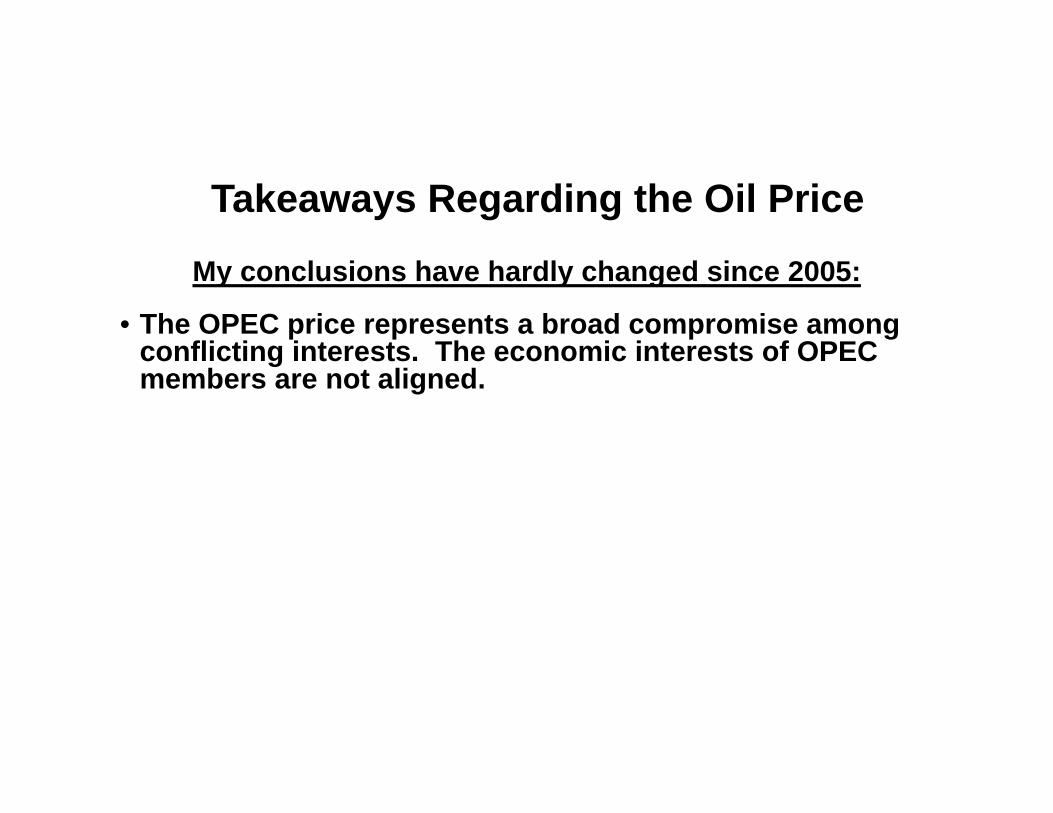
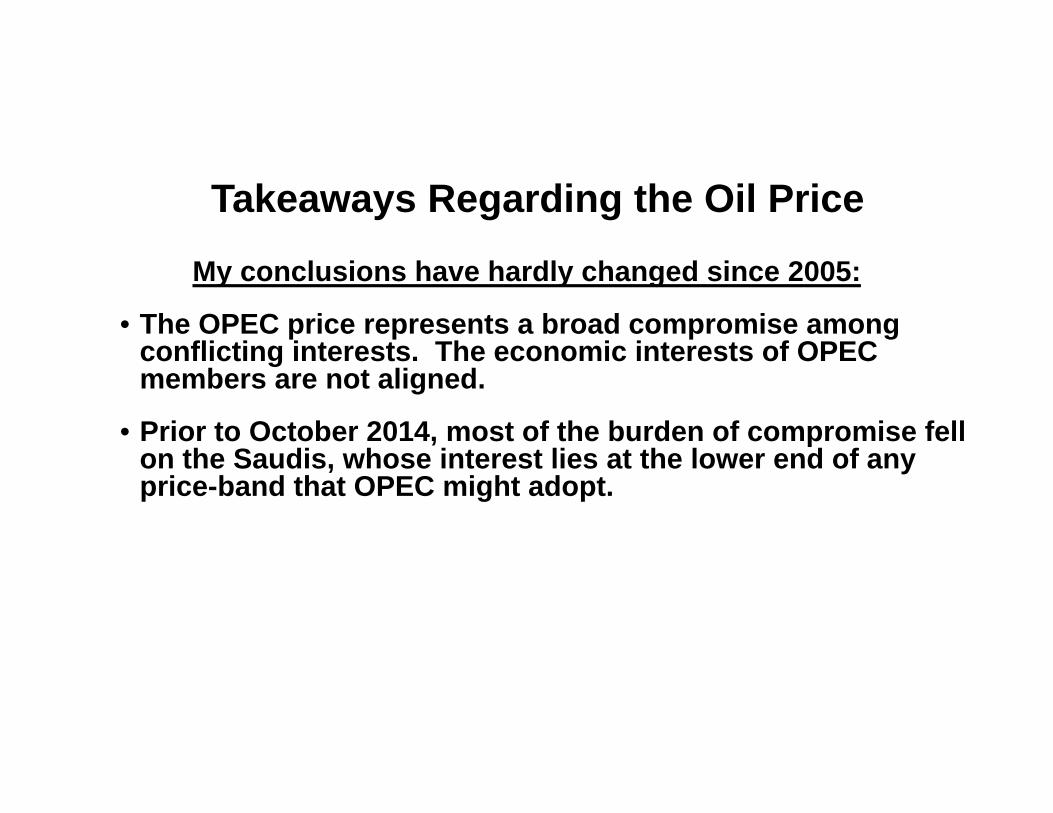
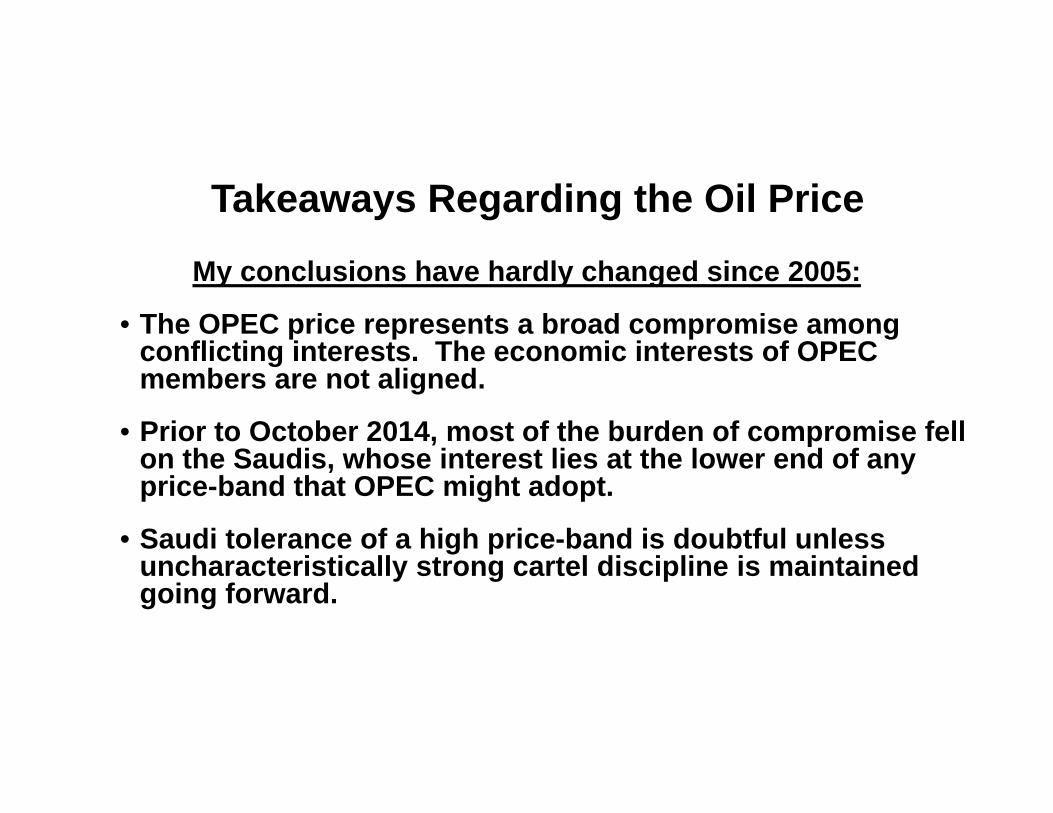
Takeaways Regarding the Oil Price
My conclusions have hardly changed since 2005:
• The OPEC price represents a broad compromise among conflicting interests. The economic interests of OPEC members are not aligned.
• Prior to October 2014, most of the burden of compromise fell on the Saudis, whose interest lies at the lower end of any price-band that OPEC might adopt.
• Saudi tolerance of a high price-band is doubtful unless uncharacteristically strong cartel discipline is maintained going forward.
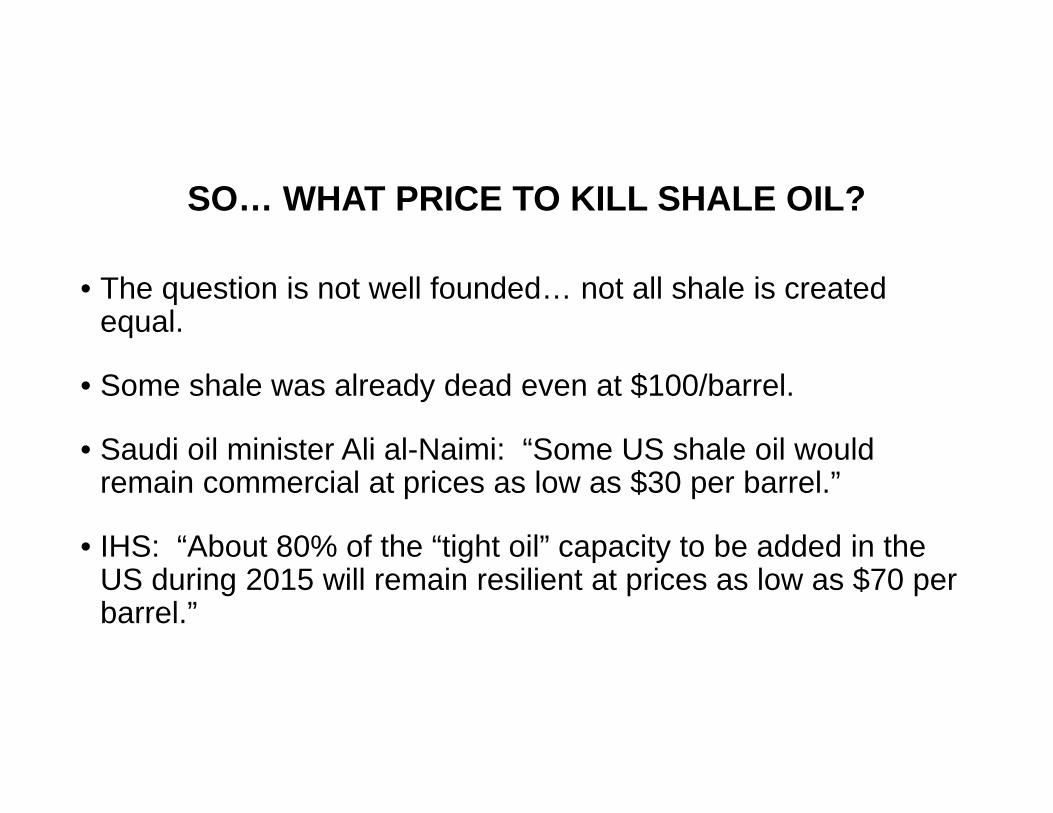
SO… WHAT PRICE TO KILL SHALE OIL?
• The question is not well founded… not all shale is created equal.
• Some shale was already dead even at $100/barrel.
• Saudi oil minister Ali al-Naimi: “Some US shale oil would remain commercial at prices as low as $30 per barrel.”
• IHS: “About 80% of the “tight oil” capacity to be added in the US during 2015 will remain resilient at prices as low as $70 per barrel.”
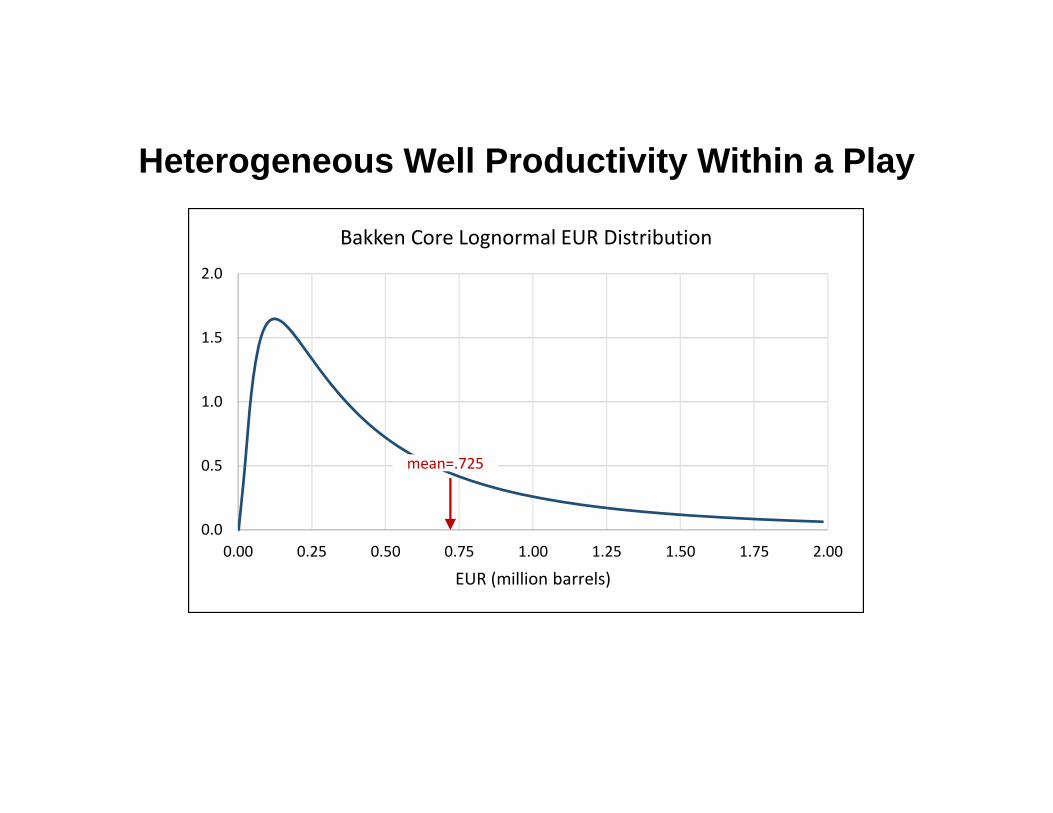
Heterogeneous Well Productivity Within a Play
0.0
0.5
1.0
1.5
2.0
0.00 0.25 0.50 0.75 1.00 1.25 1.50 1.75 2.00
EUR (million barrels)
Bakken Core Lognormal EUR Distribution
mean=.725
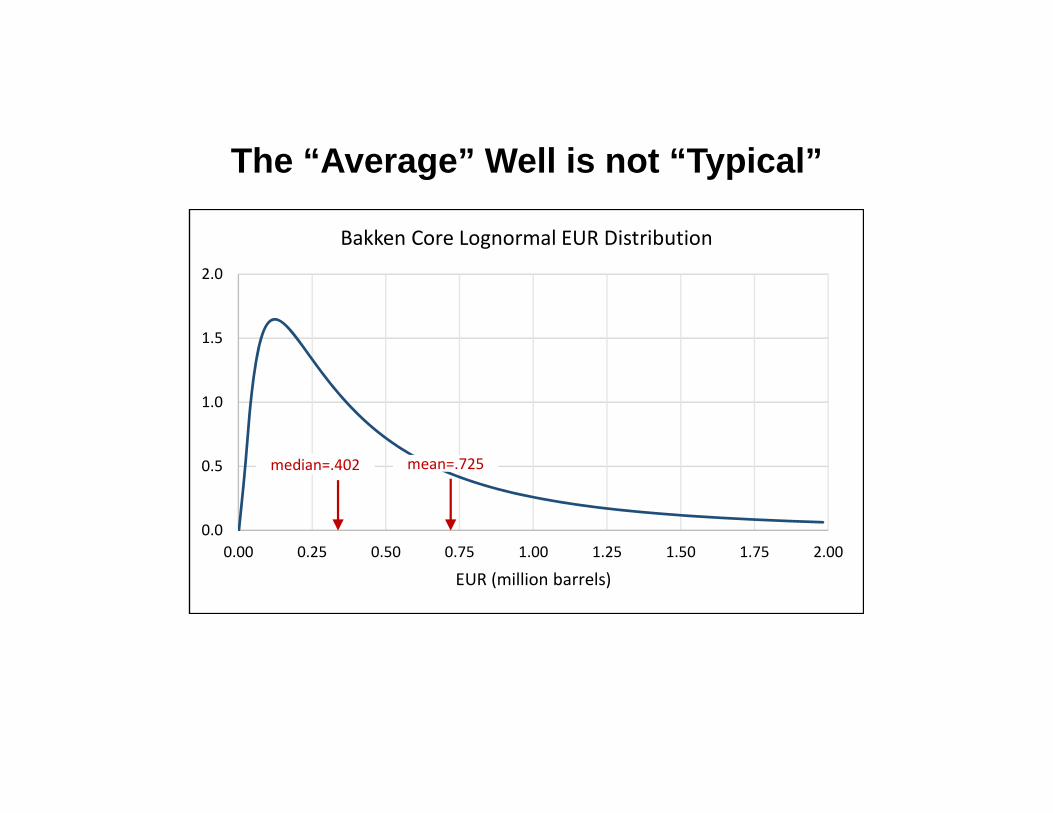
The “Average” Well is not “Typical”
0.0
0.5
1.0
1.5
2.0
0.00 0.25 0.50 0.75 1.00 1.25 1.50 1.75 2.00
EUR (million barrels)
Bakken Core Lognormal EUR Distribution
mean=.725median=.402

At $90, Any Well Above the B/E EUR is Viable
0.0
0.5
1.0
1.5
2.0
0.00 0.25 0.50 0.75 1.00 1.25 1.50 1.75 2.00
EUR (million barrels)
Bakken Core Lognormal EUR Distribution
mean=.725median=.402
B/E @$90=.504
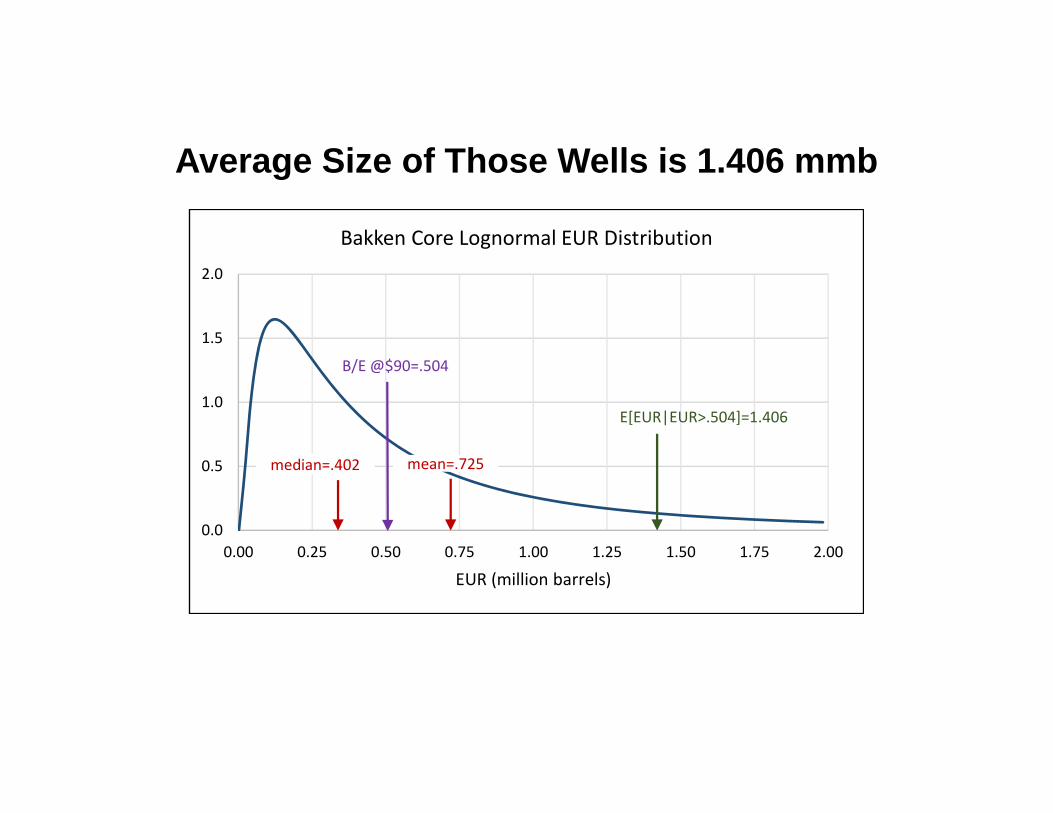
Average Size of Those Wells is 1.406 mmb
0.0
0.5
1.0
1.5
2.0
0.00 0.25 0.50 0.75 1.00 1.25 1.50 1.75 2.00
EUR (million barrels)
Bakken Core Lognormal EUR Distribution
mean=.725median=.402
B/E @$90=.504
E[EUR|EUR>.504]=1.406
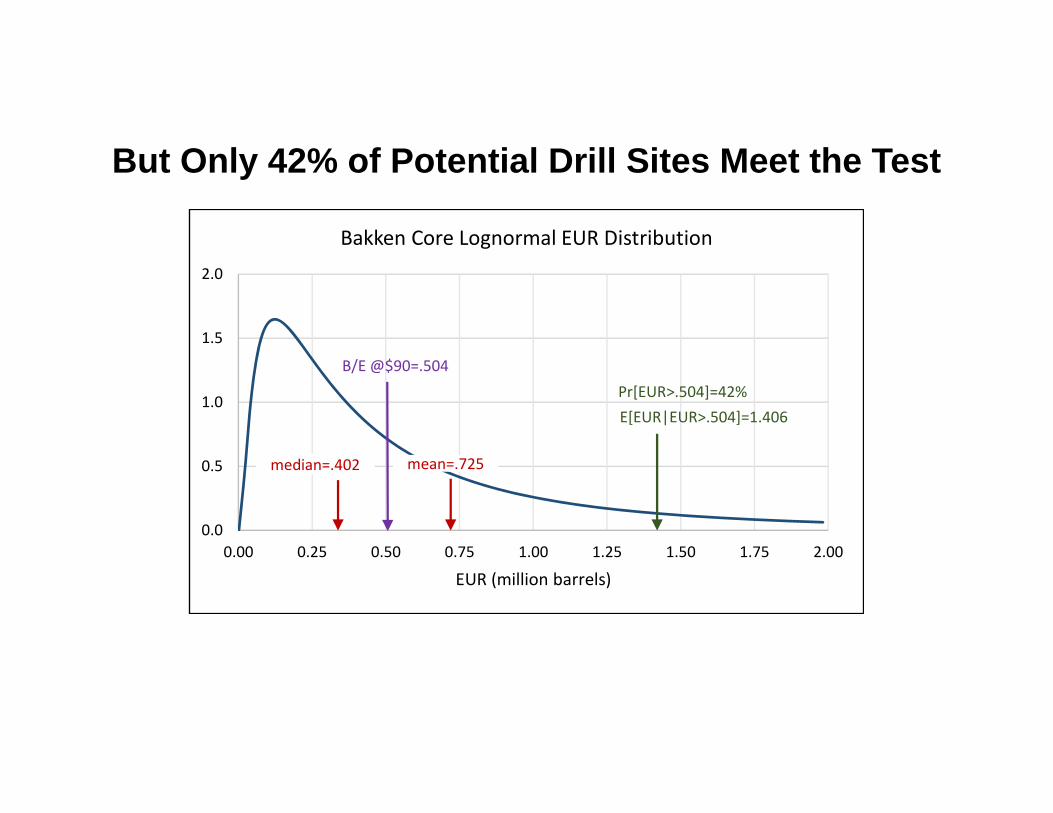
But Only 42% of Potential Drill Sites Meet the Test
0.0
0.5
1.0
1.5
2.0
0.00 0.25 0.50 0.75 1.00 1.25 1.50 1.75 2.00
EUR (million barrels)
Bakken Core Lognormal EUR Distribution
mean=.725median=.402
B/E @$90=.504
E[EUR|EUR>.504]=1.406Pr[EUR>.504]=42%
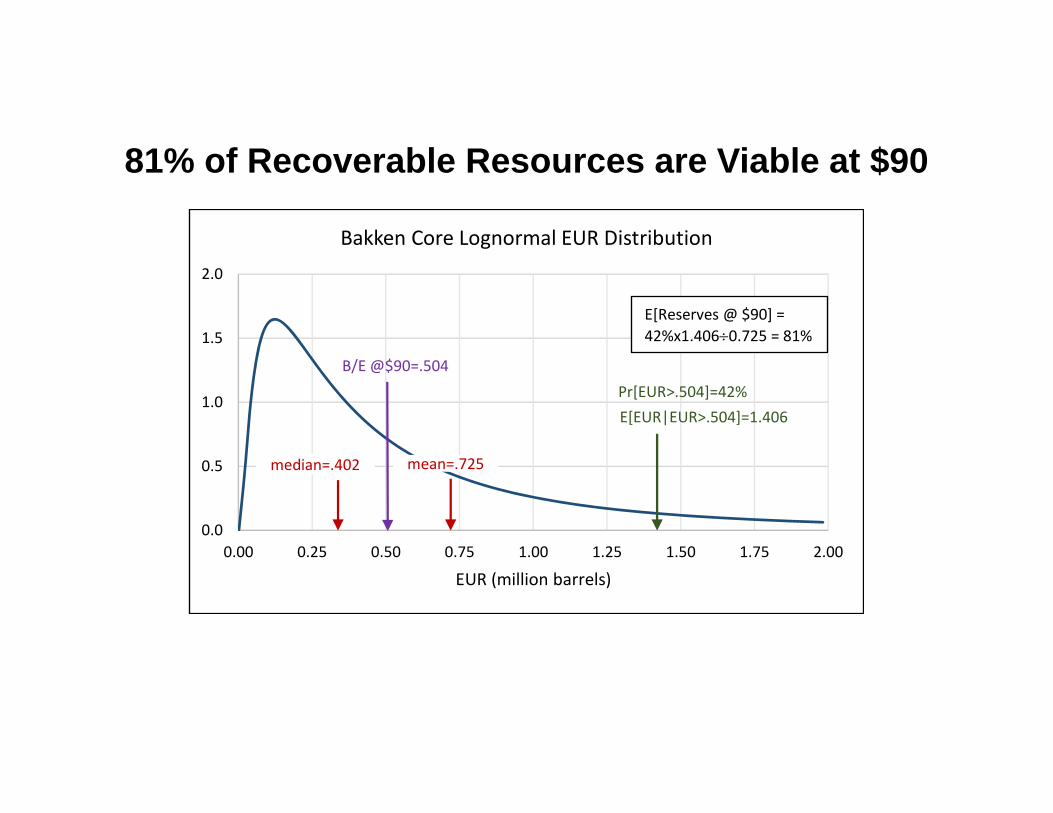
81% of Recoverable Resources are Viable at $90
0.0
0.5
1.0
1.5
2.0
0.00 0.25 0.50 0.75 1.00 1.25 1.50 1.75 2.00
EUR (million barrels)
Bakken Core Lognormal EUR Distribution
mean=.725median=.402
B/E @$90=.504
E[EUR|EUR>.504]=1.406Pr[EUR>.504]=42%
E[Reserves @ $90] = 42%x1.4060.725 = 81%
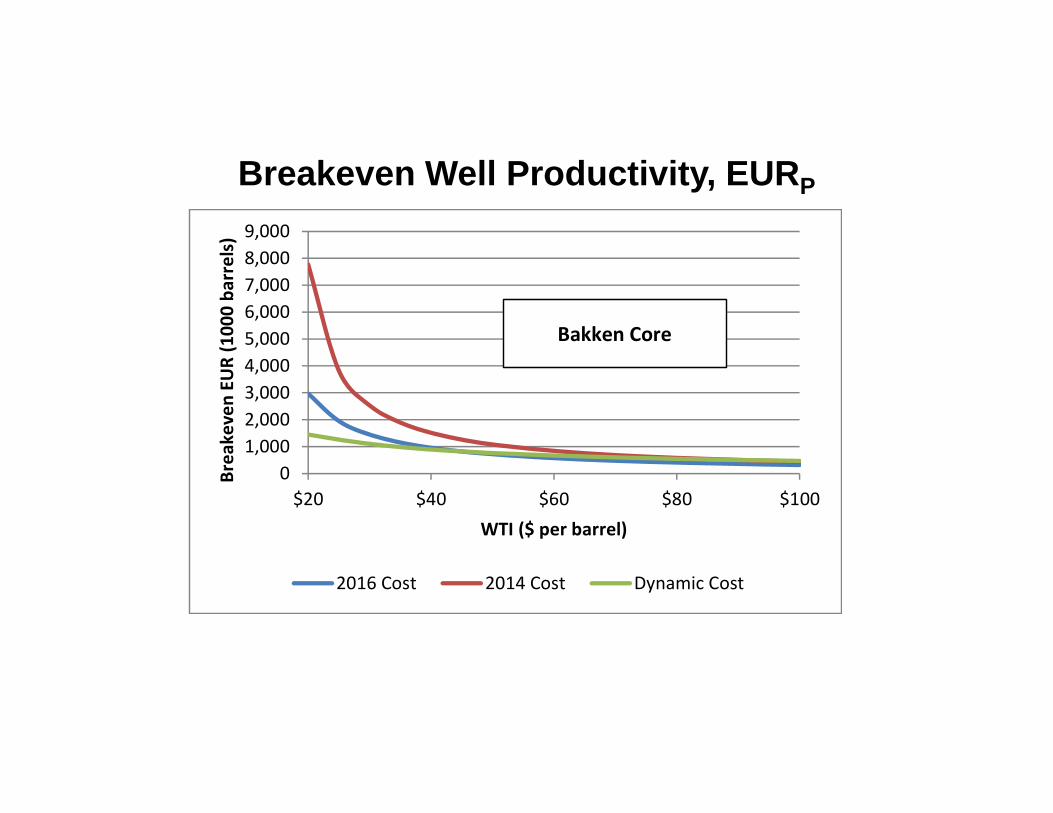
Breakeven Well Productivity, EURP
01,0002,0003,0004,0005,0006,0007,0008,0009,000
$20 $40 $60 $80 $100
Breakeven EU
R (100
0 ba
rrels)
WTI ($ per barrel)
2016 Cost 2014 Cost Dynamic Cost
Bakken Core
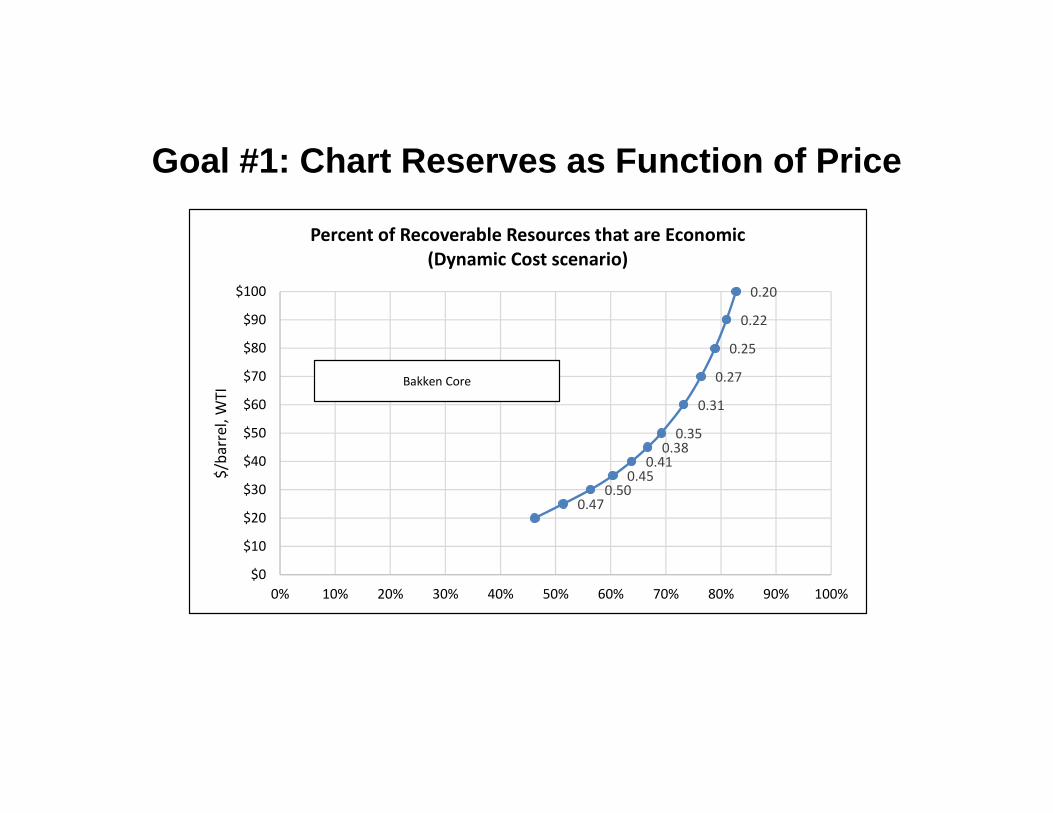
Goal #1: Chart Reserves as Function of Price
0.470.50
0.450.41
0.380.35
0.31
0.27
0.25
0.22
0.20
$0
$10
$20
$30
$40
$50
$60
$70
$80
$90
$100
0% 10% 20% 30% 40% 50% 60% 70% 80% 90% 100%
$/barrel, W
TIPercent of Recoverable Resources that are Economic
(Dynamic Cost scenario)
Bakken Core
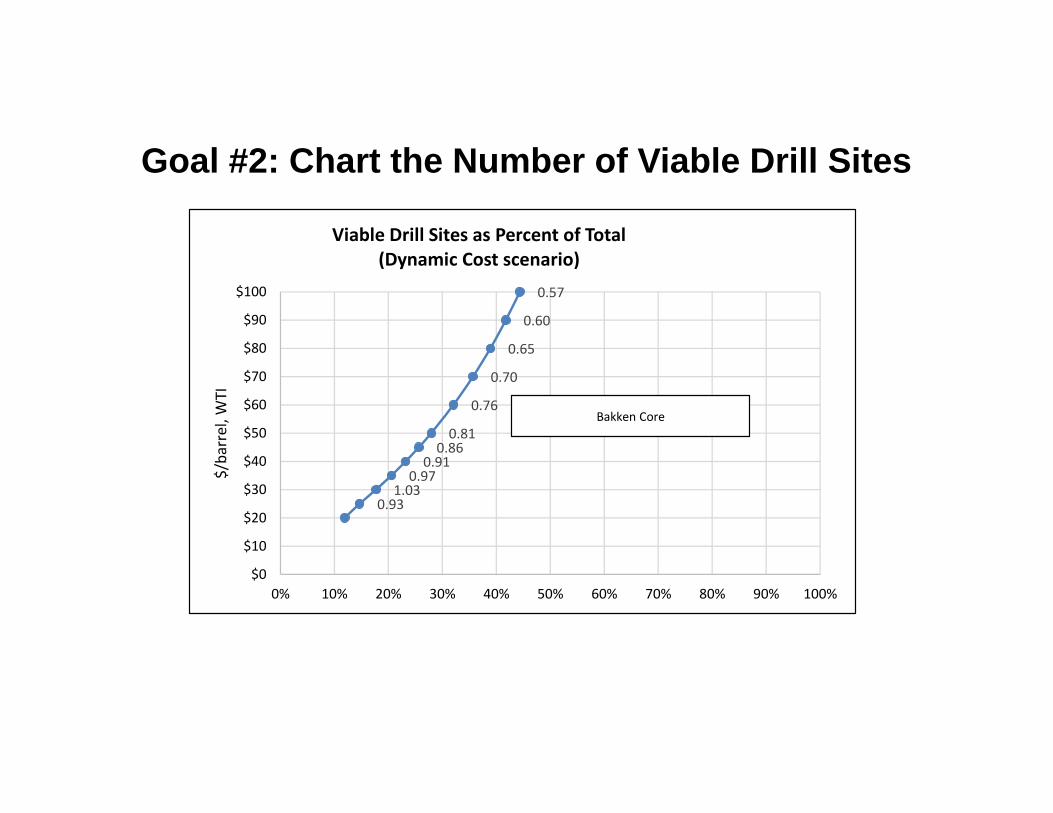
Goal #2: Chart the Number of Viable Drill Sites
0.93
1.03 0.97 0.91 0.86 0.81
0.76
0.70
0.65
0.60
0.57
$0
$10
$20
$30
$40
$50
$60
$70
$80
$90
$100
0% 10% 20% 30% 40% 50% 60% 70% 80% 90% 100%
$/barrel, W
TIViable Drill Sites as Percent of Total
(Dynamic Cost scenario)
Bakken Core
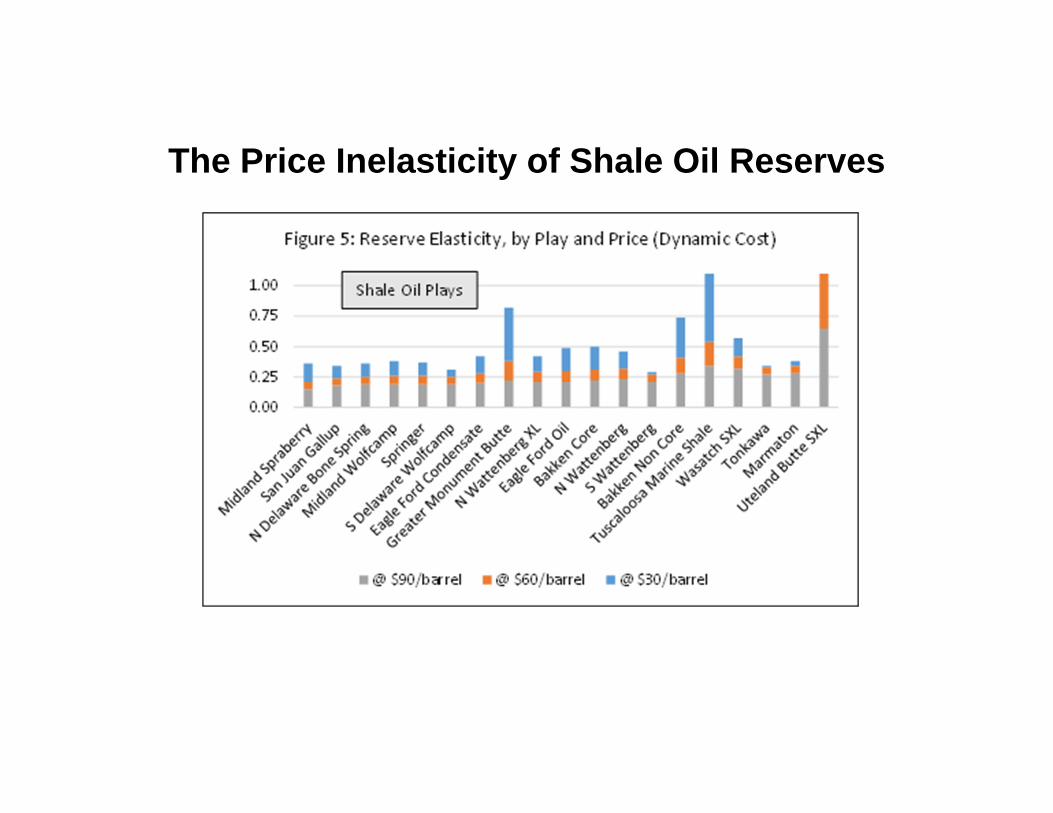
The Price Inelasticity of Shale Oil Reserves

The Price Elasticity of Viable Drill Sites