petrobras general overview
TRANSCRIPT
__
Petrobras
General Overview
STRATEGIC PLAN 2017-2021 BUSINESS AND MANAGEMENT PLAN —
3
FORWARD-LOOKING STATEMENTS:
DISCLAIMER
The presentation may contain forward-looking statements about future events within the meaning of Section 27A of the Securities Act of 1933, as amended, and Section 21E of the Securities Exchange Act of 1934, as amended, that are not based on historical facts and are not assurances of future results. Such forward-looking statements merely reflect the Company’s current views and estimates of future economic circumstances, industry conditions, company performance and financial results. Such terms as "anticipate", "believe", "expect", "forecast", "intend", "plan", "project", "seek", "should", along with similar or analogous expressions, are used to identify such forward-looking statements. Readers are cautioned that these statements are only projections and may differ materially from actual future results or events. Readers are referred to the documents filed by the Company with the SEC, specifically the Company’s most recent Annual Report on Form 20-F, which identify important risk factors that could cause actual results to differ from those contained in the forward-looking statements, including, among other things, risks relating to general economic and business conditions, including crude oil and other commodity prices, refining margins and prevailing exchange rates, uncertainties inherent in making estimates of our oil and gas reserves including recently discovered oil and gas reserves, international and Brazilian political, economic and social developments, receipt of governmental approvals and licenses and our ability to obtain financing.
Disclaimer —
We undertake no obligation to publicly update or revise any forward-looking statements, whether as a result of new information or future events or for any other reason. Figures for 2016 on are estimates or targets.
All forward-looking statements are expressly qualified in their entirety by this cautionary statement, and you should not place reliance on any forward-looking statement contained in this presentation.
In addition, this presentation also contains certain financial measures that are not recognized under Brazilian GAAP or IFRS. These measures do not have standardized meanings and may not be comparable to similarly-titled measures provided by other companies. We are providing these measures because we use them as a measure of company performance; they should not be considered in isolation or as a substitute for other financial measures that have been disclosed in accordance with Brazilian GAAP or IFRS.
NON-SEC COMPLIANT OIL AND GAS RESERVES:
CAUTIONARY STATEMENT FOR US INVESTORS
We present certain data in this presentation, such as oil and gas resources, that we are not permitted to present in documents filed with the United States Securities and Exchange Commission (SEC) under new Subpart 1200 to Regulation S-K because such terms do not qualify as proved, probable or possible reserves under Rule 4-10(a) of Regulation S-X.
General - February 2017
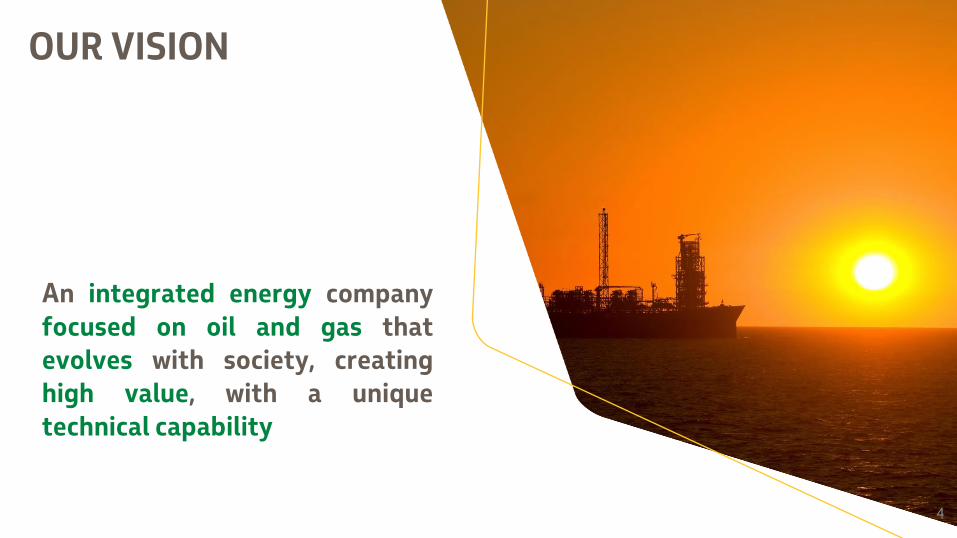
An integrated energy company
focused on oil and gas that evolves with society, creating high value, with a unique
technical capability
OUR VISION
4

OUR VALUES
Ethics and transparency
Market driven
Results oriented
Overcoming and confidence
5
Respect for life,
people and
environment

Main Metrics of Strategic Plan (SP) and Business and Management Plan (BMP) —
SAFETY FINANCIAL
Reduction of
36% In the Total Recordable Injury
Frequency Rate (TRIFR*)
Reduction in
LEVERAGE Net Debt/EBITDA
* TRIFR = number of reportable injuries per million man-hours
TO
2.5
by 2018
FROM
5.3 in 2015
TO
1.4
in 2018
FROM
2.2 in 2015
6

Highlights of the Plan —
main metrics drive the strategy
Unified Plan
New management system with targets up to supervisory level
Disciplined execution: systematic monitoring of
goals with mid-course corrections
New tools of
cost management Meritocracy
2 (SP and BMP)
7
Engagement of the leadership
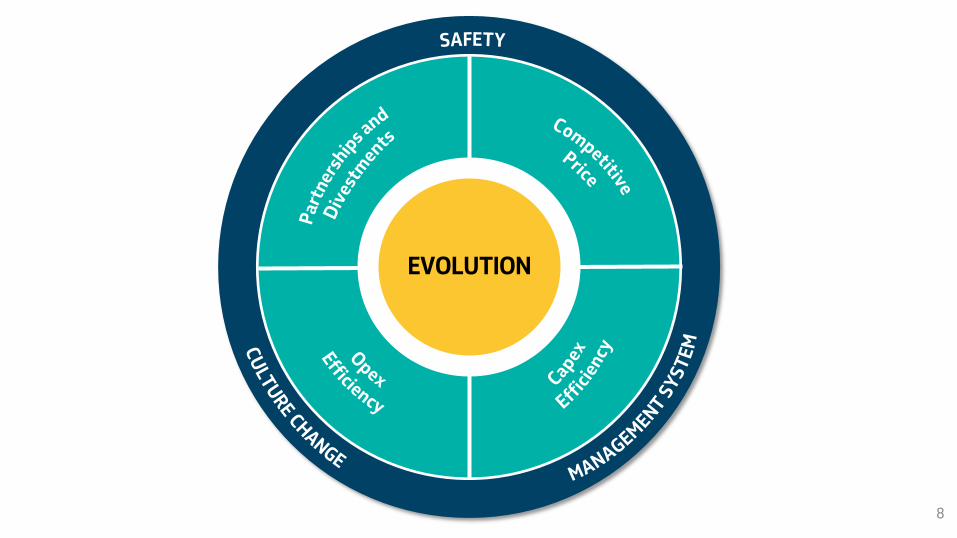
EVOLUTION
8

Main variables in the base case scenario —
48
Brent Prices (US$/bbl - base year 2016)
Nominal exchange rate (R$/US$)
56
68 71
0
40
80
120
2016 2017 2018 2019 2020 2021
Source: Petrobras; IHS, PIRA, IEA, Focus report
Range of estimates(IHS, PIRA and IEA)
71
45
9
Petrobras
3.48 3.55 3.71 3.72 3.74 3.78
2,20
2,70
3,20
3,70
4,20
4,70
2016 2017 2018 2019 2020 2021
Intervalo Focus Petrobras
4.70
4.20
3.70
3.20
2.70
2.20
Market forecast Range of estimates (IHS,PIRA and IEA)

Brazilian market for oil products resumes growth —
10
0
500
1000
1500
2000
2500
2017 2021
917 997
529 476
863 956
Brazilian oil products market (Million bpd)
Diesel Others Gasoline
2.3 2.4
+5.2%

Cost reductions —
142
126
2015-2019 BMP
2017-2021 Estimates
2017-2021 BMP
-18%
53% 37%
10%
E&P RGN Demais áreas
Manageable operating costs* (US$ Billion)
11
153
Other segments Refining & Natural Gas (RNG)
* Manageable operating costs: lifting, refining, logistics and distribution costs, overhead and others

Partnerships and divestments —
2015-2016 2017-2018
19.5
15.1
Amount in US$ Billion
12
Benefits of the partnerships
Risk sharing
Capex reduction
Increased capacity to invest along the value chain
Technological exchange
Strengthening of corporate governance
The partnerships and divestments program of Petrobras leverages third parties investments that might surpass US$ 40 Billion* in the next 10 years.
* Does not consider investment of suppliers to increase capacity
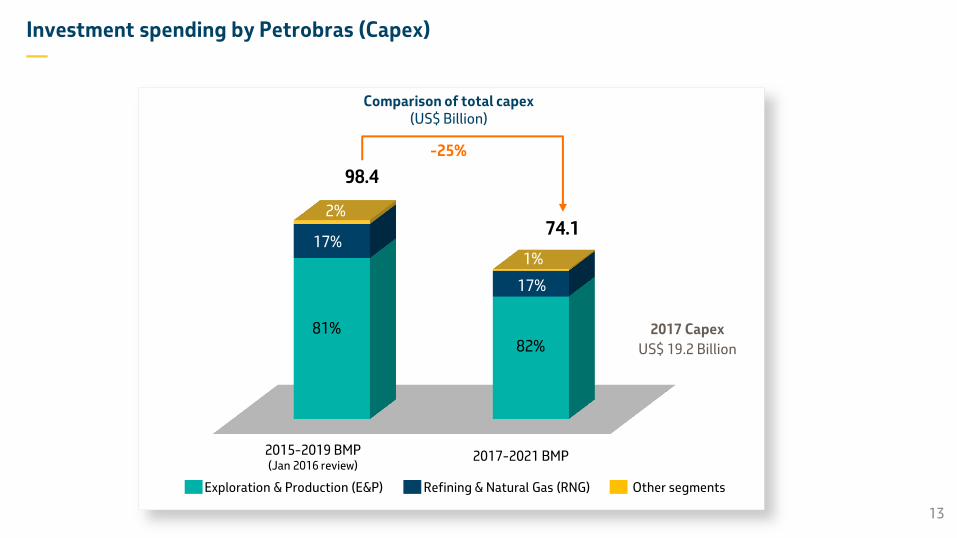
Investment spending by Petrobras (Capex) —
13
2017 Capex
US$ 19.2 Billion
0,00
20,00
40,00
60,00
80,00
100,00
PNG 2015-2019
(revisão JAN 2016)
PNG 2017-2021
81% 82%
17%
17%
2%
1%
Comparison of total capex (US$ Billion)
Exploration & Production (E&P) Other segments Refining & Natural Gas (RNG)
98.4
74.1
-25%
2015-2019 BMP (Jan 2016 review)
2017-2021 BMP
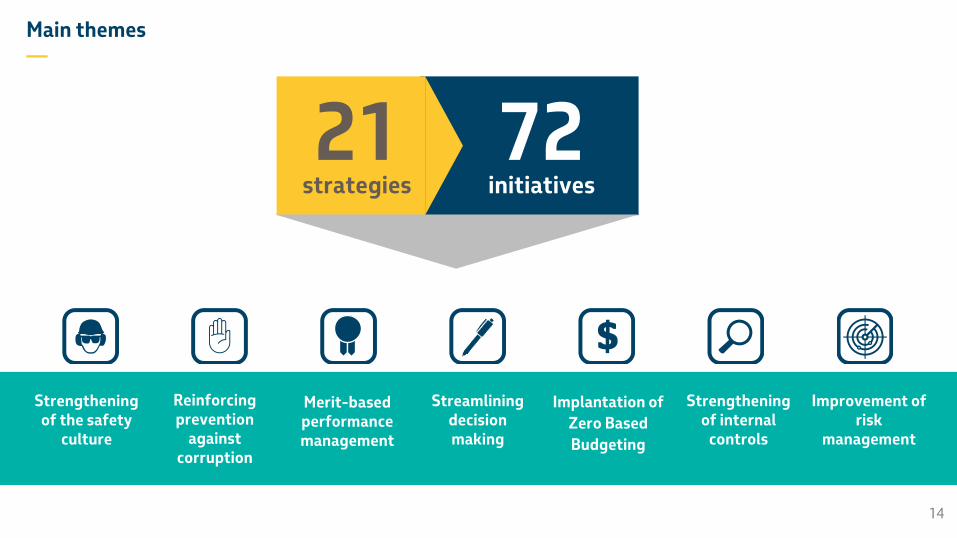
72 initiatives
Main themes —
21 strategies
Implantation of
Zero Based
Budgeting
Strengthening of internal
controls
Merit-based performance management
Strengthening of the safety
culture
Streamlining decision making
Improvement of risk
management
14
Reinforcing prevention
against corruption

EXPLORATION & PRODUCTION —
15

Pre-Salt Post-Salt
34% 66%
Production Development + Exploration
Total E&P US$ 60.6 billion
Upstream Capex Breakdown —
Suporte Operacional Exploração
13% 11%
76%
16
Development of production Exploration Operational support
Concession Transfer of Rights Production Sharing (Libra)

17
Greater well productivity in concessions
Experience acquired in well construction
Fewer wells to top capacity
3 times faster
Shorter well construction time in concessions
2016
2010
26
20
2016
2010
6
8
kbpd/well
Until 2016
Until 2010
124
3
2016
2010
89
310
Days construction per well
Efficiency gains: Santos Basin pre-salt case —
+ 30% productivity - 25% wells
204 wells drilled
Lower capex for the same production
Number of wells built (drilled and completed)
Producing wells

Lula field: faster well construction and connection —
2010 2016
60% reduction in well construction and connection times
6 units in Angra dos Reis Paraty Itaguaí Mangaratiba Maricá Saquarema
1 unit in Angra dos Reis
18
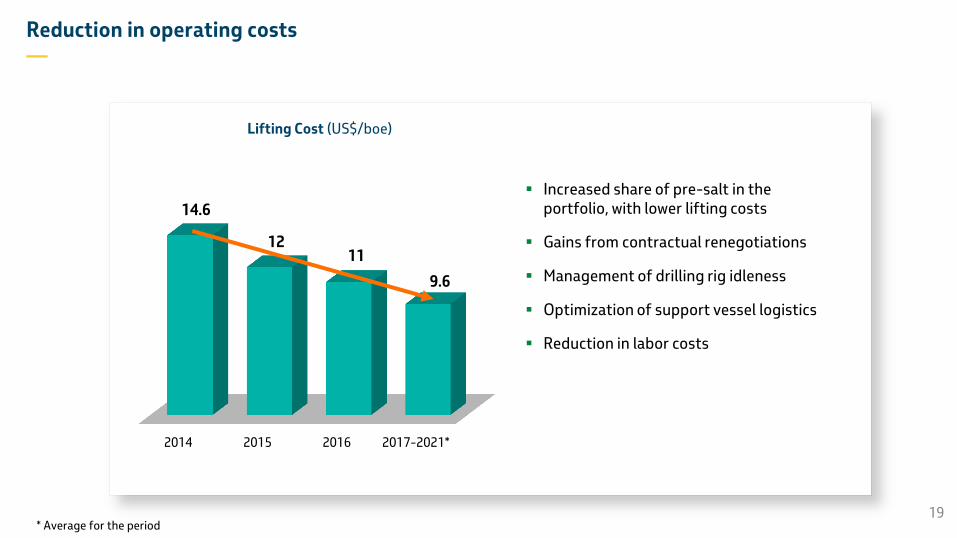
Increased share of pre-salt in the portfolio, with lower lifting costs
Gains from contractual renegotiations
Management of drilling rig idleness
Optimization of support vessel logistics
Reduction in labor costs
Reduction in operating costs —
Lifting Cost (US$/boe)
0
2
4
6
8
10
12
14
16
2014 2015 2016 2017-2021*
14.6
12 11
9.6
* Average for the period 19

0
250
500
750
1000
1250
1500
1750
2000
20
01
20
03
20
05
20
07
20
09
20
11
20
13
20
15
20
17
20
19
20
21
Oil production in the Campos
Basin (kbpd)
Stable decline of around 9*%
Opportunities in the Campos Basin —
• Operations with emphasis on strategic partnerships, seeking to increase recovery
• Extension of concessions
• Revitalization of Marlim project
*Below the industry average of 12% for deepwater wells
Bacia de Campos
20
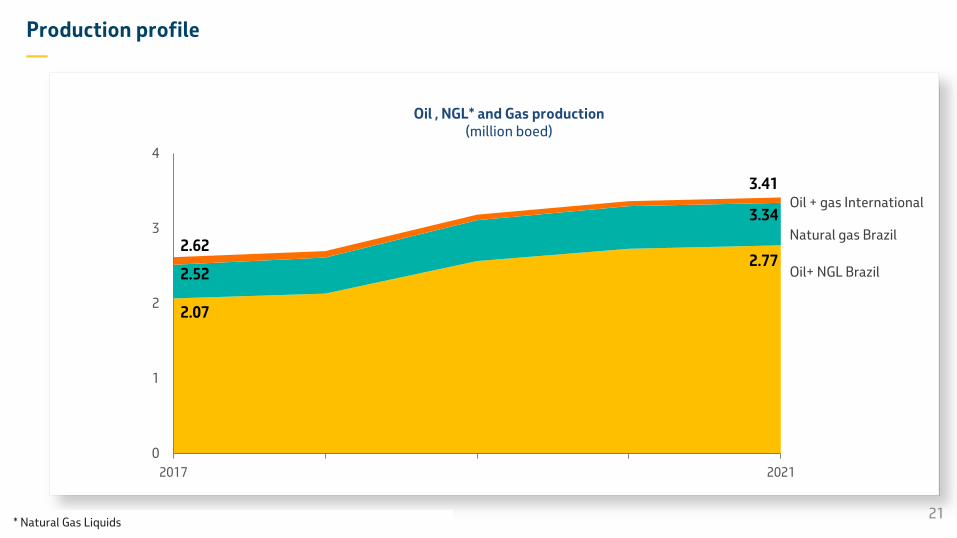
21
0
1
2
3
4
2017 2021
Produção Óleo, LGN e Gás
Oil+ NGL Brazil
Oil + gas International
2.52
3.34
2.07
2.77
Natural gas Brazil 2.62
3.41
Production profile —
Oil , NGL* and Gas production (million boed)
* Natural Gas Liquids
LEGEND
CONCESSION
PSA
TRANSFER OF RIGHTS
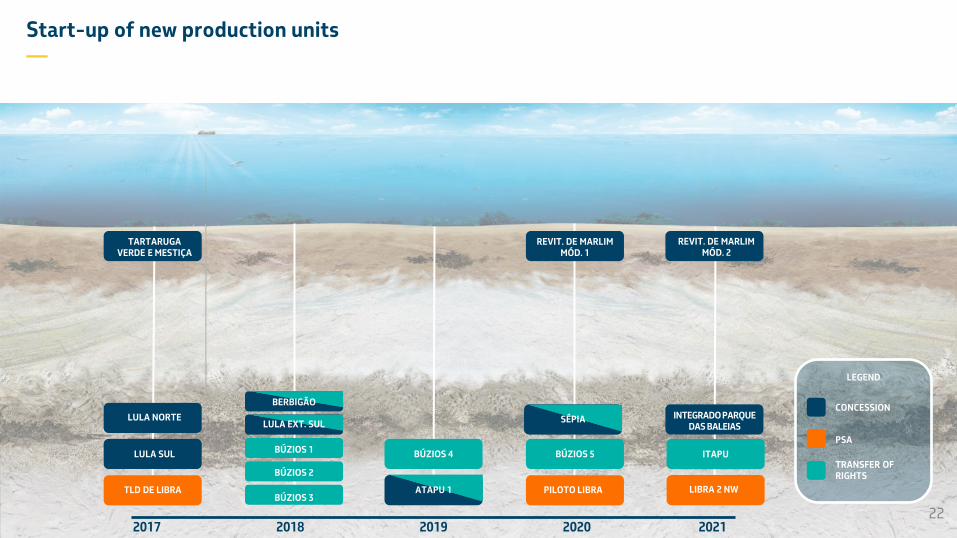
22
Start-up of new production units —
2017 2018 2019 2020 2021
TARTARUGA VERDE E MESTIÇA
LULA NORTE
LULA SUL
TLD DE LIBRA
BÚZIOS 2
BÚZIOS 1
BÚZIOS 3
BÚZIOS 4 BÚZIOS 5
PILOTO LIBRA
REVIT. DE MARLIM MÓD. 1
REVIT. DE MARLIM MÓD. 2
LIBRA 2 NW
ITAPU
INTEGRADO PARQUE DAS BALEIAS
BERBIGÃO
LULA EXT. SUL
ATAPU 1
SÉPIA

REFINING & NATURAL GAS
—
23
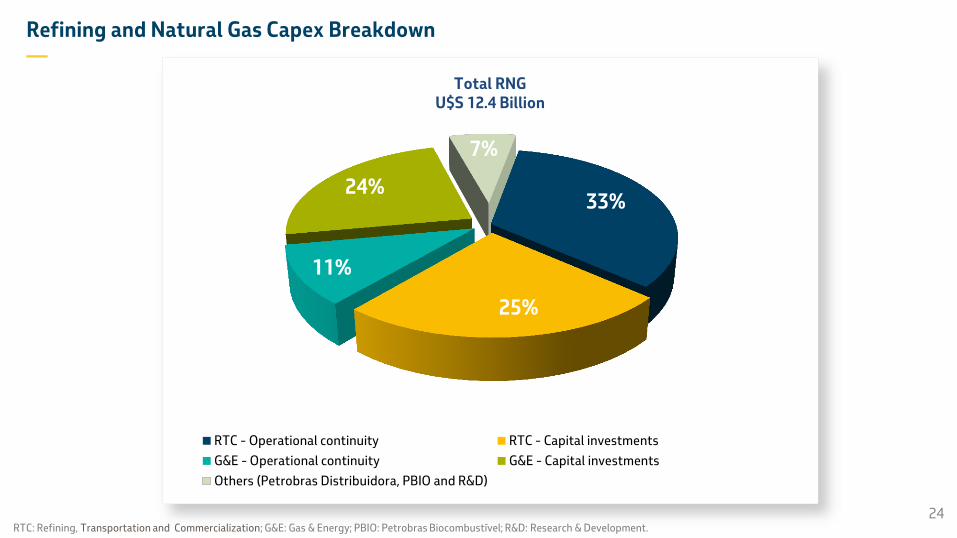
33%
25%
11%
24%
7%
RTC - Operational continuity RTC - Capital investments
G&E - Operational continuity G&E - Capital investments
Others (Petrobras Distribuidora, PBIO and R&D)
Total RNG U$S 12.4 Billion
24 RTC: Refining, Transportation and Commercialization; G&E: Gas & Energy; PBIO: Petrobras Biocombustível; R&D: Research & Development.
Refining and Natural Gas Capex Breakdown —
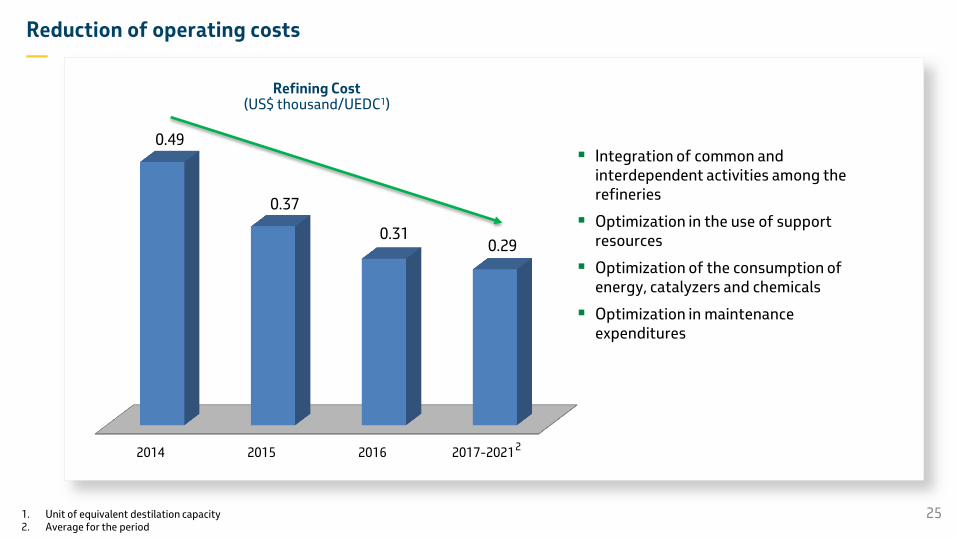
2014 2015 2016 2017-2021
0.49
0.37
0.31 0.29
Integration of common and interdependent activities among the refineries
Optimization in the use of support resources
Optimization of the consumption of energy, catalyzers and chemicals
Optimization in maintenance expenditures
Reduction of operating costs —
Refining Cost (US$ thousand/UEDC1)
25 1. Unit of equivalent destilation capacity 2. Average for the period
2
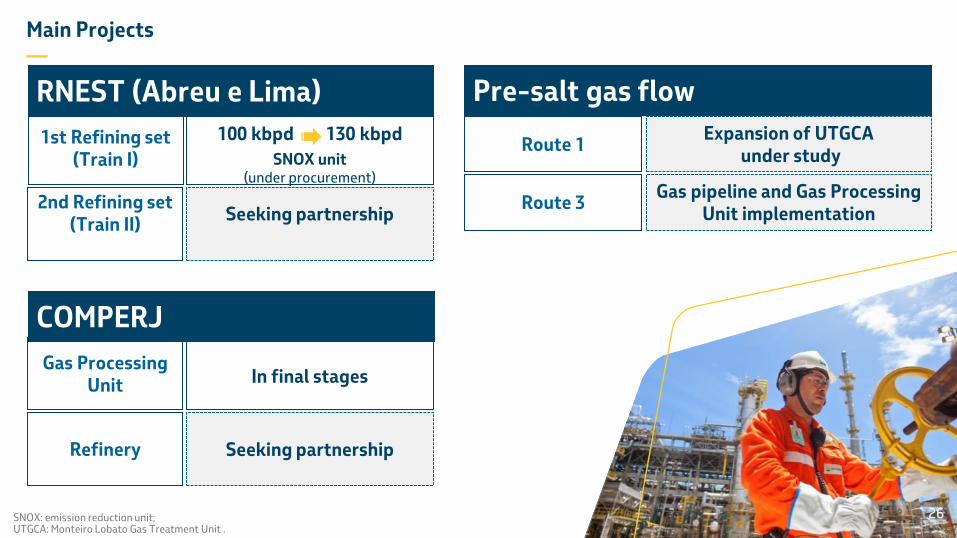
Main Projects —
26 SNOX: emission reduction unit; UTGCA: Monteiro Lobato Gas Treatment Unit .
Seeking partnership
Seeking partnership
In final stages
100 kbpd 130 kbpd
SNOX unit (under procurement)
1st Refining set (Train I)
2nd Refining set (Train II)
Gas Processing Unit
Refinery
RNEST (Abreu e Lima)
COMPERJ
Expansion of UTGCA under study
Route 1
Pre-salt gas flow
Gas pipeline and Gas Processing Unit implementation
Route 3
26
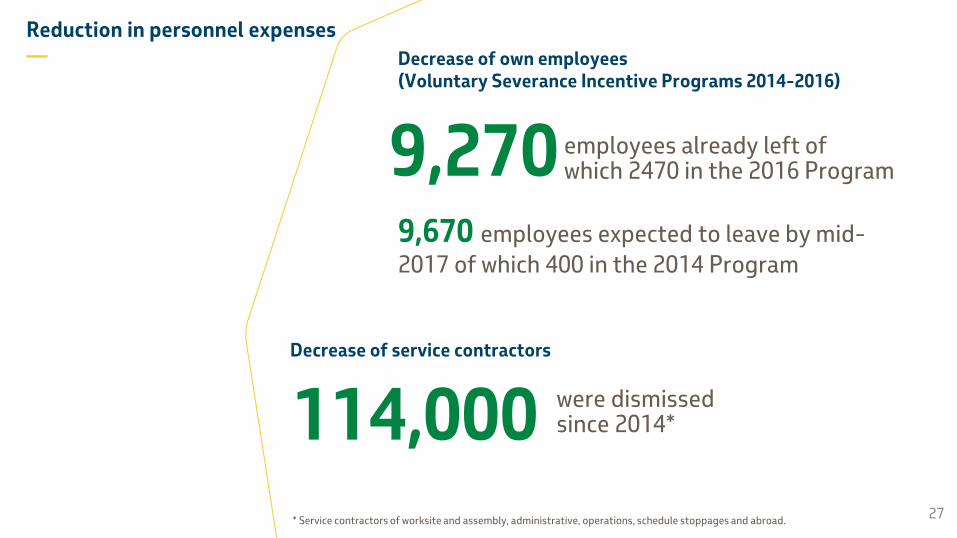
Reduction in personnel expenses —
employees already left of which 2470 in the 2016 Program
9,670 employees expected to leave by mid-
2017 of which 400 in the 2014 Program
9,270
27
Decrease of own employees (Voluntary Severance Incentive Programs 2014-2016)
Decrease of service contractors
114,000 were dismissed since 2014*
* Service contractors of worksite and assembly, administrative, operations, schedule stoppages and abroad.

Due diligence counterparty
Integrity background check for candidates to key positions
Adherence to the Code of Ethics and the Guide to Ethical Conduct for 100% of employees
Board of Directors and Executive Board are selected exclusively by technical criteria
Independent whistleblower channel
Correction Committee
Foreign Corrupt Practices Act
DOJ and SEC
UK Bribery Act
Brazilian Law 12.846/2013 Brazilian Decree-Law 8.420/2015
Brazilian Law 13.303/2016
CORRUPTION PREVENTION
Program
Code of
ETHICS
28
Measures adopted to strengthen compliance —
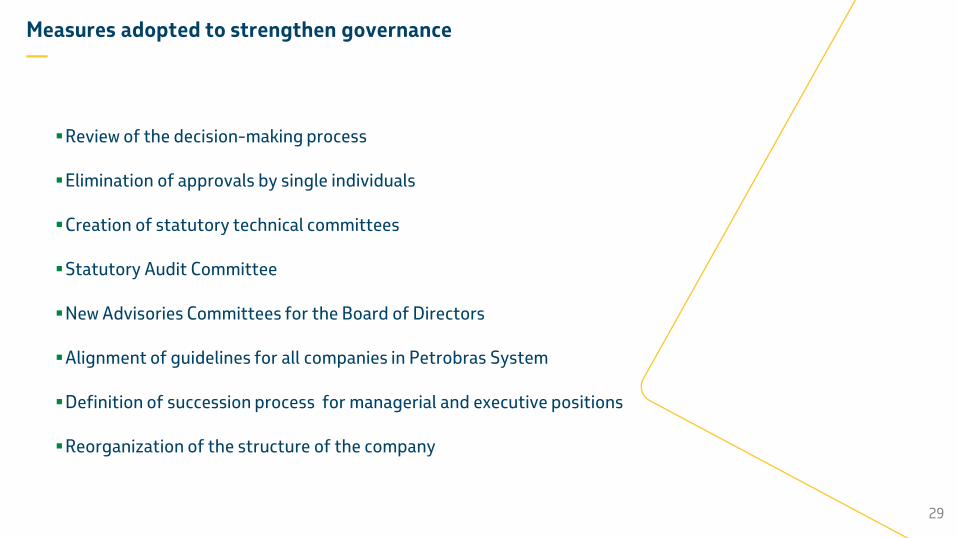
Review of the decision-making process
Elimination of approvals by single individuals
Creation of statutory technical committees
Statutory Audit Committee
New Advisories Committees for the Board of Directors
Alignment of guidelines for all companies in Petrobras System
Definition of succession process for managerial and executive positions
Reorganization of the structure of the company
29
Measures adopted to strengthen governance —

FINANCE —
30

Sources and Uses —
158
19
2
Sources
74
73
32
Uses
Partnerships and divestments are
essential to enable the planned
capex
179 179
31
Investments
Amortizations
Financial Expenses Operating Cash Flow (after dividends)
Use of Cash
Partnerships and Divestments
Sources and Uses 2017-2021 (US$ billion)
No requirement for new net debt
during the 2017-2021 period

Main risks* —
Material changes to market conditions
Divestments and partnerships below plan
Judicial disputes
Renegotiation of the Transfer of Rights terms
Impact of Local Content on costs and timing of the projects
Delays in the construction of platforms
Higher than expected capex
*These risks are not exhaustive
Risks and mitigating activities managed by accountable people

3Q16 Results —
33

34
Production continues in an upward trend Production increases 2.5% in the period
Production (MMboe/d)
2.14 2.12 1.98 2.13 2.22
0.10 0.10 0.09
0.09 0.08 0.57 0.56
0.55 0.58 0.57
2.80 2.78 2.62
2.80 2.87
3Q15 4Q15 1Q16 2Q16 3Q16
Oil Brazil Oil International Natural Gas
+4% +8% Oil production in Brazil
Oil and gas production
Operated production
Production Records
2.22 MMbbl/d
2.87 MMboe/d
3.17 MMboe/d
Seven of the eight Pre-Salt platforms in Campos Basin have reached full capacity
+2.5%
+2.3%

35
Lifting cost keeps downward trend
12.1 10.4
9M15 9M16
Lifting Cost*
(US$/boe)
Pre-Salt Lifting Cost Below 8 Dollars per barrel
< 8.0 US$ boe
11.0
10.6 10.5
3Q15 2Q16 3Q16
Lifting Cost 3Q15 vs 3Q16 We reduced by 20% the maneageble operating costs in the same period in which production grew by 2,5%
* Lifting Cost in Brazil and abroad
Lifting Cost* (US$/boe)
-14%
36
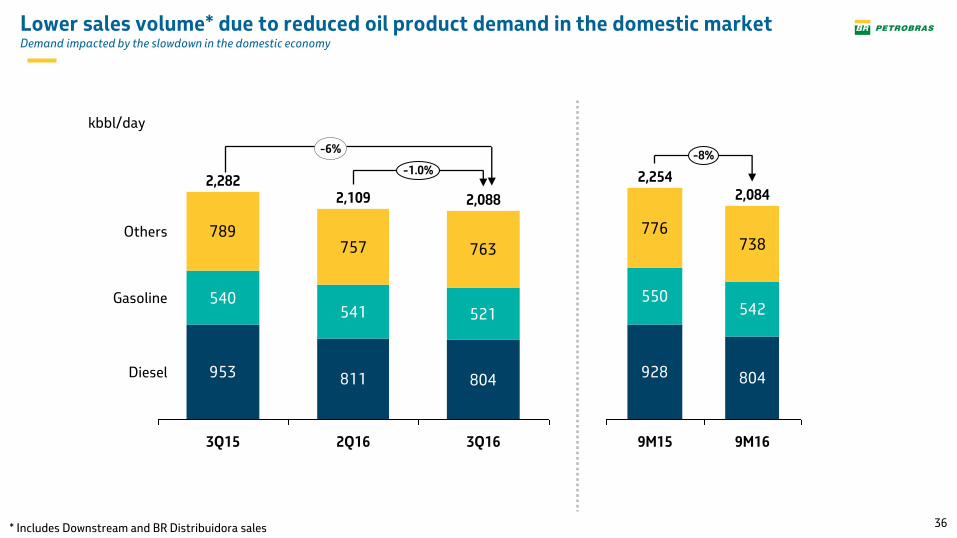
Lower sales volume* due to reduced oil product demand in the domestic market Demand impacted by the slowdown in the domestic economy
953 811 804
540541 521
789757 763
Diesel
Gasoline
Others
3Q16
2,088
2Q16
2,109
3Q15
2,282 -1.0%
kbbl/day
-6%
928 804
550542
776738
9M16
-8%
2,084
9M15
2,254
* Includes Downstream and BR Distribuidora sales
37
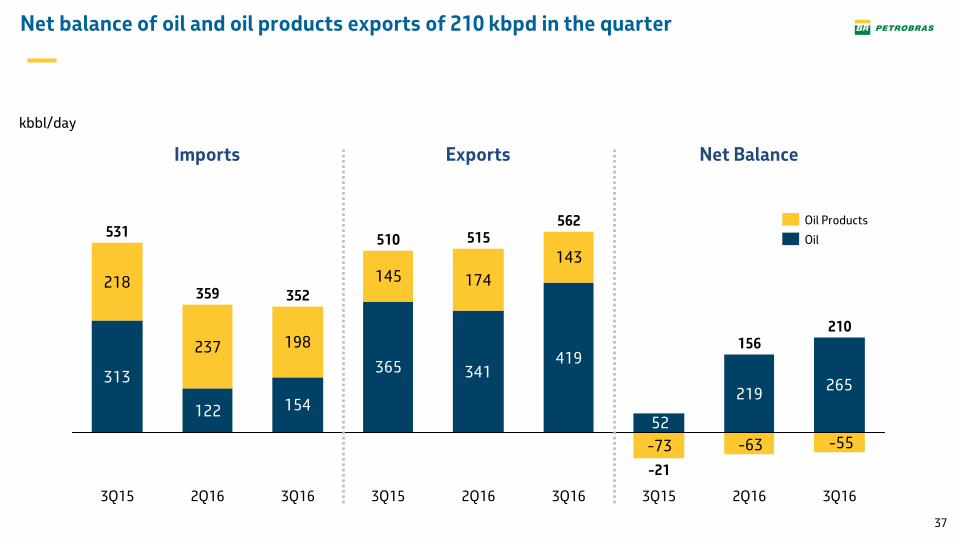
Net balance of oil and oil products exports of 210 kbpd in the quarter
313
122 154
365 341419
218
237 198
145 174
143
-55-63-73
265219
52
352
531
3Q16
210
2Q16
515
3Q15 3Q16 2Q16
359
3Q15
562
510
2Q16
156
3Q15
-21
3Q16
Imports Exports Net Balance
Oil
Oil Products
kbbl/day

38
Positive free cash flow for the sixth quarter in a row
Operating Cash Flow
Free Cash Flow Investments2
Adjusted EBITDA1
3Q15
15.5 21.6
3Q16 2Q16
20.3
3Q15
18.0 11.2
3Q16
10.3
2Q16
3.8
3Q16 3Q15
10.8
2Q16
16.4
3Q16
26.7
2Q16 3Q15
21.9 21.8
1. Adjusted EBITDA is the sum of EBITDA, share of earning in equity-accounted investments and cumulative translation adjustments – CTA. 2. Cash basis
R$ Billion
19 28 33
+11%
63.0
9M16
56.8
9M15
24 30
+8%
9M15
66.0
9M16
61.1
36.3
52.8
9M15
-31%
9M16
+256%
9M16 9M15
8.3
29.6
Adjusted EBITDA Margin (%)
39
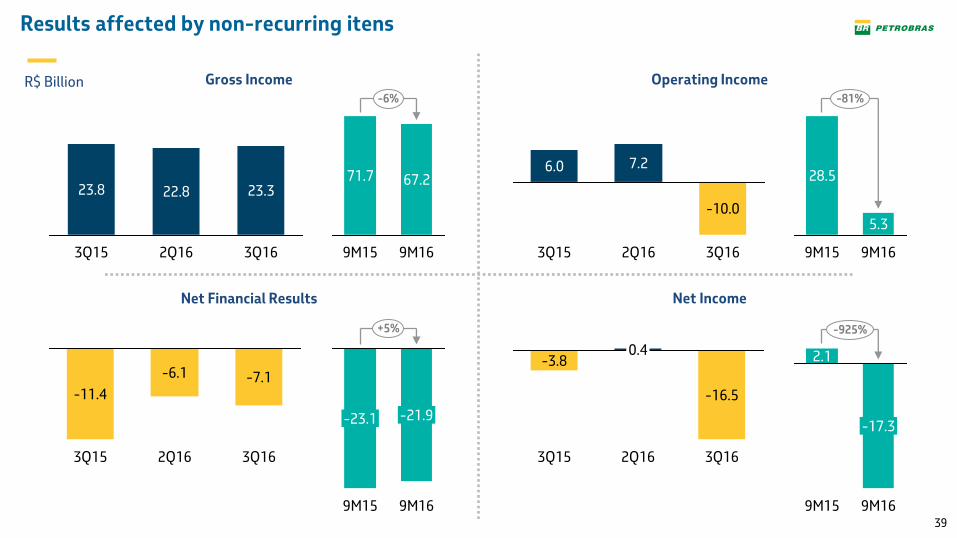
Results affected by non-recurring itens
Operating Income
Net Income Net Financial Results
Gross Income
3Q16
-7.1
2Q16
-6.1
3Q15
-11.4
3Q16
-16.5
2Q16
0.4
3Q15
-3.8
3Q16
-10.0
2Q16
7.2
3Q15
6.0
3Q16
23.3
2Q16
22.8
3Q15
23.8
R$ Billion -6%
9M16
67.2
9M15
71.7
-81%
9M16
5.3
9M15
28.5
+5%
9M16
-21.9
9M15
-23.1
-925%
9M16
-17.3
9M15
2.1
40
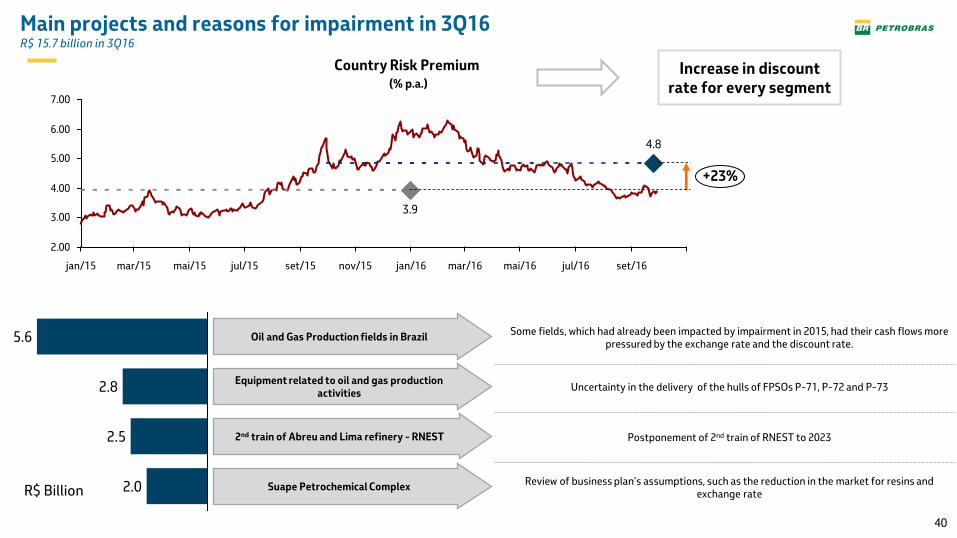
Main projects and reasons for impairment in 3Q16 R$ 15.7 billion in 3Q16
R$ Billion
7.00
6.00
5.00
4.00
3.00
2.00
mai/15 jul/15 set/15 nov/15 jan/16 mar/16 mai/16 jul/16 set/16 mar/15 jan/15
+23%
4.8
3.9
Country Risk Premium (% p.a.)
2.0
2.5
2.8
5.6 Some fields, which had already been impacted by impairment in 2015, had their cash flows more pressured by the exchange rate and the discount rate.
Uncertainty in the delivery of the hulls of FPSOs P-71, P-72 and P-73
Postponement of 2nd train of RNEST to 2023
Review of business plan’s assumptions, such as the reduction in the market for resins and exchange rate
Oil and Gas Production fields in Brazil
Equipment related to oil and gas production activities
2nd train of Abreu and Lima refinery - RNEST
Suape Petrochemical Complex
Increase in discount rate for every segment

41
In 3Q16, Petrobras did not provision
nor closed settlements related to
the class action and other individual
actions.
The ongoing discussions encompass very complex issues and are subject to substantial uncertainties.
Individual Actions – New York
In October 2016, Petrobras reached
an agreement to settle four
individual actions, with the plaintiffs
below:
• Dodge & Cox Int'l Stock Fund;
• Janus Overseas Fund;
• PIMCO Total Return Fund;
• Al Shams Investments.al.
In 3Q16, Petrobras provisioned for
individual actions under
negotiation, for which settlements
were not yet reached.
Settlement in 3Q16 Provision in 3Q16
Settlement in 3Q16 Provision in 3Q16
Settlement in 3Q16 Provision in 3Q16
Individual actions (negotiated)
Individual actions (under negotiation)
Class action + other individual
actions
Provision of R$ 1.2 billion in 3Q16
42
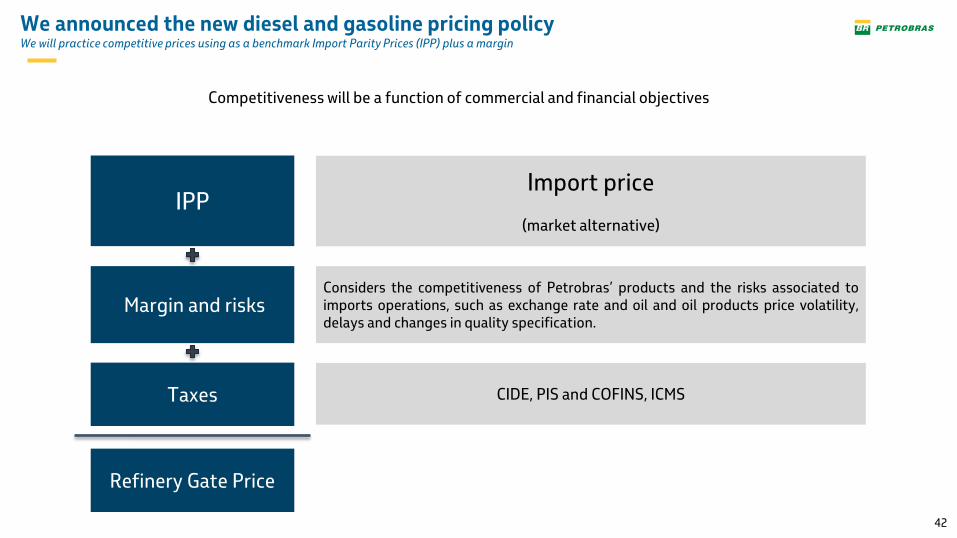
We announced the new diesel and gasoline pricing policy We will practice competitive prices using as a benchmark Import Parity Prices (IPP) plus a margin
Import price
(market alternative)
Taxes
Margin and risks
IPP
Considers the competitiveness of Petrobras’ products and the risks associated to imports operations, such as exchange rate and oil and oil products price volatility, delays and changes in quality specification.
Competitiveness will be a function of commercial and financial objectives
CIDE, PIS and COFINS, ICMS
Refinery Gate Price
43
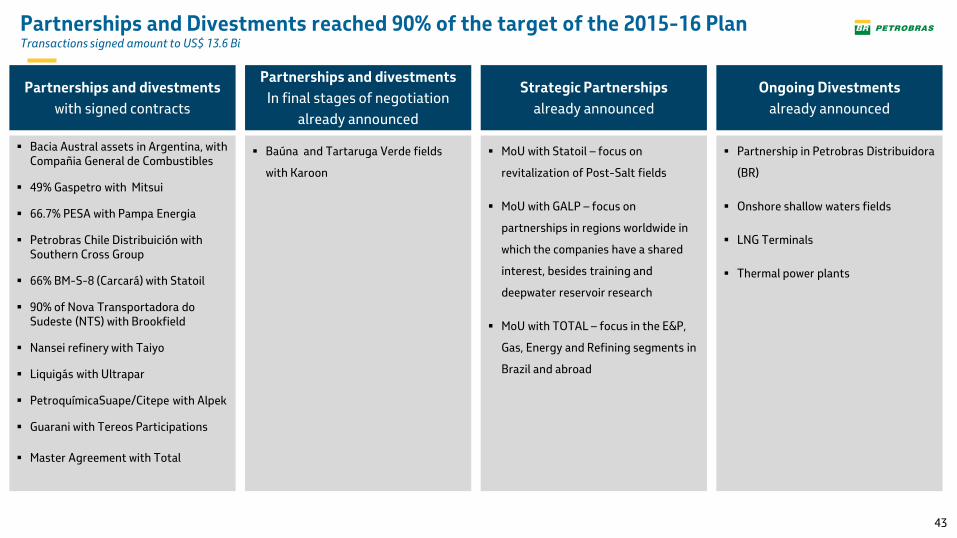
Partnerships and Divestments reached 90% of the target of the 2015-16 Plan Transactions signed amount to US$ 13.6 Bi
Partnerships and divestments
with signed contracts
Bacia Austral assets in Argentina, with Compañia General de Combustibles
49% Gaspetro with Mitsui
66.7% PESA with Pampa Energia
Petrobras Chile Distribuición with Southern Cross Group
66% BM-S-8 (Carcará) with Statoil
90% of Nova Transportadora do Sudeste (NTS) with Brookfield
Nansei refinery with Taiyo
Liquigás with Ultrapar
PetroquímicaSuape/Citepe with Alpek
Guarani with Tereos Participations
Master Agreement with Total
Partnerships and divestments
In final stages of negotiation
already announced
Baúna and Tartaruga Verde fields
with Karoon
Strategic Partnerships
already announced
MoU with Statoil – focus on
revitalization of Post-Salt fields
MoU with GALP – focus on
partnerships in regions worldwide in
which the companies have a shared
interest, besides training and
deepwater reservoir research
MoU with TOTAL – focus in the E&P,
Gas, Energy and Refining segments in
Brazil and abroad
Ongoing Divestments
already announced
Partnership in Petrobras Distribuidora
(BR)
Onshore shallow waters fields
LNG Terminals
Thermal power plants
44
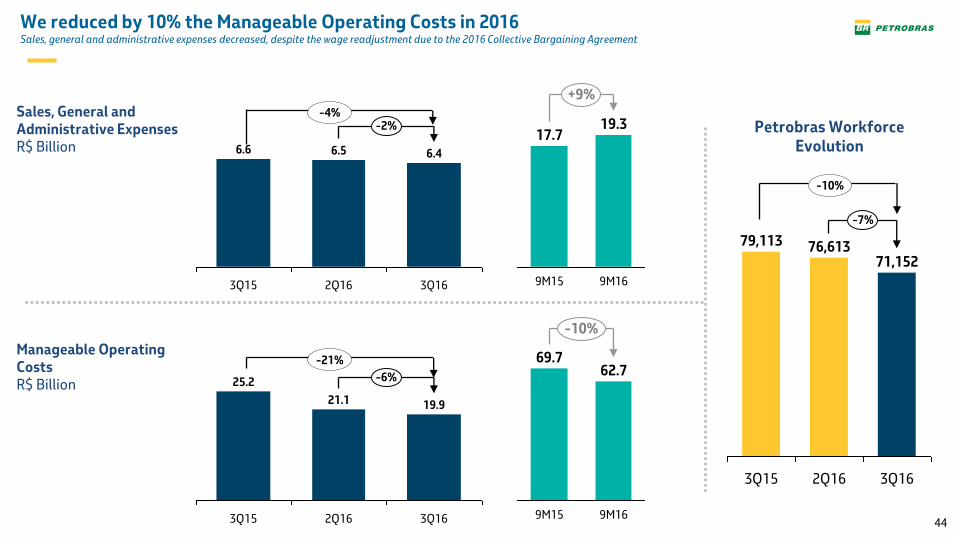
We reduced by 10% the Manageable Operating Costs in 2016 Sales, general and administrative expenses decreased, despite the wage readjustment due to the 2016 Collective Bargaining Agreement
-6%
3Q16
19.9
2Q16
21.1
3Q15
25.2
-21%
-10%
9M16
62.7
9M15
69.7
-7%
3Q16
71,152
2Q16
76,613
3Q15
79,113
-10%
Petrobras Workforce Evolution
Manageable Operating Costs R$ Billion
-4%
+9%
9M16
19.3
9M15
17.7 -2%
3Q16
6.4
2Q16
6.5
3Q15
6.6
Sales, General and Administrative Expenses R$ Billion

45
Lower debt in line with 2017-2021 BMP targets
398,2397,8
450,0493,0506,6
325,6332,4369,5
392,1402,3
122,7123,9126,4126,3127,5
100,3103,6103,8100,4101,3Net Debt
(US$ billion)
Total Debt (US$ billion)
Net Debt (R$ billion)
Total Debt (R$ billion)
2Q16 1Q16 4Q15 3Q15 3Q16
3Q15 2Q16 3Q16
Cost of Debt(% a.a.) 6.1 6.3 6.3
Maturity (years) 7.49 7.30 7.33
Leverage (%) 58 55 55

46
DEBT PROFILE – AS OF SEPTEMBER 30, 2016
By Category By Currency
Note: Brazilian State Banks: BNDES, Banco do Brasil and Caixa Econômica Federal
44%
24%
6%
22%
4%
Brazilian State Banks
Other Brazilian Banks
Bond Markets
Foreign Financial Institutions
Foreign Development Banks and ECA
74%
19%
1% 6%
EUR
USD
BRL
Others
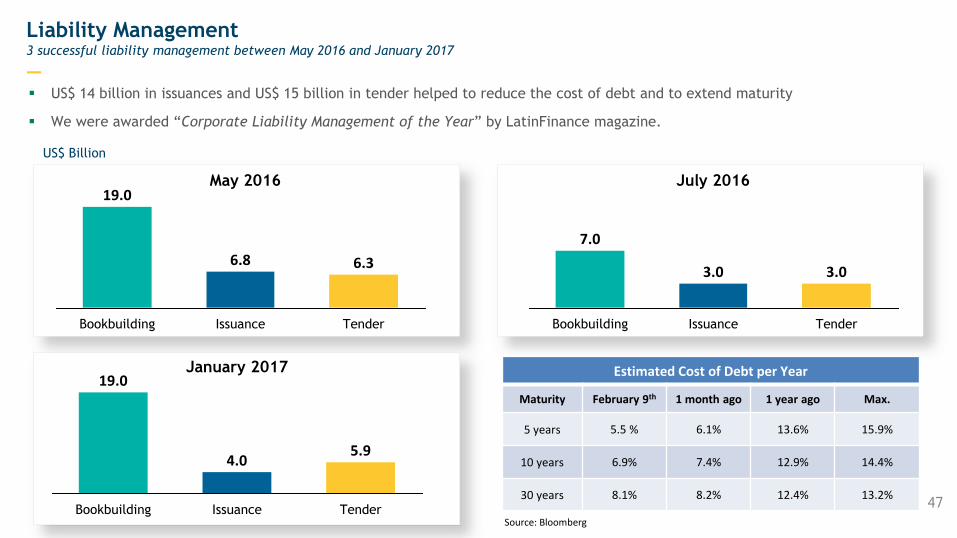
Liability Management 3 successful liability management between May 2016 and January 2017
—
US$ Bilhões
47
US$ 14 billion in issuances and US$ 15 billion in tender helped to reduce the cost of debt and to extend maturity
We were awarded “Corporate Liability Management of the Year” by LatinFinance magazine.
Estimated Cost of Debt per Year
Maturity February 9th 1 month ago 1 year ago Max.
5 years 5.5 % 6.1% 13.6% 15.9%
10 years 6.9% 7.4% 12.9% 14.4%
30 years 8.1% 8.2% 12.4% 13.2%
6.8
Issuance
6.3
Tender Bookbuilding
19.0 May 2016
3.0
Issuance
3.0
Tender Bookbuilding
7.0
July 2016
4.0
Issuance
5.9
Tender Bookbuilding
19.0 January 2017
US$ Billion
Source: Bloomberg

Debt maturity between 2017 and 2020 Includes January 2017 tender offer
—
13
23
17
12
14
18
11
8
2019 2018 2017 2020
As of Feb/2015
As of Feb/2017
US$ Billion
48
49
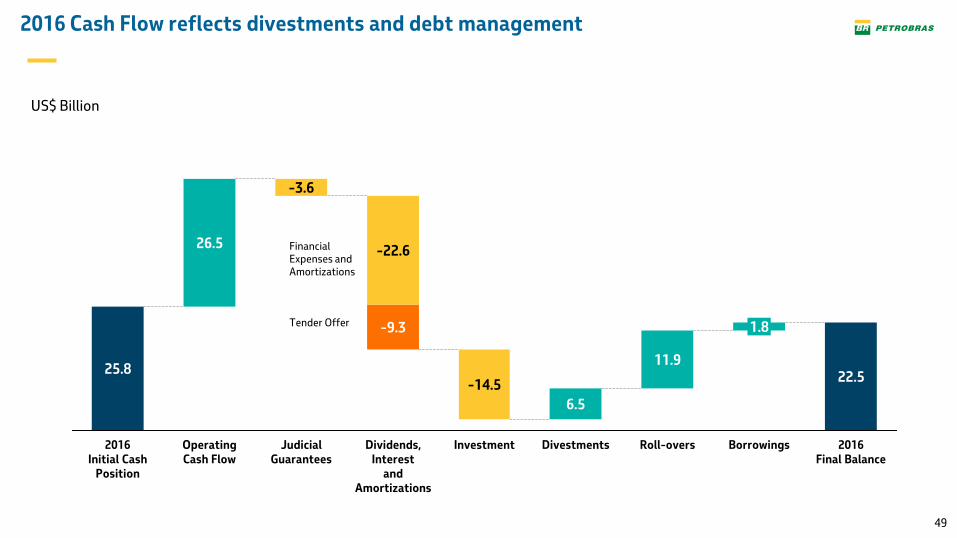
2016 Cash Flow reflects divestments and debt management
US$ Billion
Judicial Guarantees
Borrowings
-9.3 1.8
Roll-overs
11.9
Divestments
6.5
Investment
-14.5
Dividends, Interest
and Amortizations
-22.6
-3.6
Operating Cash Flow
26.5
2016 Initial Cash
Position
25.8 22.5
2016 Final Balance
Financial Expenses and Amortizations
Tender Offer

50
And evolving with a focus on the main metrics of the 2017-21 BMP
Net Debt / EBITDA**
2Q16 2015
4.1
5.3 4.5
3Q16
-9%
2Q16
1.6
2.2
3Q16
-12%
1.8
2015
Total Recordable Injury Frequency Rate*
SAFETY
* TRIFR = Number of reportable injuries per million man-hours
FINANCIAL
-24% -27%
** LTM Adjusted EBITDA

STRATEGIC PLAN 2017-2021 BUSINESS AND MANAGEMENT PLAN —