petersen alternative center for education school ... · petersen alternative center for education...
TRANSCRIPT

2015-16 School Accountability Report Card for Petersen Alternative Center for Education Page 1 of 13
Petersen Alternative Center for Education
School Accountability Report Card
Reported Using Data from the 2015-16 School Year
Published During 2016-17
By February 1 of each year, every school in California is required by state law to publish a School Accountability Report Card (SARC). The SARC contains information about the condition and performance of each California public school. Under the Local Control Funding Formula (LCFF) all local educational agencies (LEAs) are required to prepare a Local Control and Accountability Plan (LCAP), which describes how they intend to meet annual school-specific goals for all pupils, with specific activities to address state and local priorities. Additionally, data reported in an LCAP is to be consistent with data reported in the SARC. • For more information about SARC requirements, see the California Department of Education (CDE) SARC Web page at
http://www.cde.ca.gov/ta/ac/sa/. • For more information about the LCFF or LCAP, see the CDE LCFF Web page at http://www.cde.ca.gov/fg/aa/lc/. • For additional information about the school, parents/guardians and community members should contact the school principal or
the district office. DataQuest DataQuest is an online data tool located on the CDE DataQuest Web page at http://dq.cde.ca.gov/dataquest/ that contains additional information about this school and comparisons of the school to the district and the county. Specifically, DataQuest is a dynamic system that provides reports for accountability (e.g., test data, enrollment, high school graduates, dropouts, course enrollments, staffing, and data regarding English learners). Internet Access Internet access is available at public libraries and other locations that are publicly accessible (e.g., the California State Library). Access to the Internet at libraries and public locations is generally provided on a first-come, first-served basis. Other use restrictions may include the hours of operation, the length of time that a workstation may be used (depending on availability), the types of software programs available on a workstation, and the ability to print documents.
About This School Contact Information (School Year 2016-17)
School Contact Information
School Name------- Petersen Alternative Center for Education
Street------- 2209 Blue Gum Ave.
City, State, Zip------- Modesto, CA 95358
Phone Number------- (209) 238-6716
Principal------- John Luis
E-mail Address------- [email protected]
Web Site-------
CDS Code 50 10504 5030226

2015-16 School Accountability Report Card for Petersen Alternative Center for Education Page 2 of 13
District Contact Information
District Name------- Stanislaus County Office of Education
Phone Number------- (209) 238-1700
Superintendent------- Tom Changnon
E-mail Address------- [email protected]
Web Site------- www.stancoe.org
School Description and Mission Statement (School Year 2016-17)
The Petersen Alternative Center for Education (PACE) is located in Modesto, California. It is a court/community school program, operated by the Stanislaus County Office of Education (SCOE). We operate community school classrooms for grades 9-12 and Independent Study classes for all grade levels. Included under the PACE umbrella of schools is the Stanislaus County West Campus where we provide an educational program for incarcerated youth. We are committed to providing the students in our program a quality education. We are WASC accredited and strive to meet the many and diverse needs of all our students. Our students have access to community resources through the City of Modesto, Modesto Police Department, Stanislaus County Probation, Miri Counseling Center, Sierra Vista and other community entities. Students attending PACE are able to meet the requirements of expulsion plans to return to comprehensive sites, work on and complete GED requirements or graduate from PACE. Students released from the West Campus often come to PACE for continued educational services or return to their comprehensive sites. The teachers and staff are committed to working with the individual student to accomplish their goals for the future. Student Enrollment by Grade Level (School Year 2015-16)
Grade Number of
Level Students
Grade 7 1
Grade 8 4
Grade 9 5
Grade 10 29
Grade 11 54
Grade 12 59
Total Enrollment 152
Student Enrollment by Group (School Year 2015-16)
Student Percent of
Group Total Enrollment
Black or African American 9.2
American Indian or Alaska Native 0.7
Asian 2
Filipino 0
Hispanic or Latino 58.6
Native Hawaiian or Pacific Islander 0
White 23
Two or More Races 3.9
Socioeconomically Disadvantaged 86.2
English Learners 13.2
Students with Disabilities 0
Foster Youth 0.7

2015-16 School Accountability Report Card for Petersen Alternative Center for Education Page 3 of 13
A. Conditions of Learning
State Priority: Basic The SARC provides the following information relevant to the Basic State Priority (Priority 1): • Degree to which teachers are appropriately assigned and fully credentialed in the subject area and for the pupils they are
teaching; • Pupils have access to standards-aligned instructional materials; and • School facilities are maintained in good repair. Teacher Credentials
Teachers School District
2014-15 2015-16 2016-17 2016-17
With Full Credential 10 9 9
Without Full Credential 2 2 0
Teaching Outside Subject Area of Competence (with full credential) 0 0 0
Teacher Misassignments and Vacant Teacher Positions
Indicator 2014-15 2015-16 2016-17
Misassignments of Teachers of English Learners 0 0 0
Total Teacher Misassignments * 0 0 0
Vacant Teacher Positions 0 0 0 Note: “Misassignments” refers to the number of positions filled by teachers who lack legal authorization to teach that grade level, subject area, student group, etc. * Total Teacher Misassignments includes the number of Misassignments of Teachers of English Learners. Core Academic Classes Taught by Highly Qualified Teachers (School Year 2015-16)
Location of Classes Percent of Classes In Core Academic Subjects
Taught by Highly Qualified Teachers Not Taught by Highly Qualified Teachers
This School 64.8 35.2
All Schools in District 64.7 35.3
High-Poverty Schools in District 64.7 35.3
Low-Poverty Schools in District 0.0 0.0 Note: High-poverty schools are defined as those schools with student eligibility of approximately 40 percent or more in the free and reduced price meals program. Low-poverty schools are those with student eligibility of approximately 39 percent or less in the free and reduced price meals program. Quality, Currency, Availability of Textbooks and Instructional Materials (School Year 2016-17) Year and month in which data were collected: 8/10/2016
Subject Textbooks and Instructional Materials/
Year of Adoption
From Most Recent
Adoption?
Percent of Students Lacking Own
Assigned Copy
Reading/Language Arts FLVS English II FLVS English III FLVS English IV
FLVS English I
Yes 0

2015-16 School Accountability Report Card for Petersen Alternative Center for Education Page 4 of 13
Subject Textbooks and Instructional Materials/
Year of Adoption
From Most Recent
Adoption?
Percent of Students Lacking Own
Assigned Copy
Mathematics FLVS Algebra 1A
FLVS Algebra 1B
FLVS Algebra 1
FLVS Algebra 2
FLVS Calculus Honors
FLVS Geometry
FLVS Pre Calculus
FLVS Liberal Arts Mathematics
FLVS Advanced Alg Financial App
Yes 0
Science FLVS Biology
FLVS Anatomy & Physiology
FLVS Physical Science
FLVS Earth Space Science
FLVS Physics
FLVS Chemistry
Yes 0
History-Social Science FLVS United States American History
FLVS World History
FLVS United States American Government
Yes 0
Foreign Language FLVS French I FLVS French II FLVS Spanish I FLVS Spanish II FLVS Spanish for Spanish Speakers
Yes 0
Health FLVS Health Science Yes 0
Visual and Performing Arts FLVS Art History & Critisism
School Facility Conditions and Planned Improvements (Most Recent Year)
We have 13 classrooms for student use: Three rooms are used by students and staff for Independent Study; Three rooms are currently used for high school students attending Community School; One room is to house our middle school students; Two rooms are used for Special Education purposes. One room is a computer lab; One room is used as a Curriculum Office and houses texts and library books, while also housing our Resource Specialist. Each classroom has its own restroom, phone, OH Projector, and LCD projector, and white boards. We also have a counseling office, Principal's office, a security building housing our Probation Officer, and a Healthy Start facility. The site has one full time janitor who maintains the buildings. SCOE provides landscape maintenance and also is available for facility maintenance and repairs that are beyond the scope of the janitor. The janitor is here for over half of the school day and stays until the early evening. He is able to do deep cleaning procedures after students are gone on a rotating basis in the classrooms and offices. School Facility Good Repair Status (Most Recent Year)
School Facility Good Repair Status (Most Recent Year) Year and month of the most recent FIT report: 11/14/2016
System Inspected Repair Status Repair Needed and
Action Taken or Planned Good Fair Poor
Systems: Gas Leaks, Mechanical/HVAC, Sewer
X

2015-16 School Accountability Report Card for Petersen Alternative Center for Education Page 5 of 13
School Facility Good Repair Status (Most Recent Year) Year and month of the most recent FIT report: 11/14/2016
System Inspected Repair Status Repair Needed and
Action Taken or Planned Good Fair Poor
Interior: Interior Surfaces X
Cleanliness: Overall Cleanliness, Pest/ Vermin Infestation
X
Electrical: Electrical X Replace broken outlet plate in back counseling office in Room 10.
Restrooms/Fountains: Restrooms, Sinks/ Fountains
X Check and repair running toilet in Room 10.
Safety: Fire Safety, Hazardous Materials X
Structural: Structural Damage, Roofs X
External: Playground/School Grounds, Windows/ Doors/Gates/Fences
X
Overall Facility Rating (Most Recent Year)
Year and month of the most recent FIT report: 11/14/2016
Overall Rating Exemplary Good Fair Poor
X
B. Pupil Outcomes
State Priority: Pupil Achievement The SARC provides the following information relevant to the State priority: Pupil Achievement (Priority 4): • Statewide assessments (i.e., California Assessment of Student Performance and Progress [CAASPP] System, which includes the
Smarter Balanced Summative Assessments for students in the general education population and the California Alternate Assessments [CAAs] for English language arts/literacy [ELA] and mathematics given in grades three through eight and grade eleven. The CAAs have replaced the California Alternate Performance Assessment [CAPA] for ELA and mathematics, which were eliminated in 2015. Only eligible students may participate in the administration of the CAAs. CAA items are aligned with alternate achievement standards, which are linked with the Common Core State Standards [CCSS] for students with significant cognitive disabilities); and
• The percentage of students who have successfully completed courses that satisfy the requirements for entrance to the University of California and the California State University, or career technical education sequences or programs of study
CAASPP Test Results in English Language Arts/Literacy (ELA) and Mathematics for All Students
Subject
Percent of Students Meeting or Exceeding the State Standards (grades 3-8 and 11)
School District State
2014-15 2015-16 2014-15 2015-16 2014-15 2015-16
English Language Arts/Literacy 8 27 31 44 48
Mathematics 0 17 21 34 36 Note: Percentages are not calculated when the number of students tested is ten or less, either because the number of students in this category is too small for statistical accuracy or to protect student privacy.

2015-16 School Accountability Report Card for Petersen Alternative Center for Education Page 6 of 13
CAASPP Test Results in ELA by Student Group Grades Three through Eight and Grade Eleven (School Year 2015-16)
Student Group Grade
Number of Students Percent of Students
Enrolled Tested Tested Standard Met or
Exceeded
All Students 5 -- -- -- --
6 -- -- -- --
7 -- -- -- --
8 28 9 32.1
11 71 20 28.2
Male 5 -- -- -- --
6 -- -- -- --
7 -- -- -- --
8 18 6 33.3
11 41 12 29.3
Female 7 -- -- -- --
8 -- -- -- --
11 30 8 26.7
Black or African American 7 -- -- -- --
8 -- -- -- --
11 -- -- -- --
American Indian or Alaska Native 11 -- -- -- --
Asian 6 -- -- -- --
8 -- -- -- --
Hispanic or Latino 6 -- -- -- --
7 -- -- -- --
8 19 6 31.6
11 50 13 26.0
White 5 -- -- -- --
6 -- -- -- --
8 -- -- -- --
11 14 4 28.6
Two or More Races 11 -- -- -- --
Socioeconomically Disadvantaged 5 -- -- -- --
6 -- -- -- --
7 -- -- -- --
8 19 5 26.3
11 51 15 29.4
English Learners 6 -- -- -- --
8 -- -- -- --
11 11 2 18.2

2015-16 School Accountability Report Card for Petersen Alternative Center for Education Page 7 of 13
Student Group Grade
Number of Students Percent of Students
Enrolled Tested Tested Standard Met or
Exceeded
Foster Youth 5 -- -- -- --
6 -- -- -- --
7 -- -- -- --
8 -- -- -- --
11 -- -- -- --
Note: ELA test results include the Smarter Balanced Summative Assessment and the CAA. The “Percent Met or Exceeded” is calculated by taking the total number of students who met or exceeded the standard on the Smarter Balanced Summative Assessment plus the total number of students who met the standard on the CAAs divided by the total number of students who participated in both assessments. Double dashes (--) appear in the table when the number of students is ten or less, either because the number of students in this category is too small for statistical accuracy or to protect student privacy. Note: The number of students tested includes all students who participated in the test whether they received a score or not; however, the number of students tested is not the number that was used to calculate the achievement level percentages. The achievement level percentages are calculated using only students who received scores.
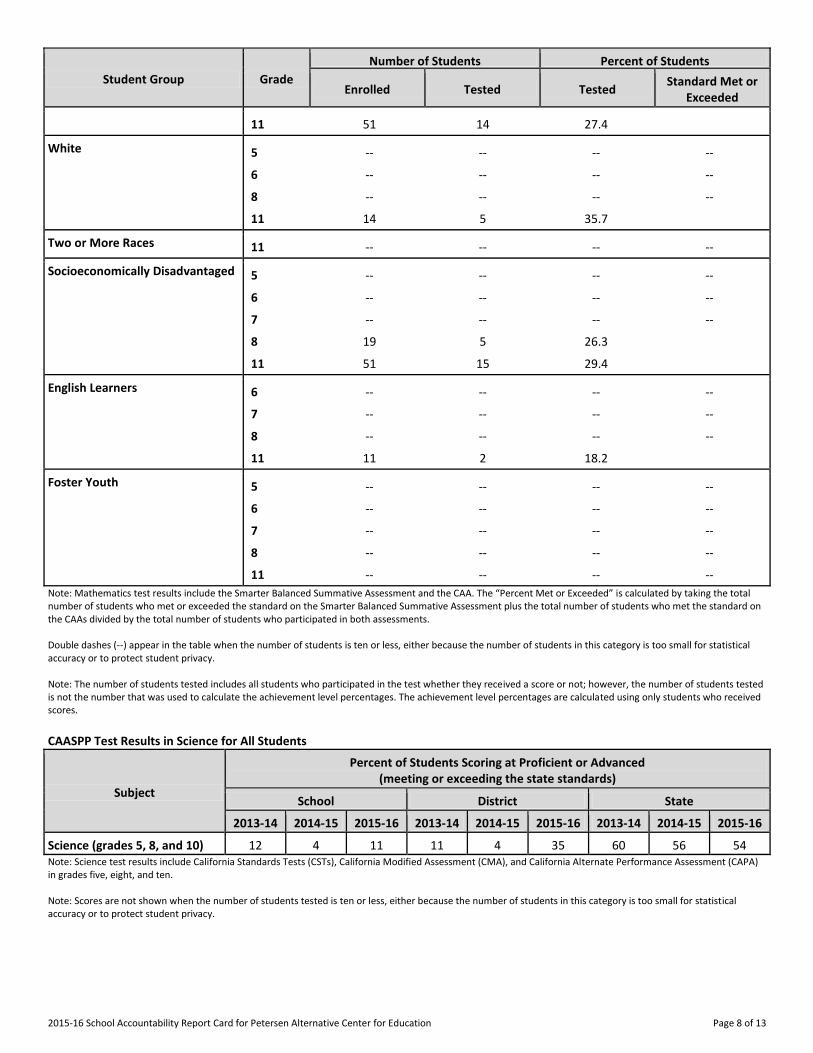
CAASPP Test Results in Mathematics by Student Group Grades Three through Eight and Grade Eleven (School Year 2015-16)
Student Group Grade
Number of Students Percent of Students
Enrolled Tested Tested Standard Met or
Exceeded
All Students 5 -- -- -- --
6 -- -- -- --
7 11 5 45.5
8 28 10 35.7
11 72 22 30.6
Male 5 -- -- -- --
6 -- -- -- --
7 -- -- -- --
8 18 7 38.9
11 41 11 26.8
Female 7 -- -- -- --
8 -- -- -- --
11 31 11 35.5
Black or African American 7 -- -- -- --
8 -- -- -- --
11 -- -- -- --
American Indian or Alaska Native 11 -- -- -- --
Asian 6 -- -- -- --
8 -- -- -- --
Hispanic or Latino 6 -- -- -- --
7 -- -- -- --
8 18 7 38.9
2015-16 School Accountability Report Card for Petersen Alternative Center for Education Page 8 of 13
Student Group Grade
Number of Students Percent of Students
Enrolled Tested Tested Standard Met or
Exceeded
11 51 14 27.4
White 5 -- -- -- --
6 -- -- -- --
8 -- -- -- --
11 14 5 35.7
Two or More Races 11 -- -- -- --
Socioeconomically Disadvantaged 5 -- -- -- --
6 -- -- -- --
7 -- -- -- --
8 19 5 26.3
11 51 15 29.4
English Learners 6 -- -- -- --
7 -- -- -- --
8 -- -- -- --
11 11 2 18.2
Foster Youth 5 -- -- -- --
6 -- -- -- --
7 -- -- -- --
8 -- -- -- --
11 -- -- -- --
Note: Mathematics test results include the Smarter Balanced Summative Assessment and the CAA. The “Percent Met or Exceeded” is calculated by taking the total number of students who met or exceeded the standard on the Smarter Balanced Summative Assessment plus the total number of students who met the standard on the CAAs divided by the total number of students who participated in both assessments. Double dashes (--) appear in the table when the number of students is ten or less, either because the number of students in this category is too small for statistical accuracy or to protect student privacy. Note: The number of students tested includes all students who participated in the test whether they received a score or not; however, the number of students tested is not the number that was used to calculate the achievement level percentages. The achievement level percentages are calculated using only students who received scores.
CAASPP Test Results in Science for All Students
Subject
Percent of Students Scoring at Proficient or Advanced (meeting or exceeding the state standards)
School District State
2013-14 2014-15 2015-16 2013-14 2014-15 2015-16 2013-14 2014-15 2015-16
Science (grades 5, 8, and 10) 12 4 11 11 4 35 60 56 54 Note: Science test results include California Standards Tests (CSTs), California Modified Assessment (CMA), and California Alternate Performance Assessment (CAPA) in grades five, eight, and ten. Note: Scores are not shown when the number of students tested is ten or less, either because the number of students in this category is too small for statistical accuracy or to protect student privacy.

2015-16 School Accountability Report Card for Petersen Alternative Center for Education Page 9 of 13
CAASPP Test Results in Science by Student Group Grades Five, Eight, and Ten (School Year 2015-16)
Student Group
Total Enrollment
# of Students with Valid Scores
% of Students with Valid Scores
% of Students Proficient or
Advanced
All Students 108 55 50.9 10.9
Male 70 40 57.1 10.0
Female 38 15 39.5 13.3
Hispanic or Latino 74 40 54.1 10.0
White 16 7 43.8 14.3
Socioeconomically Disadvantaged 76 38 50.0 10.5
English Learners 20 12 60.0 16.7 Note: Science test results include CSTs, CMA, and CAPA in grades five, eight, and ten. The “Proficient or Advanced” is calculated by taking the total number of students who scored at Proficient or Advanced on the science assessment divided by the total number of students with valid scores. Note: Scores are not shown when the number of students tested is ten or less, either because the number of students in this category is too small for statistical accuracy or to protect student privacy.
Career Technical Education Programs (School Year 2015-16)
N/A Career Technical Education Participation (School Year 2015-16)
Measure CTE Program Participation
Number of pupils participating in CTE 0
% of pupils completing a CTE program and earning a high school diploma 0
% of CTE courses sequenced or articulated between the school and institutions of postsecondary education 0.00%
Courses for University of California (UC) and/or California State University (CSU) Admission
UC/CSU Course Measure Percent
2015-16 Pupils Enrolled in Courses Required for UC/CSU Admission 0
2014-15 Graduates Who Completed All Courses Required for UC/CSU Admission 0
State Priority: Other Pupil Outcomes The SARC provides the following information relevant to the Other Pupil Outcomes State Priority (Priority 8): • Pupil outcomes in the subject areas of physical education.

2015-16 School Accountability Report Card for Petersen Alternative Center for Education Page 10 of 13
C. Engagement
State Priority: Parental Involvement The SARC provides the following information relevant to the Parental Involvement State Priority (Priority 3): • Efforts the school district makes to seek parent input in making decisions for the school district and each schoolsite. Opportunities for Parental Involvement (School Year 2016-17)
Parent involvement is welcomed at PACE. We believe that a team approach in working with students is effective and welcome parent input on any student or school issues. Parents are encouraged to participate in both the School Site Council, which meets monthly and the Bilingual Parent Advisory Committee. Parents are welcome to come in to discuss areas of concern with teachers. We have an annual Open House every fall and spring semester. We have implemented School Messenger, an automated phone calling system, to notify parents of attendance information as well as announce events and update them on school policies and procedures. Contact Person Name: John Luis Contact Person Phone Number: 209-238-6716
State Priority: Pupil Engagement The SARC provides the following information relevant to the Pupil Engagement State Priority (Priority 5): • High school dropout rates; and • High school graduation rates. Dropout Rate and Graduation Rate (Four-Year Cohort Rate)
Indicator School District State
2012-13 2013-14 2014-15 2012-13 2013-14 2014-15 2012-13 2013-14 2014-15
Dropout Rate 11.60 11.50 9.50 11.60 11.50 9.50 11.40 11.50 10.70
Graduation Rate 82.50 82.12 84.61 82.50 82.12 84.61 80.44 80.95 82.27
Completion of High School Graduation Requirements - Graduating Class of 2015 (One-Year Rate)
Group Graduating Class of 2015
School District State
All Students 57 79 86
Black or African American 100 66 78
American Indian or Alaska Native 0 38 78
Asian 67 78 93
Filipino 0 100 93
Hispanic or Latino 60 72 83
Native Hawaiian/Pacific Islander 0 83 85
White 46 94 91
Two or More Races 100 85 89
Socioeconomically Disadvantaged 0 100 66
English Learners 55 68 54
Students with Disabilities 61 75 78

2015-16 School Accountability Report Card for Petersen Alternative Center for Education Page 11 of 13
State Priority: School Climate The SARC provides the following information relevant to the School Climate State Priority (Priority 6): • Pupil suspension rates; • Pupil expulsion rates; and • Other local measures on the sense of safety. Suspensions and Expulsions
Rate School District State
2013-14 2014-15 2015-16 2013-14 2014-15 2015-16 2013-14 2014-15 2015-16
Suspensions------- 6.7 8.0 7.3 6.8 8.0 7.0 4.4 3.8 3.7
Expulsions------- 0.0 0.0 0.0 0.0 0.0 0.0 0.1 0.1 0.1
School Safety Plan (School Year 2016-17)
We have formed partnerships with the Stanislaus County Probation Department. Our Probation Officer is on campus 5 days a week , we use a progressive discipline system which emphasizes teacher attempts to resolve the situation before sending the offending student to the office. PACE has implemented Conflict Resolution, In-House Suspension room with a certificated teacher. This room is in place for students to be assigned disciplinary steps in-lieu of a more serious consequence. As the number or severity of an offense occurs, additional consequences are issued; which may include suspension from school, referral to the Probation for legal issues, or referral to our Independent Study program. All classrooms are wired into a Bogan System, which allows for direct communication with officer personnel in an emergency situation. We use cameras inside and outside the classrooms to assist with the supervision of our clientele. Our site receives annual reviews of safety by the SCOE maintenance staff, the Modesto Fire Department, and a representative from our insurance company. Our custodian and Principal are active members of the SCOE Safety Committee. Site concerns are handled immediately by our custodian or members from the SCOE maintenance team. Our Site Safety team meets twice a year and we have fire drills once a semester, as required by law.
D. Other SARC Information
The information in this section is required to be in the SARC but is not included in the state priorities for LCFF. Federal Intervention Program (School Year 2016-17)
Indicator School District
Program Improvement Status In PI In PI
First Year of Program Improvement 2005-2006 2007-2008
Year in Program Improvement* Year 5 Year 3
Number of Schools Currently in Program Improvement N/A 2
Percent of Schools Currently in Program Improvement N/A 40.0 Note: Cells with N/A values do not require data.

2015-16 School Accountability Report Card for Petersen Alternative Center for Education Page 12 of 13
Average Class Size and Class Size Distribution (Secondary)
Subject
2013-14 2014-15 2015-16
Avg. Class Size
Number of Classrooms Avg. Class Size
Number of Classrooms Avg. Class Size
Number of Classrooms
1-22 23-32 33+ 1-22 23-32 33+ 1-22 23-32 33+
English------- ----------
6 44 7 27 7 27
Mathematics ----------
6 30 5 20 5 20
Science------- ----------
5 25 5 16 5 16
Social Science ----------
5 42 6 29 6 29 Note: Number of classes indicates how many classrooms fall into each size category (a range of total students per classroom). At the secondary school level, this information is reported by subject area rather than grade level. Academic Counselors and Other Support Staff (School Year 2015-16)
Title Number of FTE
Assigned to School Average Number of Students per
Academic Counselor
Academic Counselor------- 1.00 336
Counselor (Social/Behavioral or Career Development) 1.6 N/A
Library Media Teacher (Librarian) N/A
Library Media Services Staff (Paraprofessional) N/A
Psychologist------- N/A
Social Worker------- N/A
Nurse------- .25 N/A
Speech/Language/Hearing Specialist N/A
Resource Specialist------- .5 N/A
Other------- N/A Note: Cells with N/A values do not require data. *One Full Time Equivalent (FTE) equals one staff member working full time; one FTE could also represent two staff members who each work 50 percent of full time.
Expenditures per Pupil and School Site Teacher Salaries (Fiscal Year 2014-15)
Level
Expenditures Per Pupil Average Teacher Salary Total
Supplemental/ Restricted
Basic/ Unrestricted
School Site------- 6065.09 3,997.40 12,593.48 68,926
District------- N/A N/A 5036.09
Percent Difference: School Site and District N/A N/A 150.1
State------- N/A N/A $5,677
Percent Difference: School Site and State N/A N/A 121.8 5.0 Note: Cells with N/A values do not require data.
Types of Services Funded (Fiscal Year 2015-16)
Lottery 1180 Title I Part A Basic 3010 Title I Local Delinquent 3025 Teacher Quality 4035 Title III Part A LEP 4203 Library 6296 Work for Success 9858
ROP 0650 Foster Youth (Core & Delinquent) Carl Perkins (CTE) Medi-Cal Administrative Activity (MAA) GED Healthy Start

2015-16 School Accountability Report Card for Petersen Alternative Center for Education Page 13 of 13
Teacher and Administrative Salaries (Fiscal Year 2014-15)
Category District Amount State Average for Districts In Same Category
Beginning Teacher Salary
Mid-Range Teacher Salary
Highest Teacher Salary
Average Principal Salary (Elementary)
Average Principal Salary (Middle)
Average Principal Salary (High)
Superintendent Salary
Percent of Budget for Teacher Salaries
Percent of Budget for Administrative Salaries For detailed information on salaries, see the CDE Certificated Salaries & Benefits Web page at http://www.cde.ca.gov/ds/fd/cs/. Advanced Placement (AP) Courses (School Year 2015-16)
Subject Number of AP Courses Offered* Percent of Students In AP Courses
Computer Science N/A
English------- N/A
Fine and Performing Arts N/A
Foreign Language N/A
Mathematics N/A
Science------- N/A
Social Science N/A
All courses Cells with N/A values do not require data. *Where there are student course enrollments of at least one student.
Professional Development (Most Recent Three Years)
Professional development opportunities are coordinated and conducted by the curriculum and assessment consultant twice monthly on early release days focused on instruction to improve student achievement. Principals and other division leadership staff also offer the faculty opportunities to attend conferences on subject related areas. It is a division goal for all staff members to feel confident about the curriculum they are teaching as well as to provide opportunities for the staff to learn ways to more effectively serve our alternative education population academically, emotionally, and physically.