peter gray - revolutionising the viewing experience of the tour de france
TRANSCRIPT
Revolutionising the
viewing experience of
the Tour de France.
If you believe you can do anything,
we’re here to help you do it.
Peter Gray, Senior Director – Technology, Sports Practice
b y ad van ces i n t ech n o l o g y.
There’s no part of thesports experience that won’t be radically impacted
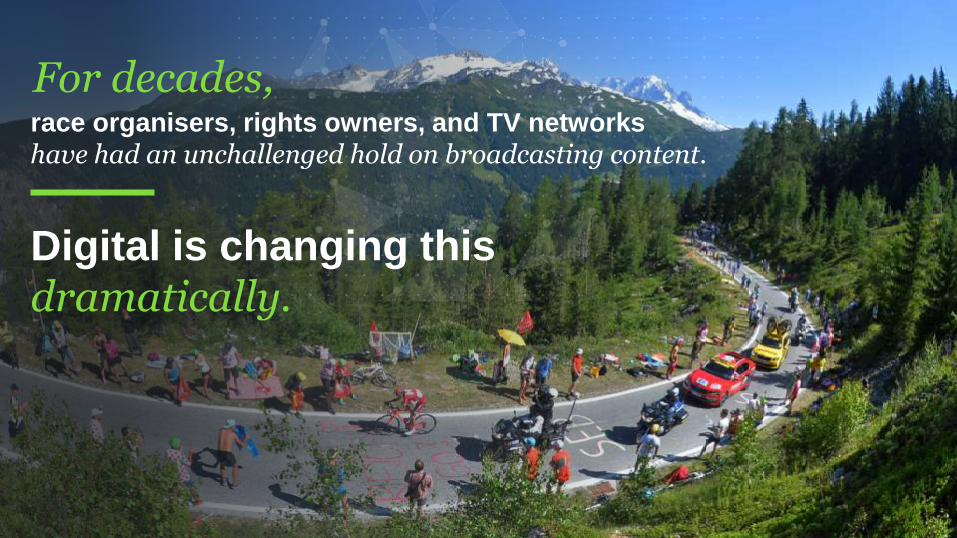
race organisers, rights owners, and TV networks
have had an unchallenged hold on broadcasting content.
For decades,
Digital is changing this
dramatically.
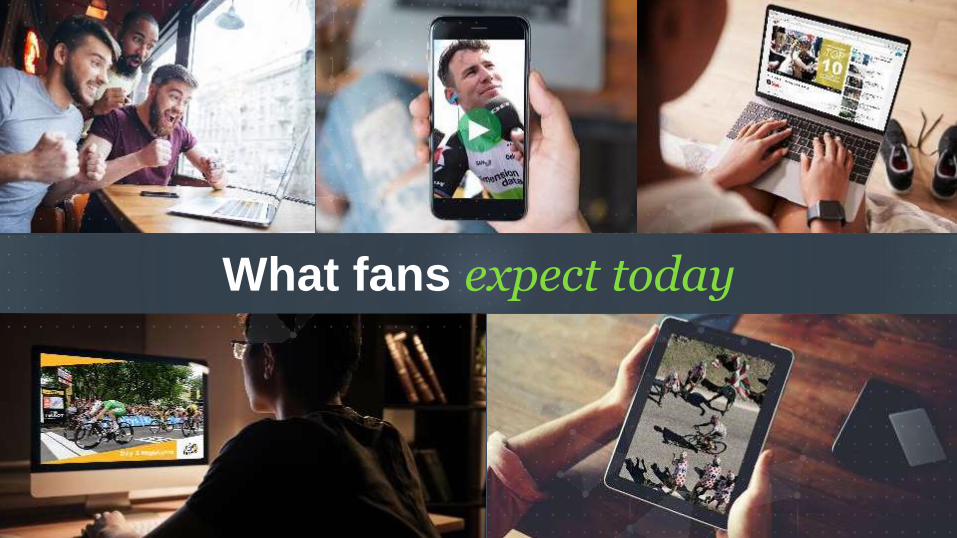
What fans expect today
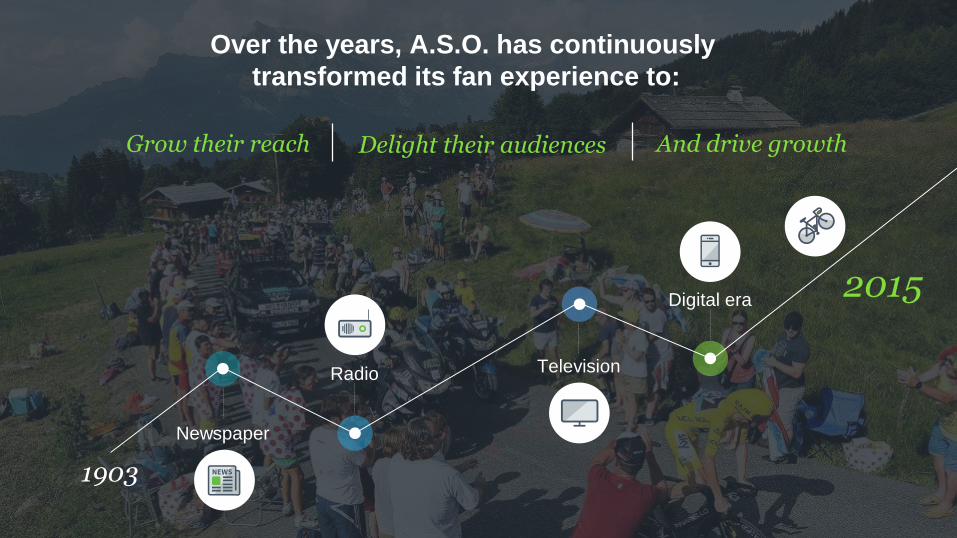
Over the years, A.S.O. has continuously
transformed its fan experience to:
1903
Newspaper
Radio Television
Digital era2015
Grow their reach And drive growthDelight their audiences

The start of A.S.O.’s journey…
accelerate your ambition
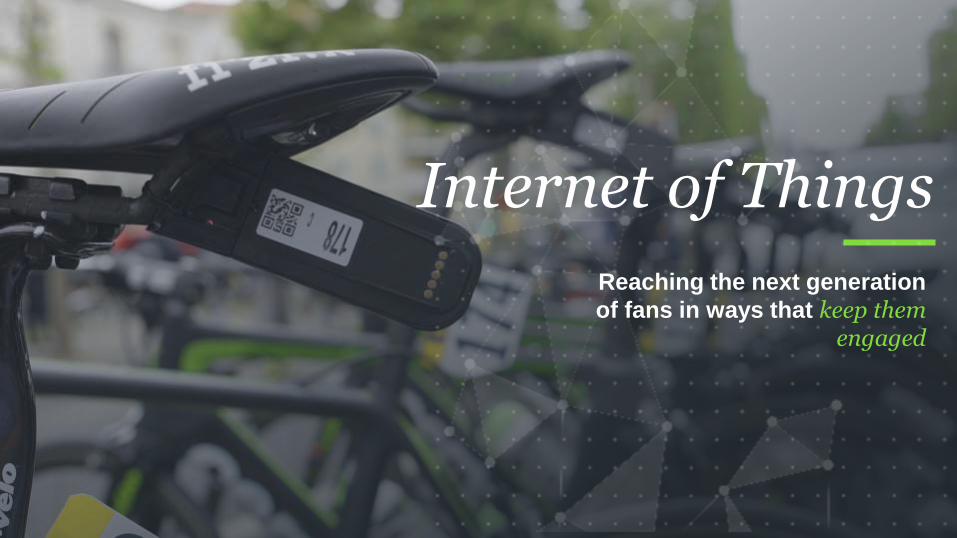
Internet of Things
Reaching the next generation
of fans in ways that keep them engaged
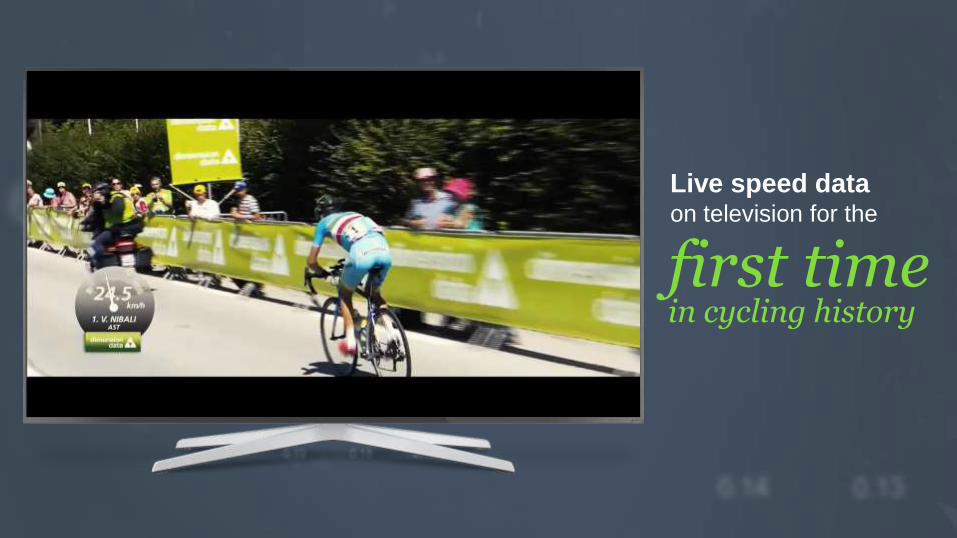
Live speed data on television for the
first time in cycling history
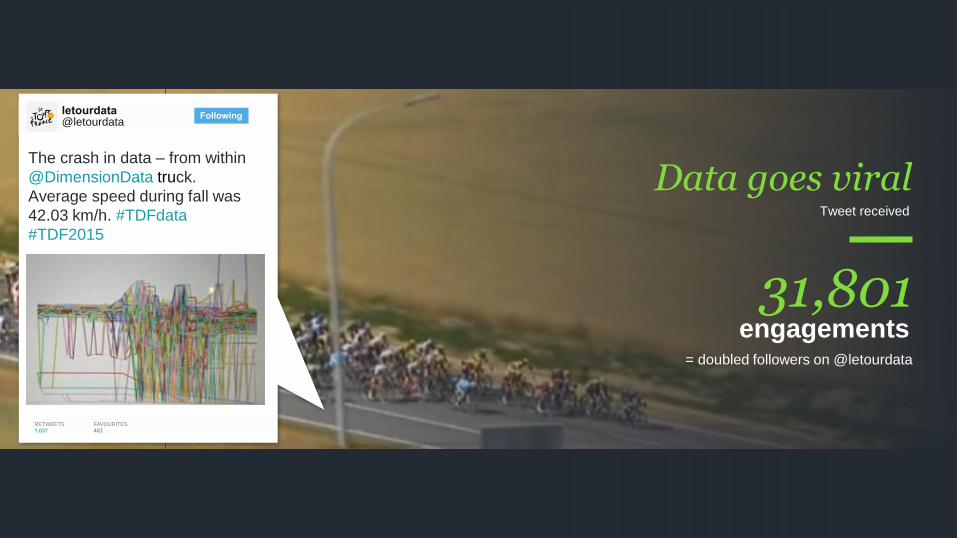
Data goes viralTweet received
31,801engagements
= doubled followers on @letourdata
letourdata@letourdata
RETWEETS
1,037
FAVOURITES
403
Following
letourdata@letourdata
RETWEETS
1,037
FAVOURITES
403
Following
The crash in data – from within
@DimensionData truck.
Average speed during fall was
42.03 km/h. #TDFdata
#TDF2015
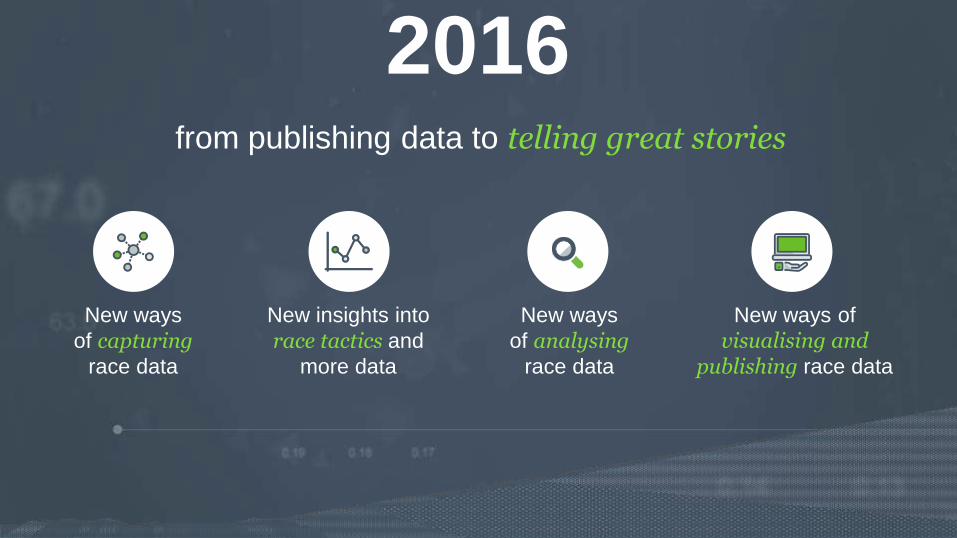
2016
New ways
of capturingrace data
New insights into
race tactics and
more data
New ways
of analysingrace data
New ways of
visualising and publishing race data
from publishing data to telling great stories
accelerate your ambition
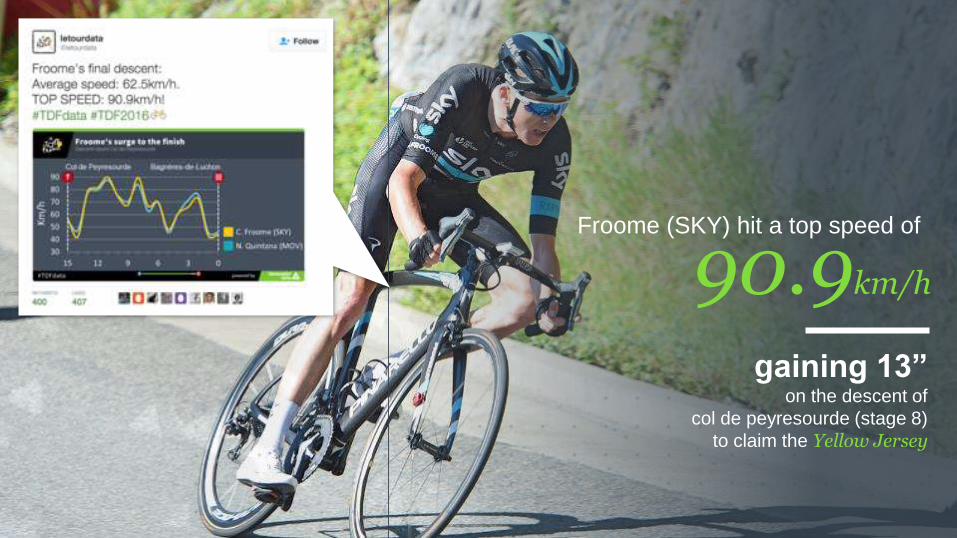
90.9km/h
Froome (SKY) hit a top speed of
gaining 13” on the descent of
col de peyresourde (stage 8)
to claim the Yellow Jersey
accelerate your ambition
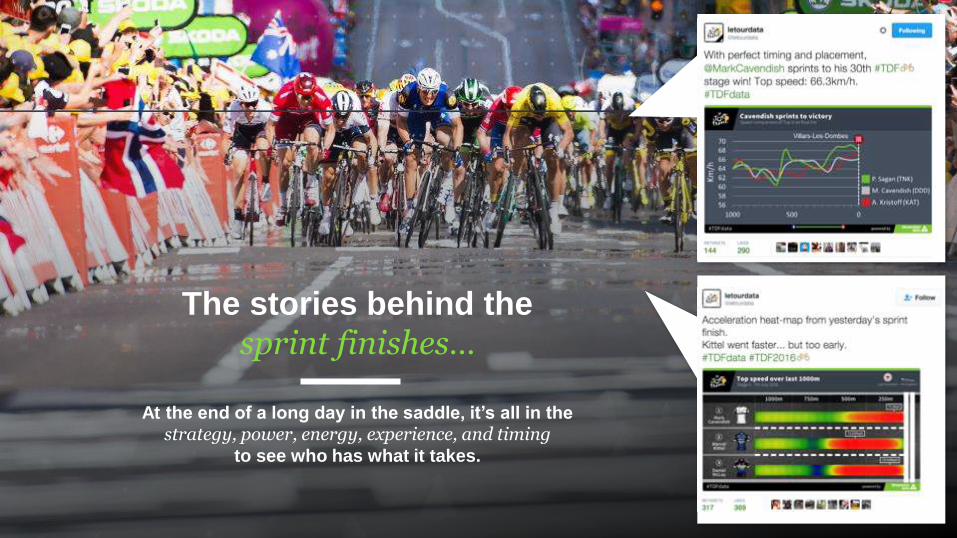
The stories behind the
sprint finishes…
At the end of a long day in the saddle, it’s all in the
strategy, power, energy, experience, and timing to see who has what it takes.
accelerate your ambition
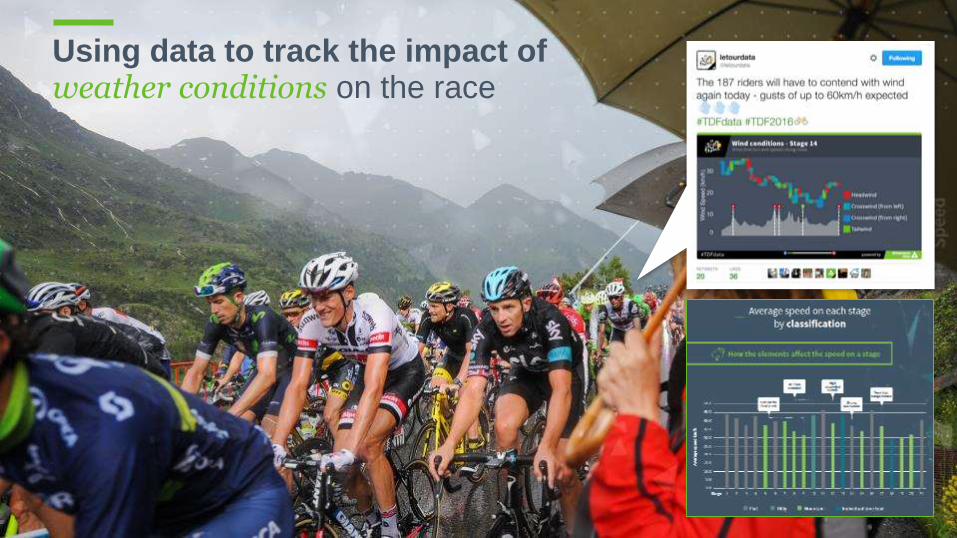
Using data to track the impact ofweather conditions on the race
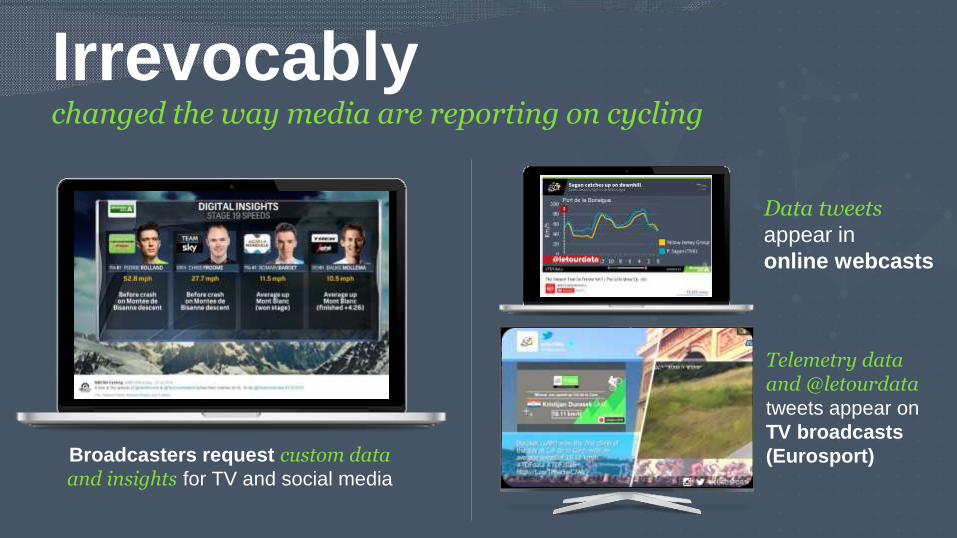
changed the way media are reporting on cycling
Irrevocably
Broadcasters request custom data and insights for TV and social media
Data tweets appear in
online webcasts
Telemetry data and @letourdata tweets appear on
TV broadcasts
(Eurosport)
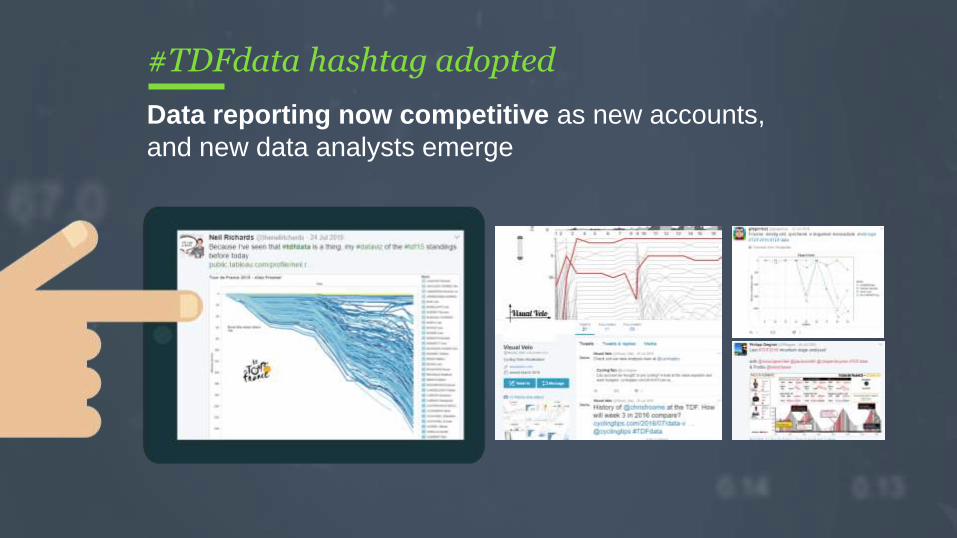
#TDFdata hashtag adopted
Data reporting now competitive as new accounts,
and new data analysts emerge
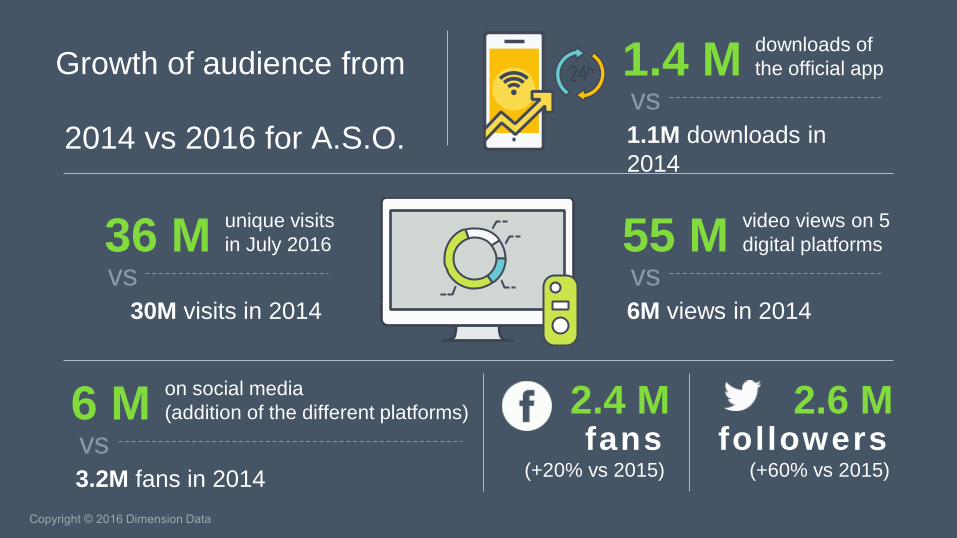
Growth of audience from
2014 vs 2016 for A.S.O.
1.4 M
1.1M downloads in
2014
downloads of
the official app
vs
55 M
6M views in 2014
video views on 5
digital platforms
vs36 M
30M visits in 2014
unique visits
in July 2016
vs
2.4 M fans
(+20% vs 2015)
2.6 M followers
(+60% vs 2015)
6 M
3.2M fans in 2014
on social media
(addition of the different platforms)
vs
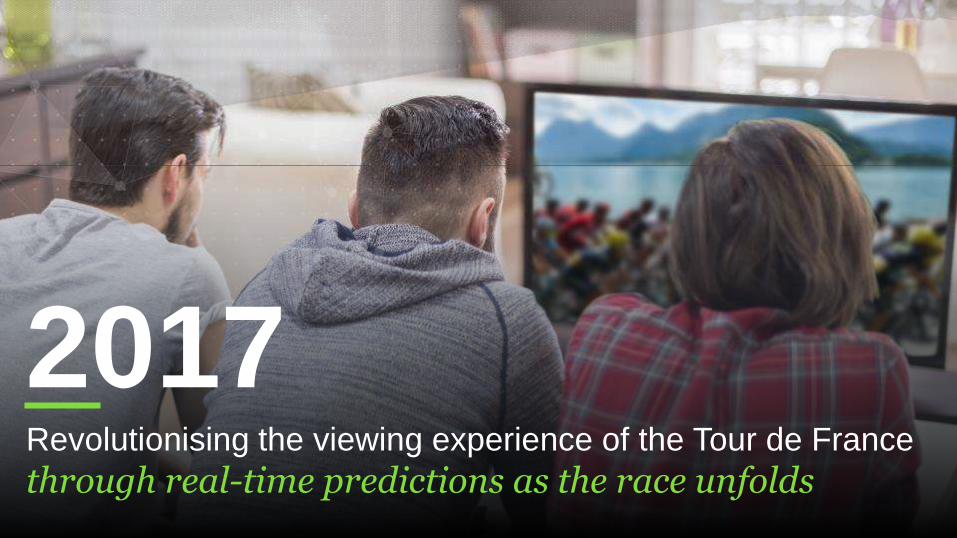
2017Revolutionising the viewing experience of the Tour de France
through real-time predictions as the race unfolds
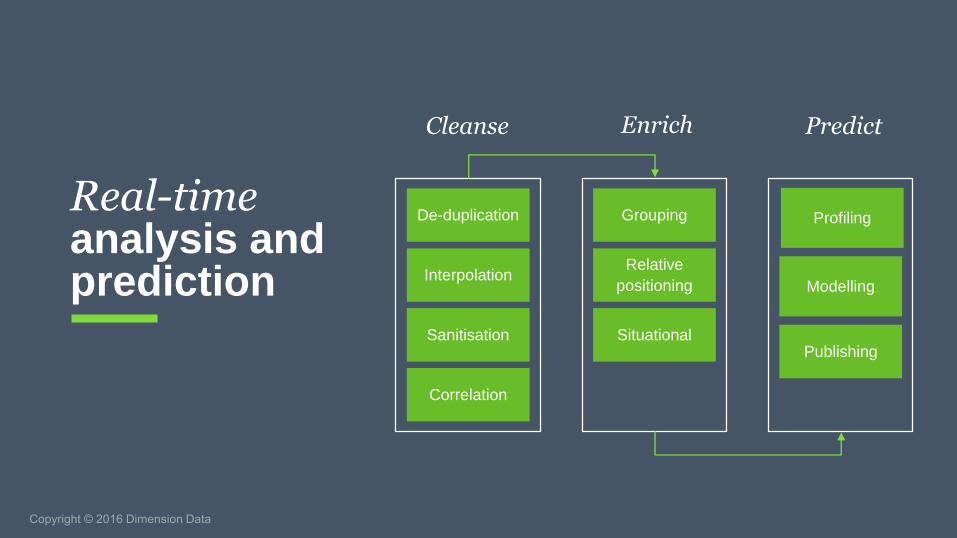
Real-time analysis and prediction
De-duplication
Interpolation
Sanitisation
Correlation
Grouping
Relative
positioning
Situational
Cleanse Enrich Predict
Profiling
Modelling
Publishing
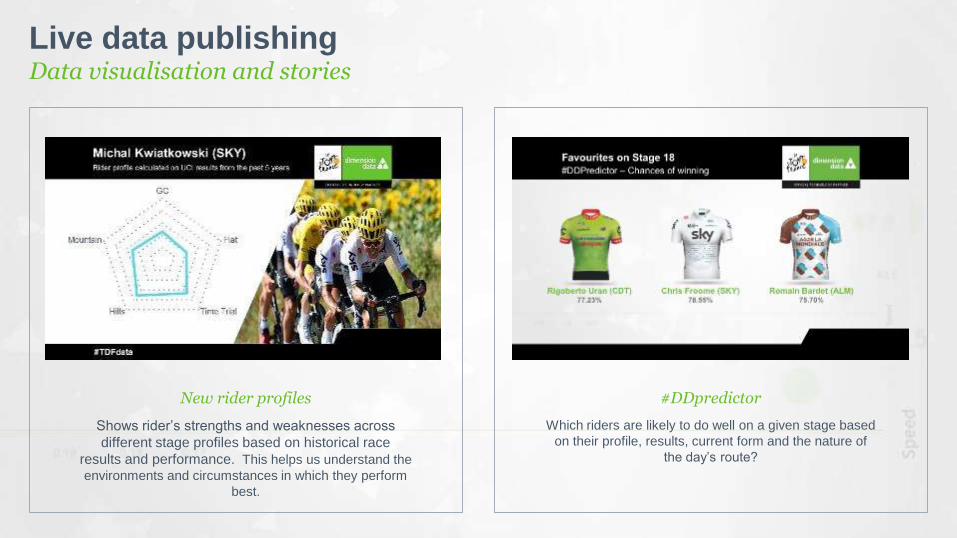
Live data publishingData visualisation and stories
Shows rider’s strengths and weaknesses across
different stage profiles based on historical race
results and performance. This helps us understand the
environments and circumstances in which they perform
best.
New rider profiles
Which riders are likely to do well on a given stage based
on their profile, results, current form and the nature of
the day’s route?
#DDpredictor
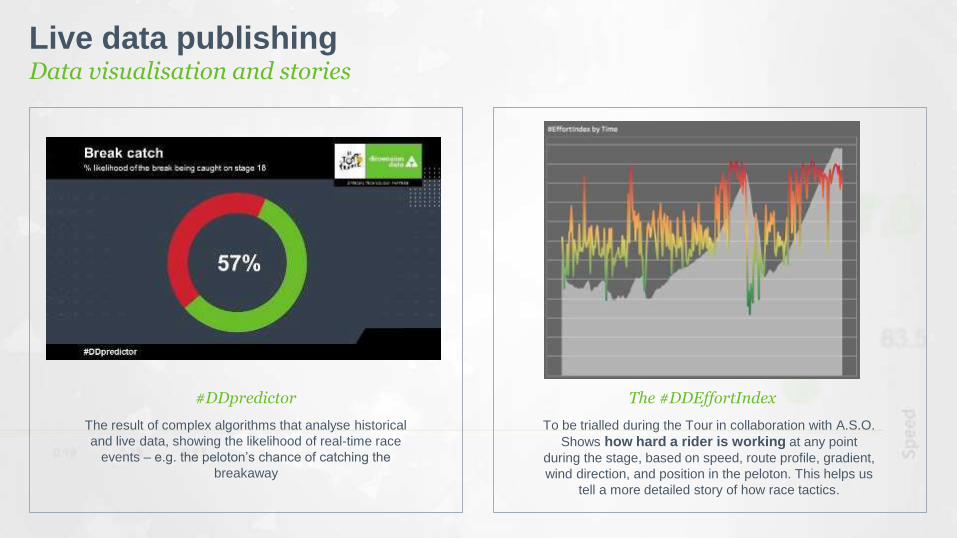
Live data publishingData visualisation and stories
To be trialled during the Tour in collaboration with A.S.O.
Shows how hard a rider is working at any point
during the stage, based on speed, route profile, gradient,
wind direction, and position in the peloton. This helps us
tell a more detailed story of how race tactics.
The #DDEffortIndex
The result of complex algorithms that analyse historical
and live data, showing the likelihood of real-time race
events – e.g. the peloton’s chance of catching the
breakaway
#DDpredictor
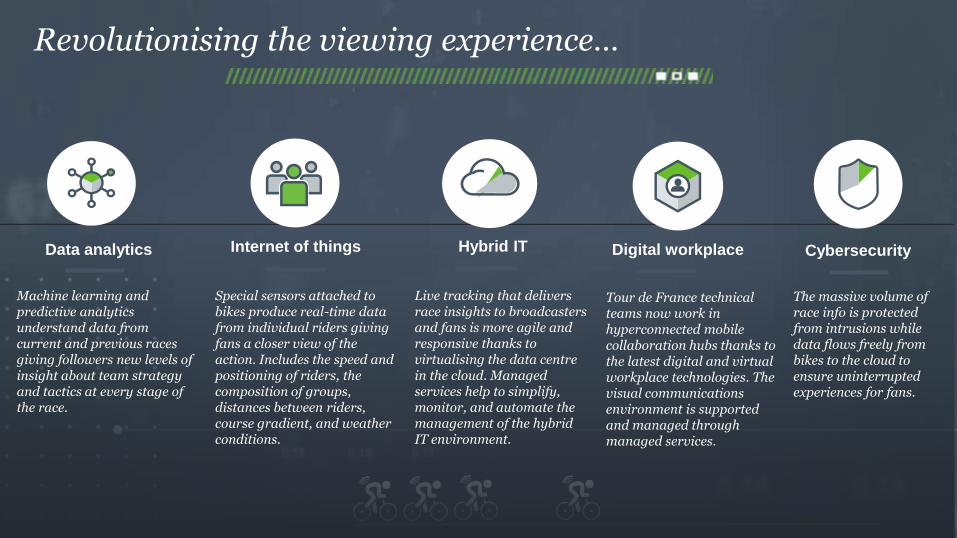
Revolutionising the viewing experience…
Machine learning and predictive analytics understand data from current and previous races giving followers new levels of insight about team strategy and tactics at every stage of the race.
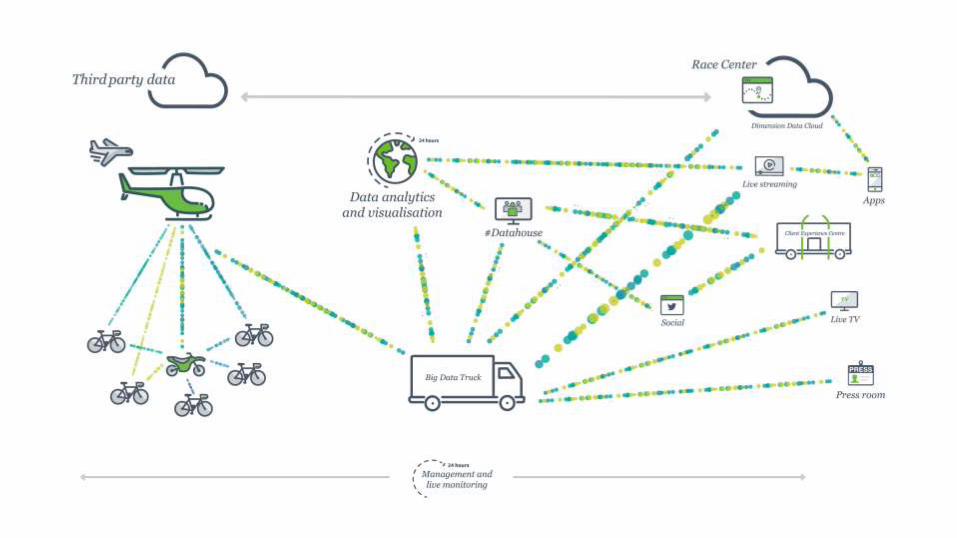
Data analytics
Live tracking that delivers race insights to broadcasters and fans is more agile and responsive thanks to virtualising the data centre in the cloud. Managed services help to simplify, monitor, and automate the management of the hybrid IT environment.
Hybrid IT Digital workplace
Tour de France technical teams now work in hyperconnected mobile collaboration hubs thanks to the latest digital and virtual workplace technologies. The visual communications environment is supported and managed through managed services.
The massive volume of race info is protected from intrusions while data flows freely from bikes to the cloud to ensure uninterrupted experiences for fans.
Cybersecurity
Special sensors attached to bikes produce real-time data from individual riders giving fans a closer view of the action. Includes the speed and positioning of riders, the composition of groups, distances between riders, course gradient, and weather conditions.
Internet of things
accelerate your ambition
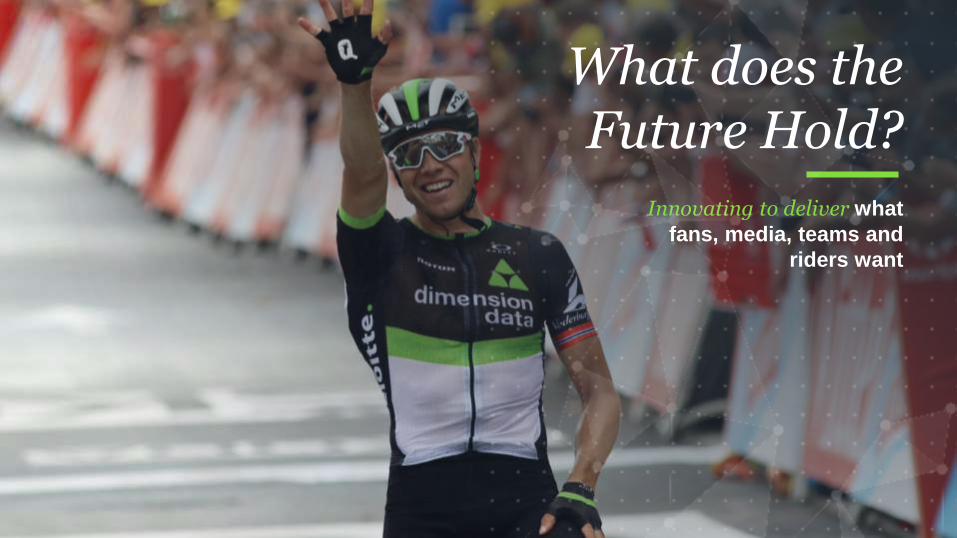
What does the Future Hold?
Innovating to deliver what
fans, media, teams and
riders want
Thank you.