pet packaging business value enhancement sunil marwah packaging business 1.3x 2x 1x
TRANSCRIPT
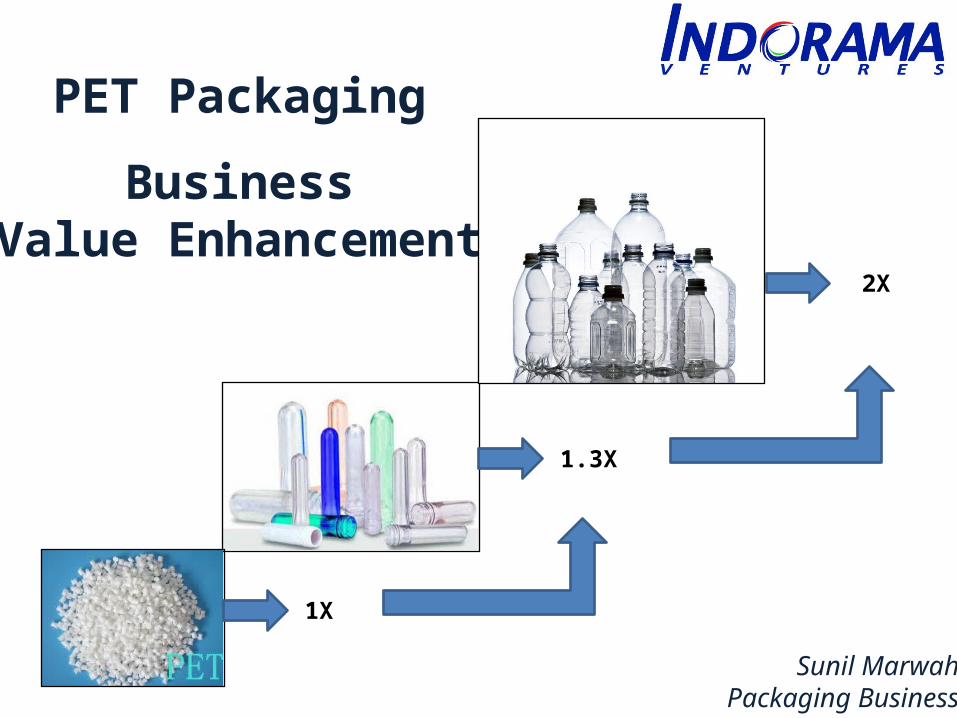
PET Packaging BusinessValue Enhancement
Sunil MarwahPackaging Business
1.3X
2X
1X
2
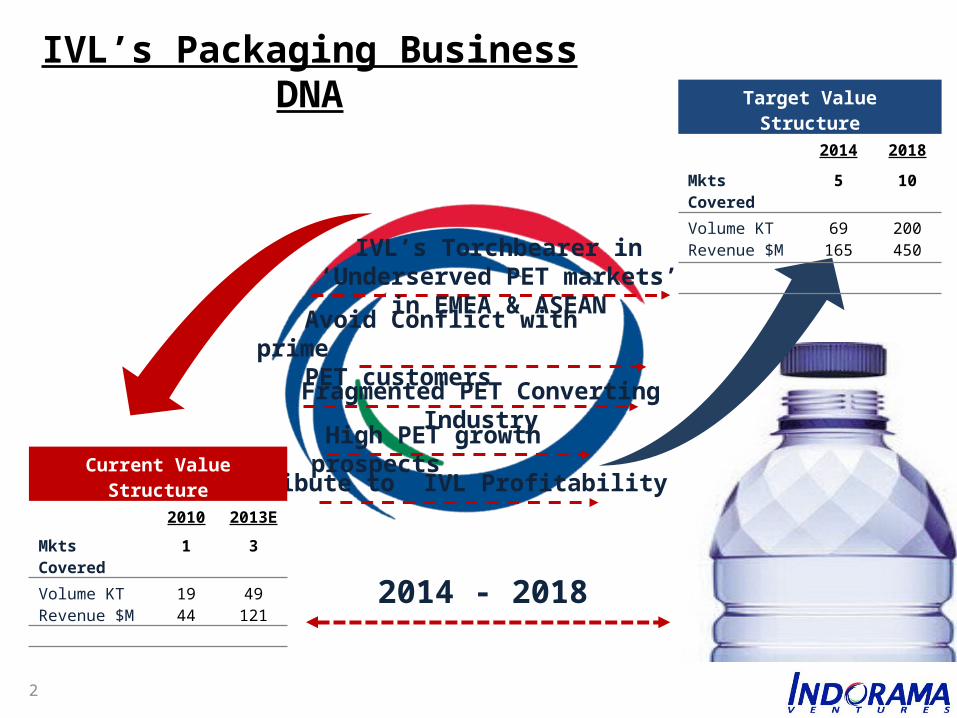
IVL’s Packaging Business DNA
Avoid Conflict with prime PET customers
High PET growth prospects
IVL’s Torchbearer in ‘Underserved PET markets’ in EMEA & ASEAN
Contribute to IVL Profitability
Target Value Structure
2014 2018
Mkts Covered 5 10
Volume KTRevenue $M
69165
200450
Current Value Structure
2010 2013E
Mkts Covered
1 3
Volume KTRevenue $M
1944
49121 2014 - 2018
Fragmented PET Converting Industry
3
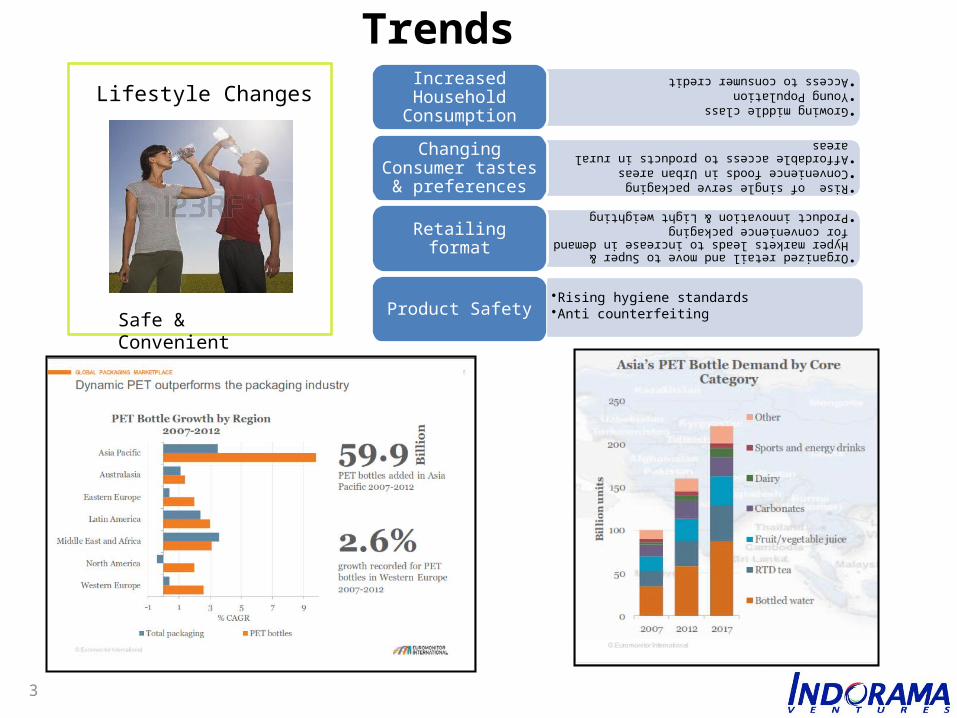
Global Packaging Trends
Lifestyle Changes
Safe & Convenient
•Growing middle class
•Young Population
•Access to consumer credit
Increased Household Consumption
•Rise of single serve packaging
•Convenience foods in Urban areas
•Affordable access to products in rural areas
Changing Consumer tastes & preferences
•Organized retail and move to Super & Hyper markets leads to increase in demand for convenience packaging
•Product innovation & Light weighting
Retailing format
Product Safety•Rising hygiene standards•Anti counterfeiting
4
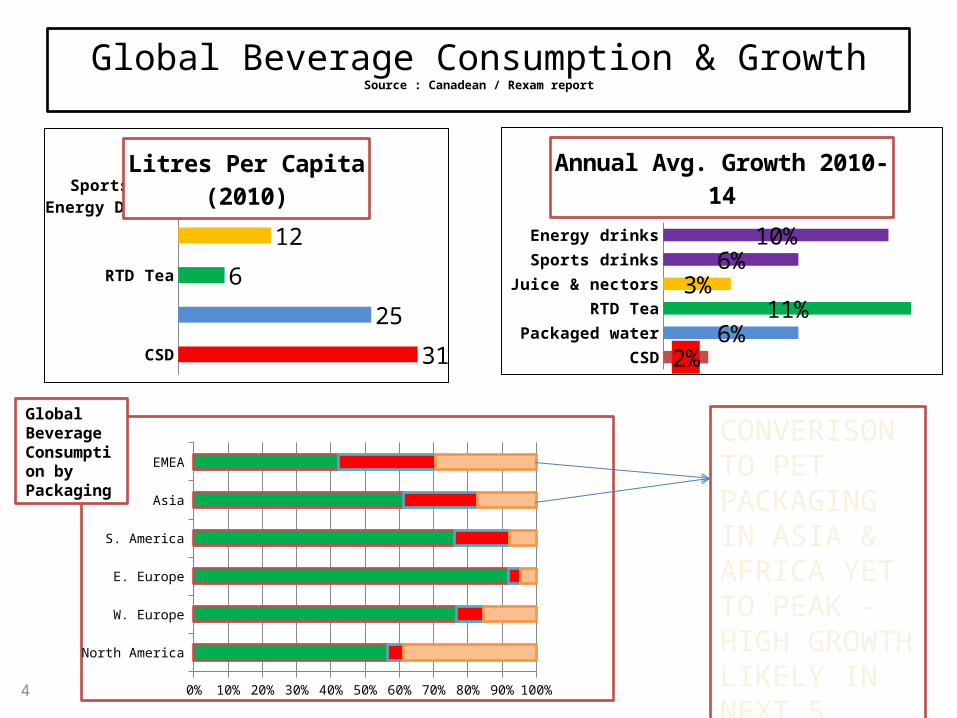
Global Beverage Consumption & GrowthSource : Canadean / Rexam report
CSD
Packaged water
RTD Tea
Juice & nectors
Sports drinks
Energy drinks
2%6%
11%3%
6%10%
Annual Avg. Growth 2010-14
North America
W. Europe
E. Europe
S. America
Asia
EMEA
0% 10% 20% 30% 40% 50% 60% 70% 80% 90% 100%
PET Glass Can
CSD
Packaged Water
RTD Tea
Juice/Nector/Still drinks
Sports & Energy Drinks
31
25
6
12
2
Litres Per Capita (2010)
Global Beverage Consumption by Packaging
CONVERISON TO PET PACKAGING IN ASIA & AFRICA YET TO PEAK - HIGH GROWTH LIKELY IN NEXT 5 YEARS
5
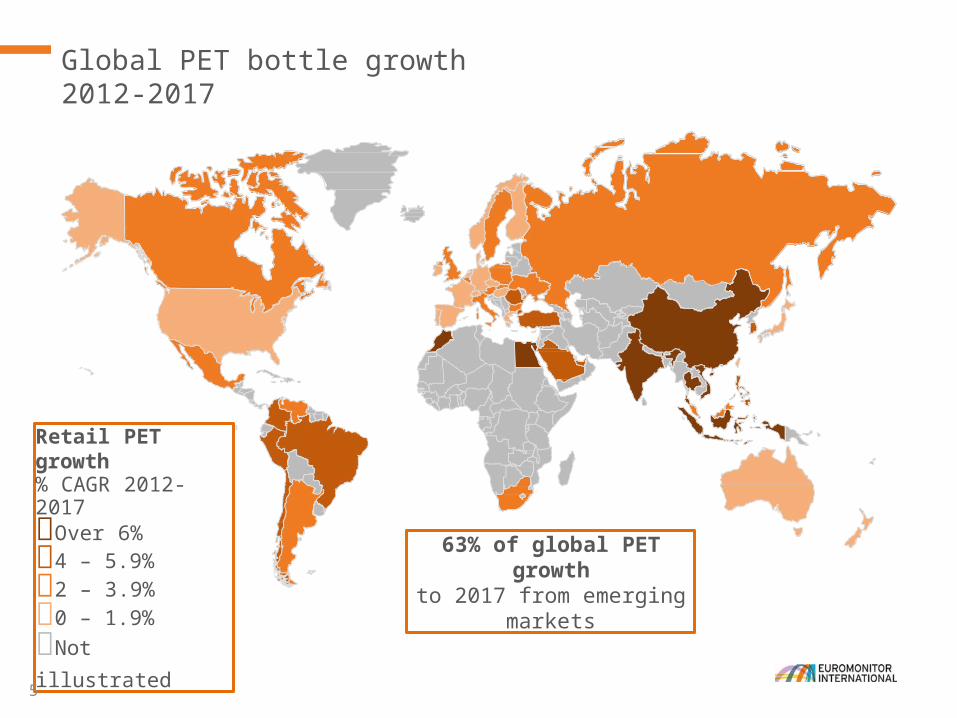
Global PET bottle growth 2012-2017
Retail PET growth% CAGR 2012-2017Over 6%4 – 5.9%2 – 3.9%0 – 1.9%Not illustrated
63% of global PET growthto 2017 from emerging markets
6
604 244
1,980
604
3,509
1,948
4,251 3,577
--
-
180
1,680
778
1,680
868
- 360
-1,196
-
2,463
691 2,476
-
-
-
299
-
1,000
2,000
3,000
4,000
5,000
6,000
7,000
8,000
Region Product Region Product Region Product Region Product
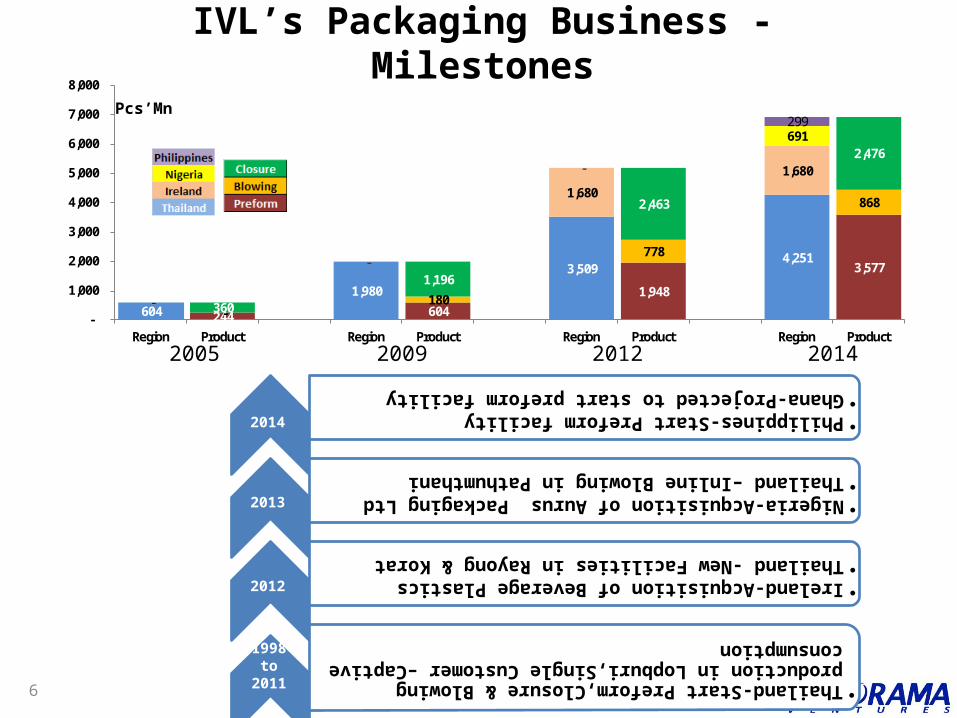
IVL’s Packaging Business - Milestones
•Philippines-Start Preform facility
•Ghana-Projected to start preform facility
•Nigeria-Acquisition of Aurus Packaging Ltd
•Thailand –Inline Blowing in Pathumthani
•Ireland-Acquisition of Beverage Plastics
•Thailand -New Facilities in Rayong & Korat
•Thailand-Start Preform,Closure & Blowing production in Lopburi,Single Customer –Captive consumption
1998 to 2011
2012
2013
2014
Pcs’Mn
2005 2009 2012 2014
7
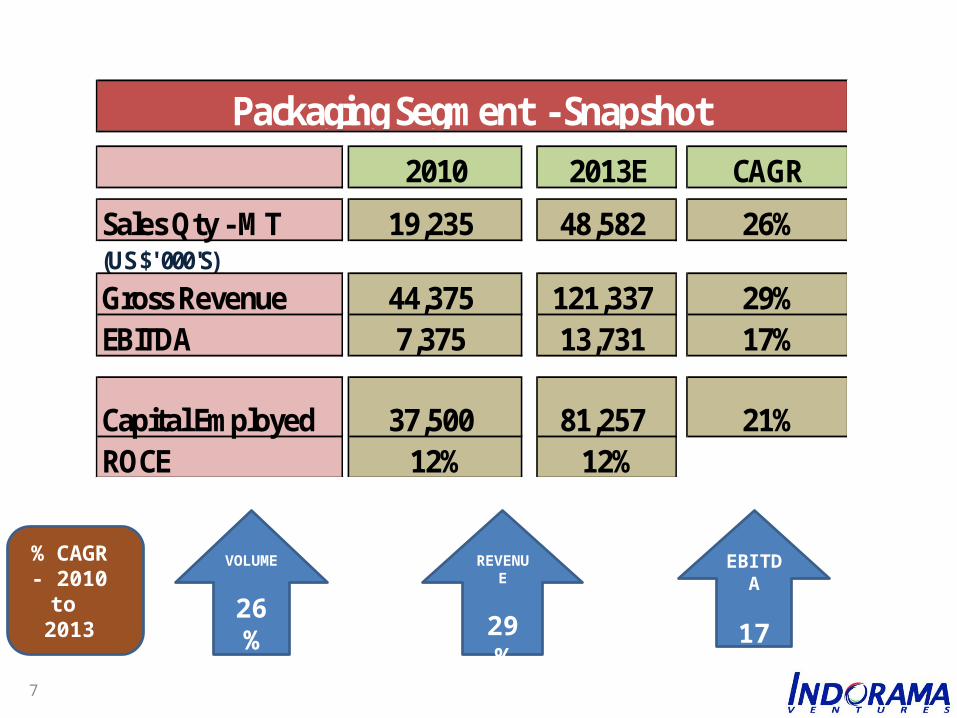
REVENUE
29 %
EBITDA
17 %
% CAGR - 2010
to 2013
VOLUME
26 %
2010 2013E CAGR
Sales Qty - MT 19,235 48,582 26%(US $' 000'S)
Gross Revenue 44,375 121,337 29%EBITDA 7,375 13,731 17%
Capital Employed 37,500 81,257 21%ROCE 12% 12%
Packaging Segment - Snapshot
8
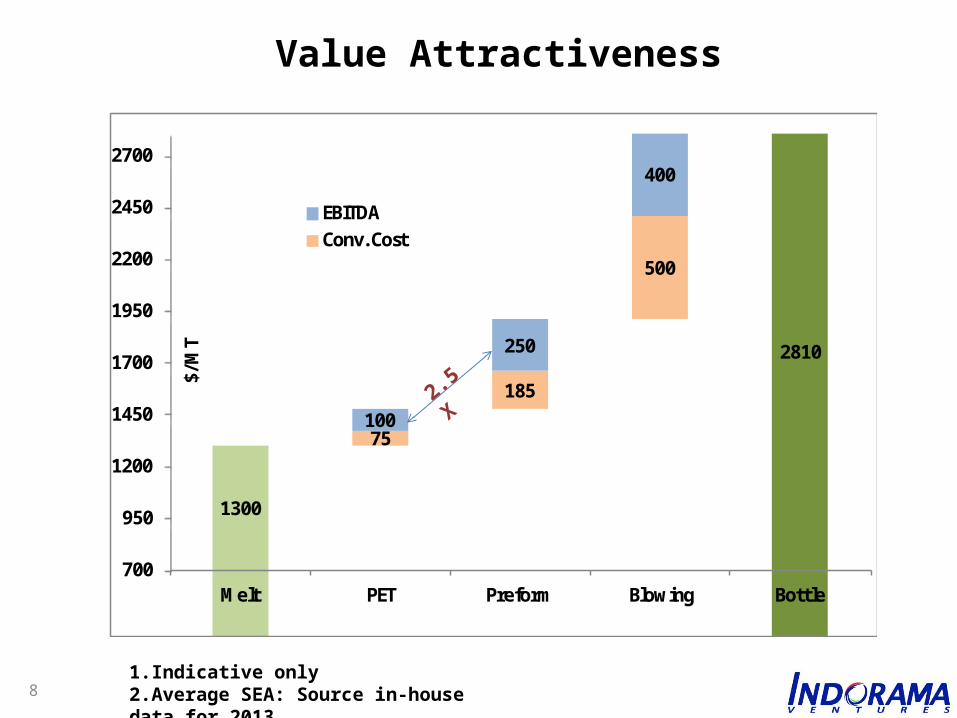
75
185
500
1300
100
250
400
2810
700
950
1200
1450
1700
1950
2200
2450
2700
Melt PET Preform Blowing Bottle
$/M
TEBITDAConv. Cost
Value Attractiveness
1.Indicative only 2.Average SEA: Source in-house data for 2013
2.5X
9
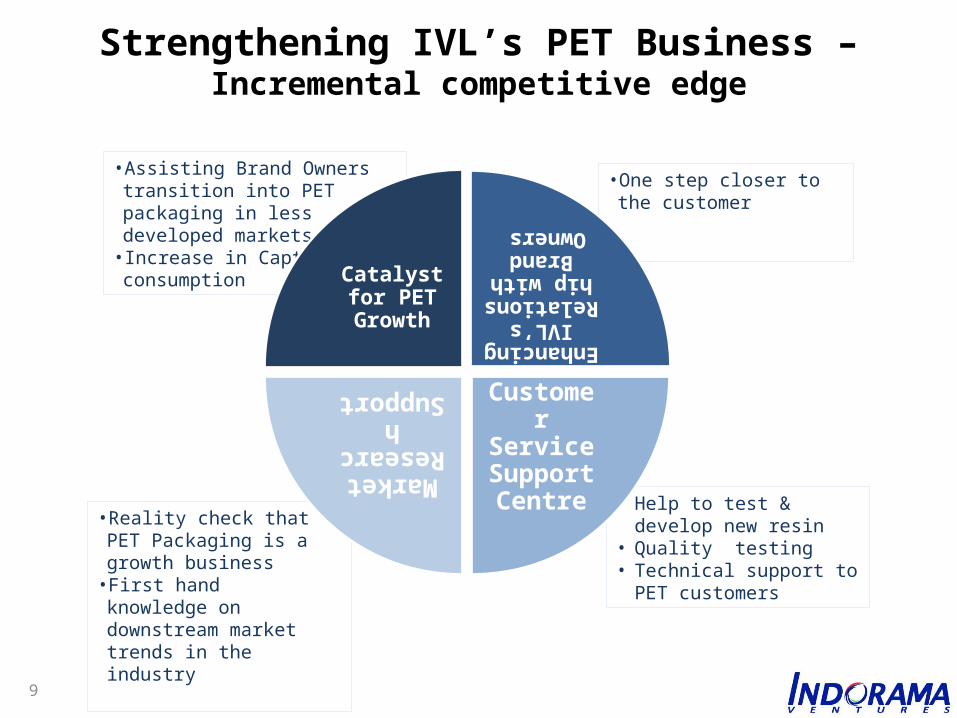
Strengthening IVL’s PET Business – Incremental competitive edge
• Assisting Brand Owners transition into PET packaging in less developed markets
• Increase in Captive PET consumption
• Help to test & develop new resin
• Quality testing• Technical support to PET
customers
• One step closer to the customer
• Reality check that PET Packaging is a growth business
• First hand knowledge on downstream market trends in the industry
Catalyst for PET Growth
Enhancing IVL’s
Relationship with Brand
Owners
Customer Service Support Centre
Market Research Support
10