persistence of subsoil compaction from heavy axle loads
TRANSCRIPT

Soil& Tillage Research, 23 (1992) 95-110 95 Elsevier Science Publishers B.V., Amsterdam
Persistence of subsoil compaction from heavy axle loads*
S.D. Logsdon a, R.R. Allmaras b, W.W. N e l s o n c a n d W.B. V o o r h e e s a
aUSDA Agricultural Research Service, National Soil Tilth Laboratory, 2150 Pammel Dr., Ames, IA 50011, USA
b USDA-ARS, Department of Soil Science, 1991 Upper Buford Circle, University of Minnesota, St. Paul MN55108, USA
cUniversity of Minnesota, Southwest Experiment Station, Lamberton, MN 56152, USA d USDA-ARS, North Central Soil Conservation Research Laboratory, North Iowa Avenue, Morris,
MN 56267, USA
(Accepted 24 July 1991 )
ABSTRACT
Logsdon, S.D., Allmaras, R.R., Nelson, W.W. and Voorhees, W.B., 1992. Persistence of subsoil com- paction from heavy axle loads. Soil Tillage Res., 23: 95-110.
As the persistence of subsoil compaction has a major impact on agricultural sustainability, re- sponses of soil pore characteristics and plant roots to subsoil compaction were examined as related to heavy axle loads. A Ves clay loam was originally compacted with three axle loads of less than 4.5 (control), 9, and 18 Mg in the fall of 1981 (soil dry (D) ) and in the fall of 1982 (soil wet (W)) . The 9 Mg treatment was recompacted on both trials in the spring of 1988 with an 18 Mg axle load, and maize and soybean were grown in rotation. Field measurements in 1988 and 1989 included bulk density, biopore area, root number and location, ponded and negative water pressure infiltration, saturated hydraulic conductivity (Ksat), and ped size distribution. Bulk densities measured under the row in 1989 for the W plots were increased in the 10-28 cm layer by the new 18 Mg load, whereas the original 18 Mg treatment had higher bulk densities in the 28-68 cm depth. The control had lower bulk densities than both compacted treatments for the 18-58 cm increment in 1989. The number and areas ofbiopores in the D control plots were at least ten times greater than in W control plots. Compaction at 35 cm reduced/(sat and ponded infiltration compared with the control. Mean ped diameter ranged from 1.3 to almost four times greater in the compacted treatments than in the control. In spite of increased soil density, a substantial reduction in root growth was not observed. Roots grew around dense clods in the compact treatments allowing continual vertical extension. There was no evidence of poor drainage hindering crop growth in the heavy axle load treatments.
I N T R O D U C T I O N
S u b s o i l c o m p a c t i o n is n o t a l l e v i a t e d w i t h n o r m a l t o p s o i l t i l l a g e p r a c t i c e s .
U n l e s s t h e r e i s s u b s o i l t i l l a g e , n a t u r a l f o r c e s s u c h a s w e t t i n g / d r y i n g , f r e e z i n g /
t h a w i n g , a n d b i o a c t i v i t y m u s t b e r e l i e d u p o n t o a l l e v i a t e t h i s c o m p a c t i o n .
*University of Minnesota manuscript no. 19111.
© 1992 Elsevier Science Publishers B.V. All rights reserved 0167-1987/92/$05.00
96 S.D. LOGSDON ET AL.
Gameda et al. ( 1987 ) observed some alleviation of compacted clay loam sub- soil, but after 3 years the compacted soil still had significantly greater bulk densities than the uncompacted treatment. The compacted layer o fa Ves clay loam produced by packing the bot tom of each adjacent plough furrow (Blake et al., 1976) was not significantly ameliorated over a 9 year period, even though the soil had annually frozen deeper than the depth of compaction. This was true whether maize or alfalfa was grown, and also whether or not irrigation was applied in the fall to enhance the effect of freezing. Voorhees ( 1983 ) showed that in a Ves clay loam, high bulk density and high penetro- meter resistance of wheel-tracked interrows was relieved more by moldboard plowing than by chisel plowing or by natural forces. Natural forces appear to alleviate compaction more effectively in the topsoil than in the subsoil. Ak- ram and Kemper ( 1979 ) indicated that wett ing/drying and freezing/thawing in the laboratory were effective for alleviating compaction of soils with tex- tures ranging from loamy sand to silty clay. This was especially true in the first year. Gaultney et al. ( 1982 ) observed that for a Fincastle silt loam, freeze/ thaw reduced the bulk density of initially wet samples in the laboratory but had no effect on soil in the field.
Crop growth and yields can be adversely affected by subsoil compaction from heavy axle loads depending on the crop, soil type, and nature of soil changes caused by the axle loads. Voorhees et al. (1986) showed increased bulk density (Pb) and decreased Ksat of Ves clay loam, with heavy axle loads causing diminished early growth of maize (Voorhees et al., 1989 ) or soybean (Johnson et al., 1990). Grain yields were not consistently reduced on the Ves clay loam. Winter wheat yields were highest when a silt loam soil was com- pacted with low pressure tires on a combine and a tractor (load less than 5 Mg) than when not compacted or compacted with a 13 Mg loaded wheel (Graham et al., 1986). Aeration stress may have been a problem in the heavy axle load treatment as indicated by low redox potentials after rains, low air- filled porosity at - 5 kPa soil water potential for a Harwell silt loam (Black- well et al., 1986), and reduced rooting depth throughout the growing season (Graham et al., 1986 ). Mechanical impedance may also have limited rooting as indicated by a higher cone resistance (Blackwell et al., 1986 ), a concentra- tion of roots along the planting slits, and thickened roots in the denser soil (Graham et al., 1986). Gameda et al. (1987) observed reduced yields for maize growing on soils with compacted subsoils, which they attributed to aer- ation stress. Hakansson et al. ( 1987 ) measured more yield reduction for sub- soil compaction on clay soils than on sandy soils. Gaultney et al. ( 1982 ) ob- served that compaction reduced maize yields.
Voorhees et al. (1986) suggested a need to "quantify pore continuity, ori- entation, and stability", especially for compacted soils. Infiltration measure- ments (positive and negative water pressures) have been used to determine effective hydraulic porosity of a given equivalent pore size range (Watson
SUBSOIL COMPACTION FROM HEAVY AXLE LOADS 97
and Luxmoore, 1986; Wilson and Luxmoore, 1988). Vertical continuity of pores is also important in these in situ measurements. Wheel traffic reduced infiltration rates by a factor o f t en in a no-till treatment, and by a factor of 20 in a chisel treatment when compared with areas without wheel traffic (An- keny et al., 1990). Wang et al. ( 1985 ) indicated compaction for clayey soils at the 10-25 cm depth (lower portion of Ap horizon produced by moldboard plow). They used both in situ measured and predicted (McKeague et al., 1982 ) g s a t values.
The aim of this research was to determine long-term effects of heavy axle loads on soil pore characteristics, current rooting patterns, and associated in- fluences of pore conditions on rooting pattern. Pores were measured directly, as well as indirectly through determination of soil hydraulic properties.
MATERIALS AND METHODS
Field descriptions
The original field experiment was started in the fall of 1981 on a Ves clay loam (fine-loamy, mixed mesic Udic Haplustoll) at the Southwest Experi- ment Station at Lamberton, MN. The soil is clay loam throughout, and the subsoil has weak to moderate prismatic structure parting to moderate angular blocky structure. (Ves naturally has subangular blocky structure, but tillage and traffic has resulted in angular blocky structure). Details of the initial ex- perimental arrangement are given by Voorhees et al. ( 1986, 1989). The ini- tial compaction treatments were axle loads of 9 and 18 Mg applied at the soil surface uniformly over the plots. The control treatment had an axle load of less than 4.5 Mg. Two replicates received the initial heavy axle load when the soil was relatively dry (D) (fall of 1981 ), and two replicates received the initial heavy axle load when the soil was relatively wet (W) (fall of 1982). After 1982 both sets of plots were treated in the same way.
The 9 Mg treatment (both W and D plots) was recompacted in the spring of 1988 with an 18 Mg axle load. The gravimetric soil moisture content in a nearby field for 1 and 15 April 1988 was about 20% except for a wet zone at depths from 20 to 50 cm, which was around 25% or approximately 'field ca- pacity' as indicated by Voorhees et al. ( 1986 ).
Maize (Zea mays L.) and soybean (Glycine max (L.) Merr) were grown in rotation, both grown each year until 1986; then the whole field was maize in even years, and soybean in odd years. Through 1986 annually applied wheel traffic with axle loads of less than 4.5 Mg was controlled to occur only in the interrows. Traffic was not controlled from 1987 to 1990. Chiseling for pri- mary tillage was done diagonally in the springs of 1988 and 1990. It was done after applying the 18 Mg load in 1988. The field was moldboard plowed (landside parallel with the row) after maize in the fall of 1988. Secondary
98 S.D. LOGSDON ET AL.
tillage in the spring of 1988 to 1990 was done by tandem disking twice (par- allel with the row). Most measurements were confined to interrows not traf- ficked during spring field operations; however, effects in the bottom of the Ap from previous uncontrolled traffic (from 1987 to 1990) may still have been present.
B ul k densi ty
Dry bulk density was determined at 2 cm depth increments (Allmaras et al., 1988 ) under the row with a 2.84 cm diameter core sampler. Twelve 2-cm core increments from each depth were composited for each determination with one determination made in each of two replicates. Bulk densities were measured to the 80 cm depth in the D plots in the summer of 1988, to the 74 cm depth in the W plots before moldboard plowing in the fall of 1988, and to the 68 cm depth in the recovery W plots in the summer of 1989. For each sampling date, variances were pooled to obtain a single estimate of random error. Treatment differences were compared at each depth for each sampling date.
Pit measuremen t s ~ 1988 (D plots)
A single excavation was made per treatment within one replicate of the D plots, and five horizontal planes were exposed from an access pit using the technique described by Logsdon et al. (1990). Five planes were exposed in a depth sequence at the following depths: 15, 25, 35, 50, and 70 cm. After a plane was cleared, pores and cracks were marked on polyethylene sheets, ori- ented to cover the row and extend into an interrow that was not tracked dur- ing planting. Roots were mapped by marking on polyethylene sheets as de- scribed by Logsdon and Allmaras (1991). Pore and crack characteristics, stained areas from dye movement, and root distributions were determined in each duplicate area at each of the 15 and 35 cm depths (Logsdon et al., 1990). One 30 c m × 30 cm section from each sheet was later digitized and processed by image analysis (Logsdon et al., 1990).
After marking the plastic sheets, sets of 16 undisturbed soil cores (5 cm diameter and 6 cm length) for saturated hydraulic conductivity (Ksa~) were taken at the 15 and 35 cm depths as previously described by Logsdon et al. ( 1990 ). These cores were gently inserted without impact to minimize distur- bance during sampling. If necessary, the soil was pre-wetted before taking cores.
Pit measuremen t s ~ 1989 ( W plots)
In 1989 one access pit was made for each treatment within one replicate of the W plots. Marking of pores, cracks, and roots on horizontal faces was done
SUBSOIL COMPACTION FROM HEAVY AXLE LOADS 99
on both sides of an access pit ( instead of just one side as in 1988 ). Separate plastic sheets were marked for two adjacent rows and the associated interrow. This procedure produced six locations for measurements in each access pit for each t reatment and for each feature determined. Image analysis determi- nations were made on two contiguous 30 cm X 30 cm sections. The two sec- tions were oriented with the combined 60 cm length parallel to the row.
Infiltration tests with both positive and negative water pressure were made with a disk permeameter (Perroux and White, 1988 ) during the field season of 1989. The permeameters had a wetting disk diameter of 22 cm. The disk design required a positive pressure head of 13 mm of water which was sub- tracted from the tension setting in the bubble tube (Perroux and White, 1988; Wilson and Luxmoore, 1988 ). By maintaining a smaller water tension in the bubble tube than the pressure head in the disk, ponded infiltration was pos- sible without modifying the permeameter . Water pressures were + 5, - 3 0 , and - 75 mm. Three determinat ions for each treatment were made at the soil surface, four determinat ions at the 35 cm depth, and two determinat ions at the 70 cm depth. These determinat ions were all made within one replicate of the W plots. The surfaces had been cleared smooth with an offset putty knife, and no contact material was used between the infil trometer and the soil. Be- cause no confining ring was used, infiltration was three-dimensional (Smet- tern and Clothier, 1989; Ankeny et al., 1990, 1991 ) allowing for rapid quasi- steady-state flow into a soil that was not dis turbed by insertion of a confining ring (Smet tem and Clothier, 1989). Moreover, tor tuous biopores were not excluded, as would occur with a confining ring (Ankeny et al., 1991 ).
Two duplicate sets o f 16 undis turbed cores were taken from exposed planes at 35 cm depth in each t reatment for measurement of Ksa t. These cores were taken in the same location where the permeameters had been used, and these areas had enough moisture to facilitate obtaining undisturbed cores without impact. The cores were stored at 5 °C prior to g s a t analysis.
Pit measurements, 1990
Ponded and tension infiltration measurements were made in both D and W trials, in both replicates for each of the three treatments at the 35 cm depth. Again the water pressures used were + 5, - 30, and - 75 mm.
Ped diameter distribution
Unconfined, undis turbed cores (6.7 cm in diameter) were taken from the 35-45 cm depth. In 1989 five cores were taken in only one replicate of the W plots, the same replicate as for the pit measurements . In 1990 two cores were taken from each of two replicates for the three treatments on both the D and
100 S.D. LOGSDON ET AL.
W plots. These cores were wrapped in plastic and taped into a cardboard cyl- inder ( 12 cm in length, 7 cm in diameter) for transport to the laboratory. After the samples were air-dried slowly in the laboratory, a dry-ped diameter distribution was determined after shaking for 6 min with a vibrating shaker (Van de Graaff, 1978). The sieves had openings of 25.3, 12.7, 9.52, 5.6, and 2 mm. Dry-ped size distribution is an empirical measure of the cohesive strength of the air-dried core. If there is less dry strength, the uniformly ap- plied energy should produce a greater number of ruptures.
Ksa t and root length density
g s a t w a s determined on the undisturbed samples by the falling head method (K lute and Dirksen, 1986) with four determinations per core. Geometric means were calculated stepwise: first from each set of four determinations per core, and then for each set of 16 cores. In 1988 roots were washed from these same cores for measurements of root length density by the intersection method (Tennant, 1975 ). Only g s a t w a s measured from the cores in 1989.
Statistics
Pit measurements from 1988 and 1989 could not be statistically compared because pits were only dug in one replicate to prevent excessive destruction of the plots. The data are included for qualitative comparisons and trends.
The ponded infiltration and mean ped diameter measured in 1990 were analyzed as planned orthogonal comparisons. For the D plots, the old 18 Mg and control treatments were contrasted with the new 18 Mg treatment. (As the original 18 Mg load did not produce compaction, no difference would be expected from the control; however, the new load might produce differ- ences. ) For the W plots, the old and new 18 Mg treatments were contrasted with the control. (In this case the original 18 Mg load as well as the new load produced compaction. )
For all statistics, differences were considered significant at the 0.05 proba- bility level.
RESULTS
Bulk density
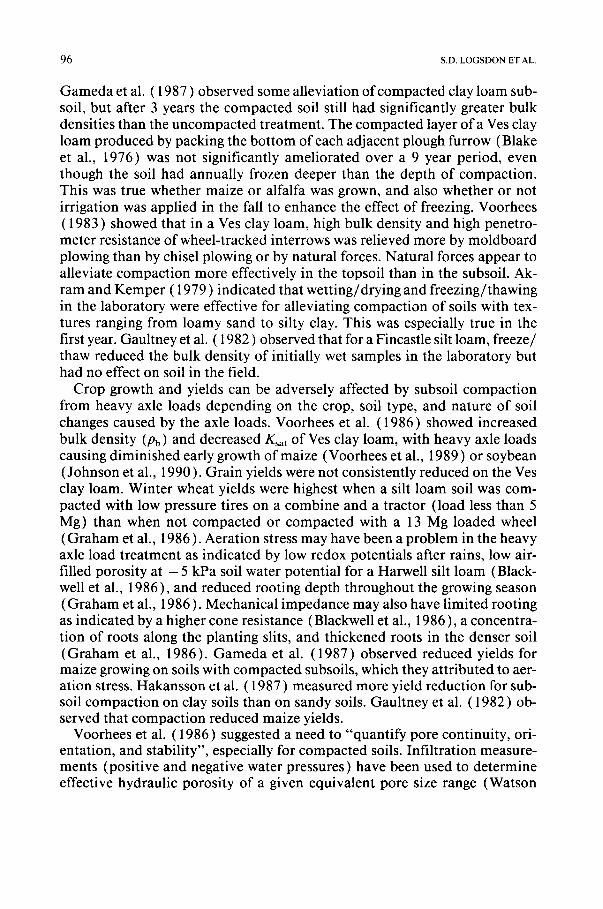
Bulk densities from the D plots did not show consistent trends of treatment differences in the subsoil (Fig. 1 (a ) ) , although the control was least dense from 52 to 62 cm. Voorhees et al. (1986) had observed no treatment differ- ences. In the surface layers at depths from 4 to 14 cm, the new 18 Mg treat- ment was significantly more dense than the other treatments. Dense angular-
S U B S O I L C O M P A C T I O N F R O M H E A V Y A X L E L O A D S 101
0.5 1.0 1.5 0.5 1.0 1.5 0.5 1.0 1.5 0 I I I I I I
O
~ - 4 0
o A o l ~ B M g O ~ A I O new 1B M g o ~ ~ ¢1~ . - 6 0
s s=O. lO ~ [ s=O.OS - o A
1988, D o°J~PL I 1988, W ~ I 1 9 8 9 , W --80 ' P~ i II . . . . . I
0.5 1 .O 1.5 0.5 1 .O 1.5 0,5 1.0 1.5
BULK DENSITY (g cm-%
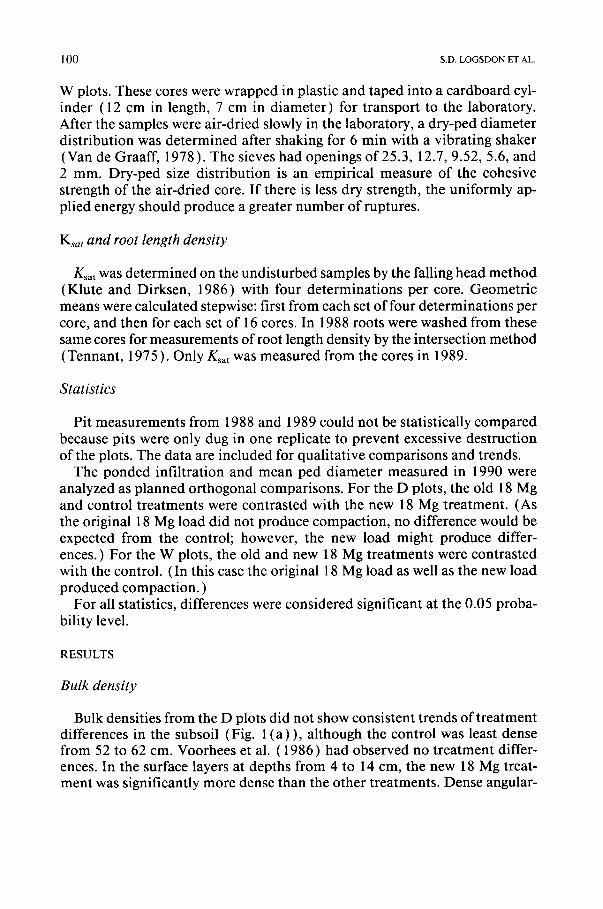
Fig. 1. Bulk density profiles for: (a) dry site, spring 1988 after chiseling and secondary tillage; (b) wet site, fall 1988 before moldboard plowing; and (c) wet site, summer 1989 after fall moldboard plowing.
blocky clods were present at the 14-22 cm depth in all t reatments including the control. Uncontrolled wheel traffic during chiseling may have caused poor physical conditions at this depth. Subsequent spring disking would only loosen the soil to about 10 cm.
Subsoil compact ion was evident 6 -7 years after the original 18 Mg load was applied on the W plots (Figs. 1 (b) and 1 ( c ) ) . In 1988 the old 18 Mg treat- ment from the W plots was significantly more dense than the other t reatments at depths from 46 to 64 cm except for the depth increments 50-52 cm, and 56-60 cm, and in 1989 was significantly more dense from 28 to 66 cm except for the depth intervals 34-36, 40-42, 50-52, and 60-62 cm.
In the spring of 1988, the soil was wet only to a depth of about 50 cm, so recompact ion with an 18 Mg load did not extend as deeply (Fig. 1 ( b ) ) as in the fall of 1982. In 1988 on the W plots the new 18 Mg treatment was signifi- cantly more dense than the other t reatments at depths from 2 to 34 cm except for the 6-8 cm depth interval, and in 1989 was more dense from 10 to 28 cm. On the W plots in 1988, the control was the least dense t reatment from 2 to 56 cm except for the depth intervals 6-8, 42-44, and 46-48 cm, and in 1989 was the least dense t reatment at depths from 16 to 60 cm.
Bulk density profiles also indicated tillage depth. In the spring of 1988, chiseling only extended about 8 cm in the new 18 Mg treatment, and about 12 cm in the control and old 18 Mg load treatments (Figs. 1 (a) and 1 ( b ) ) . Fall moldboard plowing ( 1988 ) extended only about 14 cm in the new 18 Mg treatment, and about 20 cm in the control and old 18 Mg treatments (Fig. l ( c ) ) .
102 S.D. LOGSDON ET AL.
1.8
I
E 1.7 o c~
m 1.6 z
m 1.5
1.4
I I I L 33 fo 45 -cm depfh
..i, .................. \
I I I I
45 fo 6 0 - c m depfh
° - - ' ' ° ' ° ' ~ . o o . ° - - ' "
J
• Old 18 Mg
i i i i r i i F
0 2 4 6 0 2 4 6
YEARS AFTER COMPACTION
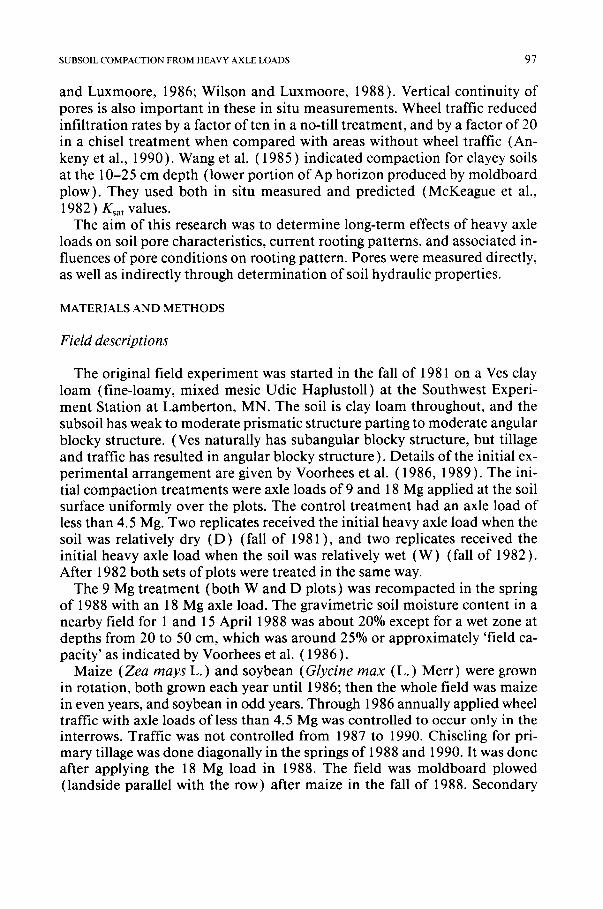
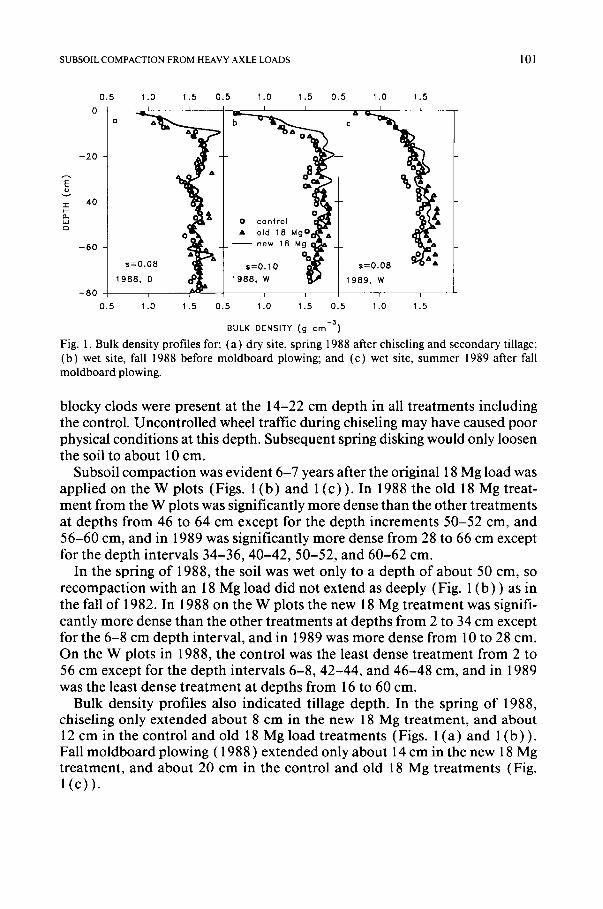
Fig. 2. Bulk densi ty o f two dep th inc remen t s over a t ime per iod o f 7 years in the dry site.
Measurements in the W plots can be compared with bulk densities mea- sured by Voorhees et al. (1986) by pooling data at specific depth intervals. Bulk densities decreased in both treatments between 1988 and 1989, but the differences between treatments were still evident. Year-to-year fluctuations in subsoil bulk density were also reported by Blake et al. (1976). Because bulk density shows a response to soil structure, the year-to-year variations suggest variations of structure owing to natural forces. Sampling methodol- ogy, especially diameter of the core and volume of the release mechanism in the sampler were very different between the first two and last two sampling dates. Subsoil density still remained greater for the old 18 Mg treatment than for control even though reductions in bulk density occurred for both treat- ments. In fact, differences between treatments appeared to increase over time (Fig. 2).
Subsoil compaction was not evident in pooled bulk density data for the D plots 6-7 years after compaction. Bulk densities for the 33-45 cm depth were 1.58 Mg m - 3 and 1.55 Mg m -3 for the control and old 18 Mg treatments, respectively. Respective bulk densities for the 45-60 cm depth were 1.62 Mg m - 3 and 1.59 Mg m - 3 .
Macroporosity
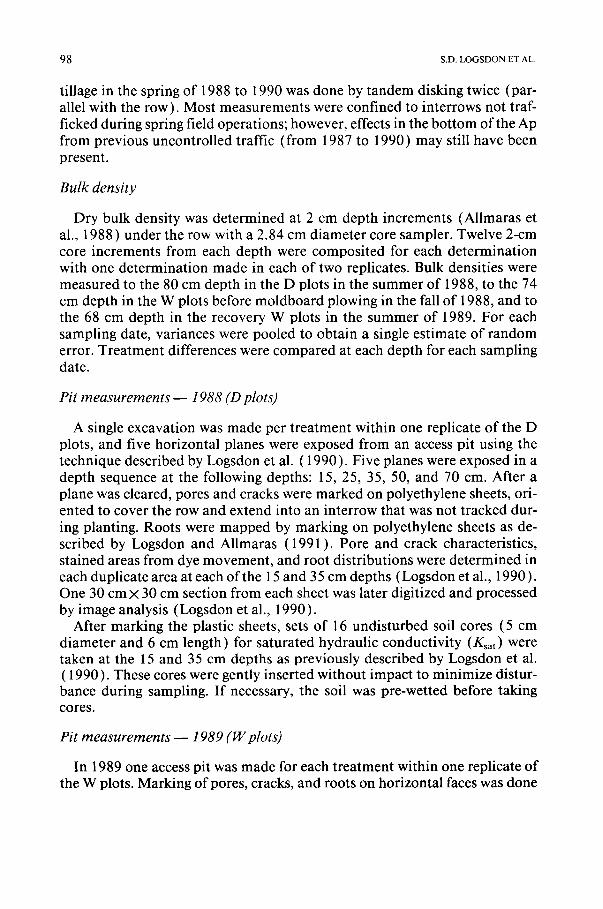
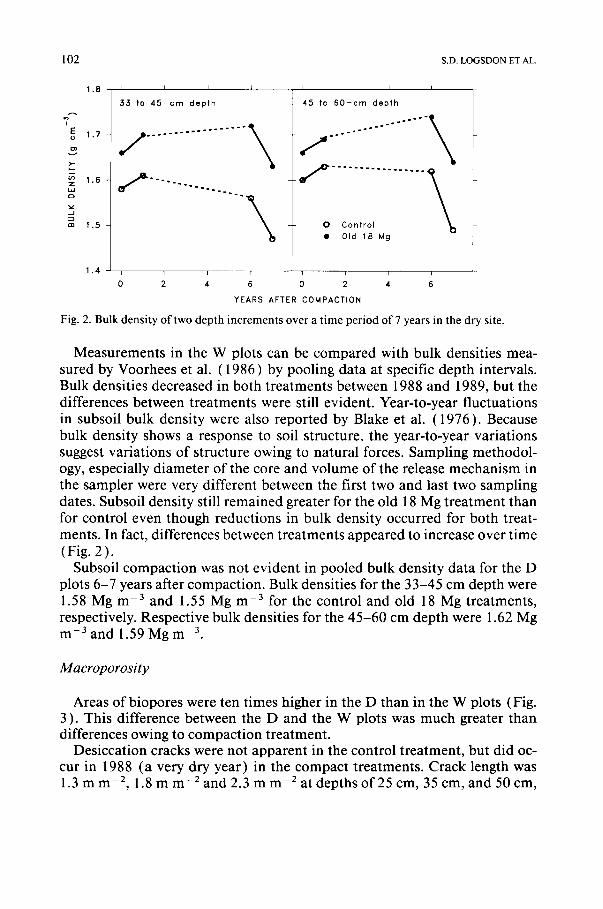
Areas of biopores were ten times higher in the D than in the W plots (Fig. 3 ). This difference between the D and the W plots was much greater than differences owing to compaction treatment.
Desiccation cracks were not apparent in the control treatment, but did oc- cur in 1988 (a very dry year) in the compact treatments. Crack length was 1.3 m m -2, 1.8 m m -2 and 2.3 m m -2 at depths of 25 cm, 35 cm, and 50 cm,
SUBSOIL COMPACTION FROM HEAVY AXLE LOADS 103
o v - r ) -
0 I I I I I I I
1989, D 1989, W
20
1 ~ i x x x x x i ~
! I 40
r ~ Old 18 Mg ~ New 18 Mg ~ C o n t r o l
6O
8 0 i i i i i i i
0 . 0 0 . 5 1.0 1.5 0 . 0 0 0 . 0 2 0 . 0 4 0 . 0 6 0 . 0 8
AREA OF PORES > 0 .4 m m (% o f t o t a l a r e a )
Fig. 3. Total area of biopores at various depths as related to compaction treatment and test site.
respectively, in the old 18 Mg treatment. Crack length was 0.6 m m -2 and 2.2 m m -2 at depths of 15 cm and 50 cm, respectively, in the 18 Mg treatment. Desiccation cracks did not occur in 1989, but fine cracks were apparent after the exposed soil had dried.
Dye stains were not apparent below the Ap in any treatment as would be expected when chiseled (Logsdon et al., 1990). This indicated that macro- pores were not cont inuous vertically from the surface in any of these plots.
Ksat
In the D plots, Ksat in 1988 was slow in all t reatments at the 15 cm depth (Table 1 ), which can be at t r ibuted to random surface traffic after 1986. The new and old 18 Mg treatments in the D plots at a depth of 35 cm had respec- tive/(sat values of only 4% and 27% that of the control. For the W plots at a depth of 35 cm,/(sat in 1989 was only 5% and 32% that o f the control for the new and old 18 Mg treatments, respectively.
Infiltration
Infiltration rates measured in 1989 at the soil surface appeared greater for the control t reatment when ponded as well as at - 3 0 and - 7 5 mm water pressure (Table 2) , but differences between treatments were not as great at negative water pressures. Infiltration rates were not different at any water pressure for the new and old 18 Mg treatments. Infiltration rates at the 70 cm depth were uniformly higher than at the 35 cm depth (Table 1 ), and no treat- ment differences should be expected at the 70 cm depth.
At the 35 cm depth of the W plots, the ponded infiltration rate in 1989 was
104 S.D. LOGSDON ET AL.
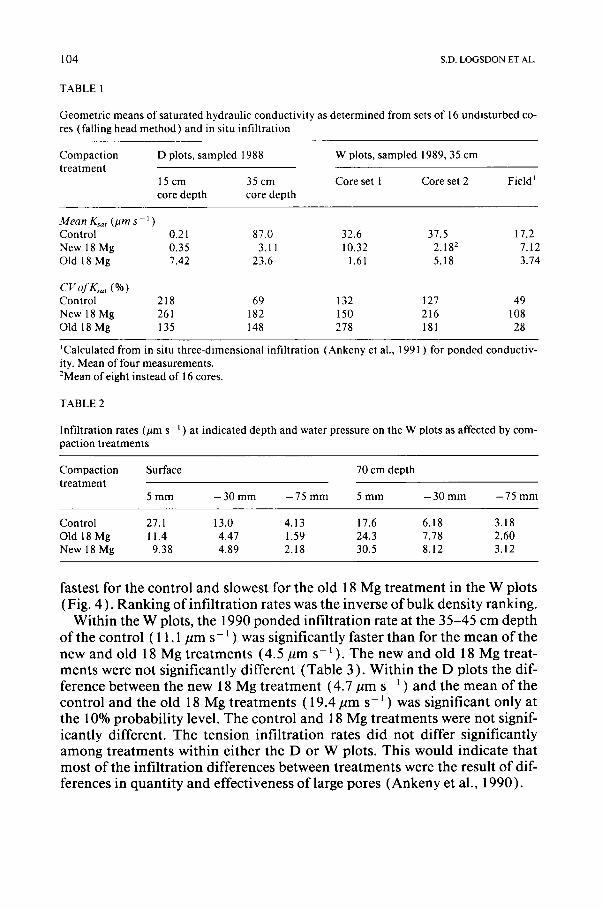
TABLE 1
Geometric means of saturated hydraulic conductivity as determined from sets of 16 undisturbed co- res (falling head method) and in situ infiltration
Compaction treatment
D plots, sampled 1988 W plots, sampled 1989, 35 cm
15 cm 35 cm Core set 1 Core set 2 Field ~ core depth core depth
M e a n K~a, ( I t m s - 1 )
Control 0.21 87.0 32.6 37.5 17.2 New 18 Mg 0.35 3.11 10.32 2.182 7.12 Old 18 Mg 7.42 23.6 1.61 5.18 3.74
CVofKsa, (%) Control 218 69 132 127 49 New 18 Mg 261 182 150 216 108 Old 18 Mg 135 148 278 181 28
t Calculated from in situ three-dimensional infiltration (Ankeny et al., 1991 ) for ponded conductiv- ity. Mean of four measurements. 2Mean of eight instead of 16 cores.
TABLE 2
Infiltration rates (/~m s - ~ ) at indicated depth and water pressure on the W plots as affected by com- paction treatments
Compaction Surface 70 cm depth treatment
5 m m - 3 0 m m - 7 5 m m 5 m m - 3 0 m m - 7 5 m m
Control 27.1 13.0 4.13 17.6 6.18 3.18 Old 18 Mg 11.4 4.47 1.59 24.3 7.78 2.60 New 18 Mg 9.38 4.89 2.18 30.5 8.12 3.12
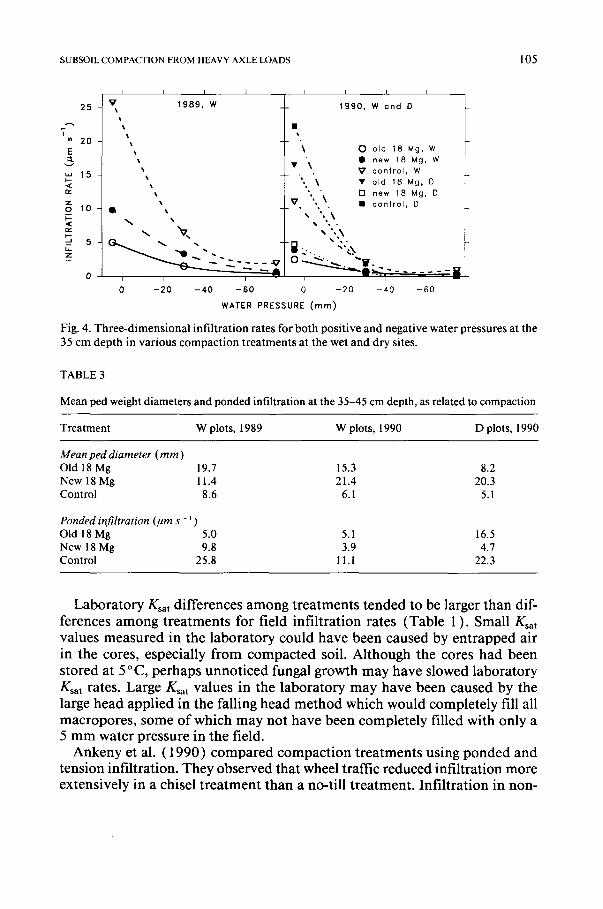
fastest for the control and slowest for the old 18 Mg treatment in the W plots (Fig. 4 ). Ranking of infiltration rates was the inverse of bulk density ranking.
Within the W plots, the 1990 ponded infiltration rate at the 35-45 cm depth of the control ( 1 I. 1 pm s - 1 ) was significantly faster than for the mean of the new and old 18 Mg treatments (4.5 p m s - ~ ). The new and old 18 Mg treat- ments were not significantly different (Table 3 ). Within the D plots the dif- ference between the new 18 Mg treatment (4.7 p m s -1 ) and the mean of the control and the old 18 Mg treatments ( 19 .4 / tm s - 1 ) was significant only at the 10% probability level. The control and 18 Mg treatments were not signif- icantly different. The tension infiltration rates did not differ significantly among treatments within either the D or W plots. This would indicate that most of the infiltration differences between treatments were the result o f dif- ferences in quantity and effectiveness of large pores (Ankeny et al., 1990).
SUBSOIL COMPACTION FROM HEAVY AXLE LOADS 105
25
I 20
E ~L
uJ 15
o~
I.--
5
0
I I I I
V 1 9 8 9 , W
Q •
,
0 - 2 0 - 4 0 - 6 0
I I I
1 9 9 0 , W ond D
i
\ 0 old 18 Mg, W • new 18 Mg, W • \ V contro l , W
"', \ • old 18 Mg, D • , "\ I-I new 18 Mg, D
V • cont ro l , D
" ,'. .X
0 - 2 0 - 4 0 - 6 0
WATER PRESSURE (mm)
Fig. 4. Three-dimensional infiltration rates for both positive and negative water pressures at the 35 cm depth in various compaction treatments at the wet and dry sites.
TABLE3
Mean ped weight diameters and ponded infiltration at the 35-45 cm depth, as related to compaction
Treatment W plots, 1989 W plots, 1990 D plots, 1990
M e a n p e d d i a m e t e r ( m m ) Old 18 Mg 19.7 15.3 8.2 New 18 Mg 11.4 21.4 20.3 Control 8.6 6.1 5.1
P o n d e d inf i l t rat ion ( # m s - ~ ) Old 18 Mg 5.0 5.1 16.5 New 18 Mg 9.8 3.9 4.7 Control 25.8 11.1 22.3
L a b o r a t o r y gsa t differences among treatments tended to be larger than dif- ferences among treatments for field infiltration rates (Table 1 ). Small gsa t values measured in the laboratory could have been caused by entrapped air in the cores, especially from compacted soil. Although the cores had been stored at 5 o C, perhaps unnoticed fungal growth may have slowed laboratory /(sat rates. Large gsa t values in the laboratory may have been caused by the large head applied in the falling head method which would completely fill all macropores, some of which may not have been completely filled with only a 5 mm water pressure in the field.
Ankeny et al. (1990) compared compaction treatments using ponded and tension infiltration. They observed that wheel traffic reduced infiltration more extensively in a chisel treatment than a no-till treatment. Infiltration in non-
106 S.D. LOGSDON ET AL.
wheel track interrows was slightly more rapid for chisel than for no-till. At more negative water potentials, treatment differences were reduced, as ex- pected, because traffic destroyed more of the larger pores than the smaller pores.
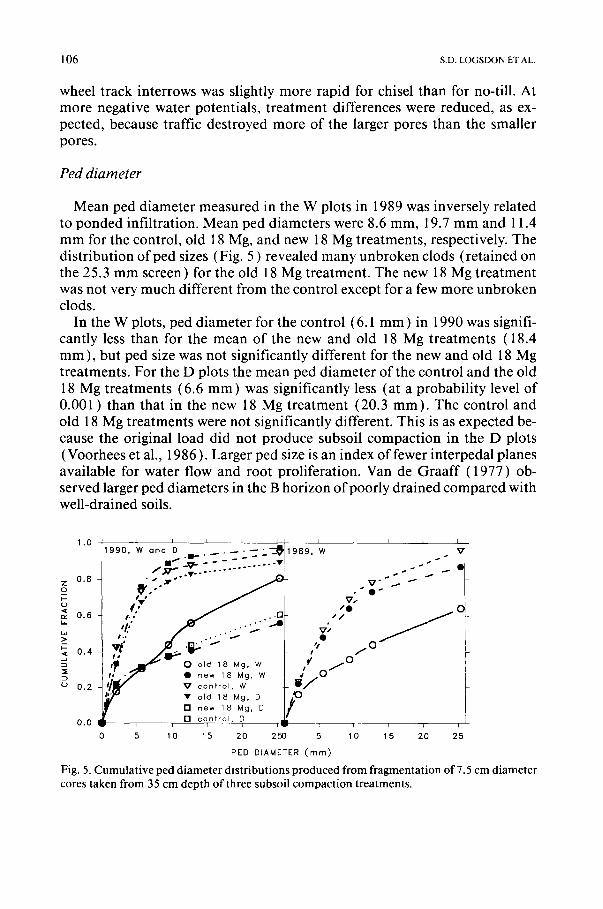
Ped diameter
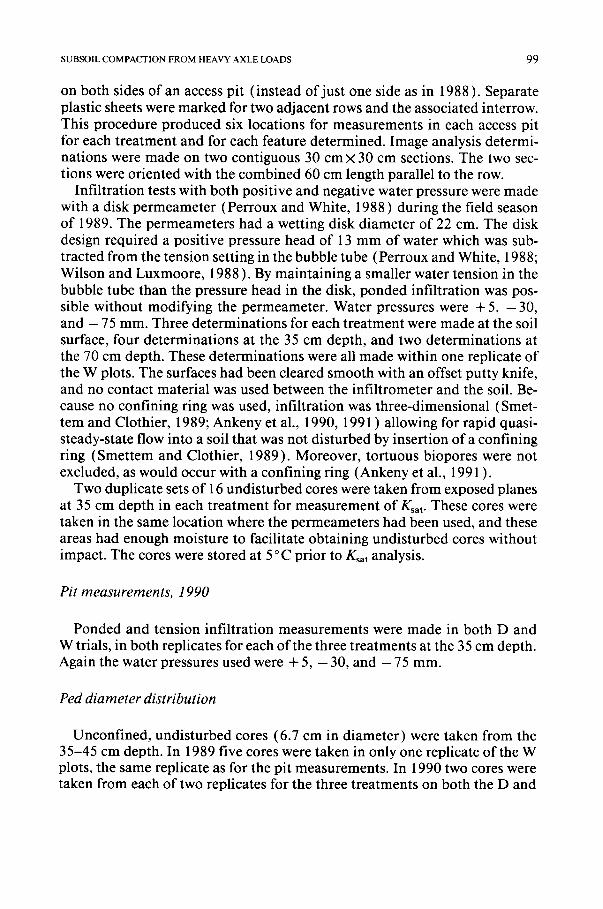
Mean ped diameter measured in the W plots in 1989 was inversely related to ponded infiltration. Mean ped diameters were 8.6 mm, 19.7 mm and 11.4 mm for the control, old 18 Mg, and new 18 Mg treatments, respectively. The distribution ofped sizes (Fig. 5 ) revealed many unbroken clods (retained on the 25.3 mm screen) for the old 18 Mg treatment. The new 18 Mg treatment was not very much different from the control except for a few more unbroken clods.
In the W plots, ped diameter for the control (6.1 mm) in 1990 was signifi- cantly less than for the mean of the new and old 18 Mg treatments (18.4 mm), but ped size was not significantly different for the new and old 18 Mg treatments. For the D plots the mean ped diameter of the control and the old 18 Mg treatments (6.6 mm) was significantly less (at a probability level of 0.001 ) than that in the new 18 Mg treatment (20.3 mm). The control and old 18 Mg treatments were not significantly different. This is as expected be- cause the original load did not produce subsoil compaction in the D plots (Voorhees et al., 1986). Larger ped size is an index of fewer interpedal planes available for water flow and root proliferation. Van de Graaff (1977) ob- served larger ped diameters in the B horizon of poorly drained compared with well-drained soils.
z o
t~ id .
1.0
0 .8
0.6
0 .4
0.2
O.O
L t D t L 990, W and . . . . . - ~ -
f . l ~ '
/-" _.,o ,I." . 7 . . . . . . ~-""~
.~... ~ --"
t , . . ~ f ~ e w 18 Mg, W l ~ I f V cont ro l , W- T • old 18 Mg, D
[ ] new 18 Mg, D , , [] co, ntro~, ? 5 10 15 20 250
I L I I
1989, W V
s
/ 0 0
v~ '~'• /
9
,¢
P E i - i I
5 10 15 20 25
PED DIAMETER (mm)
Fig. 5. Cumulative ped diameter distributions produced from fragmentation of 7.5 cm diameter cores taken from 35 cm depth of three subsoil compaction treatments.
SUBSOIL COMPACTION FROM HEAVY AXLE LOADS 107
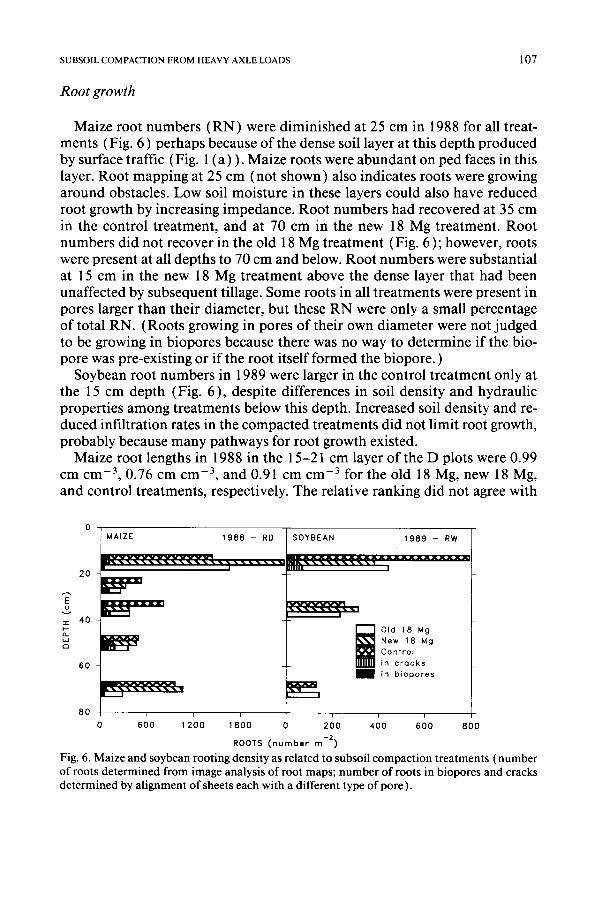
Rootgrowth
Maize root numbers (RN) were diminished at 25 cm in 1988 for all treat- ments (Fig. 6 ) perhaps because of the dense soil layer at this depth produced by surface traffic (Fig. 1 (a) ) . Maize roots were abundant on ped faces in this layer. Root mapping at 25 cm (not shown) also indicates roots were growing around obstacles. Low soil moisture in these layers could also have reduced root growth by increasing impedance. Root numbers had recovered at 35 cm in the control treatment, and at 70 cm in the new 18 Mg treatment. Root numbers did not recover in the old 18 Mg treatment (Fig. 6 ); however, roots were present at all depths to 70 cm and below. Root numbers were substantial at 15 cm in the new 18 Mg treatment above the dense layer that had been unaffected by subsequent tillage. Some roots in all treatments were present in pores larger than their diameter, but these RN were only a small percentage of total RN. (Roots growing in pores of their own diameter were not judged to be growing in biopores because there was no way to determine if the bio- pore was pre-existing or if the root itself formed the biopore. )
Soybean root numbers in 1989 were larger in the control treatment only at the 15 cm depth (Fig. 6), despite differences in soil density and hydraulic properties among treatments below this depth. Increased soil density and re- duced infiltration rates in the compacted treatments did not limit root growth, probably because many pathways for root growth existed.
Maize root lengths in 1988 in the 15-21 cm layer of the D plots were 0.99 c m c m -3 , 0.76 c m c m -3 , and 0.91 c m c m -3 for the old 18 Mg, new 18 Mg, and control treatments, respectively. The relative ranking did not agree with
20
o v x: 4 0
i.,J c3
60
8 0
MAIZE 1 9 8 8 - RD
v v v ~
i [
6 0 0 1 2 0 0
S O Y B E A N
I mnnm
i i 1 8 0 0 2 0 0
ROOTS ( n u m b e r m - 2 )
1 9 8 9 - RW
I I Old 18 Mg New 18 Mg
E Control in c r o c k s
n in b i o p o r e s
i i
4 0 0 6 0 0 8 0 0
Fig. 6. Maize and soybean rooting density as related to subsoil compaction treatments (number of roots determined from image analysis of root maps; number of roots in biopores and cracks determined by alignment of sheets each with a different type of pore).
108 S.D. LOGSDON ET AL.
root number data at 15 cm because of the dense layer from 15 to 25 cm. Root numbers (Fig. 6 ) measured at 15 cm were above the dense layer causing some root proliferation, especially in the 18 Mg treatment; however, root lengths were measured within the dense layer. Coefficients of variation of the 16 root samples were 42%, 84%, and 64% for the old 18 Mg, new 18 Mg, and control treatments, respectively. Maize root lengths in the 35-41 cm layer of the D plots were 0.39 cm cm -3, 0.22 cm cm -3, and 0.52 cm cm -3 for the old 18 Mg, new 18 Mg, and control treatments, respectively. The control treatment appeared to have more roots, as also suggested by root numbers at 35 cm.
DISCUSSION A N D C O N C L U S I O N S
Subsoil density increase and reduced infiltration owing to heavy axle load on the surface persisted in spite of freeze/thaw and wett ing/drying cycles. The increased dry bulk density measured immediately after compaction per- sisted for 7 years in the 35-60 cm zone. Not only was dry bulk density in- creased, but also there were 30-50% reductions in soil hydraulic conductivi- ties near saturation. There was also a major increase in dry cohesive strength as observed by increase of mean ped diameter when large clods were sub- jected to a vibrational energy. Although the hydraulic conductivities were re- duced, they apparently have not prevented soil drainage enough to induce poor soil aeration and other drainage problems. Biopores, cracks, and other interpedal planes still provided pathways for root growth even though dry bulk density was increased, and cohesion between morphological peds may have been increased.
Crop yield in the original study until 1986 were not significantly influenced by the deep soil compaction (Voorhees et al., 1989; Johnson et al., 1990) although there were some small and inconsistent crop yield increase/de- creases. In this study, maize yields in 1988 and 1990 were not significantly affected by the two 18 Mg treatments. Maize yields in 1988 for D plots were 3.99 Mg ha - ~, 4.21 Mg ha - ~, and 4.00 Mg ha - ~, respectively for the control, new 18 Mg, and old 18 Mg treatments, and for W plots were 8.39 Mg ha -~, 8.56 Mg ha -~, and 8.44 Mg ha -~. Maize yields for 1990 were 7.89 Mg ha -~, 7.86 Mg ha -1, and 7.89 Mg ha -1 for D plots, and 8.39 Mg ha -1, 8.56 Mg ha - 1, and 8.44 Mg ha - ~ for D plots, respectively. The apparent greater influ- ence of drought in 1988 on maize yields of the D site relative to the W site, agrees with the drier profile of the D site and its lower susceptibility to deep axle compaction.
Persistence of increased density and reduced infiltration as produced by heavy axle load (more than 15 Mg per axle) characteristic of farm use, agrees with that observed (Blake et al., 1976 ) in the same soil and climate type when produced by wheel traffic in the furrow during moldboard plowing. In both
SUBSOIL COMPACTION FROM HEAVY AXLE LOADS 109
cases, compact ion was applied uniformly overall by adjacent /over lap wheel tracks. Blake et al. (1976) also used late fall irrigation unsuccessfully to ac- celerate amelioration. In contrast, laboratory measurements (Akram and Kemper, 1979 ) and comparat ive laboratory and field measurements (Gault- ney et al., 1982 ) both suggest that a wetter subsoil should accelerate amelio- ration owing to freeze/thaw. It is suggested that unimpaired infiltration in strips between the deeply compacted strips, and subsequent lateral move- ment may provide a sufficiently high water content underneath the com- pacted strip to accelerate ameliorat ion during freeze/thaw.
In conclusion, a uniformly compacted Ves clay loam remained dense with reduced infiltration rate through the subsoil. Natural processes could not be counted on to alleviate the uni form compaction, but may be adequate to al- leviate strip compaction. This mechanism may have l imited inference to the arable field condition, and should be studied as it relates to deep soil compac- t ion in soils other than those similar to the Ves clay loam.
Plant response to the dense soil was minimal in this study. When subsoil compaction does reduce yield, mechanisms for response should be more thor- oughly examined so we can predict when compaction will adversely influence plants. Compact ion responses could result from factors other than imped- ance, such as low soil temperatures and increased denitrification owing to poor drainage.
REFERENCES
Akram, M. and Kemper, W.D., 1979. Infiltration of soils as affected by the pressure and water content at the time of compaction. Soil Sci. Soc. Am. J., 43: 1080-1086.
Allmaras, R.R., Pikul, Jr., J.L., Kraft, J.M. and Wilkins, D.E., 1988. A method for measuring incorporated crop residue and associated soil properties. Soil Sci. Soc. Am. J., 52:1128- 1133.
Ankeny, M.D., Kaspar, T.C. and Horton, R, 1990. Characterization of tillage and traffic effects on unconfined infiltration measurements. Soil Sci. Soc. Am. J., 54: 837-840.
Ankeny, M.D., Ahmed, M., Kaspar, T.C. and Horton, R., 1991. A simple field method for de- termining unsaturated hydraulic conductivity. Soil Sci. Soc. Am. J., 55: 467-470.
Blackwell, P.S., Graham, J.P., Armstrong, J.V., Ward, M.A., Howse, K.R., Dawson, C.J. and Butler, A.R., 1986. Compaction of a silt loam soil by wheeled agricultural vehicles. I. Effects upon soil conditions. Soil Tillage Res., 7:97-116.
Blake, G.R., Nelson, W.W. and Allmaras, R.R., 1976. Persistence of subsoil compaction in a Mollisoi. Soil Sci. Soc. Am. J., 40: 943-948.
Gameda, S., Raghavan, G.S.V., McKyes, E. and Theriault, R., 1987. Subsoil compaction in a clay soil. II. Natural alleviation. Soil Tillage Res., 10:123-130.
Gaultney, L., Krutz, G.W., Steinhardt, G.C. and Liljedahl, J.B., 1982. Effects of subsoil com- paction on corn yields. Trans. Am. Soc. Agric. Eng., 25: 563-569.
Graham, J.P., Blackwell, P.S., Armstrong, J.V., Christian, D.G., Howse, K.R., Dawson, C.J. and Butler, A.R., 1986. Compaction of a silt loam by wheeled agricultural vehicles. II. Effects on growth and yield of direct-drilled winter wheat. Soil Tillage Res., 7:189-203.
Hakansson, I., Voorhees, W.B., Elonen, P., Raghavan, G.S.V., Lowery, B., van Wijk, A.L.M.,
110 S.D. LOGSDON ET AL.
Rasmussen, K. and Riley, H., 1987. Effect of high axle-load traffic on subsoil compaction and crop yield in humid regions with annual freezing. Soil Tillage Res., 10: 259-268.
Johnson, J.F., Voorhees, W.B., Nelson, W.W. and Randall, G.W., 1990. Soybean growth and yield as affected by surface and subsoil compaction. Agron. J., 82: 973-979.
Klute, A. and Dirksen, C., 1986. Hydraulic conductivity and diffusivity: Laboratory methods. In: A. Klute (Editor), Methods of Soil Analysis. Part 1.2nd edn. Agron. Mongr. 9, ASA and SSSA, Madison, WI, pp. 687-734.
Logsdon, S.D. and Allmaras, R.R., 1991. Maize and soybean root clustering as indicated by root mapping. Plant Soil, 131: 169-176.
Logsdon, S.D., Allmaras, R.R., Wu, L., Swan, J.B. and Randall, G.W., 1990. Macroporosity and its relation to saturated hydraulic conductivity under different tillage practices. Soil Sci. Soc. Am. J., 54:1096-1102.
McKeague, J.A., Wang, C. and Topp, G.C., 1982. Estimating saturated hydraulic conductivity from soil morphology. Soil Sci. Soc. Am. J., 46: 1239-1244.
Perroux, K.M. and White, I., 1988. Designs for disc permeameters. Soil Sci. Soc. Am. J., 52: 1205-1215.
Smettem, K.R.J. and Clothier, B.E., 1989. Measuring unsaturated sorptivity and hyraulic con- ductivity using multiple disc permeameters. J. Soil Sci., 40: 563-568.
Tennant, D., 1975. A test of a modified line intersection method of estimating root length. J. Ecol., 63: 995-1001.
Van de Graaff, R.H.M., 1978. Size of subsoil blocky peds in relation to textural parameters, depth, and drainage. In: W.W. Emerson, R.D. Bond and A.R. Dexter (Editors), Modifica- tion of Soil Structure. Wiley, New York, pp. 87-96.
Voorhees, W.B., 1983. Relative effectiveness of tillage and natural forces in alleviating wheel- induced soil compaction. Soil Sci. Soc. Am. J., 47: 129-133.
Voorhees, W.B., Nelson, W.W. and Randall, G.W., 1986. Extent and persistence of subsoil com- paction caused by heavy axle loads. Soil Sci. Soc. Am. J., 50: 428-433.
Voorhees, W.B., Johnson, J.T., Randall, G.W. and Nelson, W.W., 1989. Corn growth and yield as affected by surface compaction. Agron. J., 81 : 294-303.
Wang, C., McKeague, J.A. and Switzer-Howse, K.D., 1985. Saturated hydraulic conductivity as an indicator of structural degradation in clayey soils of Ottawa area, Canada. Soil Tillage Res., 5: 19-31.
Watson, K.W. and Luxmoore, R.J., 1986. Estimating macroporosity in a forest watershed by use of a tension infiltrometer. Soil Sci. Soc. Am. J., 50: 578-582.
Wilson, G.V. and Luxmoore, R.J., 1988. Infiltration, macroporosity, and mesoporosity distri- butions on two forested watersheds. Soil Sci. Soc. Am. J., 52: 329-335.