permeability and relative permeability of ...9th international conference on fracture mechanics of...
TRANSCRIPT

9th International Conference on Fracture Mechanics of Concrete and Concrete Structures
FraMCoS-9 V. Saouma, J. Bolander and E. Landis (Eds)
1
PERMEABILITY AND RELATIVE PERMEABILITY OF MORTAR
UNDERGOING DAMAGE : A HIERARCHICAL CAPILLARY BUNDLE APPROACH
GILLES PIJAUDIER-CABOT*, LIONEL ECAY, DAVID GREGOIRE,
AND FADI KHADDOUR
*Université Pau & Pays Adour
LFCR, UMR 5150 Anglet, France
*corresponding author
e-mail: [email protected]
Key words: Damage, Pore size distribution, Permeability, Relative permeability Abstract: The purpose of this work is to achieve a better understanding of the relationship between mechanical damage, pore size distribution and transport properties of cementitious materials. In the literature, analyses are usually restricted to intrinsic permeability of the material and the evolution of the apparent permeability with respect to the pressure gradient and to the nature of the fluid considered are left aside. A new model capable to provide the apparent permeability of a porous material to gas, directly from the pore size distribution and from the properties of the gas is discussed. Comparisons with experimental data on mortar specimens show that the model can reproduce the intrinsic permeability and its evolution when the material is subjected to mechanical damage, provided the pore size distributions are available. Extension to the transport of different phases (e.g. water and water vapor) is discussed, with a view towards the simulation of nuclear accident in containment vessels. It is shown that small pores that are not affected by damage according to the pore size distribution are of great importance in the evaluation of the relative permeability to liquid and vapor as a function of the saturation. A tentative model is discussed and compared with the existing – standard – approach relying on Van Genuchten relationships.
1 INTRODUCTION The present study aims at a better
understanding of the relationship between damage, pore size distribution, and transport properties of cementitious materials. This problem is typically of importance in the long-term assessment of tightness of nuclear vessels and containment facilities, especially when severe accidents occur.
Many authors have looked for predictive models for permeability based on the pore size distribution of the material. Kozeny [1] related the permeability to the porosity, to the tortuosity and to an average pore size. Later
on, Katz & Thompson [2] predicted the permeability from the electrical conductivity of the porous material through a critical pores radius. There are also several studies in which the pore size distribution was modeled, e.g. with a bimodal [3] or multimodal distribution [4], and then entered into some capillary bundle model. Recently, models for the calculation of the intrinsic permeability derived directly from the experimental PSD, without any idealization have been also discussed [5]. Here, we shall follow this approach, which requires (i) to transform the pore size distribution into a hydraulic network,
DOI 10.21012/FC9.242
GillesPijaudier-Cabot,LionelEcay,DavidGrépoire,andFadiKhaddour
2
and (ii) to solve the equations governing fluid flow.
As far as the porous network in the material is concerned, we shall use a description that is consistent with the Pore Size Distribution (PSD) characterization technique used for this study, mercury intrusion. The pore network is not defined in the material space, e.g. with a distribution of pores connected to each other following a topological distribution characterized e.g. by micro tomography, but rather following a hierarchical approach. The technique yields a pore network, which mimics the porous space measured experimentally.
The intrinsic permeability and the evolution of the apparent permeability with mean pressure are provided by comparing Darcy’s law [6], which represents the flow in the porous media at the macro scale and a combination of Poiseuille [7] and Knudsen laws [8], which represent respectively viscous flow and diffusion at the micro scale.
Comparisons with experimental data on mortar specimens show that the model can reproduce the intrinsic permeability and its evolution when the material is subjected to mechanical damage, provided the pore size distributions are available at each level of damage. For a given pore size distribution, the evolution of the apparent permeability is also obtained, for several gases, and compares quite well with experiments.
In the last section of this paper, the capillary bundle model is extended to the unsaturated case. Relative permeability to liquid water and vapor can be extracted. The model can provide results that are similar to the classical Van Genuchten’s equations.
2 HIERARCHICAL CAPILLARY MODEL
Assuming that the porous space has been characterized by mercury intrusion technique, we consider that the microstructure of the porous material consists in cylindrical pores of different lengths and diameters. For each pore size, the pore length to the pore volume fraction may easily be deduced.
A simple assembling technique consists in distributing all the pores of a given size (or interval of size) in parallel and in a regular manner, assuming that all pores have an identical length corresponding to the cubic root of the total porous volume times the tortuosity. Predictions of permeability based on such parallel assembly of pores have been discussed in [5], and it was observed that tuning parameters were required in order to obtain relevant results in term of apparent and intrinsic permeability. Here, a different approach is followed:
The PSD is discretized into a finite set of pore diameters, 𝑖 = 1,2,…𝑛. Let Vt be the total porous volume, characterized by mercury intrusion, which may be organized according to the PSD into a series of volumes 𝑉!" of mean diameter 𝑑!. For each pore size, the total pore length 𝐿! is a function of the pore diameter 𝑑! and of the pore volume fraction 𝑉!" assuming that pores are cylindrical:
𝐿! =4.𝑉!"𝜋.𝑑!
! (1)
This pore length is then cut into small segments of random length ∆Li (see Figure 1.a). Their assembling is performed hierarchically, from larger pores to smaller pores. Each pore segment either creates a new assembling site (on which subsequent segment will be connected) or is connected, on an existing assembling site, to a pore segment of same or larger diameter (Figure 1.b). We then define the average pore length 𝐿! and a critical length 𝐿! as
𝐿! = 𝑉!! , 𝐿! = 𝑇. 𝐿! T = tortuosity (2)
As soon as the sum of all pore segment lengths reaches this critical length on one assembling site, further segments cannot be added anymore and the permeability of the resulting capillary is computed and added to the global permeability.

GillesPijaudier-Cabot,LionelEcay,DavidGrépoire,andFadiKhaddour
3
(a) (b)
Figure 1. Random network assembly of pores: (a)
Discretization of pores; (b) Random assembling This random process is performed until the
overall permeability does not change by adding a new assembled capillary (with some specified tolerance). This criterion is used to speed up the process: there is a huge amount of pore segments of very small diameter but they do not contribute so much to the global permeability, which is mostly driven by larger pores. As soon as this criterion is reached, the remaining porosity is organized according to a parallel capillary bundle, each capillary being of the same diameter. Their contribution is also taken into account in the global permeability, but as we will see in the last section of this paper, this latter step will be modified when considering an unsaturated porous space.
Some adjustments need to be discussed with respect to the mercury intrusion technique from which the PSD is obtained. During mercury intrusion, two different phases are performed. Firstly, mercury is introduced at low pressure (from 0 MPa to 0.2 MPa) and large diameter pores are characterized. Secondly, mercury is introduced at high pressure (from 0.2 MPa to 200 MPa) in order to drive mercury into smaller pores. Unfortunately, the data obtained at low pressure are quite noisy and the distribution of sizes for very large pores is not characterized accurately. Since large pores drive the permeability, this may be very problematic in order to predict the permeability accurately. Usually, the solution to circumvent this artifact consists in removing the low-pressure information. Here we adopt another, less arbitrary technique, motivated by the fact that
upon damage, pores (or cracks) of large aperture might contribute significantly to the permeability.
Figure 2 (top) presents a typical PSD response of a cementitious material (mortar). We observe both the low-pressure signal and the high-pressure one (in the range of 100 micrometers).
Figure 2. Method of eliminating of the noise at low
pressure for an undamaged sample. Top: pore size distribution corresponding to the low and high pressures; Bottom: statistical study of the low frequency for 100 random realizations.
In order to keep the relevant low-pressure information and at the same time to remove the artifacts, we implement a specific filtering of the low-pressure information: let us consider the pores of size corresponding to the low-pressure measurements only. These pores are discretized randomly into segments of equal size. We now count the number of segments corresponding to these pore sizes. Figure 2 (bottom) shows this number for several random realizations. We observe that the number of segments lies below 10000 for the material that is typically considered in this

GillesPijaudier-Cabot,LionelEcay,DavidGrépoire,andFadiKhaddour
4
study. Instead of removing these pores, we assume that each segment below this threshold is forced to create a new assembling site. Consequently pores of such sizes cannot percolate throughout the material, unless the total number of segments is over the threshold.
In the hierarchical assembly forming the porous network, the random function that decides if the current pore segment should be connected to an existing site or will create a new site is weighted by the following exponential function:
𝑓(𝑥) = exp (−𝑥 − 𝐵𝐴 ) (3)
where x is the number of the current pore segment dealt with, 𝐴 and 𝐵 are parameters.
Parameter 𝐵 controls the pore diameter from which new pore segments may be connected to existing assembling sites. Parameter A controls the pore diameter from which new pore increments have almost no chance to create a new assembling site.
3 FLUID FLOW IN THE PORE NETWORK
From a given hierarchical assembling of capillary pores, the objective is now to estimate not only the intrinsic but also the apparent permeability. The apparent permeability is obtained by comparing Darcy’s law, which represents the flow at the macro-scale, and Poiseuille and Knudsen laws, which represent the flow at the micro-scale.
3.1 Microscale Let us consider a cylindrical pore of
diameter 𝑑!. The flow (i.e. volume of fluid per unit time) passing through the pore of length 𝐿! is given by:
𝑄!! =12
𝜋128
𝑑!!
𝜇𝑃!! − 𝑃!!
𝐿! 𝑃! (4)
where (𝑃!,𝑃!) are the upstream and downstream pressures respectively, 𝑄!! is flow rate at the outlet pressure and 𝜇 is the fluid dynamic viscosity. This classical expression
(Poiseuille flow) relies on the assumption of laminar flow [7].
In the Knudsen region, the mass transfer behaves differently [8] and the laminar flow assumption is no longer valid. This region is defined for each pore diameter from the Knudsen number 𝑁!!":
𝑁!!" > 1
𝑁!!" =𝜆𝑑!=
1𝑑!
𝑅 𝑇 𝜋 2 𝑑!! 𝑁!! 𝑃!
(5)
where (𝜆, 𝑑!, 𝑃!) are the average free path, the molecule diameter and the average pressure of the considered gas respectively, and (𝑁!") is Avogadro’s number. When the Knudsen number is greater than one, the interaction between the walls of the pore and the gas, at the molecular level, are dominant and the fluid flow is quite different from Poiseuille’s flow. The volume of fluid per unit time passing in the pore is, according to Knudsen diffusion [8]:
𝑄!"! =𝜋12
𝑑!!
𝐿!(8 𝑅 𝑇𝜋 𝑀 )
∆𝑃 𝑃!
(6)
where ∆𝑃 = 𝑃! − 𝑃! is the difference between the upstream and downstream pressures.
In the transition regime defined as (0.01 < 𝑁!!" < 1) the flow rate through a pore (𝑖) due to a pressure gradient is given as the sum of Poiseuille flow (Eq. 4) and Knudsen diffusion (Eq. 6). For typical gases, the contributions of laminar flow and of Knudsen diffusion are of the same order for pores of diameter in the range of a few hundred of nanometers [9]. This characteristic diameter falls in the middle of the pore size distribution on Fig. 2, which demonstrate that Poiseuille flow and Knudsen diffusion ought to be considered simultaneously for a proper description of mass transfer.
When looking at Eqs. (4,6), it can be noticed that the dependence of the flow rate on the pressure is not the same. Poiseuille flow for compressible gas depends on the difference of the pressure to the square, whereas Knudsen diffusion depends on the difference of

GillesPijaudier-Cabot,LionelEcay,DavidGrépoire,andFadiKhaddour
5
pressure. Consequently, the total flow rate described at the macroscale according to a Darcy-type law exhibits a dependence to the inverse of the pressure that is similar to what has been proposed by Klinkenberg [10].
3.2 Macroscale
At the macro-scale, the flow rate is described by Darcy’s law [6]:
𝑄!! =𝐾!𝜇 𝑆
∆𝑃 𝑃!𝐿! 𝑃! (7)
For hierarchical assembly of capillaries, the
transport properties are obtained by adding the contribution of each capillary pore. Comparison between Eq. (7) and the equations at the micro-scale provides the expression of the apparent permeability 𝐾!.
4 APPARENT PERMEABILITY : COMPARISON WITH EXPERIMENTAL DATA
Experiments have been performed on mortars specimens with water/cement ratio of 0.7 and a maximum aggregate diameter of 3mm. Mortar hollow cylinders were cast in aluminum molds (outer diameter: 24.5mm; inner diameter: 6.5mm; height: 40 mm). Top and bottom surfaces were rectified and the samples were cured in a ventilated oven at 80°C at constant humidity during 48 hours.
The testing apparatus consists in a conventional electro-mechanical compressive machine coupled with a nitrogen permeameter in order to measure in-situ the permeability under load [5]. The initial permeability is measured before applying a given compressive load corresponding to a given level of damage (measured by the variation of the Young’s modulus of the material upon unloading [9,11]). Permeability is measured under load and after load. Several load levels are considered, corresponding to several levels of damage ranging from 0% to 12% (in the pre-peak regime).
The apparent permeability has been measured by applying a pressure gradient and measuring the radial gas flow through the sample (see e.g.[11]):
𝐾! = 𝑄! 𝜇 𝑃! ln (𝑅!𝑅!
)
𝜋 ℎ (𝑃!! − 𝑃!!) (8)
where 𝑄! is the gas volumetric flow rate, (ℎ,𝑅!,𝑅!) are the sample height, outer and inner diameters respectively and (𝑃! ,𝑃!) are the gas upstream and downstream pressure respectively. Typically 𝑃! is the atmospheric pressure. In order to derive the intrinsic permeability from experimental data, the approach of Klinkenberg [10] is applied:
𝐾! = 𝐾!" (1+𝛽𝑃!)
(9)
where 𝛽 is the Klinkenberg coefficient, 𝐾!" is the intrinsic permeability and 𝑃! is the mean pressure.
After complete unloading, the middle part of the sample (15mm over 40mm) is cut out in order to characterize the PSD. Figure 3 shows the evolution of pore size distribution of different samples subjected to different mechanical damage (from 0 to 12%). Initially, a peak at 150nm is observed with no porosity higher than 1000nm. As damage increases, a slight shift upward of the PSD is observed between 1000nm and 3000nm. Moreover new porosity is created around 10000nm. This new porosity leads to the increase of the intrinsic permeability of two orders of magnitude.
Figure 3. Evolution of pore size distribution upon
damage
GillesPijaudier-Cabot,LionelEcay,DavidGrépoire,andFadiKhaddour
6
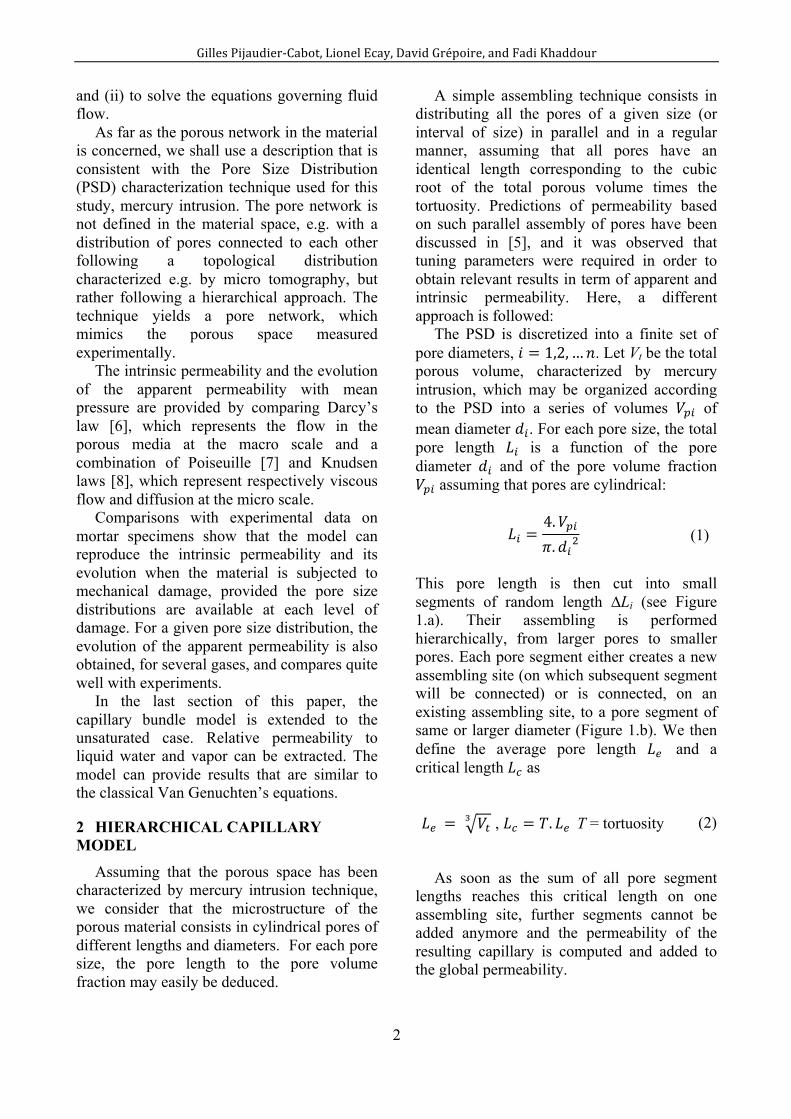
Figure 4 present a comparison between the measured and predicted results. The predicted values are in good agreement with the experimental ones whatever the state of damage. Note that no tortuosity parameter has been introduced in the model (tortuosity equals 1).
Figure 4. Comparison between the measured and
predicted intrinsic permeability (top) and Klinkenberg coefficient (bottom)
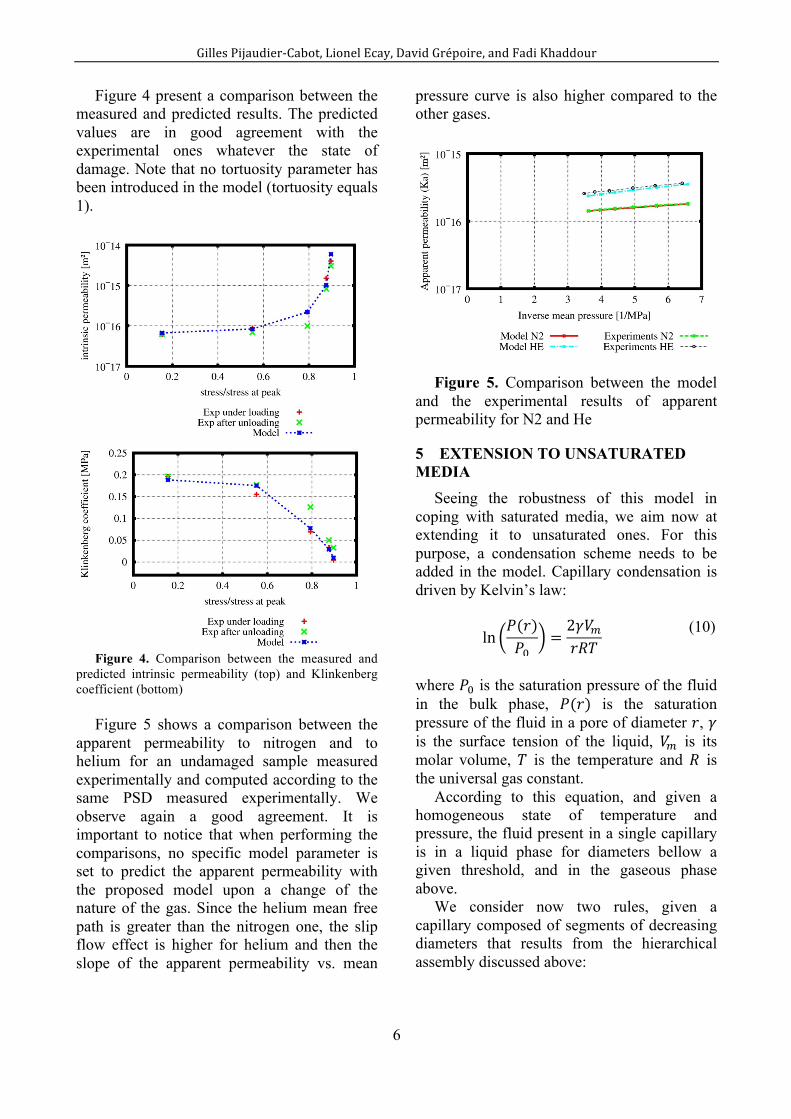
Figure 5 shows a comparison between the
apparent permeability to nitrogen and to helium for an undamaged sample measured experimentally and computed according to the same PSD measured experimentally. We observe again a good agreement. It is important to notice that when performing the comparisons, no specific model parameter is set to predict the apparent permeability with the proposed model upon a change of the nature of the gas. Since the helium mean free path is greater than the nitrogen one, the slip flow effect is higher for helium and then the slope of the apparent permeability vs. mean
pressure curve is also higher compared to the other gases.
Figure 5. Comparison between the model and the experimental results of apparent permeability for N2 and He
5 EXTENSION TO UNSATURATED MEDIA
Seeing the robustness of this model in coping with saturated media, we aim now at extending it to unsaturated ones. For this purpose, a condensation scheme needs to be added in the model. Capillary condensation is driven by Kelvin’s law:
ln𝑃(𝑟)𝑃!
=2𝛾𝑉!𝑟𝑅𝑇
(10)
where 𝑃! is the saturation pressure of the fluid in the bulk phase, 𝑃(𝑟) is the saturation pressure of the fluid in a pore of diameter 𝑟, 𝛾 is the surface tension of the liquid, 𝑉! is its molar volume, 𝑇 is the temperature and 𝑅 is the universal gas constant.
According to this equation, and given a homogeneous state of temperature and pressure, the fluid present in a single capillary is in a liquid phase for diameters bellow a given threshold, and in the gaseous phase above.
We consider now two rules, given a capillary composed of segments of decreasing diameters that results from the hierarchical assembly discussed above:

GillesPijaudier-Cabot,LionelEcay,DavidGrépoire,andFadiKhaddour
7
- If the conditions are such that condensation occurs in the part of the capillary with the smallest diameter, this capillary will not participate to the gas flow.
- If the conditions are such that condensation occurs in the part of the capillary with the largest diameter, then the capillary will participate to the liquid flow.
Hence, given the temperature and pressure conditions, and given a hierarchical assembling, three types of capillary can be distinguished: those in which condensation does not occur which participate to the transport of the gaseous phase, those in which condensation occurs at the entry which participate to the transport of the fluid phase, and those in which condensation occurs in the smallest diameters only, which do not participate to any transfer at all. Accordingly, the flow rates of liquid and gas can be computed from the model according to Eqs. (4,6). For the liquid phase, Poiseuille flow is to be considered only.
As a first step, we implemented these simple rules in a hierarchical assembling corresponding to the PSD depicted in Figure 6.
Figure 6. PSD used for the calculation of the
relative permeability to liquid water and vapor In addition to the relative permeability
computed according to the hierarchical model, we have also considered the phenomenological model due to Van - Genuchten - Mualem (VGM) [12,13]. The relative permeabilities read:
𝑘!" = 𝑆!! 1− 1− 𝑆!
! !! !
(11)
𝑘!" = 1− 𝑆!!1− 𝑆!
! !!!
(12)
where 𝑘!" and 𝑘!" are the relative
permeabilities to gas and liquid respectively, and 𝑆! is the saturation.
Figure 7 shows a comparison between this first approach and the VGM model with classical coefficients (q=4,5 and m=0,5) corresponding to a cementitious material. (On both graphs, solid lines are for the VGM model, and dashed ones for the hierarchical model. Furthermore, red curves are for gas and blue ones correspond to the liquid phase.)
Figure 7. Relative permeability to vapor and liquid
water computed according to the hierarchical and VGM model.
It is clear from this result that the direct
implementation of the hierarchical approach to the unsaturated state does not agree with standard results observed in the literature. Looking at the evolution of the relative permeability to gas as a function of the saturation according to the hierarchical model, several observations can be made:
First, the relative permeability to vapor does not decrease as fast as it should when the saturation increases. Second, the point at which the two relative permeabilities are equal is shifted towards the high saturation levels and high permeability.
GillesPijaudier-Cabot,LionelEcay,DavidGrépoire,andFadiKhaddour
8
This mismatch can be explained by looking at the way the hierarchical model is organized for capillaries of small diameters. For small diameters, the model is strictly equivalent to a bundle of capillaries with constant diameter. This is not important as far as the intrinsic permeability or the apparent permeability to a single gas phase are concerned because the contribution of each capillary is negligible. When the saturation grows, water condensates in these capillaries very quickly. They do not contribute to the relative permeability to gas, but since their contribution is negligible, the effect is not substantial overall. This is the reason why the relative permeability to gas is severely overestimated.
The fact that the point where the two relative permeabilities are equal is shifted upwards, towards the high saturation levels follows from the same reasoning. The corresponding relative permeabilities are quite high. For these relative permeabilities to be very small, it would require that the pore network be clogged, which means that all the capillaries should end with a pore diameter which is small enough so that the fluid condensates. This cannot be the case according to the hierarchical model as it has been designed. In fact, the model has been designed with descending diameters, understanding that pores of very small diameters do not contribute to the gas permeability compared to large ones. If the hierarchical model is to be extended to the unsaturated case, it should be complemented by an ascending approach, focusing on the small pores whose clogging effect on the entire network is of great importance.
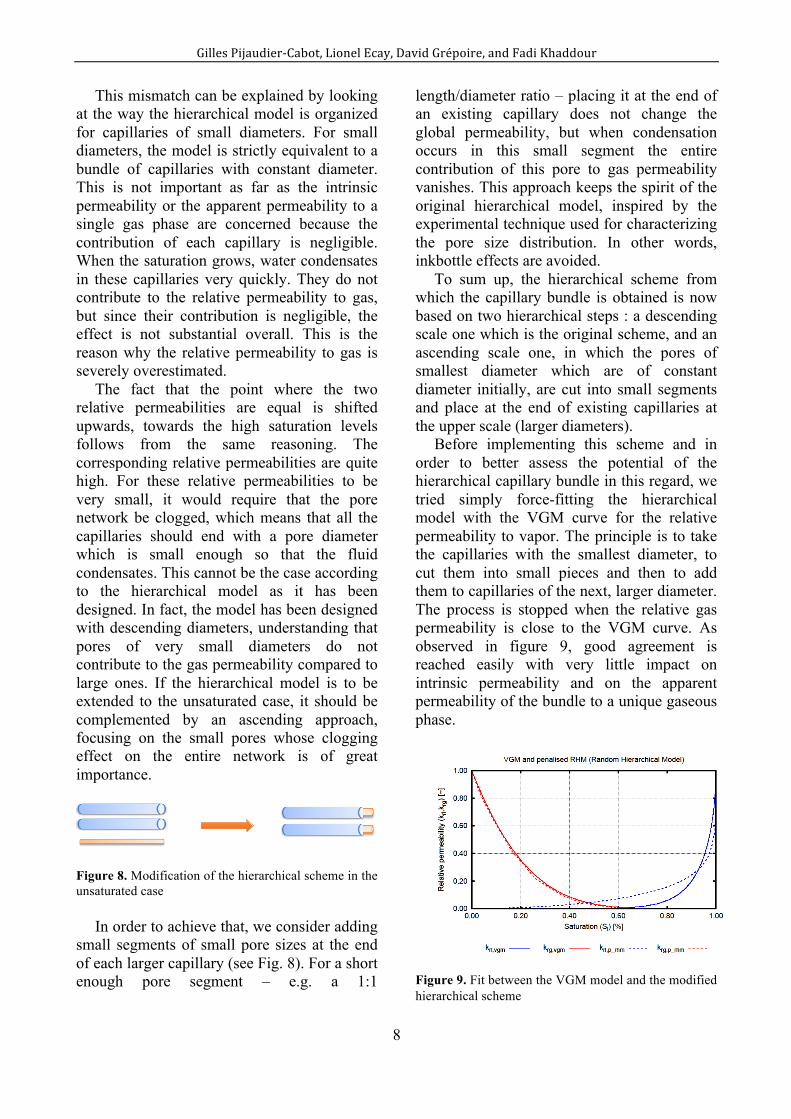
Figure 8. Modification of the hierarchical scheme in the unsaturated case
In order to achieve that, we consider adding small segments of small pore sizes at the end of each larger capillary (see Fig. 8). For a short enough pore segment – e.g. a 1:1
length/diameter ratio – placing it at the end of an existing capillary does not change the global permeability, but when condensation occurs in this small segment the entire contribution of this pore to gas permeability vanishes. This approach keeps the spirit of the original hierarchical model, inspired by the experimental technique used for characterizing the pore size distribution. In other words, inkbottle effects are avoided.
To sum up, the hierarchical scheme from which the capillary bundle is obtained is now based on two hierarchical steps : a descending scale one which is the original scheme, and an ascending scale one, in which the pores of smallest diameter which are of constant diameter initially, are cut into small segments and place at the end of existing capillaries at the upper scale (larger diameters).
Before implementing this scheme and in order to better assess the potential of the hierarchical capillary bundle in this regard, we tried simply force-fitting the hierarchical model with the VGM curve for the relative permeability to vapor. The principle is to take the capillaries with the smallest diameter, to cut them into small pieces and then to add them to capillaries of the next, larger diameter. The process is stopped when the relative gas permeability is close to the VGM curve. As observed in figure 9, good agreement is reached easily with very little impact on intrinsic permeability and on the apparent permeability of the bundle to a unique gaseous phase.
Figure 9. Fit between the VGM model and the modified hierarchical scheme

GillesPijaudier-Cabot,LionelEcay,DavidGrépoire,andFadiKhaddour
9
Of course, the above results illustrate the
potentiality of the model, it cannot help at defining the way pore segments are redistributed in the initial hierarchical model after the descending scale phase. Several ways can be used in order to organize the ascending scheme. The simplest one would be to separate the pores of a single diameter into two fractions: the one that cannot percolate into a homogeneous material and its counterpart. The part that cannot percolate is, by definition connected to pores of largest diameter because it is accessible to mercury intrusion. It can be distributed to capillary ends with the immediate larger diameter and up if needed.
5 CONCLUSIONS
A theoretical model aimed at computing the apparent permeability of a porous material to gas has been presented. The model uses the pore size distribution of the material as an input. The porous network is generated according to a hierarchical scheme in which bundles of capillaries are assembled randomly. Within each capillary pore, fluid flow is described by a combination of Poiseuille Flow and Knudsen (diffusion) flow. The outcome at the macroscopic scale results into an apparent permeability of the Klinkerberg-type.
The model has been compared with experiments on mortar subjected to compression. The theoretical model captures experimental trends very consistently. In addition, the same model is also capable of predicting the permeability of the material to a different gas, without any adjustment of the parameters.
An extension to phase change within a single fluid and unsaturated media has been discussed. The initial – descending scale – scheme ought to be complemented with an ascending scale one since small pores drives the evolution of the relative permeability to gas upon increasing saturation. Work, in which such an ascending scheme is implemented, is in progress.
ACKNOWLEDGEMENTS Financial supports from the Région Aquitaine through the grant CEPAGE (20121105002) and ANR project MACENA are gratefully acknowledged. F. Khaddour is grateful to the Syrian Ministry of Higher Education for its support (13153/4/W).
REFERENCES
[1] Kozeny, J. 1927. Über Kapillare Leitung Des Wassers Im Boden [About capillary pipe of water in soil]. Wien, Akad. Wiss, 136: 271–306.
[2] Katz, A. J. and A. H. Thompson. 1986. Quantitative prediction of permeability in porous rock. Physical review B, 34: 8179–8181.
[3] Aït-Mokhtar, A., O. Amiri, P. Dumargue and S. Sammartino. 2002. A new model to calculate water permeability of cement materials from MIP results. Magazine of Concrete Research, 14: 43–49.
[4] Amiri, O., A. Aït-Mokhtar and M. Sarhani. 2005. Tri-dimensional modelling of cementitious materials permeability from polymodal pore size distribution obtained by mercury intrusion porosimetry tests. Magazine of Concrete Research, 17: 39–45.
[5] Khaddour, F., D. Grégoire and G. Pijaudier-cabot. 2012. Upscaling Permeation Properties in Porous Materials from Pore Size Distributions. In Geomechanical Issues in CO2 Storage Facilities, eds G. Pijaudier-Cabot and J.-M. Pereira, 44–56.
[6] Darcy, H. 1856. Les fontaines publiques de la ville de Dijon [The public fountains of the city of Dijon]. Paris: Dalmont.
[7] Poiseuille, J. 1840. Recherches expérimentales sur le mouvement des liquides dans les tubes de très petits diamètres [Experimental research on the movement of liquids in capillary of very small diameters]. Comptes rendus hebdomadaires des séances de l’Académie des sciences, T11: 1041–1048.
[8] Steckelmacher, W. 1986. Knudsen flow 75 years on: the current state of the art for

GillesPijaudier-Cabot,LionelEcay,DavidGrépoire,andFadiKhaddour
10
flow of rarefied gases in tubes and systems. Rep. Prog. Phys, 49: 1083–1107.
[9] F. Khaddour, D. Grégoire and G. Pijaudier-Cabot. 2015. Capillary bundle model for the computation of the apparent permeability from pore size distributions. European journal of environmental and civil engineering, 9: 168–183.
[10] Klinkenberg, L. J. 1941. The permeability of porous media to liquids and to gases. In Drilling and Production Practice, ed. American Petroleum Institute, 200–213.
[11] Choinska, M., A. Khelidj, G. Chatzigeorgiou and G. Pijaudier-Cabot. 2007. Effects and interactions of temperature and stress-level related damage on permeability of concrete. Cement and Concrete Research, 37: 79–88.
[12] Van Genuchten, M. Th. 1980. A closed-form equation for predicting the hydraulic conductivity of unsaturated soils. Soil Sci. Soc. Am. J., 44:892–898
[13] Mualem, Y. 1976. A new model for predicting the hydraulic conductivity of unsaturated porous media. Water resources research, 12(3), 513–522.