periodical fluctuation studies of cosmic-ray diurnal variations during the quiet-sun period...
TRANSCRIPT
PERIODICAL FLUCTUATION STUDIES OF COSMIC-RAY DIURNAL VARIATIONS DURING THE QUIET-SUN
PERIOD 1962-64'
1 Insx~rno I<on.\~r.\~ Clralk Rizmcr Nzlclear Labointorics, CI~alk Riz'cr, Onturio
Received October 25, l9GG
Statistical studies of periodic Iluct~~ations ol the cosniic-ray diuriial variation have been perlormed, using 11eutron and meson colilponent data obtained by the high-counti~ig-rate cosniic-ray monitors a t Deep liiver. The data cover an interval lrom h4ay 1962 to October 1964, a period of descending solar activity ending near the solar inin~mum. I t,is ,sho\vn that a 27-clay rccurrerlce tendency of the nniplit~!de ol the diurnal var~ation occasionally appears as \\.ell as shorter recurrent var~ations, ranging from one-hall to one-sixth of the solar rotation period. The correlations of these fluct~~ations ivith some typical solar and terrestrial indices arc exanlined in ordcr to search for possible origins ol the shorter recurrent variations. :\ possible connection \vith the I<,, index exists.
1. INTRODUCTION
Among the various types of time variation of cosmic-ray intensit!, cletectal>le on the ground, the diurnal variation is an interesting phenomenon closely con- ilectecl ~v i th the anisotropy of the primary cos~i~ic-ray intensity. Since the diurnal variation is con t inuo~~s ly observable, i t might be expected to provide a n excellent day-to-day index of the cosmic-ray ailisotropy in contrast \\.it11 the direct l ~ u t transient measurements using satellites or space prol)es. I-Iow- ever, most research in this field so far has suffered iron1 the follo~ving diffi- culties: (I) the statistical fluctuations inherent in the use of small cosmic-ray monitors are too large to permit significant da).-l>y-day monitorirlg of the anisotropy and (2) a t times of high solar actil-ity considerable disturl~ance is caused by other time variations such as For1)ush decreases. Accordingly, diurnal-variation studies in the past have l~een lilnlited either to overall cl~arncteristics averaged over a long period, or to unusually large effects accompanying For1)ush events. Thus i t n-as rather difficult to n ~ a k e detailed investigations of the diurnal variation even using the neutron-coniponent d a t a which since I C Y have played such a n iin~portaint role in connection ~ v i t h solar proton events and 1;orbusIi events.
A large neutron inonitor and a large meson telescope have been in operation a t Deep River since early 19G2 (Carmichael 19G4; I-Iatton and Carnlichael 1964). T h e mean countir~g rate of the neutron n~oni tor was GOO 000* per hour, corresponding to a n hourly standard deviation of 0.13y0, and tha t of the inlesoil monitor was 1 300 000 per liour, corresponding to 0.0970. Accordingly, the standard deviation of the diurnal amplitude for a single da)- is o.O52y0 for the neutron connponent and 0.025Y0 foi- the meson component, 1v11ere the
lIssued as A.E.C.L. h-o. 2'323. ZNo\\r a t Institute ol Physical and Chemical Research, Tokyo, Japan. -2.1 X 10"ince February 196.5.
Canadian Journal of Plis~sics. Volume 45 (1067)
Can
. J. P
hys.
Dow
nloa
ded
from
ww
w.n
rcre
sear
chpr
ess.
com
by
YO
RK
UN
IV o
n 11
/13/
14Fo
r pe
rson
al u
se o
nly.
2734 CANADIAN JOURNAL O F PHYSICS. VOL. 45. 1967
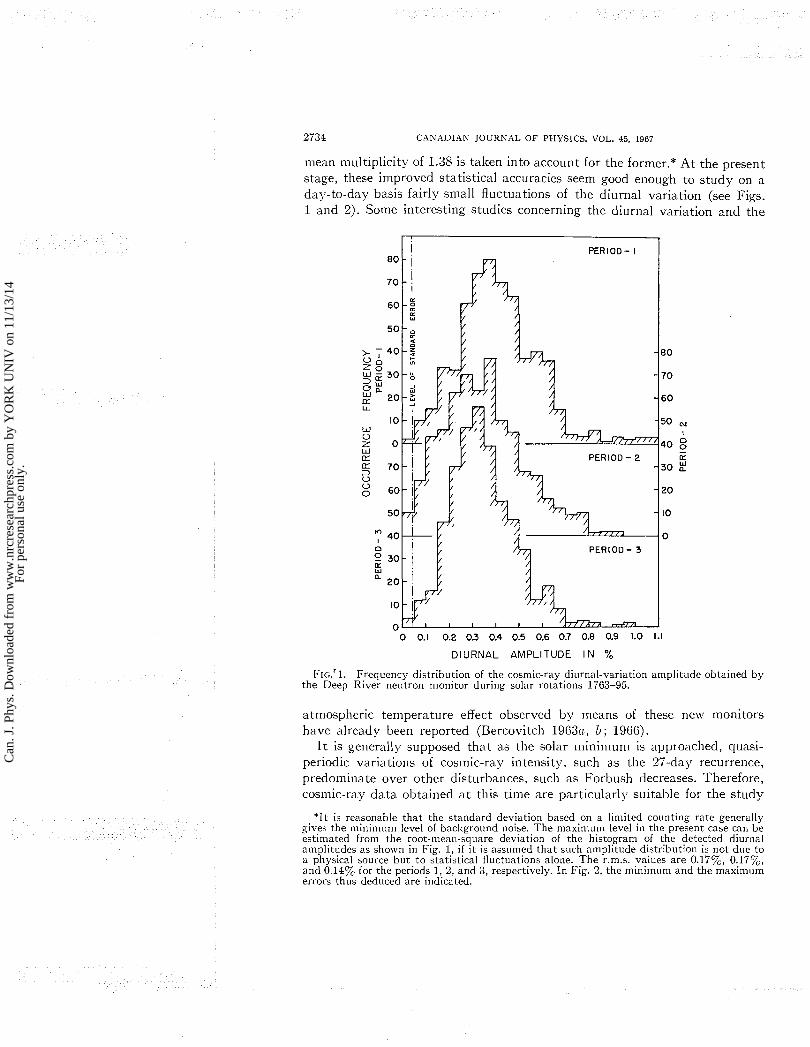
mean multiplicity of 1.38 is taken into account for the former.* At the present stage, these improved statistical accuracies seem good enough to study on a day-to-day basis fairly small fluctuations of the diurnal variation (see Figs. 1 and 2). Some interesting studies concerning the diurnal variation and the
FIG.‘^. Frequency distribution of the cosn~ic-ray diurnal-variation amplitude obtained by the Deep River neutron monitor during solar rotations 1763-95.
atrnospheric temperature effect observed by rneans of these new monitors have alreadv been reported (Bercovitch 1963a, b ; 1966).
I t is generally supposed that as the solar minimunl is approached, quasi- periodic variations of cosmic-ray intensity, such as the "-day recurrence, predominate over other disturbances, such as Forbush decreases. Therefore, cosmic-ray data obtained a t this time are particularly suitable for the study
*It is reasonable that the standard deviation based on a limited counting rate generally gives the minimum level of bacl;ground noise. The maximum level in the present case can be estimated from the root-mean-sq~lare deviation of the histogram of the detected diurnal amplitudes as shown in Fig. 1, if it is assumed that such amplitude distribution is not due to a physical source but t o statistical fluctuations alone. The r.m.s. values are 0.17y0, O.lf%, and 0.14y0 for the periods 1, 2, and 3, respectively. In Fig. 2, the mini~num and the maximum errors thus deduced are indicated.
Can
. J. P
hys.
Dow
nloa
ded
from
ww
w.n
rcre
sear
chpr
ess.
com
by
YO
RK
UN
IV o
n 11
/13/
14Fo
r pe
rson
al u
se o
nly.
KODAMA: COSMIC-RAY DIURNAL VARIATIONS
1 AMPLITUDE OF DIURNAL VARIATION 7
OCTOBER 1 9 6 2
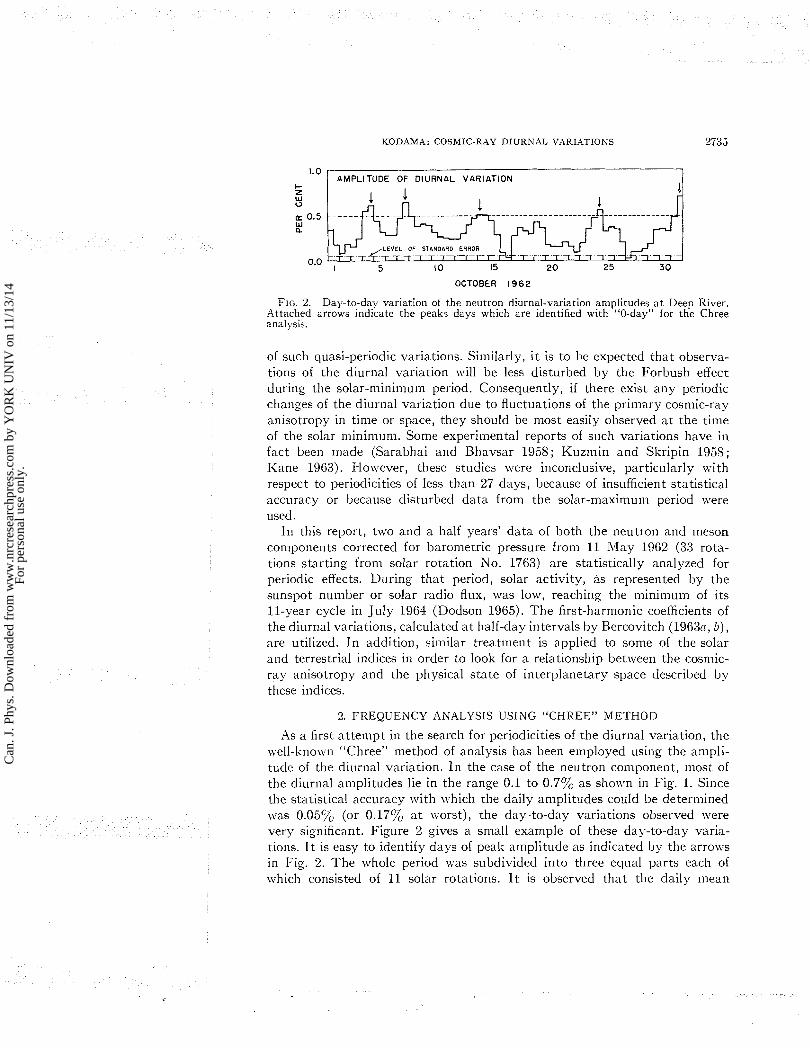
FIG. 2. Day-to-day variation of the neutron diurnal-variation amplitudes a t Deep River. Attached arrows indicate the peaks days which are identified with "0-day" for the Chree analysis.
of such quasi-periodic variations. Similarly, i t is to be expected that observa- tions of the diurnal variation mill be less disturbed by the Forbush effect during the solar-minimum period. Consequently, if there exist any periodic changes of the diurnal variation due to fluctuatioi~s of the primary cosn~ic-ray anisotropy in time or space, they should be most easily observed a t the time of the solar minimunl. Some experimental reports of such variations have in fact been made (Sarabhai and Bhavsar 1958; Kuzinin and Skripin 1955; Kane 1963). However, these studies were inconclusive, particularly with respect to periodicities of Iess than 27 days, because of insufficient statistical accuracy or because disturbed data from the solar-maximum period were used.
In this report, two and a half years' data of both the neutron and ineson conlponents corrected for barometric pressure from 11 May 1962 (33 rota- tions starting from solar rotation No. 1763) are statistically analyzed for periodic effects. During that period, solar activity, as represented by the sunspot number or solar radio flux, was low, reaching the minimuin of its 11-year cycle in July 1964 (Dodson 1965). The first-harmonic coefficients of the diurnal variations, calculated a t half-day intervals by Bercovitch (1963c~, b ) , are utilized. In addition, similar treatment is applied to some of the solar and terrestrial indices in order to look for a relationship between the cosinic- ray anisotropy and the physical state of interplanetary space described by these indices.
2. FREQUENCY ANALYSIS USING "CHREE" METHOD
As a first attempt in the search for periodicities of the diurnal variation, the nell-known "Chree" method of anaIysis has been employed using the ampli- tude of the diurnal variation. I n the case of the neutron component, nos t of the diurnal amplitudes lie in the range 0.1 to 0.7y0 as shown in Fig. 1. Since the statistical accuracy with lvhich the daily amplitudes could be determined was 0.05% (or 0.17% a t worst), the day-to-day variations observed were very significant. Figure 2 gives a small example of these day-to-day varia- tions. I t is easy to identify days of peal; amplitude as indicated by the arrows in Fig. 2. The whole period mas subdivided into three equal parts each of which consisted of 11 solar rotations. I t is observed that the daily mean
Can
. J. P
hys.
Dow
nloa
ded
from
ww
w.n
rcre
sear
chpr
ess.
com
by
YO
RK
UN
IV o
n 11
/13/
14Fo
r pe
rson
al u
se o
nly.
2736 C:\S.-1IjI.AS JOURNAL OF PIIYSICS. VOL. 45. 1967
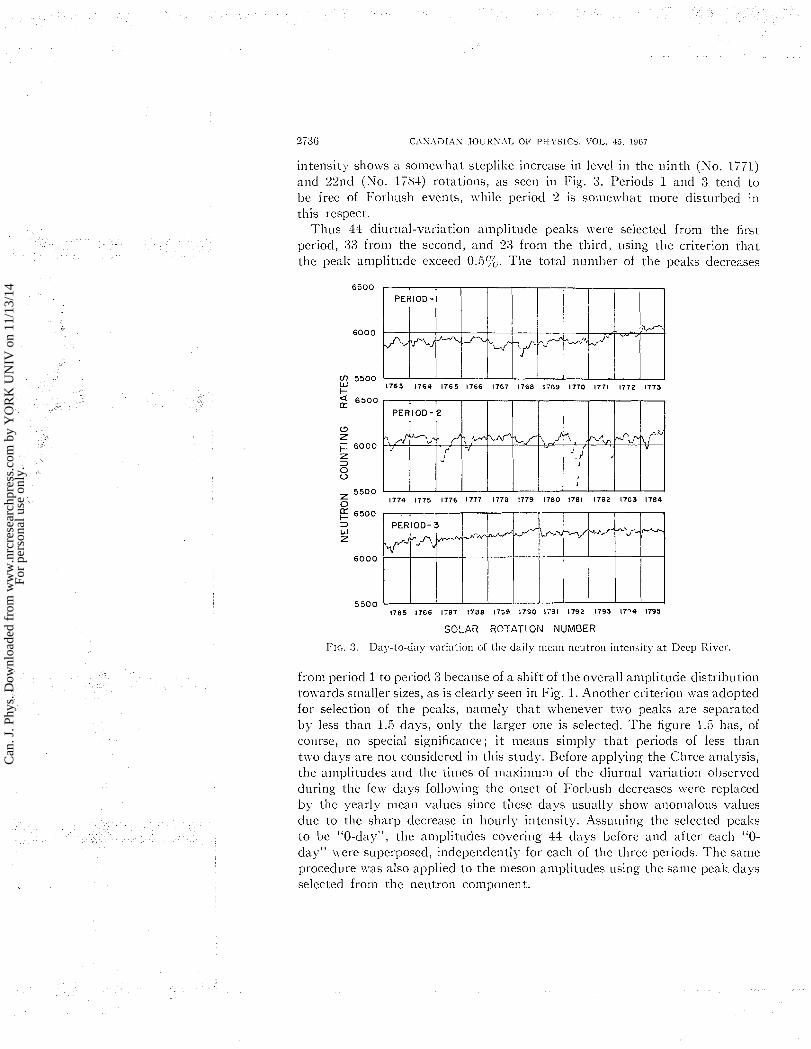
intensity sho\vs a some\vhat stcp1il;e increase in level in the ninth (KO. 1771) and 2"id (No. 1784) rotations, as seen in Fig. 3. Periods 1 and 3 tend to be free of I:orbush events, \vliile period 2 is soiiie\\~hat more disti~rl~ed in this respect.
Thus 44 diurnal-variatioi~ amplitude peals \\.ere selected from tlie first period, 33 from the seco~lcl, and 2:3 from the third, using the criterion that the peal; amplitude exceed 0..5y0. The total number of tlie peaks decreases
PERIOD-I
Lsz
SO!-AR ROTATION NUMBER
I 3 . Da>-to-day variation of the daily mean n e ~ ~ t r o n intensity a t Deep Rivcr.
from period 1 to period 3 I~ecause of a shift of tlie overall aniplitude distribution to~vards s111alle1- sizes, as is clearly seen in Fig. 1. Another criterion \\;as adopted for selectio~l of tlie peaks, i~aiiiely that \\;I~enever two pea1;s are separated by less tlian 1.5 days, only the larger one is selected. 'The figure 1.5 has, of course, no special significance; it mcruis simply that periods of less tlian t\vo days are not considered i l l this study. Before applying the Cliree analysis, the an~plitucles and tlie times of niaxi~iium of the diurnal variatio11 oljserved during tlie few days follo\\;iiig the onset of Forbusli decreases \\.ere replaced by the yearly Iiiean values since these days usually show ailomalous values due to the sharp decrease in hourly i~itensity. Assumi~ig the selected peaks to be "0-day", the amplitudes covering 44 days before and after each "0- day" were superposed, independently for each of the three periods. The same procedure \\;as also applied to the meson aniplitudes using the same peal; days selected from the neutron componeilt.
Can
. J. P
hys.
Dow
nloa
ded
from
ww
w.n
rcre
sear
chpr
ess.
com
by
YO
RK
UN
IV o
n 11
/13/
14Fo
r pe
rson
al u
se o
nly.
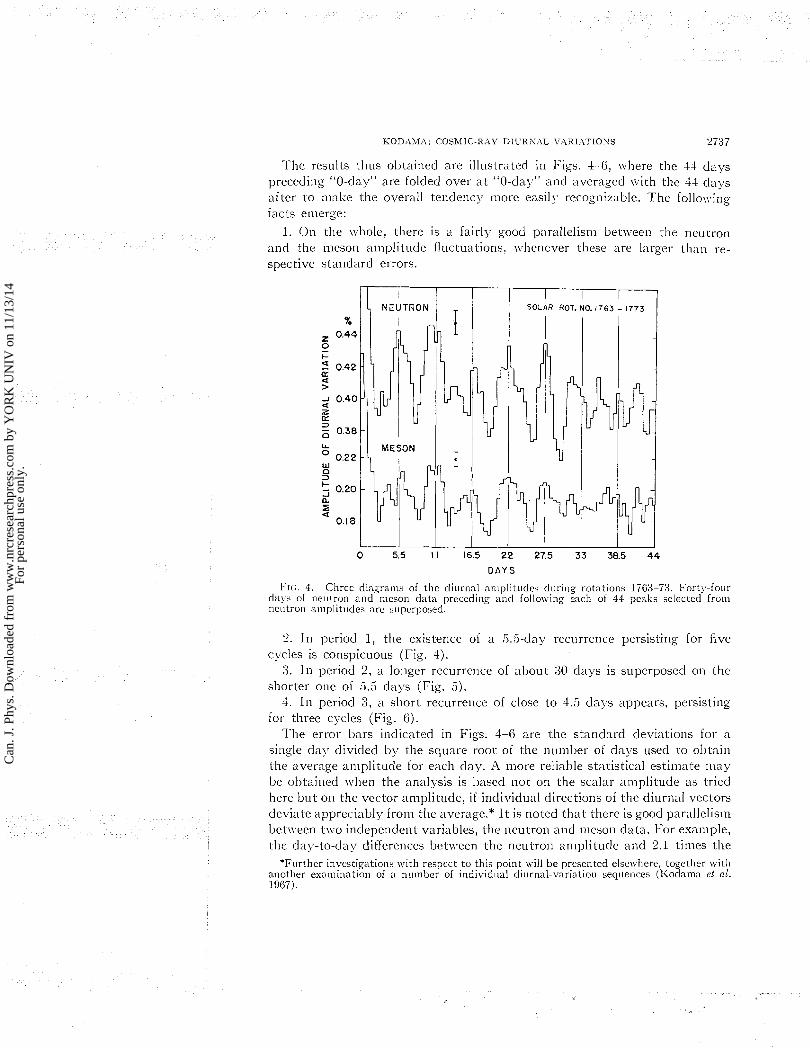
?I'he results thus obtained are illustrated in Figs. 4-6, \\here the 44 days preceding "0-day" are folded over a t "0-da)." and averaged \\-it11 the 44 clal-s after to nialce the overall tendency inore easily recognizable. The folio\\-ing facts emerge:
1. On the \\hole, there is a fairly good parallelism bet j~een the neutron and the meson amplitude fluctuations, \\hencver these are larger than re- spective standard errors.
0 5.5 1 1 16.5 22 27.5 33 38.5 44
D A Y S
I;I(. 4. Cliree diagrams of the d i ~ ~ r n a l a ~ i ~ ~ l i t ~ ~ d c i during rotations 1763-7:;. 170rt).-four da!i of neutron and meson da ta preceding and folloiving each of 44 peaks selected from neutron a m p l ~ t l ~ d e s are superposed
2. In period I , the existence of a 5.5-day recurrence persisting for five c> cles is conspicuous (Fig. 4).
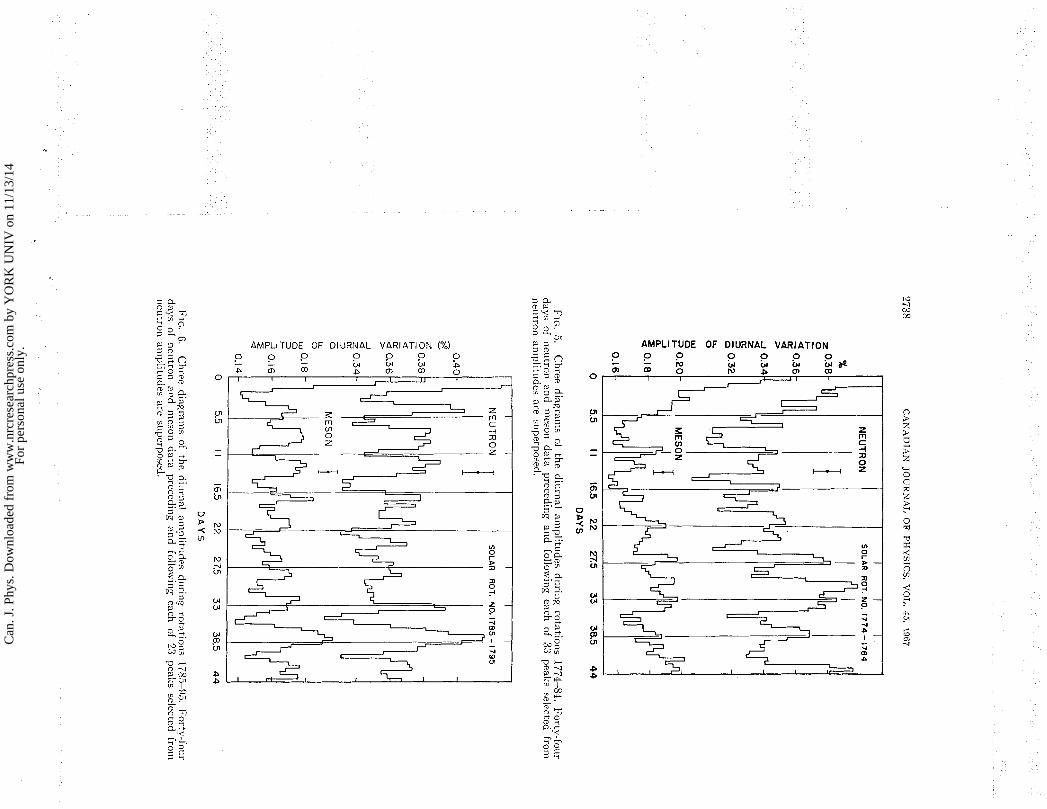
3. In period 2, a longer recurrence of about 30 days is superposed on the shorter one of 5.5 days (Fig. 3).
4. In period 3, a short recurrence of close to 4.5 dnj.s appears, persisting for three cycles (Fig. 6).
7 .
I he error bars indicated in Figs. 4-6 are the standard deviations for a single dalr divided by the square root of the number of days used to ol~tain the average amplitude for each day. A more reliable statistical estimate may be obtained \vhen the analysis is based not on the scalar amplitude as tried here but on the vector amplitude, if individual directions of the diurnal vectors deviate appreciably from the average.* I t is noted that there is good parallelisin l~e t \ \ een t\\o independent variables, the neutron and meson data. For example, the day-to-day differences bet~veen the neutron anlplitude and 2.1 times the
*Further investigations \\-it11 respect t o this point will be presented else\\lierc, together with another examination of ;l number of individual di~~rnal-variat ion sequences (I<odama et al. 1967).
Can
. J. P
hys.
Dow
nloa
ded
from
ww
w.n
rcre
sear
chpr
ess.
com
by
YO
RK
UN
IV o
n 11
/13/
14Fo
r pe
rson
al u
se o
nly.
AMPLITUDE OF DIURNAL VARIATION (%)
5 n 0 &,
5%" z o o 2 - &, 2 2 'D
2 5 0 ~5 T - d m C ' D O ! 2 2 n 2 ng'
g g z 0
'Sf: 8 2 5 'D tl in gE
0 w s' 5 rd $5 W N n -.
F -- E% 0 "? 2 5.9 3 - w 2.
W p 5 W 0 1
" 2 W z:. p
03 O UI 0, 2 a r ' D - P - P 7;* : 6 ". R .r! C 0 E2
(4
AMPLl TUDE OF DIURNAL VARIATION
Can
. J. P
hys.
Dow
nloa
ded
from
ww
w.n
rcre
sear
chpr
ess.
com
by
YO
RK
UN
IV o
n 11
/13/
14Fo
r pe
rson
al u
se o
nly.

KODAMA: COSMIC-RAY DIURNAL VARIATICXS 2739
meson amplitude were derived from Fig. 4. T h e amplitude ratio of 2.1 between the two components was obtained by Bercovitch (1966). The points are found to scatter within a region limited by the standard deviation.
In order to investigate the relationship of the 5.5-day recurrence to the earth-sun direction, the diurnal-variation harmonic vector was resolved into the two components, a radial component along the earth-sun line and a tangential component perpendicular to that line. Both these components were calculated making allowance for the geomagnetic deflection by using the 35" eastward shift of the effective cosmic-ray zenith for a neutron moi~itor a t Deep River, v.hich was calculated by i\,IcCracken et al. (1962). Then the same procedure as described above was repeated for each component. From the amplitude scales in Fig. 7 we see that the magnitude of the neutron radial conlponent is much less than that of the tangential component." This means
I I I I I TANGENT1 AL SOLAR ROT. NO. 1763 - 1773
DAYS
FIG. 7. Chree diagrams of the radial and tangential components in the neutron diurnal variation during solar rotations 1763-73.
that the persistent part of the diurnal variation, as has already been reported by Bercovitch (1963n), is attributable to a primary cosmic-ray anisotropy from a direction 90" to the east of the sun-earth line. Figure '7 also sho\\:s that it is the tangential componellt which exhibits the 5.5-clay recurrence, u-hile 110 such tendency is apparent for the radial component.
As one may see from Figs. 4, 5, and 6 the short-period fluct;uations are not stable but are changeable with time. I t is, however, rather difficult to carry the investigation further by ineans of the Chree analysis alone. I11 order to
"The meson component is subject to a geomagnetic deflection slightly different fro111 that for the neutron component and also to the atmospheric temperature effect. These tn.0 effects may introduce relatively large errors into its radial component.
Can
. J. P
hys.
Dow
nloa
ded
from
ww
w.n
rcre
sear
chpr
ess.
com
by
YO
RK
UN
IV o
n 11
/13/
14Fo
r pe
rson
al u
se o
nly.
2710 C.\S.-\DIz\N JOLRS.4L OF PHYSICS. VOL. 45, 196i
examine the fine structure of the day-to-day changes of the diurnal variation it \\-ill Ile necessary to deduce the so-called po\\ier spectrum, \\rhich is another technique for frequency analysis.
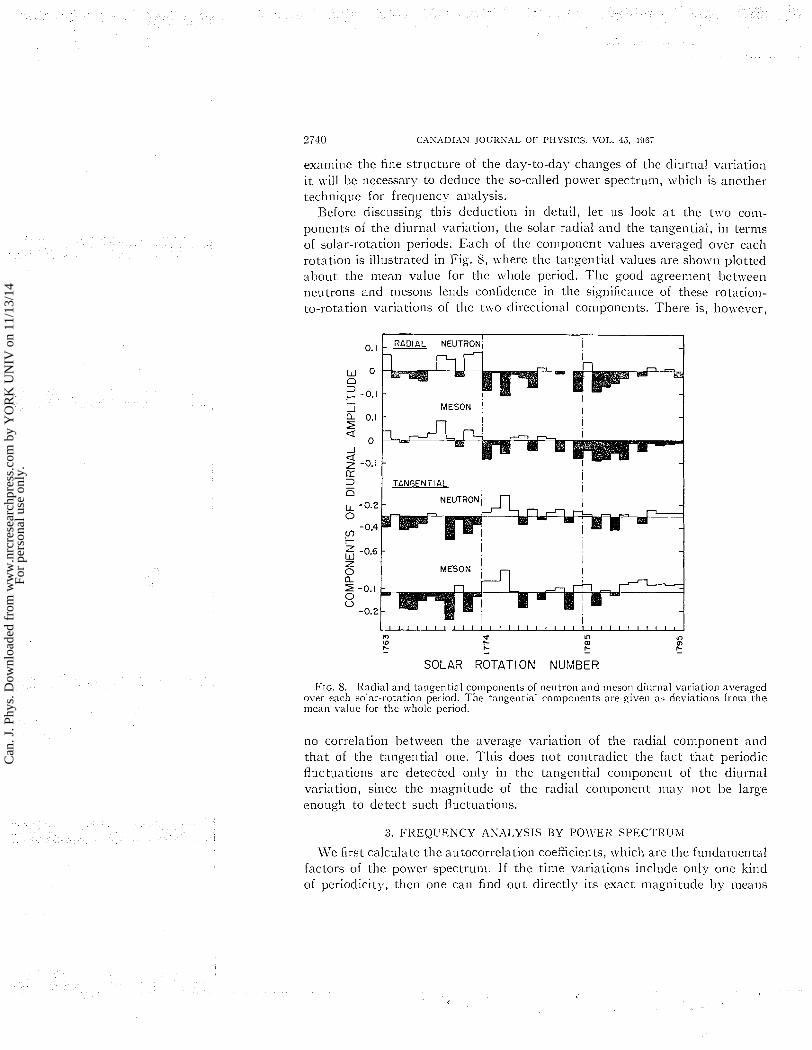
Before clisc~~ssing this deduction in detail, let us look a t the t\vo con,- ponents of the diurnal variation, the solar radial and the tangential, in terms of solar-rotation periods. Each of the component values averaged over each rotation is illustrated in Fig. 9, \\-here the tai-igential values are sho\\rn plotted about the mean value for the \\.hole period. The good agreement bet\\-een neutrons and mesons lends confidence in the significance of these rotation- to-rotation variations of the t\\:o clirectional conlponents. There is, ho\\-ever,
C)
U) P I- In m
Y)
I- 0)
t - k k
SOLAR ROTATION NUMBER
I 8. IZnclial and tangential coniponents of neutron and meson diurnal variation averaged over each solar-rotation period. The tatlgential conipol~ents are given as deviations from the lnea~i value for the whole period.
no correlation between the average variation of the radial con~ponent and that of the tangential one. This does not contradict the fact that periodic fluctuations are detected only in the tangential component of the diurnal variation, since the magnitude of the radial componei~t may not l ~ e large enough to detect such fluctuations.
3. FREQUENCY ANr\I,YSIS BY PO\\'ER SPECTRUlI
\Ve first calculate the autocorrelation coefficients, \\;hich are the fundamental factors of the power spectrunl. If the time variations include only one ltind of periodicity, then one can find out directly its exact magnitude by means
Can
. J. P
hys.
Dow
nloa
ded
from
ww
w.n
rcre
sear
chpr
ess.
com
by
YO
RK
UN
IV o
n 11
/13/
14Fo
r pe
rson
al u
se o
nly.
KODAMA: COSMIC-RAY DIURNAL VARIATIONS 2741
of autocorrelation alone. However, if a number of different periods are super- posed on one another, i t is hard to discriminate between them by this method alone, but it is possible if the power spectrum is deduced.
In this paper the autocorrelation coefficients were calculated for the ampli- tude of the diurnal variation from any one solar rotation through the two successive rotations by steps of half a day, where the size of the original population of data was taken to be a 27-day group. Using a sequence of half-daily values of the diurnal amplitude, A( l ) , A(2), . . . , the autocorre- lation coefficients between the two populations of data
and
A(n + 1 + t), A(n + 2 + t), . . . , A(% + m + t) are denoted by
where n takes on the values
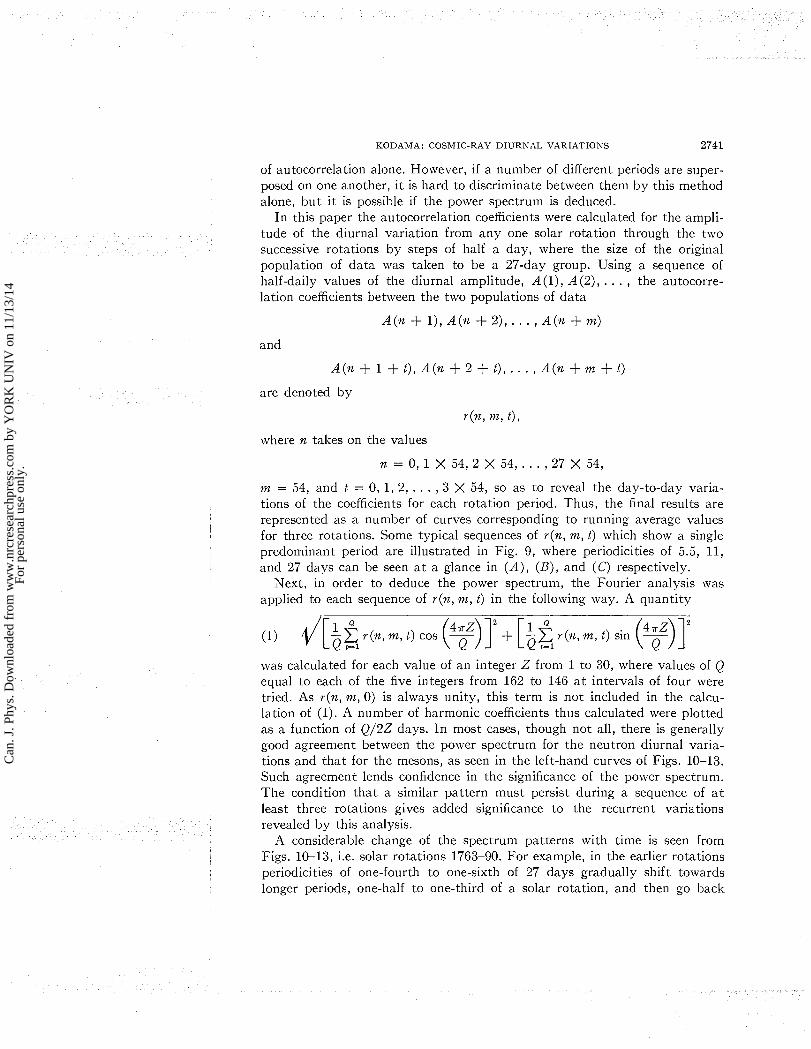
m = 54, and t = 0, 1, 2, . . . , 3 X 54, so as to reveal the day-to-day varia- tions of the coefficients for each rotation period. Thus, the final results are represented as a number of curves corresponding to running average values for three rotations. Some typical sequences of r(n, m, t) which show a single predominant period are illustrated in Fig. 9, where periodicities of 5.5, 11, and 27 days can be seen a t a glance in (A), (B), and (C) respectively.
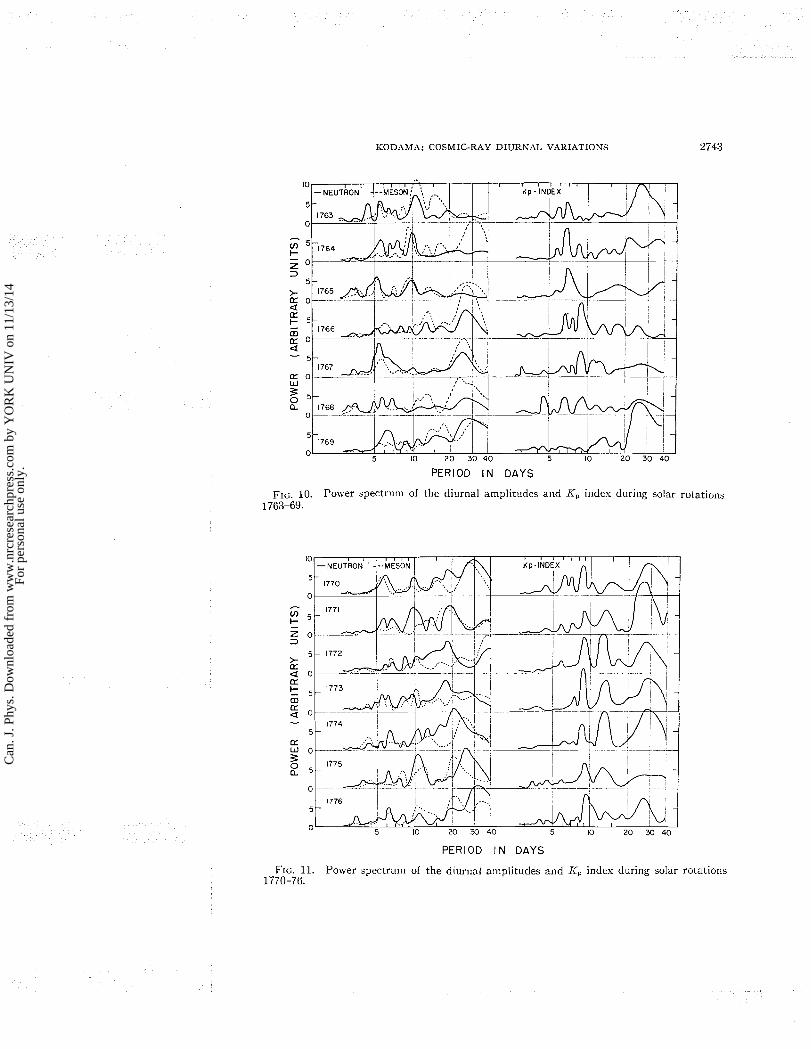
Next, in order to deduce the power spectrum, the Fourier analysis was applied to each sequence of r(n, m, t) in the following way. A quantity
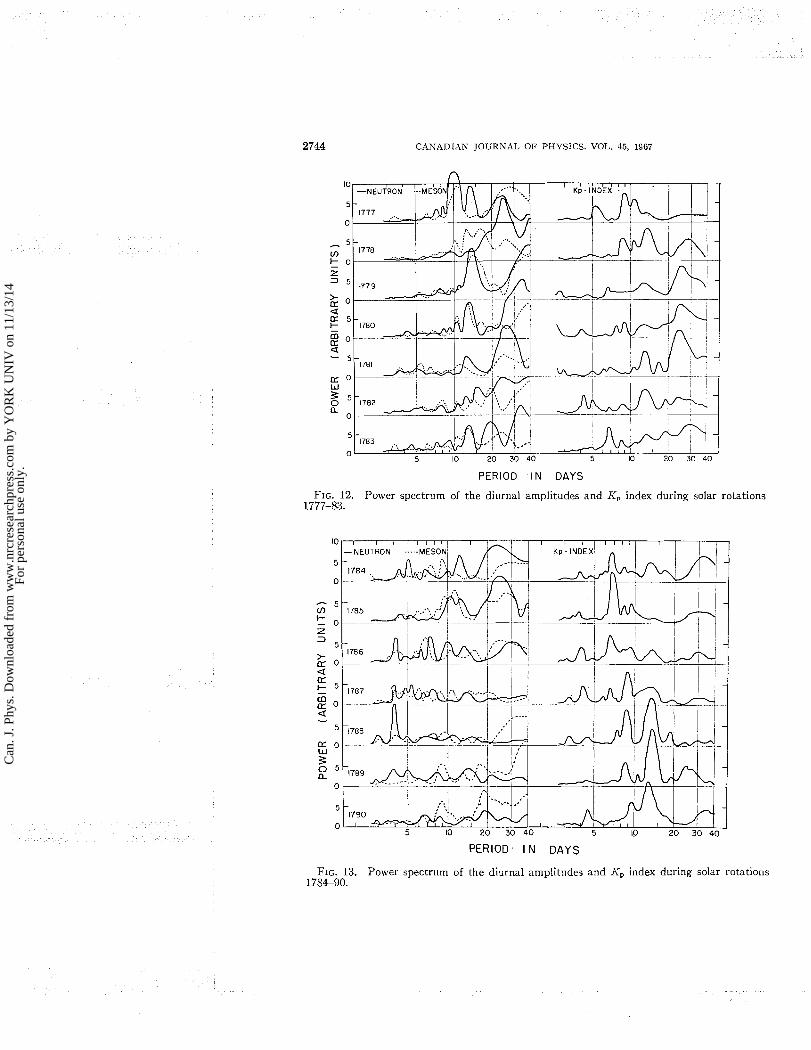
was calculated for each value of an integer Z from 1 to 30, where values of Q equal to each of the five integers from 162 to 146 a t intervals of four were tried. As r(n, m, 0) is always unity, this term is not included in the calcu- lation of (I). A number of harmonic coefficients thus calculated were plotted as a function of Q/2Z days. In most cases, though not all, there is generally good agreement between the power spectrum for the neutron diurnal varia- tions and that for the mesons, as seen in the left-hand curves of Figs. 10-13. Such agreement lends confidence in the significance of the power spectrum. The condition that a similar pattern must persist during a sequence of a t least three rotations gives added significance to the recurrent variations revealed by this analysis.
A considerable change of the spectrum patterns with time is seen from Figs. 10-13, i.e. solar rotations 1763-90. For example, in the earlier rotations periodicities of one-fourth to one-sixth of 27 days gradually shift towards longer periods, one-half to one-third of a solar rotation, and then go back
Can
. J. P
hys.
Dow
nloa
ded
from
ww
w.n
rcre
sear
chpr
ess.
com
by
YO
RK
UN
IV o
n 11
/13/
14Fo
r pe
rson
al u
se o
nly.

CANADIAN JOURNAL O F PHYSICS. VOL. 45, 1967
(A) SOLAR ROTATION NO. 1 7 6 7 1 n -
0.5 - , 1 J
1
1 : ' , l, J : J~, - 1 2 J
il
-0.5 - J -
0 (C1 SOLAR ROTATION NO. 1781
D A Y S
FIG., 9. Some results of autocorrelations applied to neutron amplitudes of the diur~lal variat~ons.
close to the original period. In addition, a 27-day recurrence sometimes appears in association with the shorter one. Although the Chree analysis results given in the preceding section are consistent with these, they do not shon- the short-term changes of the spectrunl but only the overall properties averaged over 11 solar rotations.
I t is interesting to coinpare the power spectrunl for the cosmic-ray diurnal variation \vitl~ that of the K, index, nrhich has beell clainled to be a good nleasure of the solar plasma velocity (Snyder et al. 1963). The I<, frequency spectrunl is illustrated in the right-hand curves of Figs. 10-13 so that it may be directly compared with the diurnal-variation spectrum. We note that the general teildency seen in the case of the diurnal variation is also recognized in the case of the K,, index, i.e., there are again three shorter recurrences, one-half, one-third, and one-fourth of 27 days, and also a 27-day recurrence. I t is suggestive that these short-term recurrences (less than 27 days) dis- appear during rotations 1778-82 when no short-term recurrences of the diurnal variation are found. Although the I<, periods of one-third to one-fourth the
Can
. J. P
hys.
Dow
nloa
ded
from
ww
w.n
rcre
sear
chpr
ess.
com
by
YO
RK
UN
IV o
n 11
/13/
14Fo
r pe
rson
al u
se o
nly.
KODAMA: COSMIC-RAY DIURNAL VARIATIONS 2 7 4 3
PERIOD I N DAYS
FIG. 10. Power spectrum of the diurnal amplitudes and K,, index during solar rotations 1763-69.
PERIOD I N DAYS
FIG. 11. Power spectrum of the diurnal arnpl i t~~des and I(, index during solar rotations 1770-76.
Can
. J. P
hys.
Dow
nloa
ded
from
ww
w.n
rcre
sear
chpr
ess.
com
by
YO
RK
UN
IV o
n 11
/13/
14Fo
r pe
rson
al u
se o
nly.
CANADIAN JOURNAL O F PHYSICS. VOL. 45, 1967
PERIOD I N DAYS
FIG. 12. Power spectrum of the diurnal amplitudes and K, index during solar rotations 1777-83.
PERIOD. I N DAYS
FIG. 13. Power spectrum of the diurnal amplitudes and K, index during solar rotations 1784-90.
Can
. J. P
hys.
Dow
nloa
ded
from
ww
w.n
rcre
sear
chpr
ess.
com
by
YO
RK
UN
IV o
n 11
/13/
14Fo
r pe
rson
al u
se o
nly.
KODAMA: COSMIC-RAY DIURNAL Vt\RIATIOSS 2745
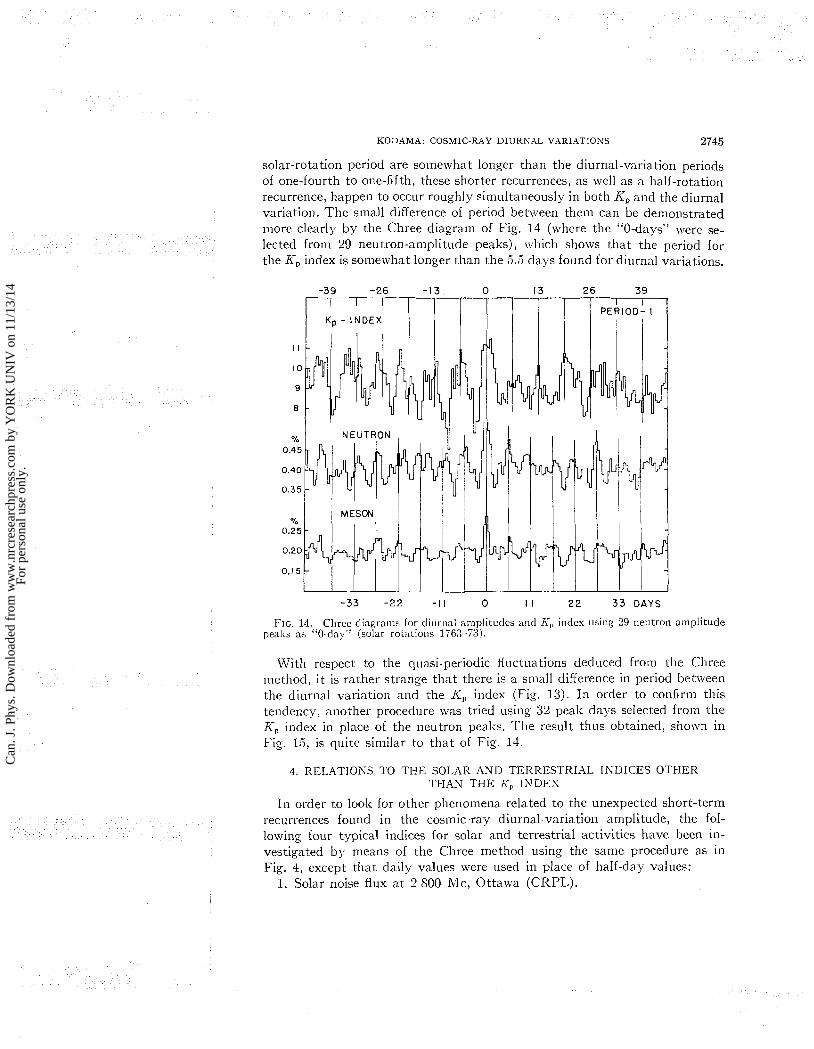
solar-rotation period are somewhat longer than the diurnal-variation periods of one-fourth to one-fifth, these shorter recurrences, as well as a half-rotation recurrence, happen to occur roughly simultaneously in both K p and the diurnal variation. The small difference of period between them can be demoilstrated inore clearly by the Chree diagram of Fig. 14 (where the "0-days" were se- lected from 29 neutron-amplitude pealcs), which shows that the period for the I(, index is somelvhat longer than the 5.5 days found for diurnal variations.
-33 -22 - 1 1 0 I I 22 33 D A Y S
FIG. 14. Chree diagrams for diurr~al amplitudes and I<,, ir~dex u s i n ~ 29 neutron amplitude peaks as "0-day" (solar rotalio~is 1763-73).
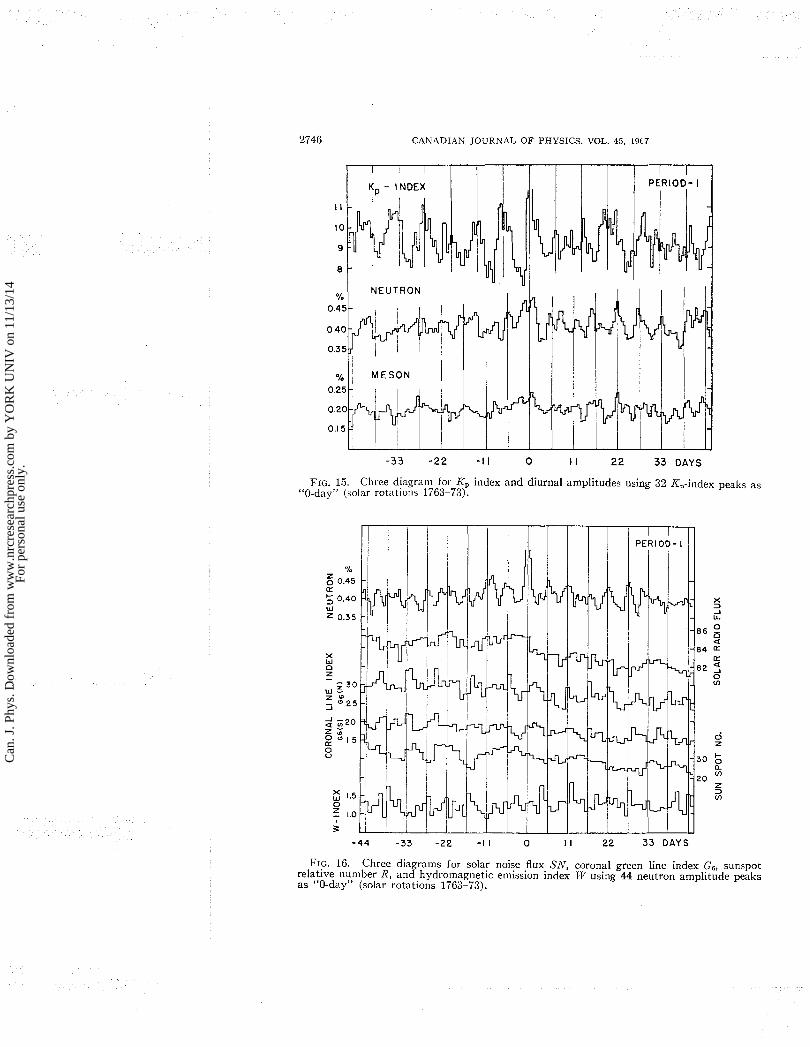
With respect to the quasi-periodic fluctuations deduced from the Chree method, it is rather strange that there is a small difference in period betnreen the diurnal variation and the K , index (Fig. 13). In order to confirm this tendency, another procedure \\as tried using 32 peak days selected from the I<, index in place of the neutron peal=. The result thus obtained, shoxv11 in Fig. 15, is quite similar to that of Fig. 14.
4. RELATIONS TO TI-IE SOLAR AND TERRESTRIAL INDICES O T H E R TI-IAN T H E K, I N D E X
In order to loolc for other phenomena related to the unexpected short-term recurrences found in the cosmic-ray diurnal-variation amplitude, the fol- lowing four typical indices for solar and terrestrial activities have been in- vestigated by means of the Chree method using the same procedure as in Fig. 4, except that daily values \\-ere used in place of half-day values:
1. Solar noise flux a t 2 SO0 ivIc, Ottawa (CRPL).
Can
. J. P
hys.
Dow
nloa
ded
from
ww
w.n
rcre
sear
chpr
ess.
com
by
YO
RK
UN
IV o
n 11
/13/
14Fo
r pe
rson
al u
se o
nly.
CANADIAN JOURNAL OF PHYSICS. VOL. 45. 1967
% 1 NEUTRON
% I M E S O N I ! I ( I / / 1 / I I ! I
-33 -22 - 1 1 0 I I 22 33 D A Y S
FIG. 15. Chree diagram for K, index and diurnal amplitudes using 32 K,-index peaks a s "0-day" (solar rotations 1763-73).
- 4 4 -33 -22 - 1 I 0 I I 22 33 D A Y S
FIG. 16. Chree diagrams for solar noise flux SN, coronal green line index Gs, sunspot relative number R , and hydromagnetic emission index bTf using 44 neutron amplitude peaks a s "0-day" (solar rotations 1763-73).
Can
. J. P
hys.
Dow
nloa
ded
from
ww
w.n
rcre
sear
chpr
ess.
com
by
YO
RK
UN
IV o
n 11
/13/
14Fo
r pe
rson
al u
se o
nly.
KODAMA: COSMIC-RAY DIURNAL VARIATIONS 2747
2. Coronal green-line emission index G6, for each of the northern and the southern hemispheres (CRPL).
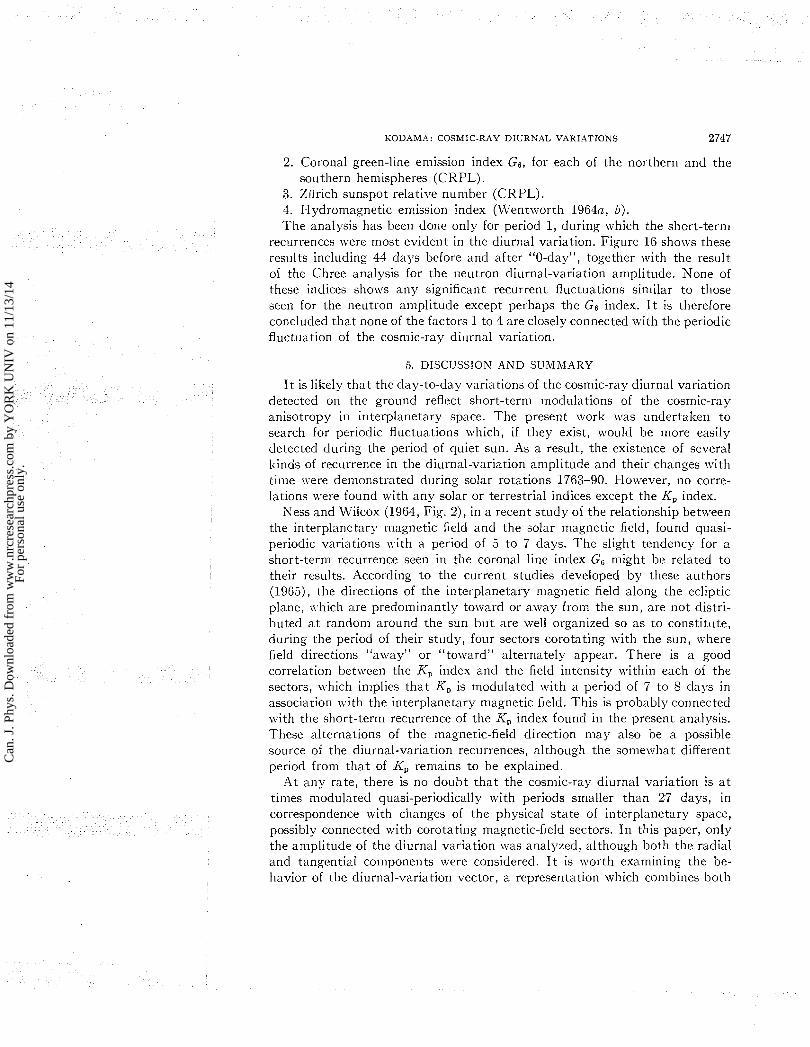
3. Ziirich sunspot relative number (CRPL). 4. I-Iydromagnetic emission index (Wentworth 1964a, b). The analysis has been done only for period 1 , during which the short-term
recurrences were most evident in the diurnal variation. Figure 16 shows these results including 44 days before and after "0-day", together with the result of the Chree analysis for the neutron diurnal-variation amplitude. None of these indices shows any significant recurrent fluctuations similar to those seen for the neutron amplitude except perhaps the G6 index. I t is therefore concluded that none of the factors 1 to 4 are closely connected with the periodic fluctuation of the cosn~ic-ray diurnal variation.
5. DISCUSSION AND SUMMARY
I t is likely that the day-to-day variations of the cosmic-ray diurnal variation detected on the ground reflect short-tern~ modulations of the cosmic-ray anisotropy in interplanetary space. The present work uras undertaken to search for periodic fluctuations which, if they exist, would be more easily detected during the period of quiet sun. As a result, the existence of several kinds of recurrence in the diurnal-variation amplitude and their changes with time were demonstrated during solar rotations 1763-90. I-Io~vever, no corre- lations were found with any solar or terrestrial indices except the K, index.
Ness and Wiicox (1964, Fig. 2), in a recent study of the relationship between the interplanetary magnetic field and the solar iriagnetic field, found quasi- periodic variations \\-ith a period of 5 to 7 days. The slight tendency for a short-tern~ recurrence seen in the coronal line index G6 might be related to their results. According to the current studies developed by these authors (1963), the directions of the interplanetary niagnetic field along the ecliptic plane, n.hich are predoininantly to\\lard or away froiri the sun, are not distri- buted a t random around the sun but are 117ell organized so as to constitute, during the period of their study, four sectors corotating with the sun, where field directions "away" or "toward" alternately appear. There is a good correlation between the K, index and the field intensity lvithin each of the sectors, I\-hich implies that K, is modulated with a period of 7 to S days in association xi th the interplanetary magnetic field. This is probably connected with the short-term recurrence of the K, index found in the present analysis. These alternations of the magnetic-field direction may also be a possible source of the diurnal-variation recurrences, although the somewhat different period from that of K, remains to be explained.
At any rate, there is no doubt that the cosmic-ray diurnal variation is a t times modulated quasi-periodically with periods smaller than 27 days, in correspondence with changes of the physical state of interplanetary space, possibly connected with corotating magnetic-field sectors. In this paper, only the amplitude of the diurnal variation was analyzed, although both the radial and tangential components were considered. I t is worth examining the be- havior of the diurnal-variation vector, a representation which combines both
Can
. J. P
hys.
Dow
nloa
ded
from
ww
w.n
rcre
sear
chpr
ess.
com
by
YO
RK
UN
IV o
n 11
/13/
14Fo
r pe
rson
al u
se o
nly.
2748 CANADIAN JOURNAL OF PHYSICS. VOL. 45. 1967
the amplitude and the time of maximum. Indeed, i t has been found from a day-to-day summation dial of such diurnal vectors that both the magnitude and the direction of the cosmic-ray anisotropy are modulated quasi-periodic- ally, and are sensitive to the boundaries of the corotating sectors (Icodama et al. 1967).
In summary, it has been shown, using the results from high-counting-rate cosmic-ray monitors, that the cosmic-ray diurnal variation undergoes quite significant day-to-day variations of amplitude far beyond statistical fluctua- tions. Such variations occasionally have marked recurrent variations which, in the interval studied, include not only a 27-day period but also shorter periods, of from one-half to one-sixth of a solar-rotation period. The long and the short periods may appear independently or in superposition. This recurrent behavior, which predominates along a direction perpendicular to the sun-earth line, bears some relation to that of the K, index, in that the appearance of short-term recurrences in the one tends to accompany that in the other.
ACKNOWLEDGMENTS
I wish to thank Dr. H. Carmichael for his constant interest and valuable comments and Dr. M . Bercovitch for his careful reading during the prepara- tion of this manuscript. Also many thanks are due to the Cosn~ic Ra17 Group a t Deep River for kind hospitality extended to me.
REFERENCES
BERCOVITCN, ivI. 1963a. J. Geophys. Res. 68, 4366. 1963b. Proc. Eighth Intern. Conf. Cosmic Rays (Jaipur), 2, 332. 1'366. Can. J. Phys. 44, 1329.
CARAIICHAEL, H. 1964. IQSY I~lstruction Manual No. 7 , Cosmic Rays (Published by the IQSY Secretariat, London).
CRPL-F, Solar-geophysical data, issued by the National Bureau of Standards, Boulder, Colorado.
DODSON, H. W. 1965. Private communication to H. Carmichael. 1-IATTON, C. J , and CARMICHAEL, H. 1964. Can. J. Phys. 42, 2443. I<AXE, R. P. 1963. Nuovo Cimento, 29, 801. I<ODAJIA. M., BERCOVITCH, M., MOIII, S., UENO, H., and NAGASIIIMA, I<. 1967. TO be
published. K u z a r ~ ~ , A. I. and SICRIPIN, G. V. 1958. Trudy Ya. FAN, 2, 107. MCCRACICEN, I<. G., RAO, V. R., and SHEA, M. A. 1962. Mass. Inst. Techno]. Tech. Rept. -,. NESS, N. F. and WILCOS, J. M. 1964. Phys. Rev. Letters, 13 (15) , 461.
1965. J. Geophys. Res. 70, ,5793. SARABHAI, V. and BHAVSAR, P. D. 1958. Nuovo Cimento, 8, Suppl., 299. SNYDER, C. W., NEUGEBAUER, M., and RAO, U. R. 1963. J. Geophys. Res. 68, 6361. WENTWORTH. R. C. 1964a. 1. Geophys. Res. 69, 2689.
1964b. Private communicafioh.
Can
. J. P
hys.
Dow
nloa
ded
from
ww
w.n
rcre
sear
chpr
ess.
com
by
YO
RK
UN
IV o
n 11
/13/
14Fo
r pe
rson
al u
se o
nly.