performance prediction and its use in parallel and distributed computing systems
TRANSCRIPT
Future Generation Computer Systems 22 (2006) 745–754www.elsevier.com/locate/fgcs
Performance prediction and its use in parallel and distributedcomputing systemsI
Stephen A. Jarvisa,∗, Daniel P. Spoonera, Helene N. Lim Choi Keunga, Junwei Caob,Subhash Sainic, Graham R. Nudda
a Department of Computer Science, University of Warwick, Warwick CV4 7AL, UKb Center for Space Research, Massachusetts Institute of Technology, Cambridge, MA, USA
c NASA Ames Research Center, Moffett Field, CA, USA
Available online 2 May 2006
Abstract
Performance prediction is set to play a significant role in supportive middleware that is designed to manage workload on parallel and distributedcomputing systems. This middleware underpins the discovery of available resources, the identification of a task’s requirements and the match-making, scheduling and staging that follow.
This paper documents two prediction-based middleware services that address the implications of executing a particular workload on a givenset of resources. These services are based on an established performance prediction system that is employed at both the local (intra-domain) andglobal (multi-domain) levels to provide dynamic workload steering. These additional facilities bring about significant performance improvements,the details of which are presented with regard to system- and user-level qualities of service. The middleware has been designed for the managementof resources and distributed workload across multiple administrative boundaries, a requirement that is of central importance to grid computing.c© 2006 Elsevier B.V. All rights reserved.
Keywords: Performance prediction; Resource management; Grid computing
1. Introduction
The computing architectural landscape is changing. High-end resources that were once large, multi-processor supercom-puting systems are being increasingly replaced by heteroge-neous commodity PCs and complex powerful servers. Thesenew architectural solutions, including the Internet computingmodel [28] and the grid computing [18,25] paradigm, aim tocreate integrated computational and collaborative environmentsthat provide technology and infrastructure support for the effi-cient use of remote computing facilities. The adoption of sucharchitectures rests on the outcome of a number of important re-search areas; one of these – performance – is fundamental, asthe uptake of these approaches relies on their ability to provide
I Sponsored in part by grants from the NASA AMES Research Center(USARDSG N68171-01-C-9012), the EPSRC (GR/R47424/01) and theEPSRC e-Science Core Programme (GR/S03058/01).
∗ Corresponding author. Tel.: +44 2476 524258; fax: +44 2476 573024.E-mail address: [email protected] (S.A. Jarvis).
0167-739X/$ - see front matter c© 2006 Elsevier B.V. All rights reserved.doi:10.1016/j.future.2006.02.008
a steady and reliable source of capacity and capability comput-ing power.
While the study of performance in relation to computerhardware and software has been a topic of much scrutiny for anumber of years, it is likely that this research area will change toreflect the emergence of geographically dispersed networks ofcomputing resources such as grids. There will be an increasedneed for high performance resource allocation services [3] andan additional requirement for increased system adaptabilityin order to respond to the variations in user demands andresource availability. Performance engineering in this contextraises a number of important questions, the answers to whichwill impact on the utilisation and effectiveness of relatedperformance services:
What does the performance data describe? The responseof a system (or user) to the performance data will dependon the nature of the data. This might include timing datafor the run-time of a particular application (on a givenresource) or data relating to the monitoring of various network
746 S.A. Jarvis et al. / Future Generation Computer Systems 22 (2006) 745–754
and computational resources, for example the communicationlatencies provided by network monitors such as NWS [35].
How is this performance data obtained? Gatheringperformance data can be achieved by a number of methods.Monitoring services provide records (libraries) of dynamicinformation such as resource usage or characteristics ofapplication execution. This data can be used as a benchmark foranticipating the future performance behaviour of an application,a technique that can be used to extrapolate a wide range ofpredictive results [15]. Alternatively it is possible to extract datafrom an application through the evaluation of analytical models.While these have the advantage of deriving a priori performancedata – the application need not be run before performance datacan be collected [1,29] – they are offset by the complexity ofmodel generation.
How is this data classified? Monitored data is often fixed-scenario – based on a particular run on a particular machine– in contrast, analytical approaches can produce parametricmodels which allow the investigation of performance scenariosthrough extrapolation. Data will also relate to different levels ofabstraction in the system; this may include different applicationsoftware components [34] or different machine instructionbenchmarks [23] for example.
How can this data be used? Once the data has beenobtained it needs to be published. This can be achieved throughinformation services that ensure the shared performance dataremains current amongst the distributed nodes in the system.The delivery of the data via information services allows it tobe used for resource scheduling [7,33], batch queueing [27],resource discovery [10,11] or resource brokerage [8,21]. Thedata might also be used to manage workload from the point ofview of service contracts, deadlines, or other user and systemdefined QoS (Quality of Service) constraints.
What will acting on this data achieve? The provisionof performance information can have a number of benefits:distributed performance services [19] can be built that allowmiddleware to steer tasks to suitable architectures; the QoSdemands of users can be serviced in resource efficient ways; thearchitecture can be configured so that the best use is made of itsresources; the capabilities of the architecture can be extended,and configurations for providing application steering can beimplemented.
This paper addresses these issues in the context ofan application performance prediction environment. ThePerformance Analysis and Characterisation Environment(PACE) [29] developed by the High Performance SystemsGroup at the University of Warwick is a performanceprediction system that provides quantitative data concerning theperformance of (typically scientific) applications running onhigh performance parallel and distributed computing systems.The system works by characterising the application and theunderlying hardware on which the application is to be run, andcombining the resulting models to derive predictive executiondata. PACE provides the capability for the rapid calculationof performance estimates without sacrificing performanceaccuracy. PACE also offers a mechanism for evaluatingperformance scenarios – for example the scaling effect of
increasing the number of processors – and the impact ofmodifying the mapping strategies (of process to processor) andunderlying computational algorithms [12].
The real-time capabilities and parametric prediction func-tions (see Section 2) allow PACE to be used for the provi-sion of dynamic performance information services. These inturn can be used to aid the scheduling of tasks over clustersof homogeneous resources (see Section 3), and provide a ba-sis for the higher-level management of grid system resources(see Section 4). Results (in Section 5) show that employing pre-diction techniques at these two system levels provides an effi-cient framework for the management and distribution of multi-ple tasks in a wide-area, heterogeneous distributed computingenvironment.
2. The PACE toolkit
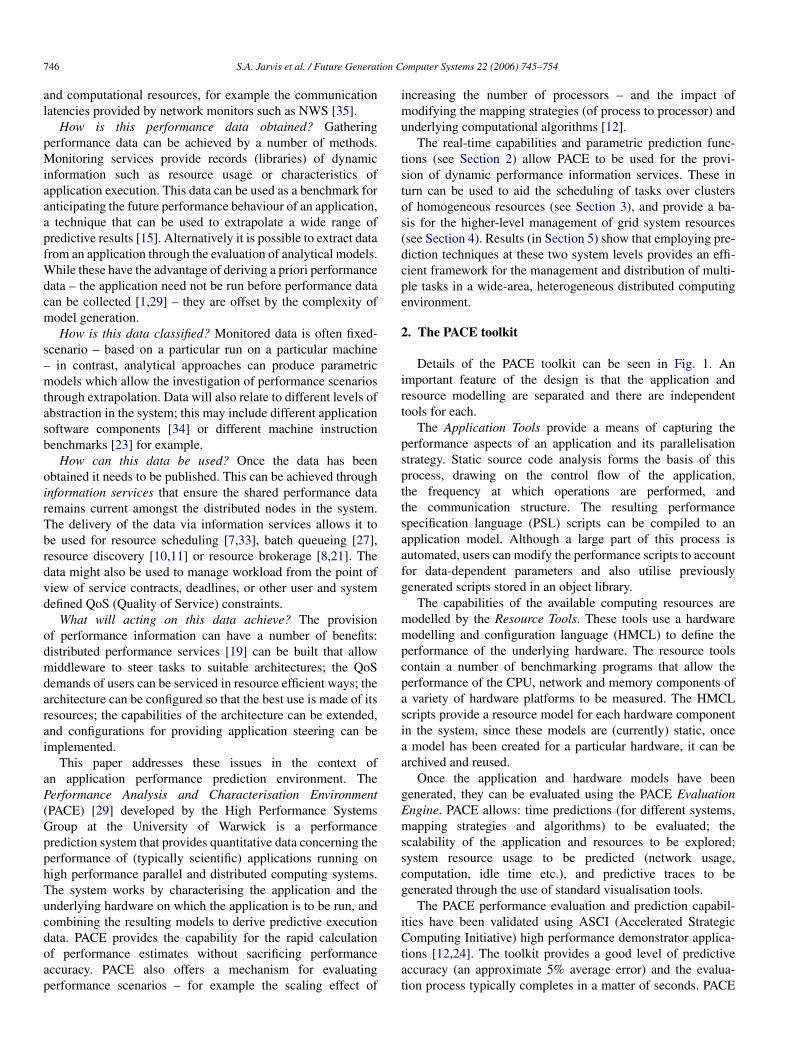
Details of the PACE toolkit can be seen in Fig. 1. Animportant feature of the design is that the application andresource modelling are separated and there are independenttools for each.
The Application Tools provide a means of capturing theperformance aspects of an application and its parallelisationstrategy. Static source code analysis forms the basis of thisprocess, drawing on the control flow of the application,the frequency at which operations are performed, andthe communication structure. The resulting performancespecification language (PSL) scripts can be compiled to anapplication model. Although a large part of this process isautomated, users can modify the performance scripts to accountfor data-dependent parameters and also utilise previouslygenerated scripts stored in an object library.
The capabilities of the available computing resources aremodelled by the Resource Tools. These tools use a hardwaremodelling and configuration language (HMCL) to define theperformance of the underlying hardware. The resource toolscontain a number of benchmarking programs that allow theperformance of the CPU, network and memory components ofa variety of hardware platforms to be measured. The HMCLscripts provide a resource model for each hardware componentin the system, since these models are (currently) static, oncea model has been created for a particular hardware, it can bearchived and reused.
Once the application and hardware models have beengenerated, they can be evaluated using the PACE EvaluationEngine. PACE allows: time predictions (for different systems,mapping strategies and algorithms) to be evaluated; thescalability of the application and resources to be explored;system resource usage to be predicted (network usage,computation, idle time etc.), and predictive traces to begenerated through the use of standard visualisation tools.
The PACE performance evaluation and prediction capabil-ities have been validated using ASCI (Accelerated StrategicComputing Initiative) high performance demonstrator applica-tions [12,24]. The toolkit provides a good level of predictiveaccuracy (an approximate 5% average error) and the evalua-tion process typically completes in a matter of seconds. PACE
S.A. Jarvis et al. / Future Generation Computer Systems 22 (2006) 745–754 747
Fig. 1. An outline of the PACE system including the application and resource modelling components and the parametric evaluation engine which combines the two.
has been used in a number of other high-performance settings;these include the performance optimisation of financial appli-cations [30], real-time performance analysis and applicationsteering [2] and the predictive performance and scalability mod-elling of the application Sweep3D [12].
This work is different from our previous research in thatthe prediction data (from PACE) is integrated in and appliedto a dynamic workload steering environment. To enable suchan application, new techniques have been devised that allowPACE performance data to be generated, published and queriedin real time. This provides the basis for the services documentedin Sections 3 and 4.
This paper also documents two levels of performancemanagement (intra-domain and multi-domain) based onperformance data. These services are supported by abstractand domain views of prediction data provided through anintegration of PACE with the Monitoring and Discovery Service(MDS) [16] from the Globus Toolkit [17].
Finally this paper demonstrates a new mapping betweenPACE prediction data and high-level system metrics, includingaverage system delay, idle time and resource utilisation.
3. Intra-domain management
The management of resources at the intra-domain level isprovided by the combination of a co-scheduler Titan [32] anda standard commodity scheduler (in this case Condor [27],operated in dedicated mode rather than cycle-stealing mode).Titan employs the PACE predictions to manage the incomingtasks and improve resource utilisation by coupling applicationperformance data with a genetic algorithm (GA). The objectiveof the GA is to minimize the run-time of applications, reducethe resource idle time and maintain the service contracts(deadline) of each task. This is achieved by targeting suitable
resources and scaling the applications using the evaluatedperformance models.
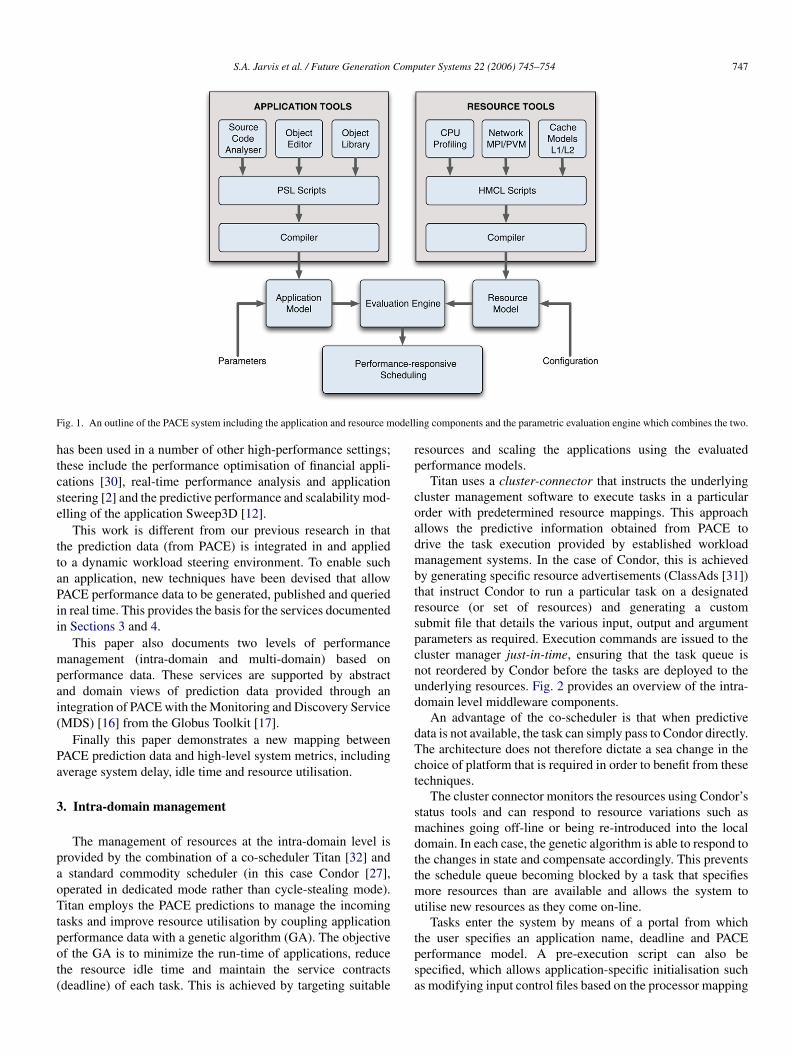
Titan uses a cluster-connector that instructs the underlyingcluster management software to execute tasks in a particularorder with predetermined resource mappings. This approachallows the predictive information obtained from PACE todrive the task execution provided by established workloadmanagement systems. In the case of Condor, this is achievedby generating specific resource advertisements (ClassAds [31])that instruct Condor to run a particular task on a designatedresource (or set of resources) and generating a customsubmit file that details the various input, output and argumentparameters as required. Execution commands are issued to thecluster manager just-in-time, ensuring that the task queue isnot reordered by Condor before the tasks are deployed to theunderlying resources. Fig. 2 provides an overview of the intra-domain level middleware components.
An advantage of the co-scheduler is that when predictivedata is not available, the task can simply pass to Condor directly.The architecture does not therefore dictate a sea change in thechoice of platform that is required in order to benefit from thesetechniques.
The cluster connector monitors the resources using Condor’sstatus tools and can respond to resource variations such asmachines going off-line or being re-introduced into the localdomain. In each case, the genetic algorithm is able to respond tothe changes in state and compensate accordingly. This preventsthe schedule queue becoming blocked by a task that specifiesmore resources than are available and allows the system toutilise new resources as they come on-line.
Tasks enter the system by means of a portal from whichthe user specifies an application name, deadline and PACEperformance model. A pre-execution script can also bespecified, which allows application-specific initialisation suchas modifying input control files based on the processor mapping
748 S.A. Jarvis et al. / Future Generation Computer Systems 22 (2006) 745–754
Fig. 2. Intra-domain level middleware components. Tasks that have associatedperformance data are processed by the Titan co-scheduler. This maps the tasksto the resources before they are finally committed to the physical hardware byCondor.
recommended by Titan, or down-loading appropriate binariesfor the resource type.
Titan combines the PACE application model with thehardware model for a particular resource. The combined modelis evaluated for different processor configurations to obtain ascaling graph for the application on the given resource. Bycomparing the application’s minimum run-time with the run-time of the existing queued tasks, Titan is able to predict whenthe application will complete and can compare this with theuser-specified deadline. If the deadline of the task can be met,the task is submitted to the local queue for processing. If thedeadline cannot be met then Titan will negotiate with otherco-schedulers to determine whether the task request can besatisfied by neighbouring resource domains (see Section 4). Ifit is not possible to meet the deadline, the task is submitted tothe resource that minimises the deadline failure.
When a task is accepted for processing it is placed in Titan’sscheduling queue with the other accepted tasks. The geneticalgorithm works on this queue while the jobs are waiting,exploring task mappings that reduce the makespan (end-to-endrun-time), idle time (locked between processes) and averagedelay (the amount of time tasks complete before or aftertheir deadline). The GA creates multiple scheduling solutions,evaluates these and then rejects unsuccessful schedules whilemaintaining the good schedules for the next generation. Asbetter schedules are discovered, they replace the current bestschedule and the queue is reordered appropriately. Whenresources are free to accept the tasks at the front of the queue,the tasks are despatched by the cluster connector.
On task completion, Titan compares the actual run-time ofthe task against the predicted run-time generated by PACE,feeding back refinements where possible.
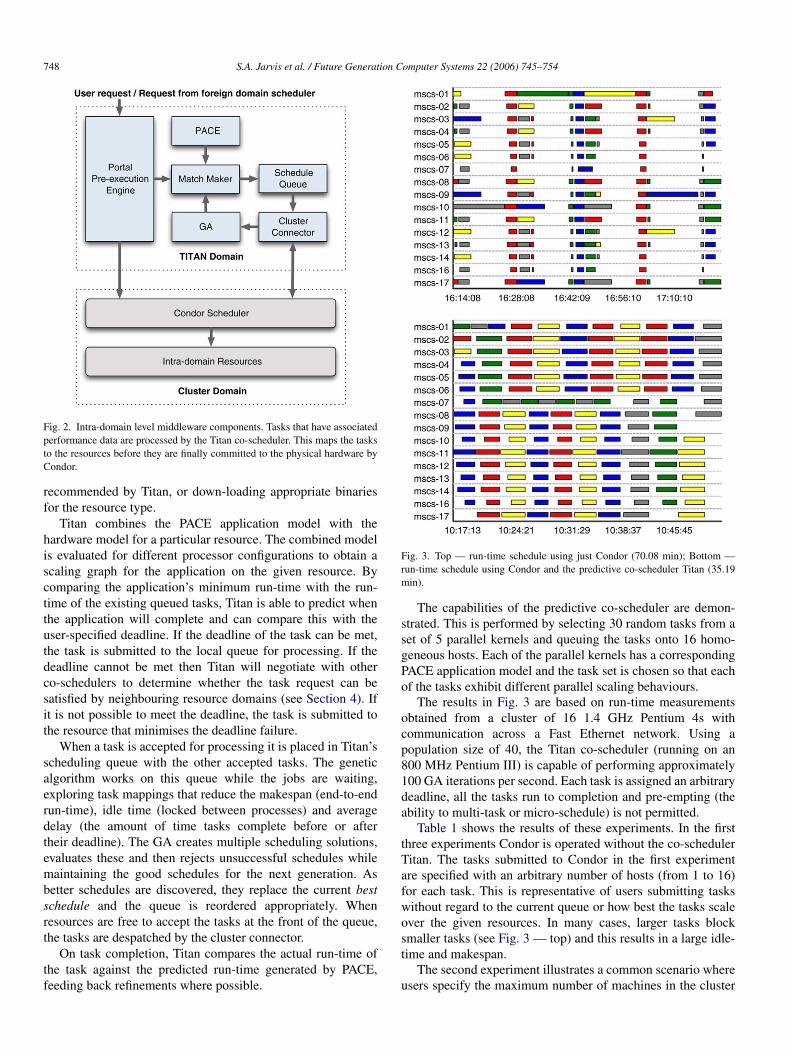
Fig. 3. Top — run-time schedule using just Condor (70.08 min); Bottom —run-time schedule using Condor and the predictive co-scheduler Titan (35.19min).
The capabilities of the predictive co-scheduler are demon-strated. This is performed by selecting 30 random tasks from aset of 5 parallel kernels and queuing the tasks onto 16 homo-geneous hosts. Each of the parallel kernels has a correspondingPACE application model and the task set is chosen so that eachof the tasks exhibit different parallel scaling behaviours.
The results in Fig. 3 are based on run-time measurementsobtained from a cluster of 16 1.4 GHz Pentium 4s withcommunication across a Fast Ethernet network. Using apopulation size of 40, the Titan co-scheduler (running on an800 MHz Pentium III) is capable of performing approximately100 GA iterations per second. Each task is assigned an arbitrarydeadline, all the tasks run to completion and pre-empting (theability to multi-task or micro-schedule) is not permitted.
Table 1 shows the results of these experiments. In the firstthree experiments Condor is operated without the co-schedulerTitan. The tasks submitted to Condor in the first experimentare specified with an arbitrary number of hosts (from 1 to 16)for each task. This is representative of users submitting taskswithout regard to the current queue or how best the tasks scaleover the given resources. In many cases, larger tasks blocksmaller tasks (see Fig. 3 — top) and this results in a large idle-time and makespan.
The second experiment illustrates a common scenario whereusers specify the maximum number of machines in the cluster
S.A. Jarvis et al. / Future Generation Computer Systems 22 (2006) 745–754 749
Table 1Experimental results using Condor and using Condor with the Titan co-scheduler
Experiment Time (min) Idle (%)
CondorArbitrary hosts per task 70.08 61Maximum hosts per task 69.10 28Calculated hosts per task 38.05 14Condor & co-sched. Titan 35.19 21
on which to run their tasks. While in most cases this reduces thesingle-task execution time, the improvement over fewer hostsmay in fact be marginal and blocking is still common (the run-time view is omitted for brevity).
In the third experiment the tasks are submitted with apre-calculated number of hosts. As one would expect, thissignificantly reduces the make-span although it is a schemethat requires a good deal of pre-execution analysis and usercooperation.
In the final experiment, the Titan co-scheduler is usedto dynamically map tasks to resources before the tasks aredeployed to the physical resources by Condor (see Fig. 3 —bottom). Significant improvements are made by searching fora schedule that minimises the makespan, reduces the idle timeand minimises the average delay, in the context of the othertasks that are currently executing on the cluster.
The results in Table 1 demonstrate the improvementsobtained using this predictive co-scheduling technique. Overthe first two experiments the Condor–Titan system effectivelyhalves the makespan (from 70 to 35 min). Even when thebest resource mapping and schedule is pre-calculated by theusers (the third experiment), Condor–Titan still improves themakespan by 8%. These results are significant, but of additionalinterest is the ability of the predictive co-scheduling to self-manage and adapt according to additional quality of servicefeatures (see Section 5).
4. Multi-domain management
To schedule across multiple grid resources with an agreedquality of service, the Titan architecture employs agent brokersthat store and disseminate resource and application data. Wherethe resources reside outside the administrative domain, theagents communicate through existing grid information and taskmanagement services.
Each Titan scheduler is represented by an agent thatpromotes the capabilities of the available resource. The agentreceives additional service information from other local agentsthat is then organised in Agent Capability Tables (ACTs). TheACTs form the basis of a performance information service,which is implemented as a series of Titan-specific informationproviders to the Monitoring and Discovery Service (MDS) [16]from the Globus Toolkit [17].
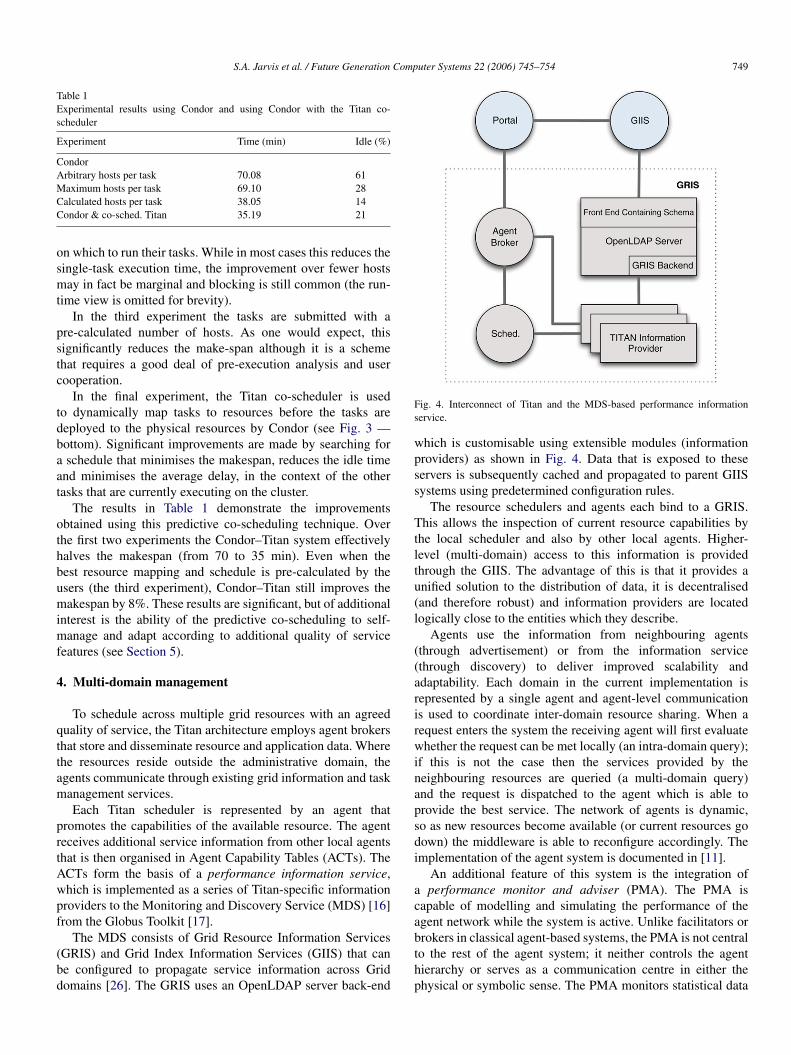
The MDS consists of Grid Resource Information Services(GRIS) and Grid Index Information Services (GIIS) that canbe configured to propagate service information across Griddomains [26]. The GRIS uses an OpenLDAP server back-end
Fig. 4. Interconnect of Titan and the MDS-based performance informationservice.
which is customisable using extensible modules (informationproviders) as shown in Fig. 4. Data that is exposed to theseservers is subsequently cached and propagated to parent GIISsystems using predetermined configuration rules.
The resource schedulers and agents each bind to a GRIS.This allows the inspection of current resource capabilities bythe local scheduler and also by other local agents. Higher-level (multi-domain) access to this information is providedthrough the GIIS. The advantage of this is that it provides aunified solution to the distribution of data, it is decentralised(and therefore robust) and information providers are locatedlogically close to the entities which they describe.
Agents use the information from neighbouring agents(through advertisement) or from the information service(through discovery) to deliver improved scalability andadaptability. Each domain in the current implementation isrepresented by a single agent and agent-level communicationis used to coordinate inter-domain resource sharing. When arequest enters the system the receiving agent will first evaluatewhether the request can be met locally (an intra-domain query);if this is not the case then the services provided by theneighbouring resources are queried (a multi-domain query)and the request is dispatched to the agent which is able toprovide the best service. The network of agents is dynamic,so as new resources become available (or current resources godown) the middleware is able to reconfigure accordingly. Theimplementation of the agent system is documented in [11].
An additional feature of this system is the integration ofa performance monitor and adviser (PMA). The PMA iscapable of modelling and simulating the performance of theagent network while the system is active. Unlike facilitators orbrokers in classical agent-based systems, the PMA is not centralto the rest of the agent system; it neither controls the agenthierarchy or serves as a communication centre in either thephysical or symbolic sense. The PMA monitors statistical data
750 S.A. Jarvis et al. / Future Generation Computer Systems 22 (2006) 745–754
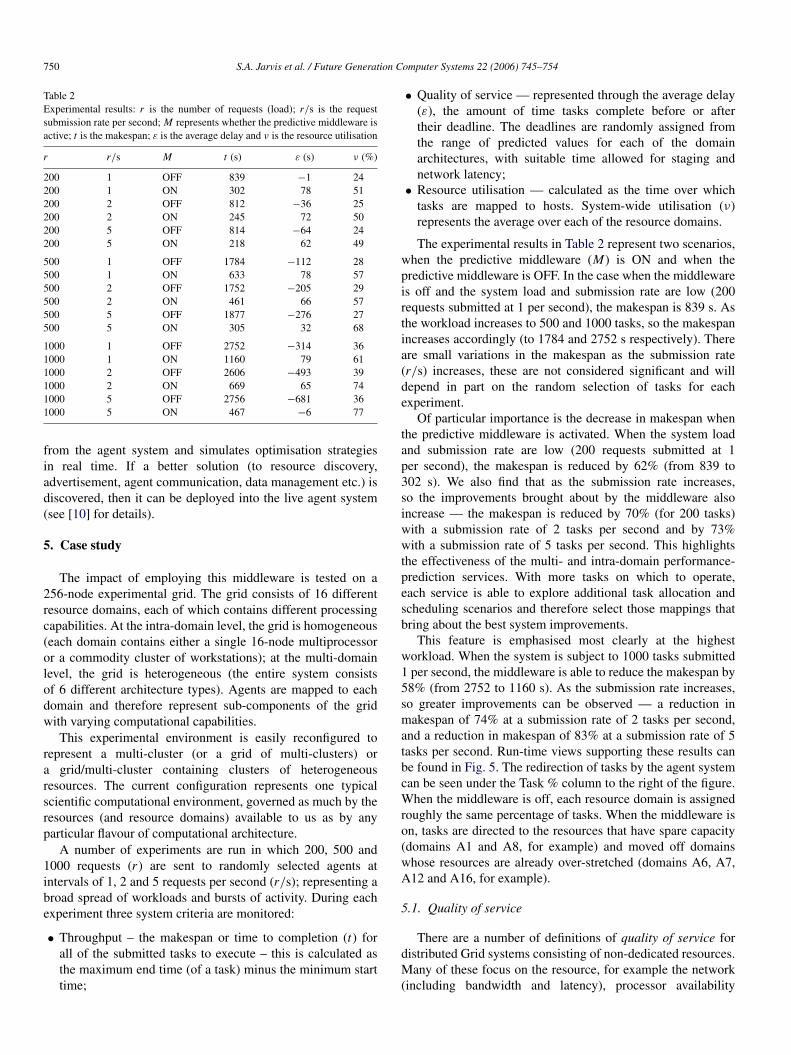
Table 2Experimental results: r is the number of requests (load); r/s is the requestsubmission rate per second; M represents whether the predictive middleware isactive; t is the makespan; ε is the average delay and ν is the resource utilisation
r r/s M t (s) ε (s) ν (%)
200 1 OFF 839 −1 24200 1 ON 302 78 51200 2 OFF 812 −36 25200 2 ON 245 72 50200 5 OFF 814 −64 24200 5 ON 218 62 49
500 1 OFF 1784 −112 28500 1 ON 633 78 57500 2 OFF 1752 −205 29500 2 ON 461 66 57500 5 OFF 1877 −276 27500 5 ON 305 32 68
1000 1 OFF 2752 −314 361000 1 ON 1160 79 611000 2 OFF 2606 −493 391000 2 ON 669 65 741000 5 OFF 2756 −681 361000 5 ON 467 −6 77
from the agent system and simulates optimisation strategiesin real time. If a better solution (to resource discovery,advertisement, agent communication, data management etc.) isdiscovered, then it can be deployed into the live agent system(see [10] for details).
5. Case study
The impact of employing this middleware is tested on a256-node experimental grid. The grid consists of 16 differentresource domains, each of which contains different processingcapabilities. At the intra-domain level, the grid is homogeneous(each domain contains either a single 16-node multiprocessoror a commodity cluster of workstations); at the multi-domainlevel, the grid is heterogeneous (the entire system consistsof 6 different architecture types). Agents are mapped to eachdomain and therefore represent sub-components of the gridwith varying computational capabilities.
This experimental environment is easily reconfigured torepresent a multi-cluster (or a grid of multi-clusters) ora grid/multi-cluster containing clusters of heterogeneousresources. The current configuration represents one typicalscientific computational environment, governed as much by theresources (and resource domains) available to us as by anyparticular flavour of computational architecture.
A number of experiments are run in which 200, 500 and1000 requests (r ) are sent to randomly selected agents atintervals of 1, 2 and 5 requests per second (r/s); representing abroad spread of workloads and bursts of activity. During eachexperiment three system criteria are monitored:
• Throughput – the makespan or time to completion (t) forall of the submitted tasks to execute – this is calculated asthe maximum end time (of a task) minus the minimum starttime;
• Quality of service — represented through the average delay(ε), the amount of time tasks complete before or aftertheir deadline. The deadlines are randomly assigned fromthe range of predicted values for each of the domainarchitectures, with suitable time allowed for staging andnetwork latency;
• Resource utilisation — calculated as the time over whichtasks are mapped to hosts. System-wide utilisation (ν)represents the average over each of the resource domains.
The experimental results in Table 2 represent two scenarios,when the predictive middleware (M) is ON and when thepredictive middleware is OFF. In the case when the middlewareis off and the system load and submission rate are low (200requests submitted at 1 per second), the makespan is 839 s. Asthe workload increases to 500 and 1000 tasks, so the makespanincreases accordingly (to 1784 and 2752 s respectively). Thereare small variations in the makespan as the submission rate(r/s) increases, these are not considered significant and willdepend in part on the random selection of tasks for eachexperiment.
Of particular importance is the decrease in makespan whenthe predictive middleware is activated. When the system loadand submission rate are low (200 requests submitted at 1per second), the makespan is reduced by 62% (from 839 to302 s). We also find that as the submission rate increases,so the improvements brought about by the middleware alsoincrease — the makespan is reduced by 70% (for 200 tasks)with a submission rate of 2 tasks per second and by 73%with a submission rate of 5 tasks per second. This highlightsthe effectiveness of the multi- and intra-domain performance-prediction services. With more tasks on which to operate,each service is able to explore additional task allocation andscheduling scenarios and therefore select those mappings thatbring about the best system improvements.
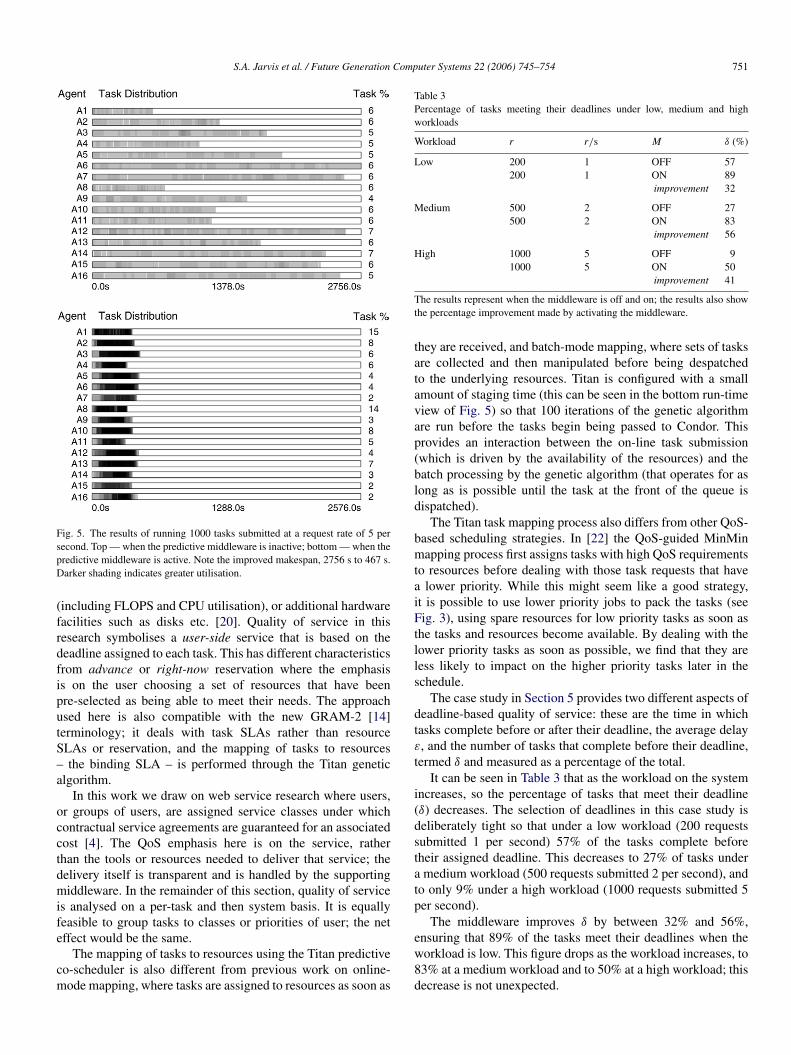
This feature is emphasised most clearly at the highestworkload. When the system is subject to 1000 tasks submitted1 per second, the middleware is able to reduce the makespan by58% (from 2752 to 1160 s). As the submission rate increases,so greater improvements can be observed — a reduction inmakespan of 74% at a submission rate of 2 tasks per second,and a reduction in makespan of 83% at a submission rate of 5tasks per second. Run-time views supporting these results canbe found in Fig. 5. The redirection of tasks by the agent systemcan be seen under the Task % column to the right of the figure.When the middleware is off, each resource domain is assignedroughly the same percentage of tasks. When the middleware ison, tasks are directed to the resources that have spare capacity(domains A1 and A8, for example) and moved off domainswhose resources are already over-stretched (domains A6, A7,A12 and A16, for example).
5.1. Quality of service
There are a number of definitions of quality of service fordistributed Grid systems consisting of non-dedicated resources.Many of these focus on the resource, for example the network(including bandwidth and latency), processor availability
S.A. Jarvis et al. / Future Generation Computer Systems 22 (2006) 745–754 751
Fig. 5. The results of running 1000 tasks submitted at a request rate of 5 persecond. Top — when the predictive middleware is inactive; bottom — when thepredictive middleware is active. Note the improved makespan, 2756 s to 467 s.Darker shading indicates greater utilisation.
(including FLOPS and CPU utilisation), or additional hardwarefacilities such as disks etc. [20]. Quality of service in thisresearch symbolises a user-side service that is based on thedeadline assigned to each task. This has different characteristicsfrom advance or right-now reservation where the emphasisis on the user choosing a set of resources that have beenpre-selected as being able to meet their needs. The approachused here is also compatible with the new GRAM-2 [14]terminology; it deals with task SLAs rather than resourceSLAs or reservation, and the mapping of tasks to resources– the binding SLA – is performed through the Titan geneticalgorithm.
In this work we draw on web service research where users,or groups of users, are assigned service classes under whichcontractual service agreements are guaranteed for an associatedcost [4]. The QoS emphasis here is on the service, ratherthan the tools or resources needed to deliver that service; thedelivery itself is transparent and is handled by the supportingmiddleware. In the remainder of this section, quality of serviceis analysed on a per-task and then system basis. It is equallyfeasible to group tasks to classes or priorities of user; the neteffect would be the same.
The mapping of tasks to resources using the Titan predictiveco-scheduler is also different from previous work on online-mode mapping, where tasks are assigned to resources as soon as
Table 3Percentage of tasks meeting their deadlines under low, medium and highworkloads
Workload r r/s M δ (%)
Low 200 1 OFF 57200 1 ON 89
improvement 32
Medium 500 2 OFF 27500 2 ON 83
improvement 56
High 1000 5 OFF 91000 5 ON 50
improvement 41
The results represent when the middleware is off and on; the results also showthe percentage improvement made by activating the middleware.
they are received, and batch-mode mapping, where sets of tasksare collected and then manipulated before being despatchedto the underlying resources. Titan is configured with a smallamount of staging time (this can be seen in the bottom run-timeview of Fig. 5) so that 100 iterations of the genetic algorithmare run before the tasks begin being passed to Condor. Thisprovides an interaction between the on-line task submission(which is driven by the availability of the resources) and thebatch processing by the genetic algorithm (that operates for aslong as is possible until the task at the front of the queue isdispatched).
The Titan task mapping process also differs from other QoS-based scheduling strategies. In [22] the QoS-guided MinMinmapping process first assigns tasks with high QoS requirementsto resources before dealing with those task requests that havea lower priority. While this might seem like a good strategy,it is possible to use lower priority jobs to pack the tasks (seeFig. 3), using spare resources for low priority tasks as soon asthe tasks and resources become available. By dealing with thelower priority tasks as soon as possible, we find that they areless likely to impact on the higher priority tasks later in theschedule.
The case study in Section 5 provides two different aspects ofdeadline-based quality of service: these are the time in whichtasks complete before or after their deadline, the average delayε, and the number of tasks that complete before their deadline,termed δ and measured as a percentage of the total.
It can be seen in Table 3 that as the workload on the systemincreases, so the percentage of tasks that meet their deadline(δ) decreases. The selection of deadlines in this case study isdeliberately tight so that under a low workload (200 requestssubmitted 1 per second) 57% of the tasks complete beforetheir assigned deadline. This decreases to 27% of tasks undera medium workload (500 requests submitted 2 per second), andto only 9% under a high workload (1000 requests submitted 5per second).
The middleware improves δ by between 32% and 56%,ensuring that 89% of the tasks meet their deadlines when theworkload is low. This figure drops as the workload increases, to83% at a medium workload and to 50% at a high workload; thisdecrease is not unexpected.
752 S.A. Jarvis et al. / Future Generation Computer Systems 22 (2006) 745–754
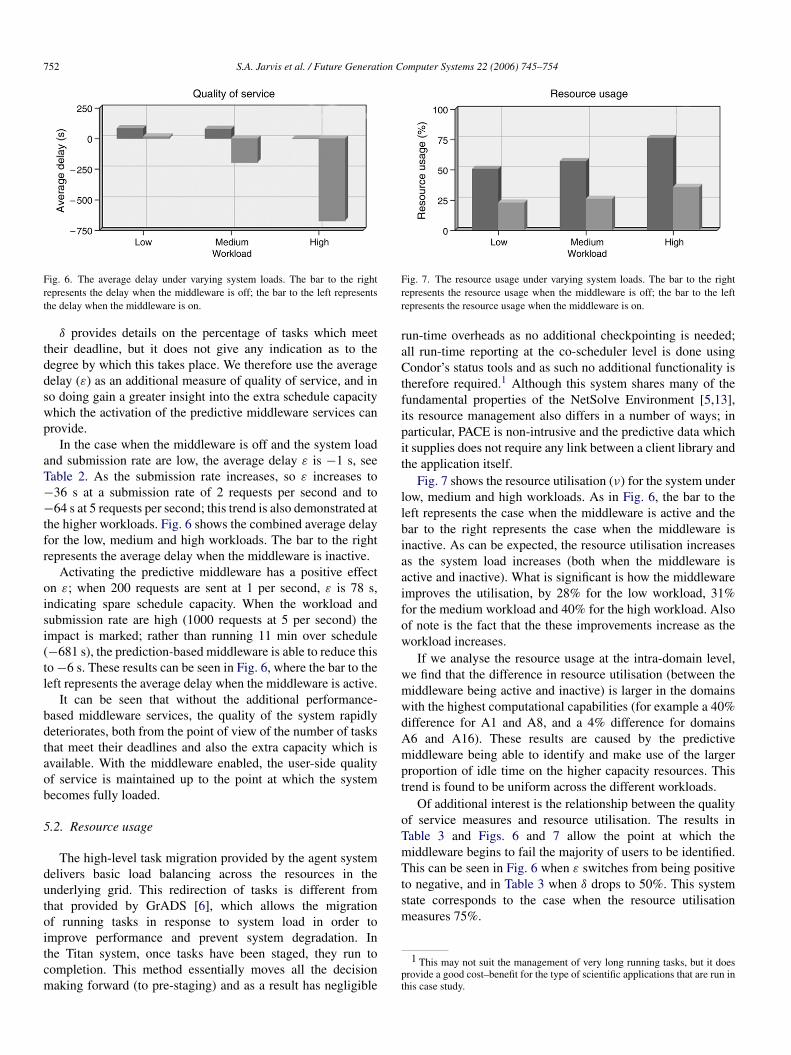
Fig. 6. The average delay under varying system loads. The bar to the rightrepresents the delay when the middleware is off; the bar to the left representsthe delay when the middleware is on.
δ provides details on the percentage of tasks which meettheir deadline, but it does not give any indication as to thedegree by which this takes place. We therefore use the averagedelay (ε) as an additional measure of quality of service, and inso doing gain a greater insight into the extra schedule capacitywhich the activation of the predictive middleware services canprovide.
In the case when the middleware is off and the system loadand submission rate are low, the average delay ε is −1 s, seeTable 2. As the submission rate increases, so ε increases to−36 s at a submission rate of 2 requests per second and to−64 s at 5 requests per second; this trend is also demonstrated atthe higher workloads. Fig. 6 shows the combined average delayfor the low, medium and high workloads. The bar to the rightrepresents the average delay when the middleware is inactive.
Activating the predictive middleware has a positive effecton ε; when 200 requests are sent at 1 per second, ε is 78 s,indicating spare schedule capacity. When the workload andsubmission rate are high (1000 requests at 5 per second) theimpact is marked; rather than running 11 min over schedule(−681 s), the prediction-based middleware is able to reduce thisto −6 s. These results can be seen in Fig. 6, where the bar to theleft represents the average delay when the middleware is active.
It can be seen that without the additional performance-based middleware services, the quality of the system rapidlydeteriorates, both from the point of view of the number of tasksthat meet their deadlines and also the extra capacity which isavailable. With the middleware enabled, the user-side qualityof service is maintained up to the point at which the systembecomes fully loaded.
5.2. Resource usage
The high-level task migration provided by the agent systemdelivers basic load balancing across the resources in theunderlying grid. This redirection of tasks is different fromthat provided by GrADS [6], which allows the migrationof running tasks in response to system load in order toimprove performance and prevent system degradation. Inthe Titan system, once tasks have been staged, they run tocompletion. This method essentially moves all the decisionmaking forward (to pre-staging) and as a result has negligible
Fig. 7. The resource usage under varying system loads. The bar to the rightrepresents the resource usage when the middleware is off; the bar to the leftrepresents the resource usage when the middleware is on.
run-time overheads as no additional checkpointing is needed;all run-time reporting at the co-scheduler level is done usingCondor’s status tools and as such no additional functionality istherefore required.1 Although this system shares many of thefundamental properties of the NetSolve Environment [5,13],its resource management also differs in a number of ways; inparticular, PACE is non-intrusive and the predictive data whichit supplies does not require any link between a client library andthe application itself.
Fig. 7 shows the resource utilisation (ν) for the system underlow, medium and high workloads. As in Fig. 6, the bar to theleft represents the case when the middleware is active and thebar to the right represents the case when the middleware isinactive. As can be expected, the resource utilisation increasesas the system load increases (both when the middleware isactive and inactive). What is significant is how the middlewareimproves the utilisation, by 28% for the low workload, 31%for the medium workload and 40% for the high workload. Alsoof note is the fact that the these improvements increase as theworkload increases.
If we analyse the resource usage at the intra-domain level,we find that the difference in resource utilisation (between themiddleware being active and inactive) is larger in the domainswith the highest computational capabilities (for example a 40%difference for A1 and A8, and a 4% difference for domainsA6 and A16). These results are caused by the predictivemiddleware being able to identify and make use of the largerproportion of idle time on the higher capacity resources. Thistrend is found to be uniform across the different workloads.
Of additional interest is the relationship between the qualityof service measures and resource utilisation. The results inTable 3 and Figs. 6 and 7 allow the point at which themiddleware begins to fail the majority of users to be identified.This can be seen in Fig. 6 when ε switches from being positiveto negative, and in Table 3 when δ drops to 50%. This systemstate corresponds to the case when the resource utilisationmeasures 75%.
1 This may not suit the management of very long running tasks, but it doesprovide a good cost–benefit for the type of scientific applications that are run inthis case study.
S.A. Jarvis et al. / Future Generation Computer Systems 22 (2006) 745–754 753
[
[
[
[
[
[
[
[
[
[
[
[
[
[
[
[
[
[
We are able to choose some combination of these metricsand some suitable thresholds under which to determine whenthe system has reached user-side capacity. This represents thepoint at which we can predict when a task will not meetits deadline, even before the task has been deployed or anyadditional service discovery has been instantiated. Similarly,we can predict what computing reserves are available and knowat which point new facilities will need to be interconnected tomeet the increasing demands on the Grid. These provisioningand capacity planning features may also link with otherautonomic services (e.g. [9]) which are able to determine timeof use meters to reflect variations in price–time processing, andare the subject of future work.
6. Conclusions
Performance-based middleware services are set to play anincreasingly important role in the management of resources anddistributed workloads in emerging wide-area, heterogeneousdistributed computing environments. This paper documentshow such services might be built based on existing Condor- andGlobus-enabled Grid infrastructures.
A local (intra-domain) level predictive co-scheduler isdescribed, which uses performance prediction data generatedby the PACE toolkit to support intra-domain task management.This service is extended to the global (multi-domain) levelthrough an information service based on the Globus MDS. Theglobal middleware uses a peer-to-peer agent system and high-level workload steering strategies to balance system load andimprove system-wide resource utilisation.
The improvements brought about by these performance-based middleware services are significant. At the intra-domainlevel, predictive co-scheduling can halve the makespan of aset of typical scientific tasks running on an Condor cluster.At the multi-domain level, the combination of predictiveco-scheduling and agent-based task migration improves themakepsan by up to 83% in a heavily loaded 256-node Grid.These improvements also manifest themselves in the recordedresource usage and also the associated user-side quality ofservice.
A multi-tiered approach to middleware performance-serviceprovision is likely to prove successful, where improvementsbrought about at a local level can be exploited by cooperativewide-area management tools.
References
[1] V. Adve, R. Bagrodia, J. Browne, E. Deelman et al., Poems: End-to-endperformance design of large parallel adaptive computional systems, IEEETransactions on Software Engineering 26 (11) (2000) 1027–1048.
[2] A. Alkindi, D. Kerbyson, G. Nudd, Optimisation of application executionon dynamic systems, Future Generation Computer Systems 17 (8) (2001)941–949.
[3] R. Allan, J. Brooke, F. Costen, M. Westhead, Grid-based highperformance computing, Technical Report of the UKHEC CollaborationUKHEC (2000), 2000.
[4] J. Aman, C. Eilert, D. Emmes, P. Yacom, D. Dillenberger, Adaptivealgorithms for managing a distributed data processing workload, IBMSystems Journal 36 (2) (1997) 242–283.
[5] D. Arnold, J. Dongarra, The NetSolve environment: processing towardsthe seamless Grid, in: 29th Int. Conference on Parallel Processing, ICPP-2000, 21–24 August 2000, Toronto, Canada, 2000.
[6] F. Berman, A. Chien, K. Cooper, J. Dongarra, I. Foster, D. Gannon, L.Johnsson, K. Kennedy, C. Kesselman, J. Mellor-Crummey, D. Reed, L.Torczon, R. Wolski, The GrADS project: Software support for high-levelgrid application development, International Journal of High PerformanceComputing Applications 15 (4) (2001) 327–344.
[7] F. Berman, R. Wolski, S. Figueira, J. Schopf, G. Shao, Application-level scheduling on distributed heterogeneous networks, in: Proc. ofSupercomputing, 1996.
[8] R. Buyya, D. Abramson, J. Giddy, Nimrod–G resource broker for service-oriented grid computing, IEEE Distributed Systems Online 2 (7) (2001).
[9] R. Buyya, D. Abramson, J. Giddy, H. Stockinger, Economic models forresource management and scheduling in Grid computing, Concurrencyand Computation: Practice and Experience 14 (2002) 1507–1542.
10] J. Cao, S. Jarvis, S. Saini, D. Kerbyson, G. Nudd, ARMS: An agent-basedresource management system for grid computing, Scientific Programming10 (2) (2002) 135–148.
11] J. Cao, D. Kerbyson, G. Nudd, High performance service discovery inlarge-scale multi-agent and mobile-agent systems, International Journalof Software Engineering and Knowledge Engineering 11 (5) (2001)621–641.
12] J. Cao, D. Kerbyson, E. Papaefstathiou, G. Nudd, Performance modellingof parallel and distributed computing using PACE, in: 19th IEEE Int.Performance, Computing and Communication Conference, IPCCC’00,2000, pp. 485–492.
13] H. Casanova, J. Dongarra, NetSolve: A network server for solvingcomputational science problems, International Journal of SupercomputerApplications and High Performance Computing 11 (3) (1997) 212–223.
14] K. Czajkowski, GT resource management and scheduling: The globusperspective, in: GlobusWorld 2003, 13–17 January 2003, San Diego, CA,USA, 2003.
15] P. Dinda, Online prediction of the running time of tasks, ClusterComputing 5 (3) (2002) 225–236.
16] S. Fitzgerald, I. Foster, C. Kesselman, Grid information servicesfor distributed resource sharing, in: 10th Int. Symposium on HighPerformance Distributed Computing, HPDC-10 ’01, 2001.
17] I. Foster, C. Kesselman, Globus: A metacomputing infrastructure toolkit,International Journal of Supercomputer Applications 11 (2) (1997)115–128.
18] I. Foster, C. Kesselman, The GRID: Blueprint for a New ComputingInfrastructure, Morgan-Kaufmann, 1998.
19] I. Foster, C. Kesselman, J. Nick, S. Tuecke, Grid services for distributedsystem integration, IEEE Computer 35 (6) (2002) 37–46.
20] I. Foster, A. Roy, V. Sander, A quality of service architecture thatcombines resource reservation and application adaption, in: Proceedingsof 8th Int. Workshop on Quality of Service, 5–7 June 2000, Pittsburgh,PA, USA, 2000, pp. 181–188.
21] J. Frey, T. Tannenbaum, I. Foster, M. Livny, S. Tuecke, Condor-G: Acomputation management agent for multi-institutional grids, in: Proc. ofthe 10th IEEE Sym. on High Performance Distributed Computing, 2001.
22] X. He, X. Sun, G. Laszewski, A QoS guided scheduling algorithm forgrid computing, in: Int. Workshop on Grid and Cooperative Computing,GCC02, Hainan, China, 2002.
23] C. Herder, J. Dujmovic, Frequency analysis and timing of Java bytecodes,San Francisco State University Technical Report, SFSU-CS-TR-00.02,2000.
24] D. Kerbyson, H. Alme, A. Hoisie, F. Petrini, H. Wasserman, M.Gittings, Predictive performance and scalability modelling of a large-scaleapplication, in: Supercomputing’01, 2001.
25] W. Leinberger, V. Kumar, Information power grid: The new frontier inparallel computing? IEEE Concurrency 7 (4) (1999).
26] H. Lim Choi Keung, J. Dyson, S. Jarvis, G. Nudd, Performance evaluationof a grid resource monitoring and discovery service, IEE Proceedings-Software 150 (4) (2003).
27] M. Litzkow, M. Livny, M. Mutka, Condor — a hunter of idle workstations,in: 8th International Conference on Distributed Computing Systems,ICDCS’88, 1988, pp. 104–111.

754 S.A. Jarvis et al. / Future Generation Computer Systems 22 (2006) 745–754
[28] W. McColl, Foundations of time-critical computing, in: 15th IFIP WorldComputer Congress, Vienna and Budapest, 1998.
[29] G. Nudd, D. Kerbyson, E. Papaefstathiou, S. Perry, J. Harper, D.Wilcox, PACE: A toolset for the performance prediction of paralleland distributed systems, International Journal of High PerformanceComputing Applications 14 (3) (2000) 228–251.
[30] S. Perry, R. Grimwood, D. Kerbyson, E. Papaefstathiou, G. Nudd,Performance optimisation of financial option calculations, ParallelComputing 26 (5) (2000) 623–639.
[31] R. Raman, M. Livny, M. Solomon, Matchmaking: Distributed resourcemanagement for high throughput computing, in: 7th Int. Symposium onHigh Performance Distributed Computing, HPDC-7’98, 1998.
[32] D. Spooner, S. Jarvis, J. Cao, S. Saini, G. Nudd, Local grid schedulingtechniques using performance prediction, IEE Proceedings-Computersand Digital Techniques 150 (2) (2003) 87–96.
[33] A. Takefusa, S. Matsuoka, H. Nakada, K. Aida, U. Nagashima, Overviewof a performance evaluation system for global computing schedulingalgorithms, in: Proc. of 8th IEEE Int. Symp. on High PerformanceDistributed Computing, 1999, pp. 97–104.
[34] J. Turner, D. Spooner, J. Cao, S. Jarvis, D. Dillenberger, G.Nudd, A transaction definition language for Java application responsemeasurement, Journal of Computer Resource Measurement 105 (2001)55–65.
[35] R. Wolski, N. Spring, J. Haye, The network weather service: A distributedresource performance forecasting service for metacomputing, FutureGeneration Computer Systems 5–6 (1999) 757–768.
Stephen A. Jarvis is a senior lecturer in the HighPerformance Systems Group at the University ofWarwick. He has authored more than 90 refereedpublications (including three books) in the areaof software and performance evaluation. Whilepreviously at the Oxford University ComputingLaboratory, he worked on the development ofperformance tools with Oxford Parallel, Sychron Ltd.,and Microsoft Research in Cambridge. He has close
research ties with IBM, including current projects with IBM T. J. WatsonResearch Centre in New York and with IBM Hursley Park in the UK.Additional collaborative projects include those with BT at Martlesham Heath,Hewlett Packard Research Laboratories in Bristol and Palo Alto, and withthe UK National Business to Business Centre. Dr Jarvis sits on a numberof international program committees for high-performance computing, he ismanager of the Midlands e-Science Technical Forum on Grid Technologies,and elected member of the EPSRC Review College.
Daniel P. Spooner is a lecturer in the Departmentof Computer Science at the University of Warwickand member of the High Performance SystemsGroup. His primary research interests are in theapplication of prediction techniques to improveresource scheduling in grid environments. Otherinterests include distributed network managementarchitectures and high performance web services.
Helene N. Lim Choi Keung is in the latter stagesof her Ph.D. studies at the Department of ComputerScience, University of Warwick. She received aB.Sc. in Computing Science from Aston University,Birmingham, and also worked as an e-BusinessResearch Engineer at the International AutomotiveResearch Centre, Warwick Manufacturing Group. Hercurrent research interests are in distributed and Gridcomputing, with an emphasis on resource monitoring,
selection, autonomous systems, and performance evaluation and prediction.
Junwei Cao is currently a Research Scientist at theCenter for Space Research, Massachusetts Instituteof Technology, USA. He has been working ongrid infrastructure implementation and grid-enabledapplication development since 1999. Before joiningMIT in 2004, Dr. Cao was a research staff memberof C&C Research Laboratories, NEC Europe Ltd.,Germany. He received his Ph.D. in Computer Sciencein 2001 from the University of Warwick, UK and
M.Sc. in 1998 from Tsinghua University, China, respectively. He is a memberof the IEEE Computer Society and the ACM.
Subhash Saini received his Ph.D. from the Universityof Southern California and has held positions atUniversity of California at Los Angeles (UCLA),University of California at Berkeley (UCB), andLawrence Livermore National Laboratory (LLNL). Hehas 11 years experience of teaching Physics at B.S. andM.S. level. Since 1989, he is a senior scientist at theNASA Advanced Supercomputing (NAS) program atNASA Ames Research Center. He is a senior visiting
scientist at LLNL under a participating guest program. He has been a highlyrated tutorial speaker at SC 92, SC ’94, SC ’95, SC ’96, SC ’97 and SC ’98. HisSC ’94, SC ’95, SC ’96, SC ’97 and SC ’2004 tutorials on high end computingdrew the highest number of attendees in any of the pre-conference tutorials.His research interests involves performance evaluation and modelling of newgeneration of CMOS based processors and highly parallel computers includingnext generation of petaflop class computers. He has published 127 technicalpapers and presented over 200 technical talks. He has won several awards forExcellence in Teaching including one from USC. In 1992, he was named theNAS employee of the year. In 2001, he was a co-author of a Best TechnicalPaper Award at SC 2001.
Graham R. Nudd is Head of the High PerformanceComputing Group and Chairman of the ComputerScience Department at the University of Warwick. Hisprimary research interests are in the management andapplication of distributed computing. Prior to joiningWarwick in 1984, he was employed at the HughesResearch Laboratories in Malibu, California.