performance of east/west plane booster mirror
TRANSCRIPT

Pergamon Energy Convers. Mgmt Vol. 35, No. 6, pp. 543-554, 1994
Copyright (~:) 1994 Elsevier Science Ltd Printed in Great Britain. All rights reserved
0196-8904/94 $7.00 + 0.00
PERFORMANCE OF EAST/WEST PLANE BOOSTER MIRROR
A. V. NARASIMHA RAO, t S. SUBRAMANYAM 2 and T. L. S I T H A R A M A R A O I
IDepartment o f Mechanical Engineering, Regional Engineering College, Warangal-506 004 and -~Department of Civil Engineering, Kakat iya Institute of Technology and Science, Warangal-506 015, India
(Received 9 September 1992; received for publication 11 October 1993)
Abst rac t - -A detailed analysis of the energy contribution by the east/west booster mirror on a horizontal receiver is presented in this paper. The east/west mirror is known to make the energy flux distribution flatter in a day. A quantitative analysis of the degree of flatness of the energy flux distribution due to the east/west mirror, on the basis of flux ratio, is made. It is observed that the energy enhancement factor or boost factor due to the east/west mirror is significant all through the year. These factors make the east/west mirror more attractive in photo-voltaic power generation applications. An algorithm based on a vectorial approach and the laws of reflection developed by the authors is used in the present analysis.
East/west booster mirror Opt imum mirror angle Energy flux ratio Boost factor
N O M E N C L A T U R E
AF = Area of receiver illuminated by mirror (m 2) AI = Area of receiver illuminated directly by sun's rays (m 2) BF = Boost factor C R = Concentration ratio
E = Energy flux collected by receiver (W/m 2) EL = Elevation o f place (m)
EWM = East/west mirror EFM = East facing mirror
F R = Energy flux ratio G = Intensity of solar radiation (W/m 2)
G~ = Solar constant (1353 W/m 2) HM = Height of mirror (m)
LAT = Local apparent time (h) LR = Length of receiver (m)
W R = Width of receiver (m)
Greek symbols
ct = Altitude (°) /~ = Mirror angle (°) 6 = Declination (°) 7 = Azimuth (°) 0 = Angle of incidence of incident sun rays on receiver (°)
= Angle of rotation of receiver (°) p = Reflectivity of mirror
= Transmit tance = Latitude of place (°)
;~ = Angle of incidence of reflected ray on receiver (~) @ = Angle of incidence of sun rays on mirror (°) to = Hour angle (°)
Superscript and subscripts ° = Degrees d = Device h = Horizontal surface 1 = Incident radiation
max = Maximum noon = Noon value
opt = Opt imum value R = Reflected radiation r = Reflected ray S = Sun
T = Total radiation
543
544 RAO e t al.: PERFORMANCE OF EAST/WEST PLANE BOOSTER MIRROR
INTRODUCTION
An east/west mirror exhibits an interesting characteristic. Apart from providing a boost to the incident flux, it tends to flatten the distribution of total flux with respect to time, i.e. the shape of the distribution curve is transformed from its characteristic bell shape to one closely approximating a rectangle. In evaluating the performance of energy systems, a term usually known as fill factor is used. The east/west mirror tends to improve the fill factor of a horizontal solar device. One of the serious defects of solar energy devices is that full capacity/output is manifest only for a short time (around noon), and the rest of the time they work at levels below their full potential. In other words, the fill factor is rather small. The east/west mirror tends to increase the fill factor and make the devices more akin to constant output devices.
Though the idea of such mirrors appears to have been appreciated earlier, it was Tabor [1] who first unravelled these characteristic features. He also identified the essential feature of noon reversal of the mirror position. However, no quantitative results were given. Such a reversal is a requirement which makes the east/west mirror feasible. The contribution of plane mirrors in the process of boosting energy flux has been investigated by many investigators [2-18]. Most of such work has been confined to south facing (top end) mirrors. Tabor's work apart, little attention seems to have been bestowed on east/west booster mirrors.
ALGORITHM
A generalized algorithm, based on vector algebra, has been developed to assess the solar energy contribution of mirrors [19]. The algorithm is capable of determining the aperture area illuminated by the mirror as well as identifying the cases of shadows cast by the mirrors.
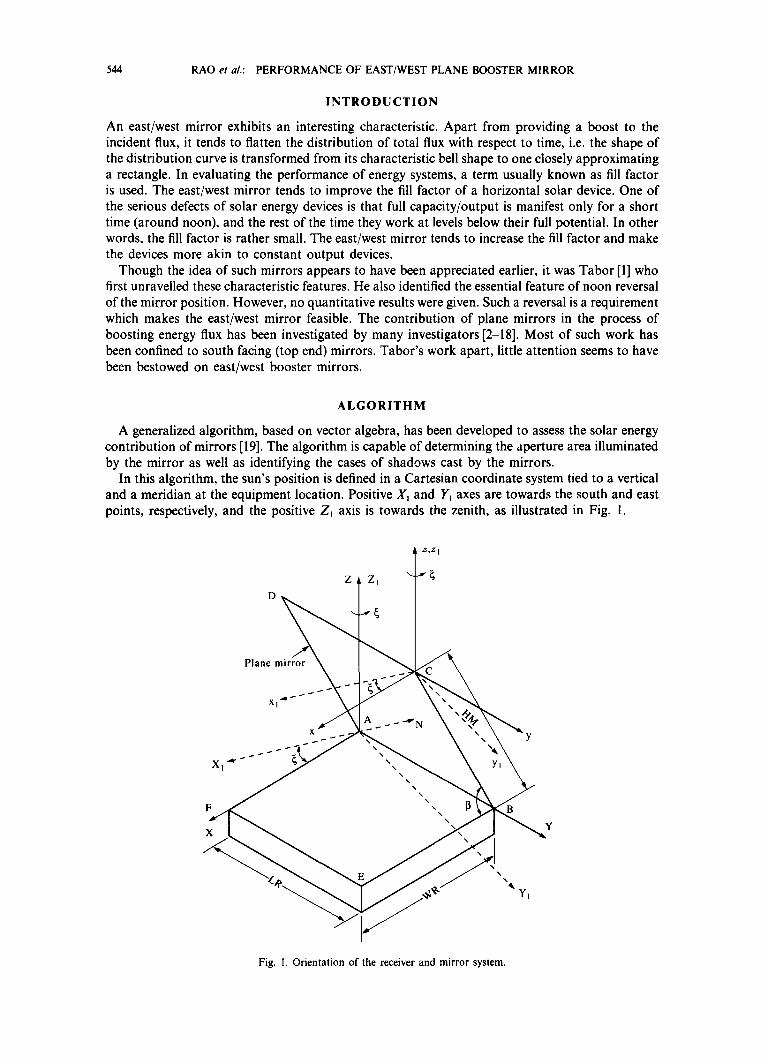
In this algorithm, the sun's position is defined in a Cartesian coordinate system tied to a vertical and a meridian at the equipment location. Positive X~ and Yt axes are towards the south and east points, respectively, and the positive Z~ axis is towards the zenith, as illustrated in Fig. 1.
z S ,
Plane mirror
X I . a l
X
.~v 1 " 4 " ~ ~ - ~
A ~ ~ ~ ~ " " ~ N
N \
\ \
\ \
% \
Y
\ \
YI
Fig. I. Orientation of the receiver and mirror system.
RAO et al.: PERFORMANCE OF EAST/WEST PLANE BOOSTER MIRROR 545
The provision of rotation about the ZI axis (designated by ~ ) provides the required flexibility in the computations. Anticlockwise rotations of ~ are positive, and the direction of the south point is the reference. Accordingly, the south, east and north facing mirrors have values ~ = 0, 90 and 180 °, respectively.
O R I E N T A T I O N OF R E C E I V E R - M I R R O R S Y S T E M
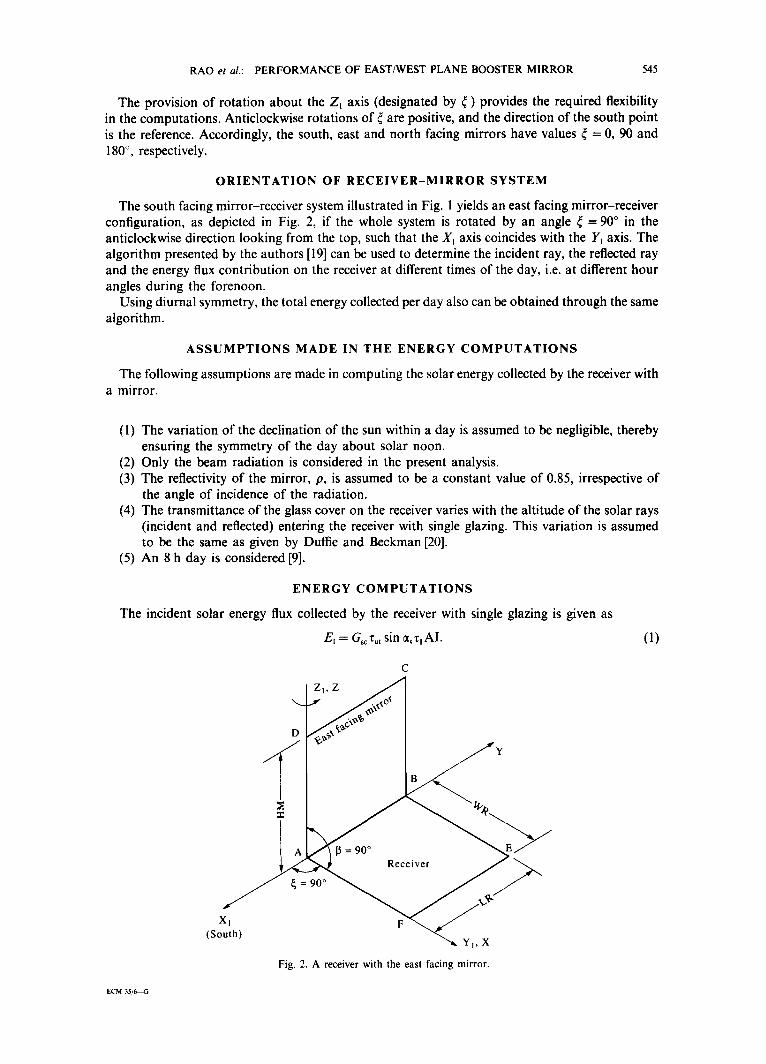
The south facing mirror-receiver system illustrated in Fig. 1 yields an east facing mirror-receiver configuration, as depicted in Fig. 2, if the whole system is rotated by an angle ¢ = 90 ° in the anticlockwise direction looking from the top, such that the X~ axis coincides with the Y~ axis. The algorithm presented by the authors [19] can be used to determine the incident ray, the reflected ray and the energy flux contribution on the receiver at different times of the day, i.e. at different hour angles during the forenoon.
Using diurnal symmetry, the total energy collected per day also can be obtained through the same algorithm.
A S S U M P T I O N S M A D E IN T H E E N E R G Y C O M P U T A T I O N S
The following assumptions are made in computing the solar energy collected by the receiver with a mirror.
(1) The variation of the declination of the sun within a day is assumed to be negligible, thereby ensuring the symmetry of the day about solar noon.
(2) Only the beam radiation is considered in the present analysis. (3) The reflectivity of the mirror, p, is assumed to be a constant value of 0.85, irrespective of
the angle of incidence of the radiation. (4) The transmittance of the glass cover on the receiver varies with the altitude of the solar rays
(incident and reflected) entering the receiver with single glazing. This variation is assumed to be the same as given by Duffie and Beckman [20].
(5) An 8 h day is considered [9].
ENERGY C O M P U T A T I O N S
The incident solar energy flux collected by the receiver with single glazing is given as
E~ = Gsczat sin ~:lAI. (l)
c
I Z,, z J
D ~ L ~ ~¢:x~x~"
/
~ _ ~ ~ e ~ ~
x, (South) ~ YI, X
Fig. 2. A receiver with the east facing mirror.
ECM 35,~43
546 RAO et al.: PERFORMANCE OF EAST/WEST PLANE BOOSTER MIRROR
The solar energy reflected by the east/west mirror and collected by the receiver can be expressed as:
E R = Gsczat COS I]/p0tr't'R A F . (2)
The atmospheric transmittance, rat, in the above equations is obtained by using Hottel's model of clear sky atmospheric transmittance[21]. The parameters, such as ors--altitude of the sun, err--altitude of the reflected ray, C-- the angle of incidence of the sun's rays on the mirror surface, etc. can be computed by the methods indicated in the authors' work [19]. Then, the total energy flux collected by the receiver is the sum of the energy flux incident directly on the receiver and that reflected by the mirror. The total energy flux can be expressed as:
Ex = El + ER. (3)
The energy flux concentration ratio at any instant of time can be expressed as:
CR = Ex /E, = 1 + (ER/E,). (4)
The flux ratio, FR, is the ratio of the energy flux on the receiver at any given instant to that at solar noon and is given by the equation:
FR = ET (at any instant)/ET (at noon). (5)
The energy boost factor, BF, is the ratio of the total energy collected by the receiver with mirror over a day to that collected by a plane receiver. The energy boost factor can be expressed as
B F - energy collected by the receiver-mirror system over a day/energy collected by the plane receiver over a day. (6)
O P T I M U M M I R R O R ANGLE
The angle fl (between the receiver and the mirror) has to be selected. The value of 13, which maximizes the day long energy collection, is considered as the best value if maximization of energy flux is the criterion. The optimal value of/3 is derived by the following procedure. An initial value of/3 = 90 ° (according to Tabor) is chosen. Values of/3, varying in an interval of 5 ° in the range from 60 to 120 °, are chosen. For these values, the total energy collected by the system is computed. The noon reversal of mirror position is a part of the procedure. The values of total energy are plotted against 13, and from this curve, the best value of/3 is determined.
The exercise is carried out for the five selected days of a year and for locations at various latitudes between 0 and 40°N.
RESULTS AND DISCUSSION
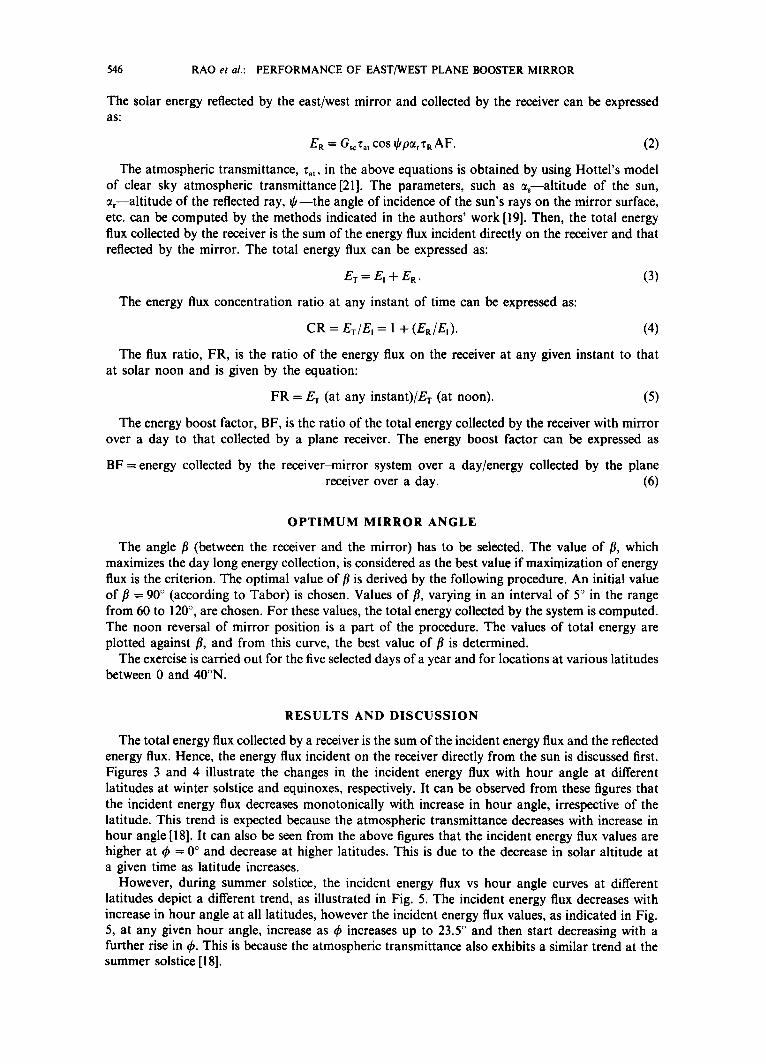
The total energy flux collected by a receiver is the sum of the incident energy flux and the reflected energy flux. Hence, the energy flux incident on the receiver directly from the sun is discussed first. Figures 3 and 4 illustrate the changes in the incident energy flux with hour angle at different latitudes at winter solstice and equinoxes, respectively. It can be observed from these figures that the incident energy flux decreases monotonically with increase in hour angle, irrespective of the latitude. This trend is expected because the atmospheric transmittance decreases with increase in hour angle [18]. It can also be seen from the above figures that the incident energy flux values are higher at ~ = 0 ° and decrease at higher latitudes. This is due to the decrease in solar altitude at a given time as latitude increases.
However, during summer solstice, the incident energy flux vs hour angle curves at different latitudes depict a different trend, as illustrated in Fig. 5. The incident energy flux decreases with increase in hour angle at all latitudes, however the incident energy flux values, as indicated in Fig. 5, at any given hour angle, increase as ~ increases up to 23.5 ° and then start decreasing with a further rise in ~. This is because the atmospheric transmittance also exhibits a similar trend at the summer solstice [i 8].

R A O et al.: P E R F O R M A N C E O F E A S T / W E S T P L A N E B O O S T E R M I R R O R
800 r - Winter so l s t i ce (8 = - 2 3 . 4 5 °)
547
700
600
- 500
~. 400
i .
300
2 0 0
'0°
100
0 I I I I ~ "
0 o 15 ° 30 ° 45 °
Hour angle , to
F i g . 3. Incident energy flux at winter solstice.
60 °
Figure 6 illustrates the changes in total energy collected per day with different values of mirror angle/~ at three different latitudes for three specific days. Perusal of the curves indicates that the energy collected is not very sensitive to the changes in /L particularly at winter solstice (6 = -23.45°). One can easily obtain the optimum angle for a given latitude from the total energy flux vs mirror angle curves depicted in Fig. 6.
The east/west mirror system does not imply that two mirrors, respectively facing east and west are used; for such usage will cause undesirable shadows on the receiver by the non-functional
800 7 - E q u i n o x e s (8 = 0 ° )
700
&'-- 600
- 500
400
300
200
I00
O0o
40 °
0 i 0 o
I I I 15 ° 30 ° 45 °
Hour angle , ¢o
F ig . 4. Incident energy flux at equinox,
I 60 °

548 R A O e t al.: P E R F O R M A N C E O F E A S T / W E S T P L A N E B O O S T E R M I R R O R
800 - -
700
600 eq
E
~- 500
400
o t -
~ 300 r -
~ 200
100
S u m m e r s o l s t i c e (8 = 2 3 . 4 5 °)
0 I I I I 0 ° 15 ° 30 ° 45 ° 60 °
H o u r a n g l e , (0
F ig . 5. I n c i d e n t e n e r g y f lux a t s u m m e r sols t ice .
mirror. Only one mirror is used, and by use of a simple half rotation, the east facing mirror is made to face the west after transit of the sun. This was suggested by Tabor [1]. As the energy collection in this case is not very sensitive to mirror angle (see Fig. 6), unlike in south and north facing mirrors [18], the east/west mirror is oriented with fl = 90 °, and this is convenient from a practical point of view. Hence, further discussion on east/west performance is confined to a mirror angle ofg0 ° only.
Figure 7(a) illustrates the changes in reflected and total energy with hour angle at winter solstice. The reflected energy, at any given latitude, increases gradually up to to = 45 ° and then decreases.
8 - E a s t - W e s t m i r r o r
~ = 0 °
- - x - $ = 23.5°N
7 - - -0-- t~ = 40°N
,~ 6 - ~ x ~ x - X ~ x 8 = 23.45 °
= 23.45 o
& 23.45 °
4 -
= ~ o - - - - - - . o . _ _ _
~ 3 ~ x - - X ~ x ~ x x'-'-----x 8 = -23 .45 °
2 O F-
I . - - - - - - O ~ O O ~- 0 8 = -23 .45 °
0 I L L I I I 75 ° 80 ° 85 ° 90 ° 95 ° 100 ° 105 °
M i r r o r a n g l e , ~l
F ig . 6. Effect o f m i r r o r a n g l e o f E W M o n the t o t a l ene rgy co l l ec t ion .

R A O et al.: P E R F O R M A N C E O F E A S T / W E S T P L A N E B O O S T E R M I R R O R 549
( a )
E F M , ~ = 9 0 °
W i n t e r s o l s t i c e ( 5 = - 2 3 . 4 5 ° )
800 Total ene rgy flux [ - - - Ref lec ted energy flux
700 I-- 0 = 0 °
6 0 0 ~ _ . _ _ . ~ O°
500
400
300
200
100
0 i - 0 o
¢ = 2 0 °
0 = 3 0 °
¢ = 4 0 °
15 ° 30 ° 45 °
H o u r a n g l e , to
~ ¢ = 0 ° Q ¢ = ! 0 o
' :~0 = 23.5 °
¢ = 4 0 ° 60 °
E
( b )
900 -
800 - -
700 - -
600 --
500
400
300
200
100
0 0 o
(c) E F M , 13 = 9 0 °
E q u i n o x e s (5 = 0 ° ) 900 Total ene rgy flux
- - - Ref lec ted energy flux
0 = O° 800
¢ = 10 °
9 = 2 3 ' 5 ° 700
9 = 30 °
600
¢ = 4 0 °
500
-- ~ 400
- - 300
2OO -." - L - - - - - - - - ¢ = 1°°
///," , . t . . - " - , ' 0 = 2 3 . 5 ° _ z / / . . t t " ~ . . . . _ "¢=30 °
z ~ L ~ "¢ = 4 0 °
_ . ~ t t * ~ l I I I 15 ° 30 ° 45 ° 60 °
E F M , 13 = 9 0 °
S u m m e r s o l s t i c e , 8 = + 2 3 . 4 5 °
I Total ene rgy flux - - - Ref lected ene rgy flux
- ~ 10°
, = 3 0 ° 0 o
- °
¢ = 4 0 \ . ' d ¢ " " " " - o _ \ ~-/ ~ 3 0
~ _ ~ - - - -. " 2 3 . 5 °
. ~ / - L - - - - "-lO °
, o 0 - . : . - . - - 0 o
o - - ,"~-J ~1 I 0 ° 15 ° 30 °
I I 45 ° 60 °
H o u r a n g l e , to H o u r a n g l e , to
Fig. 7. E n e r g y flux co l lec ted by t he r ece ive r w i th the E F M a t (a) w i n t e r solst ice; (b) e q u i n o x ; (c) s u m m e r solst ice.
550 RAO et al.: P E R F O R M A N C E OF EAST/WEST PLANE BOOSTER M I R R O R
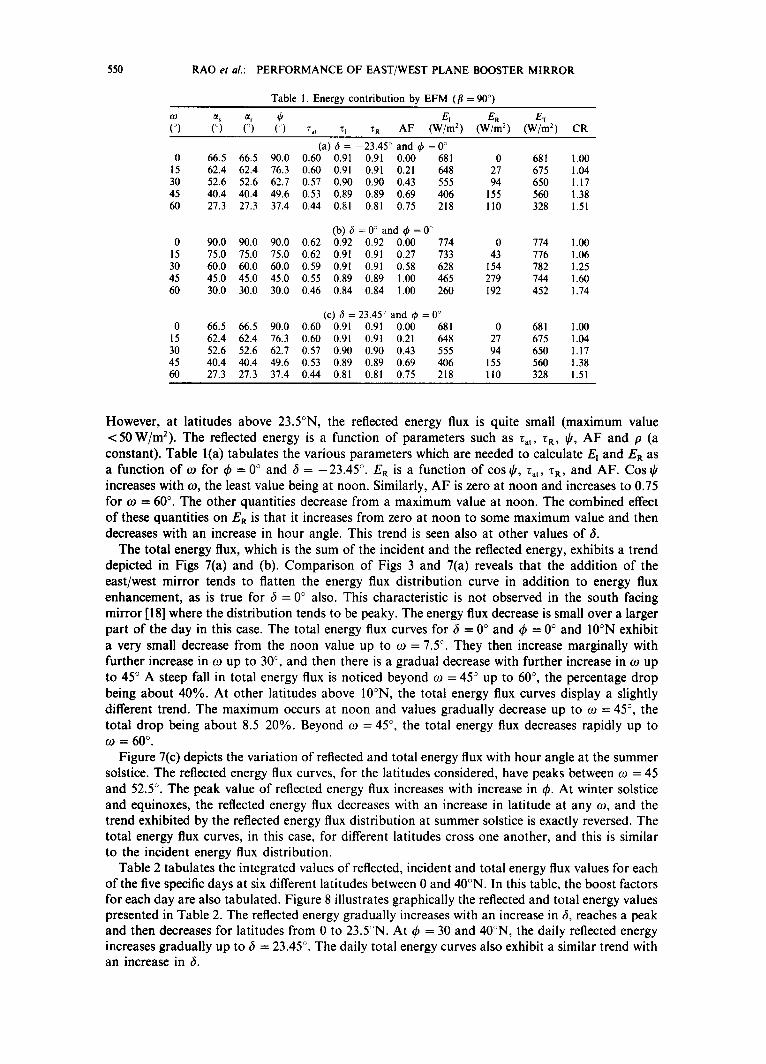
Table I. Energy contribution by EFM (fl = 90 °)
tO ~s ~r ~ El ER ET (o) (o) (~) (/) ra t TI ~'R AF (W/m 2) (W/m 2) (W/m 2) CR
(a) 6 = -23 .45 ° and ~b = 0 ° 0 66.5 66.5 90.0 0.60 0.91 0.91 0.00 681 0 681 1.00
15 62.4 62.4 76.3 0.60 0.91 0.91 0.21 648 27 675 1.04 30 52.6 52.6 62.7 0.57 0.90 0.90 0.43 555 94 650 1.17 45 40.4 40.4 49.6 0.53 0.89 0.89 0.69 406 155 560 1.38 60 27.3 27.3 37.4 0.44 0.81 0.81 0.75 218 110 328 1.51
(b) 6 = O: and ~b = 0 ° 0 90.0 90.0 90.0 0.62 0.92 0.92 0.00 774 0 774 1.00
15 75.0 75.0 75.0 0.62 0.91 0.91 0.27 733 43 776 1.06 30 60.0 60.0 60.0 0.59 0.91 0.91 0.58 628 154 782 1.25 45 45.0 45.0 45.0 0.55 0.89 0.89 1.00 465 279 744 1.60 60 30.0 30.0 30.0 0.46 0.84 0.84 1.00 260 192 452 1.74
(c) fi = 23.45 ° and q~ = 0 ° 0 66.5 66.5 90.0 0.60 0.91 0.91 0.00 681 0 681 1.00
15 62.4 62.4 76.3 0.60 0.91 0.91 0.21 648 27 675 1.04 30 52.6 52.6 62.7 0.57 0.90 0.90 0.43 555 94 650 1.17 45 40.4 40.4 49.6 0.53 0.89 0.89 0.69 406 155 560 1.38 60 27.3 27.3 37.4 0.44 0.81 0.81 0.75 218 110 328 1.51
However, at latitudes above 23.5°N, the reflected energy flux is quite small (maximum value < 5 0 W / m : ) . The reflected energy is a function of parameters such as zat, ZR, ~, AF and p (a constant). Table l(a) tabulates the various parameters which are needed to calculate El and ER as a function of to for ~b = 0 ° and 6 = -23 .45 °. ER is a function of cos ~, Za~, ZR, and AF. Cos ~b increases with to, the least value being at noon. Similarly, AF is zero at noon and increases to 0.75 for to = 60 °. The other quantities decrease from a maximum value at noon. The combined effect of these quantities on ER is that it increases from zero at noon to some maximum value and then decreases with an increase in hour angle. This trend is seen also at other values of 3.
The total energy flux, which is the sum of the incident and the reflected energy, exhibits a trend depicted in Figs 7(a) and (b). Comparison of Figs 3 and 7(a) reveals that the addition of the east/west mirror tends to flatten the energy flux distribution curve in addition to energy flux enhancement, as is true for 3 = 0 ° also. This characteristic is not observed in the south facing mirror [18] where the distribution tends to be peaky. The energy flux decrease is small over a larger part of the day in this case. The total energy flux curves for 3 = 0 ° and ~b = 0 ° and 10°N exhibit a very small decrease from the noon value up to to = 7.5 °. They then increase marginally with further increase in to up to 30 °, and then there is a gradual decrease with further increase in to up to 45 ° A steep fall in total energy flux is noticed beyond to = 45 ° up to 60 °, the percentage drop being about 40%. At other latitudes above 10°N, the total energy flux curves display a slightly different trend. The maximum occurs at noon and values gradually decrease up to to = 45 °, the total drop being about 8.5-20%. Beyond to = 45 °, the total energy flux decreases rapidly up to to = 60 °.
Figure 7(c) depicts the variation of reflected and total energy flux with hour angle at the summer solstice. The reflected energy flux curves, for the latitudes considered, have peaks between to = 45 and 52.5 °. The peak value of reflected energy flux increases with increase in t#. At winter solstice and equinoxes, the reflected energy flux decreases with an increase in latitude at any to, and the trend exhibited by the reflected energy flux distribution at summer solstice is exactly reversed. The total energy flux curves, in this case, for different latitudes cross one another, and this is similar to the incident energy flux distribution.
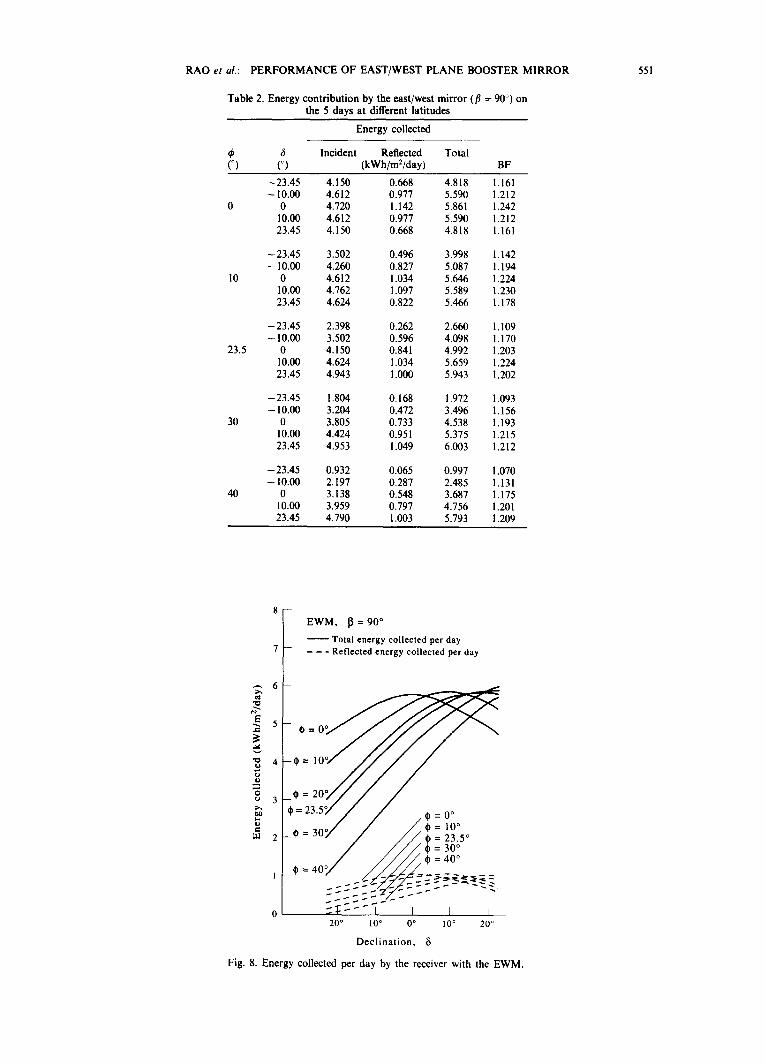
Table 2 tabulates the integrated values of reflected, incident and total energy flux values for each of the five specific days at six different latitudes between 0 and 40°N. In this table, the boost factors for each day are also tabulated. Figure 8 illustrates graphically the reflected and total energy values presented in Table 2. The reflected energy gradually increases with an increase in 6, reaches a peak and then decreases for latitudes from 0 to 23.5°N. At ~b = 30 and 40°N, the daily reflected energy increases gradually up to 3 = 23.45 °. The daily total energy curves also exhibit a similar trend with an increase in 3.
RAO et al.: PERFORMANCE OF EAST/WEST PLANE BOOSTER MIRROR 551
Table 2. Energy contribution by the east/west mirror (fl = 90 °) on the 5 days at different latitudes
Energy collected
~ Incident Reflected Total (¢:) (°) (kWh/m2/day) BF
--23.45 4.150 0.668 4.818 1.161 -- I0.00 4.612 0.977 5.590 1.212
0 4.720 1.142 5.861 1.242 10.00 4.612 0.977 5.590 1.212 23.45 4.150 0.668 4.818 1.161
10
--23.45 3.502 0.496 3.998 1.142 -- 10.00 4.260 0.827 5.087 1.194
0 4.612 1.034 5.646 1.224 10.00 4.762 1.097 5.589 1.230 23.45 4.624 0.822 5.466 1,178
23.5
--23.45 2.398 0.262 2.660 1.109 -- 10.00 3.502 0.596 4.098 1.170
0 4.150 0.841 4.992 1.203 I0.00 4.624 1.034 5.659 1.224 23.45 4.943 1.000 5.943 1.202
30
-- 23.45 1.804 0.168 1.972 1.093 -- 10.00 3.204 0.472 3.496 1.156
0 3.805 0.733 4.538 1.193 10.00 4.424 0.951 5.375 1.215 23.45 4.953 1.049 6.003 1.212
40
-- 23.45 0.932 0.065 0.997 1.070 -- 10.00 2.197 0.287 2.485 1.131
0 3.138 0.548 3.687 1.175 10.00 3.959 0.797 4.756 1.201 23.45 4.790 1.003 5.793 1.209
EWM, ~ = 90 °
Total energy collected per day - - - Reflected energy collected per day
6 -
5 - "
j 4 - -~ -- 10
3 - ¢ - 20
~ = 23.5~/ / / tO .- / / , ¢ = 1o °
m 2 - # = 3 0 y , / / . t~ = 23.5 ° / / / ¢ = 30 °
/ / / / ¢ = 40 °
0 I J I 20 ° I0 ° 0 o 10 ° 20 °
Declination,
Fig. 8. Energy collected per day by the receiver with the EWM.
552 R A O e t al.: P E R F O R M A N C E O F E A S T / W E S T P L A N E B O O S T E R M I R R O R
m
0 e~
1.3
1.2
1.1
1.0
E W M , 13 = 9 0 °
= 0 o
o-,.;,y// -::;::Z
I I I I I I I _30 ° _20 ° - 1 0 o 0 o _10 o - 2 0 ° - 3 0 °
D e c l i n a t i o n ,
F i g . 9. B o o s t f a c t o r o f t he E W M .
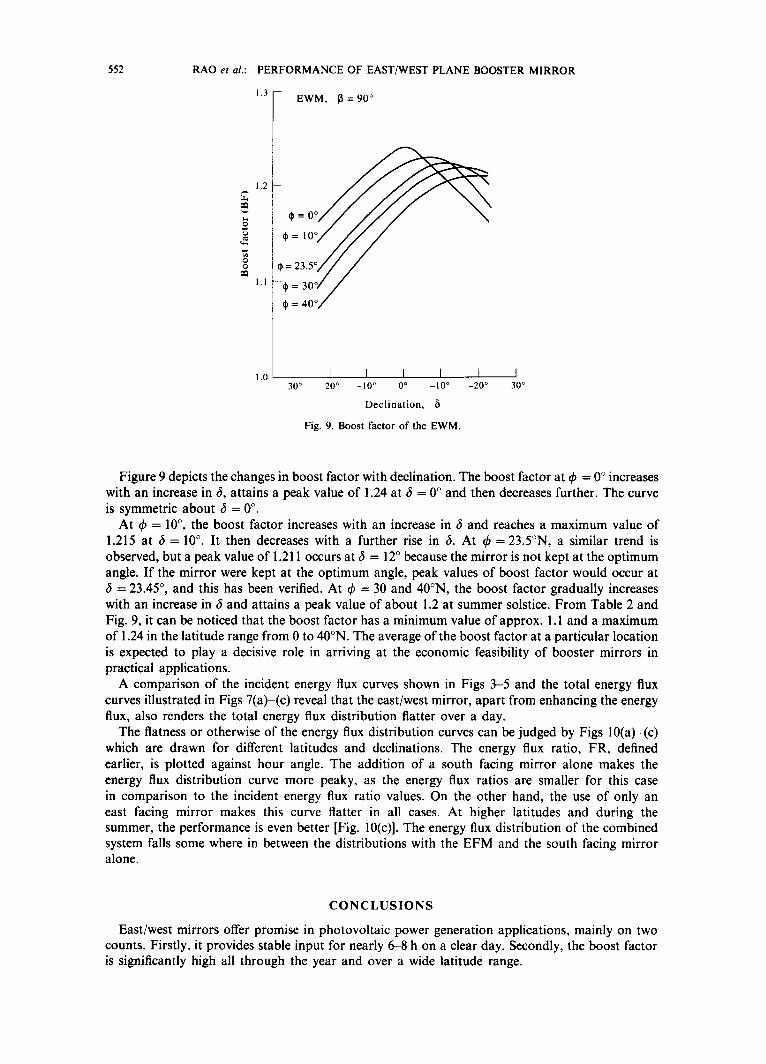
Figure 9 depicts the changes in boost factor with declination. The boost factor at ~b = 0 ° increases with an increase in 6, attains a peak value of 1.24 at 6 = 0 ° and then decreases further. The curve is symmetric about 6 = 0 °.
At ~b = 10 °, the boost factor increases with an increase in 6 and reaches a maximum value of 1.215 at 6 = 10 °. It then decreases with a further rise in 6. At tk = 23.5°N, a similar trend is observed, but a peak value of 1.211 occurs at ~ = 12 ° because the mirror is not kept at the optimum angle. If the mirror were kept at the optimum angle, peak values of boost factor would occur at 6 = 23.45 °, and this has been verified. At qb = 30 and 40°N, the boost factor gradually increases with an increase in 6 and attains a peak value of about 1.2 at summer solstice. From Table 2 and Fig. 9, it can be noticed that the boost factor has a minimum value of approx. 1.1 and a maximum of 1.24 in the latitude range from 0 to 40°N. The average of the boost factor at a particular location is expected to play a decisive role in arriving at the economic feasibility of booster mirrors in practical applications.
A comparison of the incident energy flux curves shown in Figs 3-5 and the total energy flux curves illustrated in Figs 7(a)-(c) reveal that the east/west mirror, apart from enhancing the energy flux, also renders the total energy flux distribution flatter over a day.
The flatness or otherwise of the energy flux distribution curves can be judged by Figs 10(a)-(c) which are drawn for different latitudes and declinations. The energy flux ratio, FR, defined earlier, is plotted against hour angle. The addition of a south facing mirror alone makes the energy flux distribution curve more peaky, as the energy flux ratios are smaller for this case in comparison to the incident energy flux ratio values. On the other hand, the use of only an east facing mirror makes this curve flatter in all cases. At higher latitudes and during the summer, the performance is even better [Fig. 10(c)]. The energy flux distribution of the combined system falls some where in between the distributions with the EFM and the south facing mirror alone.
C O N C L U S I O N S
East/west mirrors offer promise in photovoltaic power generation applications, mainly on two counts. Firstly, it provides stable input for nearly 6-8 h on a clear day. Secondly, the boost factor is significantly high all through the year and over a wide latitude range.

0.8
tr
O 0.6 "~.
~ 0.4
0.2
0.0 0
x Incident A Incident and EFM o Incident and SFM 13 Incident , SFM and EFM ( a )
I I I b I I 15 ° 30 ° 45 ° 60 ° 0 15 ° 30 ° 45 ° 60 ° 0 15 ° 30 ° 45 ° 60*
H o u r a n g l e , to
( b )
1.0
(c)
H o u r a n g l e , to H o u r a n g l e , co
q~ = 23.5°N, ~5 = 0 °
I I I I 15 ° 30 ° 45 ° 60 ° 0
I I I I 15 ° 30 ° 45 ° 60 ° 0
H o u r a n g l e , to
0 15 ° 30 ° 45 ° 60 °
0.0 0
1.0
0.8
Q 0.6
~ 0.4
0.2
H o u r a n g l e , co
t = 23.5°N, 6 = 23.45 °
I I t I 15 ° 30 ° 45 ° 60 °
H o u r a n g l e , to
0.8
Q 0.6
~ 0.4
0.2
0.0 ~
H o u r a n g l e , to
~ON 81 0 I I
15 ° 30 ° 45 ° 60 ° 0
H o u r a n g l e , co
= 40°N, 8 = 23.45 °
I I I I 15 ° 30 ° 45 ° 60 °
H o u r a n g l e , co
F ig . 10. Effect o f the b o o s t e r m i r r o r s o n the ene rgy flux r a t i o a t (a) ~b = 0 ; (b) q~ = 23.5 N ; (c) ~ = 4 0 N .
553
554 RAO et al.: PERFORMANCE OF EAST/WEST PLANE BOOSTER MIRROR
Acknowledgements--Financial assistance received from the U.G.C., New Delhi, is gratefully acknowledged. The authors wish to express their sincere thanks to the Principal, Regional Engineering College, Warangal, for providing facilities to carry out this work.
R E F E R E N C E S
1. H. Tabor, Sol. Energy 10, 111 (1966). 2. S. C. Seitel, Sol. Energy 17, 291 (1975). 3. A. F. Souka and H. H. Safwat, Sol. Energy 10, 170 (1966). 4. A. F. Souka and H. H. Safwat, Sol. Energy 12, 347 (1969). 5. S. L. Grassie and N. R. Sheridan, Sol. Energy 19, 663 (1977). 6. D, K. McDaniels et al., Sol. Energy 17, 277 (1975). 7. I. S. Taha and S. M. Eldighidy, Sol. Energy 25, 173 (1980). 8. D. C. Larson, Sol. Energy 24, 203 (1980). 9. H, F. Chiam, Sol. Energy 26, 503 (1981).
10. A. Dang, Energy Convers. Mgmt 25, 255 (1985). I1. K. D. Mannan and R. B. Bannerot, Sol. Energy 21, 385 (1978). 12. K, D. Mannan and L. S. Cheema, Theory, design, development and evaluation of multi-step stationary concentrators.
Proc. NSEC-82, New Delhi, pp. 3.008-3.011 (1982). 13. D. Faiman and A. Zemel, Sol. Energy 40, 385 (1988). 14. S, Baker et al., Sol. Energy 20, 415 (1978). 15. R. F. Jones Jr, Sol. Energy 33, 527 (1984). 16. A. V. Narasimha Rao, T. L. Sitharama Rao and S. Subramanyam, Energy Convers. Mgmt 29, 157 (1989). 17. A. V. Narasimha Rao, T. L. Sitharama Rao and S. Subramanyam, Energy Convers. Mgmt 28, 265 (1989). 18. A. V. Narasimha Rao, T. L. Sithararna Rao and S. Subramanyam, Energy Convers. Mgmt 32, 51 (1991). 19. A. V. Narasimha Rao, R. Venkata Chalam, S. Subramanyam and T. L. Sitharama Rao, Energy Convers. Mgmt 34,
309 (1993). 20. J. A. Duffle and W. A. Beckman, Solar Energy Engineering of Thermal Processes. Wiley, New York (1980). 21. H. C. Hottel, Sol. Energy 18, 129 (1976).