performance comparison between the agilent 1290 infi nity ... · compartment (tcc). the icc and...
TRANSCRIPT
Performance Comparison Between the Agilent 1290 Infi nity Thermostatted Column Compartment and the Integrated Column Compartment in the Agilent 1260 Infi nity II and 1290 Infi nity II Vialsamplers Technical Overview
AuthorMelanie MetzlaffAgilent Technologies, Inc.Waldbronn, Germany
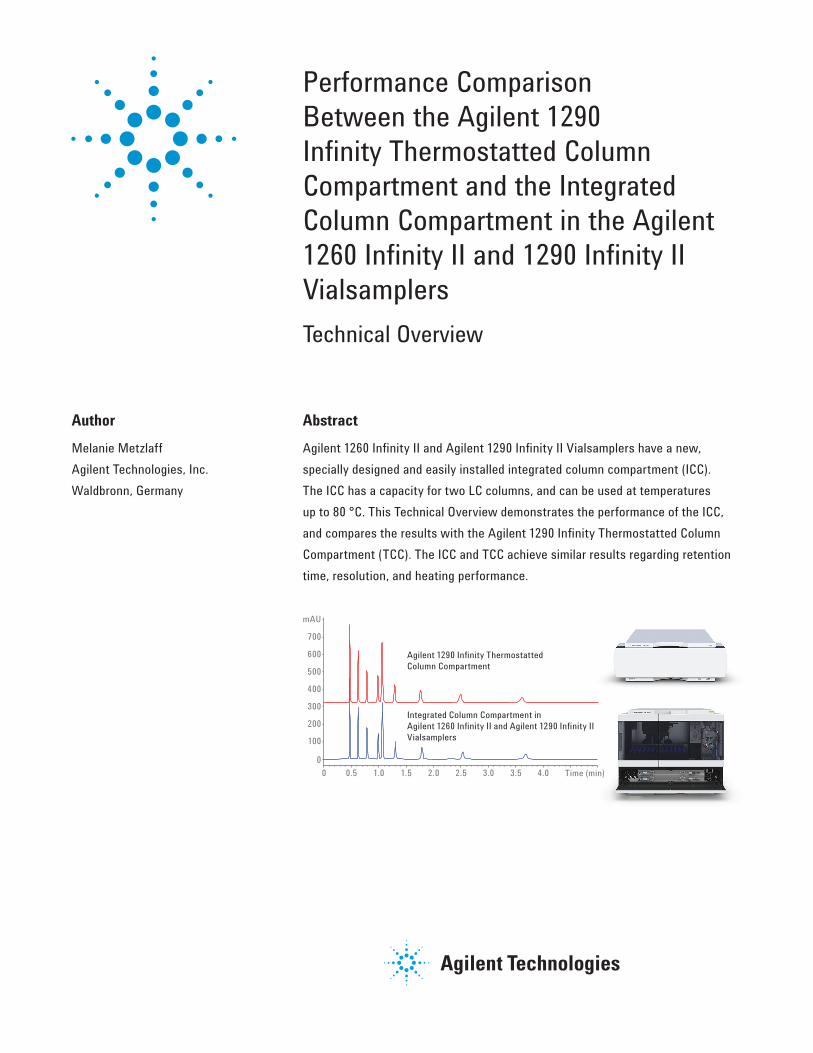
AbstractAgilent 1260 Infi nity II and Agilent 1290 Infi nity II Vialsamplers have a new, specially designed and easily installed integrated column compartment (ICC). The ICC has a capacity for two LC columns, and can be used at temperatures up to 80 °C. This Technical Overview demonstrates the performance of the ICC, and compares the results with the Agilent 1290 Infi nity Thermostatted Column Compartment (TCC). The ICC and TCC achieve similar results regarding retention time, resolution, and heating performance.
Time (min)0 0.5 1.0 1.5 2.0 2.5 3.0 3.5 4.0
mAU
0
100
200
300
400
500
Agilent 1290 Infinity Thermostatted Column Compartment
Integrated Column Compartment in Agilent 1260 Infinity II and Agilent 1290 Infinity II Vialsamplers
600
700
2
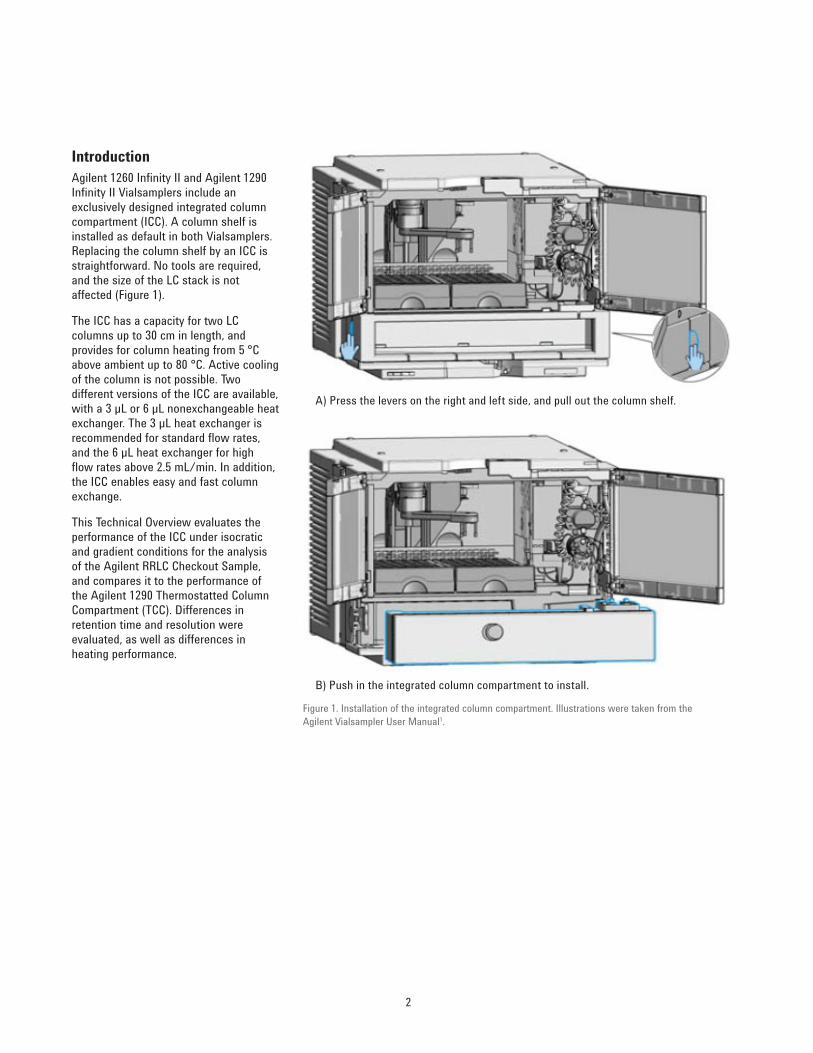
IntroductionAgilent 1260 Infi nity II and Agilent 1290 Infi nity II Vialsamplers include an exclusively designed integrated column compartment (ICC). A column shelf is installed as default in both Vialsamplers. Replacing the column shelf by an ICC is straightforward. No tools are required, and the size of the LC stack is not affected (Figure 1).
The ICC has a capacity for two LC columns up to 30 cm in length, and provides for column heating from 5 °C above ambient up to 80 °C. Active cooling of the column is not possible. Two different versions of the ICC are available, with a 3 µL or 6 µL nonexchangeable heat exchanger. The 3 µL heat exchanger is recommended for standard fl ow rates, and the 6 µL heat exchanger for high fl ow rates above 2.5 mL/min. In addition, the ICC enables easy and fast column exchange.
This Technical Overview evaluates the performance of the ICC under isocratic and gradient conditions for the analysis of the Agilent RRLC Checkout Sample, and compares it to the performance of the Agilent 1290 Thermostatted Column Compartment (TCC). Differences in retention time and resolution were evaluated, as well as differences in heating performance.
Figure 1. Installation of the integrated column compartment. Illustrations were taken from the Agilent Vialsampler User Manual1.
A) Press the levers on the right and left side, and pull out the column shelf.
B) Push in the integrated column compartment to install.
3
ExperimentalInstrumentationThe Agilent 1290 Infi nity II LC used for the experiments consisted of the following modules:
• Agilent 1290 Infi nity II Flexible Pump (G7104A)
• Agilent 1290 Infi nity II Vialsampler (G7129B), equipped with an integrated column compartment (3 µL heater exchanger) (Option #063) and integrated sample cooler (Option #100)
• Agilent 1290 Infi nity II Diode Array Detector (G7117B), equipped with a 10 mm Max-Light cartridge cell
• Agilent 1290 Infi nity Thermostatted Column Compartment (G1316C)
For the performance comparison, only the Vialsamplers’ ICC and the Agilent 1290 TCC were exchanged for the experiments. The other LC modules remained the same.
Solvents and samplesAll solvents used were LC grade. Fresh ultrapure water was obtained from a Milli-Q Integral system equipped with a 0.22 μm membrane point-of-use cartridge (Millipak).
The Agilent RRLC Checkout Sample (p/n 5188-6529) was used for the isocratic and gradient analysis and consisted of nine compounds (in order of elution):
1. Acetanilide2. Acetophenone3. Propiophenone4. Butyrophenone5. Valerophenone6. Hexanophenone7. Heptanophenone8. Octanophenone9. Benzophenone
Table 1. Chromatographic parameters for performance comparison under isocratic conditions.
Method
Parameter ValueColumn Agilent ZORBAX Eclipse Plus C18, 3 × 100 mm, 3.5 µm (p/n 959961-302)Mobile phase 65 % acetonitrile in waterFlow rate 1 mL/minStop time 5 minutesInjection volume 1 µL, sample cooled at 8 °CColumn temperature 40 °CDetection 254/10 nm, reference wavelength 380/100 nm, 40 Hz
Table 2. Chromatographic parameters for performance comparison under gradient conditions at a fl ow rate of 0.3 mL/min.
Table 3. Chromatographic parameters for performance comparison under gradient conditions at a fl ow rate of 1 mL/min.
Parameter ValueColumn Agilent ZORBAX Eclipse Plus C18, 2.1 × 100 mm, 1.8 µm (p/n 959764-902)Mobile phase A) Water
B) AcetonitrileFlow rate 0.3 mL/minGradient 15 %B to 95 %B in 10 minutes Stop 12 minutesPost time 8 minutes Injection volume 1 µL, sample cooled at 8 °CColumn temperature 30 °C, 40 °C, 60 °CDetection 254/10 nm, reference wavelength 380/100 nm, 40 Hz
Parameter ValueColumn Agilent ZORBAX Eclipse Plus C18, 3 × 100 mm, 3.5 µm (p/n 959961-302)Mobile phase A: Water
B: AcetonitrileFlow rate 1 mL/minGradient 15 %B to 95 %B in 5 minutes Stop 7 minutesPost time 6 minutes Injection volume 1 µL, sample cooled at 8 °CColumn temperature 30 °C, 40 °C, 60 °CDetection 254/10 nm, ref. wavelength 380/100 nm, 40 Hz
SoftwareAgilent OpenLAB CDS ChemStation Edition for LC and LC/MS systems, Version C.01.07 [27].
4
Results and DiscussionTo evaluate the performance of the Vialsamplers’ ICC, different experiments were carried out and compared with the results obtained from the Agilent 1290 Infi nity Thermostatted Column Compartment with respect to retention time (RT) and resolution. The performance was tested under isocratic and gradient conditions with the RRLC Checkout Sample. The 3 μL heat exchanger was used for all experiments, and both modules.
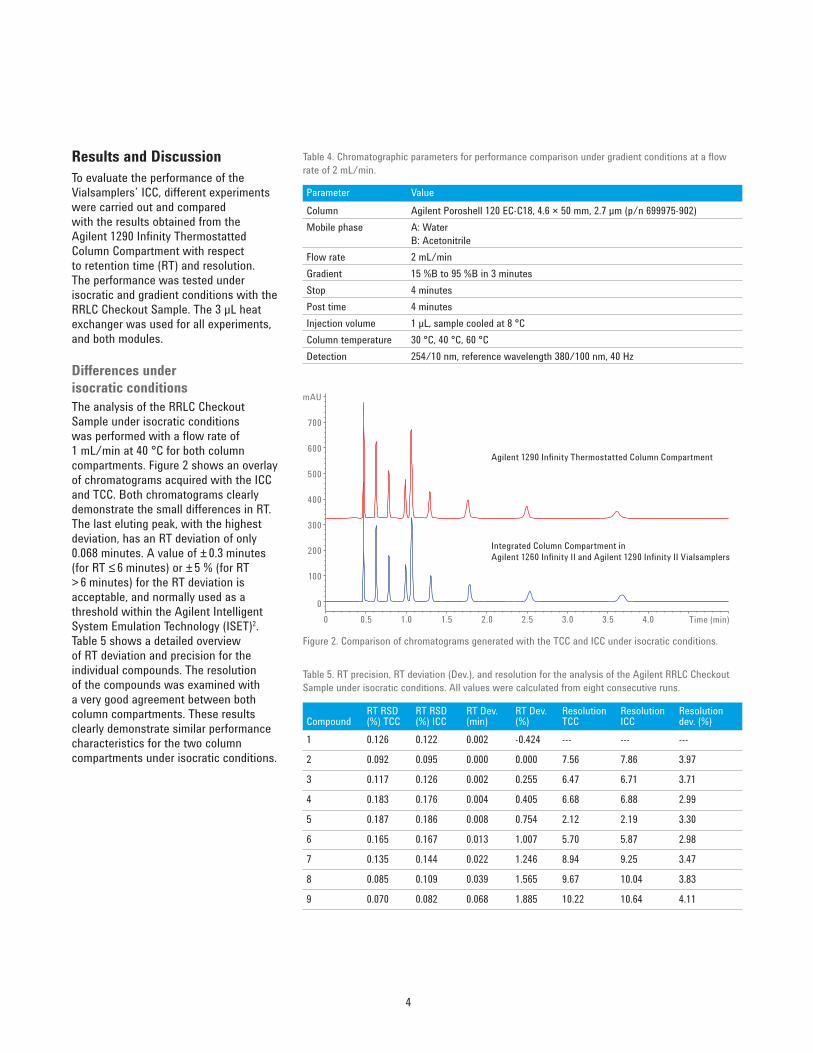
Differences under isocratic conditionsThe analysis of the RRLC Checkout Sample under isocratic conditions was performed with a fl ow rate of 1 mL/min at 40 °C for both column compartments. Figure 2 shows an overlay of chromatograms acquired with the ICC and TCC. Both chromatograms clearly demonstrate the small differences in RT. The last eluting peak, with the highest deviation, has an RT deviation of only 0.068 minutes. A value of ± 0.3 minutes (for RT ≤ 6 minutes) or ± 5 % (for RT > 6 minutes) for the RT deviation is acceptable, and normally used as a threshold within the Agilent Intelligent System Emulation Technology (ISET)2. Table 5 shows a detailed overview of RT deviation and precision for the individual compounds. The resolution of the compounds was examined with a very good agreement between both column compartments. These results clearly demonstrate similar performance characteristics for the two column compartments under isocratic conditions.
Figure 2. Comparison of chromatograms generated with the TCC and ICC under isocratic conditions.
Table 5. RT precision, RT deviation (Dev.), and resolution for the analysis of the Agilent RRLC Checkout Sample under isocratic conditions. All values were calculated from eight consecutive runs.
CompoundRT RSD (%) TCC
RT RSD (%) ICC
RT Dev. (min)
RT Dev. (%)
Resolution TCC
Resolution ICC
Resolution dev. (%)
1 0.126 0.122 0.002 -0.424 --- --- ---
2 0.092 0.095 0.000 0.000 7.56 7.86 3.97
3 0.117 0.126 0.002 0.255 6.47 6.71 3.71
4 0.183 0.176 0.004 0.405 6.68 6.88 2.99
5 0.187 0.186 0.008 0.754 2.12 2.19 3.30
6 0.165 0.167 0.013 1.007 5.70 5.87 2.98
7 0.135 0.144 0.022 1.246 8.94 9.25 3.47
8 0.085 0.109 0.039 1.565 9.67 10.04 3.83
9 0.070 0.082 0.068 1.885 10.22 10.64 4.11
Table 4. Chromatographic parameters for performance comparison under gradient conditions at a fl ow rate of 2 mL/min.
Parameter ValueColumn Agilent Poroshell 120 EC-C18, 4.6 × 50 mm, 2.7 µm (p/n 699975-902)Mobile phase A: Water
B: AcetonitrileFlow rate 2 mL/minGradient 15 %B to 95 %B in 3 minutes Stop 4 minutesPost time 4 minutes Injection volume 1 µL, sample cooled at 8 °CColumn temperature 30 °C, 40 °C, 60 °CDetection 254/10 nm, reference wavelength 380/100 nm, 40 Hz
Time (min)0 0.5 1.0 1.5 2.0 2.5 3.0 3.5 4.0
mAU
0
100
200
300
400
500
Agilent 1290 Infinity Thermostatted Column Compartment
Integrated Column Compartment in Agilent 1260 Infinity II and Agilent 1290 Infinity II Vialsamplers
600
700
5
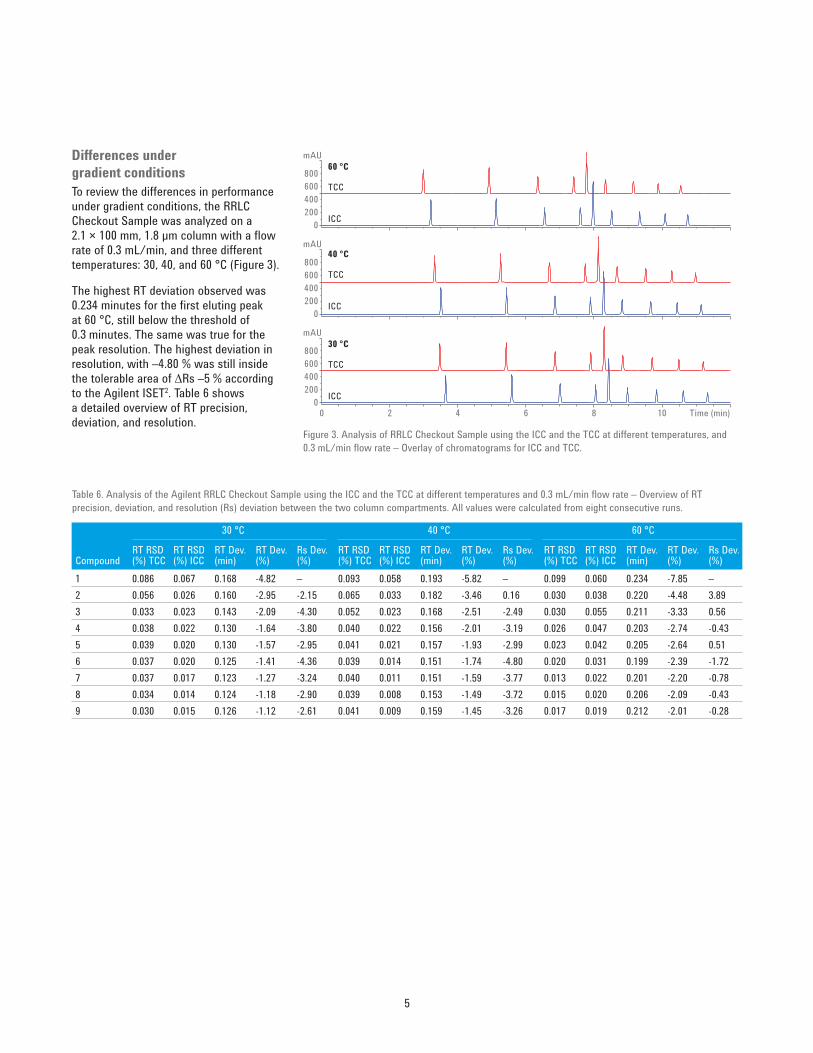
Differences under gradient conditionsTo review the differences in performance under gradient conditions, the RRLC Checkout Sample was analyzed on a 2.1 × 100 mm, 1.8 µm column with a fl ow rate of 0.3 mL/min, and three different temperatures: 30, 40, and 60 °C (Figure 3).
The highest RT deviation observed was 0.234 minutes for the fi rst eluting peak at 60 °C, still below the threshold of 0.3 minutes. The same was true for the peak resolution. The highest deviation in resolution, with –4.80 % was still inside the tolerable area of ∆Rs –5 % according to the Agilent ISET2. Table 6 shows a detailed overview of RT precision, deviation, and resolution.
800
mAU
TCC
ICC
60 °C
TCC
ICC
40 °C
TCC
ICC
30 °C
600400200
0
800
mAU
600400200
0
800
mAU
600400200
00 2 4 6 8 10 Time (min)
Figure 3. Analysis of RRLC Checkout Sample using the ICC and the TCC at different temperatures, and 0.3 mL/min fl ow rate – Overlay of chromatograms for ICC and TCC.
Table 6. Analysis of the Agilent RRLC Checkout Sample using the ICC and the TCC at different temperatures and 0.3 mL/min fl ow rate – Overview of RT precision, deviation, and resolution (Rs) deviation between the two column compartments. All values were calculated from eight consecutive runs.
Compound
30 °C 40 °C 60 °C
RT RSD (%) TCC
RT RSD (%) ICC
RT Dev. (min)
RT Dev. (%)
Rs Dev. (%)
RT RSD (%) TCC
RT RSD (%) ICC
RT Dev. (min)
RT Dev. (%)
Rs Dev. (%)
RT RSD (%) TCC
RT RSD (%) ICC
RT Dev. (min)
RT Dev. (%)
Rs Dev. (%)
1 0.086 0.067 0.168 -4.82 – 0.093 0.058 0.193 -5.82 – 0.099 0.060 0.234 -7.85 –2 0.056 0.026 0.160 -2.95 -2.15 0.065 0.033 0.182 -3.46 0.16 0.030 0.038 0.220 -4.48 3.893 0.033 0.023 0.143 -2.09 -4.30 0.052 0.023 0.168 -2.51 -2.49 0.030 0.055 0.211 -3.33 0.564 0.038 0.022 0.130 -1.64 -3.80 0.040 0.022 0.156 -2.01 -3.19 0.026 0.047 0.203 -2.74 -0.435 0.039 0.020 0.130 -1.57 -2.95 0.041 0.021 0.157 -1.93 -2.99 0.023 0.042 0.205 -2.64 0.516 0.037 0.020 0.125 -1.41 -4.36 0.039 0.014 0.151 -1.74 -4.80 0.020 0.031 0.199 -2.39 -1.727 0.037 0.017 0.123 -1.27 -3.24 0.040 0.011 0.151 -1.59 -3.77 0.013 0.022 0.201 -2.20 -0.788 0.034 0.014 0.124 -1.18 -2.90 0.039 0.008 0.153 -1.49 -3.72 0.015 0.020 0.206 -2.09 -0.439 0.030 0.015 0.126 -1.12 -2.61 0.041 0.009 0.159 -1.45 -3.26 0.017 0.019 0.212 -2.01 -0.28
6
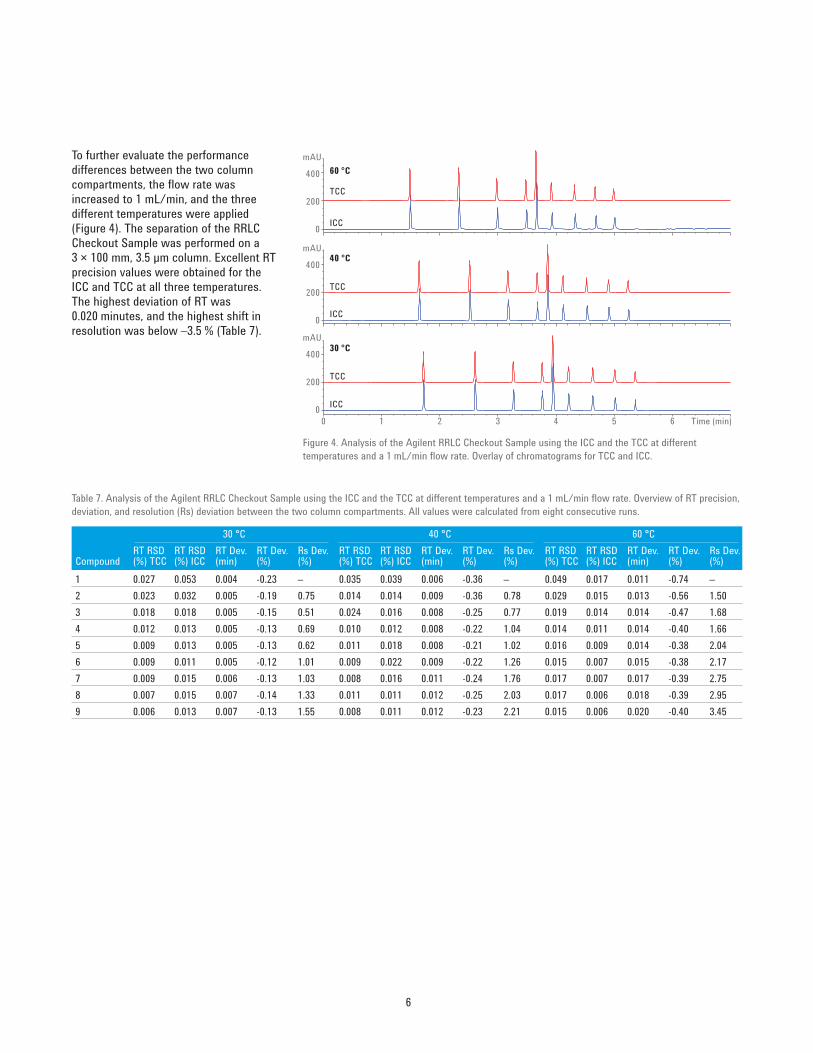
To further evaluate the performance differences between the two column compartments, the fl ow rate was increased to 1 mL/min, and the three different temperatures were applied (Figure 4). The separation of the RRLC Checkout Sample was performed on a 3 × 100 mm, 3.5 µm column. Excellent RT precision values were obtained for the ICC and TCC at all three temperatures. The highest deviation of RT was 0.020 minutes, and the highest shift in resolution was below –3.5 % (Table 7).
mAU
TCC
ICC
60 °C
TCC
ICC
40 °C
TCC
ICC
30 °C
400
200
0
mAU
400
200
0
mAU
400
200
00 1 2 3 4 5 6 Time (min)
Figure 4. Analysis of the Agilent RRLC Checkout Sample using the ICC and the TCC at different temperatures and a 1 mL/min fl ow rate. Overlay of chromatograms for TCC and ICC.
Compound
30 °C 40 °C 60 °CRT RSD (%) TCC
RT RSD (%) ICC
RT Dev. (min)
RT Dev. (%)
Rs Dev. (%)
RT RSD (%) TCC
RT RSD (%) ICC
RT Dev. (min)
RT Dev. (%)
Rs Dev. (%)
RT RSD (%) TCC
RT RSD (%) ICC
RT Dev. (min)
RT Dev. (%)
Rs Dev. (%)
1 0.027 0.053 0.004 -0.23 – 0.035 0.039 0.006 -0.36 – 0.049 0.017 0.011 -0.74 –2 0.023 0.032 0.005 -0.19 0.75 0.014 0.014 0.009 -0.36 0.78 0.029 0.015 0.013 -0.56 1.503 0.018 0.018 0.005 -0.15 0.51 0.024 0.016 0.008 -0.25 0.77 0.019 0.014 0.014 -0.47 1.684 0.012 0.013 0.005 -0.13 0.69 0.010 0.012 0.008 -0.22 1.04 0.014 0.011 0.014 -0.40 1.665 0.009 0.013 0.005 -0.13 0.62 0.011 0.018 0.008 -0.21 1.02 0.016 0.009 0.014 -0.38 2.046 0.009 0.011 0.005 -0.12 1.01 0.009 0.022 0.009 -0.22 1.26 0.015 0.007 0.015 -0.38 2.177 0.009 0.015 0.006 -0.13 1.03 0.008 0.016 0.011 -0.24 1.76 0.017 0.007 0.017 -0.39 2.758 0.007 0.015 0.007 -0.14 1.33 0.011 0.011 0.012 -0.25 2.03 0.017 0.006 0.018 -0.39 2.959 0.006 0.013 0.007 -0.13 1.55 0.008 0.011 0.012 -0.23 2.21 0.015 0.006 0.020 -0.40 3.45
Table 7. Analysis of the Agilent RRLC Checkout Sample using the ICC and the TCC at different temperatures and a 1 mL/min fl ow rate. Overview of RT precision, deviation, and resolution (Rs) deviation between the two column compartments. All values were calculated from eight consecutive runs.
7
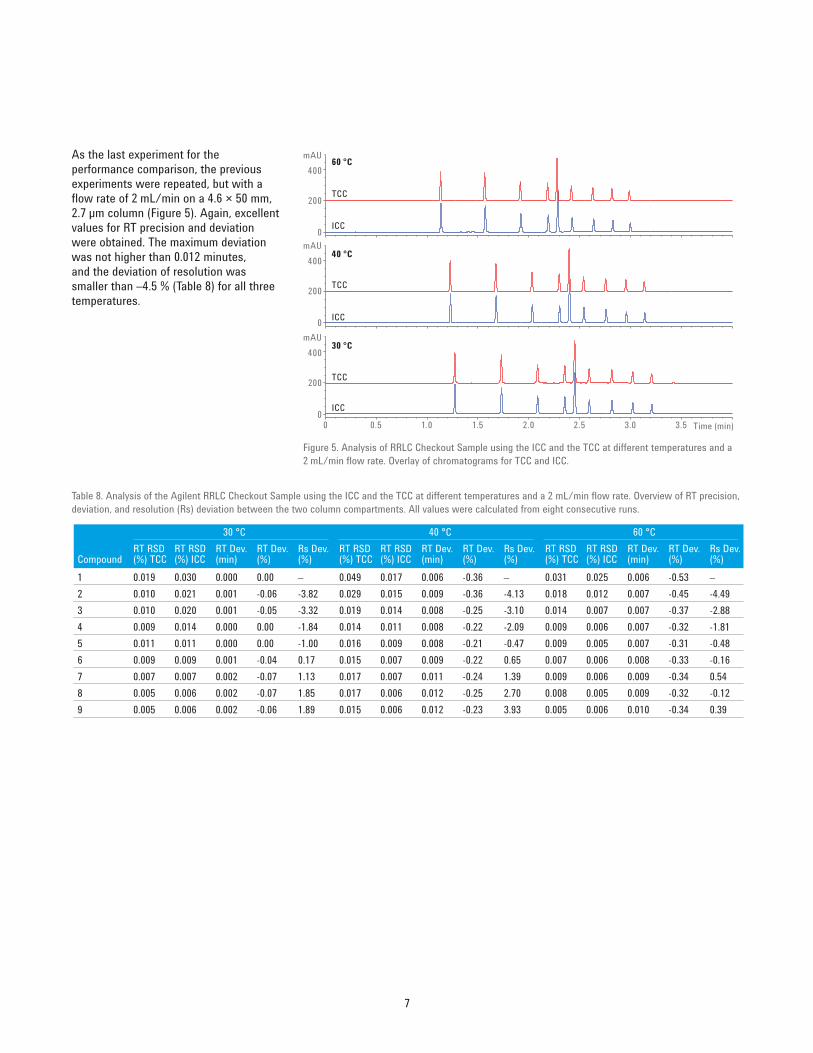
As the last experiment for the performance comparison, the previous experiments were repeated, but with a fl ow rate of 2 mL/min on a 4.6 × 50 mm, 2.7 µm column (Figure 5). Again, excellent values for RT precision and deviation were obtained. The maximum deviation was not higher than 0.012 minutes, and the deviation of resolution was smaller than –4.5 % (Table 8) for all three temperatures.
Table 8. Analysis of the Agilent RRLC Checkout Sample using the ICC and the TCC at different temperatures and a 2 mL/min fl ow rate. Overview of RT precision, deviation, and resolution (Rs) deviation between the two column compartments. All values were calculated from eight consecutive runs.
Compound
30 °C 40 °C 60 °CRT RSD (%) TCC
RT RSD (%) ICC
RT Dev. (min)
RT Dev. (%)
Rs Dev. (%)
RT RSD (%) TCC
RT RSD (%) ICC
RT Dev. (min)
RT Dev. (%)
Rs Dev. (%)
RT RSD (%) TCC
RT RSD (%) ICC
RT Dev. (min)
RT Dev. (%)
Rs Dev. (%)
1 0.019 0.030 0.000 0.00 – 0.049 0.017 0.006 -0.36 – 0.031 0.025 0.006 -0.53 –2 0.010 0.021 0.001 -0.06 -3.82 0.029 0.015 0.009 -0.36 -4.13 0.018 0.012 0.007 -0.45 -4.493 0.010 0.020 0.001 -0.05 -3.32 0.019 0.014 0.008 -0.25 -3.10 0.014 0.007 0.007 -0.37 -2.884 0.009 0.014 0.000 0.00 -1.84 0.014 0.011 0.008 -0.22 -2.09 0.009 0.006 0.007 -0.32 -1.815 0.011 0.011 0.000 0.00 -1.00 0.016 0.009 0.008 -0.21 -0.47 0.009 0.005 0.007 -0.31 -0.486 0.009 0.009 0.001 -0.04 0.17 0.015 0.007 0.009 -0.22 0.65 0.007 0.006 0.008 -0.33 -0.167 0.007 0.007 0.002 -0.07 1.13 0.017 0.007 0.011 -0.24 1.39 0.009 0.006 0.009 -0.34 0.548 0.005 0.006 0.002 -0.07 1.85 0.017 0.006 0.012 -0.25 2.70 0.008 0.005 0.009 -0.32 -0.129 0.005 0.006 0.002 -0.06 1.89 0.015 0.006 0.012 -0.23 3.93 0.005 0.006 0.010 -0.34 0.39
TCC
ICC
60 °C
TCC
ICC
40 °C
TCC
ICC
30 °CmAU
400
200
0
mAU400
200
0
mAU400
200
0
0 0.5 1.0 1.5 2.0 2.5 3.0 3.5 Time (min)
Figure 5. Analysis of RRLC Checkout Sample using the ICC and the TCC at different temperatures and a 2 mL/min fl ow rate. Overlay of chromatograms for TCC and ICC.
8
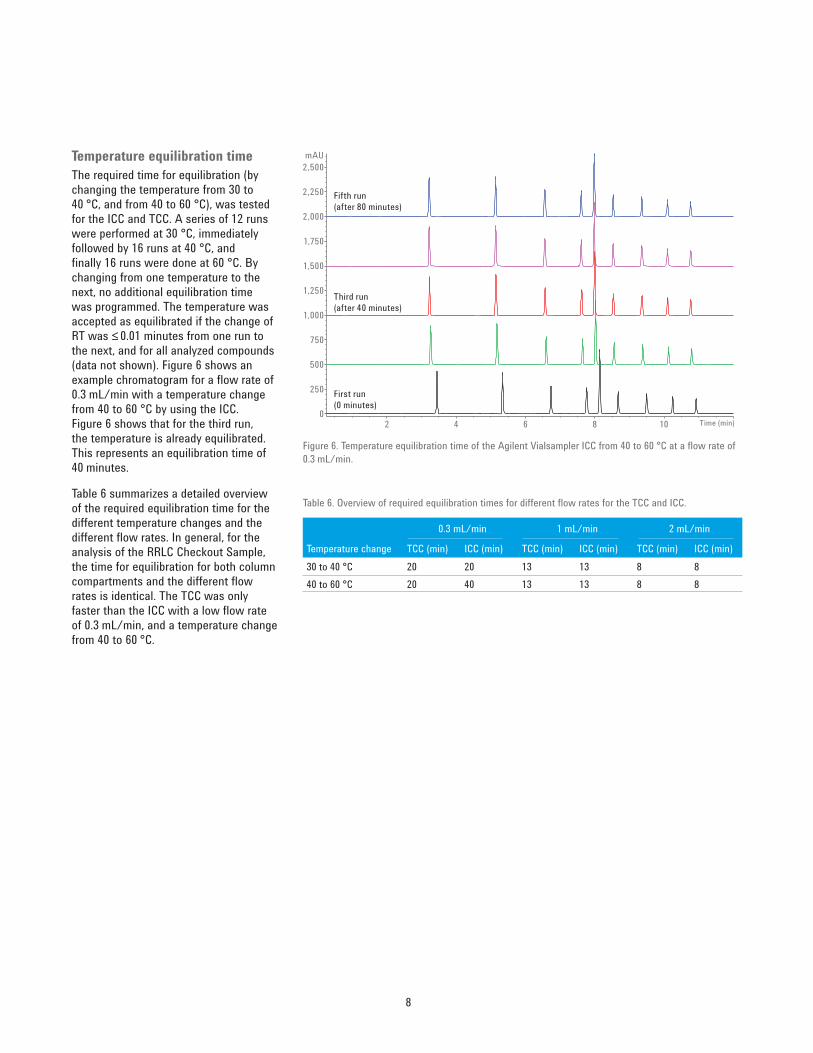
Temperature equilibration timeThe required time for equilibration (by changing the temperature from 30 to 40 °C, and from 40 to 60 °C), was tested for the ICC and TCC. A series of 12 runs were performed at 30 °C, immediately followed by 16 runs at 40 °C, and fi nally 16 runs were done at 60 °C. By changing from one temperature to the next, no additional equilibration time was programmed. The temperature was accepted as equilibrated if the change of RT was ≤ 0.01 minutes from one run to the next, and for all analyzed compounds (data not shown). Figure 6 shows an example chromatogram for a fl ow rate of 0.3 mL/min with a temperature change from 40 to 60 °C by using the ICC. Figure 6 shows that for the third run, the temperature is already equilibrated. This represents an equilibration time of 40 minutes.
Table 6 summarizes a detailed overview of the required equilibration time for the different temperature changes and the different fl ow rates. In general, for the analysis of the RRLC Checkout Sample, the time for equilibration for both column compartments and the different fl ow rates is identical. The TCC was only faster than the ICC with a low fl ow rate of 0.3 mL/min, and a temperature change from 40 to 60 °C.
Time (min)
mAU
02 4 6 8 10
250
500
750
1,000
1,250
1,500
1,750
2,000
2,250
2,500
Fifth run(after 80 minutes)
Third run(after 40 minutes)
First run(0 minutes)
Figure 6. Temperature equilibration time of the Agilent Vialsampler ICC from 40 to 60 °C at a fl ow rate of 0.3 mL/min.
Table 6. Overview of required equilibration times for different fl ow rates for the TCC and ICC.
Temperature change
0.3 mL/min 1 mL/min 2 mL/min
TCC (min) ICC (min) TCC (min) ICC (min) TCC (min) ICC (min)30 to 40 °C 20 20 13 13 8 840 to 60 °C 20 40 13 13 8 8
9
ReferencesAgilent 1200 Infi nity II Series Autosampler/Vialsampler, Agilent Technologies User Manual, part number G7129-90000, September 2015.
Agilent 1290 Infi nity with ISET, Agilent Technologies User Manual, part number G4220-90313, November 2014.
ConclusionThis Technical Overview demonstrates the heating performance of the integrated column compartment of the Agilent 1260 Infi nity II, and Agilent 1290 Infi nity II Vialsamplers in comparison to the performance of the Agilent 1290 Infi nity Thermostatted Column Compartment. The Agilent RRLC Checkout Sample was analyzed under isocratic and gradient conditions, and the RT precision, shift, and resolution were evaluated for both modules. The calculated RT RSD values were very similar for both compartments under the different applied conditions. The shift in RT was below 0.25 minutes, and the resolution deviation smaller than –4.80 %, which were inside the specifi cation range.
The Vialsamplers’ integrated column compartment shows excellent heating performance, and is comparable with the performance of the 1290 Infi nity Thermostatted Column Compartment for the RRLC Checkout Sample. The integrated column compartment is a robust and easy-to-handle module with excellent heating performance for highest reproducibility.

10

11
www.agilent.com
This information is subject to change without notice.
© Agilent Technologies, Inc., 2016Published in the USA, June 1, 20165991-6859EN