perchlorate and chlorate biogeochemistry in ice-covered lakes of the mcmurdo dry valleys, antarctica
TRANSCRIPT
Available online at www.sciencedirect.com
www.elsevier.com/locate/gca
Geochimica et Cosmochimica Acta 98 (2012) 19–30
Perchlorate and chlorate biogeochemistry in ice-covered lakesof the McMurdo Dry Valleys, Antarctica
W. Andrew Jackson a,⇑, Alfonso F. Davila b,c, Nubia Estrada a, W. Berry Lyons d,John D. Coates e, John C. Priscu f
a Department of Civil and Environmental Engineering, Texas Tech University, Lubbock, TX 79409, USAb NASA Ames Research Center, Moffett Field, CA 95136, USA
c SETI Institute, 189 Bernardo Ave., Suite 100, Mountain View, CA 94043-5203, USAd Byrd Polar Research Center, The Ohio State University, Columbus, OH 43210, USA
e Department of Plant and Microbial Biology, University of California, Berkeley, CA 94720, USAf Department of Land Resources & Environmental Sciences, Montana State University, Bozeman, MT 59717, USA
Received 15 February 2012; accepted in revised form 5 September 2012; available online 19 September 2012
Abstract
We measured chlorate (ClO3�) and perchlorate (ClO4
�) concentrations in ice covered lakes of the McMurdo Dry Valleys(MDVs) of Antarctica, to evaluate their role in the ecology and geochemical evolution of the lakes. ClO3
� and ClO4� are
present throughout the MDV Lakes, streams, and other surface water bodies. ClO3� and ClO4
� originate in the atmosphereand are transported to the lakes by surface inflow of glacier melt that has been differentially impacted by interaction with soilsand aeolian matter. Concentrations of ClO3
� and ClO4� in the lakes and between lakes vary based on both total evaporative
concentration, as well as biological activity within each lake. All of the lakes except the East lobe of Lake Bonney supportbiological reduction of ClO3
� and ClO4� either in the anoxic bottom waters or sediment. The younger less saline lakes (Miers
and Hoare), have surface ClO3� and ClO4
� concentrations, and ratios of ClO3�/Cl� and ClO4
�/Cl�, similar to sourcestreams, while Lake Fryxell has concentrations similar to input streams but much lower ClO3
�/Cl� and ClO4�/Cl� ratios,
reflecting the influence of a large Cl� source in bottom sediments. ClO3� and ClO4
� in Lake Bonney are the highest of allthe lakes reflecting the lake’s greater age and higher concentration of Cl�. ClO4
� appears to be stable in the East Lobeand its concentration is highly correlated with Cl� concentration suggesting that some ClO4
� at depth is a remnant of theinitial seawater that formed Lake Bonney. ClO3
� and ClO4� concentrations provide a simple and sensitive means to evaluate
microbial activity in these lakes due to their relatively low concentrations and lack of biological sources, unlike NO3�, NO2
�,and SO4
�2.� 2012 Elsevier Ltd. All rights reserved.
1. INTRODUCTION
Ice-covered lakes are the main sites for biological activ-ity in the McMurdo Dry Valleys (MDVs) of Antarctica,and represent one of the most pristine aquatic ecosystemson Earth. These lakes have been extensively studied in rela-tion to their physical structure, ecology, and biogeochemis-try (e.g. Green and Lyons, 2009 and references therein).
0016-7037/$ - see front matter � 2012 Elsevier Ltd. All rights reserved.
http://dx.doi.org/10.1016/j.gca.2012.09.014
⇑ Corresponding author. Tel.: +1 806 742 2801 (230)..E-mail address: [email protected] (W.A. Jackson).
Most of the ice-covered lakes in the MDV contain bothoxic and anoxic zones within the water column, althoughseveral lakes are oxic throughout. Lake water temperaturesare always close to 0 �C, and the water columns are charac-terized by relatively low biological productivity. In all cases,the lakes are perennially ice-covered, which influences allphysical, chemical, and biological processes. The deepwaters of the east lobe of Lake Bonney rank among themost saline aqueous environments on our planet with verylimited or no microbial activity, while other lakes containessentially fresh water and support diverse and widespread
20 W.A. Jackson et al. / Geochimica et Cosmochimica Acta 98 (2012) 19–30
photosynthetic microbial mats, as well as chemolithotro-phic and heterotrophic processes such as nitrification, sul-fur oxidation, denitrification, and sulfate reduction(Voytek et al., 1999; Green and Lyons, 2009).
Many major and trace element geochemical and biogeo-chemical processes have been evaluated in these lakes (e.g.Lee et al., 2004), but no information is available concerningthe occurrence, distribution and fate of ClO3
� and ClO4�.
These two oxyhalides are produced in the atmosphere byO3 and possibly UV mediated oxidation reactions (Kanget al., 2006, 2009; Rao et al., 2010a), and are ubiquitouslytransferred to the surface through dry and wet deposition(Rajagopalan et al., 2009), where they are available as alter-nate electron acceptors to support a variety of microbialmetabolisms (Coates and Achenbach, 2004, 2006). As such,the biogeochemistry of chlorine oxy-anions (ClOx) in theMDV may provide clues regarding microbial activity andthe chemical evolution of soils and lake water. Understand-ing the environmental limits of ClOx metabolism is alsoespecially important given the discovery of ClO4
� on Mars(Hecht et al., 2009).
Natural ClO4� has been known to occur at near parts per
hundred levels in the Atacama Desert for well over a hun-dred years (Ericksen, 1981), but up until the recent decadeno information was available concerning its worldwide dis-tribution, production, or fate in the environment. Due to therecent interest in ClO4
� as an anthropogenic contaminant,there is now a much better understanding of these issues(e.g. Jackson et al., 2010). Based on stable isotope ratiosof O in ClO4
�, it appears that ClO4� has at least two atmo-
spheric production pathways: O3 mediated oxidation of Clspecies and possibly photo-oxidation of oxy-chlorine com-pounds (Bao and Gu, 2004; Bohlke et al., 2005; Jacksonet al., 2010). ClO4
� occurs ubiquitously throughout theworld, and it tends to accumulate in arid areas includingthe MDV (Kounaves et al., 2010; Rajagopalan et al.,2009; Ericksen, 1981; Jackson et al., 2010). Preferentialaccumulation in arid areas is due to limited liquid waterand the generally oxic conditions, which prevent the infiltra-tion into the soil and reduction of ClO4
� by bacteria capableof using it as an electron acceptor under anoxic conditions.During microbial reduction, ClO4
� is sequentially reducedthrough ClO3
� to ClO2�, which is then disproportionated
by chlorite dismutase to produce O2 and Cl�
(ClO4� ! ClO3
� ! ClO2� ! Cl� + O2). The oxygen is
consumed within the ClO4� reducing bacterial cell.
(Per)chlorate reducing organisms are facultatively anaero-bic or micro-aerophilic and can utilize a broad range of elec-tron donors including hydrogen, organic matter, ferrousiron, and hydrogen sulfide and have been isolated from awide range of natural environments (Coates and Achen-bach, 2004, 2006). ClO4
� is very soluble and in oxic environ-ments highly conserved and is not transformed by knownabiotic processes under relevant environmental conditions.In this sense it is somewhat similar to NO3
�, with the impor-tant exception that NO3
� can be produced in situ by nitrifi-cation and is readily taken up by organisms as an N source.
Natural ClO3� is even less studied than ClO4
� mainlydue to the difficulty in the analysis of environmentalsamples as a result of their relatively low concentrations,
and has not been previously reported in Antarctica. Newtechniques for the measurement of ClO3
� have shown thatit has a similar distribution to ClO4
� (Rao et al., 2010b). Inaddition, mechanisms proposed for ClO4
� production gen-erally include simultaneous production of ClO3
�. Labora-tory experiments evaluating ClO4
� production fromoxidation of Cl� and less oxygenated oxychlorine com-pounds (HOCl, ClO2
�, ClO2) by O3 and UV all produceClO3
� generally in excess of ClO4� (Rao et al., 2010a,b;
Kang et al., 2006, 2009). It also can be biologically reducedunder anoxic conditions as all known organisms capable ofClO4
� reduction can also reduce ClO3�. In addition,
ClO3�, but not ClO4
�, can be transformed by nitrate respir-ing organisms through nitrate reductase enzymes (de grootand Stouthamer, 1969; Roldan et al., 1994).
The purpose of this study was to measure ClO4� and
ClO3� levels in ice-covered lakes of the MDV, and to eval-
uate whether these species were being reduced by bacteriacapable of (per)chlorate reduction. Results are discussedwith regard to the ecology, chemical evolution, and historyof lakes in the MDV.
2. METHODS
ClO4�, ClO3
�, NO3�, SO4
�2, and Cl� concentrationswere measured for samples from a number of surface waterbodies (e.g. streams, creeks, ponds; see Table 1) and 4 ice-covered lakes within the MDV: Lake Bonney (East andWest Lobe), Lake Hoare, and Lake Fryxell in Taylor Val-ley and Lake Miers in the Miers Valley. All samples wereobtained from the Long Term Ecological Research group(LTER) using techniques previously outlined (http://www.lternet.edu/sites/mcm/). Samples were collected ineither December of 2008 (Lake Fryxell and Miers) or2009 (Lake Hoare and Bonney). Samples were filtered(GF/F filter) within 6–8 h of collection and stored frozen.
2.1. Analysis
Major anions (Cl�, NO3�, and SO4
2�) were analyzed byion chromatography following EPA Method 300.0 (Pfaff,1993). Anion concentration distribution within the lakesis well documented but was evaluated here to demonstrateconsistency with past efforts and to evaluate ClO4
� andClO3
� concentrations with respect to other anions on aconsistent set of samples. ClO4
� and ClO3� concentrations
were separately measured by sequential ion chromatogra-phy-mass spectroscopy–mass spectroscopy (IC-MS/MS)following the method detailed in Rao et al. (2007); Raoet al. (2010b). ClO4
� and ClO3� were quantified using a
Dionex LC 20 ion chromatography system consisting ofGP50 pump, CD25 conductivity detector, AS40 automatedsampler and Dionex IonPac AS16 (250 � 2 mm) analyticalcolumn. The IC system was coupled with an Applied Bio-systems – MDS SCIEX API 2000e triple quadrupole massspectrometer equipped with a Turbo-IonSpraye source. Ahydroxide (NaOH) eluent at 0.3 mL min�1 was followed by90% acetonitrile (0.3 mL min�1) as a post-column solvent.To overcome matrix effects, all samples were spiked withCl18O3 (produced in house) or Cl18O4 (Dionex) internal
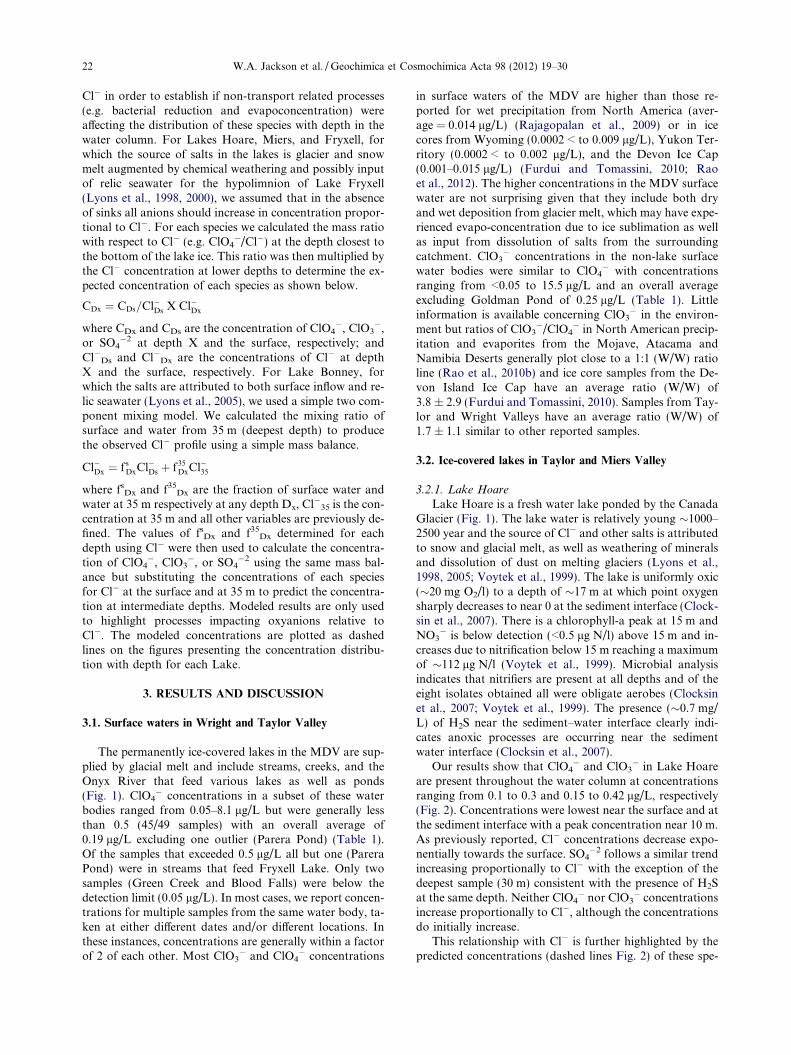
Table 1ClO3
�, ClO4�, Cl� and SO4
�2 concentrations in surface waters of the Dry Valleys.
Valley Basin Water boy Date ClO4� ClO3
� Cl� SO4�2
lg/L mg/L
E. Bonney Priscu 12/2009 0.07 0.20 10.7 5.4Priscu 12/2008 0.15 0.35 9.8 6.3Priscu 01/2009 0.47 0.47 43.0 11.3
W. Bonney Lawson 01/2009 0.14 0.18 8.22 5.4Lawson 12/2008 0.25 0.17 5.7 3.6Lawson 12/2009 0.18 0.25 4.9 3.5Blood Falls 12/2008 <0.05 <0.05
Taylor Valley Fryxell Aiken 12/2009 0.18 0.21 12.8 3.6Aiken 12/2009 0.12 <0.1 7.1 3.2Canada 01/2009 0.06 0.55 2.4 2.4Canada 12/2009 0.09 <0.1 2.2 3.3Canada 01/2010 0.06 0.25 1.7 2.2Canada 12/2008 0.13 0.11 4.0 3.9Common Wealtha 12/2008 0.10 0.21 4.7 2.2Crescent 12/2008 0.51 0.48 14.1 6.6Delta 01/2009 0.34 0.25 9.1 6.0Delta 01/2010 0.16 0.11 15.4 6.8Delta 12/2008 0.19 0.22 18.9 6.4Fryxell Pond 01/2010 0.13 0.48 8.4 3.3Green 01/2009 <0.05 <0.05 4.0 0.6Green 01/2010 0.09 0.35 1.4 0.7Green 12/2008 0.06 <0.1 2.3 0.9Green 01/2009 0.05 0.15 2.7 0.9Harnish 01/2009 0.7 0.22 13.7 7.8Howard Pond 01/2010 0.11 0.20 8.0 3.9Huey 01/2009 0.21 0.26 10.3 12.3Huey 12/2008 0.43 0.43 10.3 12.1Lost Seal 12/2008 0.18 0.07 12.6 5.4Lost Seal 01/2010 0.07 <0.1 7.9 3.6Lost Seal 12/2008 0.51 0.24 12.7 5.9Von Guerard 01/2009 0.16 0.05 6.1 3.2Von Guerard 12/2008 0.49 <0.1 6.8 3.8Von Guerard 01/2010 0.01 <0.1 61.7 13.7
Hoare Andersen 12/2008 0.1 <0.05 2.8 3.8Andersen 12/2009 0.09 <0.1 1.9 2.2Andersen 12/2008 0.07 <0.1 3.1 5.4Andersen 12/2008 0.18 0.17 14.2 11.1House 12/2008 0.10 <0.05 3.1 2.7House 12/2008 0.13 0.11 3.6 3.5House 12/2008 0.09 0.21 6.6 3.1House 12/2009 0.08 <0.1 2.4 2.3Wharton 12/2009 0.11 <0.1 2.0 1.6Parera Pond 01/2010 8.1 15.5 1300 198
Wright Vanda Onyx 12/2009 0.08 0.39 5.2 2.5Onyx 11/2009 0.13 0.16 6.8 3.4Onyx 01/2009 0.08 0.43 4.9 2.6Onyx 01/2009 0.13 0.28 8.0 4.8Onyx 12/2008 0.06 <0.1 8.9 2.7Onyx 12/2008 0.20 0.34 7.9 5.1Onyx 01/2010 0.17 0.18 5.9 3.9
a Common Wealth stream does not feed Lake Fryxell but Common Wealth Glacier, it source, does provide inflow to Lake Fryxell and so itwas grouped in this basin.
W.A. Jackson et al. / Geochimica et Cosmochimica Acta 98 (2012) 19–30 21
standards. The MDL was 2 ng/L for both ClO3� and
ClO4�, while the MRL for these samples was 50 ng/L. Sam-
ples were analyzed in batches of 8 including an analyticalduplicate and spike. The errors in duplicate samples wereless than ±10% and the spike recoveries were between90% and 110 %. Samples with elevated Cl� (>10,000 mg/L) or SO4
� (>1000 mg/L) were either diluted prior to
analysis or in some cases pre-cleaned using On-Guarde
II Ag or Ba cartridges (Dionex).
2.2. Modeling
Two simple models were used to evaluate ClO4�, ClO3
�,and SO4
�2 concentrations relative to the conserved species
22 W.A. Jackson et al. / Geochimica et Cosmochimica Acta 98 (2012) 19–30
Cl� in order to establish if non-transport related processes(e.g. bacterial reduction and evapoconcentration) wereaffecting the distribution of these species with depth in thewater column. For Lakes Hoare, Miers, and Fryxell, forwhich the source of salts in the lakes is glacier and snowmelt augmented by chemical weathering and possibly inputof relic seawater for the hypolimnion of Lake Fryxell(Lyons et al., 1998, 2000), we assumed that in the absenceof sinks all anions should increase in concentration propor-tional to Cl�. For each species we calculated the mass ratiowith respect to Cl� (e.g. ClO4
�/Cl�) at the depth closest tothe bottom of the lake ice. This ratio was then multiplied bythe Cl� concentration at lower depths to determine the ex-pected concentration of each species as shown below.
CDx ¼ CDs=Cl�Ds X Cl�Dx
where CDx and CDs are the concentration of ClO4�, ClO3
�,or SO4
�2 at depth X and the surface, respectively; andCl�Ds and Cl�Dx are the concentrations of Cl� at depthX and the surface, respectively. For Lake Bonney, forwhich the salts are attributed to both surface inflow and re-lic seawater (Lyons et al., 2005), we used a simple two com-ponent mixing model. We calculated the mixing ratio ofsurface and water from 35 m (deepest depth) to producethe observed Cl� profile using a simple mass balance.
Cl�Dx ¼ fsDxCl�Ds þ f35
DxCl�35
where fsDx and f35
Dx are the fraction of surface water andwater at 35 m respectively at any depth Dx, Cl�35 is the con-centration at 35 m and all other variables are previously de-fined. The values of fs
Dx and f35Dx determined for each
depth using Cl� were then used to calculate the concentra-tion of ClO4
�, ClO3�, or SO4
�2 using the same mass bal-ance but substituting the concentrations of each speciesfor Cl� at the surface and at 35 m to predict the concentra-tion at intermediate depths. Modeled results are only usedto highlight processes impacting oxyanions relative toCl�. The modeled concentrations are plotted as dashedlines on the figures presenting the concentration distribu-tion with depth for each Lake.
3. RESULTS AND DISCUSSION
3.1. Surface waters in Wright and Taylor Valley
The permanently ice-covered lakes in the MDV are sup-plied by glacial melt and include streams, creeks, and theOnyx River that feed various lakes as well as ponds(Fig. 1). ClO4
� concentrations in a subset of these waterbodies ranged from 0.05–8.1 lg/L but were generally lessthan 0.5 (45/49 samples) with an overall average of0.19 lg/L excluding one outlier (Parera Pond) (Table 1).Of the samples that exceeded 0.5 lg/L all but one (PareraPond) were in streams that feed Fryxell Lake. Only twosamples (Green Creek and Blood Falls) were below thedetection limit (0.05 lg/L). In most cases, we report concen-trations for multiple samples from the same water body, ta-ken at either different dates and/or different locations. Inthese instances, concentrations are generally within a factorof 2 of each other. Most ClO3
� and ClO4� concentrations
in surface waters of the MDV are higher than those re-ported for wet precipitation from North America (aver-age = 0.014 lg/L) (Rajagopalan et al., 2009) or in icecores from Wyoming (0.0002 < to 0.009 lg/L), Yukon Ter-ritory (0.0002 < to 0.002 lg/L), and the Devon Ice Cap(0.001–0.015 lg/L) (Furdui and Tomassini, 2010; Raoet al., 2012). The higher concentrations in the MDV surfacewater are not surprising given that they include both dryand wet deposition from glacier melt, which may have expe-rienced evapo-concentration due to ice sublimation as wellas input from dissolution of salts from the surroundingcatchment. ClO3
� concentrations in the non-lake surfacewater bodies were similar to ClO4
� with concentrationsranging from <0.05 to 15.5 lg/L and an overall averageexcluding Goldman Pond of 0.25 lg/L (Table 1). Littleinformation is available concerning ClO3
� in the environ-ment but ratios of ClO3
�/ClO4� in North American precip-
itation and evaporites from the Mojave, Atacama andNamibia Deserts generally plot close to a 1:1 (W/W) ratioline (Rao et al., 2010b) and ice core samples from the De-von Island Ice Cap have an average ratio (W/W) of3.8 ± 2.9 (Furdui and Tomassini, 2010). Samples from Tay-lor and Wright Valleys have an average ratio (W/W) of1.7 ± 1.1 similar to other reported samples.
3.2. Ice-covered lakes in Taylor and Miers Valley
3.2.1. Lake Hoare
Lake Hoare is a fresh water lake ponded by the CanadaGlacier (Fig. 1). The lake water is relatively young �1000–2500 year and the source of Cl� and other salts is attributedto snow and glacial melt, as well as weathering of mineralsand dissolution of dust on melting glaciers (Lyons et al.,1998, 2005; Voytek et al., 1999). The lake is uniformly oxic(�20 mg O2/l) to a depth of �17 m at which point oxygensharply decreases to near 0 at the sediment interface (Clock-sin et al., 2007). There is a chlorophyll-a peak at 15 m andNO3
� is below detection (<0.5 lg N/l) above 15 m and in-creases due to nitrification below 15 m reaching a maximumof �112 lg N/l (Voytek et al., 1999). Microbial analysisindicates that nitrifiers are present at all depths and of theeight isolates obtained all were obligate aerobes (Clocksinet al., 2007; Voytek et al., 1999). The presence (�0.7 mg/L) of H2S near the sediment–water interface clearly indi-cates anoxic processes are occurring near the sedimentwater interface (Clocksin et al., 2007).
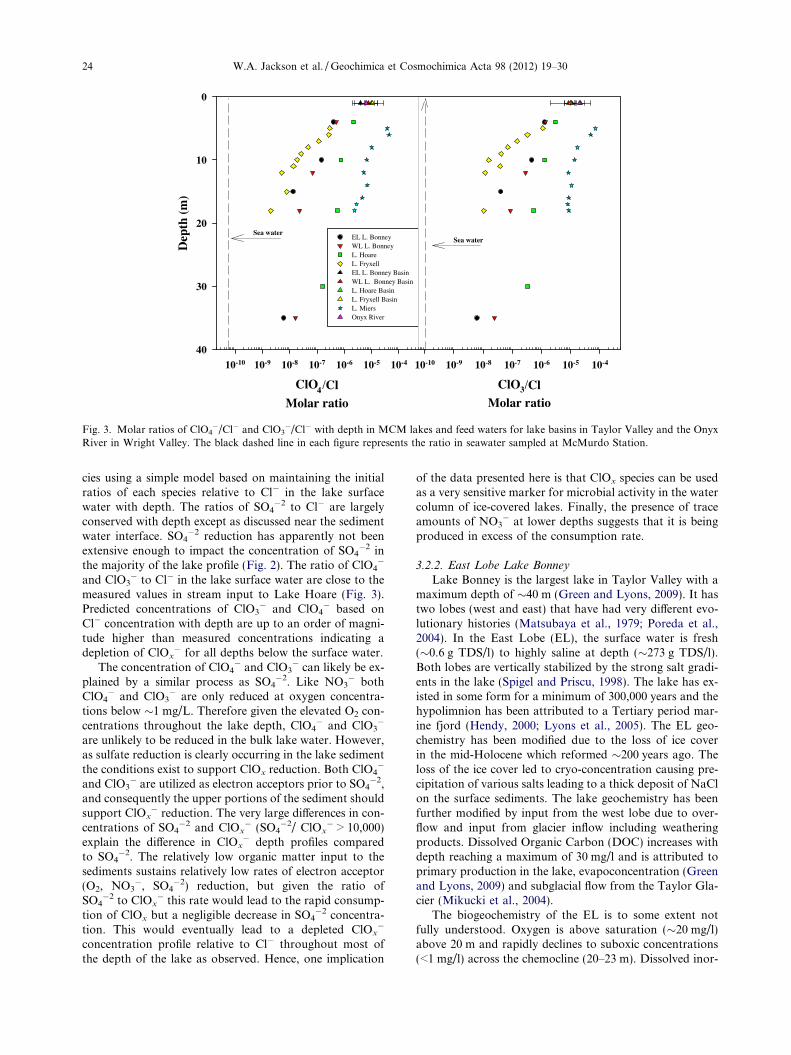
Our results show that ClO4� and ClO3
� in Lake Hoareare present throughout the water column at concentrationsranging from 0.1 to 0.3 and 0.15 to 0.42 lg/L, respectively(Fig. 2). Concentrations were lowest near the surface and atthe sediment interface with a peak concentration near 10 m.As previously reported, Cl� concentrations decrease expo-nentially towards the surface. SO4
�2 follows a similar trendincreasing proportionally to Cl� with the exception of thedeepest sample (30 m) consistent with the presence of H2Sat the same depth. Neither ClO4
� nor ClO3� concentrations
increase proportionally to Cl�, although the concentrationsdo initially increase.
This relationship with Cl� is further highlighted by thepredicted concentrations (dashed lines Fig. 2) of these spe-
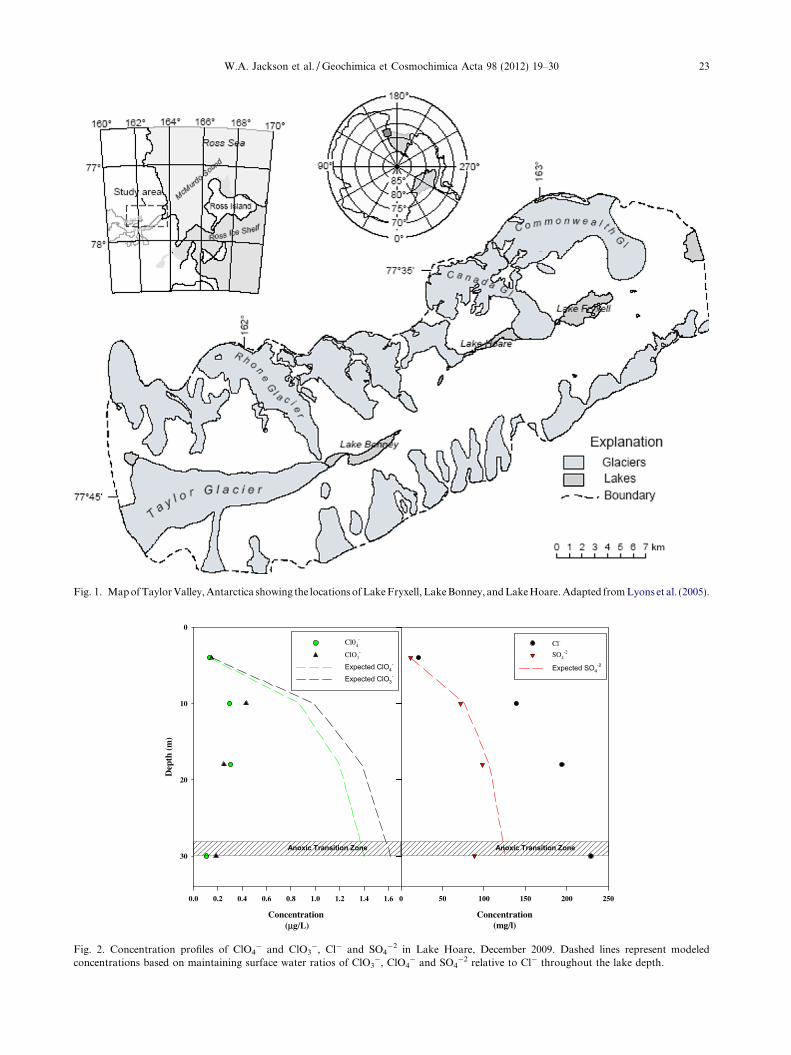
Fig. 1. Map of Taylor Valley, Antarctica showing the locations of Lake Fryxell, Lake Bonney, and Lake Hoare. Adapted from Lyons et al. (2005).
Concentration (µg/L)
0.0 0.2 0.4 0.6 0.8 1.0 1.2 1.4 1.6
Dep
th (
m)
0
10
20
30
Cl04-
ClO3-
Expected ClO4-
Expected ClO3-
Concentration(mg/l)
0 50 100 150 200 250
Cl-
SO4-2
Expected SO4-2
Anoxic Transition Zone Anoxic Transition Zone
Fig. 2. Concentration profiles of ClO4� and ClO3
�, Cl� and SO4�2 in Lake Hoare, December 2009. Dashed lines represent modeled
concentrations based on maintaining surface water ratios of ClO3�, ClO4
� and SO4�2 relative to Cl� throughout the lake depth.
W.A. Jackson et al. / Geochimica et Cosmochimica Acta 98 (2012) 19–30 23
ClO4/ClMolar ratio
10-10 10-9 10-8 10-7 10-6 10-5 10-4
Dep
th (
m)
0
10
20
30
40
EL L. Bonney WL L. BonneyL. Hoare L. FryxellEL L. Bonney Basin WL L. Bonney BasinL. Hoare Basin L. Fryxell BasinL. MiersOnyx River
ClO3/ClMolar ratio
10-10 10-9 10-8 10-7 10-6 10-5 10-4
Sea waterSea water
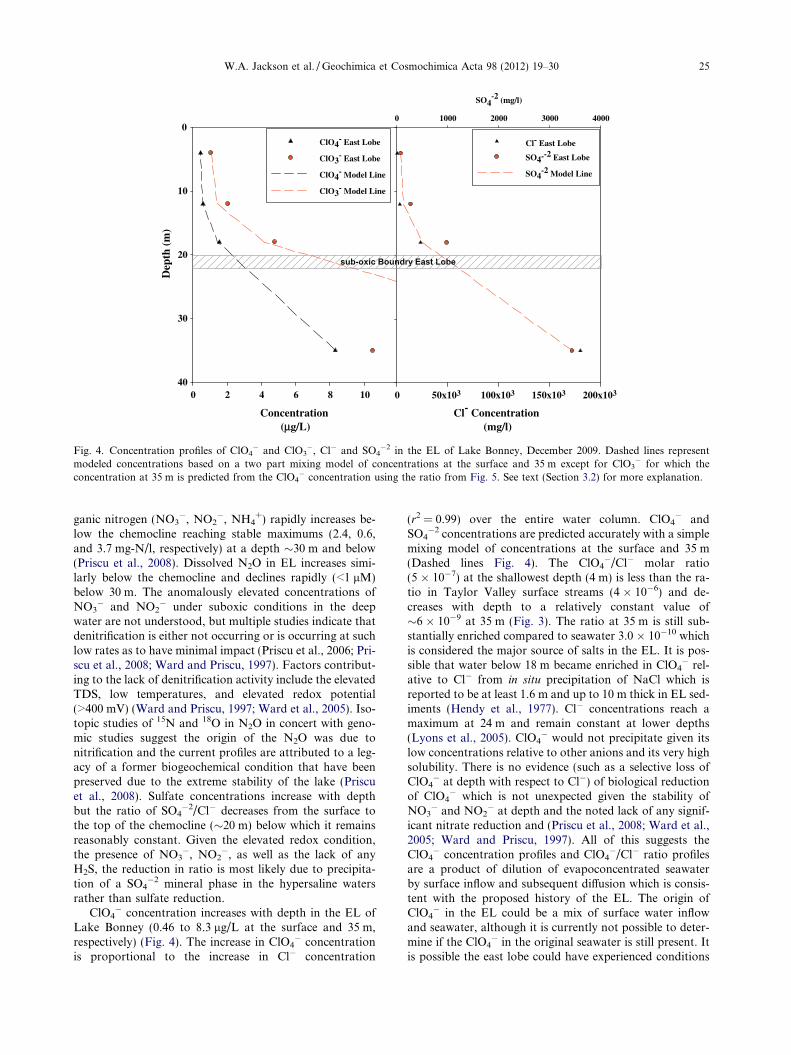
Fig. 3. Molar ratios of ClO4�/Cl� and ClO3
�/Cl� with depth in MCM lakes and feed waters for lake basins in Taylor Valley and the OnyxRiver in Wright Valley. The black dashed line in each figure represents the ratio in seawater sampled at McMurdo Station.
24 W.A. Jackson et al. / Geochimica et Cosmochimica Acta 98 (2012) 19–30
cies using a simple model based on maintaining the initialratios of each species relative to Cl� in the lake surfacewater with depth. The ratios of SO4
�2 to Cl� are largelyconserved with depth except as discussed near the sedimentwater interface. SO4
�2 reduction has apparently not beenextensive enough to impact the concentration of SO4
�2 inthe majority of the lake profile (Fig. 2). The ratio of ClO4
�
and ClO3� to Cl� in the lake surface water are close to the
measured values in stream input to Lake Hoare (Fig. 3).Predicted concentrations of ClO3
� and ClO4� based on
Cl� concentration with depth are up to an order of magni-tude higher than measured concentrations indicating adepletion of ClOx
� for all depths below the surface water.The concentration of ClO4
� and ClO3� can likely be ex-
plained by a similar process as SO4�2. Like NO3
� bothClO4
� and ClO3� are only reduced at oxygen concentra-
tions below �1 mg/L. Therefore given the elevated O2 con-centrations throughout the lake depth, ClO4
� and ClO3�
are unlikely to be reduced in the bulk lake water. However,as sulfate reduction is clearly occurring in the lake sedimentthe conditions exist to support ClOx reduction. Both ClO4
�
and ClO3� are utilized as electron acceptors prior to SO4
�2,and consequently the upper portions of the sediment shouldsupport ClOx
� reduction. The very large differences in con-centrations of SO4
�2 and ClOx� (SO4
�2/ ClOx� > 10,000)
explain the difference in ClOx� depth profiles compared
to SO4�2. The relatively low organic matter input to the
sediments sustains relatively low rates of electron acceptor(O2, NO3
�, SO4�2) reduction, but given the ratio of
SO4�2 to ClOx
� this rate would lead to the rapid consump-tion of ClOx but a negligible decrease in SO4
�2 concentra-tion. This would eventually lead to a depleted ClOx
�
concentration profile relative to Cl� throughout most ofthe depth of the lake as observed. Hence, one implication
of the data presented here is that ClOx species can be usedas a very sensitive marker for microbial activity in the watercolumn of ice-covered lakes. Finally, the presence of traceamounts of NO3
� at lower depths suggests that it is beingproduced in excess of the consumption rate.
3.2.2. East Lobe Lake Bonney
Lake Bonney is the largest lake in Taylor Valley with amaximum depth of �40 m (Green and Lyons, 2009). It hastwo lobes (west and east) that have had very different evo-lutionary histories (Matsubaya et al., 1979; Poreda et al.,2004). In the East Lobe (EL), the surface water is fresh(�0.6 g TDS/l) to highly saline at depth (�273 g TDS/l).Both lobes are vertically stabilized by the strong salt gradi-ents in the lake (Spigel and Priscu, 1998). The lake has ex-isted in some form for a minimum of 300,000 years and thehypolimnion has been attributed to a Tertiary period mar-ine fjord (Hendy, 2000; Lyons et al., 2005). The EL geo-chemistry has been modified due to the loss of ice coverin the mid-Holocene which reformed �200 years ago. Theloss of the ice cover led to cryo-concentration causing pre-cipitation of various salts leading to a thick deposit of NaClon the surface sediments. The lake geochemistry has beenfurther modified by input from the west lobe due to over-flow and input from glacier inflow including weatheringproducts. Dissolved Organic Carbon (DOC) increases withdepth reaching a maximum of 30 mg/l and is attributed toprimary production in the lake, evapoconcentration (Greenand Lyons, 2009) and subglacial flow from the Taylor Gla-cier (Mikucki et al., 2004).
The biogeochemistry of the EL is to some extent notfully understood. Oxygen is above saturation (�20 mg/l)above 20 m and rapidly declines to suboxic concentrations(<1 mg/l) across the chemocline (20–23 m). Dissolved inor-
Concentration (µµg/L)
0 2 4 6 8 10
Dep
th (
m)
0
10
20
30
40
ClO4- East Lobe
ClO3- East Lobe
ClO4- Model Line
ClO3- Model Line
Cl- Concentration (mg/l)
0 50x103 100x103 150x103 200x103
SO4-2 (mg/l)
0 1000 2000 3000 4000
Cl- East Lobe
SO4--2 East Lobe
SO4-2 Model Line
sub-oxic Boundry East Lobe
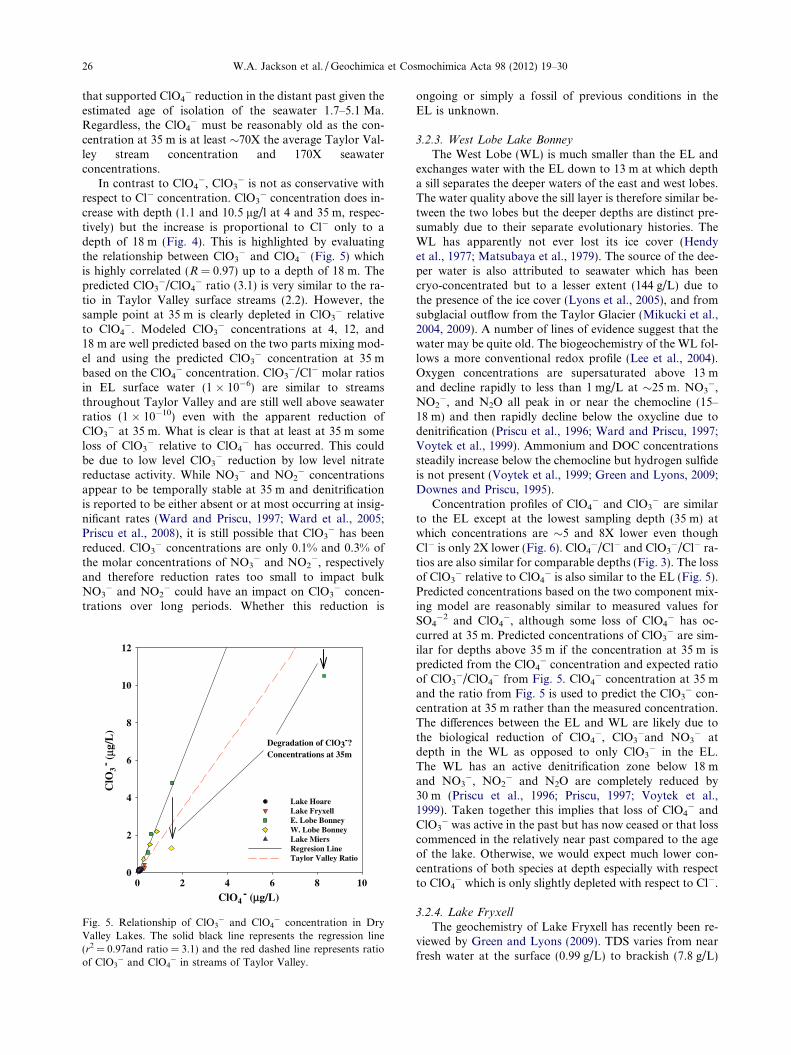
Fig. 4. Concentration profiles of ClO4� and ClO3
�, Cl� and SO4�2 in the EL of Lake Bonney, December 2009. Dashed lines represent
modeled concentrations based on a two part mixing model of concentrations at the surface and 35 m except for ClO3� for which the
concentration at 35 m is predicted from the ClO4� concentration using the ratio from Fig. 5. See text (Section 3.2) for more explanation.
W.A. Jackson et al. / Geochimica et Cosmochimica Acta 98 (2012) 19–30 25
ganic nitrogen (NO3�, NO2
�, NH4+) rapidly increases be-
low the chemocline reaching stable maximums (2.4, 0.6,and 3.7 mg-N/l, respectively) at a depth �30 m and below(Priscu et al., 2008). Dissolved N2O in EL increases simi-larly below the chemocline and declines rapidly (<1 lM)below 30 m. The anomalously elevated concentrations ofNO3
� and NO2� under suboxic conditions in the deep
water are not understood, but multiple studies indicate thatdenitrification is either not occurring or is occurring at suchlow rates as to have minimal impact (Priscu et al., 2006; Pri-scu et al., 2008; Ward and Priscu, 1997). Factors contribut-ing to the lack of denitrification activity include the elevatedTDS, low temperatures, and elevated redox potential(>400 mV) (Ward and Priscu, 1997; Ward et al., 2005). Iso-topic studies of 15N and 18O in N2O in concert with geno-mic studies suggest the origin of the N2O was due tonitrification and the current profiles are attributed to a leg-acy of a former biogeochemical condition that have beenpreserved due to the extreme stability of the lake (Priscuet al., 2008). Sulfate concentrations increase with depthbut the ratio of SO4
�2/Cl� decreases from the surface tothe top of the chemocline (�20 m) below which it remainsreasonably constant. Given the elevated redox condition,the presence of NO3
�, NO2�, as well as the lack of any
H2S, the reduction in ratio is most likely due to precipita-tion of a SO4
�2 mineral phase in the hypersaline watersrather than sulfate reduction.
ClO4� concentration increases with depth in the EL of
Lake Bonney (0.46 to 8.3 lg/L at the surface and 35 m,respectively) (Fig. 4). The increase in ClO4
� concentrationis proportional to the increase in Cl� concentration
(r2 = 0.99) over the entire water column. ClO4� and
SO4�2 concentrations are predicted accurately with a simple
mixing model of concentrations at the surface and 35 m(Dashed lines Fig. 4). The ClO4
�/Cl� molar ratio(5 � 10�7) at the shallowest depth (4 m) is less than the ra-tio in Taylor Valley surface streams (4 � 10�6) and de-creases with depth to a relatively constant value of�6 � 10�9 at 35 m (Fig. 3). The ratio at 35 m is still sub-stantially enriched compared to seawater 3.0 � 10�10 whichis considered the major source of salts in the EL. It is pos-sible that water below 18 m became enriched in ClO4
� rel-ative to Cl� from in situ precipitation of NaCl which isreported to be at least 1.6 m and up to 10 m thick in EL sed-iments (Hendy et al., 1977). Cl� concentrations reach amaximum at 24 m and remain constant at lower depths(Lyons et al., 2005). ClO4
� would not precipitate given itslow concentrations relative to other anions and its very highsolubility. There is no evidence (such as a selective loss ofClO4
� at depth with respect to Cl�) of biological reductionof ClO4
� which is not unexpected given the stability ofNO3
� and NO2� at depth and the noted lack of any signif-
icant nitrate reduction and (Priscu et al., 2008; Ward et al.,2005; Ward and Priscu, 1997). All of this suggests theClO4
� concentration profiles and ClO4�/Cl� ratio profiles
are a product of dilution of evapoconcentrated seawaterby surface inflow and subsequent diffusion which is consis-tent with the proposed history of the EL. The origin ofClO4
� in the EL could be a mix of surface water inflowand seawater, although it is currently not possible to deter-mine if the ClO4
� in the original seawater is still present. Itis possible the east lobe could have experienced conditions
26 W.A. Jackson et al. / Geochimica et Cosmochimica Acta 98 (2012) 19–30
that supported ClO4� reduction in the distant past given the
estimated age of isolation of the seawater 1.7–5.1 Ma.Regardless, the ClO4
� must be reasonably old as the con-centration at 35 m is at least �70X the average Taylor Val-ley stream concentration and 170X seawaterconcentrations.
In contrast to ClO4�, ClO3
� is not as conservative withrespect to Cl� concentration. ClO3
� concentration does in-crease with depth (1.1 and 10.5 lg/l at 4 and 35 m, respec-tively) but the increase is proportional to Cl� only to adepth of 18 m (Fig. 4). This is highlighted by evaluatingthe relationship between ClO3
� and ClO4� (Fig. 5) which
is highly correlated (R = 0.97) up to a depth of 18 m. Thepredicted ClO3
�/ClO4� ratio (3.1) is very similar to the ra-
tio in Taylor Valley surface streams (2.2). However, thesample point at 35 m is clearly depleted in ClO3
� relativeto ClO4
�. Modeled ClO3� concentrations at 4, 12, and
18 m are well predicted based on the two parts mixing mod-el and using the predicted ClO3
� concentration at 35 mbased on the ClO4
� concentration. ClO3�/Cl� molar ratios
in EL surface water (1 � 10�6) are similar to streamsthroughout Taylor Valley and are still well above seawaterratios (1 � 10�10) even with the apparent reduction ofClO3
� at 35 m. What is clear is that at least at 35 m someloss of ClO3
� relative to ClO4� has occurred. This could
be due to low level ClO3� reduction by low level nitrate
reductase activity. While NO3� and NO2
� concentrationsappear to be temporally stable at 35 m and denitrificationis reported to be either absent or at most occurring at insig-nificant rates (Ward and Priscu, 1997; Ward et al., 2005;Priscu et al., 2008), it is still possible that ClO3
� has beenreduced. ClO3
� concentrations are only 0.1% and 0.3% ofthe molar concentrations of NO3
� and NO2�, respectively
and therefore reduction rates too small to impact bulkNO3
� and NO2� could have an impact on ClO3
� concen-trations over long periods. Whether this reduction is
ClO4- (µµg/L)
0 2 4 6 8 10
ClO
3-
( µg/
L)
0
2
4
6
8
10
12
Lake HoareLake FryxellE. Lobe BonneyW. Lobe Bonney Lake MiersRegresion LineTaylor Valley Ratio
Degradation of ClO3-?Concentrations at 35m
Fig. 5. Relationship of ClO3� and ClO4
� concentration in DryValley Lakes. The solid black line represents the regression line(r2 = 0.97and ratio = 3.1) and the red dashed line represents ratioof ClO3
� and ClO4� in streams of Taylor Valley.
ongoing or simply a fossil of previous conditions in theEL is unknown.
3.2.3. West Lobe Lake Bonney
The West Lobe (WL) is much smaller than the EL andexchanges water with the EL down to 13 m at which deptha sill separates the deeper waters of the east and west lobes.The water quality above the sill layer is therefore similar be-tween the two lobes but the deeper depths are distinct pre-sumably due to their separate evolutionary histories. TheWL has apparently not ever lost its ice cover (Hendyet al., 1977; Matsubaya et al., 1979). The source of the dee-per water is also attributed to seawater which has beencryo-concentrated but to a lesser extent (144 g/L) due tothe presence of the ice cover (Lyons et al., 2005), and fromsubglacial outflow from the Taylor Glacier (Mikucki et al.,2004, 2009). A number of lines of evidence suggest that thewater may be quite old. The biogeochemistry of the WL fol-lows a more conventional redox profile (Lee et al., 2004).Oxygen concentrations are supersaturated above 13 mand decline rapidly to less than 1 mg/L at �25 m. NO3
�,NO2
�, and N2O all peak in or near the chemocline (15–18 m) and then rapidly decline below the oxycline due todenitrification (Priscu et al., 1996; Ward and Priscu, 1997;Voytek et al., 1999). Ammonium and DOC concentrationssteadily increase below the chemocline but hydrogen sulfideis not present (Voytek et al., 1999; Green and Lyons, 2009;Downes and Priscu, 1995).
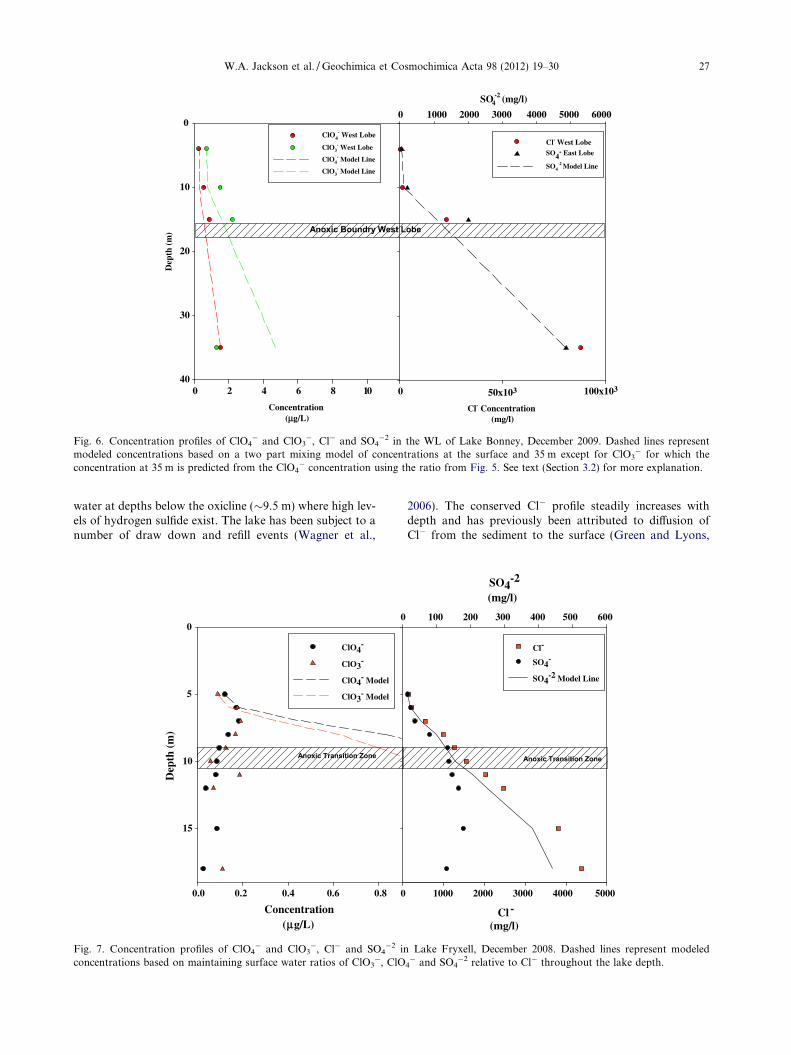
Concentration profiles of ClO4� and ClO3
� are similarto the EL except at the lowest sampling depth (35 m) atwhich concentrations are �5 and 8X lower even thoughCl� is only 2X lower (Fig. 6). ClO4
�/Cl� and ClO3�/Cl� ra-
tios are also similar for comparable depths (Fig. 3). The lossof ClO3
� relative to ClO4� is also similar to the EL (Fig. 5).
Predicted concentrations based on the two component mix-ing model are reasonably similar to measured values forSO4
�2 and ClO4�, although some loss of ClO4
� has oc-curred at 35 m. Predicted concentrations of ClO3
� are sim-ilar for depths above 35 m if the concentration at 35 m ispredicted from the ClO4
� concentration and expected ratioof ClO3
�/ClO4� from Fig. 5. ClO4
� concentration at 35 mand the ratio from Fig. 5 is used to predict the ClO3
� con-centration at 35 m rather than the measured concentration.The differences between the EL and WL are likely due tothe biological reduction of ClO4
�, ClO3�and NO3
� atdepth in the WL as opposed to only ClO3
� in the EL.The WL has an active denitrification zone below 18 mand NO3
�, NO2� and N2O are completely reduced by
30 m (Priscu et al., 1996; Priscu, 1997; Voytek et al.,1999). Taken together this implies that loss of ClO4
� andClO3
� was active in the past but has now ceased or that losscommenced in the relatively near past compared to the ageof the lake. Otherwise, we would expect much lower con-centrations of both species at depth especially with respectto ClO4
� which is only slightly depleted with respect to Cl�.
3.2.4. Lake Fryxell
The geochemistry of Lake Fryxell has recently been re-viewed by Green and Lyons (2009). TDS varies from nearfresh water at the surface (0.99 g/L) to brackish (7.8 g/L)
Concentration (µµg/L)
0 2 4 6 8 10
Dep
th (
m)
0
10
20
30
40
ClO4- West Lobe
ClO3- West Lobe
ClO4- Model Line
ClO3- Model Line
Cl- Concentration (mg/l)
0 50x103 100x103
SO4-2 (mg/l)
0 1000 2000 3000 4000 5000 6000
Cl- West LobeSO4
- East Lobe
SO4-2 Model Line
Anoxic Boundry West Lobe
Fig. 6. Concentration profiles of ClO4� and ClO3
�, Cl� and SO4�2 in the WL of Lake Bonney, December 2009. Dashed lines represent
modeled concentrations based on a two part mixing model of concentrations at the surface and 35 m except for ClO3� for which the
concentration at 35 m is predicted from the ClO4� concentration using the ratio from Fig. 5. See text (Section 3.2) for more explanation.
W.A. Jackson et al. / Geochimica et Cosmochimica Acta 98 (2012) 19–30 27
water at depths below the oxicline (�9.5 m) where high lev-els of hydrogen sulfide exist. The lake has been subject to anumber of draw down and refill events (Wagner et al.,
Concentration(µµg/L)
0.0 0.2 0.4 0.6 0.8
Dep
th (
m)
0
5
10
15
ClO4-
ClO3-
ClO4- Model
ClO3- Model
0
0
Anoxic Transition Zone
Fig. 7. Concentration profiles of ClO4� and ClO3
�, Cl� and SO4�2 i
concentrations based on maintaining surface water ratios of ClO3�, ClO
2006). The conserved Cl� profile steadily increases withdepth and has previously been attributed to diffusion ofCl� from the sediment to the surface (Green and Lyons,
Cl -
(mg/l)
1000 2000 3000 4000 5000
SO4-2
(mg/l)
100 200 300 400 500 600
Cl-
SO4-
SO4-2 Model Line
Anoxic Transition Zone
n Lake Fryxell, December 2008. Dashed lines represent modeled
4� and SO4
�2 relative to Cl� throughout the lake depth.
28 W.A. Jackson et al. / Geochimica et Cosmochimica Acta 98 (2012) 19–30
2009). At depths above �9 m the water is supersaturatedwith O2 and between �9–11 m a chemocline exists in whichO2 is rapidly depleted and in which chlorophyll-a reaches aconcentration maximum (Priscu, 1995). SO4
�2 slowly in-creases with depth to a maximum at �11–12 m and thenrapidly decreases to below 0.1 mM at the sediment waterinterface. H2S reaches a maximum (1.4 mM) at the sedi-ment water interface and declines steadily to 9 m abovewhich it is not present (Aiken et al., 1996; Karr et al.,2005; Sattley and Madigan, 2006). An active sulfur oxidiz-ing population is present with a population maximum with-in the chemocline but extending into the anoxic depths.DOC distribution is similar to Cl� with a minimum at thesurface (�3.0 mg/L) and a maximum (31.2 mg/L) at thesediment water interface. Like Cl� the distribution ofDOC is attributed to diffusion from the sediment of de-graded and relic sediment organic matter, and new inputfrom surface water inflow (Aiken et al., 1996). NH4
+ wasreported to be near the detection limit from the surface tothe bottom of the chemocline, below which the concentra-tion steadily increases to a maximum (5.6 mg-N/l) at thesediment water interface. NO3
� was below detection forall depths and NO2
� was present at trace concentrations(<0.0042 mg-N/L) at 7 m and below 15 m (Voytek et al.,1999).
Concentrations of both ClO4� and ClO3
� increaseslightly from 5 m to a maximum at 7 m and then declinesteadily to just below the chemocline at 10 m below whichthey remain relatively constant (Fig. 7). Concentrations atdepths above 9 m are generally similar to surface water con-centrations in Taylor Valley (Table 1). The ratio of ClO4
�/Cl and ClO3
�/Cl are the lowest of all the lakes, likely due toboth the addition of Cl� from the sediment and stronglyreducing conditions below 11 m that facilitate ClO4
� andClO3
� bacterial reduction. Predicted concentrations based
Concentration (µµg/L)
0.0 0.2 0.4 0.6 0.8 1.0 1.2
Dep
th (
m)
0
5
10
15
20
ClO4-
ClO3-
ClO4- Model
ClO3- Model
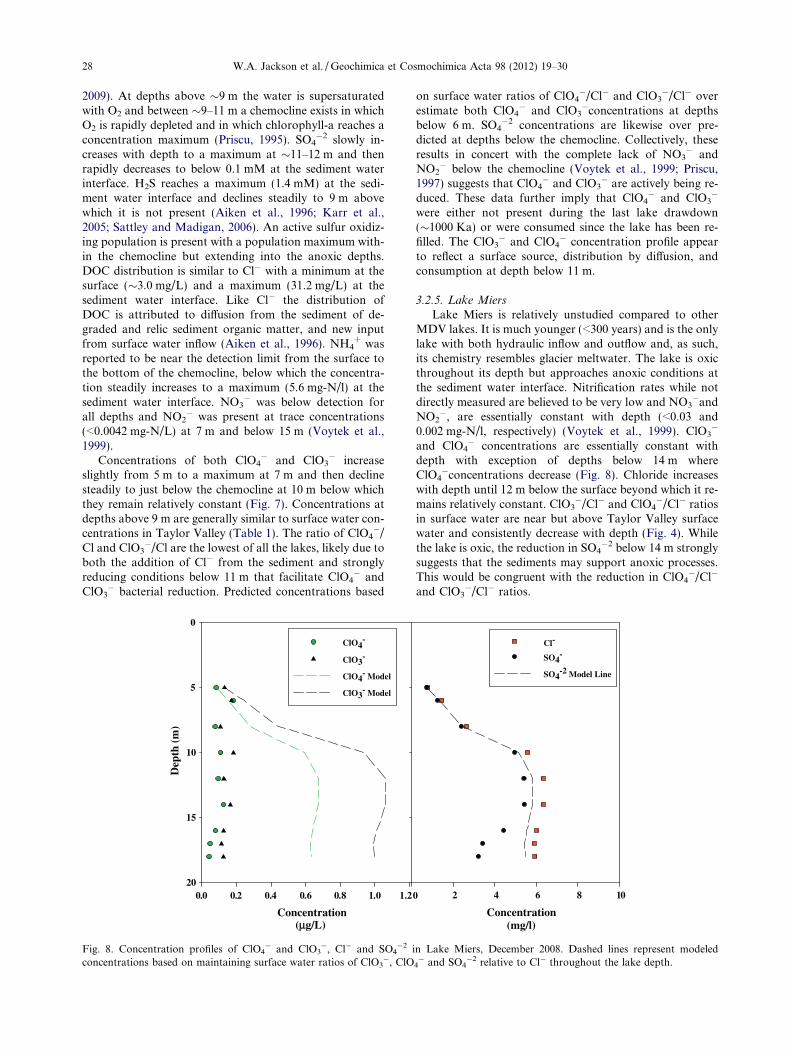
Fig. 8. Concentration profiles of ClO4� and ClO3
�, Cl� and SO4�2 i
concentrations based on maintaining surface water ratios of ClO3�, ClO
on surface water ratios of ClO4�/Cl� and ClO3
�/Cl� overestimate both ClO4
� and ClO3�concentrations at depths
below 6 m. SO4�2 concentrations are likewise over pre-
dicted at depths below the chemocline. Collectively, theseresults in concert with the complete lack of NO3
� andNO2
� below the chemocline (Voytek et al., 1999; Priscu,1997) suggests that ClO4
� and ClO3� are actively being re-
duced. These data further imply that ClO4� and ClO3
�
were either not present during the last lake drawdown(�1000 Ka) or were consumed since the lake has been re-filled. The ClO3
� and ClO4� concentration profile appear
to reflect a surface source, distribution by diffusion, andconsumption at depth below 11 m.
3.2.5. Lake Miers
Lake Miers is relatively unstudied compared to otherMDV lakes. It is much younger (<300 years) and is the onlylake with both hydraulic inflow and outflow and, as such,its chemistry resembles glacier meltwater. The lake is oxicthroughout its depth but approaches anoxic conditions atthe sediment water interface. Nitrification rates while notdirectly measured are believed to be very low and NO3
�andNO2
�, are essentially constant with depth (<0.03 and0.002 mg-N/l, respectively) (Voytek et al., 1999). ClO3
�
and ClO4� concentrations are essentially constant with
depth with exception of depths below 14 m whereClO4
�concentrations decrease (Fig. 8). Chloride increaseswith depth until 12 m below the surface beyond which it re-mains relatively constant. ClO3
�/Cl� and ClO4�/Cl� ratios
in surface water are near but above Taylor Valley surfacewater and consistently decrease with depth (Fig. 4). Whilethe lake is oxic, the reduction in SO4
�2 below 14 m stronglysuggests that the sediments may support anoxic processes.This would be congruent with the reduction in ClO4
�/Cl�
and ClO3�/Cl� ratios.
0
Concentration(mg/l)
2 4 6 8 10
Cl-
SO4-
SO4-2 Model Line
n Lake Miers, December 2008. Dashed lines represent modeled
4� and SO4
�2 relative to Cl� throughout the lake depth.
W.A. Jackson et al. / Geochimica et Cosmochimica Acta 98 (2012) 19–30 29
3.3. Summary and Conclusions
ClO3� and ClO4
� are present throughout the water col-umns of the MDV lakes and other surface water bodies inthe area. Concentrations among surface water bodies aregenerally similar reflecting a common atmospheric source.Variations in streams are likely due to site-specific processes,such as the degree of evaporative concentration and the dif-ferential input of salts due to leaching of soils and aeolianmaterials and subsequent inflow to streams. The concentra-tions of ClO3
� and ClO4� in the ice-covered lakes are depen-
dent on both the total evaporative concentration that hasoccurred as well as the biological activity within each lake.The two relatively young lakes (Miers and Hoare), haveClO3
� and ClO4� concentrations and ratios of ClO3
�/Cl�
and ClO4�/Cl� in surface waters that are similar to source
streams, but suggest ClO3� and ClO4
� reduction at depthor in the sediments. Lake Fryxell has ClO3
� and ClO4� con-
centrations similar to input streams but ClO3�/Cl� and
ClO4�/Cl� ratios much lower due to the large Cl� source
in bottom sediments due to its complete evaporation in thepast. Based on the paucity of ClO3
� and ClO4� in the deep
waters, this lake appears to have supported ClO3� and ClO4
�
reduction at least back to the last draw down event. ClO3�
and ClO4� concentrations in Lake Bonney are the highest
of all the lakes reflecting the lake’s greater age and concentra-tion of Cl�. Similar to NO3
�, ClO4� appears to be stable in
the East Lobe and its concentration is highly correlated toCl� concentration. It is even possible that some ClO4
� atdepth is a remnant of the initial seawater that formed LakeBonney. In the West Lobe ClO3
� and ClO4� appear stable
at depths above the chemocline but have or are experiencingreduction at the deepest depth similar to NO3
�. Finally theconcentrations of ClO3
� and ClO4� are well correlated ex-
cept in cases where reduction has occurred.These lakes provide an excellent case study for ClO3
�
and ClO4� biotransformation in pristine extreme environ-
ments. Given their low concentrations, high solubility,and lack of any in situ generation mechanisms, they may of-fer a sensitive means to study ongoing biological activity inthe lakes, and the addition of ClO4
� stable isotope evalua-tion could provide further clues as to the geochemical his-tory of the lake water. Finally, ClO3
� and ClO4�
biogeochemistry in Antarctic ice-covered lakes may repre-sent an excellent analog for similar processes in ice-coveredlakes on Mars in the past (McKay and Davis, 1991), oreven in more recent times, especially given the discoveryof relatively large amounts of ClO4
� in the Martian soil(Hecht et al., 2009).
ACKNOWLEDGEMENTS
This work was supported by the Strategic Environmental Re-search and Development Program (SERDP Project ER-1435)and by NSF OPP grants 0432595 and 0631494. We are gratefulto the McMurdo Long Term Ecological Research Program for pro-viding water samples from the MDV and would especially like toacknowledge Kathy Welch and Amy Chiuchiolo for their timeand efforts. Work in the lab of J.D.C was supported by the EnergyBiosciences Institute, UC Berkeley, CA. A.F.D is supported by theNASA Exobiology program (Grant Number NNX12AD61G).
REFERENCES
Aiken G., McKnight D., Harnish R. and Wershaw R. (1996)Geochemistry of aquatic humic substances in the Lake FryxellBasin, Antarctica. Biogeochemistry 34, 157–188.
Bao H. M. and Gu B. H. (2004) Natural perchlorate has aunique oxygen isotope signature. Environ. Sci. Technol. 38,
5073–5077.
Bohlke J. K., Sturchio N. C., Gu B. H., Horita J., Brown G. M.,Jackson W. A., Batista J. and Hatzinger P. B. (2005) Perchlo-rate isotope forensics. Anal. Chem. 77, 7838–7842.
Clocksin K. M., Jung D. O. and Madigan M. T. (2007) Cold-activechemoorganotrophic bacteria from permanently ice-coveredLake Hoare, McMurdo Dry Valleys, Antarctica. Appl. Environ.
Microbiol. 73, 3077–3083.
Coates J. D. and Achenbach L. A. (2004) Microbial perchloratereduction: Rocket-fuelled metabolism. Nat. Rev. Microbiol. 2,
569–580.
Coates J. D. and Achenbach L. A. (2006) The microbiology ofperchlorate reduction and its bioremediative application. InPerchlorate, Environmental Occurrence, Interactions, and Treat-
ment (eds. B. Gu and J. D. Coates). Springer, New York, NY,
pp. 279–295.
De Groot G. N. and Stouthamer A. H. (1969) Regulation ofreductase formation in Proteus mirabilis. Arch. Microbiol. 66,
220–233.
Downes M. T. and Priscu J. C. (1995) Profiles of electrode potentialand dissolved oxygen in lakes of the McMurdo Dry Valleys.Antarct J Unit States 30, 305–307.
Ericksen G. E. (1981) Geology and origin of the Chilean nitratedeposits. In Geological Survey Professional Paper 1188. Gov-
ernment Printing Office, Reston, VA.
Furdui V. I. and Tomassini F. (2010) Trends and sources ofperchlorate in Arctic Snow. Environ. Sci. Technol. 44, 588–592.
Green W. J. and Lyons W. B. (2009) The Saline Lakes of theMcMurdo Dry Valleys, Antarctica. Aquat. Geochem. 15, 321–
348.
Hecht M. H., Kounaves S. P., Quinn R. C., West S. J., Young S.M. M., Ming D. W., Catling D. C., Clark B. C., Boynton W.V., Hoffman J., DeFlores L. P., Gospodinova K., Kapit J. andSmith P. H. (2009) Detection of perchlorate and the solublechemistry of Martian soil at the Phoenix Lander Site. Science
325, 64–67.
Hendy C. H. (2000) Late Quaternary lakes in the McMurdo Soundregion of Antarctica. Geografiska annaler series: A, Physical
geography. 82A, 411–432.
Hendy C. H., Wilson A. T., Popplewell K. B. and House D. A.(1977) Dating of geochemical events in Lake Bonney, Antarc-tica and their relation to glacial and climatic changes. NZ J.
Geol. Geophys. 20, 1103–1122.
Jackson W. A., Bohlke J. K., Gu B. H., Hatzinger P. B. andSturchio N. C. (2010) Isotopic composition and origin ofindigenous natural perchlorate and co-occurring nitrate in theSouthwestern United States. Environ. Sci. Technol. 44, 4869–
4876.
Kang N. G., Anderson T. A. and Jackson W. A. (2006)Photochemical formation of perchlorate from aqueous oxychl-orine anions. Anal. Chim. Acta 567, 48–56.
Kang N., Anderson T. A., Rao B. and Jackson W. A. (2009)Characteristics of perchlorate formation via photodissociationof aqueous chlorite. Environ. Chem. 6, 53–59.
Karr E. A., Sattley W. M., Rice M. R., Jung D. O., Madigan M. T.and Achenbach L. A. (2005) Diversity and distribution ofsulfate-reducing bacteria in permanently frozen Lake Fryxell,McMurdo Dry Valleys, Antarctica. Appl. Environ. Microbiol.
71, 6353–6359.
30 W.A. Jackson et al. / Geochimica et Cosmochimica Acta 98 (2012) 19–30
Kounaves S. P., Stroble S. T., Anderson R. M., Moore Q., CatlingD. C., Douglas S., McKay C. P., Ming D. W., Smith P. H.,Tamppari L. K. and Zent A. P. (2010) Discovery of naturalperchlorate in the Antarctic Dry Valleys and its globalimplications. Environ. Sci. Technol. 44, 2360–2364.
Lee P. A., Mikucki J. A., Foreman C. M., Priscu J. C., DiTullio G.R., Riseman S. F., de Mora S. J., Wolf C. F. and Kester L.(2004) Thermodynamic constraints on microbially mediatedprocesses in lakes of the McMurdo Dry Valleys, Antarctica.Geomicrobiol. J. 21, 1–17.
Lyons W. B., Tyler S. W., Wharton R. A., McKnight D. M. andVaughn B. H. (1998) A Late Holocene desiccation of LakeHoare and Lake Fryxell, McMurdo Dry Valleys, Antarctica.Antarct. Sci. 10, 247–256.
Lyons W. B., Fountain A., Doran P., Priscu J. C., Neumann K.and Welch K. A. (2000) Importance of landscape position andlegacy: the evolution of the lakes in Taylor Valley, Antarctica.Freshw. Biol. 43, 355–367.
Lyons W. B., Welch K. A., Snyder G., Olesik J., Graham E. Y.,Marion G. M. and Poreda R. J. (2005) Halogen geochemistryof the McMurdo dry valleys lakes, Antarctica: clues to theorigin of solutes and lake evolution. Geochim. Cosmochim. Acta
69, 305–323.
Matsubaya O., Sakai H., Torri T., Burton H. and Kerry K. (1979)Antarctic saline lakes-stable isotope ratios, chemical composi-tions, and evolution. Geochim. Cosmochim. Acta 43, 7–25.
McKay C. P. and Davis W. (1991) Duration of liquid waterhabitats on early Mars. Int. J. Solar Sys. Stud. 2, 214–221.
Mikucki J. A., Foreman C. M., Priscu J. C., Lyons W. B., SattlerB. and Welch K. (2004) Geomicrobiology of Blood Falls: asaline, iron-rich subglacial feature of Taylor Glacier, Antarc-tica. Aquat. Geochem. 10, 199–220.
Mikucki J. A., Pearson A., Johnston D. T., Turchyn A. V.,Farquhar J., Schrag D. P., Anbar A. D., Priscu J. C. and Lee P.A. (2009) A contemporary, microbially-maintained, ferroussubglacial ‘ocean’. Science 324, 397.
Pfaff J. D. (1993) US EPA Method 300.0, Methods for theDetermination of Inorganic Substances in EnvironmentalSamples, EPA-600/R-93-100, NTIS PB94-121811.
Poreda R. J., Hunt A. G., Lyons W. B. and Welch K. A. (2004)The helium isotopic chemistry of Lake Bonney, Taylor Valley,Antarctica: timing of Late Holocene climate change in Antarc-tica. Aquat. Geochem. 10, 353–371.
Priscu J. C. (1995) Phytoplankton nutrient deficiency in lakes of theMcMurdo Dry Valleys, Antarctica. Freshw. Biol. 34, 215–227.
Priscu J. C. (1997) The biogeochemistry of nitrous oxide inpermanently ice-covered lakes of the McMurdo Dry Valleys,Antarctica. Glob. Change Biol. 3, 301–305.
Priscu J. C., Downes M. T. and McKay C. P. (1996) Extremesupersaturation of nitrous oxide in a poorly ventilated Antarc-tic lake. Limnol. Oceanogr. 41, 1544–1551.
Priscu J. C., Christner B. C., Dore J. E., Westley M. B., Popp B.N., Casciotti K. L. and Lyons W. B. (2008) Supersaturated
N(2)O in a perennially ice-covered Antarctic lake: molecularand stable isotopic evidence for a biogeochemical relict. Limnol.
Oceanogr. 53, 2439–2450.
Rajagopalan S., Anderson T., Cox S., Harvey G., Cheng Q. Q. andJackson W. A. (2009) Perchlorate in wet deposition acrossNorth America. Environ. Sci. Technol. 43, 616–622.
Rao B., Anderson T. A., Redder A. and Jackson W. A. (2010a)Perchlorate Formation by ozone oxidation of aqueous chlorine/oxy-chlorine species: role of Cl(x)O(y) radicals. Environ. Sci.
Technol. 44, 2961–2967.
Rao B., Hatzinger P. B., Bohlke J. K., Sturchio N. C., Andraski B.J., Eckardt F. D. and Jackson W. A. (2010b) Natural chloratein the environment: application of a new IC-ESI/MS/MSmethod with a Cl(18)O(3)(�) internal standard. Environ. Sci.
Technol. 44, 8429–8434.
Rao B. A., Wake C. P., Anderson T. and Jackson W. A. (2012)Perchlorate depositional history as recorded in North Americanice cores from the Eclipse Icefield, Canada, and the UpperFremont Glacier, USA. Water Air Soil Pollut. 223, 181–188.
Roldan M. D., Reyes F., Morenovivian C. and Castillo F. (1994)Chlorate and nitrate reduction in the phototrophic bacteriarhodobacter-capsulatus and rhodobacter-sphaeroides. Curr.
Microbiol. 29, 241–245.
Sattley W. M. and Madigan M. T. (2006) Isolation, characteriza-tion, and ecology of cold-active, chemolithotrophic, sulfur-oxidizing bacteria from perennially ice-covered Lake Fryxell,Antarctica. Appl. Environ. Microbiol. 72, 5562–5568.
Spigel R. H., and Priscu J. C. (1998) Physical limnology of theMcMurdo Dry Valley lakes. In Ecosystems Dynamics in a Polar
Desert: The McMurdo Dry Valleys, Antarctica (ed. J. C. Priscu).Antarctica Research Series 72, American Geophysical Union,Washington, DC. pp. 153-187.
Voytek M. A., Priscu J. C. and Ward B. B. (1999) The distributionand relative abundance of ammonia-oxidizing bacteria in lakesof the McMurdo Dry Valley, Antarctica. Hydrobiologia 401,
113–130.
Wagner B., Melles M., Doran P. T., Kenig F., Forman S. L.,Pierau R. and Allen P. (2006) Glacial and postglacial sedimen-tation in the Fryxell Basin, Taylor Valley, southern VictoriaLand, Antarctica. Palaeogeogr. Palaeoclimatol. Palaeoecol. 241,
320–337.
Ward B. B. and Priscu J. C. (1997) Detection and characterizationof denitrifying bacteria from a permanently ice-covered Ant-arctic lake. Hydrobiologia 347, 57–68.
Ward B. B., Granger J., Maldonado M. T., Casciotti K. L., HarrisS. and Wells M. L. (2005) Denitrification in the hypolimnion ofpermanently ice-covered Lake Bonney, Antarctica. Aquat.
Microb. Ecol. 38, 295–307.
Associate editor: Karen Johannesson