per- and polyfluoroalkyl substances (pfas) remediation ... · per- and polyfluoroalkyl substances...
TRANSCRIPT
Presented by:
Mike Marley, M.Sc., CT LEPPrincipal
XDD Environmental
Do it Right, Do it once
Per- and Polyfluoroalkyl Substances (PFAS)
Remediation Workshop
Ellen Moyer, Ph.D., P.E.Principal
Greenvironment, LLC
Raymond Ball, Ph.D., P.E.Principal
EnChem Engineering, Inc.
October 18, 2017
Moderated by Dennis Keane, P.G., XDD Environmental

Agenda Introduction to Workshop and Objectives – Dennis Keane
General audience questions
Properties, Uses, Occurrence and Concerns with PFAS – Ellen Moyer Exercise 1
PFAS Remedial Options for Source and Plume Areas – Mike Marley Exercise 2
Break (5 minutes)
Integrating Key Data in the Characterization Phase – Mike Marley Exercise 3
Exercise 4
Adsorption Case Studies – Mike Marley Exercise 5
Chemical Oxidation Case Study – Raymond Ball
Wrap-Up / Summary of Current State of the Practice – Mike Marley
Additional Discussion – Dennis Keane
2
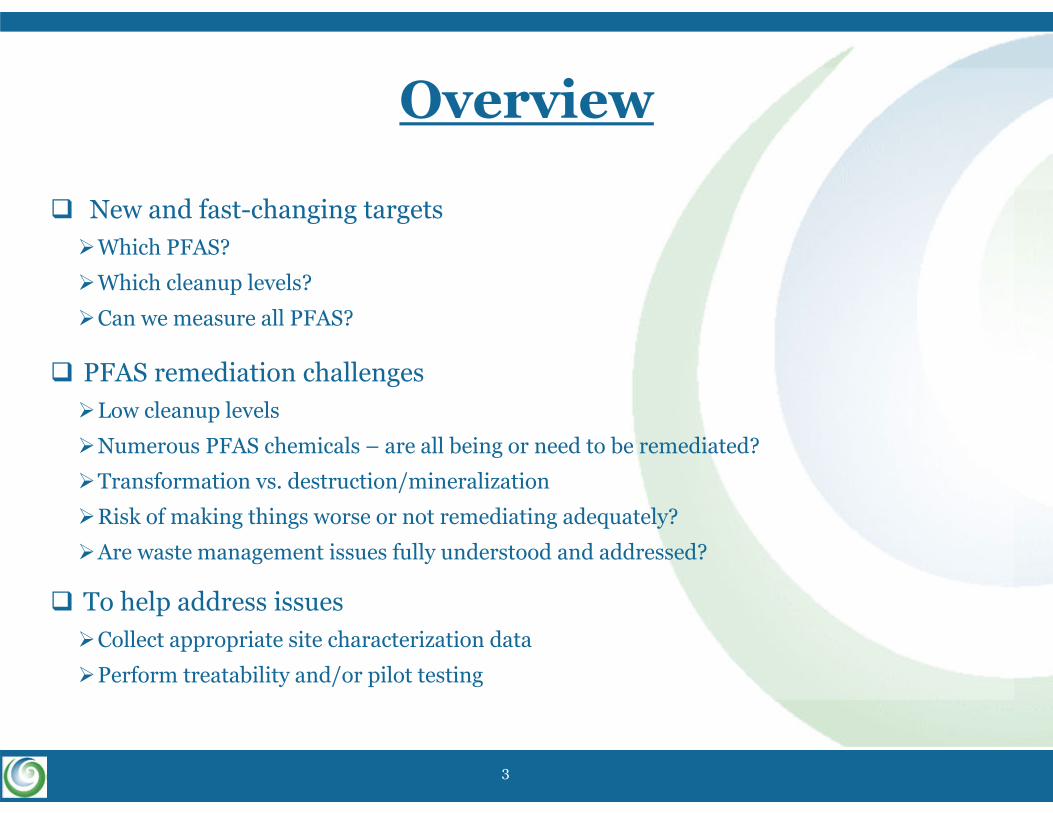
Overview
New and fast-changing targetsWhich PFAS?
Which cleanup levels?
Can we measure all PFAS?
PFAS remediation challengesLow cleanup levels
Numerous PFAS chemicals – are all being or need to be remediated?
Transformation vs. destruction/mineralization
Risk of making things worse or not remediating adequately?
Are waste management issues fully understood and addressed?
To help address issuesCollect appropriate site characterization data
Perform treatability and/or pilot testing
3
Properties, Uses, Occurrence and Concerns with PFAS
4
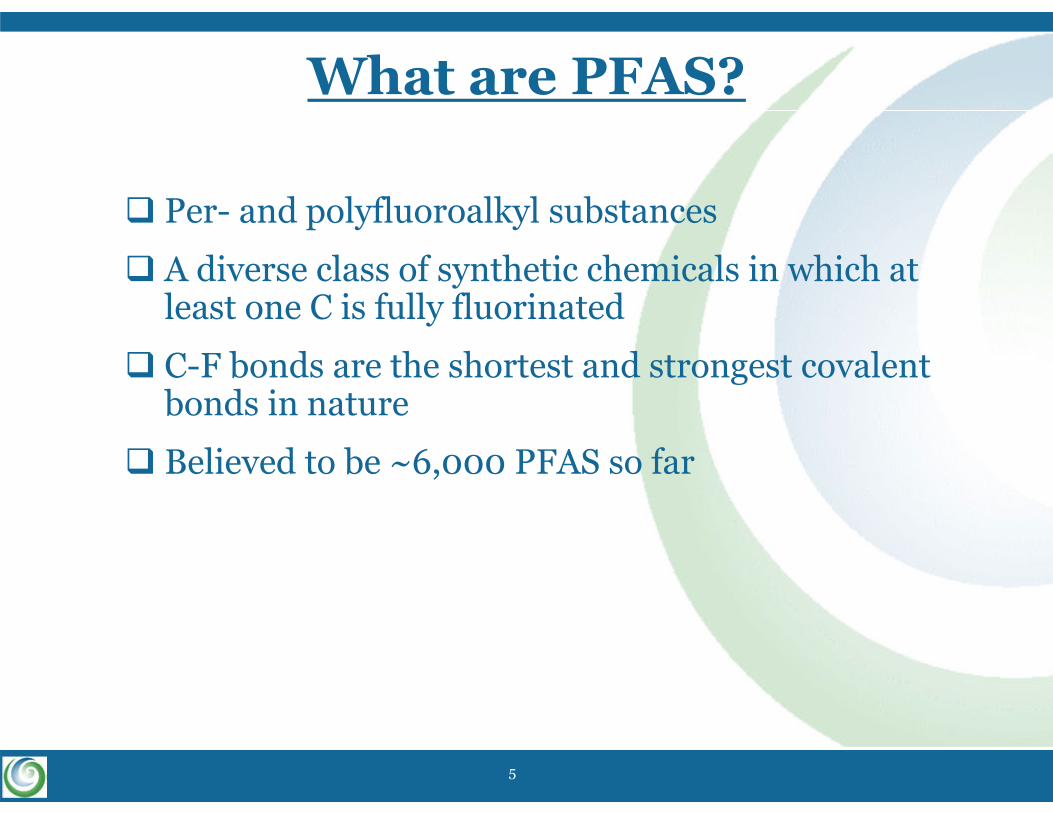
What are PFAS?
Per- and polyfluoroalkyl substances
A diverse class of synthetic chemicals in which at least one C is fully fluorinated
C-F bonds are the shortest and strongest covalent bonds in nature
Believed to be ~6,000 PFAS so far
5
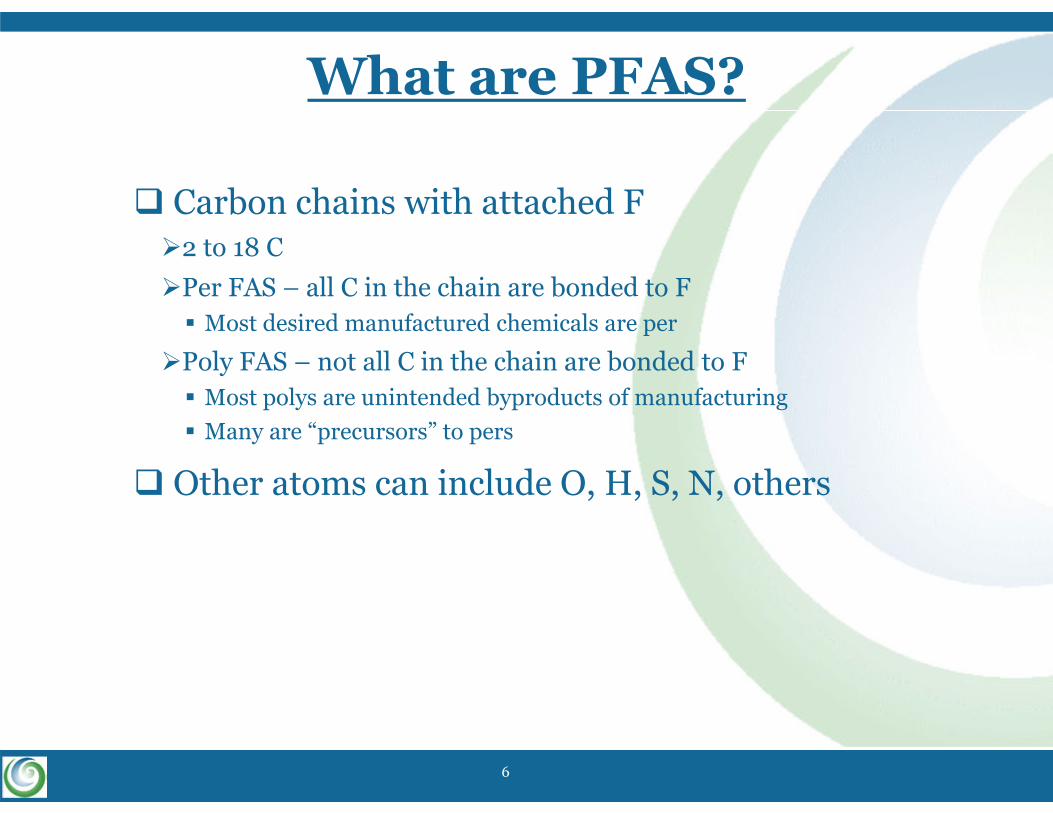
What are PFAS?
Carbon chains with attached F2 to 18 CPer FAS – all C in the chain are bonded to F Most desired manufactured chemicals are per
Poly FAS – not all C in the chain are bonded to F Most polys are unintended byproducts of manufacturing Many are “precursors” to pers
Other atoms can include O, H, S, N, others
6
What are PFAS?
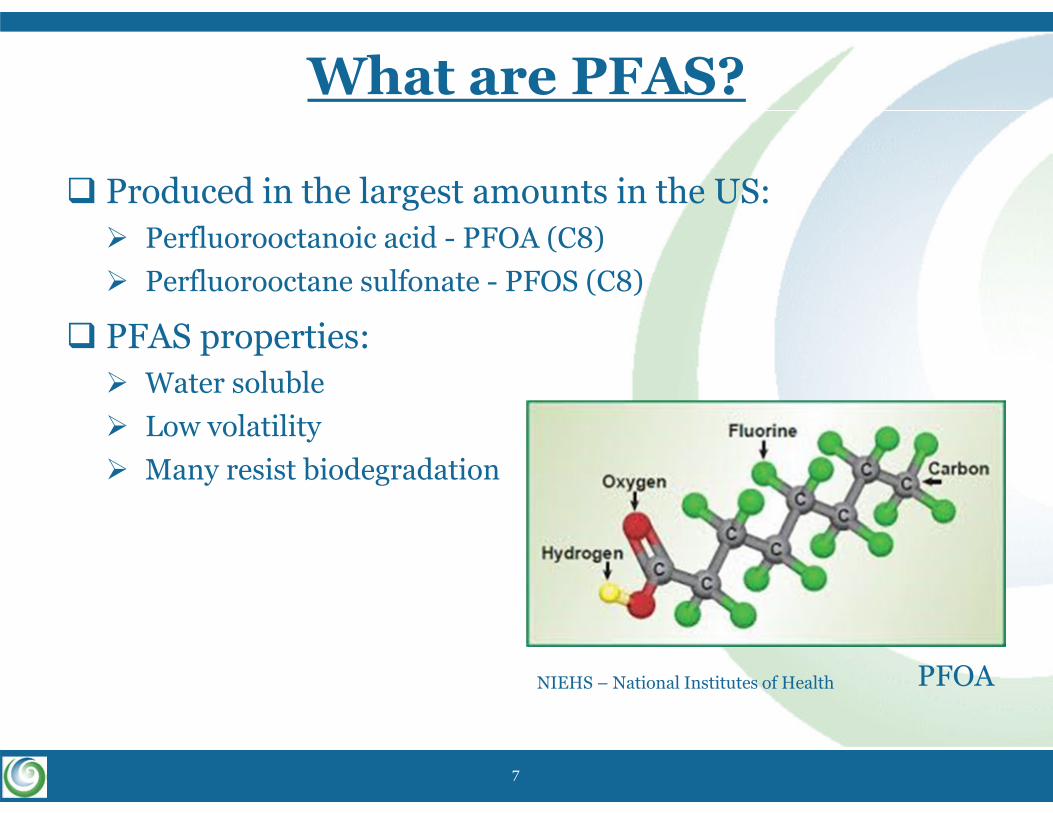
Produced in the largest amounts in the US: Perfluorooctanoic acid - PFOA (C8) Perfluorooctane sulfonate - PFOS (C8)
PFAS properties: Water soluble Low volatility Many resist biodegradation
PFOANIEHS – National Institutes of Health
7
8
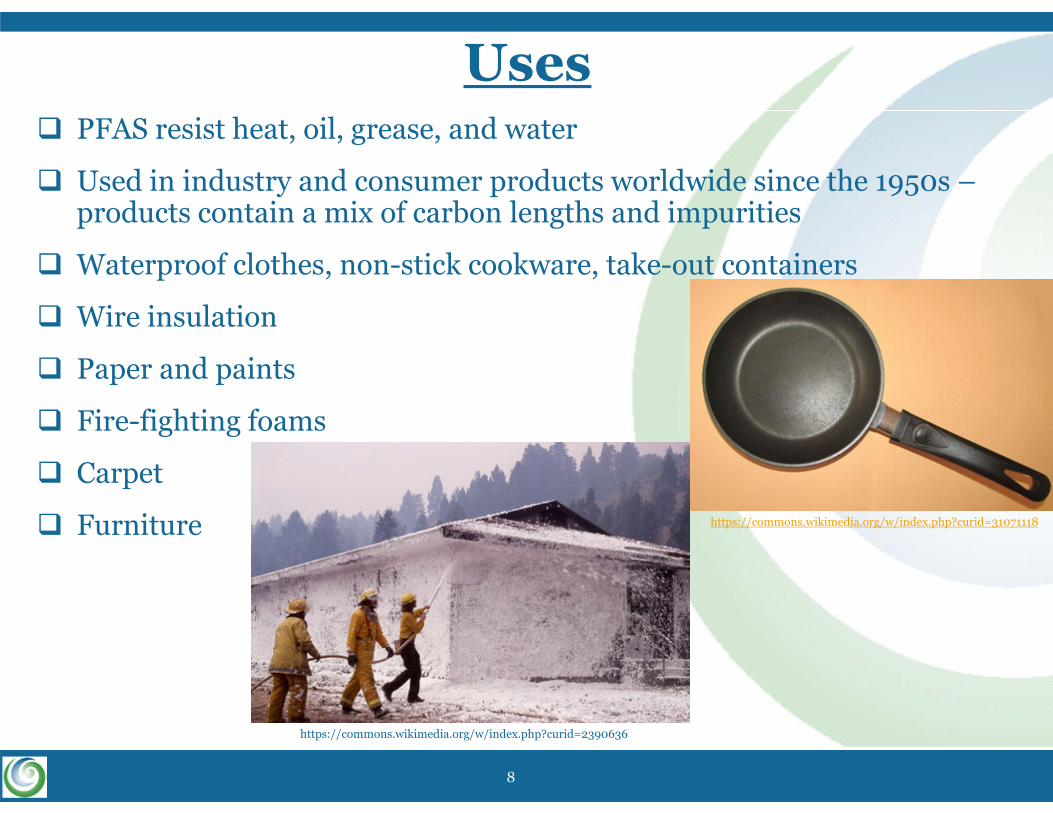
Uses PFAS resist heat, oil, grease, and water
Used in industry and consumer products worldwide since the 1950s –products contain a mix of carbon lengths and impurities
Waterproof clothes, non-stick cookware, take-out containers
Wire insulation
Paper and paints
Fire-fighting foams
Carpet
Furniture https://commons.wikimedia.org/w/index.php?curid=31071118
https://commons.wikimedia.org/w/index.php?curid=2390636

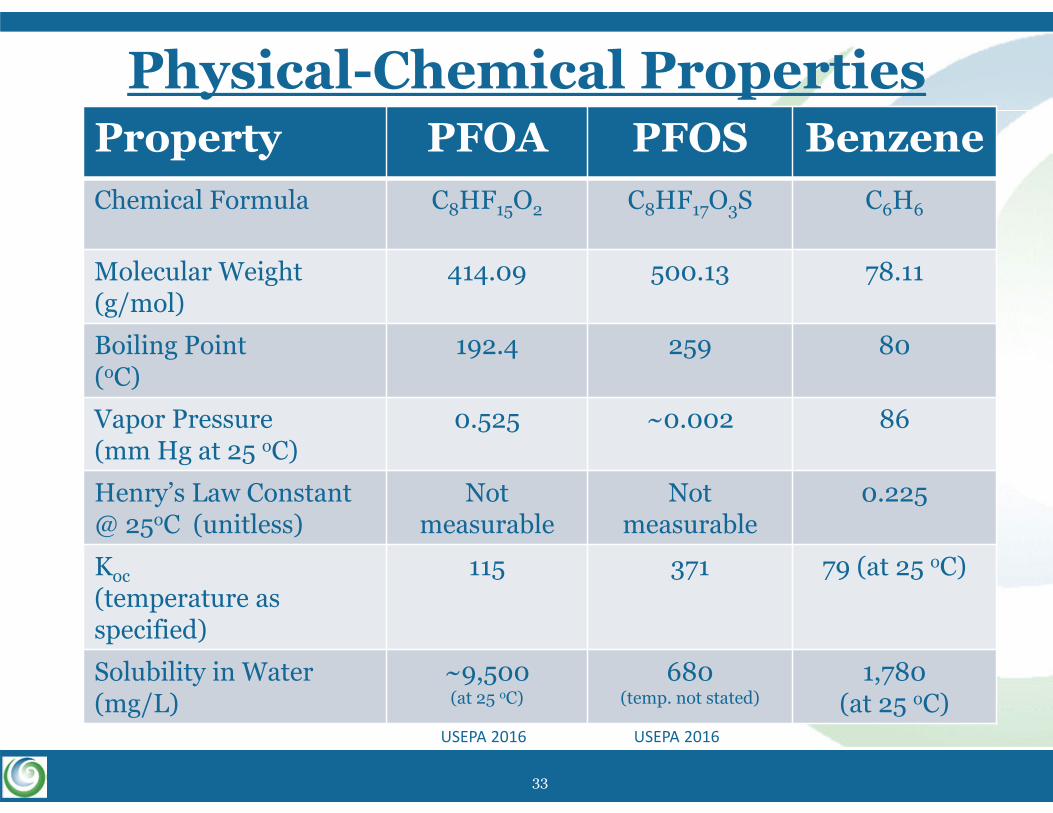
Physical-Chemical PropertiesProperty PFOA PFOS BenzeneChemical Formula C8HF15O2 C8HF17O3S C6H6
Molecular Weight (g/mol)
414.09 500.13 78.11
Boiling Point (oC)
192.4 259 80
Vapor Pressure (mm Hg at 25 oC)
0.525 ~0.002 86
Henry’s Law Constant @ 25oC (unitless)
Not measurable
Not measurable
0.225
Koc(temperature asspecified)
115 371 79 (at 25 oC)
Solubility in Water (mg/L)
~9,500 (at 25 oC)
680 (temp. not stated)
1,780(at 25 oC)
USEPA 2016 USEPA 2016
9
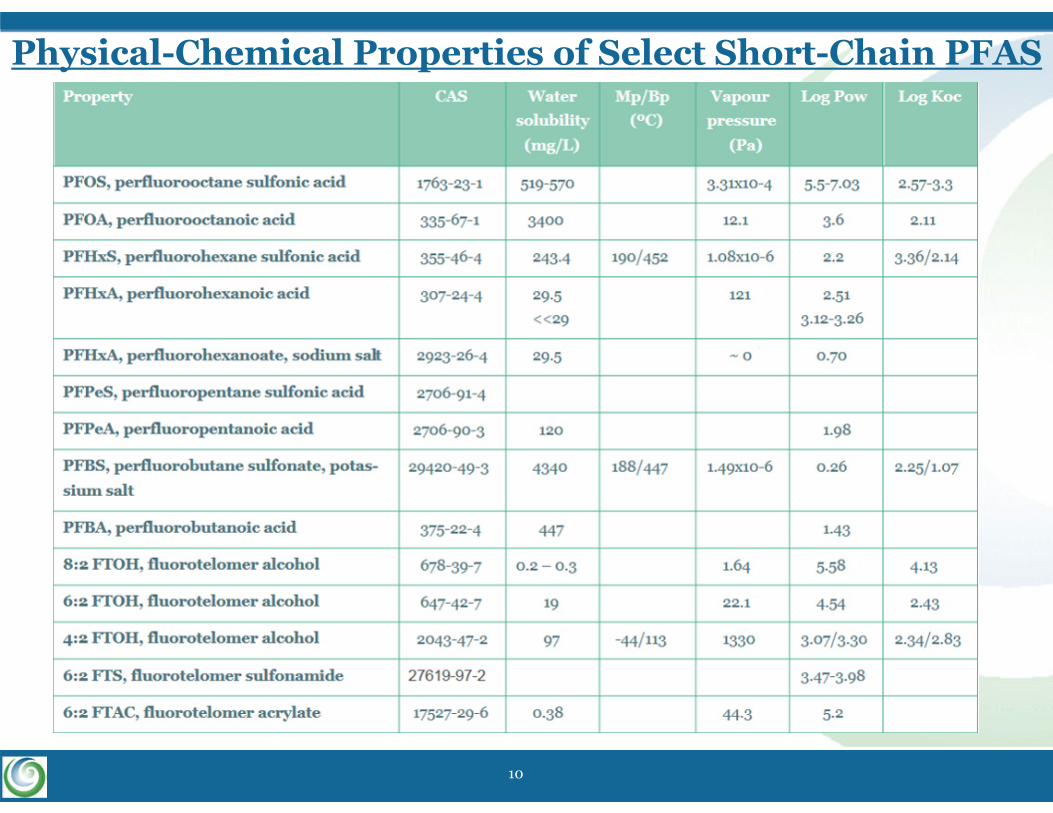
Physical-Chemical Properties of Select Short-Chain PFAS
10
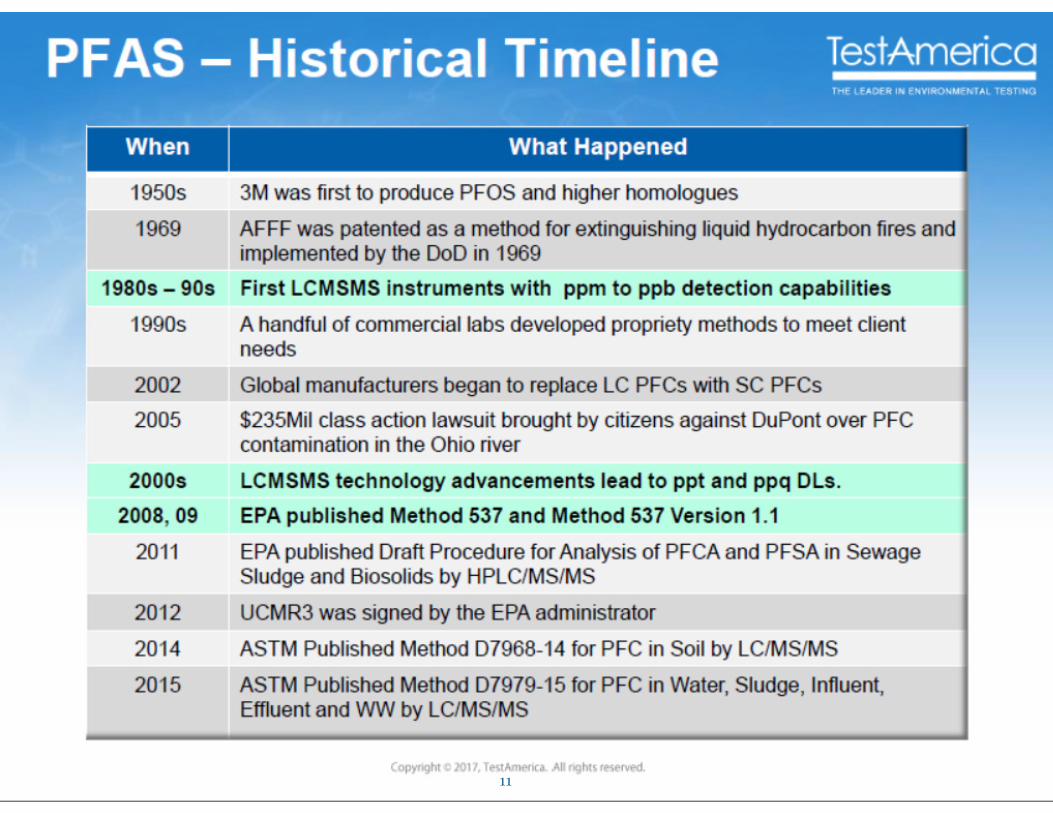
10/19/201711
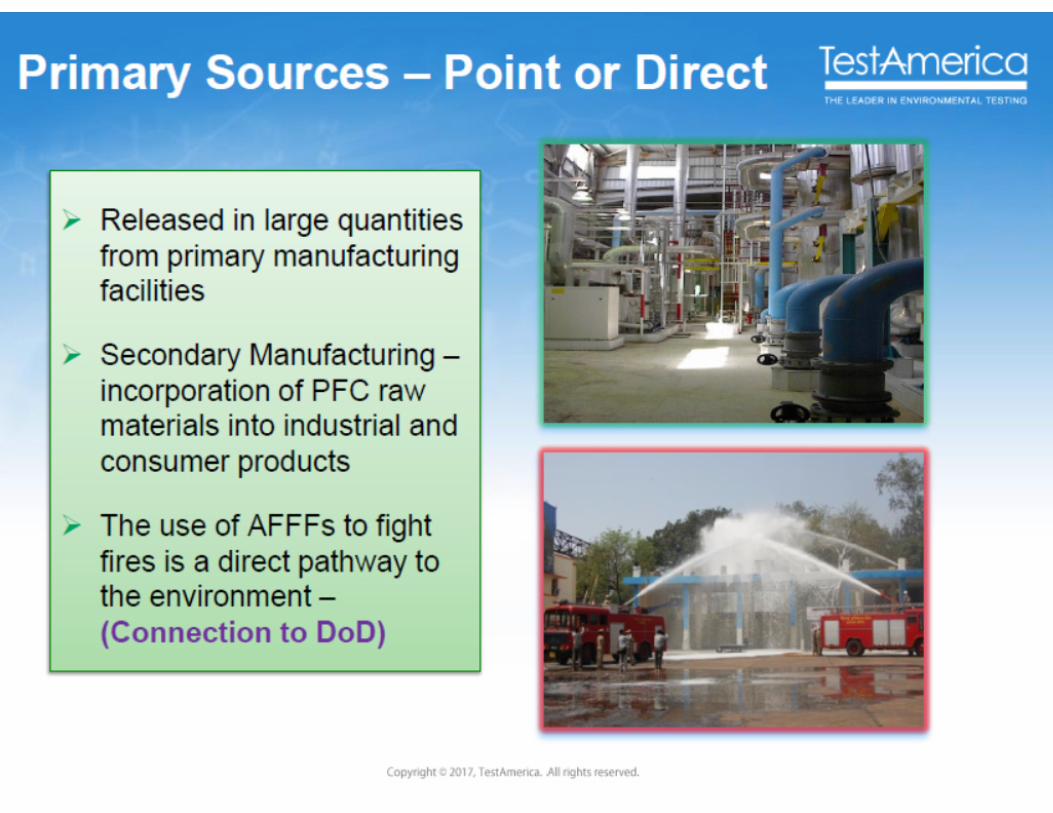
Primary Sources – Point or Direct
Released in large quantities from primary manufacturing facilities
Secondary Manufacturing –incorporation of PFC raw materials into industrial and consumer products
The use of AFFFs to fight fires is a direct pathway to the environment – (Connection to DoD)
12
12
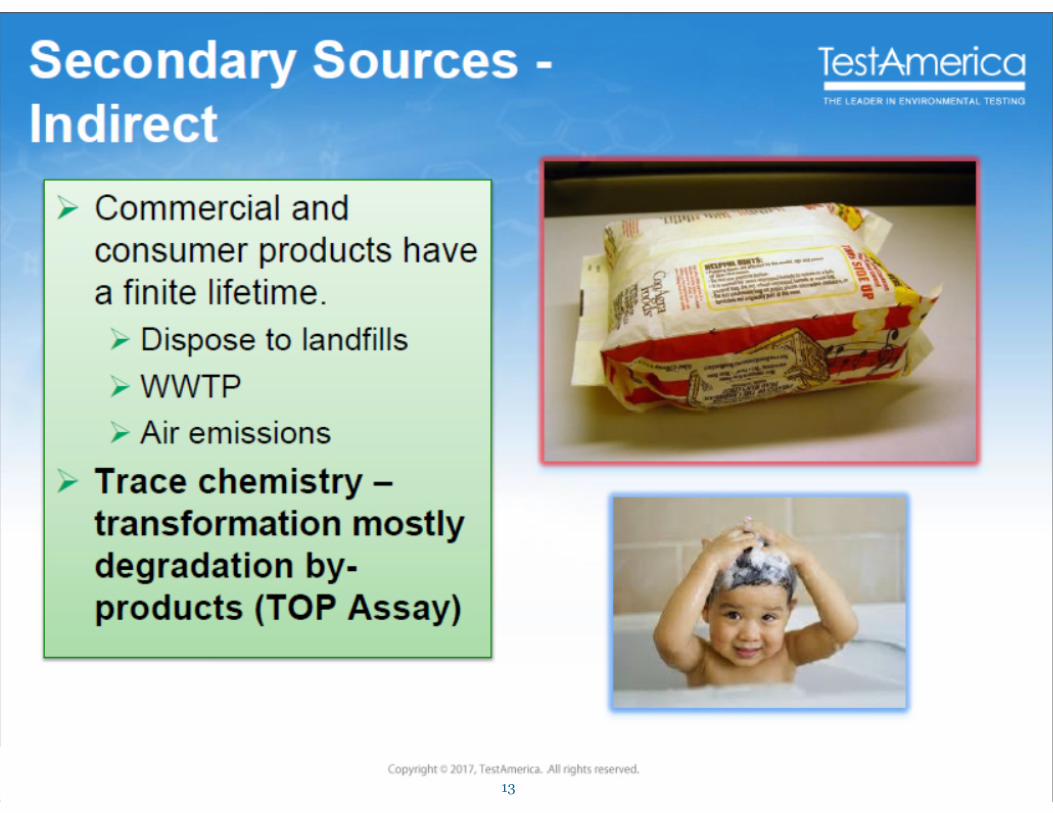
Secondary Sources ‐ Indirect
Commercial and consumer products have a finite lifetime.Dispose to landfills
WWTP
Air emissions
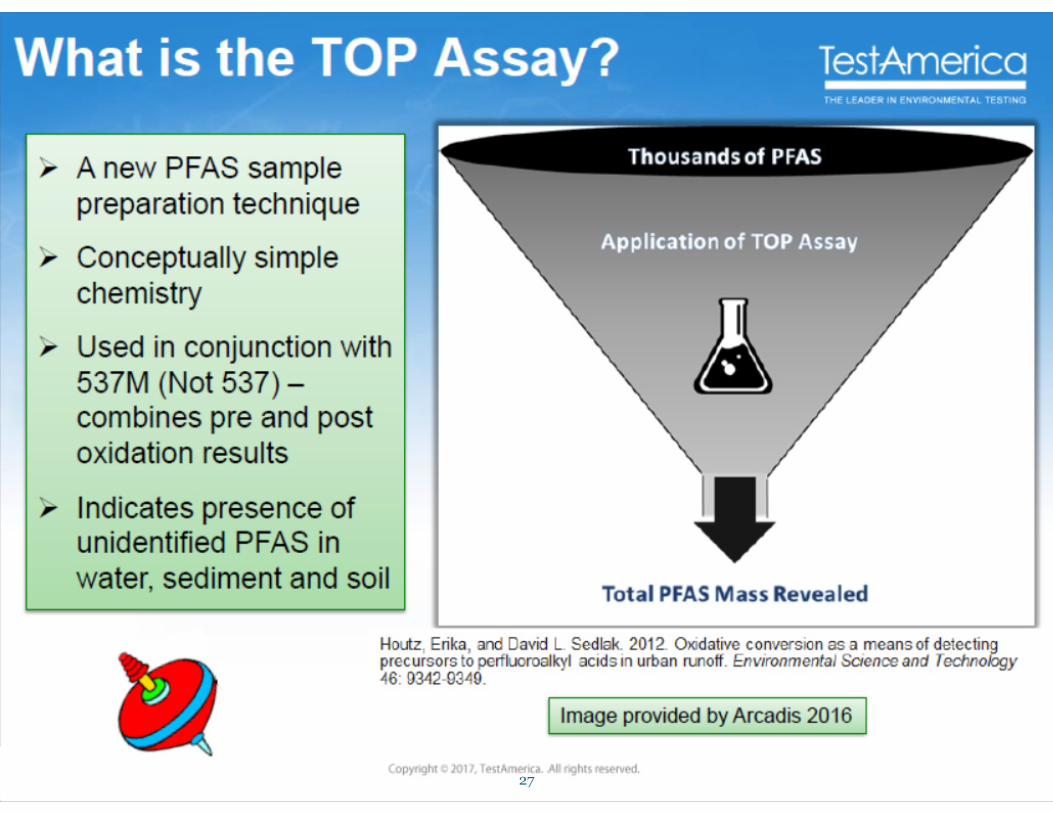
Trace chemistry – transformation mostly degradation by‐products (TOP Assay)
13
13
14
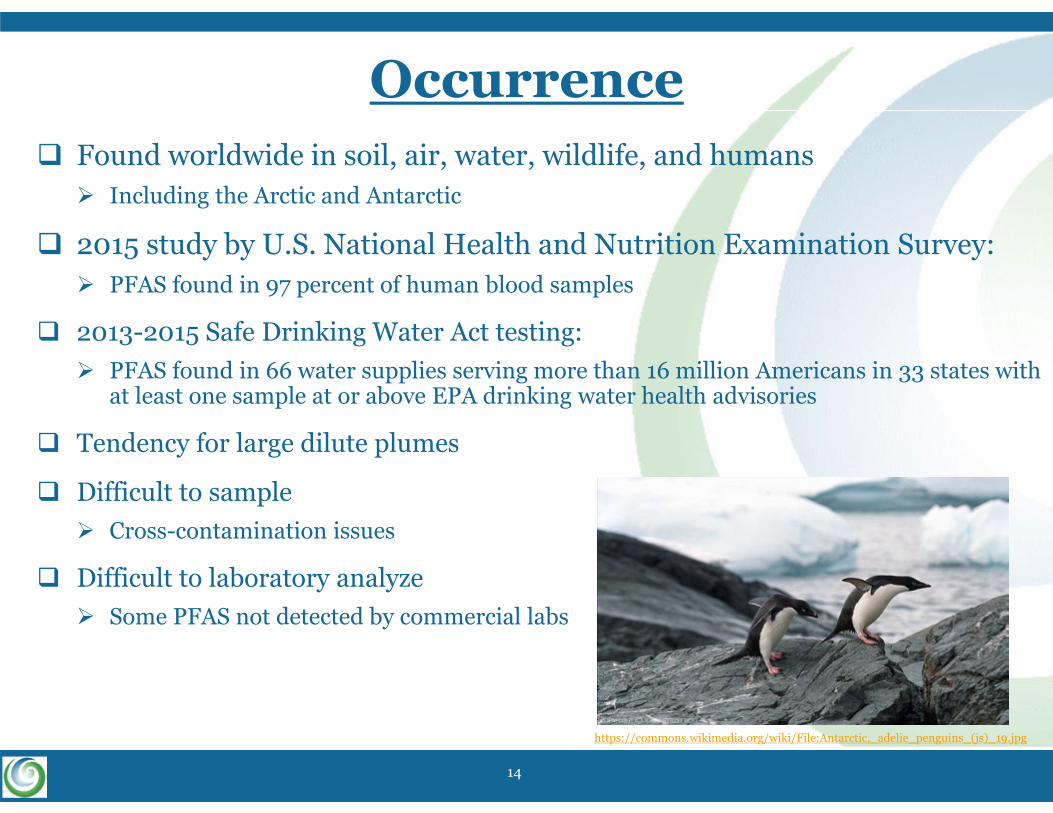
Occurrence Found worldwide in soil, air, water, wildlife, and humans Including the Arctic and Antarctic
2015 study by U.S. National Health and Nutrition Examination Survey: PFAS found in 97 percent of human blood samples
2013-2015 Safe Drinking Water Act testing: PFAS found in 66 water supplies serving more than 16 million Americans in 33 states with
at least one sample at or above EPA drinking water health advisories
Tendency for large dilute plumes
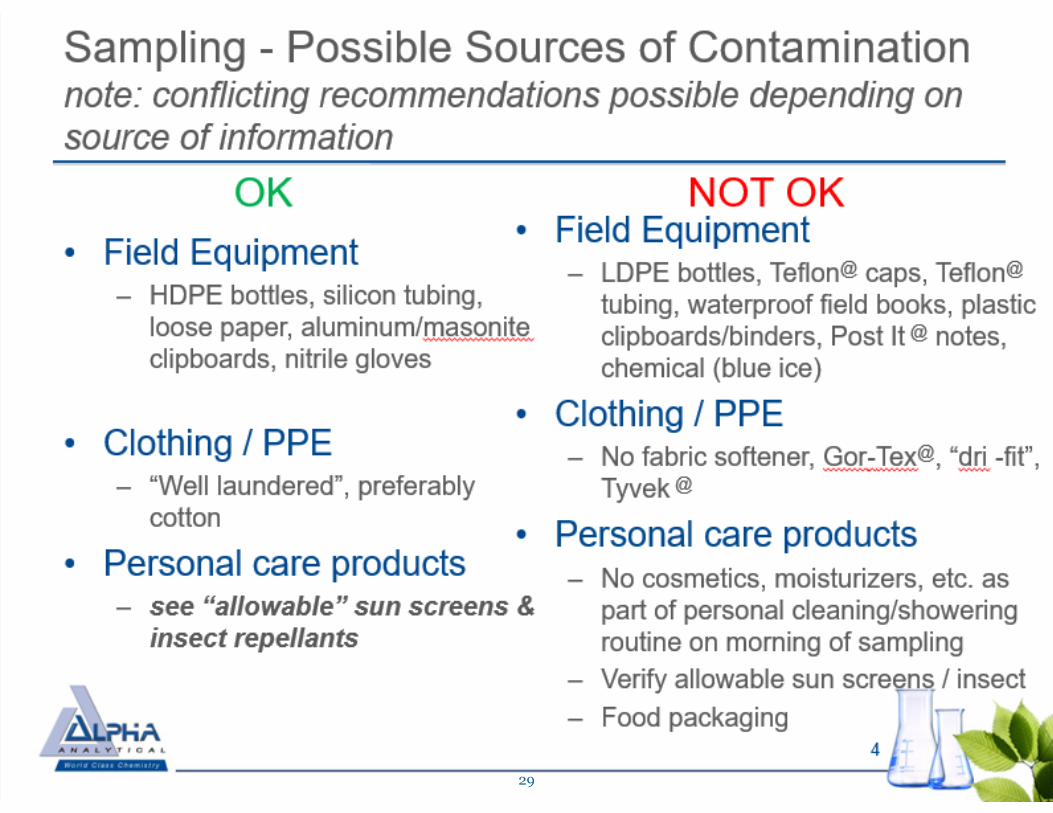
Difficult to sample Cross-contamination issues
Difficult to laboratory analyze Some PFAS not detected by commercial labs
https://commons.wikimedia.org/wiki/File:Antarctic,_adelie_penguins_(js)_19.jpg
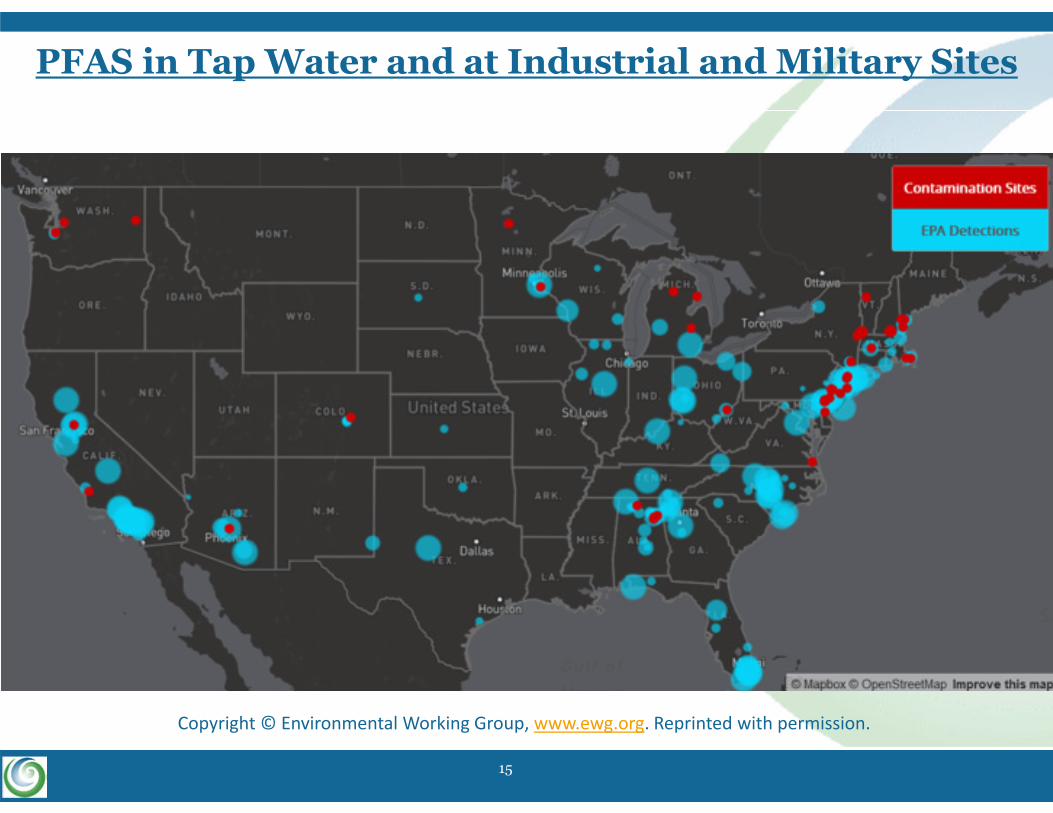
PFAS in Tap Water and at Industrial and Military Sites
Copyright © Environmental Working Group, www.ewg.org. Reprinted with permission.
15
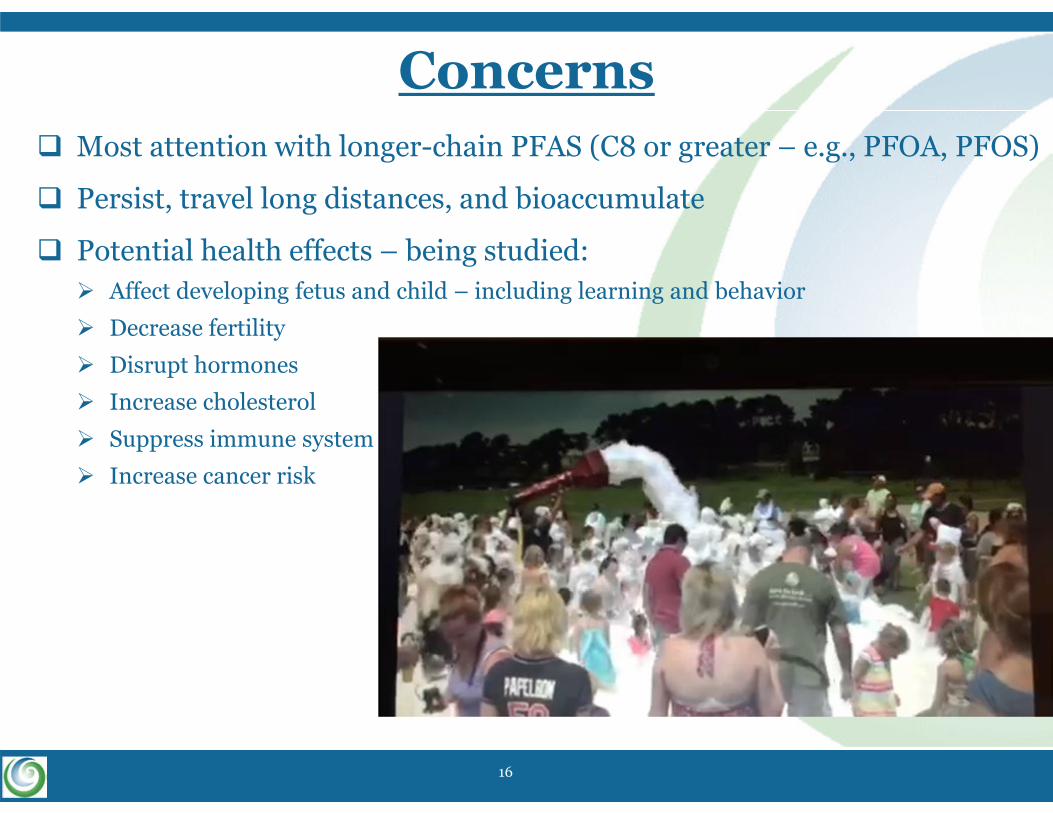
Concerns Most attention with longer-chain PFAS (C8 or greater – e.g., PFOA, PFOS)
Persist, travel long distances, and bioaccumulate
Potential health effects – being studied: Affect developing fetus and child – including learning and behavior
Decrease fertility
Disrupt hormones
Increase cholesterol
Suppress immune system
Increase cancer risk
16

10/19/201717
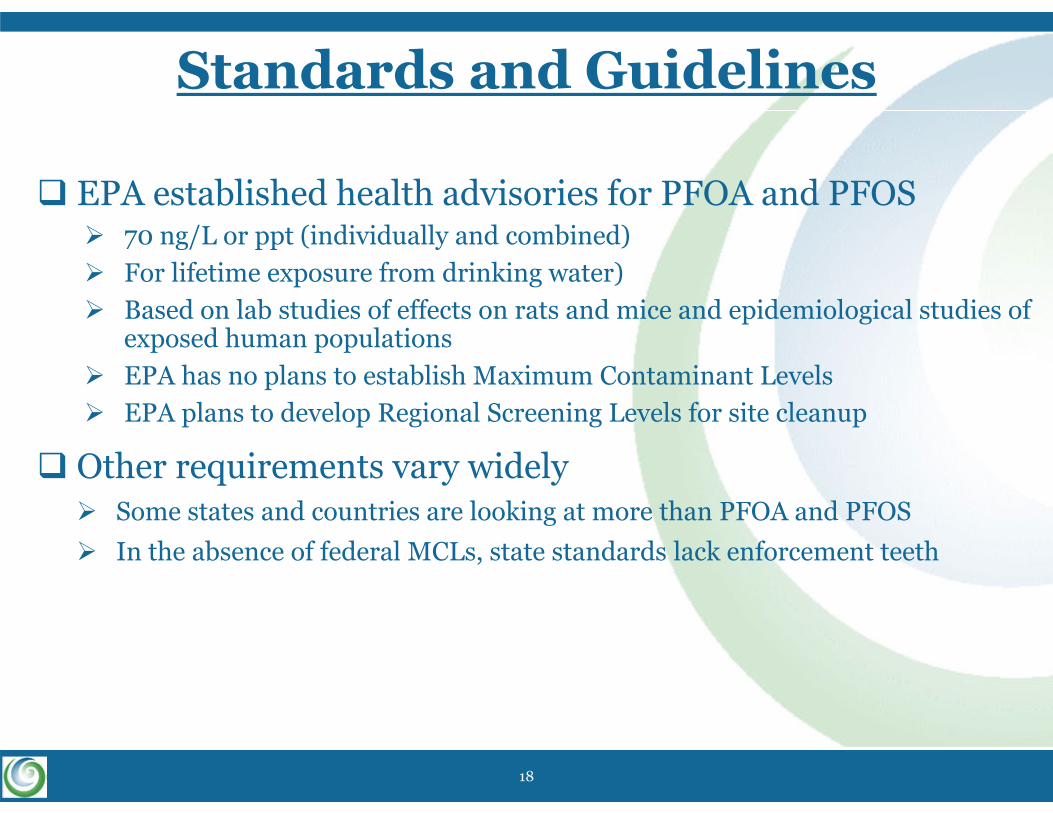
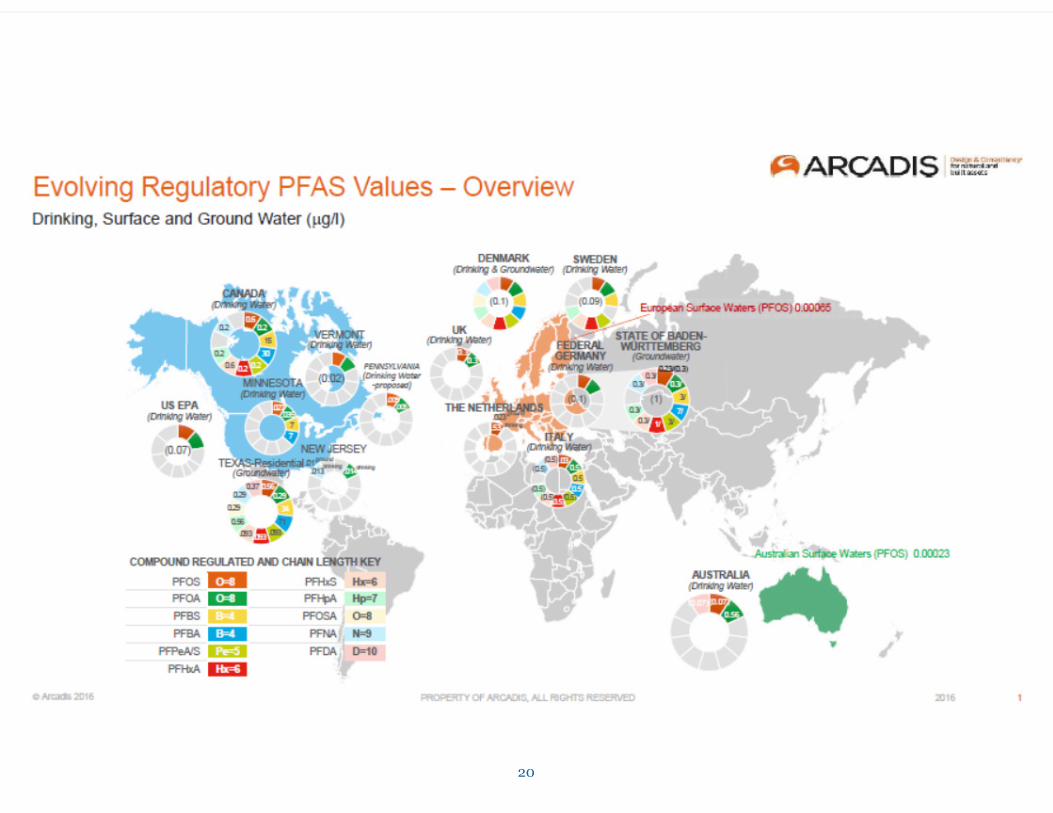
Standards and Guidelines
EPA established health advisories for PFOA and PFOS 70 ng/L or ppt (individually and combined) For lifetime exposure from drinking water) Based on lab studies of effects on rats and mice and epidemiological studies of
exposed human populations EPA has no plans to establish Maximum Contaminant Levels EPA plans to develop Regional Screening Levels for site cleanup
Other requirements vary widely Some states and countries are looking at more than PFOA and PFOS In the absence of federal MCLs, state standards lack enforcement teeth
18
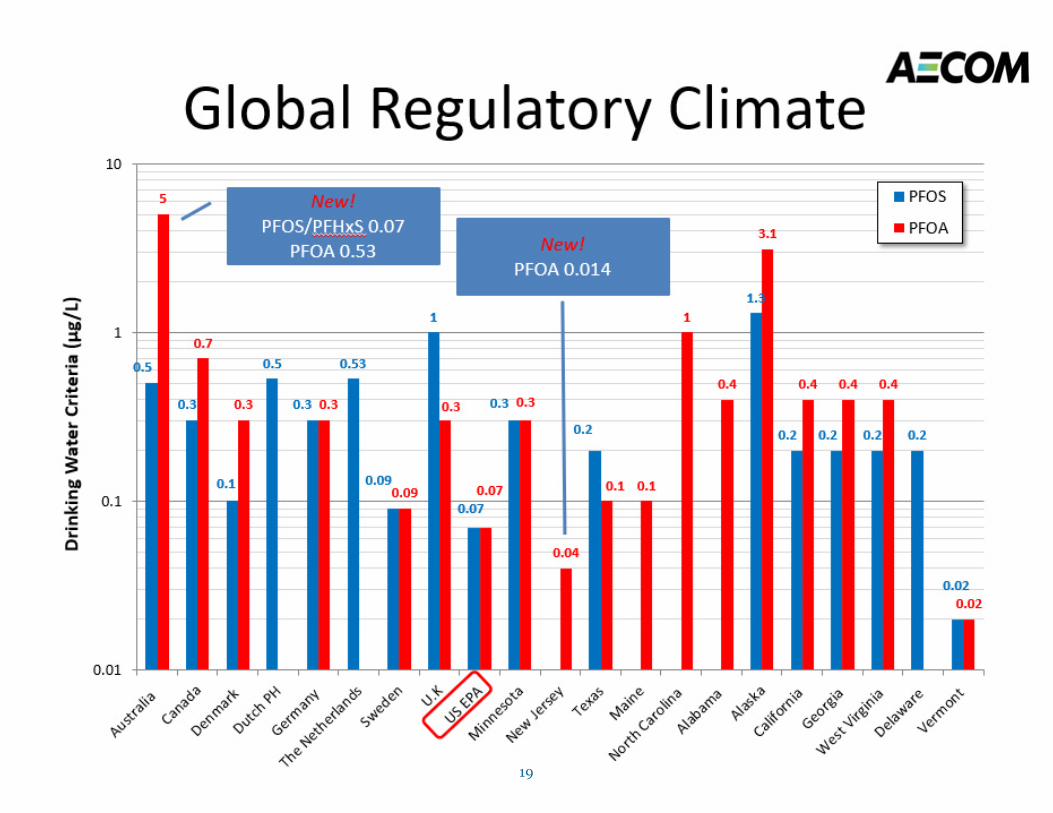
19
Ellen – ask for updated graphic, as powerpoint
20
21
Analytical Challenges
Low detection limits required
Cross-contamination during sampling
Deciding which analytes to quantify of the many that exist
Standards not available for many analytes
Fast-changing regulatory requirements and analytical methods
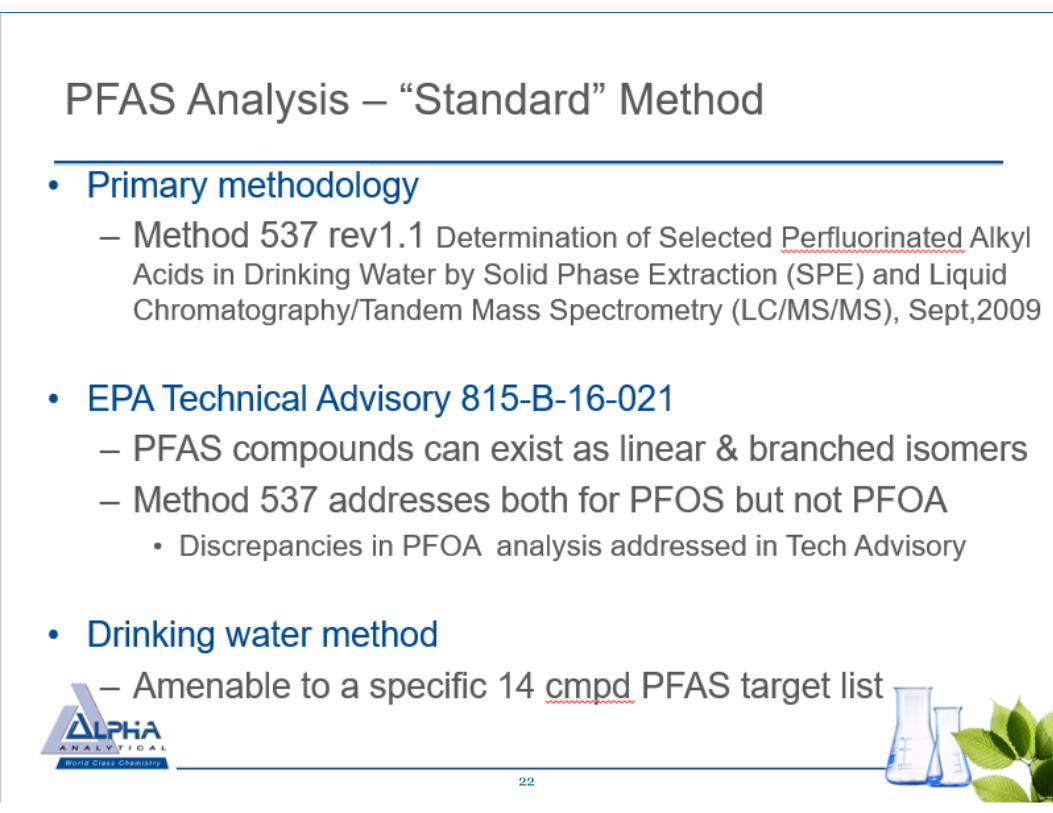
PFAS Analysis – “Standard” Method
▪ Primary methodology
– Method 537 rev1.1 Determination of Selected Perfluorinated Alkyl Acids in Drinking Water by Solid Phase Extraction (SPE) and Liquid Chromatography/Tandem Mass Spectrometry (LC/MS/MS), Sept,2009
▪ EPA Technical Advisory 815‐B‐16‐021– PFAS compounds can exist as linear & branched isomers
– Method 537 addresses both for PFOS but not PFOA▪ Discrepancies in PFOA analysis addressed in Tech Advisory
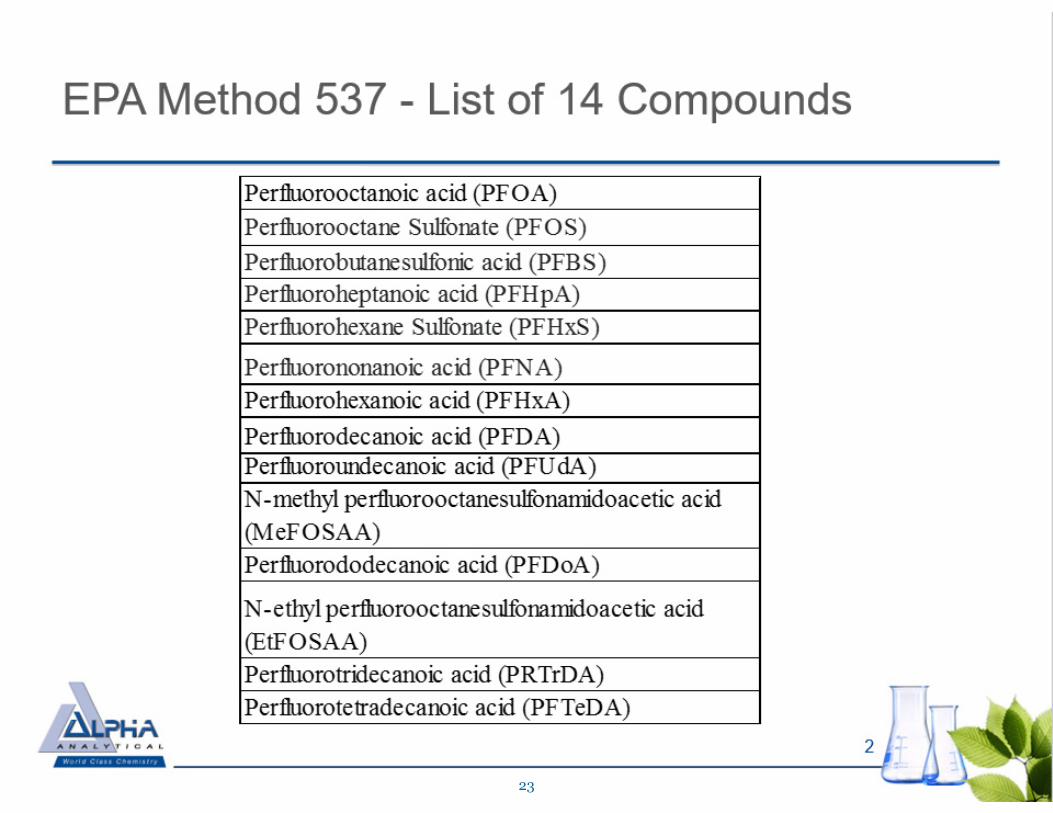
▪ Drinking water method – Amenable to a specific 14 cmpd PFAS target list
22
10/19/201723
Other LC/MS/MS Methodologies
▪ Method 537 not amenable to expanded list of compounds– 500 series DW methods not supposed to be modified
▪ “Laboratory proprietary methods” to address longer compound lists / sample matrices other than DW– Isotope dilution approach
▪ addition of known amount of isotopically‐enriched, compound‐specific internal standards
– Different or multiple SPE cartridges
– EPA releasing 2 additional methods for comments ▪ GW & soil/tissue (summer/fall) – check with Jim O. about status in 10/2017
2424
Fluoride and Total Organic Fluorine Analysis
Fluoride analysis – can be used to: Evaluate extent of biological or chemical remediation that releases
fluoride from PFAS A drawback is high detection limits of ~20 ug/L Drinking water standards/guidelines: U.S. Public Health Service recommends 0.7 mg/L to prevent cavities EPA MCL 4.0 mg/l and secondary MCL 2.0 mg/L Concerns about thyroid, brain, and other impacts
Total organic fluorine – an emerging technique –could be useful to:Locate PFAS plumesVerify remediation is complete
25
Transformation and Precursors
Pers don’t naturally transform
Oxidizable polys should eventually transform to persBiotic or abiotic transformationPolys cleave at a weak spot (i.e., a carbon not fully
fluorinated)
Total Oxidizable Precursors (TOP) analysis quantifies precursors to help assess the total mass and risk of PFAS
26
10/19/201727

10/19/201728
10/19/201729
ReferencesEPA. 2016. Health Advisories for PFOS and PFOA. https://www.epa.gov/ground-water-and-
drinking-water/drinking-water-health-advisories-pfoa-and-pfos
Environmental Working Group. 2017. Toxic Fluorinated Chemicals in Tap Water and at Industrial or Military Sites. http://www.ewg.org/interactive-maps/2017_pfa/index.php
Kjølholt, J., Allan Jensen, and M. Warming. 2015 Short-chain Polyfluoroalkyl Substances (PFAS). A literature review of information on human health effects and environmental fate and effect aspects of short-chain PFAS: https://www.researchgate.net/publication/299230070_Short-chain_Polyfluoroalkyl_Substances_PFAS_A_literature_review_of_information_on_human_health_effects_and_environmental_fate_and_effect_aspects_of_short-chain_PFAS
Buechler, Karla. 2017. The Analysis of Polyfluorinated Alkyl (PFAS) including PFOS and PFOA –June 27, 2017. http://www.testamericainc.com/services-we-offer/webinars/presentations/presentation-the-analysis-of-polyfluorinated-alkyl-substances-pfas-including-pfos-and-pfoa/
Buechler, Karla, 2017. Closing the PFAS Mass Balance: The Total Oxidizable Precursor (TOP) Assay – May 15, 2017. http://www.testamericainc.com/services-we-offer/webinars/presentations/presentation-closing-the-pfas-mass-balance-the-total-oxidizable-precursor-top-assay/
30
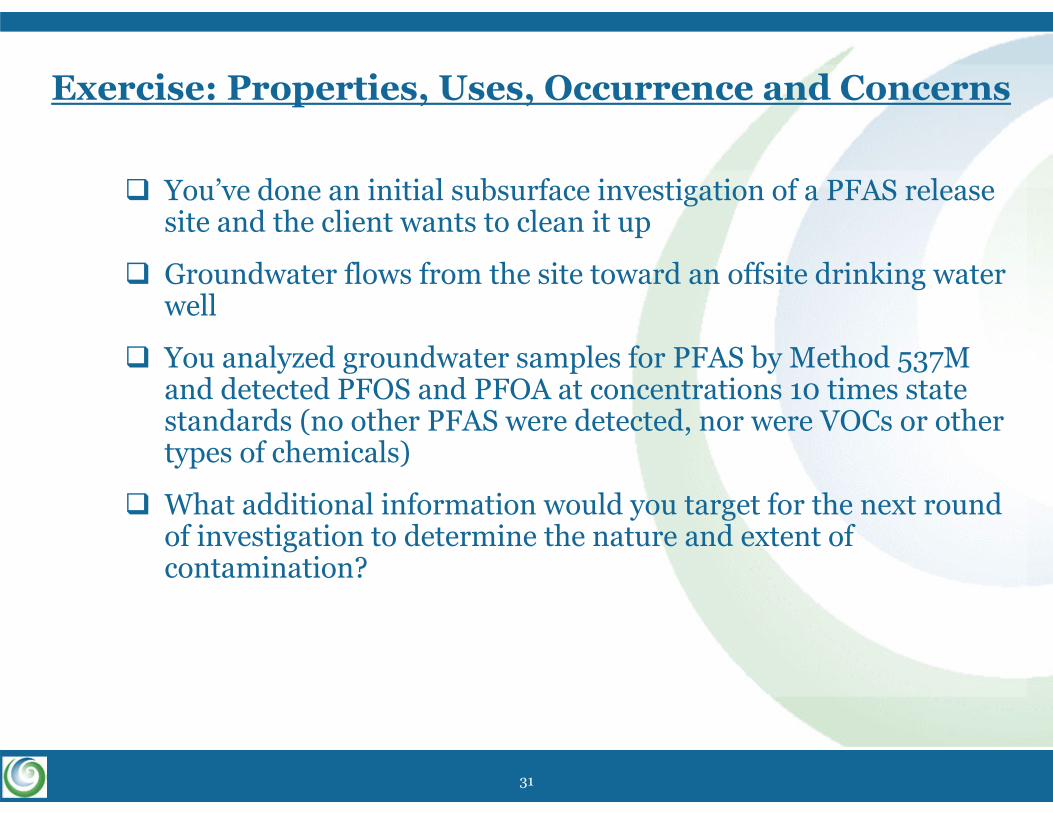
Exercise: Properties, Uses, Occurrence and Concerns
You’ve done an initial subsurface investigation of a PFAS release site and the client wants to clean it up
Groundwater flows from the site toward an offsite drinking water well
You analyzed groundwater samples for PFAS by Method 537M and detected PFOS and PFOA at concentrations 10 times state standards (no other PFAS were detected, nor were VOCs or other types of chemicals)
What additional information would you target for the next round of investigation to determine the nature and extent of contamination?
31
32
PFAS Remedial Options for Source and Plume Areas
33
Physical-Chemical PropertiesProperty PFOA PFOS BenzeneChemical Formula C8HF15O2 C8HF17O3S C6H6
Molecular Weight (g/mol)
414.09 500.13 78.11
Boiling Point (oC)
192.4 259 80
Vapor Pressure (mm Hg at 25 oC)
0.525 ~0.002 86
Henry’s Law Constant @ 25oC (unitless)
Not measurable
Not measurable
0.225
Koc(temperature asspecified)
115 371 79 (at 25 oC)
Solubility in Water (mg/L)
~9,500 (at 25 oC)
680 (temp. not stated)
1,780(at 25 oC)
USEPA 2016 USEPA 2016
34
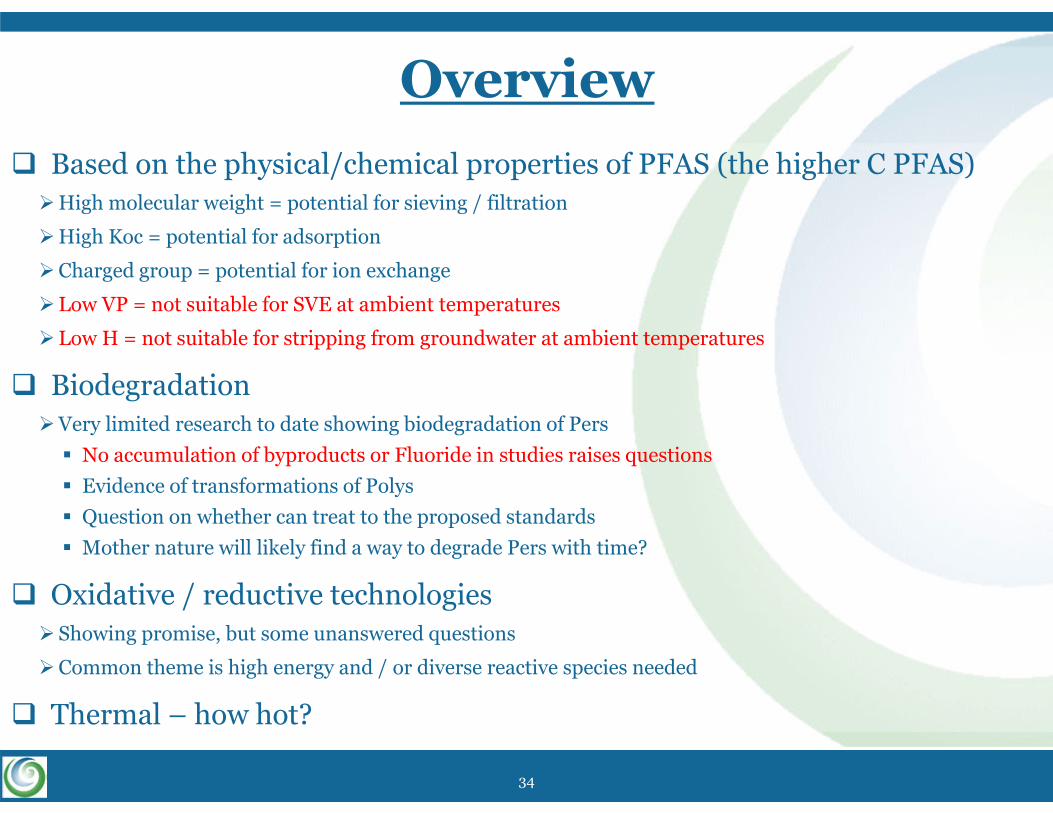
Overview Based on the physical/chemical properties of PFAS (the higher C PFAS)High molecular weight = potential for sieving / filtration
High Koc = potential for adsorption
Charged group = potential for ion exchange
Low VP = not suitable for SVE at ambient temperatures
Low H = not suitable for stripping from groundwater at ambient temperatures
Biodegradation Very limited research to date showing biodegradation of Pers No accumulation of byproducts or Fluoride in studies raises questions Evidence of transformations of Polys Question on whether can treat to the proposed standards Mother nature will likely find a way to degrade Pers with time?
Oxidative / reductive technologiesShowing promise, but some unanswered questions
Common theme is high energy and / or diverse reactive species needed
Thermal – how hot?
35
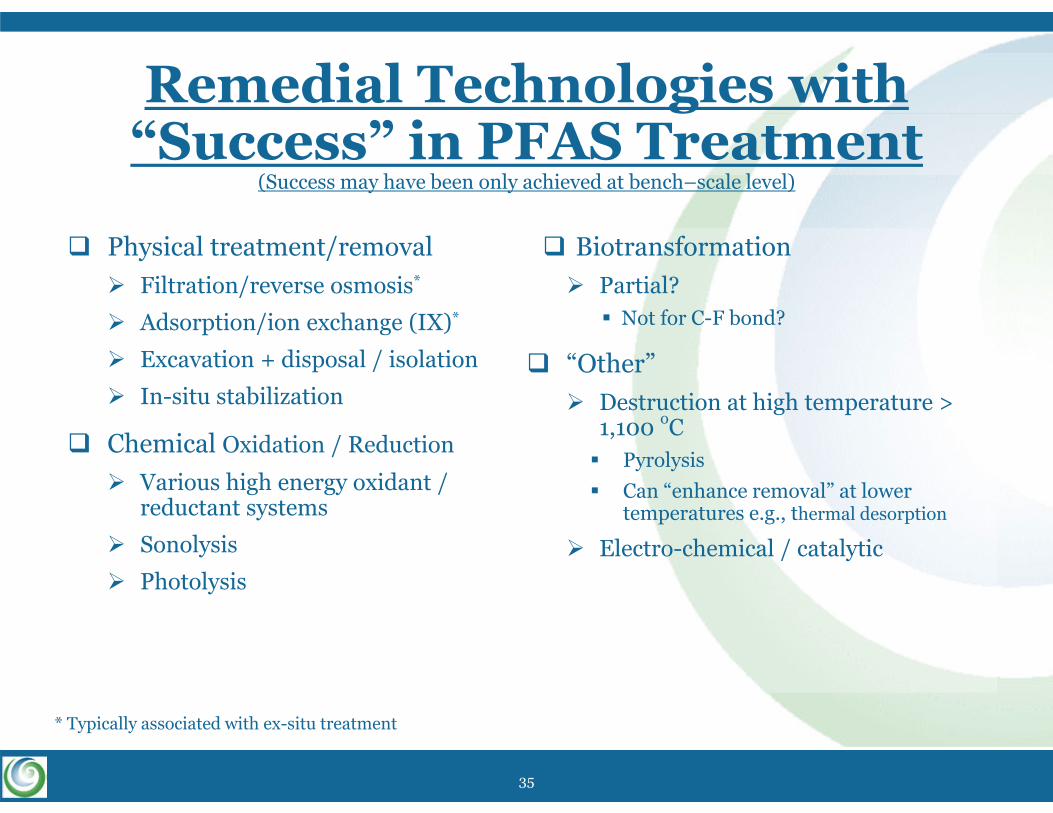
Remedial Technologies with “Success” in PFAS Treatment
(Success may have been only achieved at bench–scale level)
Physical treatment/removal Filtration/reverse osmosis*
Adsorption/ion exchange (IX)*
Excavation + disposal / isolation
In-situ stabilization
Chemical Oxidation / Reduction
Various high energy oxidant / reductant systems
Sonolysis
Photolysis
Biotransformation Partial? Not for C-F bond?
“Other” Destruction at high temperature >
1,100 oC Pyrolysis Can “enhance removal” at lower
temperatures e.g., thermal desorption
Electro-chemical / catalytic
* Typically associated with ex-situ treatment
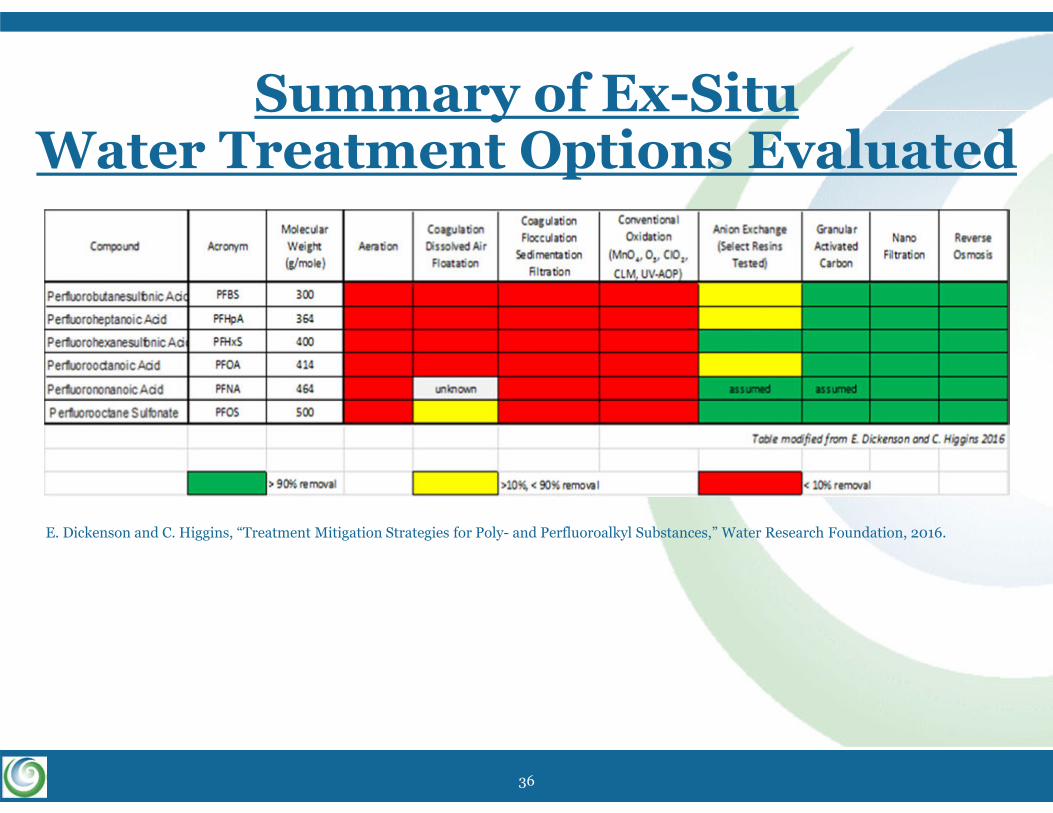
Summary of Ex-Situ Water Treatment Options Evaluated
36
E. Dickenson and C. Higgins, “Treatment Mitigation Strategies for Poly- and Perfluoroalkyl Substances,” Water Research Foundation, 2016.
37
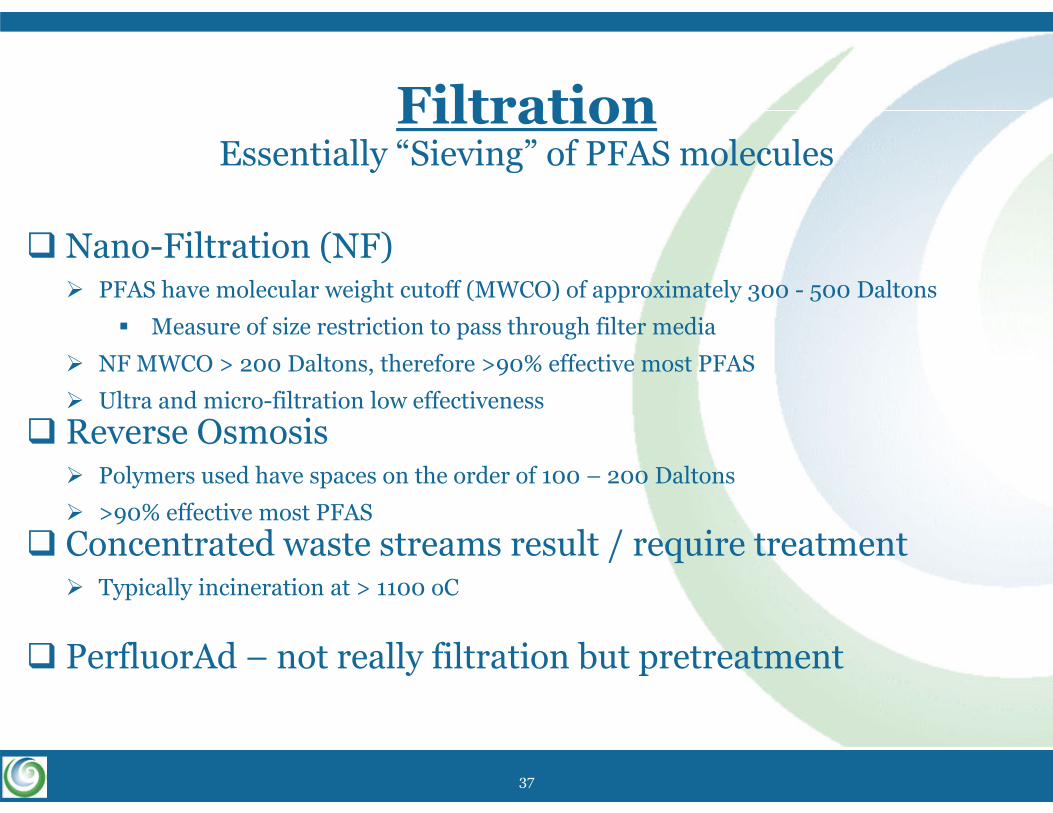
Nano-Filtration (NF) PFAS have molecular weight cutoff (MWCO) of approximately 300 - 500 Daltons
Measure of size restriction to pass through filter media
NF MWCO > 200 Daltons, therefore >90% effective most PFAS
Ultra and micro-filtration low effectiveness Reverse Osmosis Polymers used have spaces on the order of 100 – 200 Daltons
>90% effective most PFAS Concentrated waste streams result / require treatment Typically incineration at > 1100 oC
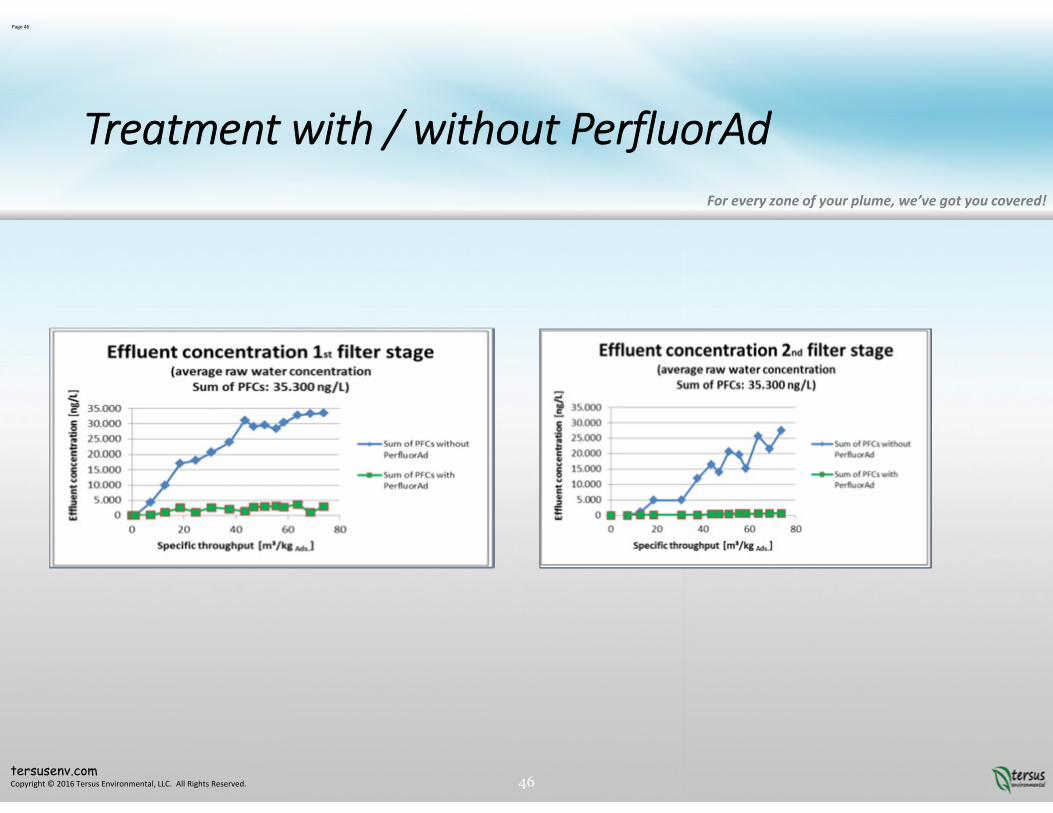
PerfluorAd – not really filtration but pretreatment
FiltrationEssentially “Sieving” of PFAS molecules
For every zone of your plume, we’ve got you covered!
Page 38
tersusenv.comCopyright © 2016 Tersus Environmental, LLC. All Rights Reserved.
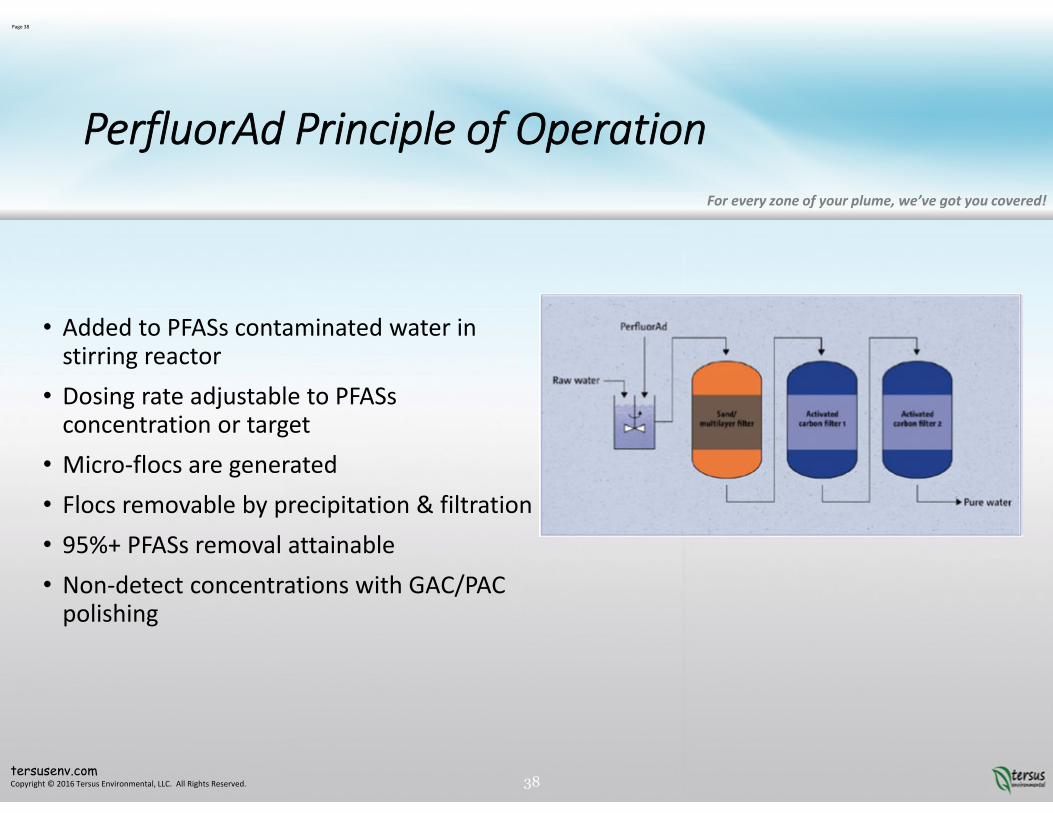
PerfluorAd Principle of Operation
• Added to PFASs contaminated water in stirring reactor
• Dosing rate adjustable to PFASs concentration or target
• Micro‐flocs are generated• Flocs removable by precipitation & filtration• 95%+ PFASs removal attainable• Non‐detect concentrations with GAC/PACpolishing
38
39
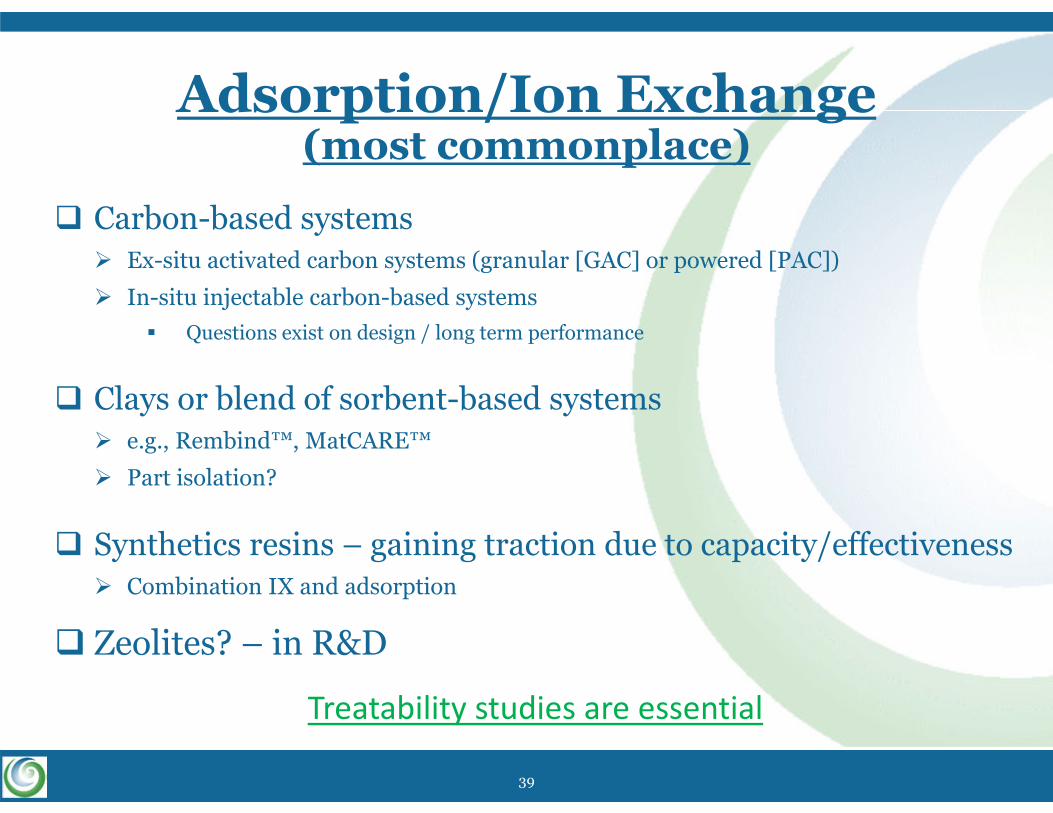
Adsorption/Ion Exchange(most commonplace)
Carbon-based systems Ex-situ activated carbon systems (granular [GAC] or powered [PAC])
In-situ injectable carbon-based systems Questions exist on design / long term performance
Clays or blend of sorbent-based systems e.g., Rembind™, MatCARE™
Part isolation?
Synthetics resins – gaining traction due to capacity/effectiveness Combination IX and adsorption
Zeolites? – in R&D
Treatability studies are essential
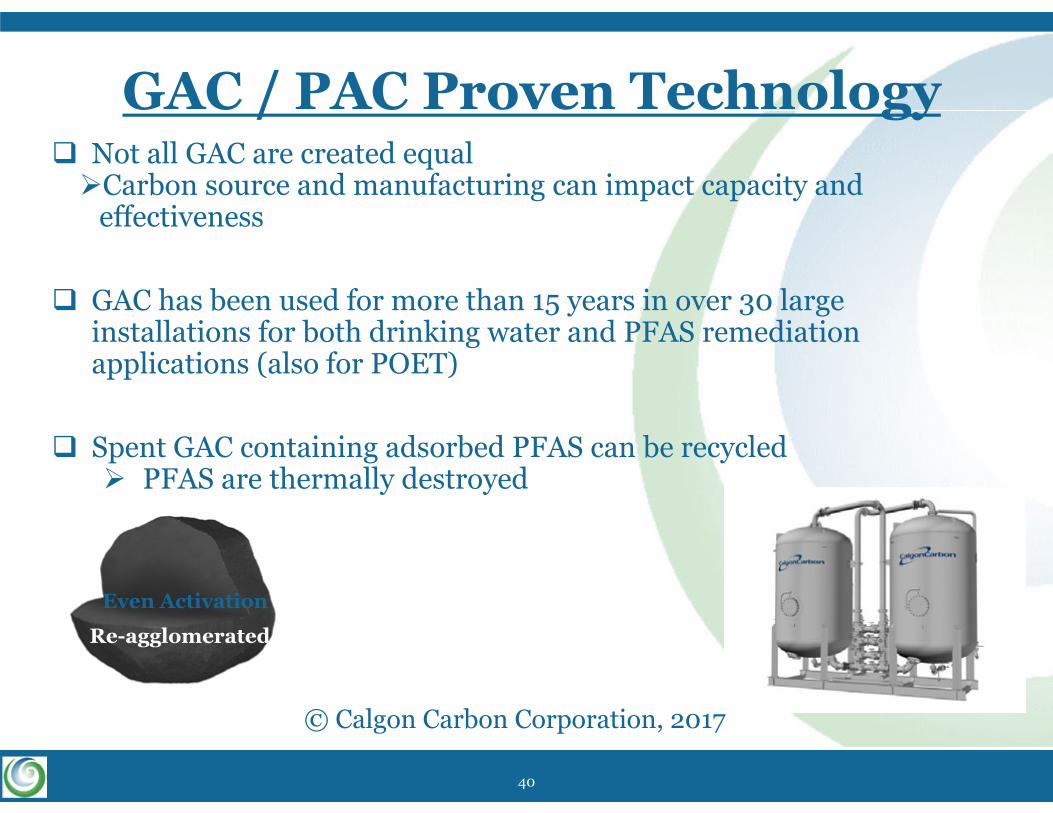
Not all GAC are created equal Carbon source and manufacturing can impact capacity and
effectiveness
GAC has been used for more than 15 years in over 30 large installations for both drinking water and PFAS remediation applications (also for POET)
Spent GAC containing adsorbed PFAS can be recycled PFAS are thermally destroyed
GAC / PAC Proven Technology
© Calgon Carbon Corporation, 2017
Re-agglomerated
Even Activation
40
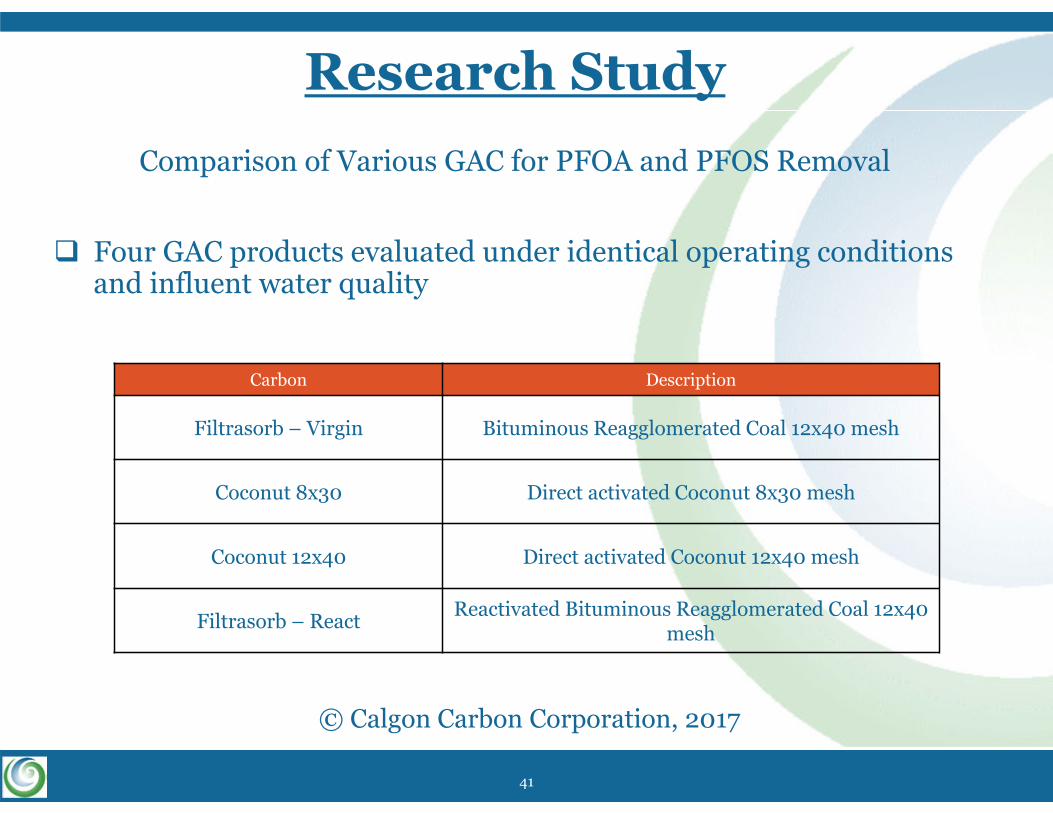
Four GAC products evaluated under identical operating conditions and influent water quality
Research StudyComparison of Various GAC for PFOA and PFOS Removal
Carbon Description
Filtrasorb – Virgin Bituminous Reagglomerated Coal 12x40 mesh
Coconut 8x30 Direct activated Coconut 8x30 mesh
Coconut 12x40 Direct activated Coconut 12x40 mesh
Filtrasorb – React Reactivated Bituminous Reagglomerated Coal 12x40 mesh
© Calgon Carbon Corporation, 2017
41
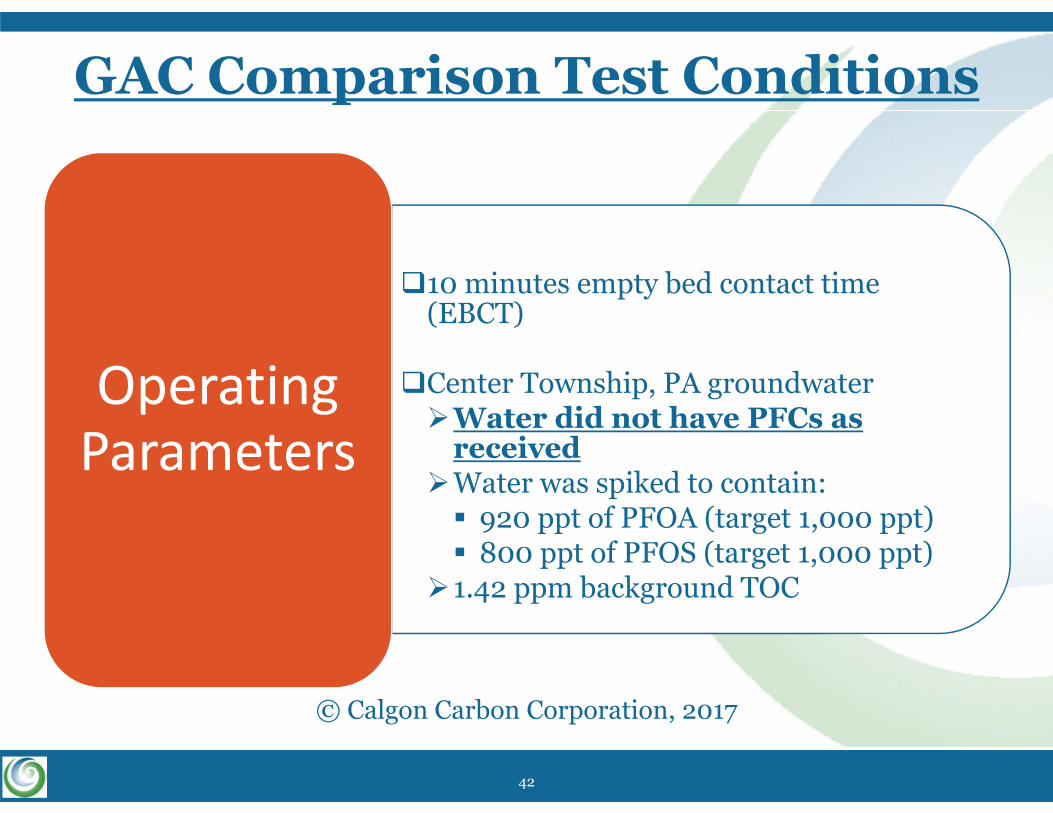
10 minutes empty bed contact time (EBCT)
Center Township, PA groundwaterWater did not have PFCs as
receivedWater was spiked to contain: 920 ppt of PFOA (target 1,000 ppt) 800 ppt of PFOS (target 1,000 ppt)
1.42 ppm background TOC
Operating Parameters
GAC Comparison Test Conditions
© Calgon Carbon Corporation, 2017
42
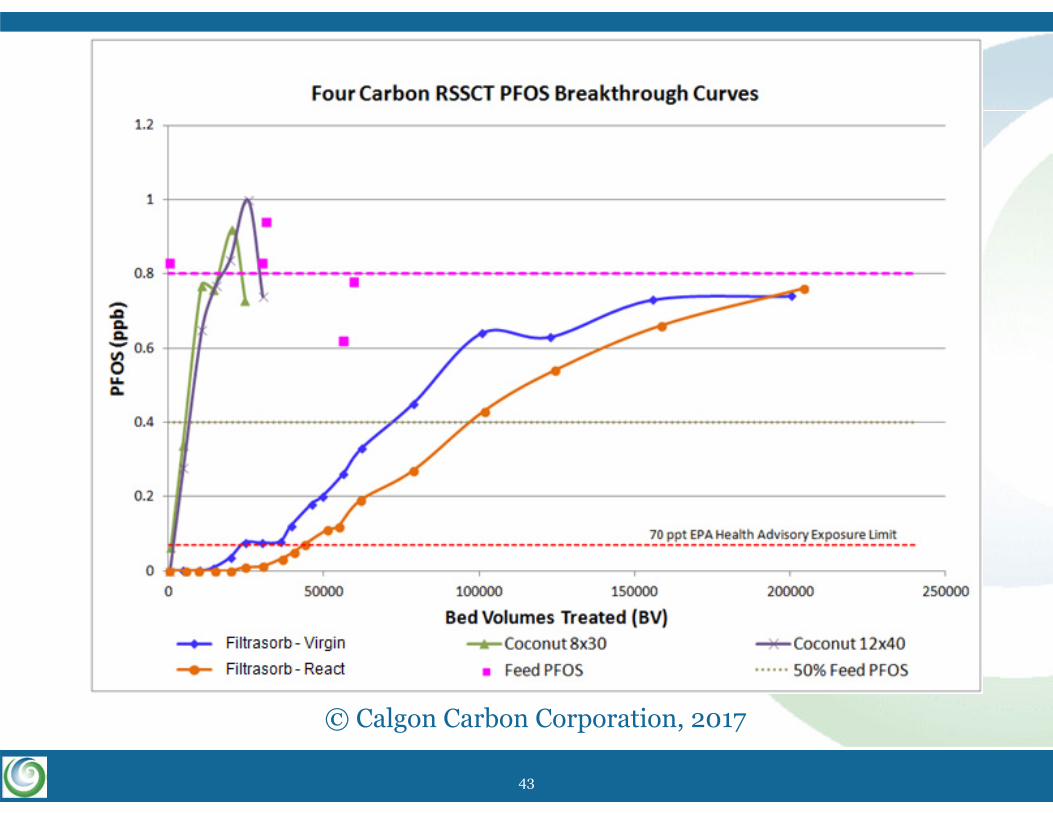
© Calgon Carbon Corporation, 2017
43
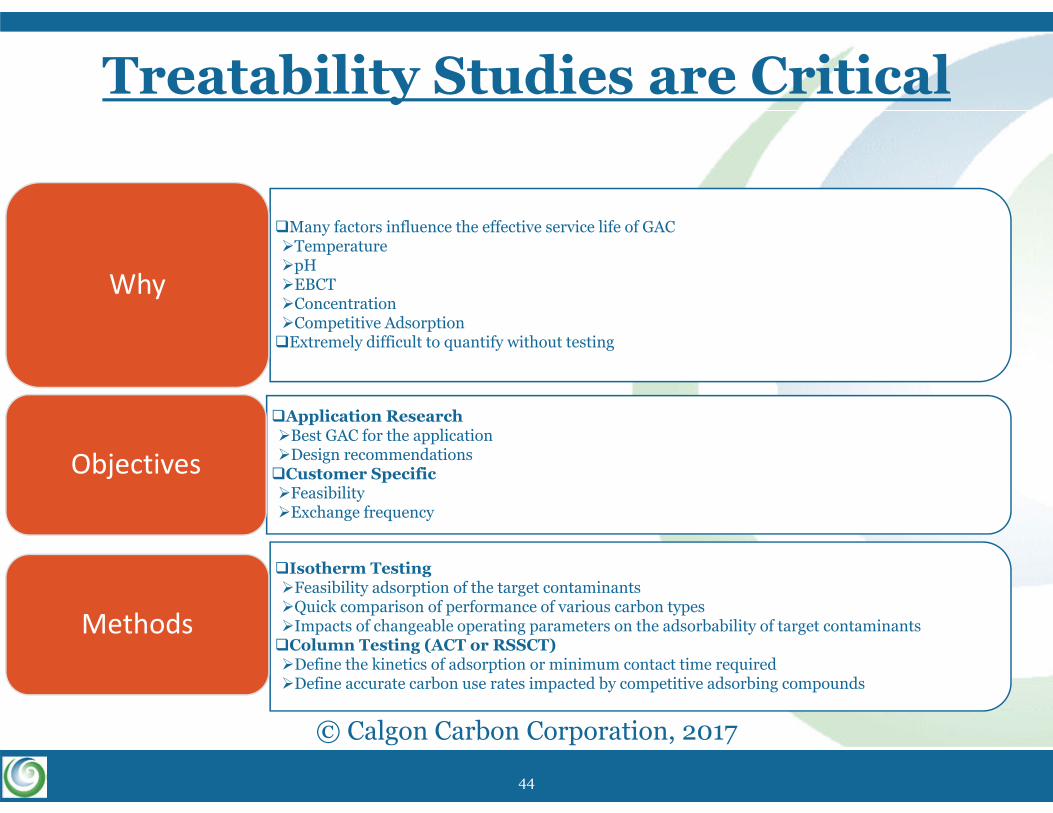
Treatability Studies are Critical
Many factors influence the effective service life of GACTemperaturepHEBCTConcentrationCompetitive AdsorptionExtremely difficult to quantify without testing
Why
Application ResearchBest GAC for the applicationDesign recommendationsCustomer SpecificFeasibilityExchange frequency
Objectives
Isotherm TestingFeasibility adsorption of the target contaminantsQuick comparison of performance of various carbon types Impacts of changeable operating parameters on the adsorbability of target contaminantsColumn Testing (ACT or RSSCT)Define the kinetics of adsorption or minimum contact time requiredDefine accurate carbon use rates impacted by competitive adsorbing compounds
Methods
© Calgon Carbon Corporation, 2017
44
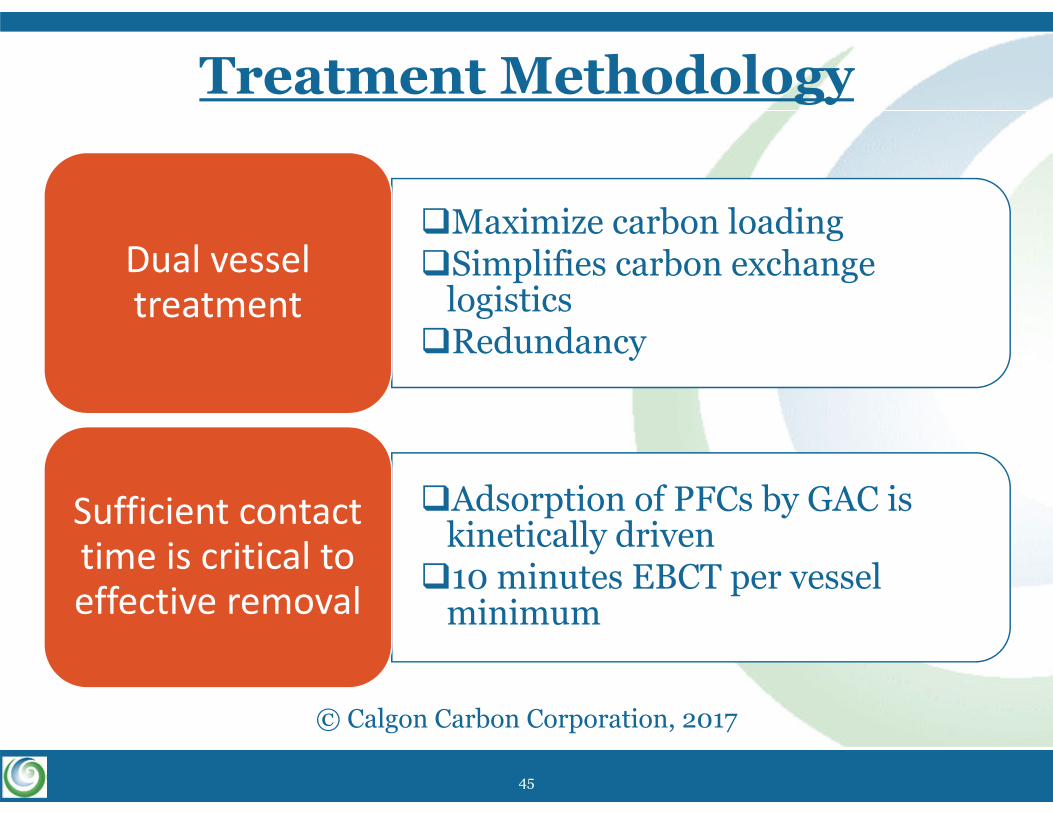
Maximize carbon loadingSimplifies carbon exchange
logisticsRedundancy
Dual vessel treatment
Adsorption of PFCs by GAC is kinetically driven10 minutes EBCT per vessel
minimum
Sufficient contact time is critical to effective removal
Treatment Methodology
© Calgon Carbon Corporation, 2017
45
For every zone of your plume, we’ve got you covered!
Page 46
tersusenv.comCopyright © 2016 Tersus Environmental, LLC. All Rights Reserved.
Treatment with / without PerfluorAd
46
For every zone of your plume, we’ve got you covered!
Page 47
tersusenv.comCopyright © 2016 Tersus Environmental, LLC. All Rights Reserved.
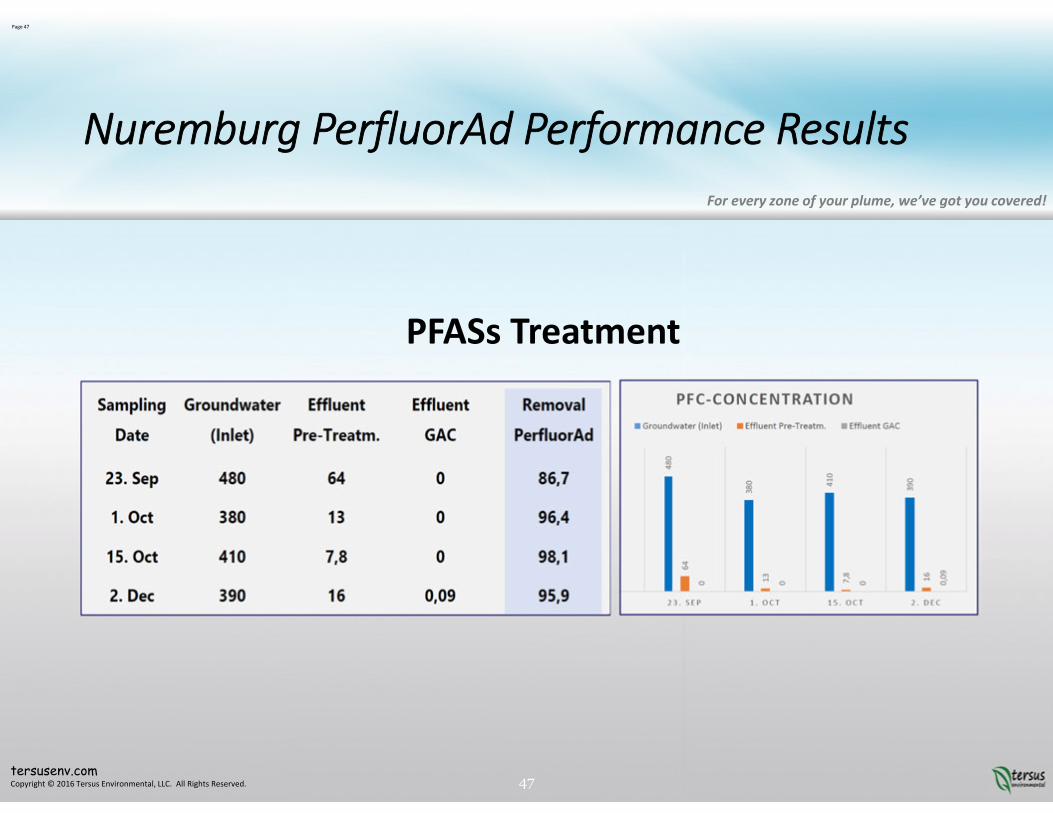
Nuremburg PerfluorAd Performance Results
PFASs Treatment
47
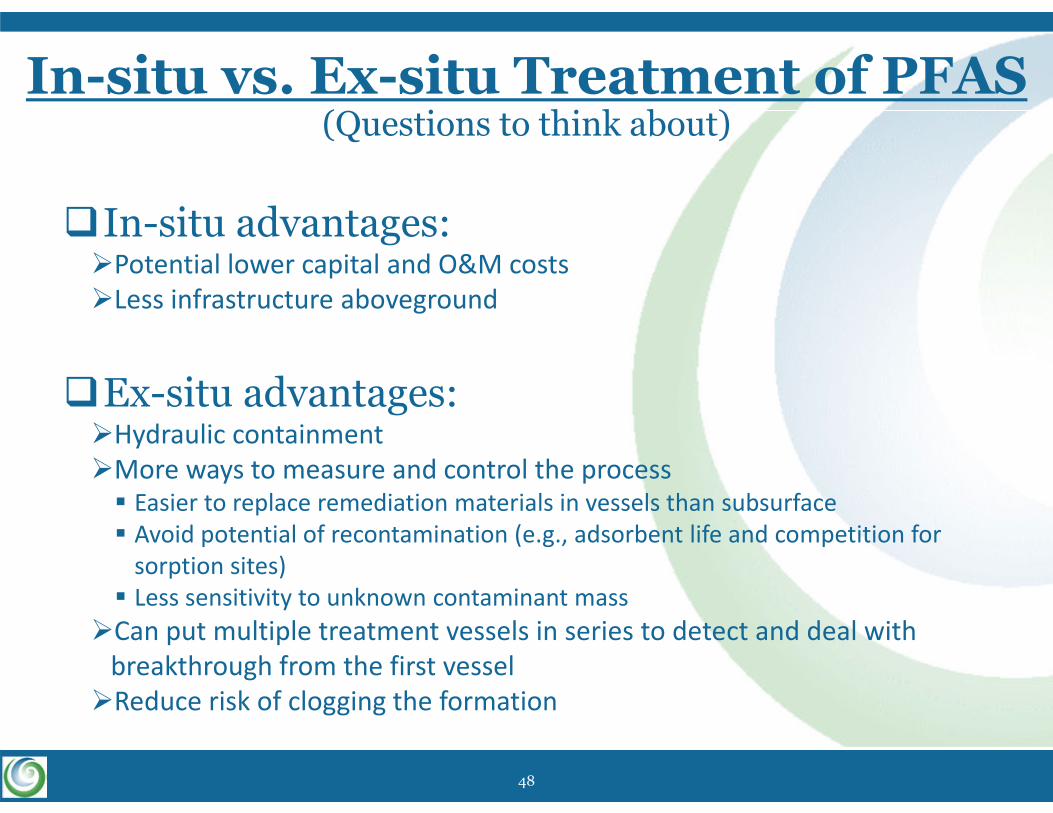
In-situ vs. Ex-situ Treatment of PFAS(Questions to think about)
In-situ advantages:Potential lower capital and O&M costsLess infrastructure aboveground
Ex-situ advantages:Hydraulic containmentMore ways to measure and control the process Easier to replace remediation materials in vessels than subsurface Avoid potential of recontamination (e.g., adsorbent life and competition for sorption sites) Less sensitivity to unknown contaminant mass Can put multiple treatment vessels in series to detect and deal with breakthrough from the first vessel Reduce risk of clogging the formation
48
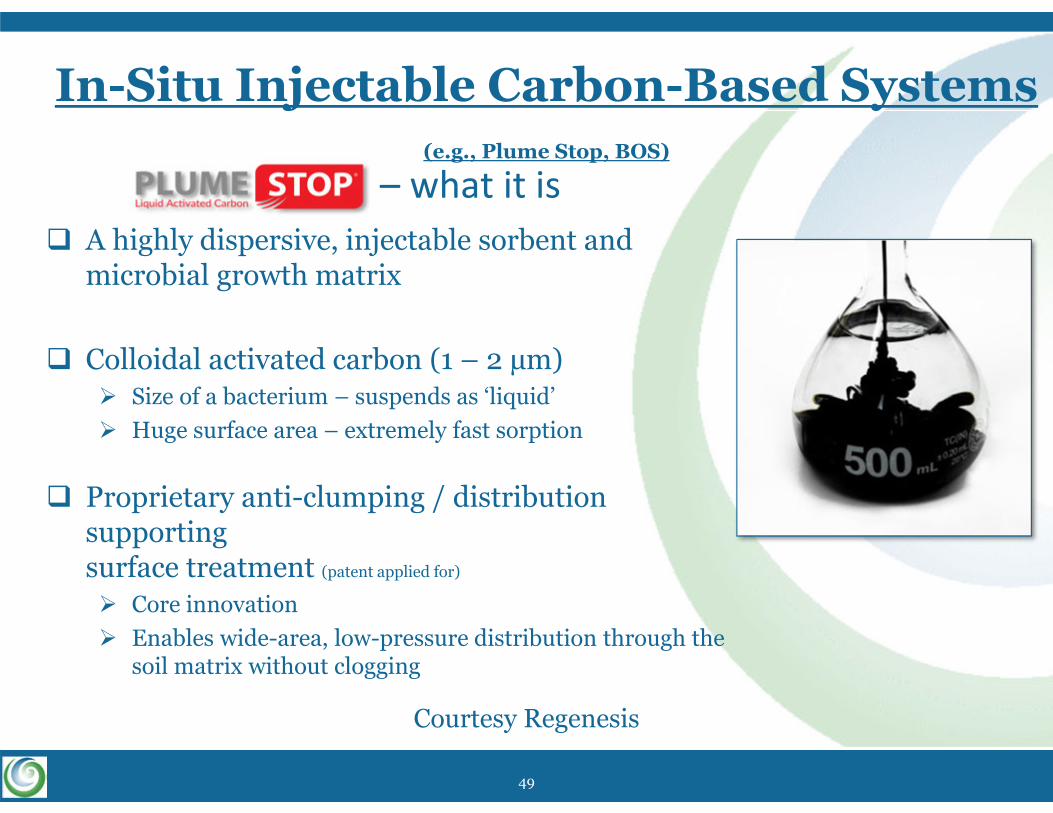
– what it is A highly dispersive, injectable sorbent and
microbial growth matrix
Colloidal activated carbon (1 – 2 µm) Size of a bacterium – suspends as ‘liquid’ Huge surface area – extremely fast sorption
Proprietary anti-clumping / distribution supporting surface treatment (patent applied for)
Core innovation Enables wide-area, low-pressure distribution through the
soil matrix without clogging
In-Situ Injectable Carbon-Based Systems(e.g., Plume Stop, BOS)
Courtesy Regenesis
49
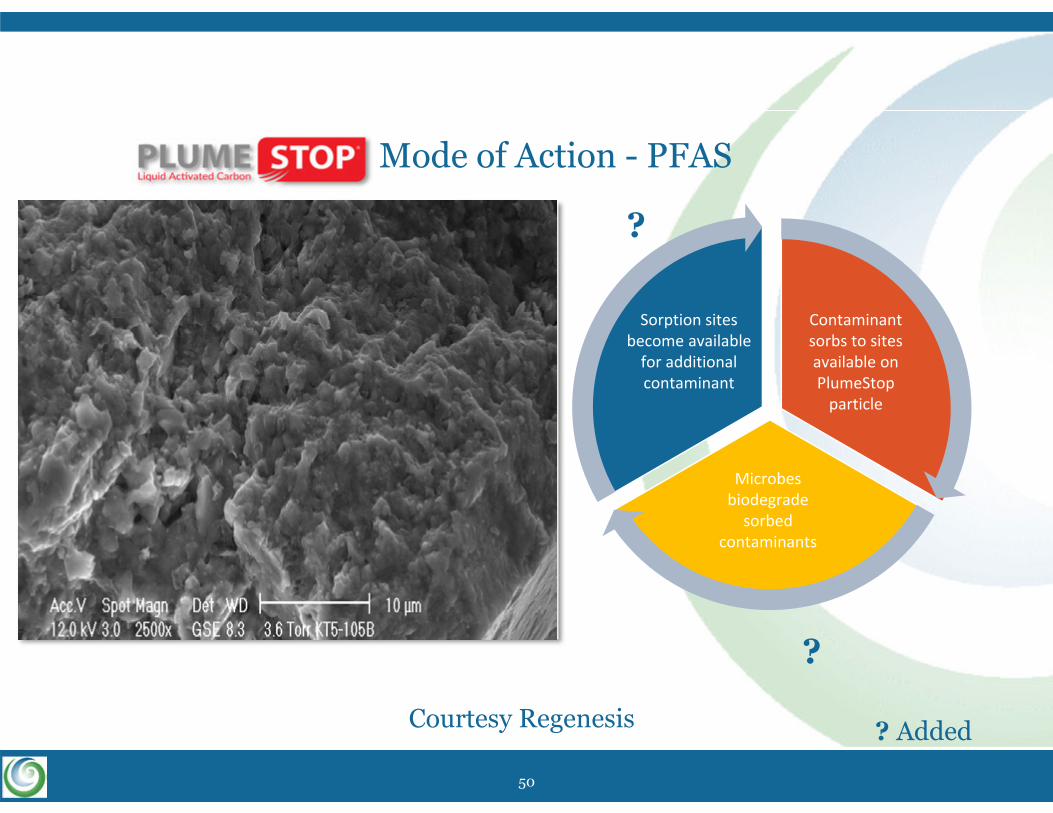
Mode of Action - PFAS
Contaminant sorbs to sites available on PlumeStop particle
Microbes biodegrade sorbed
contaminants
Sorption sites become available for additional contaminant
©2015 All Rights Reserved. REGENESIS and REGENESIS product(s) are registered trademarks of REGENESIS Remediation Products.
?
?
Courtesy Regenesis ? Added
50
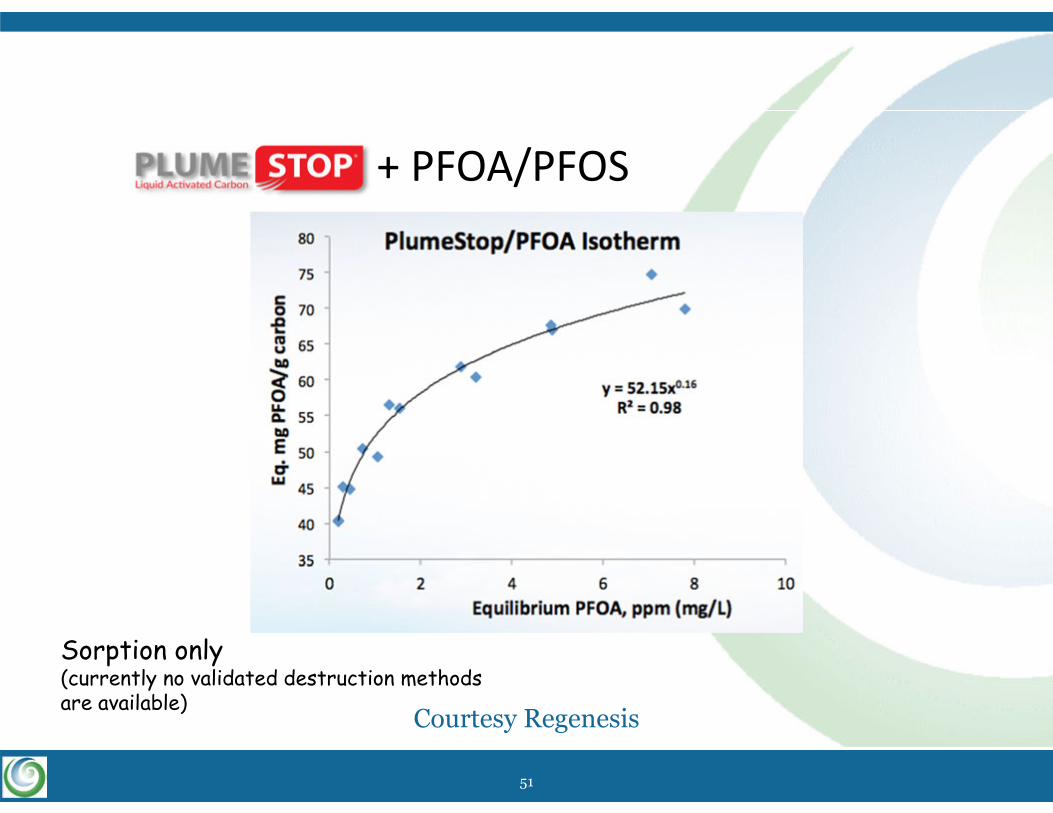
+ PFOA/PFOS
Sorption only (currently no validated destruction methods are available)
Courtesy Regenesis
51
For every zone of your plume, we’ve got you covered!
Page 52
tersusenv.comCopyright © 2017 Tersus Environmental, LLC. All Rights Reserved.
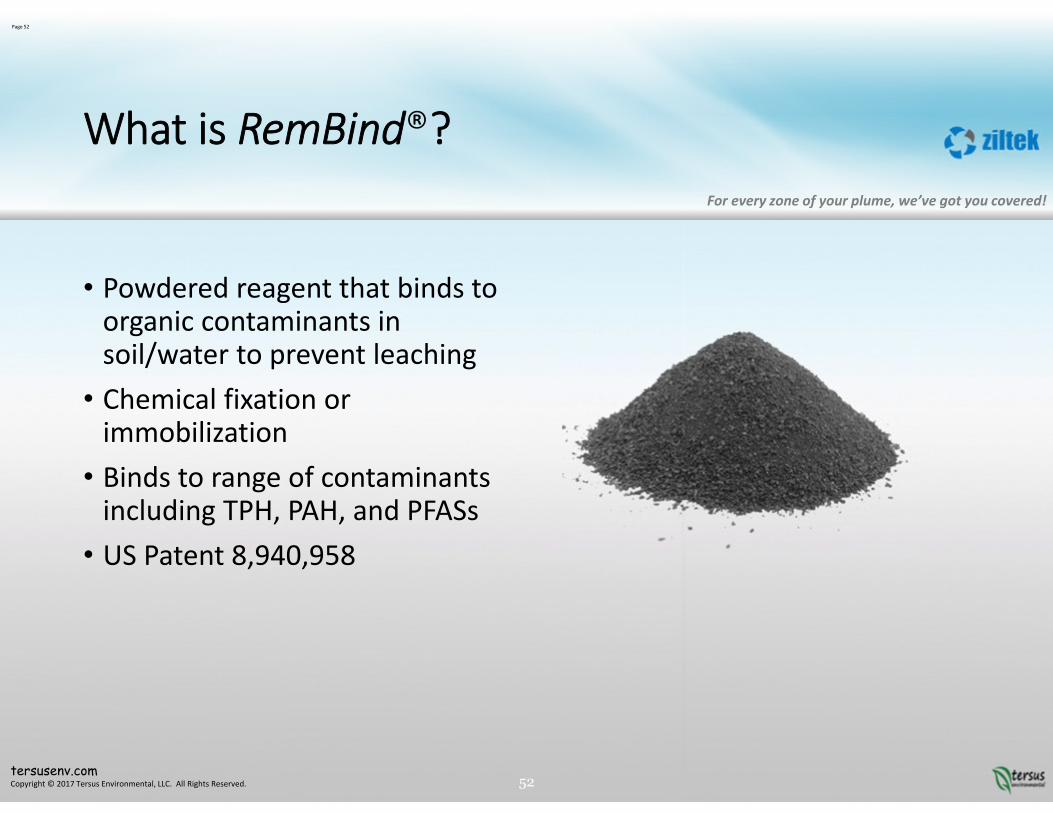
What is RemBind®?
• Powdered reagent that binds to organic contaminants in soil/water to prevent leaching
• Chemical fixation or immobilization
• Binds to range of contaminants including TPH, PAH, and PFASs
• US Patent 8,940,958
52
For every zone of your plume, we’ve got you covered!
Page 53
tersusenv.comCopyright © 2017 Tersus Environmental, LLC. All Rights Reserved.
How Does RemBind® Work?
• Main ingredients:oActivated carbon oAluminium hydroxide (amorphous) oOrganic matter and additives
• Large surface area with mixed charges
• Chemical and physical interactions
53
For every zone of your plume, we’ve got you covered!
Page 54
tersusenv.comCopyright © 2017 Tersus Environmental, LLC. All Rights Reserved.
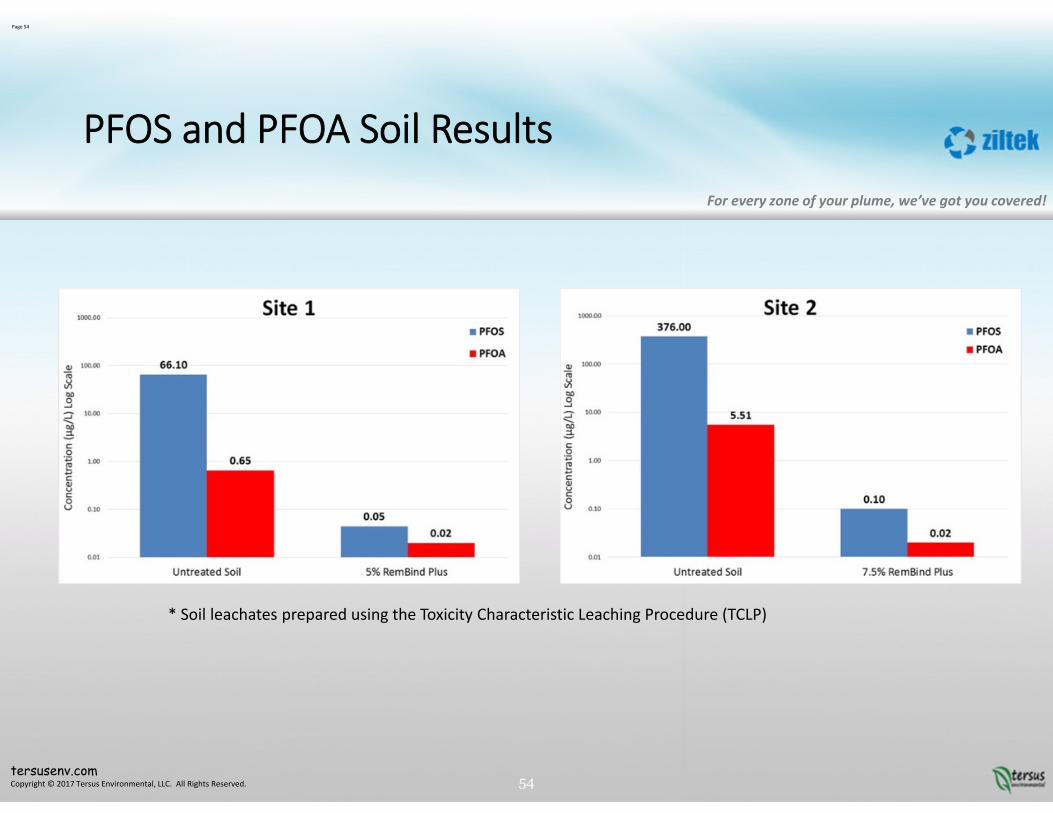
PFOS and PFOA Soil Results
* Soil leachates prepared using the Toxicity Characteristic Leaching Procedure (TCLP)
54
For every zone of your plume, we’ve got you covered!
Page 55
tersusenv.comCopyright © 2017 Tersus Environmental, LLC. All Rights Reserved. 55
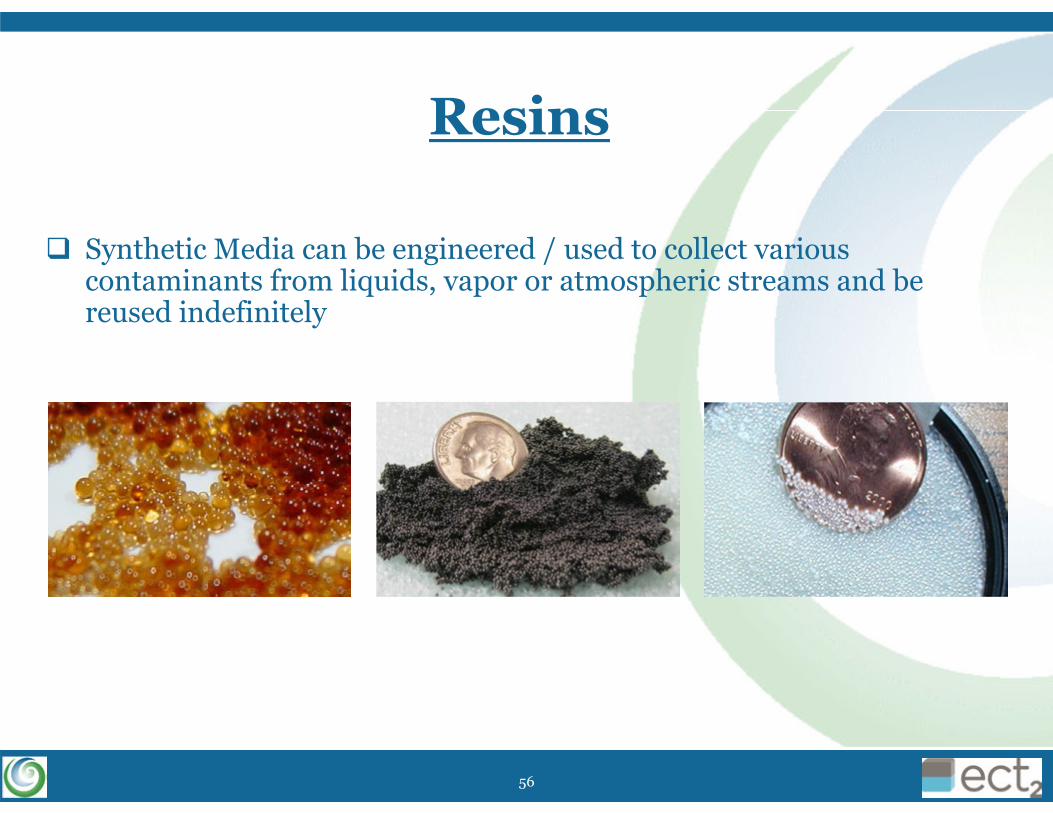
Resins
Synthetic Media can be engineered / used to collect various contaminants from liquids, vapor or atmospheric streams and be reused indefinitely
Slides courtesy of Steven Woodard, ect256

Bench-Scale Column Testing of four IX Resins
57
Overview Sorbix
Sorbix is essentially an adsorbent with IX functionality
Dual mechanism of removal takes advantage of properties of PFAS compounds
Capacity is 5-6X greater than GAC for PFOA and > 8X greater for PFOS.
Successful resin regeneration has been demonstrated
Distillation and PFAS destruction maximize sustainability
New resins are being tested: i.e., removal of shorter chain compounds
58
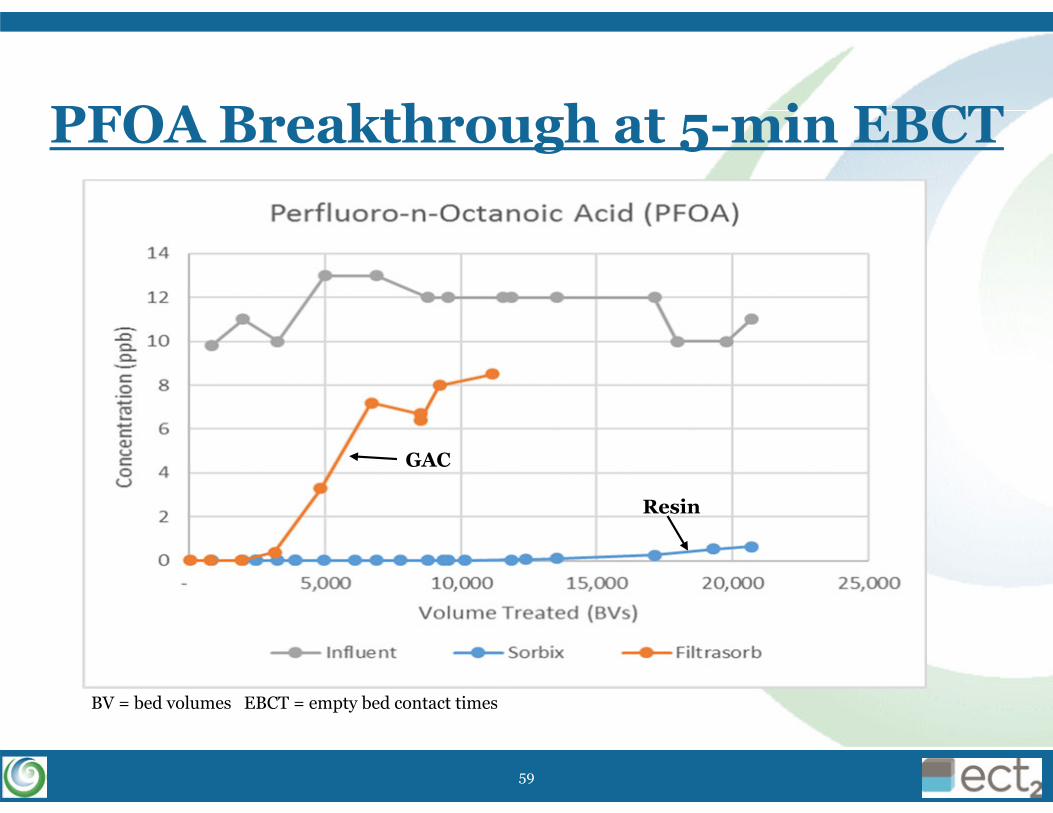
PFOA Breakthrough at 5-min EBCT
GAC
Resin
BV = bed volumes EBCT = empty bed contact times
59
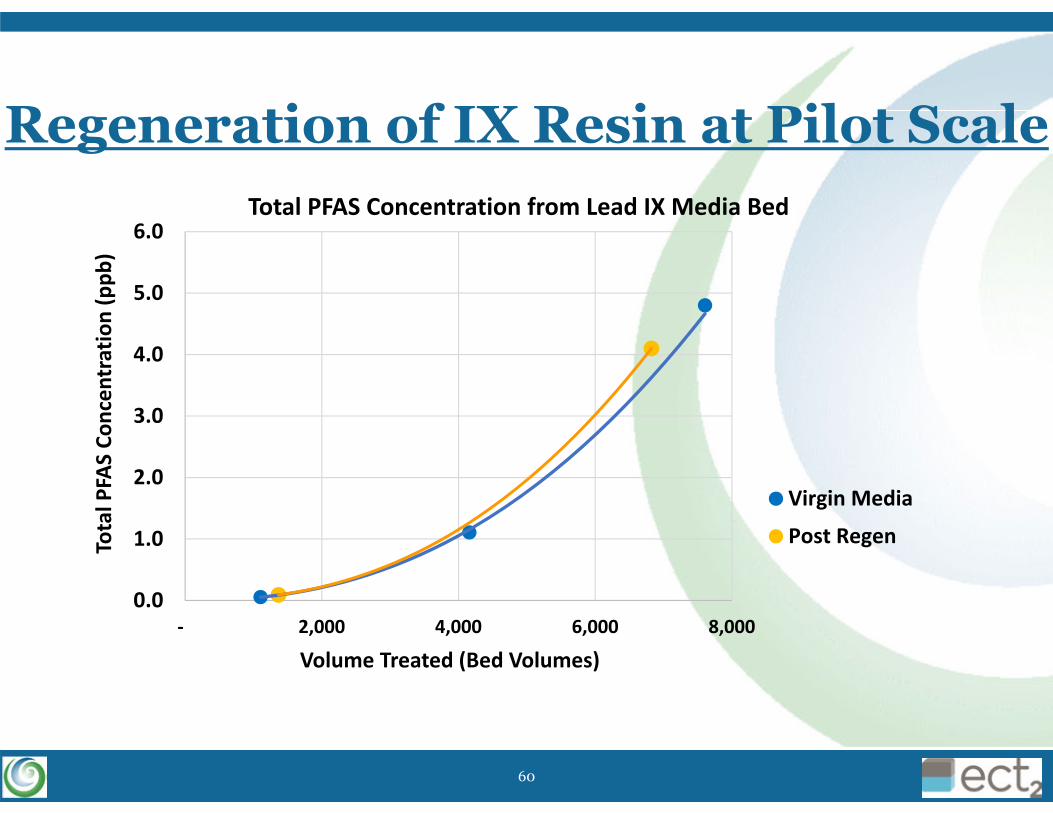
Regeneration of IX Resin at Pilot Scale
0.0
1.0
2.0
3.0
4.0
5.0
6.0
‐ 2,000 4,000 6,000 8,000
Total P
FAS Co
ncen
tration (ppb
)
Volume Treated (Bed Volumes)
Total PFAS Concentration from Lead IX Media Bed
Virgin Media
Post Regen
60

Carbon vs. IX Resins Carbon Proven effective multiple sites and >1000 point of entry treatment systems
Regeneration, at high temperature: “destroys” PFAS but may reduce capacity
Lower capacity than IX
Still evaluating short chain PFAS, but some success
Can be more cost-effective If shorter duration operations, lower PFAS concentrations, and less natural organic matter
Resins Number case studies increasing
Higher capacity for PFAS adsorption / IX
Working on engineering resins for improving short chain PFAS removal
Can be more cost-effective
On-site regeneration and PFAS destruction research/demonstration ongoing
Treatability studies are essential for design, etc.
61
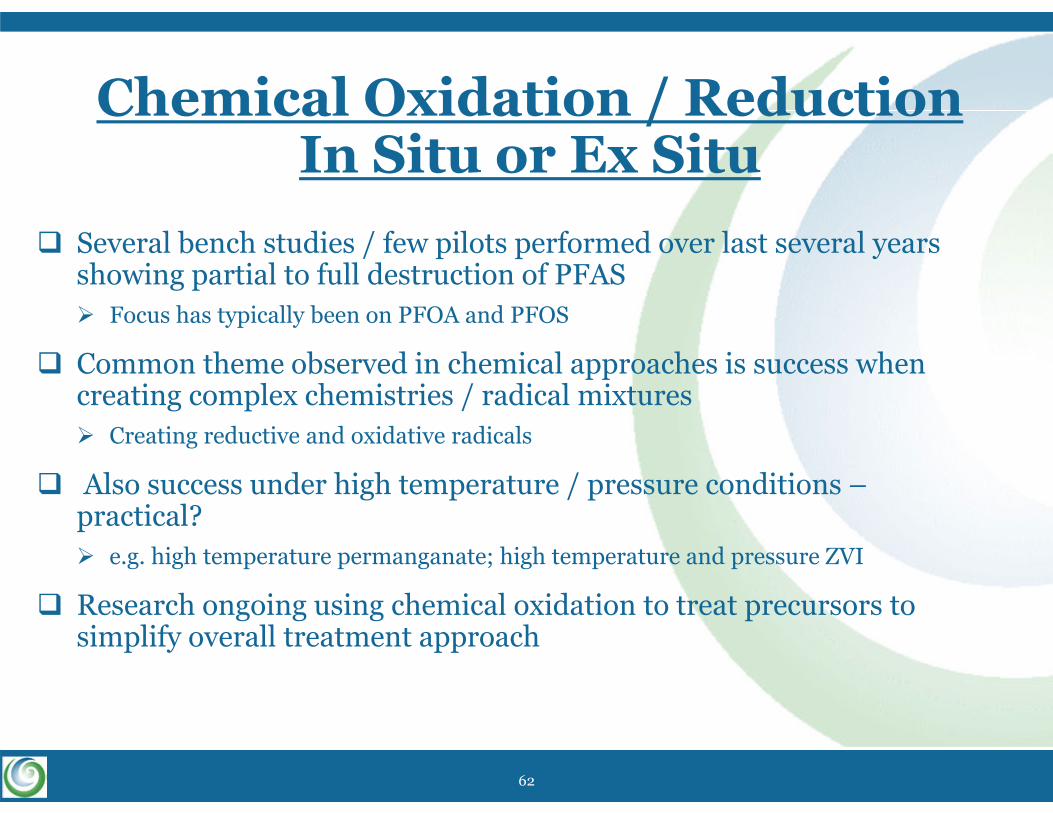
Chemical Oxidation / ReductionIn Situ or Ex Situ
Several bench studies / few pilots performed over last several years showing partial to full destruction of PFAS Focus has typically been on PFOA and PFOS
Common theme observed in chemical approaches is success when creating complex chemistries / radical mixtures Creating reductive and oxidative radicals
Also success under high temperature / pressure conditions –practical? e.g. high temperature permanganate; high temperature and pressure ZVI
Research ongoing using chemical oxidation to treat precursors to simplify overall treatment approach
62
Pretreatment of Precursors
63
64
65
66
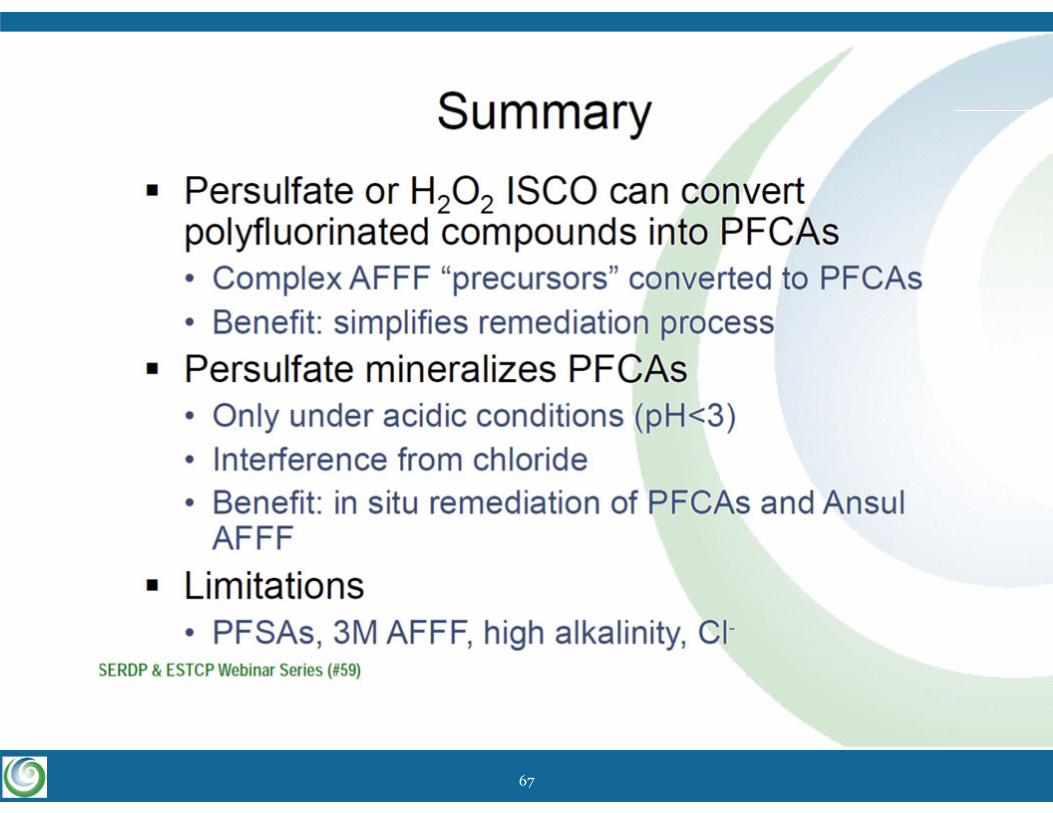
67
Exercise: PFAS Remedial Options
For the same site above, contaminated source area soil has been excavated and disposed of offsite, and a new water well was drilled for the drinking water user. Additional groundwater testing indicates the presence of significant concentrations of precursors. 1) What would be some good remedial options to consider for the site groundwater containing PFOS, PFOA, and precursors? 2) What questions should we be asking as we consider remedial options?
68

Integrating Key Data Collection into Characterization
69
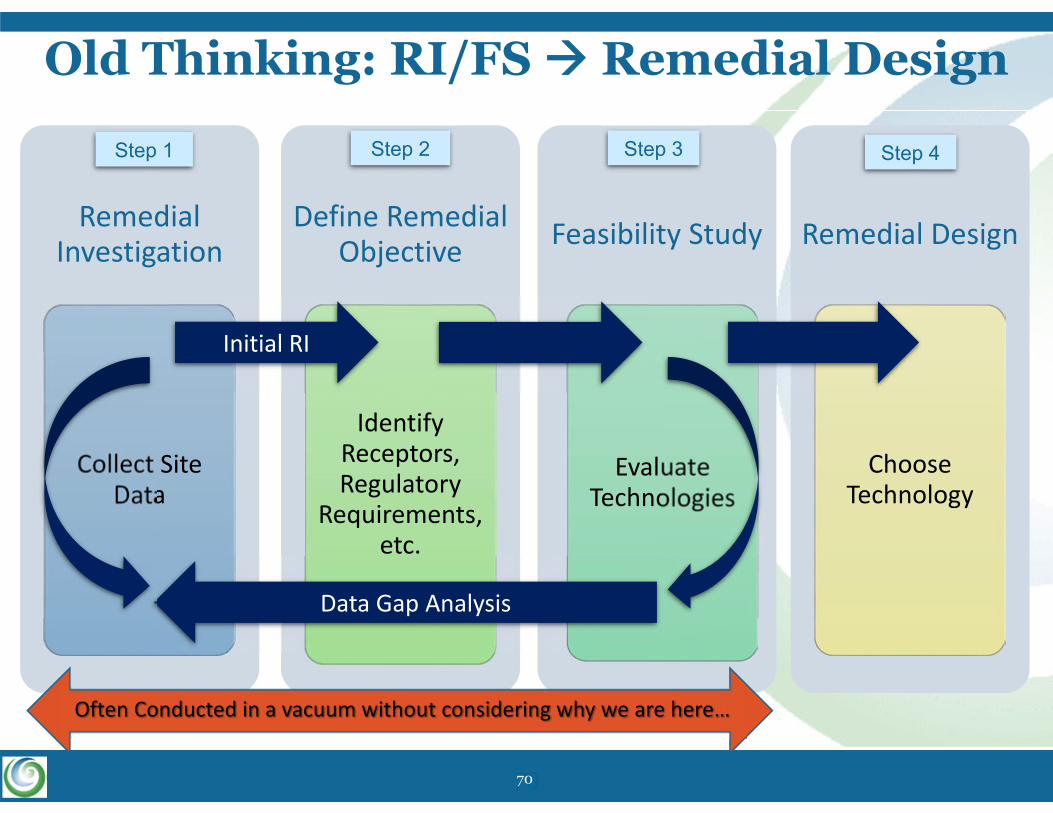
Old Thinking: RI/FS Remedial Design
70
Remedial Investigation
Collect Site Data
Feasibility Study
Evaluate Technologies
Define Remedial Objective
Identify Receptors, Regulatory
Requirements, etc.
Remedial Design
Choose Technology
Initial RI
Data Gap Analysis
Step 1 Step 2 Step 3 Step 4
Often Conducted in a vacuum without considering why we are here…
70
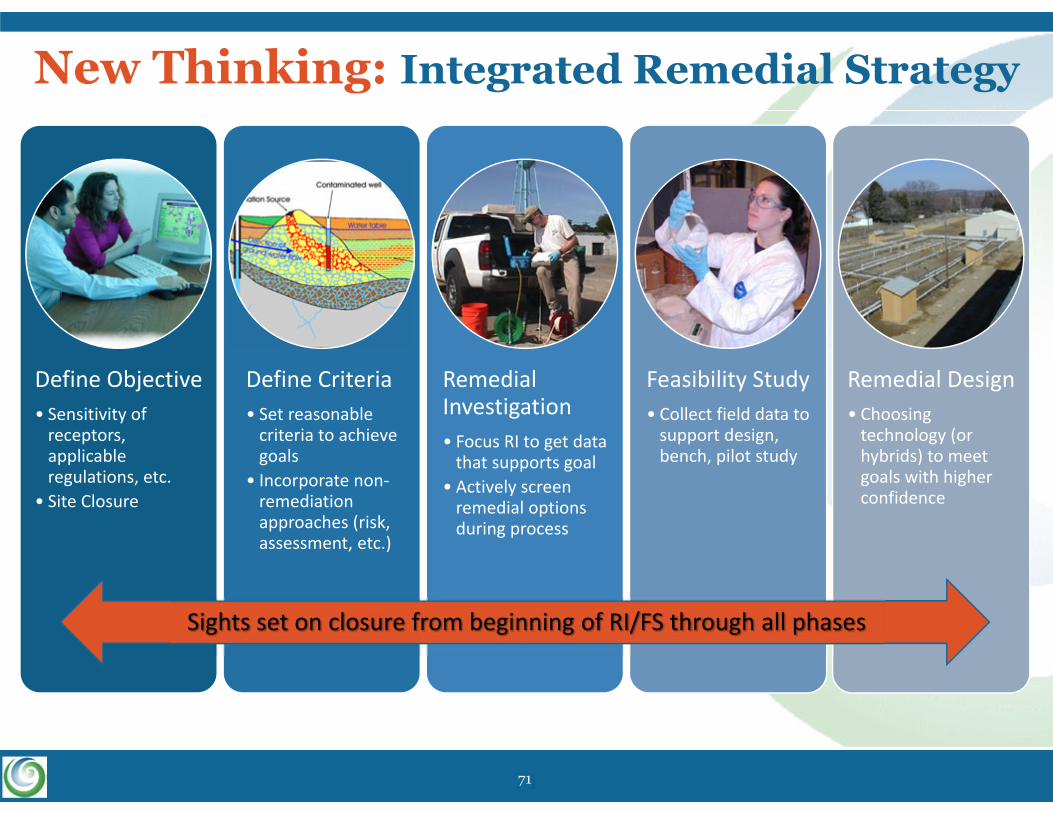
New Thinking: Integrated Remedial Strategy
71
Define Objective• Sensitivity of receptors, applicable regulations, etc.
• Site Closure
Define Criteria• Set reasonable criteria to achieve goals
• Incorporate non‐remediation approaches (risk, assessment, etc.)
Remedial Investigation• Focus RI to get data that supports goal
• Actively screen remedial options during process
Feasibility Study• Collect field data to support design, bench, pilot study
Remedial Design• Choosing technology (or hybrids) to meet goals with higher confidence
Sights set on closure from beginning of RI/FS through all phases
71
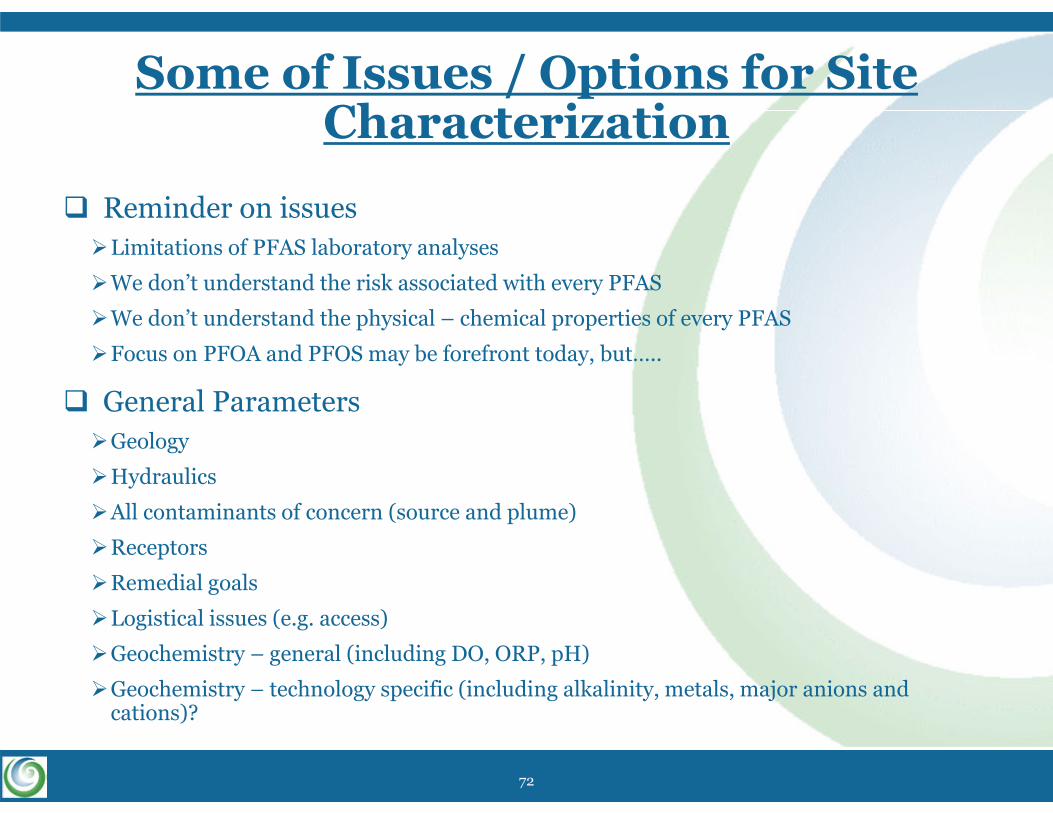
Some of Issues / Options for Site Characterization
Reminder on issues Limitations of PFAS laboratory analyses
We don’t understand the risk associated with every PFAS
We don’t understand the physical – chemical properties of every PFAS
Focus on PFOA and PFOS may be forefront today, but…..
General Parameters Geology
Hydraulics
All contaminants of concern (source and plume)
Receptors
Remedial goals
Logistical issues (e.g. access)
Geochemistry – general (including DO, ORP, pH)
Geochemistry – technology specific (including alkalinity, metals, major anions and cations)?
72
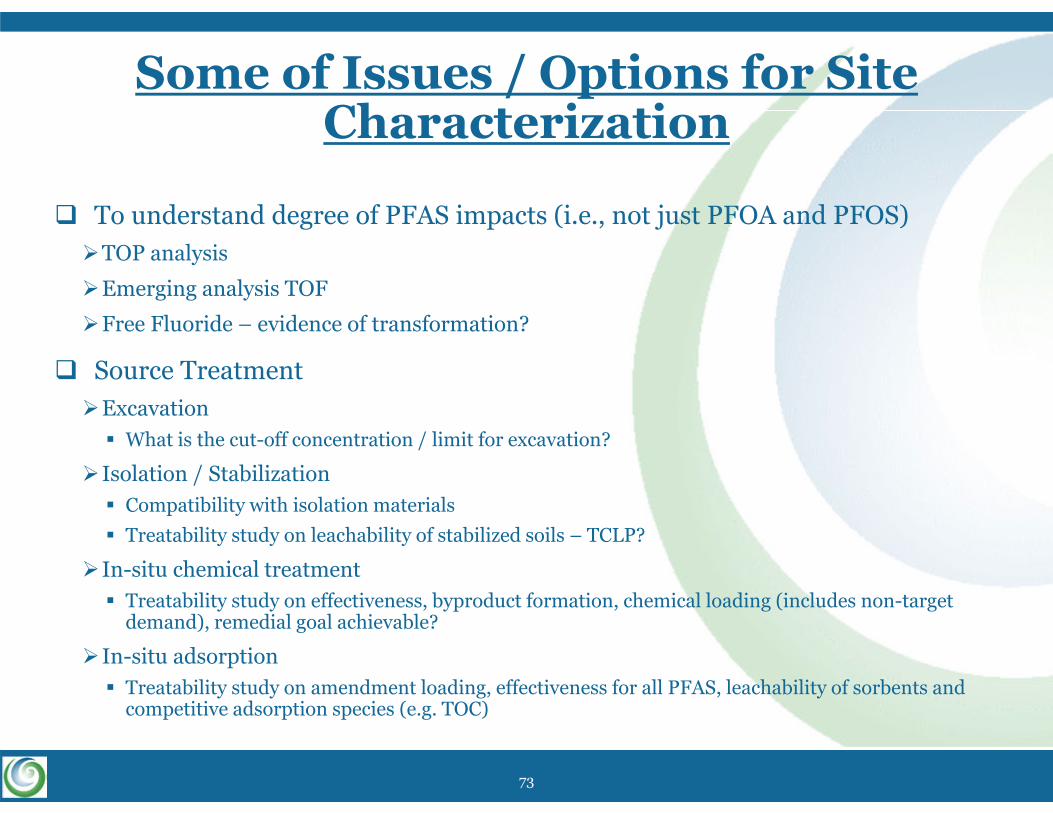
Some of Issues / Options for Site Characterization
To understand degree of PFAS impacts (i.e., not just PFOA and PFOS) TOP analysis
Emerging analysis TOF
Free Fluoride – evidence of transformation?
Source TreatmentExcavation What is the cut-off concentration / limit for excavation?
Isolation / Stabilization Compatibility with isolation materials Treatability study on leachability of stabilized soils – TCLP?
In-situ chemical treatment Treatability study on effectiveness, byproduct formation, chemical loading (includes non-target
demand), remedial goal achievable?
In-situ adsorption Treatability study on amendment loading, effectiveness for all PFAS, leachability of sorbents and
competitive adsorption species (e.g. TOC)
73
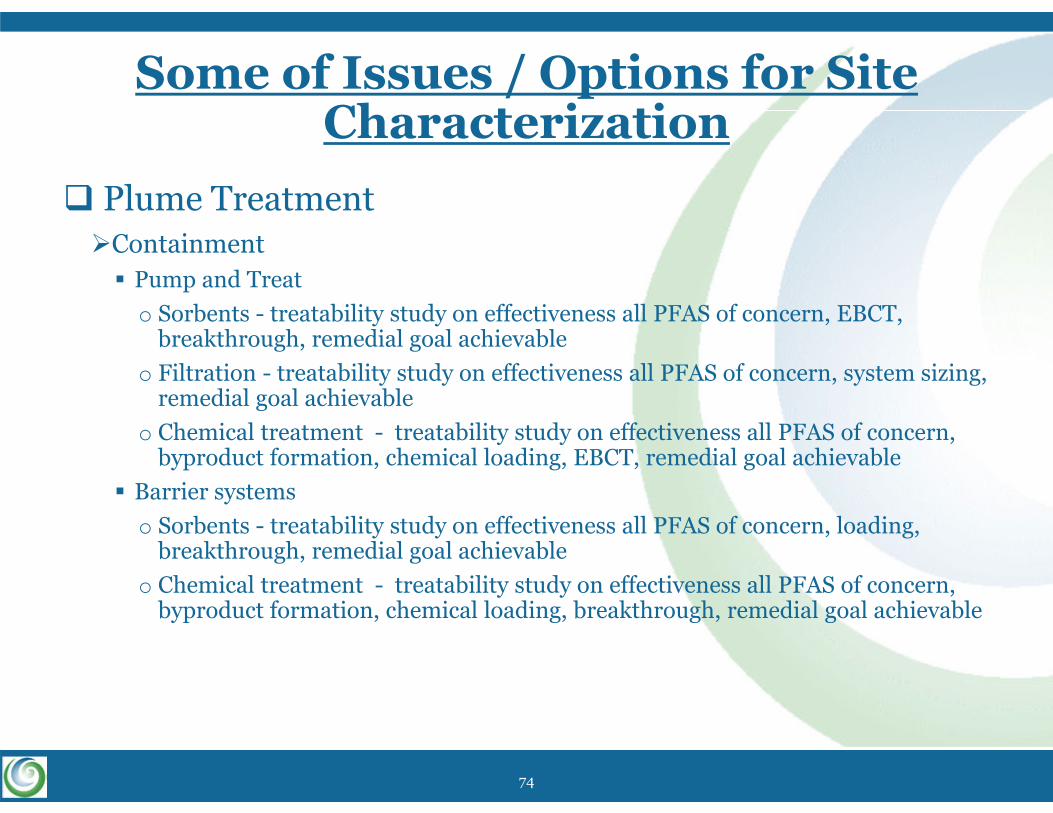
Some of Issues / Options for Site Characterization
Plume TreatmentContainment Pump and Treato Sorbents - treatability study on effectiveness all PFAS of concern, EBCT,
breakthrough, remedial goal achievableo Filtration - treatability study on effectiveness all PFAS of concern, system sizing,
remedial goal achievableo Chemical treatment - treatability study on effectiveness all PFAS of concern,
byproduct formation, chemical loading, EBCT, remedial goal achievable Barrier systems o Sorbents - treatability study on effectiveness all PFAS of concern, loading,
breakthrough, remedial goal achievableo Chemical treatment - treatability study on effectiveness all PFAS of concern,
byproduct formation, chemical loading, breakthrough, remedial goal achievable
74
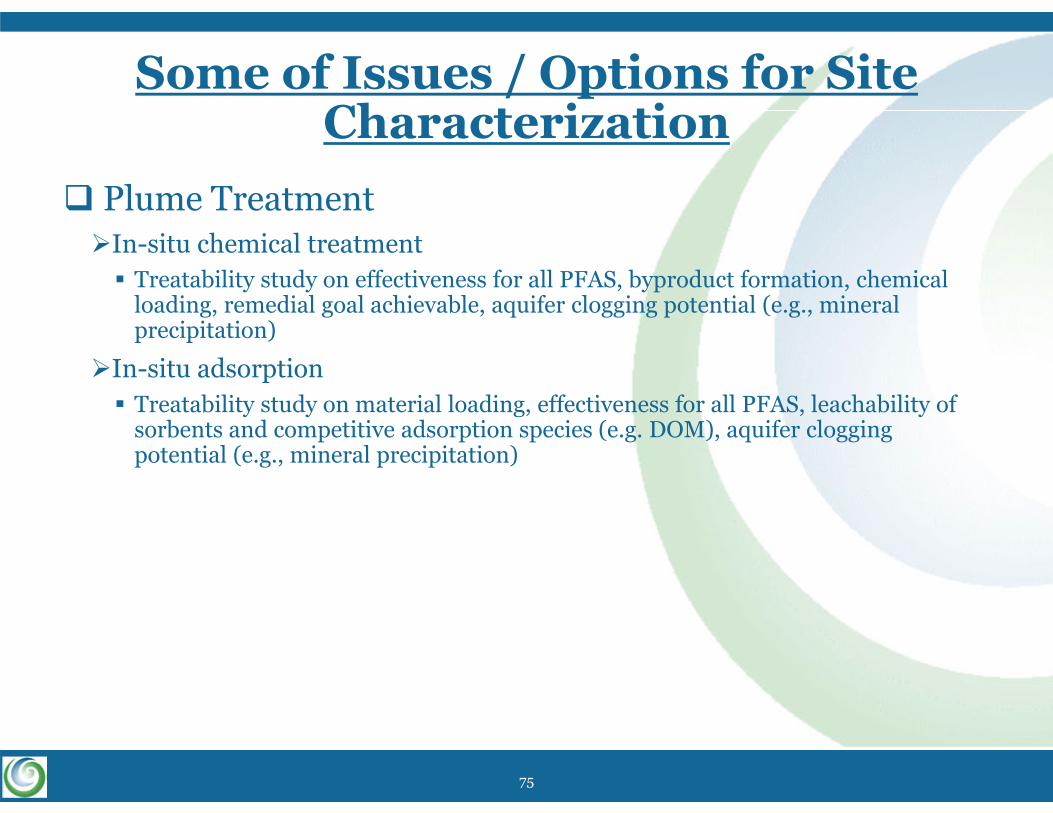
Some of Issues / Options for Site Characterization
Plume TreatmentIn-situ chemical treatment Treatability study on effectiveness for all PFAS, byproduct formation, chemical
loading, remedial goal achievable, aquifer clogging potential (e.g., mineral precipitation)
In-situ adsorption Treatability study on material loading, effectiveness for all PFAS, leachability of
sorbents and competitive adsorption species (e.g. DOM), aquifer clogging potential (e.g., mineral precipitation)
75
Exercise: Integrating Key Data Collection into Site Characterization
What analyses do you wish you had included in the additional testing that would help determine the optimal remedial approach for site groundwater?
76
Exercise: Treatability Studies
We’ve identified some potential remedial options for site groundwater that look promising. And we’ve filled the data gaps identified in the last exercise. What questions could treatability testing answer about remediating the site GW?
77
Adsorption Case Studies
78
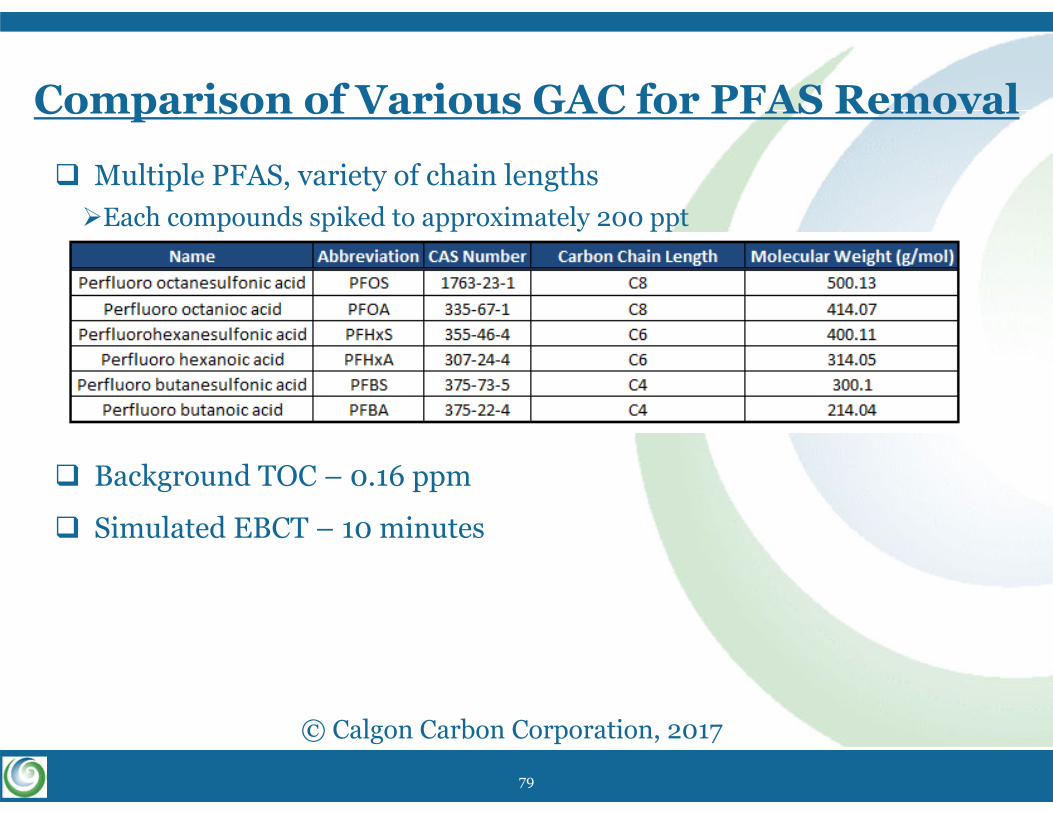
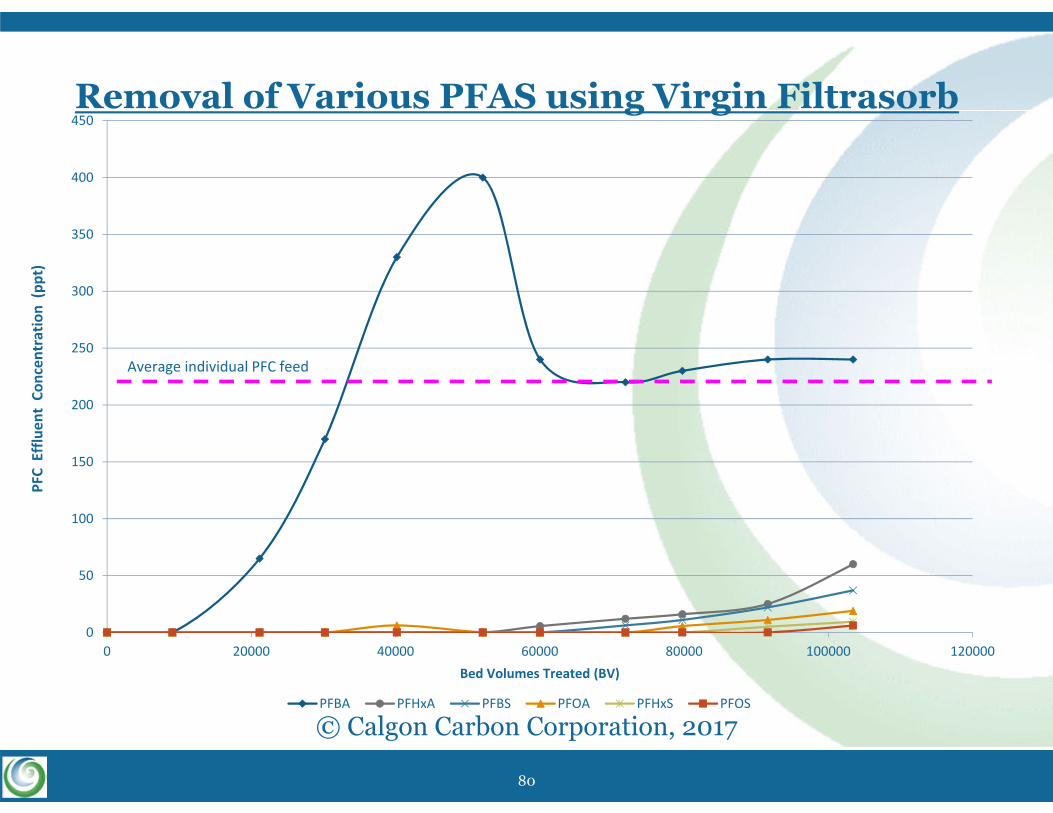
Multiple PFAS, variety of chain lengthsEach compounds spiked to approximately 200 ppt
Background TOC – 0.16 ppm
Simulated EBCT – 10 minutes
Comparison of Various GAC for PFAS Removal
© Calgon Carbon Corporation, 2017
79
0
50
100
150
200
250
300
350
400
450
0 20000 40000 60000 80000 100000 120000
PFC Effluen
t Co
ncen
tration (p
pt)
Bed Volumes Treated (BV)
PFBA PFHxA PFBS PFOA PFHxS PFOS
Removal of Various PFAS using Virgin Filtrasorb
Average individual PFC feed
© Calgon Carbon Corporation, 2017
80
0
50
100
150
200
250
300
350
400
450
500
0 10000 20000 30000 40000 50000 60000 70000 80000 90000 100000
PFC Effluen
t Co
ncen
tration (p
pt)
Bed Volumes Treated (BV)
PFBA PFHxA PFBS PFOA PFHxS PFOS
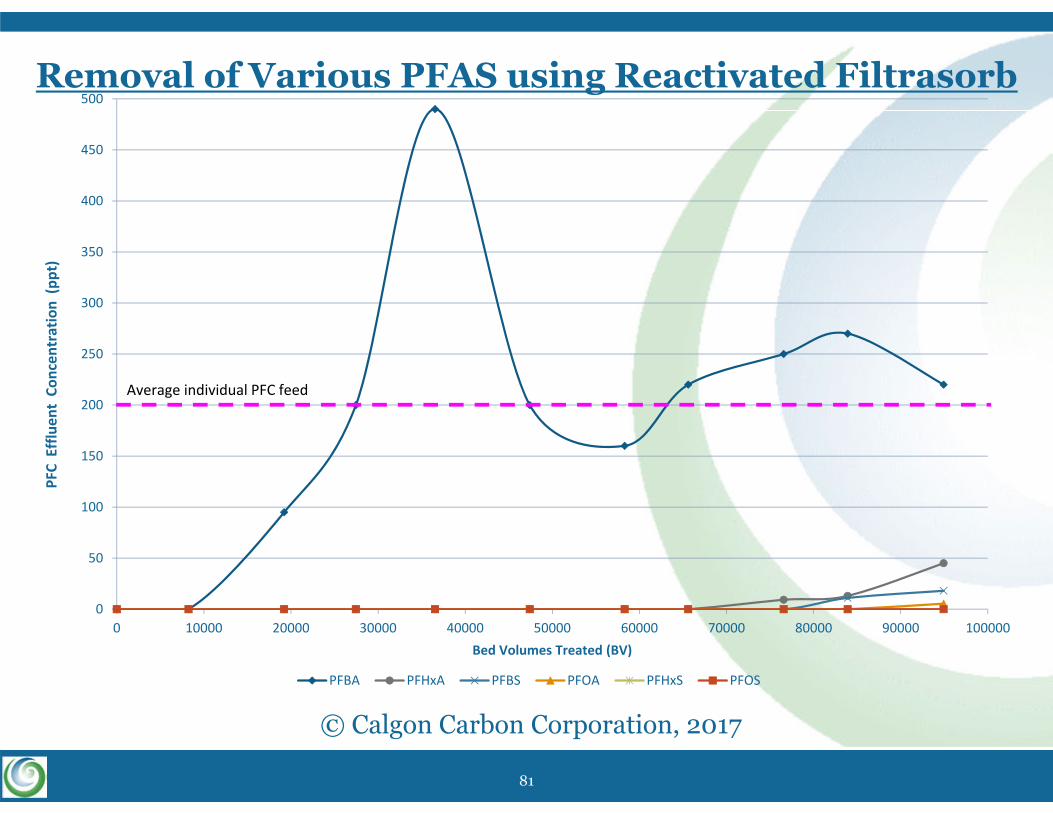
Removal of Various PFAS using Reactivated Filtrasorb
Average individual PFC feed
© Calgon Carbon Corporation, 2017
81
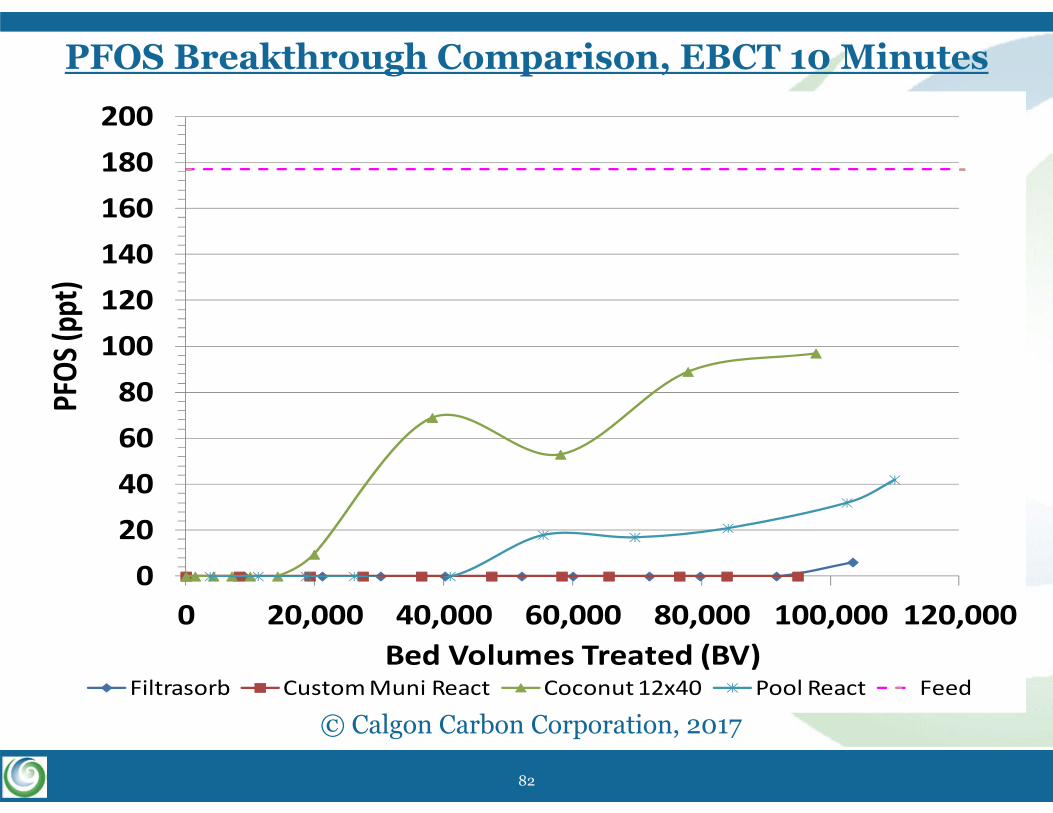
PFOS Breakthrough Comparison, EBCT 10 Minutes
020406080
100120140160180200
0 20,000 40,000 60,000 80,000 100,000 120,000
PFOS
(ppt)
Bed Volumes Treated (BV)Filtrasorb Custom Muni React Coconut 12x40 Pool React Feed
© Calgon Carbon Corporation, 2017
82
0
100
200
300
400
500
0 50 100 150 200 250 300
PFOA Co
ncen
tration (ng/L)
Days of Operation
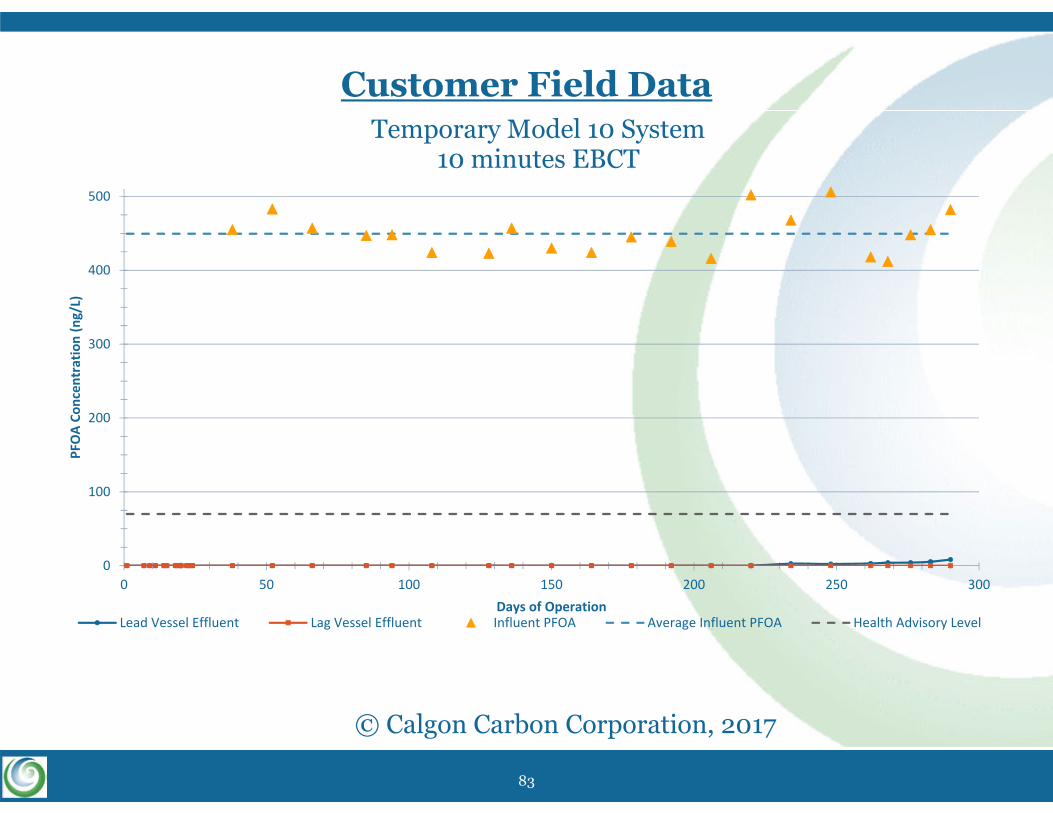
Temporary Model 10 System10 minutes EBCT
Lead Vessel Effluent Lag Vessel Effluent Influent PFOA Average Influent PFOA Health Advisory Level
Customer Field Data
© Calgon Carbon Corporation, 2017
83
© Amec Foster Wheeler 2016.84
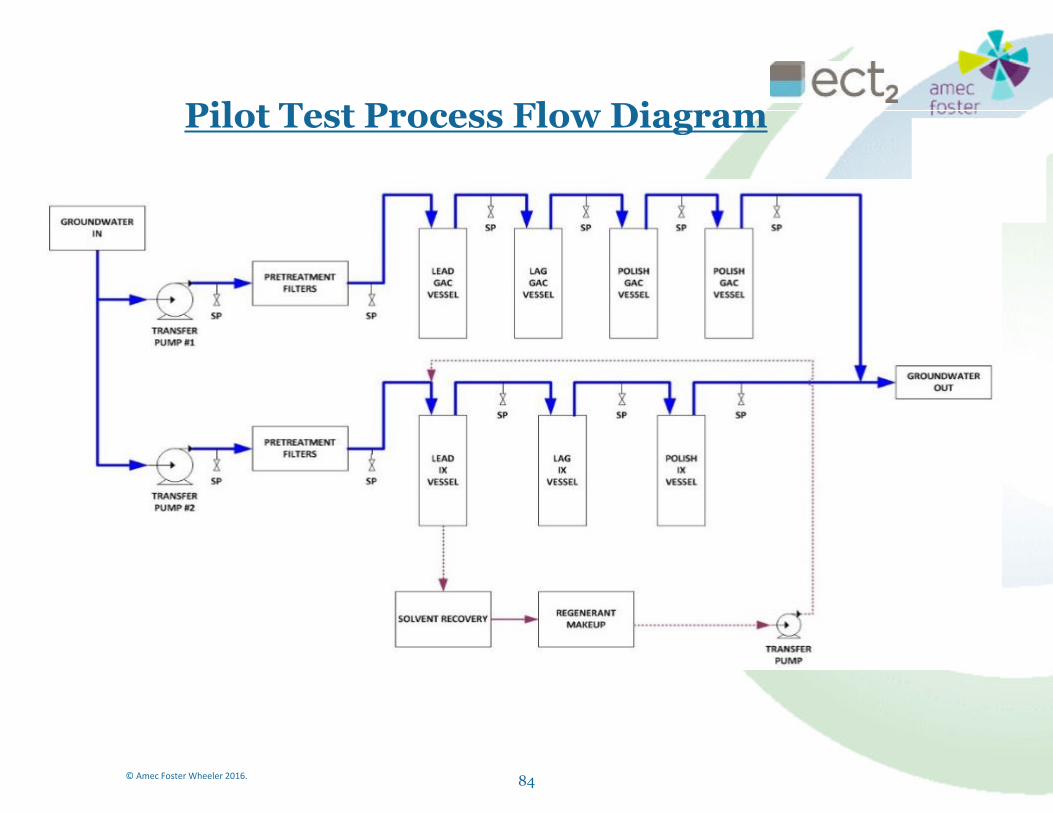
Pilot Test Process Flow Diagram
84
© Amec Foster Wheeler 2016.85
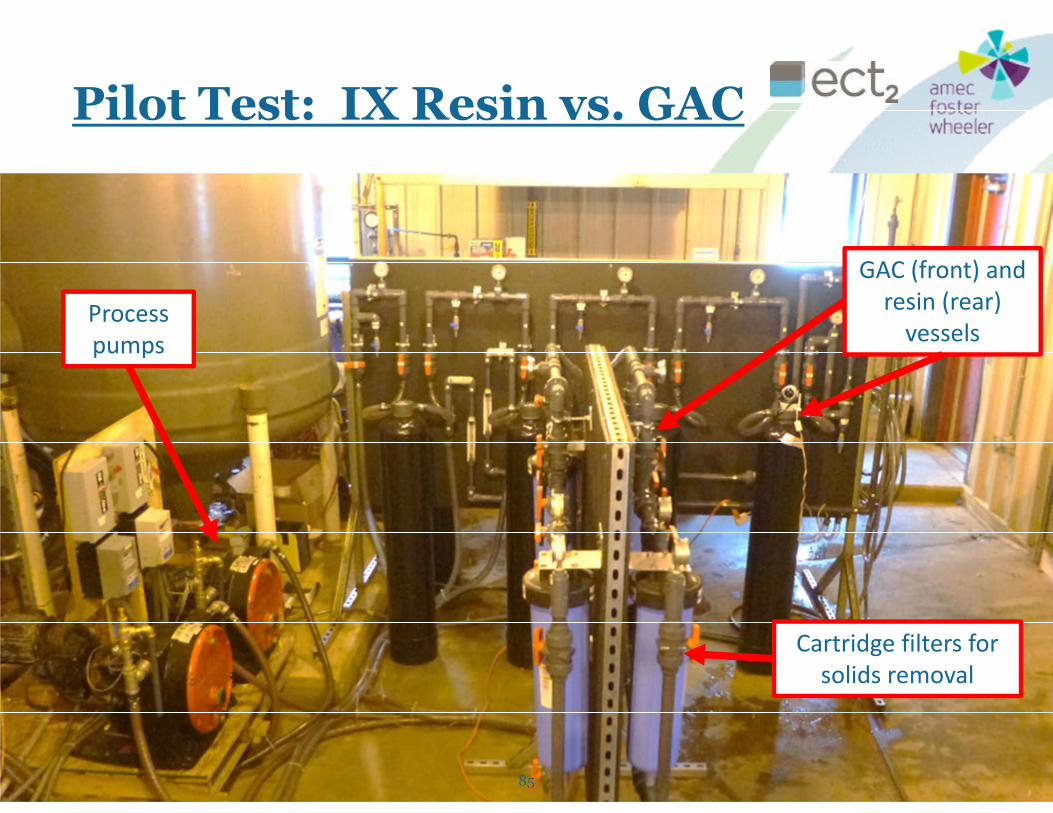
Pilot Test: IX Resin vs. GAC
Processpumps
Cartridge filters for solids removal
GAC (front) and resin (rear) vessels
85

PFOA Breakthrough at 5-min EBCT
GAC
Resin
BV = bed volumes EBCT = empty bed contact times
86
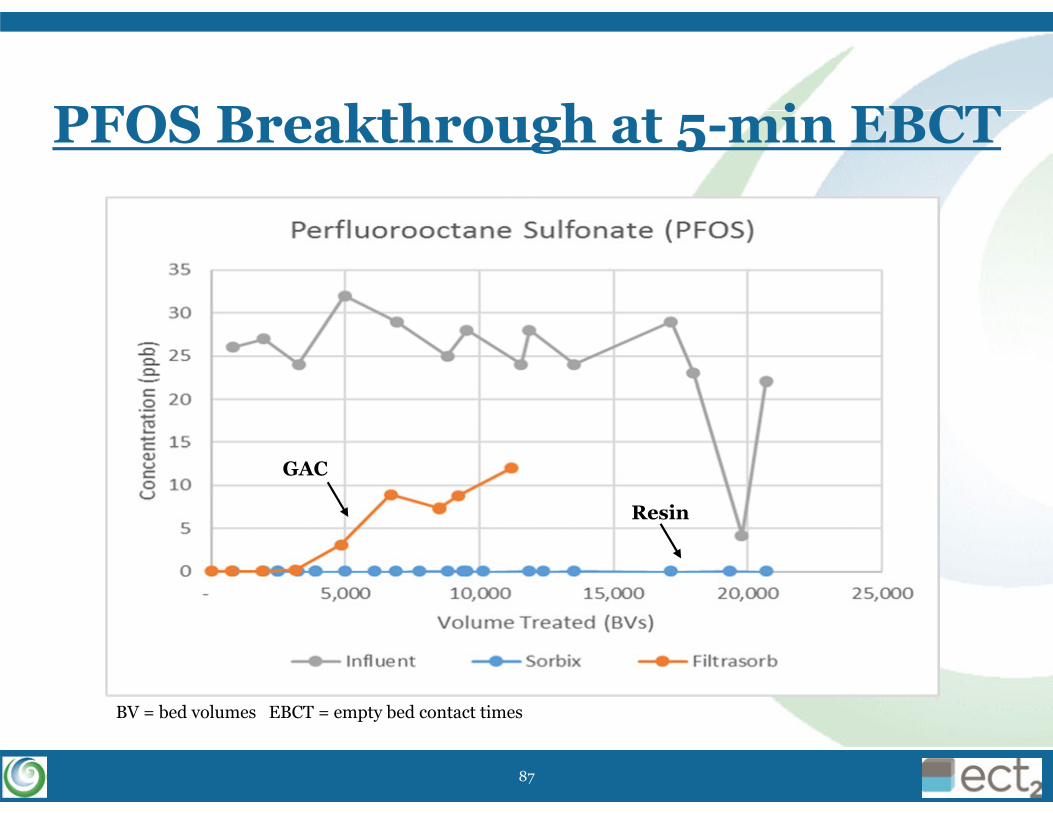
PFOS Breakthrough at 5-min EBCT
GAC
Resin
87
BV = bed volumes EBCT = empty bed contact times
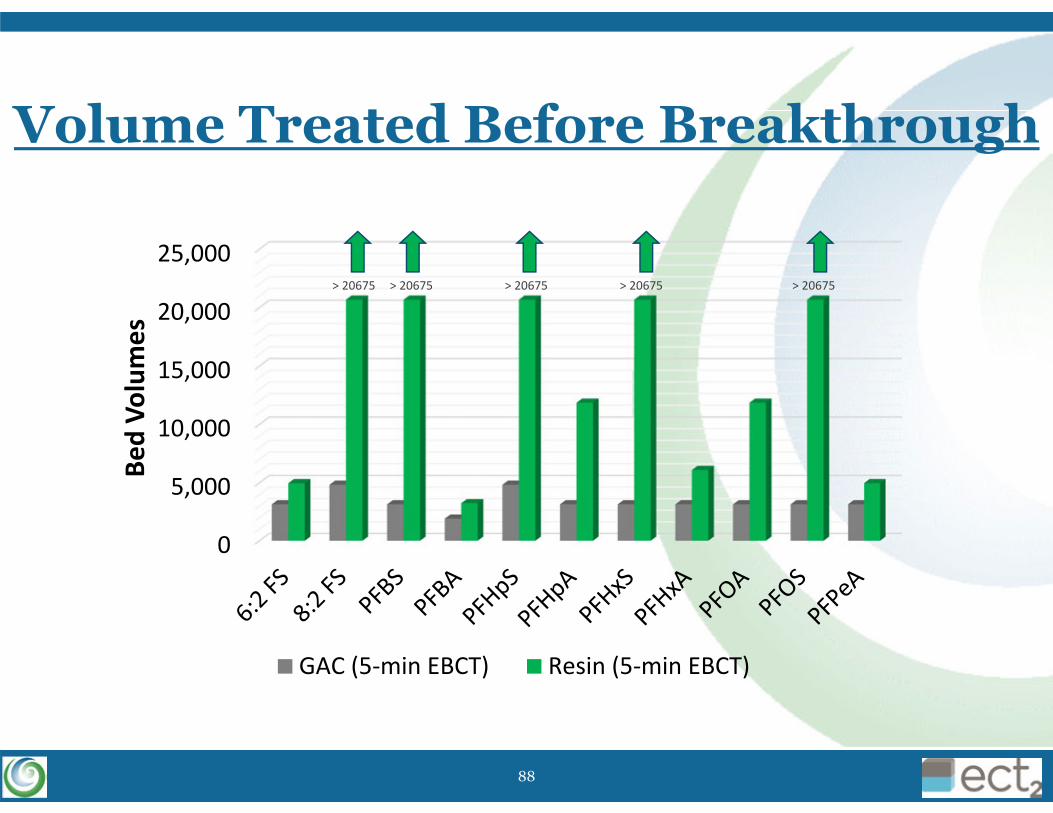
Volume Treated Before Breakthrough
0
5,000
10,000
15,000
20,000
25,000> 20675 > 20675 > 20675 > 20675 > 20675
Bed Vo
lumes
GAC (5‐min EBCT) Resin (5‐min EBCT)
88
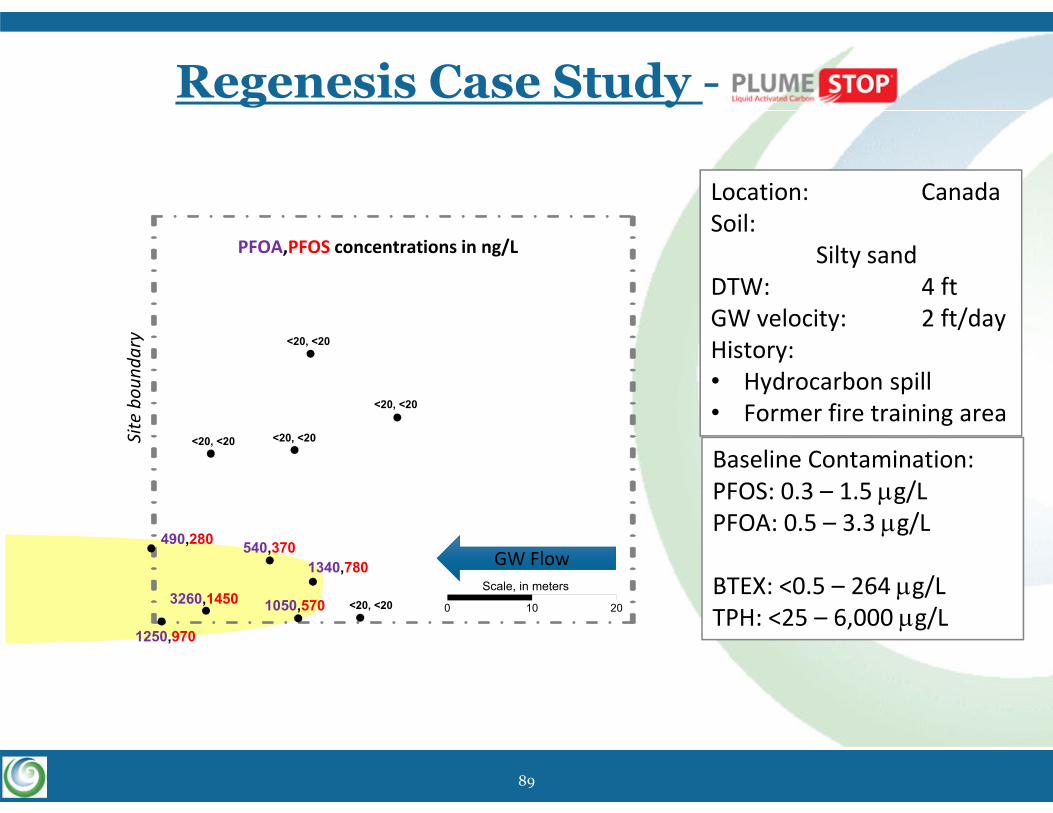
0 10 20
Scale, in meters
PFOA,PFOS concentrations in ng/L
Location: CanadaSoil:
Silty sandDTW: 4 ftGW velocity: 2 ft/dayHistory: • Hydrocarbon spill• Former fire training area
GW Flow
Baseline Contamination:PFOS: 0.3 – 1.5 g/LPFOA: 0.5 – 3.3 g/L
BTEX: <0.5 – 264 g/LTPH: <25 – 6,000 g/L
<20, <20
540,3701340,780
1050,5703260,1450
1250,970
<20, <20
<20, <20 <20, <20
<20, <20
490,280
Regenesis Case Study -Site bou
ndary
89
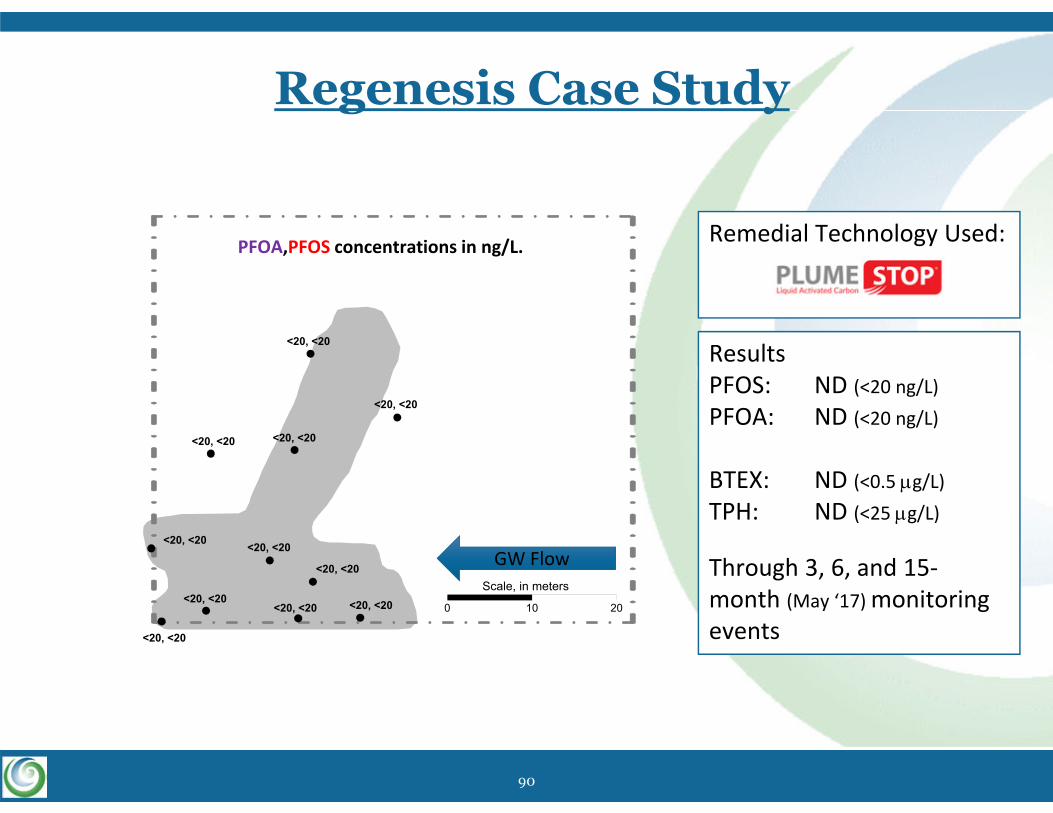
<20, <20 <20, <20
<20, <20
<20, <20 <20, <20
<20, <20
0 10 20
Scale, in meters
PFOA,PFOS concentrations in ng/L.
GW Flow
ResultsPFOS: ND (<20 ng/L)PFOA: ND (<20 ng/L)
BTEX: ND (<0.5 g/L)TPH: ND (<25 g/L)
Through 3, 6, and 15‐month (May ‘17) monitoring events
<20, <20
<20, <20
<20, <20 <20, <20
<20, <20
Remedial Technology Used:
Regenesis Case Study
90
Exercise: In-Situ Adsorption
What additional data collection or analyses do you wish too include to help determine if this is the optimal remedial approach for site groundwater?
91
Chemical Oxidation Case Study
92
93Copyright© EnChem Engineering, Inc. 2017All Rights Reserved.
Remediation of Mixed Organics and Per and Poly Fluoroalkyl Compounds (PFAS) with OxyZone®, a Multi‐Oxidant Blend
AEHS Conference WorkshopOctober 18, 2017
www.en‐chem.com
Raymond Ball, Ph.D., P.E., L.S.P.
94Copyright© EnChem Engineering, Inc. 2017All Rights Reserved.
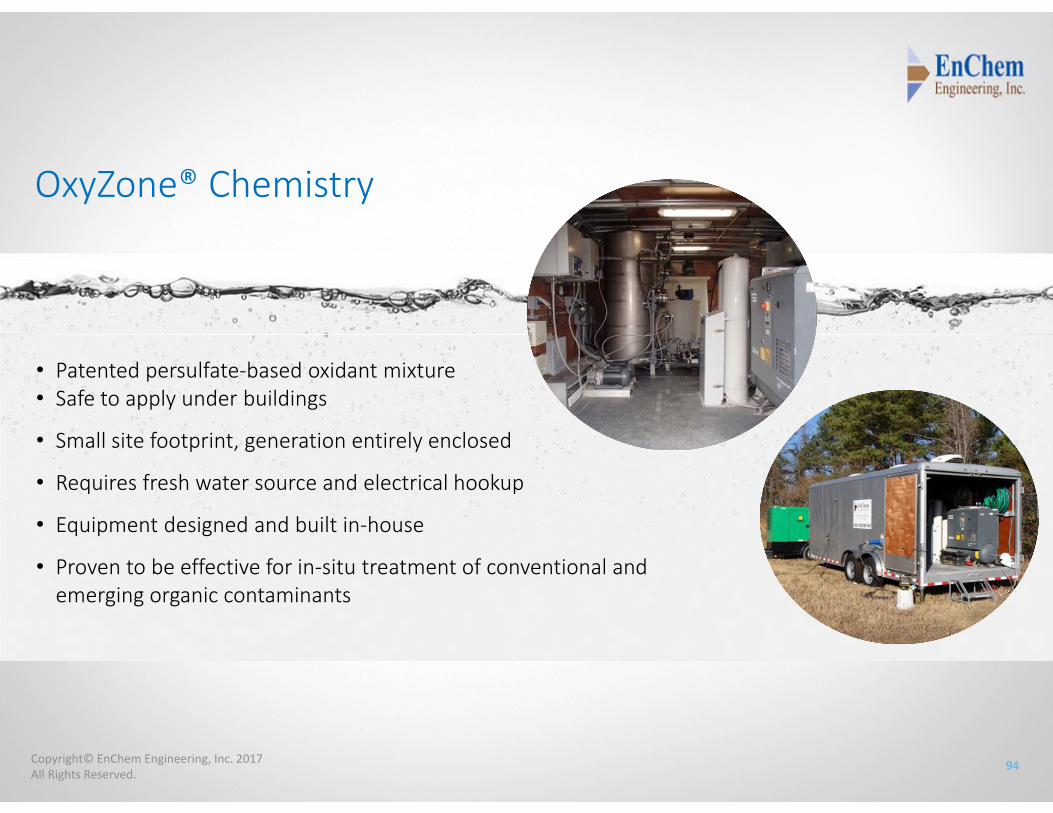
OxyZone® Chemistry
• Patented persulfate‐based oxidant mixture• Safe to apply under buildings
• Small site footprint, generation entirely enclosed
• Requires fresh water source and electrical hookup
• Equipment designed and built in‐house
• Proven to be effective for in‐situ treatment of conventional and emerging organic contaminants
95Copyright© EnChem Engineering, Inc. 2017All Rights Reserved.
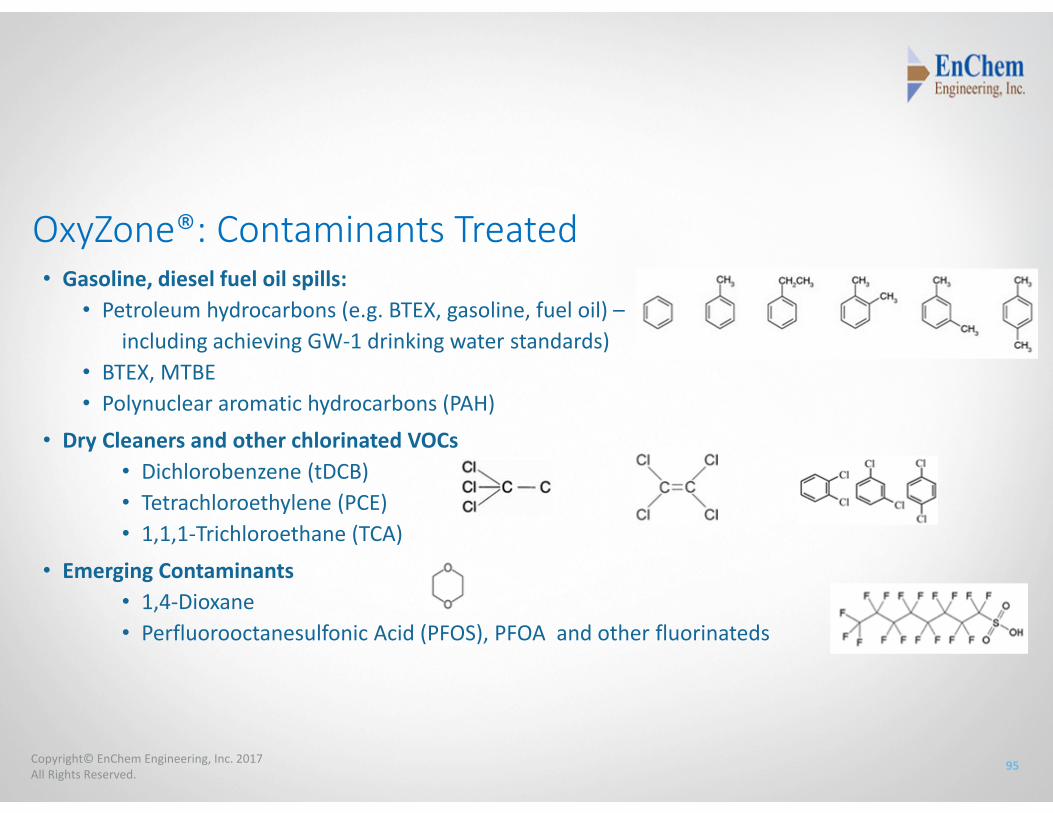
OxyZone®: Contaminants Treated• Gasoline, diesel fuel oil spills:
• Petroleum hydrocarbons (e.g. BTEX, gasoline, fuel oil) –including achieving GW‐1 drinking water standards)
• BTEX, MTBE• Polynuclear aromatic hydrocarbons (PAH)
• Dry Cleaners and other chlorinated VOCs• Dichlorobenzene (tDCB)• Tetrachloroethylene (PCE)• 1,1,1‐Trichloroethane (TCA)
• Emerging Contaminants• 1,4‐Dioxane• Perfluorooctanesulfonic Acid (PFOS), PFOA and other fluorinateds
96Copyright© EnChem Engineering, Inc. 2017All Rights Reserved.
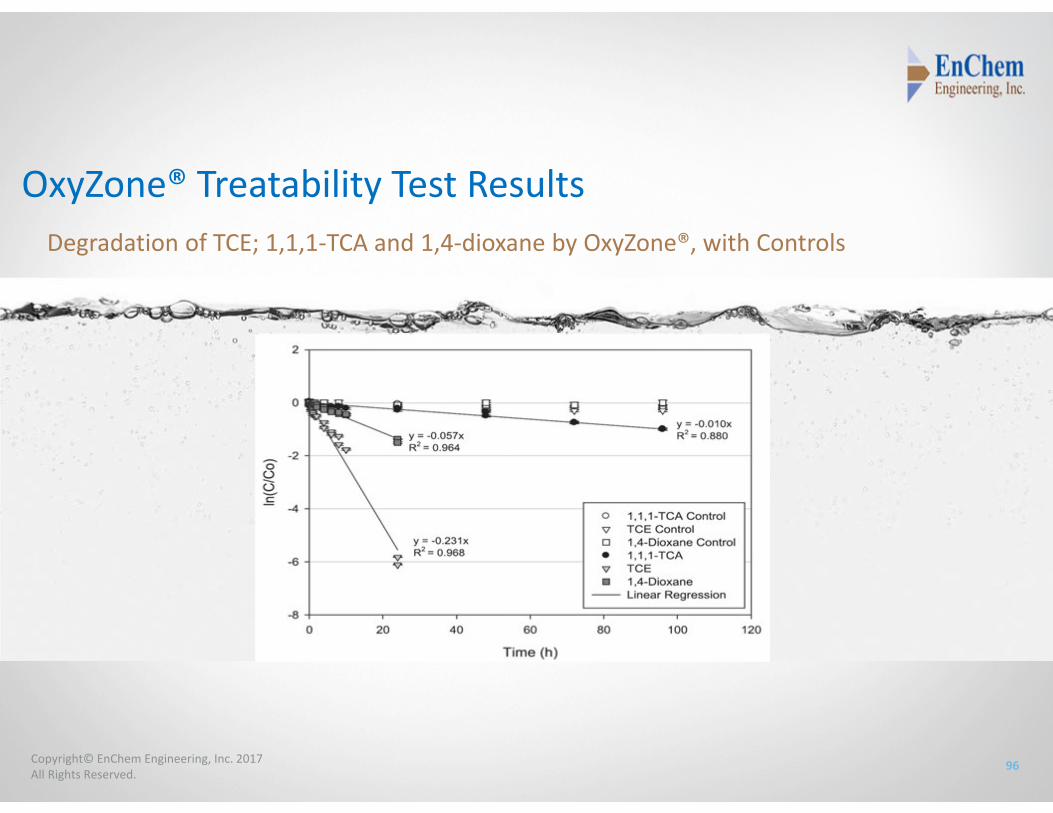
Degradation of TCE; 1,1,1‐TCA and 1,4‐dioxane by OxyZone®, with Controls
OxyZone® Treatability Test Results
97Copyright© EnChem Engineering, Inc. 2017All Rights Reserved.
Field Demonstration Test ofMixed Organics Remediation
EnChem Engineering
• Fire Training Area (FTA) at Joint Base Langley‐Eustis (JBLE) in Hampton, VA• Mixed organic wastes released and contaminated soil and GW • 9 Month Field Demonstration• OxyZone® Injection test cell of 20 feet by 30 feet• Successful aromatic and chlorinated VOC treatment• Groundwater PFAS Results showed statistically significant reduction• PFAS destruction confirmed by laboratory bench scale testing
Summary
98Copyright© EnChem Engineering, Inc. 2017All Rights Reserved.
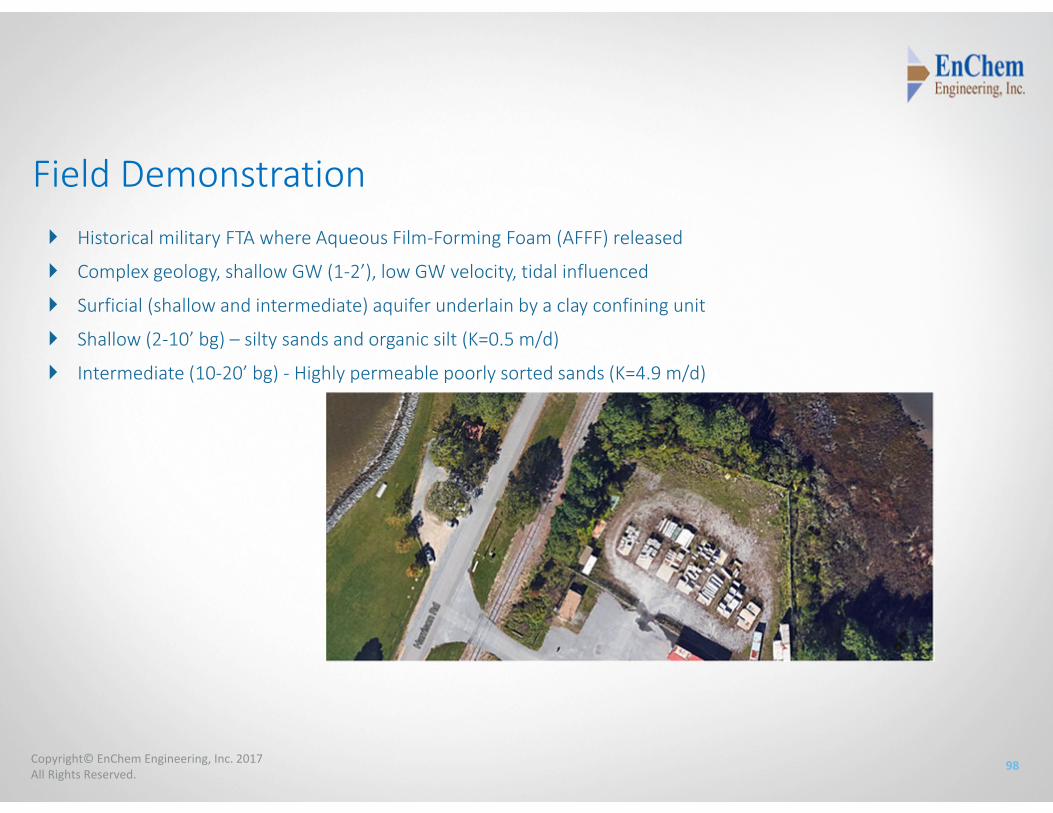
Field Demonstration Historical military FTA where Aqueous Film‐Forming Foam (AFFF) released
Complex geology, shallow GW (1‐2’), low GW velocity, tidal influenced
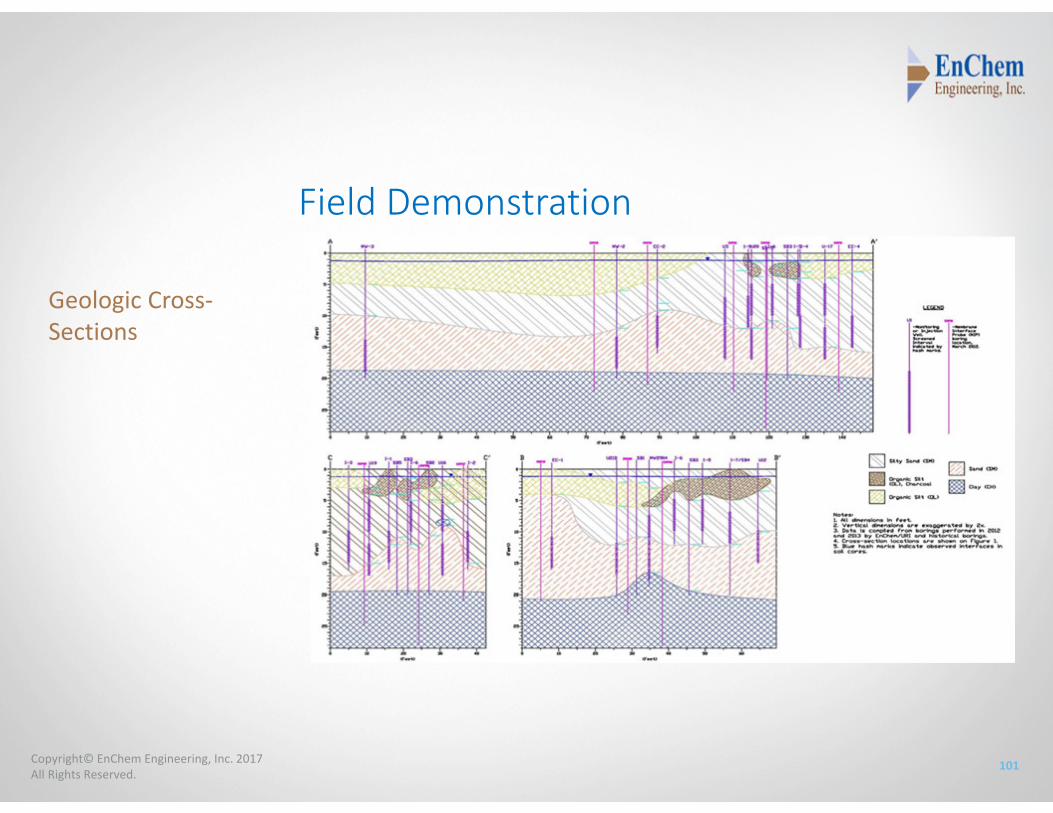
Surficial (shallow and intermediate) aquifer underlain by a clay confining unit
Shallow (2‐10’ bg) – silty sands and organic silt (K=0.5 m/d)
Intermediate (10‐20’ bg) ‐ Highly permeable poorly sorted sands (K=4.9 m/d)
99Copyright© EnChem Engineering, Inc. 2017All Rights Reserved.
Field Demonstration – Subsurface Conditions
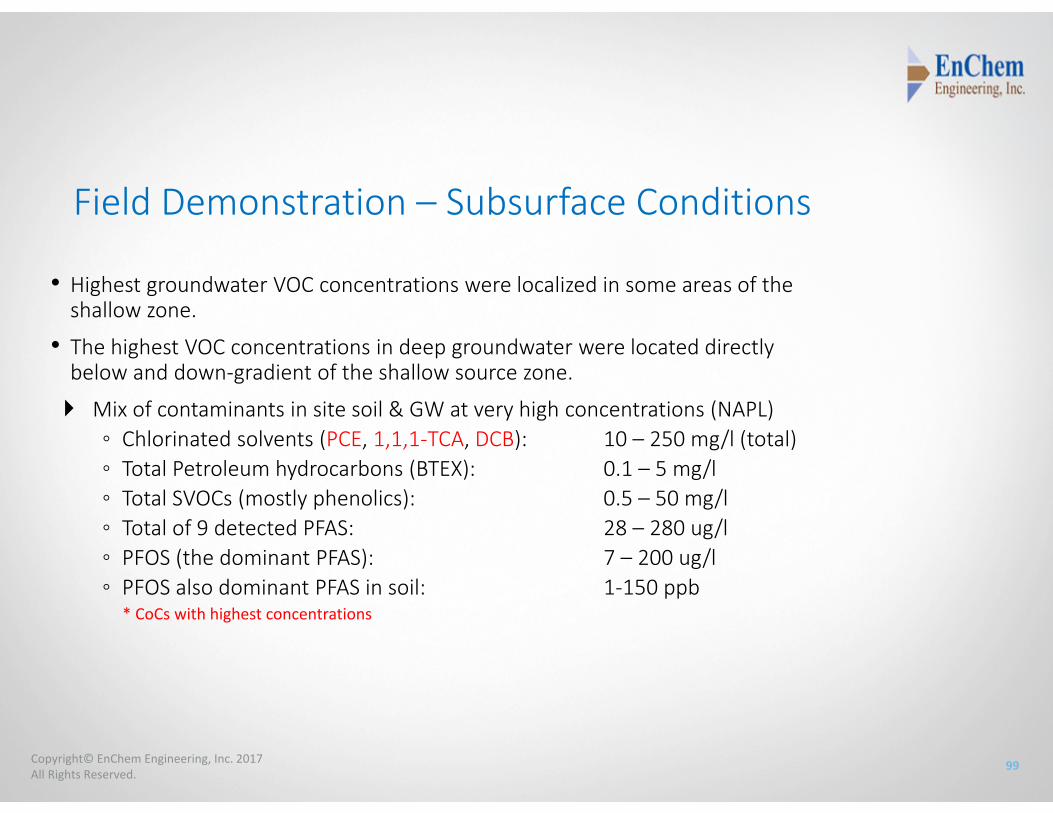
• Highest groundwater VOC concentrations were localized in some areas of the shallow zone.
• The highest VOC concentrations in deep groundwater were located directly below and down‐gradient of the shallow source zone.
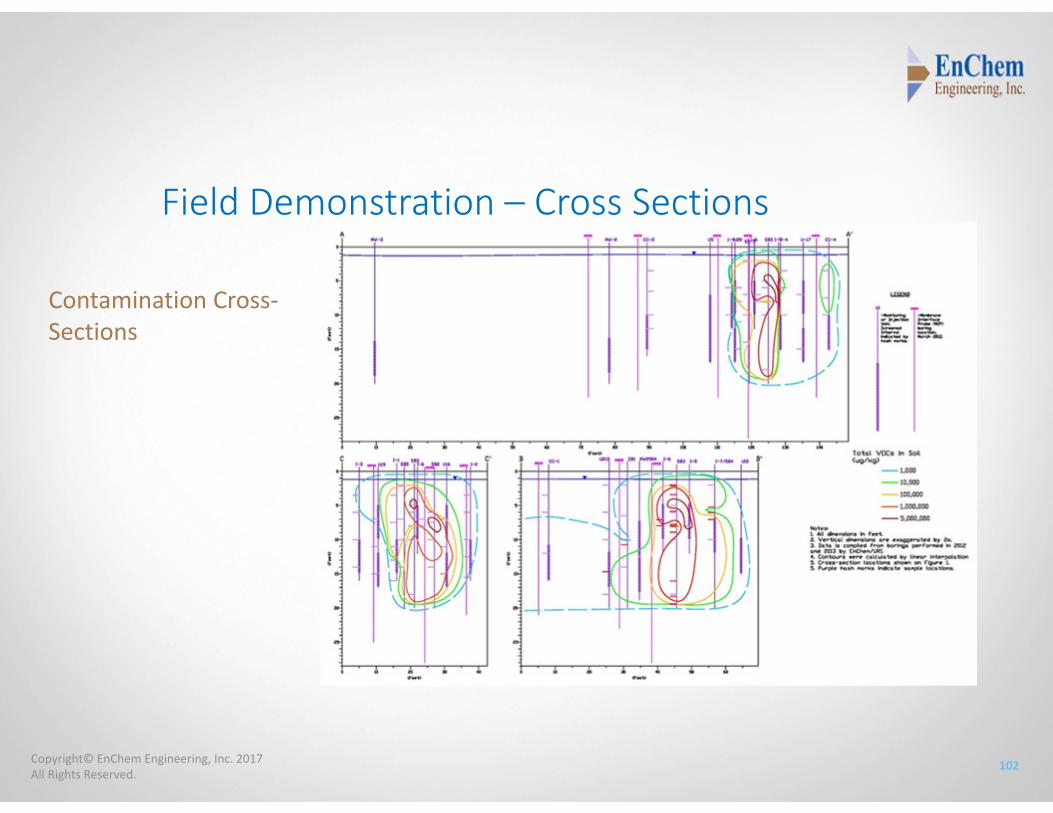
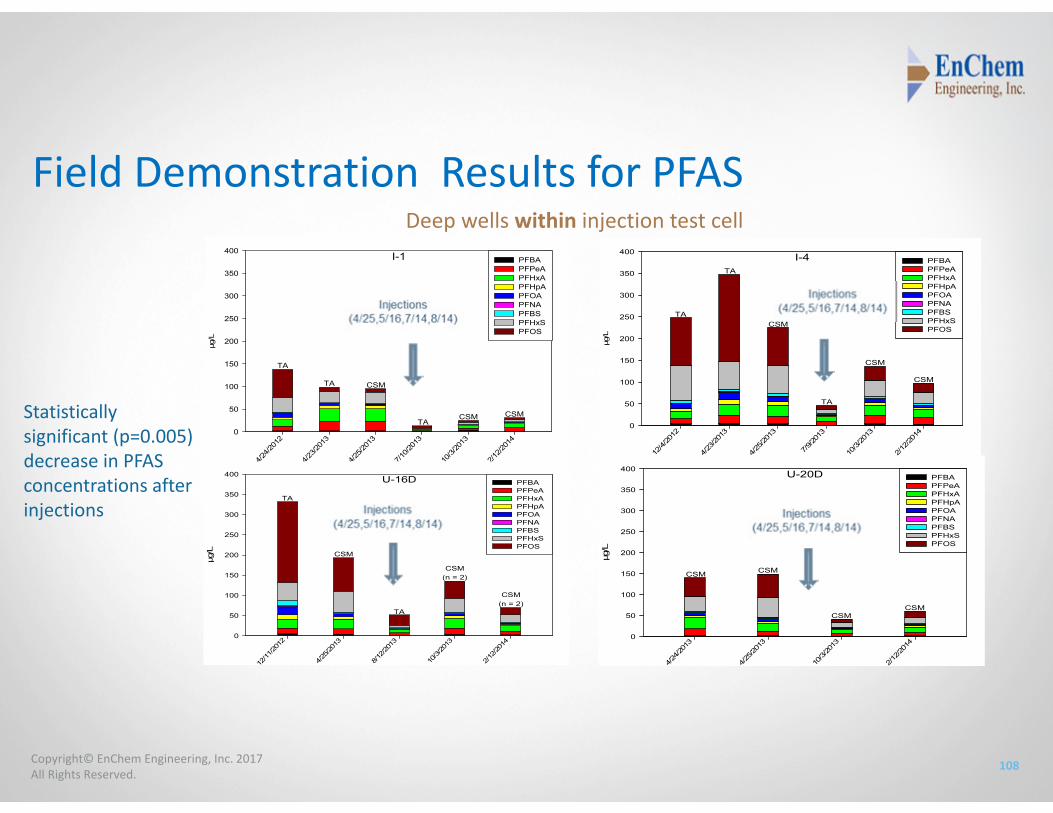
Mix of contaminants in site soil & GW at very high concentrations (NAPL)◦ Chlorinated solvents (PCE, 1,1,1‐TCA, DCB): 10 – 250 mg/l (total)◦ Total Petroleum hydrocarbons (BTEX): 0.1 – 5 mg/l◦ Total SVOCs (mostly phenolics): 0.5 – 50 mg/l◦ Total of 9 detected PFAS: 28 – 280 ug/l◦ PFOS (the dominant PFAS): 7 – 200 ug/l◦ PFOS also dominant PFAS in soil: 1‐150 ppb
* CoCs with highest concentrations
100Copyright© EnChem Engineering, Inc. 2017All Rights Reserved.
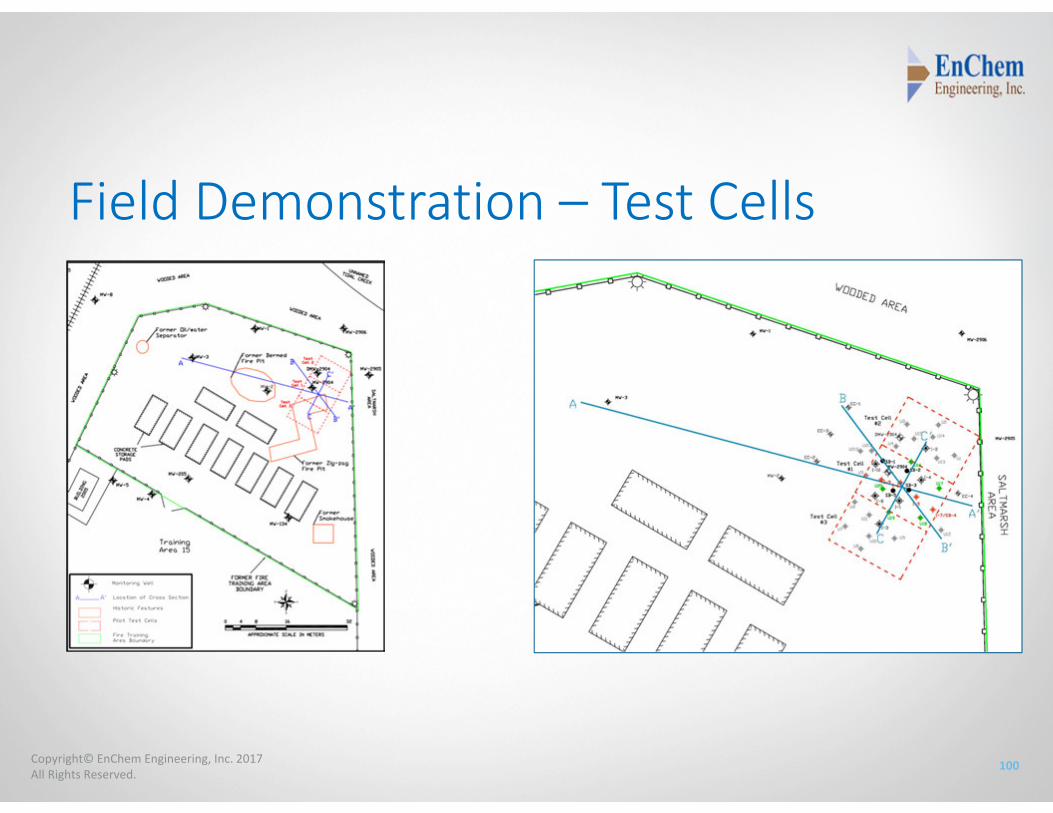
Field Demonstration – Test Cells
101Copyright© EnChem Engineering, Inc. 2017All Rights Reserved.
Field Demonstration
Geologic Cross‐Sections
102Copyright© EnChem Engineering, Inc. 2017All Rights Reserved.
Field Demonstration – Cross Sections
Contamination Cross‐Sections
103Copyright© EnChem Engineering, Inc. 2017All Rights Reserved.
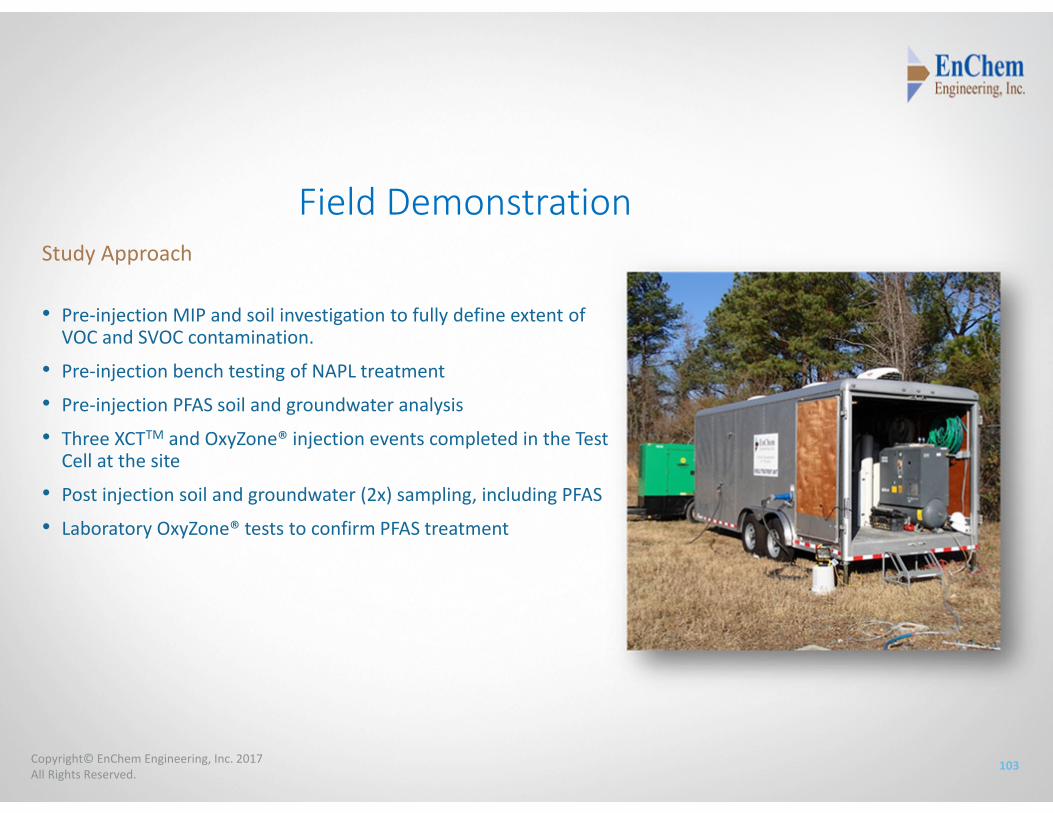
Field DemonstrationStudy Approach
• Pre‐injection MIP and soil investigation to fully define extent of VOC and SVOC contamination.
• Pre‐injection bench testing of NAPL treatment
• Pre‐injection PFAS soil and groundwater analysis
• Three XCTTM and OxyZone® injection events completed in the Test Cell at the site
• Post injection soil and groundwater (2x) sampling, including PFAS
• Laboratory OxyZone® tests to confirm PFAS treatment
104Copyright© EnChem Engineering, Inc. 2017All Rights Reserved.
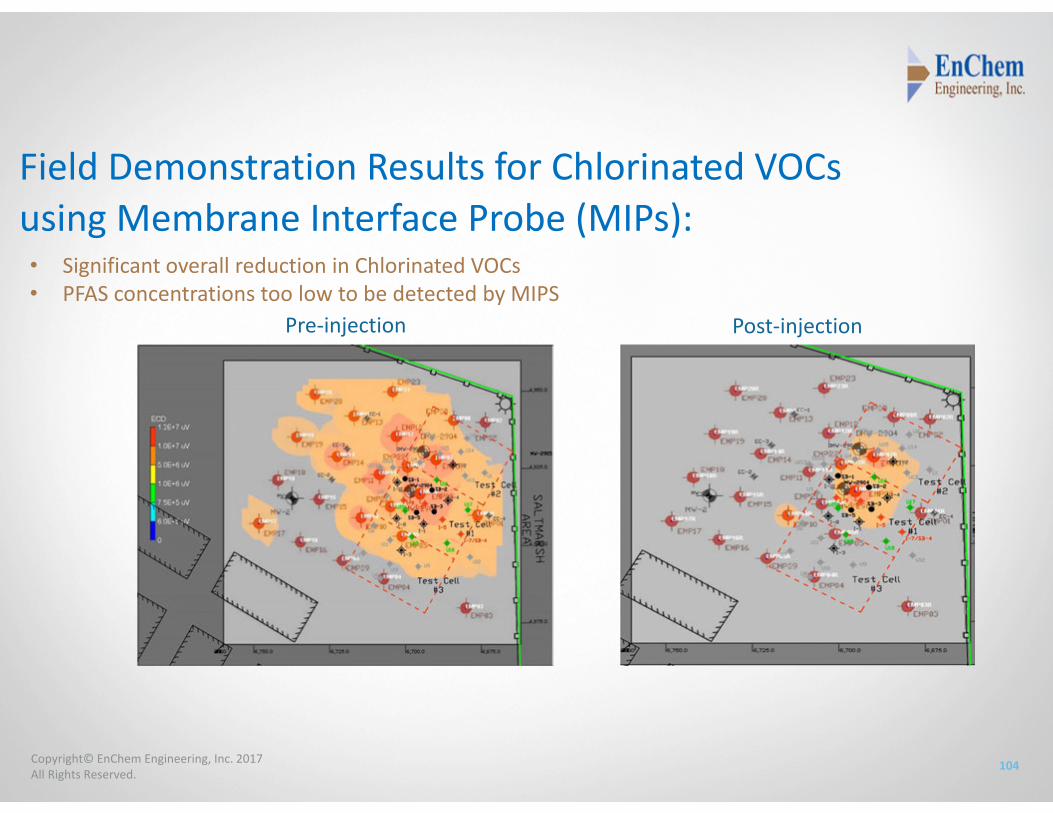
• Significant overall reduction in Chlorinated VOCs • PFAS concentrations too low to be detected by MIPS
Field Demonstration Results for Chlorinated VOCs using Membrane Interface Probe (MIPs):
Pre‐injection Post‐injection
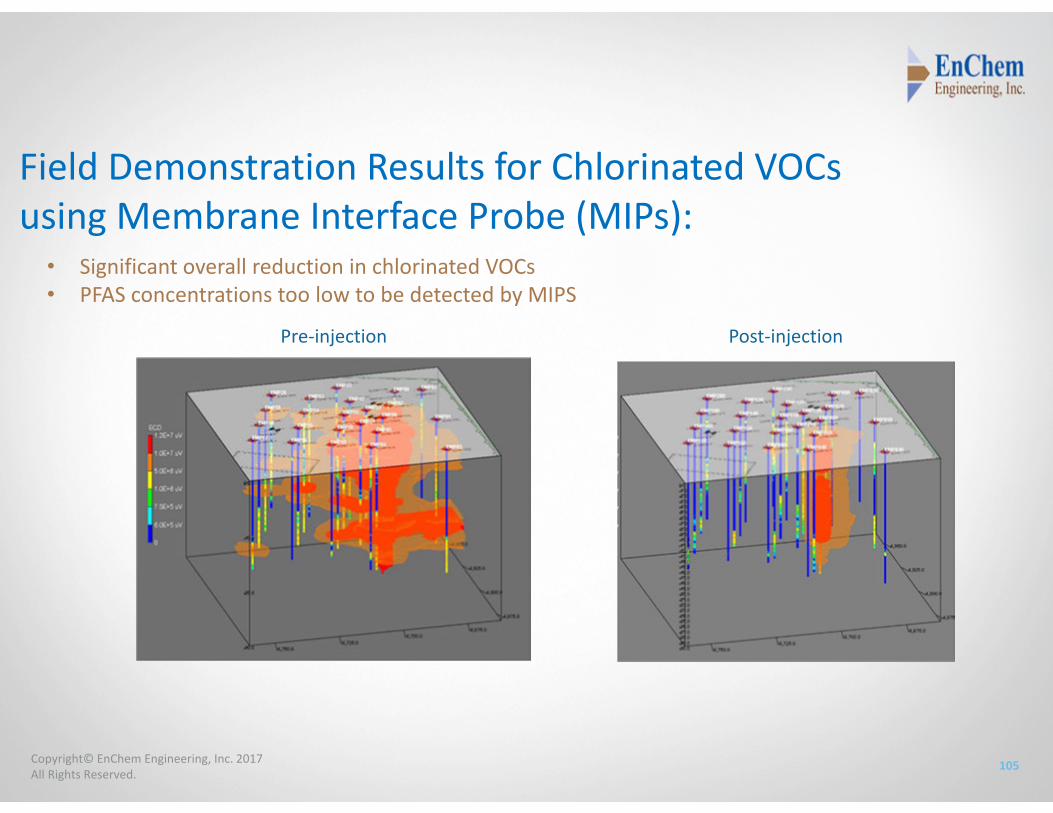
105Copyright© EnChem Engineering, Inc. 2017All Rights Reserved.
• Significant overall reduction in chlorinated VOCs • PFAS concentrations too low to be detected by MIPS
Field Demonstration Results for Chlorinated VOCs using Membrane Interface Probe (MIPs):
Pre‐injection Post‐injection
106Copyright© EnChem Engineering, Inc. 2017All Rights Reserved.
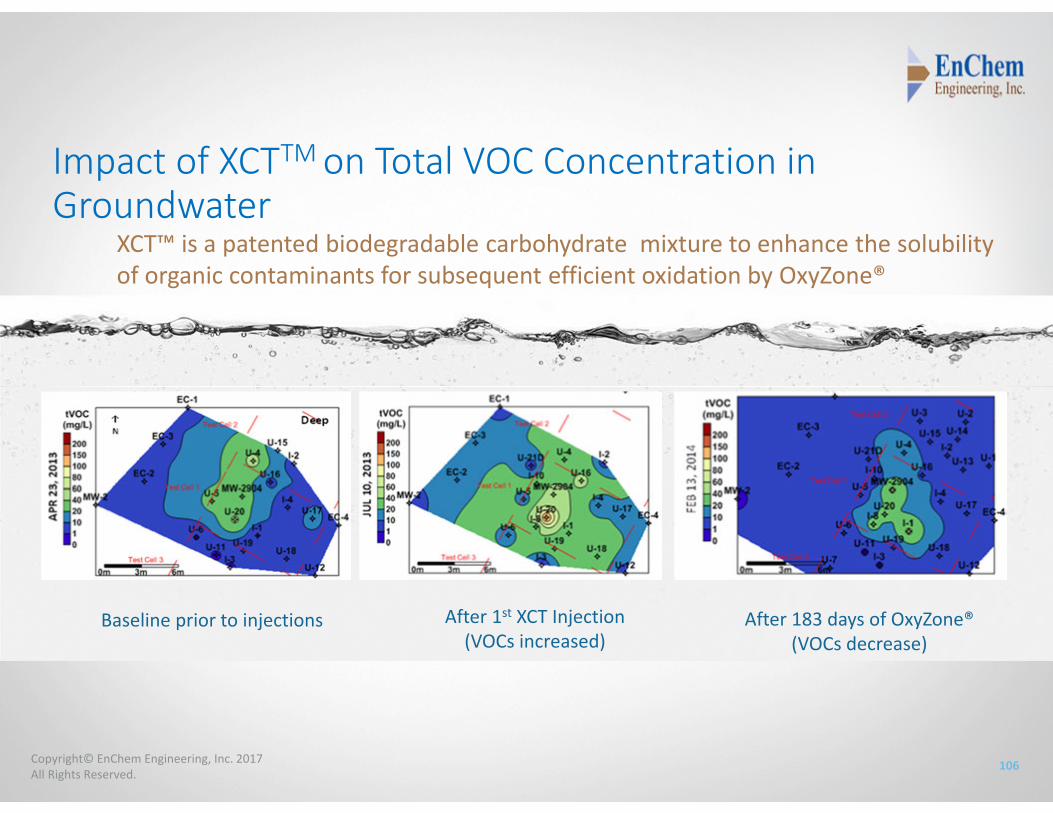
Impact of XCTTM on Total VOC Concentration in Groundwater
After 183 days of OxyZone® (VOCs decrease)
Baseline prior to injections After 1st XCT Injection (VOCs increased)
XCT™ is a patented biodegradable carbohydrate mixture to enhance the solubility of organic contaminants for subsequent efficient oxidation by OxyZone®
107Copyright© EnChem Engineering, Inc. 2017All Rights Reserved.
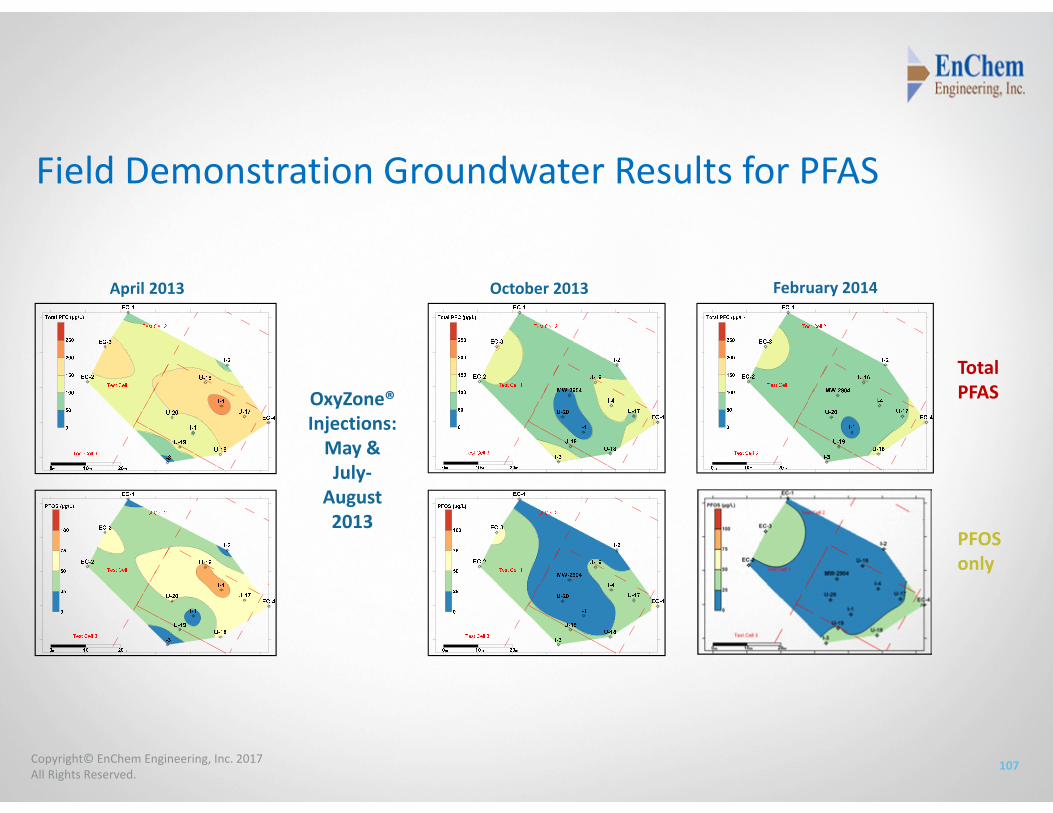
Field Demonstration Groundwater Results for PFAS
April 2013 October 2013 February 2014
OxyZone® Injections: May & July‐
August 2013
Total PFAS
PFOS only
108Copyright© EnChem Engineering, Inc. 2017All Rights Reserved.
Field Demonstration Results for PFASDeep wells within injection test cell
I-1
4/24/2
012
4/23/2
013
4/25/2
013
7/10/2
013
10/3/
2013
2/12/2
014
µg/L
0
50
100
150
200
250
300
350
400PFBAPFPeAPFHxAPFHpAPFOAPFNAPFBSPFHxSPFOS
TA
TA
CSM
CSM
TA
CSM
I-4
12/4/
2012
4/23/2
013
4/25/2
013
7/9/20
13
10/3/
2013
2/12/2
014
µg/L
0
50
100
150
200
250
300
350
400PFBAPFPeAPFHxAPFHpAPFOAPFNAPFBSPFHxSPFOS
TA
TA
CSM
CSM
CSM
TA
U-16D
12/11
/2012
4/25/2
013
8/12/2
013
10/3/
2013
2/12/2
014
µg/L
0
50
100
150
200
250
300
350
400PFBA PFPeA PFHxA PFHpA PFOA PFNA PFBS PFHxS PFOS
CSM
TA
TA
CSM(n = 2)
CSM(n = 2)
U-20D
4/24/2
013
4/25/2
013
10/3/
2013
2/12/2
014
µg/L
0
50
100
150
200
250
300
350
400PFBAPFPeAPFHxAPFHpAPFOAPFNAPFBS PFHxSPFOS
CSMCSM
CSM CSM
Statistically significant (p=0.005)decrease in PFAS concentrations after injections
109Copyright© EnChem Engineering, Inc. 2017All Rights Reserved.
Field Demonstration Results for PFASEC-1
4/24/2
012
4/25/2
013
10/3/
2013
2/11/2
014
0
50
100
150
200
250
300
350
400PFBA PFPeA PFHxA PFHpA PFOA PFNA PFBS PFHxSPFOS
TACSM
CSMCSM
µg/L
EC-2
4/24/2
012
4/23/2
013
4/25/2
013
7/10/2
013
10/3/
2013
2/11/2
014
µg/L
0
50
100
150
200
250
300
350
400PFBA PFPeA PFHxA PFHpA PFOA PFNA PFBS PFHxSPFOS
TA
TACSM
CSM
TA
CSM
EC-3
4/23/2
013
4/24/2
013
7/10/2
013
10/3/
2013
2/11/2
014
µg/L
0
50
100
150
200
250
300
350
400PFBAPFPeAPFHxAPFHpAPFOA PFNA PFBS PFHxS PFOS
TA TA
CSMCSM
CSM
EC-4
4/25/2
013
10/3/
2013
2/11/2
014
µg/L
0
50
100
150
200
250
300
350
400PFBA PFPeA PFHxAPFHpA PFOA PFNA PFBS PFHxSPFOSCSM
CSM CSM
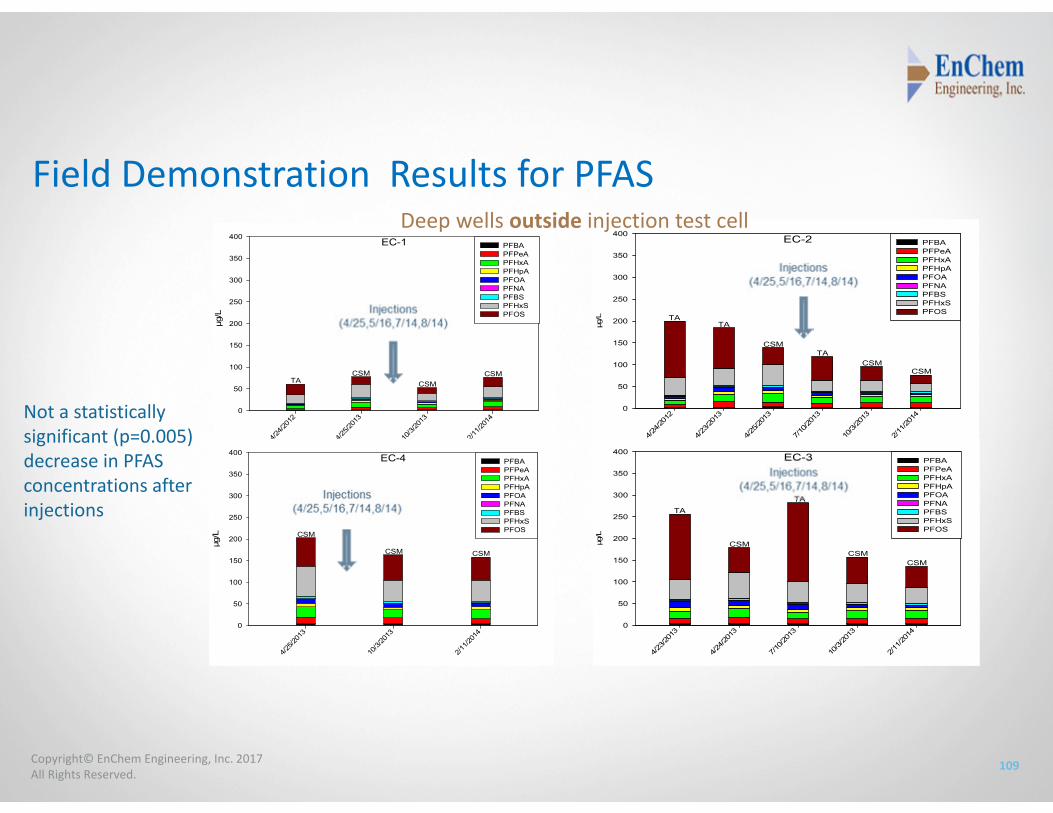
Deep wells outside injection test cell
Not a statistically significant (p=0.005)decrease in PFAS concentrations after injections
110Copyright© EnChem Engineering, Inc. 2017All Rights Reserved.
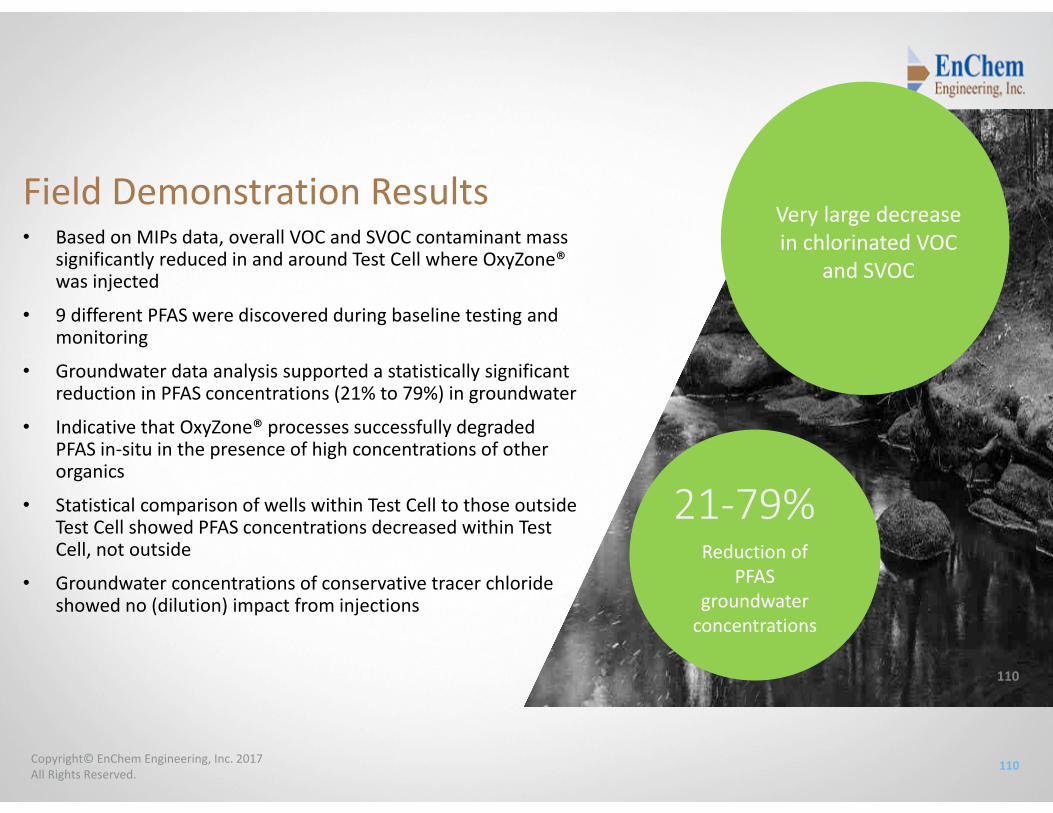
Very large decrease in chlorinated VOC
and SVOC
21‐79% Reduction of
PFAS groundwater concentrations
Field Demonstration Results• Based on MIPs data, overall VOC and SVOC contaminant mass
significantly reduced in and around Test Cell where OxyZone® was injected
• 9 different PFAS were discovered during baseline testing and monitoring
• Groundwater data analysis supported a statistically significant reduction in PFAS concentrations (21% to 79%) in groundwater
• Indicative that OxyZone® processes successfully degraded PFAS in‐situ in the presence of high concentrations of other organics
• Statistical comparison of wells within Test Cell to those outside Test Cell showed PFAS concentrations decreased within Test Cell, not outside
• Groundwater concentrations of conservative tracer chloride showed no (dilution) impact from injections
110
111Copyright© EnChem Engineering, Inc. 2017All Rights Reserved.
Confirmatory Bench Scale Treatability Testing of PFAS
EnChem Engineering
OxyZone® process performed on:• contaminated groundwater from the Fire Training
Area• distilled –deionized water• Tested both unspiked & spiked PFOA & PFOS
112Copyright© EnChem Engineering, Inc. 2017All Rights Reserved.
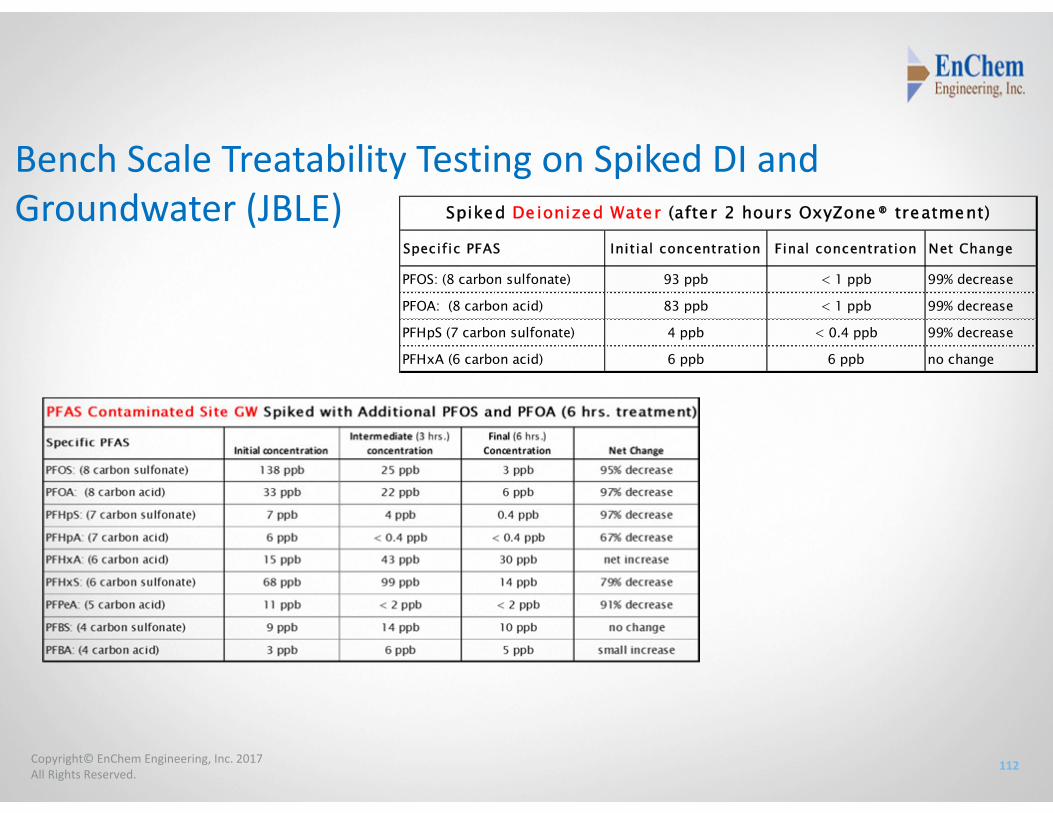
Bench Scale Treatability Testing on Spiked DI and Groundwater (JBLE)
Specific PFAS Initial concentration Final concentration Net Change
PFOS: (8 carbon sulfonate) 93 ppb < 1 ppb 99% decrease
PFOA: (8 carbon acid) 83 ppb < 1 ppb 99% decrease
PFHpS (7 carbon sulfonate) 4 ppb < 0.4 ppb 99% decrease
PFHxA (6 carbon acid) 6 ppb 6 ppb no change
Spiked De ionized Water (after 2 hours OxyZone® treatment)
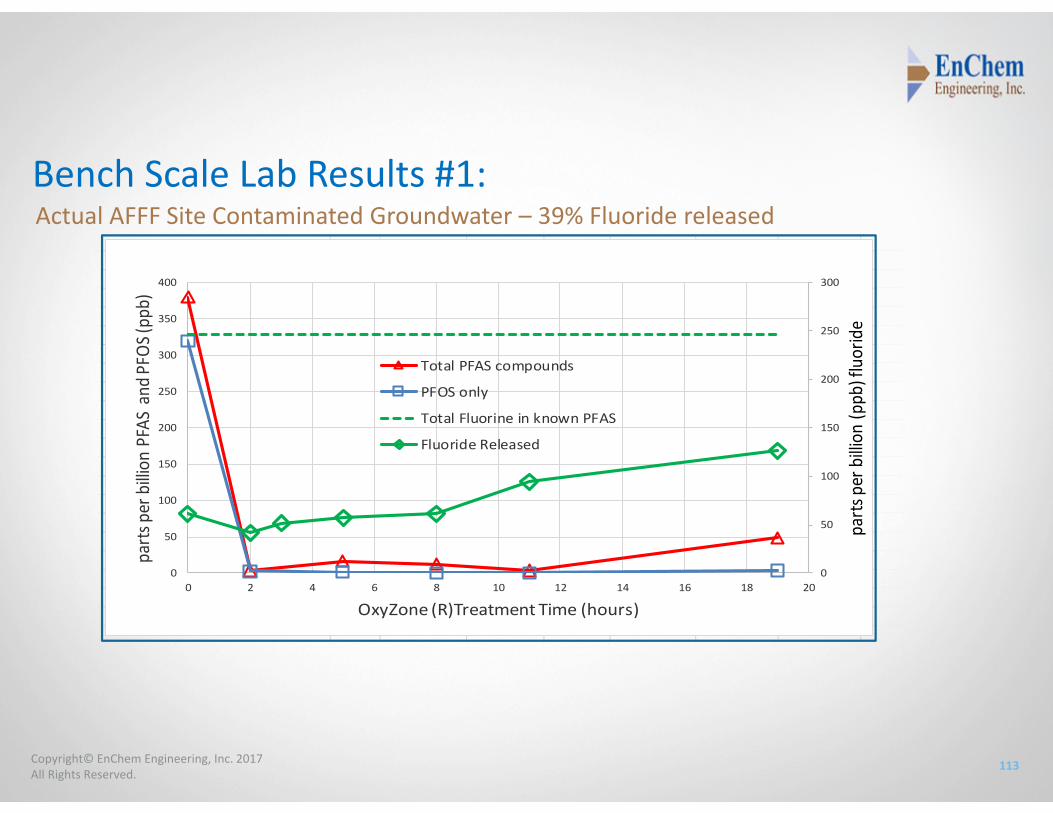
113Copyright© EnChem Engineering, Inc. 2017All Rights Reserved.
Bench Scale Lab Results #1:Actual AFFF Site Contaminated Groundwater – 39% Fluoride released
0
50
100
150
200
250
300
0
50
100
150
200
250
300
350
400
0 2 4 6 8 10 12 14 16 18 20
parts
per b
illion
(ppb
) fluoride
parts
per b
illion
PFA
S an
d PFO
S (pp
b)
OxyZone (R)Treatment Time (hours)
Total PFAS compounds
PFOS only
Total Fluorine in known PFAS
Fluoride Released
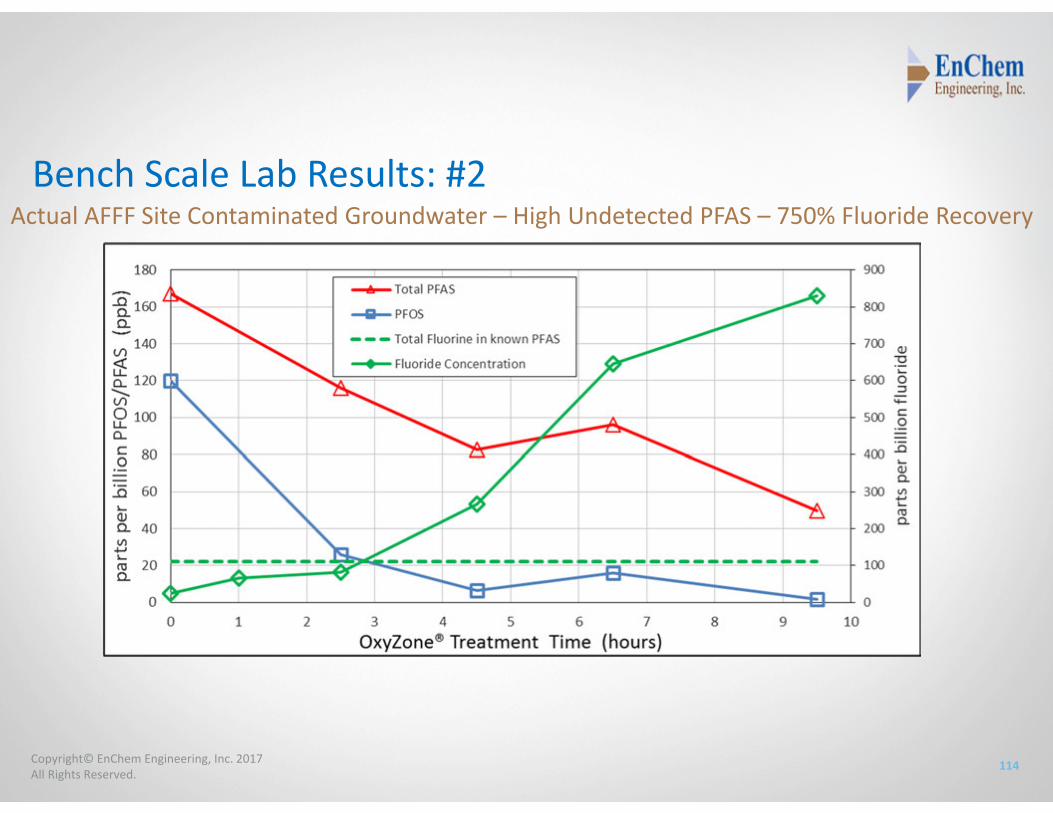
114Copyright© EnChem Engineering, Inc. 2017All Rights Reserved.
Bench Scale Lab Results: #2Actual AFFF Site Contaminated Groundwater – High Undetected PFAS – 750% Fluoride Recovery
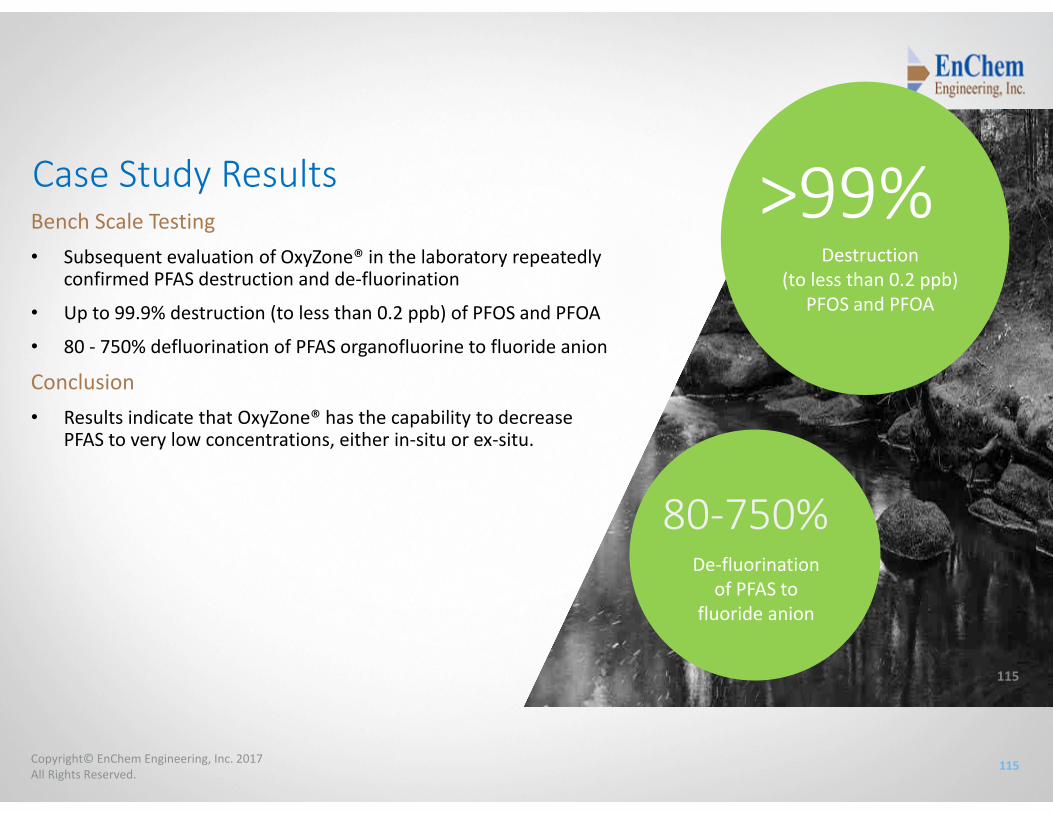
115Copyright© EnChem Engineering, Inc. 2017All Rights Reserved.
Case Study Results >99% Destruction
(to less than 0.2 ppb) PFOS and PFOA
80‐750% De‐fluorination
of PFAS to fluoride anion
Bench Scale Testing• Subsequent evaluation of OxyZone® in the laboratory repeatedly
confirmed PFAS destruction and de‐fluorination
• Up to 99.9% destruction (to less than 0.2 ppb) of PFOS and PFOA
• 80 ‐ 750% defluorination of PFAS organofluorine to fluoride anion
Conclusion• Results indicate that OxyZone® has the capability to decrease
PFAS to very low concentrations, either in‐situ or ex‐situ.
115
116Copyright© EnChem Engineering, Inc. 2017All Rights Reserved.
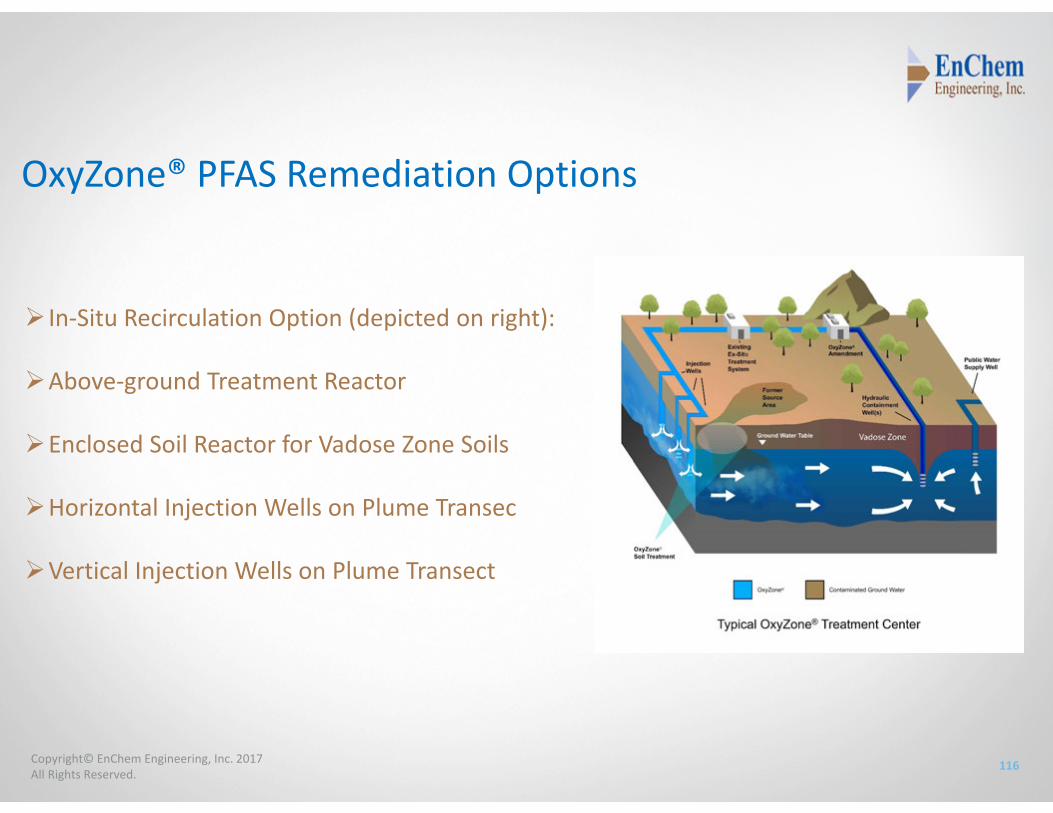
OxyZone® PFAS Remediation Options
In‐Situ Recirculation Option (depicted on right):
Above‐ground Treatment Reactor
Enclosed Soil Reactor for Vadose Zone Soils
Horizontal Injection Wells on Plume Transec
Vertical Injection Wells on Plume Transect
117Copyright© EnChem Engineering, Inc. 2017All Rights Reserved.
OxyZone® Field Demonstration
Acknowledgements• Tom Boving, Ph.D., Co‐Principal Investigator, and Dylan Eberle, Ph.D., University of Rhode Island (for Field Demonstration effort)
• AFCEC, for funding the Field Demonstration Project, FA8903‐11‐C‐8804: Chemical Oxidation and Inclusion Technology for Expedited Soil and Groundwater Remediation
118
PFAS on most people’s radar screen for just a few years
PFAS remediation very challenging: Moving targets – which PFAS need to be remediated and to what
concentrations? Large number of chemicals Low concentrations of concern Many data gaps and analytical difficulties Complexity due to chemical transformations Thin track record of many remediation technologies
Last Thoughts
119
Technologies that are currently most promising for PFAS Filtration (Nano-filtration, reverse osmosis) Adsorbents Ion exchange / adsorption resins Chemical oxidation / reduction
Treatability studies should be considered: Select the best technology(s)
Function of PFAS concentrations Optimize remediation design Minimize the risk of unintended consequences
Last Thoughts

120
For any questions that we cannot get to during the Q/A period, please feel free to contact the presenters:
Michael Marley ([email protected]) Ellen Moyer ([email protected]) Raymond Ball ([email protected])
Question and Answers