peoplesoft enterprise epm 9.1 workforce rewards … · chapter 4 managing retention strategy ........
TRANSCRIPT

PeopleSoft Enterprise EPM 9.1 Workforce Rewards PeopleBook
April 2010

PeopleSoft Enterprise EPM 9.1 Workforce Rewards PeopleBookSKU epm91pwfr-b0410
Copyright © 1999, 2010, Oracle and/or its affiliates. All rights reserved.
Trademark Notice
Oracle is a registered trademark of Oracle Corporation and/or its affiliates. Other names may be trademarks of their respective owners.
License Restrictions Warranty/Consequential Damages Disclaimer
This software and related documentation are provided under a license agreement containing restrictions on use and disclosure and are protected by intellectual property laws. Except as expressly permitted in your license agreement or allowed by law, you may not use, copy, reproduce, translate, broadcast, modify, license, transmit, distribute, exhibit, perform, publish or display any part, in any form, or by any means. Reverse engineering, disassembly, or decompilation of this software, unless required by law for interoperability, is prohibited.
Warranty Disclaimer
The information contained herein is subject to change without notice and is not warranted to be error-free. If you find any errors, please report them to us in writing.
Restricted Rights Notice
If this software or related documentation is delivered to the U.S. Government or anyone licensing it on behalf of the U.S.Government, the following notice is applicable:
U.S. GOVERNMENT RIGHTS
Programs, software, databases, and related documentation and technical data delivered to U.S. Government customers are "commercial computer software" or "commercial technical data" pursuant to the applicable Federal Acquisition Regulation and agency-specific supplemental regulations. As such, the use, duplication, disclosure, modification, and adaptation shall be subject to the restrictions and license terms set forth in the applicable Government contract, and, to the extent applicable by the terms of the Government contract, the additional rights set forth in FAR 52.227-19, Commercial Computer Software License (December 2007). Oracle USA, Inc., 500 Oracle Parkway, Redwood City, CA 94065.
Hazardous Applications Notice
This software is developed for general use in a variety of information management applications. It is not developed or intended for use in any inherently dangerous applications, including applications which may create a risk of personal injury. If you use this software in dangerous applications, then you shall be responsible to take all appropriate fail-safe, backup, redundancy and other measures to ensure the safe use of this software. Oracle Corporation and its affiliates disclaim any liability for any damages caused by use of this software in dangerous applications.
Third Party Content, Products, and Services Disclaimer
This software and documentation may provide access to or information on content, products and services from third parties. Oracle Corporation and its affiliates are not responsible for and expressly disclaim all warranties of any kind with respect to third party content, products and services. Oracle Corporation and its affiliates will not be responsible for any loss, costs, or damages incurred due to your access to or use of third party content, products or services.

Copyright © 1999, 2010, Oracle and/or its affiliates. All Rights Reserved. iii
Contents
Preface
PeopleSoft Enterprise Workforce Rewards Preface ................................................................................. ix
PeopleSoft Products ........................................................................................................................................ ixRelated PeopleBooks ...................................................................................................................................... ixDeferred Processing ......................................................................................................................................... xCommon Elements Used in Workforce Rewards ............................................................................................ xPeopleBooks and the Online PeopleSoft Library ........................................................................................... xi
Chapter 1
Getting Started With Workforce Rewards .................................................................................................. 1
Workforce Rewards Overview ......................................................................................................................... 1Workforce Rewards Business Processes .......................................................................................................... 2Workforce Rewards Implementation ............................................................................................................... 3
Chapter 2
Managing Market Compensation ................................................................................................................. 5
Understanding the Market Compensation Module ......................................................................................... 5The Market Compensation Module ........................................................................................................... 5The Market Compensation Business Process ............................................................................................ 6Base Currencies ........................................................................................................................................ 7Trees ......................................................................................................................................................... 7The Compensation Survey Data Crystal Report ...................................................................................... 8
Creating Market Compensation Scenarios ...................................................................................................... 8Understanding Market Compensation Scenarios ..................................................................................... 9Pages Used to Create and Run Market Compensation Scenarios .......................................................... 10Calculating Regressions .......................................................................................................................... 11Viewing Regression Statistics ................................................................................................................. 13Defining Market Models ......................................................................................................................... 14Defining Market Weighting Rules .......................................................................................................... 15Viewing Market Survey Samples ............................................................................................................ 18Setting Up Market Scenarios ................................................................................................................... 19Running the Market-Based Pricing Application Engine Process (WA_MBP) ...................................... 20Reviewing the Market-Based Pricing Application Engine Process (WA_MBP) .................................. 20

Contents
iv Copyright © 1999, 2010, Oracle and/or its affiliates. All Rights Reserved.
Reviewing Market Compensation Scenario Data .................................................................................. 21Analyzing Scenarios ..................................................................................................................................... 21
Understanding Scenario Data Analysis ................................................................................................... 22Common Elements Used in This Section ................................................................................................ 22Pages Used to Analyze Scenarios ........................................................................................................... 22Running Crystal Reports to Analyze Scenarios ..................................................................................... 23Reviewing Market Compensation Scenario Summary Data ................................................................... 24Reviewing Market Compensation Scenario Fit to Market Data ............................................................. 25Reviewing Market Compensation Scenario Gap to Target Data ............................................................ 27Reviewing Market Compensation Scenario Market Rate Detail Data .................................................... 29
Approving Compensation Target Rates ........................................................................................................ 30Understanding the Compensation Target Rate Approval Process .......................................................... 31Pages Used to Approve Compensation Target Rates .............................................................................. 31Establishing Target Market Rates ........................................................................................................... 32Reviewing Market Compensation Details ............................................................................................... 33Establishing Market Rates for Non-Benchmark Jobs ............................................................................. 35Reviewing Benchmark Job Details ......................................................................................................... 36Reviewing Job Code Slotting Results ..................................................................................................... 37Approving Market Compensation Target Rates ...................................................................................... 37
Comparing Current Pay Structures With New Target Rates ........................................................................ 39Understanding the Pay Structure Compare Process ................................................................................ 39Pages Used to Compare Current Pay Structures With New Target Rates .............................................. 39Viewing Final Market Compensation Scenario Data .............................................................................. 40Viewing Salary Plan Gap Data ............................................................................................................... 42
Chapter 3
Managing Base Pay Structures ................................................................................................................... 43
Understanding the Base Pay Structure Module ............................................................................................ 43Creating a Base Pay Structure Scenario ........................................................................................................ 44
Understanding How to Create a Base Pay Structure Scenario ................................................................ 45Pages Used to Create a Base Pay Structure Scenario .............................................................................. 46Assigning Job Codes to Job Classes ....................................................................................................... 47Creating a Base Pay Structure Definition ............................................................................................... 48Building Salary Grades and Ranges ........................................................................................................ 53Building Steps within Pay Grades ........................................................................................................... 55Assigning Pay Grades to Jobs in a Pay Structure .................................................................................... 57
Evaluating your Base Pay Structures ............................................................................................................ 59Pages Used to Evaluate Your Base Pay Structure ................................................................................... 59
Running Base Pay Structure Crystal Reports ............................................................................................... 60Reviewing your Base Pay Structure Gap to Market ............................................................................... 60
Approving and Publishing Base Pay Structures ........................................................................................... 61Page Used to Approve Base Pay Structures ............................................................................................ 61

Contents
Copyright © 1999, 2010, Oracle and/or its affiliates. All Rights Reserved. v
Approving Pay Structures ....................................................................................................................... 62Analyzing your Workforce Compensation Gap to Market ............................................................................ 64
Page Used to Evaluate Your Workforce Compensation Gap to Market ................................................. 64Running your Approved Pay Structure Crystal Report .......................................................................... 64
Chapter 4
Managing Retention Strategy .................................................................................................................... 67
Understanding the Retention Strategy Module ............................................................................................. 67Setting Up a Retention Strategy .................................................................................................................... 68
Pages Used to Set Up a Retention Strategy ............................................................................................. 68Setting Up Workforce Groups for Retention Strategy Management ..................................................... 69Defining Retention Factors ..................................................................................................................... 69Defining Employee Retention Risk Rules .............................................................................................. 70Defining Employee Retention Value Rules ............................................................................................ 73Defining Employee Turnover Cost Rules ............................................................................................... 75Setting Up Decision Rules ...................................................................................................................... 78
Creating a Retention Scenario ....................................................................................................................... 80Understanding How to Create a Retention Scenario .............................................................................. 81Pages Used to Create and Run a Retention Scenario .............................................................................. 81Defining the Overall Workforce Group for a Retention Model .............................................................. 82Relating Risk Rules to a Retention Model .............................................................................................. 83Relating Value Rules to a Retention Model ............................................................................................ 84Relating Cost Rules to a Retention Model .............................................................................................. 85Relating Track Decision Rules to a Retention Model ............................................................................. 85Relating Retain Decision Rules to a Retention Model ............................................................................ 86Relating Reduce Decision Rules to a Retention Model .......................................................................... 87Setting Up a Scenario Definition for Retention Management ................................................................ 88Setting Up the Process Run Control for Retention Assignment ............................................................ 88Reviewing the Retention Assignment Process ....................................................................................... 89
Evaluating Your Retention Scenario ............................................................................................................. 91Understanding How to Evaluate Your Retention Scenario Results ........................................................ 91Pages Used to Evaluate a Retention Scenario ......................................................................................... 92Running Crystal Reports to Evaluate Your Retention Scenario ............................................................ 94Reviewing a High-Level Summary of Your Retention Scenario ............................................................ 94Reviewing Decisions and Assessments ................................................................................................... 97Reviewing Risk, Value and Cost Rule Details ...................................................................................... 100Reviewing Employee Details ................................................................................................................ 103
Approving Your Retention Scenario ........................................................................................................... 105Understanding Retention Scenario Approval ........................................................................................ 105Pages Used to Approve Your Retention Scenario ................................................................................ 106Reviewing and Modifying Track Decision Results .............................................................................. 106Reviewing and Modifying Retain Decision Results ............................................................................. 108

Contents
vi Copyright © 1999, 2010, Oracle and/or its affiliates. All Rights Reserved.
Reviewing and Modifying Reduce Decision Results ............................................................................ 109Approving Your Scenario ..................................................................................................................... 109
Chapter 5
Managing Compensation Planning .......................................................................................................... 111
Understanding Compensation Strategy ....................................................................................................... 111Overview ............................................................................................................................................... 111Compensation Strategy Definition ....................................................................................................... 113Compensation Strategy Business Process ............................................................................................ 114Market Compensation Rates ................................................................................................................ 115
Setting Up Workforce Simulation .............................................................................................................. 115Understanding Workforce Simulation Setup ........................................................................................ 116Pages Used to Set Up and Run Workforce Simulation ......................................................................... 117Setting Up Workforce Groups for Workforce Simulation ................................................................... 117Entering Workforce Simulation Growth and Reduction Rules ............................................................. 117Setting Up Model IDs for Workforce Simulation ................................................................................ 120Defining a Workforce Simulation Model .............................................................................................. 120Setting Up a Scenario Definition for Workforce Simulation ............................................................... 121Setting Up the Process Run Control for Workforce Simulation .......................................................... 121Generating the Workforce Simulation Scenario .................................................................................. 122Reviewing Your Workforce Simulation Scenario Setup ..................................................................... 124
Setting Up a Compensation Scenario ......................................................................................................... 124Pages Used to Set Up and Run a Compensation Scenario .................................................................... 125Linking Employee Information to a Compensation Scenario ............................................................... 126Defining Performance-Based Calculation Rules with a Goals Matrix .................................................. 129Defining Base Compensation Increase Rules with a Merit Matrix ....................................................... 133Controlling Compensation Distribution with Payout Rules .................................................................. 135Defining Base Pay Rules ....................................................................................................................... 137Defining Variable Pay Rules ................................................................................................................. 139Specifying Other Pay Rules ................................................................................................................. 141Setting Up Frequency Details for Compensation Models ..................................................................... 142Setting Up Workforce Groups for Compensation Models ................................................................... 142Setting Up Model IDs for Compensation Models ................................................................................ 142Defining a Compensation Planning and Simulation Model .................................................................. 142Setting Up Compensation Scenario IDs ............................................................................................... 144Generating the Compensation Planning Scenario ................................................................................ 144
Reviewing and Analyzing a Compensation Scenario ................................................................................. 148Understanding Compensation Scenario Review and Analysis ............................................................. 148Understanding the Compensation Scenario Analysis Component ........................................................ 148Pages Used to Review and Analyze Your Compensation Scenario ...................................................... 150Common Elements Used in the Compensation Scenario Analysis Pages ............................................ 152Running Crystal Reports to Review your Scenario ............................................................................. 153

Contents
Copyright © 1999, 2010, Oracle and/or its affiliates. All Rights Reserved. vii
Reviewing the Results of Data Elements Applied to a Scenario .......................................................... 153Reviewing Base Pay Rules Setup .......................................................................................................... 155Reviewing Variable Pay Rules Setup .................................................................................................... 156Reviewing the Compensation Scenario Summary ................................................................................ 156Reviewing the Budget Plan ................................................................................................................... 158Reviewing the Compensation Rule ....................................................................................................... 159Reviewing the Workforce Group and Budget Plan ............................................................................... 161Reviewing the Workforce Group and Compensation Rule ................................................................... 162Reviewing the Department and Budget Plan ........................................................................................ 164Reviewing the Department and Compensation Rule ............................................................................ 166Reviewing the Employee and Budget Plan ........................................................................................... 167Reviewing the Employee and Compensation Rule ............................................................................... 168
Manually Loading the Analytic Model ....................................................................................................... 169Page Used to Manually Load the Analytic Model ................................................................................ 169Running the Load Analytic Model Process ........................................................................................... 169
Approving a Compensation Planning Scenario and Passing the Data to the Planning and BudgetingApplication ............................................................................................................................................... 170
Page Used to Run the Compensation Scenario Approval Process ....................................................... 171Running the Compensation Scenario Approval Process ....................................................................... 172
Appendix A
Workforce Rewards Data Mart ................................................................................................................ 173
Understanding the Workforce Rewards Data Mart ...................................................................................... 173Data Mart Data Model ................................................................................................................................ 174Data Mart Source ETL Jobs ........................................................................................................................ 174Data Mart Dimensions ................................................................................................................................ 174Data Mart Facts ........................................................................................................................................... 180
Appendix B
Workforce Rewards Reports ................................................................................................................... 183
Report Descriptions .................................................................................................................................... 183
Index ............................................................................................................................................................ 187


Copyright © 1999, 2010, Oracle and/or its affiliates. All Rights Reserved. ix
PeopleSoft Enterprise Workforce RewardsPreface
This preface discusses:
• PeopleSoft products.
• Related PeopleBooks.
• Deferred processing.
• Common elements used in Workforce Rewards.
PeopleSoft Products
This PeopleBook refers to these products from Oracle:
• Oracle's PeopleSoft Enterprise Performance Management Foundation.
• Oracle's PeopleSoft Enterprise Workforce Analytics.
• Oracle's PeopleSoft Enterprise HRMS.
• Oracle's PeopleSoft Analytic Calculation Engine.
• Oracle's PeopleSoft Enterprise Scorecard.
• Oracle's PeopleSoft Enterprise Workforce Scorecard.
Related PeopleBooks
The PeopleSoft Enterprise Workforce Rewards 9.1 PeopleBook provides implementation and processing information for Workforce Rewards.
Additional, essential information describing the setup and design of your system appears in these companion volumes of documentation:
• PeopleSoft Enterprise Performance Management Fundamentals 9.1 PeopleBook.
Provides information needed to complete the core setup for all PeopleSoft EPM applications. This PeopleBook also describes the system architecture, the mapping of data into the warehouse, and EPM Foundation tools and processes.
• PeopleSoft Enterprise Workforce Analytic Applications 9.1 PeopleBook.
This PeopleBook describes the common setup that Workforce Rewards shares with other workforce analytic applications.

Preface
x Copyright © 1999, 2010, Oracle and/or its affiliates. All Rights Reserved.
Deferred Processing
Several pages in Workforce Rewards operate in deferred processing mode. Most fields on these pages are not updated or validated until you save the page or refresh it by clicking a button, link, or tab. This delayed processing has various implications for the field values on the page. For example, if a field contains a default value, any value that you enter before the system updates the page overrides the default. Another implication is that the system updates quantity balances or totals only when you save or otherwise refresh the page.
Common Elements Used in Workforce Rewards
This section lists common elements used in Workforce Rewards.
SetID Provides the ID code for a TableSet. A TableSet is a group of tables (records) necessary to define your company's structure and processing options.
Effective Date Establishes the date the row in the table becomes effective. It determines when you can view and change the information. Pages and batch processes that use the information use the current row.
Status Indicates whether a row in a table is Active or Inactive. You cannot select inactive rows on pages or use them for running batch processes.
Description Allows text up to 30 characters that describes what you are defining.
Run Control ID Identifies specific run control settings for a process or report.
Report ID Identifies the report.
Program Name Provides the Enterprise Performance Management program name for which you are running the report or process.
When Specifies the frequency with which you want to run a process. You can choose Once, Always, or Don't.
Last Run On Indicates the date the report or process was last run.
As Of Date Indicates the last date for which the report or process includes data.
Scenario ID Provides an identifier for a specific scenario.
Model ID Provides an identifier for a model. A model uniquely identifies the types of data you want to include in a scenario.
Fiscal Year Specifies the fiscal year for your scenario or process run.
Period Specifies the accounting period for the object being defined or process being run.

Preface
Copyright © 1999, 2010, Oracle and/or its affiliates. All Rights Reserved. xi
Job ID Specifies an instance of an engine.
PeopleBooks and the Online PeopleSoft Library
A companion PeopleBook called PeopleBooks and the Online PeopleSoft Library contains general information, including:
• Understanding the PeopleSoft online library and related documentation.
• How to send PeopleSoft documentation comments and suggestions to Oracle.
• How to access hosted PeopleBooks, downloadable HTML PeopleBooks, and downloadable PDF PeopleBooks as well as documentation updates.
• Understanding PeopleBook structure.
• Typographical conventions and visual cues used in PeopleBooks.
• ISO country codes and currency codes.
• PeopleBooks that are common across multiple applications.
• Common elements used in PeopleBooks.
• Navigating the PeopleBooks interface and searching the PeopleSoft online library.
• Displaying and printing screen shots and graphics in PeopleBooks.
• How to manage the PeopleSoft online library including full-text searching and configuring a reverse proxy server.
• Understanding documentation integration and how to integrate customized documentation into the library.
• Glossary of useful PeopleSoft terms that are used in PeopleBooks.
You can find this companion PeopleBook in your PeopleSoft online library.


Copyright © 1999, 2010, Oracle and/or its affiliates. All Rights Reserved. 1
Chapter 1
Getting Started With Workforce Rewards
This chapter provides an overview of Workforce Rewards and discusses:
• Workforce Rewards business processes.
• Implementing Workforce Rewards.
Workforce Rewards Overview
Oracle's Workforce Rewards is an analytical application you can use to align your workforce compensation and retention initiatives with the strategic objectives of your organization. Workforce Rewards helps you bring your total rewards picture into focus, so you can most effectively support your most important asset in today's business environment, your workforce. With Workforce Rewards you can:
• Integrate data from multiple internal and external sources.
• Enrich the data using rules you define based on any data in the Operational Warehouse - Enriched (OWE).
• Simulate multiple scenarios of future workforce retention, growth, reduction, and compensation activity.
• Analyze and evaluate your scenarios, and make decisions you can communicate back to your PeopleSoft eBusiness applications for execution.
Workforce Rewards helps you determine the overall value of your compensation package, then puts that information in the context of the overall marketplace so that you can drive a competitive compensation strategy.
Process Flow
To set up and use Workforce Rewards:
1. Complete setup of EPM Foundation and the OWE.
2. Import, by ETL, data from HRMS source tables into the OWE.
3. Create a centralized repository of workforce-related data in the OWE.
4. Compile, analyze, and apply market compensation data from external, third-party, compensation surveys.
5. Create or revise base pay structures aligned with your organization's pay strategy.

Getting Started With Workforce Rewards Chapter 1
2 Copyright © 1999, 2010, Oracle and/or its affiliates. All Rights Reserved.
6. Create scenarios to develop your organization's workforce retention strategy. Assess your workforce retention risks, values, and replacement costs. Determine which employees to track moving forward, reduce from your workforce, or act to retain (including what action to take).
7. Create simulations of workforce headcount growth and reduction. Create forecasted compensation scenarios, to evaluate the costs and impacts of changes to compensation plans across business units or other groups.
See PeopleSoft Enterprise Workforce Analytic Applications 9.1 PeopleBook, "Oracle's PeopleSoft Enterprise Workforce Analytic Applications Preface."
Workforce Rewards Business Processes
Workforce Rewards is part of the Plan, Incent, and Reward business processes.
With Workforce Rewards, you perform forward-looking analyses of your organization's compensation and retention initiatives, using these four business process-based modules:
Market Compensation Streamline the compilation, analysis, and application of market compensation data from external compensation surveys. Develop market data you can use to evaluate base compensation programs, as well as other variable and benefits-related compensation in the modules that follow.
Base Pay Structure Create or revise base pay structures aligned with your organization's pay strategy as it relates to market and workforce compensation. Use your new base pay structures to evaluate changes to your organization's compensation programs (in the Manage Compensation Planning module).
Retention Strategy Create scenarios to develop your organization's workforce retention strategy. Assess your workforce retention risks, values, and replacement costs. Determine which employees to track moving forward, reduce from your workforce, or act toretain (including what action to take). Use the resulting decisions (data) in the Manage Compensation Planning module.
Compensation Strategy Create simulations of headcount growth and reduction. Create forecast compensation scenarios, to evaluate the costs and impacts of changes to compensation plans across business units or other groups. Model the results of proposed changes to all types of base, variable and benefits compensation.
The following diagram illustrates the relationship between these four main modules in Workforce Rewards. In the succeeding chapters, we discuss the functionality and use of these modules in detail.

Chapter 1 Getting Started With Workforce Rewards
Copyright © 1999, 2010, Oracle and/or its affiliates. All Rights Reserved. 3
Performing compensation planning using Workforce Rewards
Workforce Rewards Implementation
PeopleSoft Setup Manager enables you to generate a list of setup tasks for your organization based on the features that you are implementing. The setup tasks include the components that you must set up, listed in the order in which you must enter data into the component tables, and links to the corresponding PeopleBook documentation.
Other Sources of Information
In the planning phase of your implementation, take advantage of all PeopleSoft sources of information, including the installation guides, ETL job reports, and data models. A complete list of these resources is in the preface, with information on where to find the most current version of each.
See Also
Enterprise PeopleTools PeopleBook: PeopleSoft Setup Manager
PeopleBooks and the Online Library


Copyright © 1999, 2010, Oracle and/or its affiliates. All Rights Reserved. 5
Chapter 2
Managing Market Compensation
This chapter provides an overview of the Market Compensation module and discusses how to:
• Create market compensation scenarios.
• Analyze scenarios.
• Approve compensation target rates.
• Compare current pay structures with new target rates.
Understanding the Market Compensation Module
This section discusses:
• The Market Compensation module.
• The Market Compensation business process.
• Base currencies.
• Trees.
• The Compensation Survey Data Crystal report.
The Market Compensation Module
Managing market compensation means analyzing your organization's compensation strategy, by job and pay structure. You collect market compensation data from external survey sources, to compare the data against your organization's existing pay structures and compensation strategy. This requires an understanding of whatyour organization's compensation strategy is for these jobs. For example, does your organization want to meetthe 50th percentile market rate for the regular base compensation for a job and use aggressive incentives to allow workers to exceed the 50th percentile for total cash compensation? Or does your organization want to match the 50th percentile market rate for cash compensation for jobs requiring essential technological and managerial skills, and then meet the 40th percentile market rate for the remainder of the jobs? Gain a clear understanding of these issues and identify your organization's compensation strategies.
The process of defining market compensation rates involves:
• Matching your organization's jobs to similar benchmark jobs that appear in published compensation surveys.
• Developing market rates for the jobs.

Managing Market Compensation Chapter 2
6 Copyright © 1999, 2010, Oracle and/or its affiliates. All Rights Reserved.
• Comparing your organization's compensation rates to the market rates.
• Determining target market rates for your pay programs.
Jobs that are common across industries (or within an industry) and that appear in published survey sources arebenchmark jobs (or benchmarks). They provide a basis for comparison against similar jobs in your organization. Jobs in your organization for which there are no corresponding benchmarks are termed non-benchmark jobs.
Market rates are the best estimate of the external market value of a job, that is, the prevailing compensation rate for the job in the labor market. The market compensation process typically involves these steps:
1. Import relevant survey data into the system.
2. Transform the survey data to meet your predefined dimensions and requirements.
3. Transform the survey data to update data from multiple sources to a common date, or age old data to the present date.
4. Calculate market rates for each benchmark job based on a weighted average from selected survey samples.
5. Conduct analyses to compare current organization pay programs and actual pay levels to the market.
The Market Compensation Business Process
This diagram shows the main steps in the Market Compensation business process:

Chapter 2 Managing Market Compensation
Copyright © 1999, 2010, Oracle and/or its affiliates. All Rights Reserved. 7
Market Compensation business process
Base Currencies
PeopleSoft Enterprise Performance Management (PeopleSoft EPM) applications require that there can be only one business unit per scenario, and that every business unit can have only one base currency code. Therefore, every scenario can have only one base currency code.
You must import external compensation survey data that is in the same base currency as that for the business unit that you are using in your scenario.
See Also
Trees
In Workforce Rewards, you use trees to provide structure to all of the main dimensions (department, geography, compensation code, job code, financial size, unit size, and industry type). You can have multiple versions of these trees in your system, with different names.

Managing Market Compensation Chapter 2
8 Copyright © 1999, 2010, Oracle and/or its affiliates. All Rights Reserved.
In the Market Compensation module, use the trees specified on the Mapping Tree Names page. When you specify a tree on this page, the tree mapping value must remain constant. The value must remain unchanged, from the start of your external survey data import, until you are finished using the survey data to generate a market compensation scenario.
See Also
PeopleSoft Enterprise Workforce Analytic Applications 9.1 PeopleBook, "Importing Internal Source Data to Data Warehouse Tables," Setting Up Trees
The Compensation Survey Data Crystal Report
Use the Compensation Survey Data Crystal report (WAC0020) to understand and analyze the external compensation survey data that you imported into Workforce Rewards. Then prepare a strategy for how to use this in data in the Market Compensation module. To run the report, select EPM Foundation, Business Metadata, OW-E Dimension Maintenance, HRMS, Workforce Survey Setup Reports, Compensation Survey Data.
See Also
PeopleSoft Enterprise Workforce Analytic Applications 9.1 PeopleBook, "Importing External Survey Data to Data Warehouse Tables," Generating External Survey Data Reports
Creating Market Compensation Scenarios
To create market compensation scenarios use the WA_CM_MODEL_TBL.GBL, WA_WEIGHT_DFN.GBL,and WA_SCENARIO_DFN.GBL components.
This section provides an overview of market compensation scenarios, and discusses how to:
• Calculate regressions.
• View regression statistics.
• Define market models.
• Define market weighting rules.
• View market survey samples.
• Set up market scenarios.
• Run the Market-Based Pricing Application Engine process (WA_MBP).
• Review the Market-Based Pricing process.
• Review market compensation scenario data.

Chapter 2 Managing Market Compensation
Copyright © 1999, 2010, Oracle and/or its affiliates. All Rights Reserved. 9
Understanding Market Compensation Scenarios
Create scenarios with the Market Compensation module to assess your organization's compensation gap to market, that is, to compare your organization's current compensation rates to an estimate of the prevailing market rates. To create a scenario:
1. Regress the survey values for certain executive and some mid management level jobs, based on your organization's dimensions and business needs.
2. Define a model ID, including aging rules.
3. Select survey samples and apply weighting rules.
4. Create a scenario ID.
5. Run the Market-Based Pricing process.
To summarize, define a market compensation model as a set of benchmark job codes, along with their weighting and aging rules. Then reference the model to define a market compensation scenario.
Survey Regression
Regression is a statistical technique that determines the relationship between two or more variables. Regression predicts the value of one variable (the dependent variable) based upon one or more independent variables.
Run regression calculations in the Market Compensation module to adjust market rates for certain jobs from those delivered with the survey. For example, the market rates delivered in a particular compensation survey may come from a set of companies whose business circumstances are substantially different from your organization's circumstances. The survey data might be from companies that are much larger or smaller than yours, based upon their total revenue or the number of employees.
Perform regression on the salary data for executive level jobs, where the pay levels are strongly dependent on the size of the organization. The Market Compensation module uses the financial size and unit size dimensions to gauge relative organization size. This helps you run regressions for executive pay data from surveys where the companies surveyed are much larger or smaller than your organization, based on one of these dimensions, and where regression statistics are provided by that survey.
For each survey with data requiring regression, specify dimension values (financial size or unit size) to regress the compensation survey data for each benchmark job. The system calculates and stores the regressions for the predicted market rates, with a dimension value of Regressed. Market Compensation calculates single regression equations, in either natural logarithms or common logarithms. Choose according to your business requirements.
Survey Data Aging
When you create a model in the Market Compensation module, one of the model parameters that you specify is an aging factor. The aging factor is an annualized percentage, used by the system to age the survey data by updating it to a common date. The aging factor is usually based on the expected movement of pay in the market (for example, 4 percent) based on surveys that report merit budgets for the coming year. The aging calculation is a daily calculation and it works as follows:
1. (Market Rate Measure Value x Aging Factor) / 360 = (Daily Adjustment Amount).

Managing Market Compensation Chapter 2
10 Copyright © 1999, 2010, Oracle and/or its affiliates. All Rights Reserved.
2. (Daily Adjustment Amount x Number of Days to Age) + (Market Rate Measure Value) = (Aged Market Rate Measure Value).
For example, assume that:
• A compensation survey is effective-dated March 1, 2000.
• The market rate measure value for a job in the survey is 50,000 USD.
• We choose to apply an annualized aging factor of 4 percent (based on the expected movement of pay in the market).
• We choose to age the survey data to January 1, 2001, a period of 10 months (or 300 days).
The calculation is:
1. (50,000 USD x .04) / 360 days = 5.5 USD per day.
2. (5.5 USD per day x 300 days) + 50,000 USD = 51,650 USD, which is the new aged market rate measure value.
Survey Selection and Weighting Rules
Market compensation surveys provide data about prevailing compensation rates for jobs. Use this data to calculate market rates for comparison against your organization's current pay structures, or against a pay strategy. Different compensation surveys have differing importance or credibility based upon how closely they reflect the business circumstances for your organization (industry type, financial size, and so on).
On the Market Weighting Rules page, you select the compensation survey data from the data warehouse tables that best fits your analysis. This way, you direct the system to process only the market compensation data that you consider to be most relevant. Assign relative weights to the data, if you think that one set of datais more, or less, important than another.
Workforce Rewards uses the compensation survey data and weightings when calculating market rates for a scenario.
Pages Used to Create and Run Market Compensation Scenarios
Page Name Definition Name Navigation Usage
Salary Regression Calculator
WA_REGRESS_TBL Workforce Analytics, Market Compensation, Setup, Salary Regression Calculator
Calculate regressions. Specify dimension criteria about your organization's size, relative to the size of companies in the survey. The system uses this information to calculate andstore regressed survey values for predicted market rates.
Regression Statistics WA_REGR_INFO_SPNL Click the View Statistics link on the Salary Regression Calculator page
View regression statistics for the selected job code and survey instance.

Chapter 2 Managing Market Compensation
Copyright © 1999, 2010, Oracle and/or its affiliates. All Rights Reserved. 11
Page Name Definition Name Navigation Usage
Market Model WA_CM_MODEL_TBL Workforce Analytics, Market Compensation, Setup, Setup Market Model,Market Model
Define market compensation models and view job codes in the model.
Market Weighting Rule WA_WEIGHT_DFN Workforce Analytics, Market Compensation, Setup, Setup Weighting Rules, Market Weighting Rule
Define market weighting rules. Select the compensation survey data toinclude in the model, screenthe survey data, and apply a weight to the data.
Market Survey Samples WA_SAMPLE_SPNL Click the Information button on the Market Weighting Rule page.
View market survey samples.
Market Scenario WA_SCENARIO_DFN1 Workforce Analytics, Market Compensation, Setup, Setup Market Scenario, Market Scenario
Set up market compensationscenarios by specifying the models that make up the scenarios.
Run Market Scenario RUN_PF_JOBSTREAM Workforce Analytics, Market Compensation, Process, Run Market Scenario, Run Market Scenario
Run market–based pricing application engine process.
Calculating Regressions
Access the Salary Regression Calculator page (Workforce Analytics, Market Compensation, Setup, Salary Regression Calculator).

Managing Market Compensation Chapter 2
12 Copyright © 1999, 2010, Oracle and/or its affiliates. All Rights Reserved.
Salary Regression Calculator page
Job Code Set Select the node of the JOBCODE tree to which you want to map the survey job code. Values are from the WA_JOBCDSET_D00 table.
Geography, Industry, Financial CD (financial code), Unit CD (unit code)
Select survey dimensions.
The selection criteria tells the system which survey samples to pull the regressionstatistics from, and then uses these dimension values as keys for the new regressed survey sample rows of data. Select from the prompt list values, which are from the GEOGRAPHY_D00, WA_INDUSTRY_D00, WA_FINCODE_D00, and WA_UNITCODE_D00 tables, respectively.
Variable Type Select the appropriate variable type for this survey sample regression calculation.Values are:
Financial: The regression calculation takes into account your organization's financial size.
Unit: The regression calculation takes into account your organization's unit size.
Variable Enter your organization's financial or unit size value. The system uses this value when calculating the regression.
Logarithm Type Select Natural or Common, depending on the preferences or practices of your organization.
View Statistics Click to access the Regression Statistics page, and review statistics provided by the selected survey sample that is involved in running the regression calculation.

Chapter 2 Managing Market Compensation
Copyright © 1999, 2010, Oracle and/or its affiliates. All Rights Reserved. 13
Calculate Click to trigger system processing. The system regresses the survey data, based on the survey sample, dimension criteria, and variable information that you entered on this page.
Regressed Values
The system populates the Regressed Values group box with the regressed values for each compensation code and measure ID provided by that survey sample. The system also inserts new rows of data for that survey sample, with regressed measure values, in the WA_SURVALUE_F00 table.
Measure ID Displays a percentile of the market rate.
Measure Value Displays the calculated market rate value for a specified percentile of a market rate. This is the annual, monetary pay level that you compare against the compensation level for similar jobs in your organization.
Note. When you click the Calculate button, the system writes the rows of data that appear on the page to the WA_SURVALUE_F00 table. However, the system uses the original effective date of the survey instance, notthe effective date that you entered on this page. Each time that you modify the information for the survey instance and job code set and run the regression calculation, the system writes over the previous rows of data for the survey instance and job code set.
Viewing Regression Statistics
Access the Regression Statistics page (Click the View Statistics link on the Salary Regression Calculator page).
Regression Statistics page

Managing Market Compensation Chapter 2
14 Copyright © 1999, 2010, Oracle and/or its affiliates. All Rights Reserved.
View statistics for the regression calculation for this survey sample and benchmark job. Base Compensation and Cash Compensation are the two most common compensation types found in compensation surveys, and these are some of the most common statistics used to evaluate the regressions.
Return Click to return to the salary regression calculator.
Defining Market Models
Access the Market Model page (Workforce Analytics, Market Compensation, Setup, Setup Market Model, Market Model).
Market Model page
Note. You normally create model IDs on the EPM Foundation, Business Metadata, Business Framework, Models page. The Workforce Rewards Market Model page, however, enables you to create the model ID and further define the model, all on one page. Create your market compensation model IDs using this page only.
If you are adding a model, you have the option of cloning an existing model. To do this, enter a clone model ID and click the Tab button to move through the field. When saving the page, the system clones the specified model along with the associated job codes and weighting rules.
Annual Aging Rate Enter the annual aging rate or factor. The system uses this percentage to age the survey data included in the model. Specify an aging rate to bring the survey data up to the current date or to make the survey data consistent with the dates of other surveys.
Parent Model ID Enables you to link models together, using object-based modeling. This functionality is discussed in the EPM Foundation documentation.

Chapter 2 Managing Market Compensation
Copyright © 1999, 2010, Oracle and/or its affiliates. All Rights Reserved. 15
Notes Enter notes as appropriate.
Job Codes Displays job codes and descriptions.
If you cloned a previous model as well as the associated job codes and weighting rules for the model, then the system displays the job codes here.
If you created a model without cloning the rules from another model, then the system displays no data rows. To view the job data associated with this model, save and close the Market Model page, complete the Weighting Rules page for this new model, and then access the Weighting Rules page again in Update/Display or Correction mode. Access the Market Model page, where you can now view the job data.
When you create a market model and assign a parent model, the page does not display the job codes of the parent model. The page displays only the job codes for the current model. To view the job codes from the parent model, access the page for the parent model.
See Also
PeopleSoft Enterprise Performance Management Fundamentals 9.1 PeopleBook, "Setting Up Models and Scenarios," Defining Models and Scenarios
Defining Market Weighting Rules
Access the Market Weighting Rule page (Workforce Analytics, Market Compensation, Setup, Setup Weighting Rules, Market Weighting Rule).

Managing Market Compensation Chapter 2
16 Copyright © 1999, 2010, Oracle and/or its affiliates. All Rights Reserved.
Market Weighting Rule page
• Select the compensation survey data that you want to include.
• Screen the survey data using dimension criteria.
• Assign the survey data a relative weighting.
Note. Any job codes for which you want to establish weighting rules must appear on the Job Code tree. If youtry to add a weighting rule, and you receive an error message from the system saying that the job code is not available, you may not have added the job code to your tree.
Clone Rule This field appears at the top of the page in Add and Correction mode. Use this field to clone your weighting rules for the selected job code from a prior job code. Then modify the weighting rules or use as is. Select a job code from the prompt list values. These values are from a view that joins the JOBCODE_D00 and WA_WEIGHT_DFN tables.
The system uses the sample rows of the cloned job code as search criteria for the new job code. If the system returns a valid row for the new job code, then the sample row inherits the set and weight from the cloned job code.

Chapter 2 Managing Market Compensation
Copyright © 1999, 2010, Oracle and/or its affiliates. All Rights Reserved. 17
Selection Criteria
Use the Selection Criteria group box to select survey samples, define screening criteria for the survey samples, and apply weighting factors to the selected survey samples.
Survey Select a set of survey data to include in your model, to enter the selection criteria manually. The prompt values are from the WA_SURVEY_R00 table.
Geography, Industry, Financial CD (financial code), and Unit CD (unit code)
Select the dimension values to use to screen the specified set of survey data. The values are from the GEOGRAPHY_VW, WA_INDUSTRY_VW, WA_FINCODE_VW, and WA_UNITCODE_VW tables, respectively.
To select regressed survey values from the Regression Calculator, enter Regressed in either the Financial CD or the Unit CD field.
Weight Enter a whole number multiplier weight for this set of survey samples. The system uses the weighting to calculate an adjusted market rate for this job code from all of the selected survey samples. Use a weight value of 0 (zero) to excludea survey sample from the calculation for sizes that are too small or otherwise has data that is not thought to be valid for your organization.
Set Enter a set value, which is a counter used to identify each set of search criteria that you enter using this page. It is a logical group of survey sample criteria containing a particular set of dimension values.
Attach Click to enable the system to populate the Survey Samples group box with rows of survey data based on your selection criteria. Each time that you click the button, the system returns a new set of survey samples based on your criteria.
Remove Click to enable the system to remove the data that appears in the Survey Samplesgroup box, based on your selection criteria.
Survey Samples
For each survey sample returned, the system displays the set number, or counter, for the survey sample screening criteria, and the weight that you applied to the survey sample. You can override this value for a particular row. The Survey, Job Code Set, Geography, Industry, Financial CD (financial code), and Unit CD (unit code) fields display the selection criteria that you entered in the Search Criteria group box. The data is taken from the WA_WEIGHT_SEQ table.
Click the Survey Sample Information button to access the Market Survey Samples page and view details of the survey sample.
Add, remove, and modify data in the grid as needed, to define the survey data that you want to use for this model ID and job code. Click the Attach to List button to add more survey samples. Click the Remove From List button to remove the rows from the grid and start over. Or remove one row at a time.
The system uses these survey samples and associated weightings to perform market rate calculations, when you run the Market-Based Pricing process. Here is a summary of the weighting calculation that occurs:

Managing Market Compensation Chapter 2
18 Copyright © 1999, 2010, Oracle and/or its affiliates. All Rights Reserved.
1. The market rates for each of the survey samples are multiplied by the weights indicated, to provide adjusted market rate values for each sample.
2. All of the adjusted market rate values are added to make an aggregate value.
3. All of the weights are added to make an aggregate value.
4. The aggregate rate value is divided by the aggregate weight value, to yield a single, weighted market rate value for each job code, compensation code, and measure ID.
Viewing Market Survey Samples
Access the Market Survey Samples page (Click the Information button on the Market Weighting Rule page).
Market Survey Samples page
Survey Instance
Survey Instance In this group box, the page displays the company participant count and employee participant count, which provide you with an idea of the overall size of the survey from which you selected your samples.

Chapter 2 Managing Market Compensation
Copyright © 1999, 2010, Oracle and/or its affiliates. All Rights Reserved. 19
Survey Sample
Survey Sample In this group box, the system displays selection criteria that you applied to the survey data on the Market Weighting Rules page.
Market Values
Market Values In this group box, the system displays the data for the selected survey sample, including each compensation code, measure ID, and associated measure value (market rate). The measure ID is a percentile of the market rate. The measure value is the calculated market rate value for a particular percentile of a market rate, and for a particular scenario and job code. This is the annual, monetary pay level to compare against the compensation level for similar jobs in your organization.
For each row, the system also displays the total sample count of companies and sample count of employees, which provide you with an idea of the overall size ofthe survey samples that you selected from the survey with your screening criteria.
Review this information to determine if your sample size is too small to be statistically significant, or whether the survey data is weighted properly. This canhelp you decide whether you want to use the data on the Market Weighting Rule page, and whether to save the data.
Setting Up Market Scenarios
Access the Market Scenario page (Workforce Analytics, Market Compensation, Setup, Setup Market Scenario, Market Scenario).
Market Scenario page

Managing Market Compensation Chapter 2
20 Copyright © 1999, 2010, Oracle and/or its affiliates. All Rights Reserved.
Note. You normally create scenario IDs in the EPM Foundation, Business Metadata, Business Framework, Scenarios page. The Market Scenario page, however, enables you to create the scenario ID from within Workforce Rewards. Market compensation scenarios are always historical.
Model ID Select the model ID of the model that you want to include in the scenario. The prompt values are from the MODEL_VW table.
Notes Enter notes as appropriate.
Running the Market-Based Pricing Application Engine Process (WA_MBP)
Access the Run Jobstream page to run the Market-Based Pricing process (EPM Foundation, Job Processing, Update/Run Jobstreams, Run Jobstream).
As of Dated Jobstream Market compensation scenarios are historical scenarios only, as of a single point in time. Select the As of Dated Jobstream check box to enable the system to hide the Fiscal Year and Accounting Period fields and display the As of Date field. Enter an as of date for the scenario.
Jobstream ID Select the WA_MBP jobstream ID. Although several jobstream IDs appear in the list of values, this is the jobstream that you want to run from this page for the Market-Based Pricing process. We deliver this metadata for you to use to run the process:
Application Engine IDs WA_MBP and PF_MERGE.
Job IDs WA_MBP and WA_MBP_MRG.
Jobstream ID WA_MBP.
Warning! Do not run the Market Compensation Scenario jobstream based on a fiscal year and accounting period. Also, do not run a jobstream with a Forecast type scenario from this page. If you do either, the MarketCompensation engine will not run successfully.
See Also
PeopleSoft Enterprise Performance Management Fundamentals 9.1 PeopleBook, "Streamlining Processing with Jobstreams"
Reviewing the Market-Based Pricing Application Engine Process (WA_MBP)
The WA_MBP jobstream runs the Market-Based Pricing process. This process calculates market rates for the job codes from the survey samples that you selected, using the aging and weighting rules that you defined. A market rate value is calculated for every compensation code and measure. (A measure is a percentile of the market rate.) The system places the new, calculated market rate data in a temporary table called WA_MKT_SCEN_T.

Chapter 2 Managing Market Compensation
Copyright © 1999, 2010, Oracle and/or its affiliates. All Rights Reserved. 21
The jobstream then runs the Final Table Merge Application Engine process (PF_MERGE). This process moves the data from the temporary table to the final table, WA_MKT_SCEN_TBL, where the calculated market rates are stored with Scenario ID as a key. WA_MKT_SCEN_TBL is also the source table for the Market Compensation data approval process.
Reviewing Market Compensation Scenario Data
When you run the Market-Based Pricing process, the system also calls the Market Scenario Data Mart process (WA_MC_SCEN), which updates the Workforce Rewards Data Mart. This keeps the data for the Data Mart and the Workforce Rewards tables synchronized. You can also run the Market Scenario Data Mart process alone, to populate the fact tables for previous periods without having to run the WA_MBP process.
This table lists the input tables used to populate the Data Mart fact tables:
Reporting Area Input Table (D00, R00, and F00) Output Table (Fact)
Market Compensation WA_MKT_SCEN_TBL, WA_MKT_RATE_TBL , JOB_F00, WA_COMP_HST_F00, JOBCODE_D00, LOCATION_D00, SAL_GRADE_D00
WA_MC_SCEN_FACT: Contains all of the data required from the Market-Based Pricing engine, at thejob code level.
WA_MC_EMPL_FACT: Contains all of the data required from the Market-Based Pricing engine, at theemployee level.
In Market Compensation, the fact table data is accessed by delivered inquiry pages in the Market Compensation Scenario component. You may also select a business intelligence application and develop analysis templates to use with Market Compensation.
See Also
Appendix B, "Workforce Rewards Reports," page 183
Analyzing Scenarios
This section provides an overview of scenario data analysis and discusses how to:
• Run Crystal reports to analyze scenarios.
• Review market compensation scenario summary data.
• Review market compensation scenario fit to market data.
• Review market compensation scenario gap to target data.
• Review market compensation scenario market rate detail data.

Managing Market Compensation Chapter 2
22 Copyright © 1999, 2010, Oracle and/or its affiliates. All Rights Reserved.
Understanding Scenario Data Analysis
After you've generated a market compensation scenario, check the market compensation rates against your current workforce compensation data. Determine whether the scenario market rates are skewed, or in agreement with what you were expecting to see. To assist with scenario data analysis, we deliver:
• Two Crystal reports.
• An inquiry component consisting of four pages.
The review and analysis process is iterative. If you find that you don't like the results of the scenario that you just generated, then run additional scenarios with a different set of rules and dimension values. Adjust the scenario until you feel that you have valid market rate data to use as a basis for comparison and strategy. Then decide whether to approve and publish the new market rates. Some examples of the types of questions to consider during this process are:
• Does this scenario make sense?
• Are these the results that you would expect?
• Did you do something wrong in the process, resulting in skewed data?
• Was the survey data valid for your situation?
• Were your weighting rules valid for your situation?
Common Elements Used in This Section
Establish Target MarketRates
Select this link to return to the Establish Target Market Rates page.
The Market Compensation Scenario pages use market rate IDs (the Measure ID), which you must occasionally modify in the Establish Target Market Rates page. This link enables you to move directly to the Establish Target Market Rates page without having to navigate the menu.
Pages Used to Analyze Scenarios
Page Name Definition Name Navigation Usage
Weighting Rules report RUN_WA_0001 Workforce Analytics, Workforce Reports, Market Compensation Reports, Weighting Rules
Run the job code weighting definition Crystal report (WAC0001).
Scenario Fit to Structure report
RUN_WA_0028 Workforce Analytics, Workforce Reports, Market Compensation Reports, Scenario/Fit to Structure
Run the Market Scenario Fitto Structure Crystal report (WAC0028).
Chapter 2 Managing Market Compensation
Copyright © 1999, 2010, Oracle and/or its affiliates. All Rights Reserved. 23
Page Name Definition Name Navigation Usage
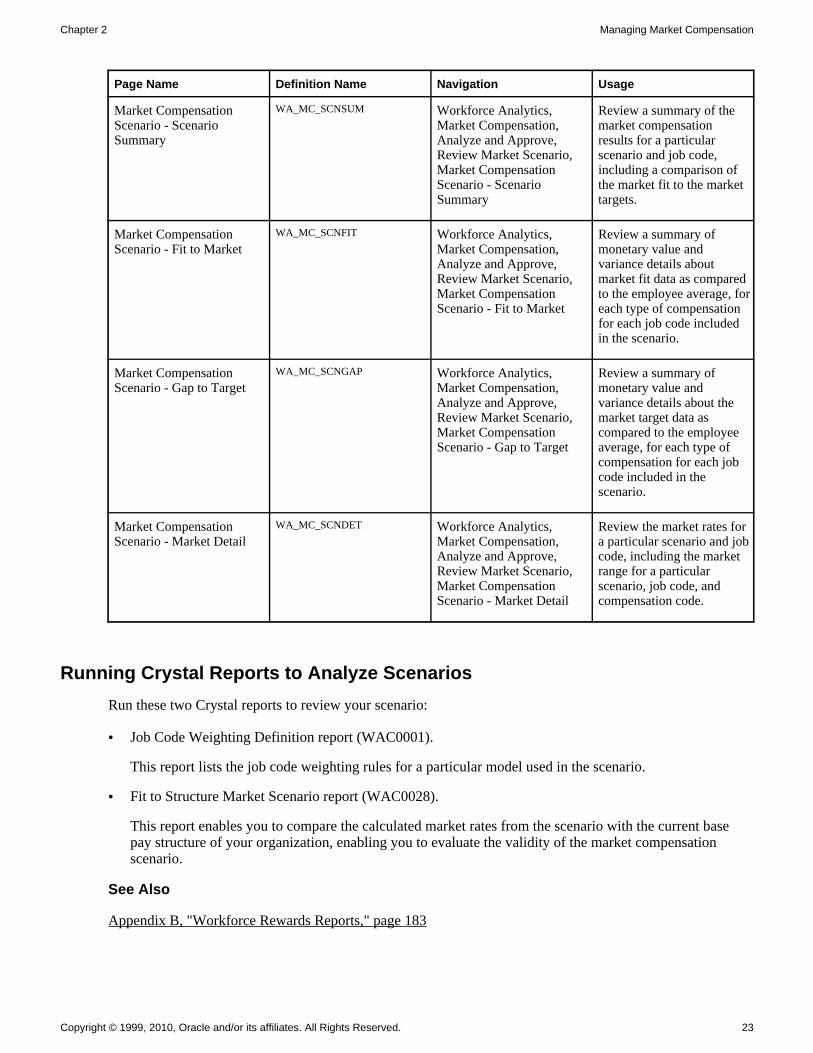
Market Compensation Scenario - Scenario Summary
WA_MC_SCNSUM Workforce Analytics, Market Compensation, Analyze and Approve, Review Market Scenario, Market Compensation Scenario - Scenario Summary
Review a summary of the market compensation results for a particular scenario and job code, including a comparison of the market fit to the market targets.
Market Compensation Scenario - Fit to Market
WA_MC_SCNFIT Workforce Analytics, Market Compensation, Analyze and Approve, Review Market Scenario, Market Compensation Scenario - Fit to Market
Review a summary of monetary value and variance details about market fit data as compared to the employee average, foreach type of compensation for each job code included in the scenario.
Market Compensation Scenario - Gap to Target
WA_MC_SCNGAP Workforce Analytics, Market Compensation, Analyze and Approve, Review Market Scenario, Market Compensation Scenario - Gap to Target
Review a summary of monetary value and variance details about the market target data as compared to the employee average, for each type of compensation for each job code included in the scenario.
Market Compensation Scenario - Market Detail
WA_MC_SCNDET Workforce Analytics, Market Compensation, Analyze and Approve, Review Market Scenario, Market Compensation Scenario - Market Detail
Review the market rates for a particular scenario and jobcode, including the market range for a particular scenario, job code, and compensation code.
Running Crystal Reports to Analyze Scenarios
Run these two Crystal reports to review your scenario:
• Job Code Weighting Definition report (WAC0001).
This report lists the job code weighting rules for a particular model used in the scenario.
• Fit to Structure Market Scenario report (WAC0028).
This report enables you to compare the calculated market rates from the scenario with the current base pay structure of your organization, enabling you to evaluate the validity of the market compensation scenario.
See Also
Appendix B, "Workforce Rewards Reports," page 183

Managing Market Compensation Chapter 2
24 Copyright © 1999, 2010, Oracle and/or its affiliates. All Rights Reserved.
Reviewing Market Compensation Scenario Summary Data
Access the Market Compensation Scenario - Scenario Summary page.
Market Compensation Scenario - Scenario Summary page 1 of 2
Market Compensation Scenario - Scenario Summary page 2 of 2
Use this page after you have run the Market-Based Pricing process. The process calls the Market Compensation process (WA_MC_SCEN), which populates the underlying fact table accessed by this page, the WA_MC_SCEN_FACT table.
Chapter 2 Managing Market Compensation
Copyright © 1999, 2010, Oracle and/or its affiliates. All Rights Reserved. 25
The Market Compensation Scenario - Scenario Summary page provides you access to three additional pages in the Market Compensation Scenario component. On each page, the system displays the business unit and scenario ID that you selected to open the component. The system also displays the as of date, currency code, and approval status of the scenario.
Note. On pages such as these, you can apply row-level security at the scenario level. This means that if your implementation has scenario security and you don't have security access to view a scenario, you won't. The scenarios that you see on these pages can vary depending upon your level of security access.
Market Fit Versus Market Target
The chart and grid display information about the market fit and the market target for each job code and compensation code combination in the scenario.
Market Fit Displays the calculated survey data percentile (or measure ID) that is closest to the current employee average compensation. The employee average base pay is calculated from the annual amount in the JOB table, while other compensations (cash and variable compensations) are calculated based on aggregation of the amounts in WA_COMP_HST_F00. To view market fit data on this page, you must have run the Market-Based Pricing process.
Market Target Displays the specified target survey data percentile (or measure ID) from the Target Market Rates page. If you have not entered target market rates on the Target Market Rates page, then you may not see market target data on the MarketCompensation Scenario - Scenario Summary page. Think of these target rates as pay guidelines, in support of your organization's overall pay strategy.
When you first run the Market-Based Pricing process, use this page to evaluate the market fit, that is, determine the survey data percentile that best fits your organization's pay strategy. Then use the Target Market Rates page to make the chosen survey data percentile a target rate for your pay strategy. Run the MBP_FACT jobstream (which includes the WA_MC_SCEN process) to repopulate the WA_MC_SCEN_FACT table. After you have performed these steps, return to this page and view the market target data, allowing a side by side comparison of the market fit and the market target data. You can also use the other three pages in this component to navigate through the data to view monetary values, variances, and market compensation ranges for each job code and compensation code in the scenario.
Perform this process repeatedly, until you are satisfied that you have valid market compensation scenarios foryour benchmark job codes. Then use the results in the WA_MKT_SCEN_TBL table to establish target market rates for your benchmark and non-benchmark jobs.
Reviewing Market Compensation Scenario Fit to Market Data
Access the Market Compensation Scenario - Fit to Market page (Workforce Analytics, Market Compensation, Analyze and Approve, Review Market Scenario, Market Compensation Scenario - Fit to Market).
Managing Market Compensation Chapter 2
26 Copyright © 1999, 2010, Oracle and/or its affiliates. All Rights Reserved.
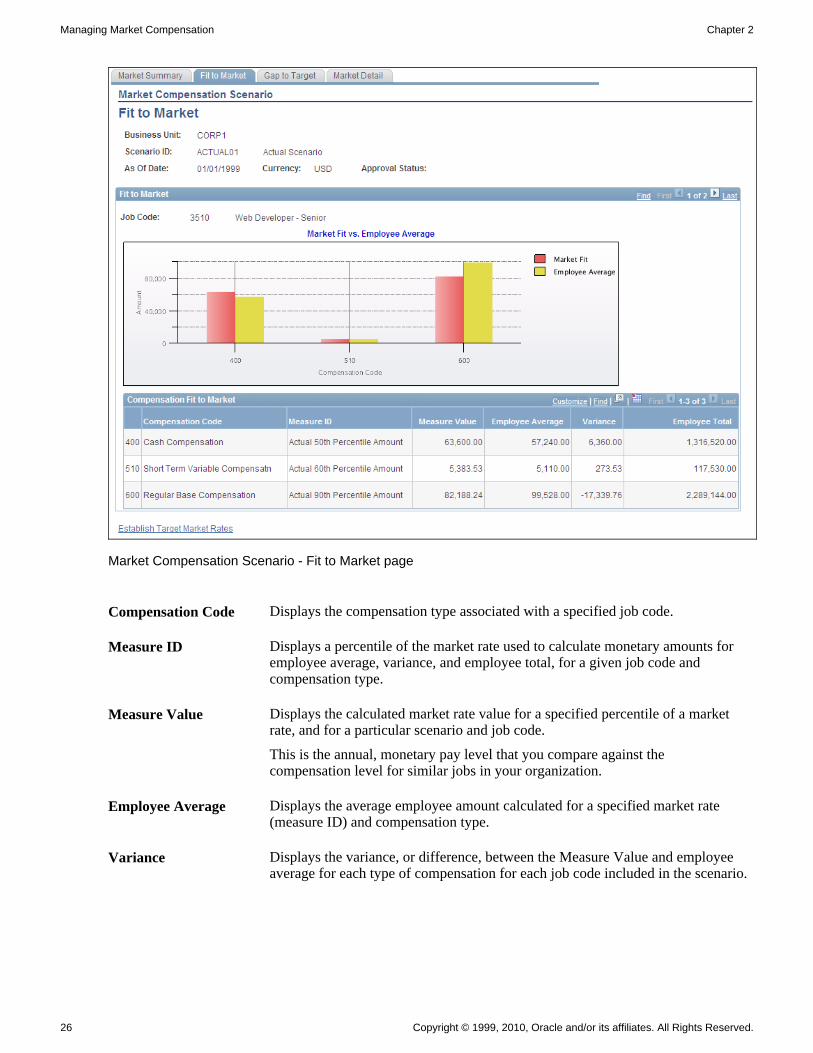
Market Compensation Scenario - Fit to Market page
Compensation Code Displays the compensation type associated with a specified job code.
Measure ID Displays a percentile of the market rate used to calculate monetary amounts for employee average, variance, and employee total, for a given job code and compensation type.
Measure Value Displays the calculated market rate value for a specified percentile of a market rate, and for a particular scenario and job code.
This is the annual, monetary pay level that you compare against the compensation level for similar jobs in your organization.
Employee Average Displays the average employee amount calculated for a specified market rate (measure ID) and compensation type.
Variance Displays the variance, or difference, between the Measure Value and employee average for each type of compensation for each job code included in the scenario.

Chapter 2 Managing Market Compensation
Copyright © 1999, 2010, Oracle and/or its affiliates. All Rights Reserved. 27
Employee Total Displays the total compensation amount for all employees for each type of compensation for each job code included in the scenario.
Note. You must run the Market-Based Pricing application engine process (WA_MBP) to correctly populate this field.
Reviewing Market Compensation Scenario Gap to Target Data
Access the Market Compensation Scenario - Gap to Target page (Workforce Analytics, Market Compensation, Analyze and Approve, Review Market Scenario, Market Compensation Scenario - Gap to Target).

Managing Market Compensation Chapter 2
28 Copyright © 1999, 2010, Oracle and/or its affiliates. All Rights Reserved.
Gap to Target page
Compensation Code Displays the compensation type associated with a specified job code.
Measure ID Displays the market rate used to calculate monetary amounts for employee average, variance, and employee total, for a given job code and compensation type.
Measure Value Displays the actual monetary amount calculated for a specified market rate (measure ID) and compensation type.
Employee Average Displays the average employee amount calculated for a specified market rate (measure ID) and compensation type.
Variance Displays the variance, or difference, between the employee average amount and the employee total amount.

Chapter 2 Managing Market Compensation
Copyright © 1999, 2010, Oracle and/or its affiliates. All Rights Reserved. 29
Employee Total Displays the total compensation amount for all employees for each type of compensation for each job code included in the scenario.
Note. You must run the Market-Based Pricing application engine process (WA_MBP) to correctly populate this field.
Reviewing Market Compensation Scenario Market Rate Detail Data
Access the Market Compensation Scenario - Market Detail page (Workforce Analytics, Market Compensation, Analyze and Approve, Review Market Scenario, Market Compensation Scenario - Market Detail).
Market Detail page 1 of 2

Managing Market Compensation Chapter 2
30 Copyright © 1999, 2010, Oracle and/or its affiliates. All Rights Reserved.
Market Detail page 2 of 2
This page displays details about the range of monetary values as well as associated percentiles (or measure IDs) for each type of compensation for each job code included in the scenario.
Best Compensation Fit The system selects a check box to indicate the market compensation measure ID whose value is closest to the employee average.
Benchmark The system selects a check box to indicate the market compensation measure ID that is closest to your existing target rate. Think of the target rate as a pay guideline, in support of your organization's overall pay strategy.
Approving Compensation Target Rates
This section provides an overview of the compensation target rate approval process and discusses how to:
• Establish target market rates.
• Review market compensation details.
• Establish market rates for non-benchmark jobs.
• Review benchmark job details.
• Review job code slotting results.
• Approve market compensation target rates.

Chapter 2 Managing Market Compensation
Copyright © 1999, 2010, Oracle and/or its affiliates. All Rights Reserved. 31
Understanding the Compensation Target Rate Approval Process
In the previous section, you determined that you have valid market compensation scenarios for your benchmark job codes, and you are satisfied with the results in the WA_MKT_SCEN_TBL table. Your next steps are to:
1. Establish the target rates that your organization wants to use for compensating workers in each of the benchmark jobs.
2. Establish the rates that your organization wants to use for compensating workers in your non-benchmark jobs.
3. Approve the results of your decisions.
Pages Used to Approve Compensation Target Rates
Page Name Definition Name Navigation Usage
Establish Target Market Rates
WA_MKT_SCEN_VW Workforce Analytics, Market Compensation, Process, Establish Target Market Rates, Establish Target Market Rates
Review the calculated market compensation data for all of the jobs in a particular scenario, and establish target market rates.
Job Code Details WA_MKT_JOB_SPNL Click the Job Code Target Detail button on the Establish Target Market Rates page.
Review the market compensation details for a particular job code in a scenario, and select the target rates.
Calculate Jobcode Slotting WA_MC_SLOT_DFN Workforce Analytics, Market Compensation, Process, Calculate Jobcode Slotting, Calculate Jobcode Slotting
Establish market rates for non-benchmark jobs, based on available data for benchmark jobs within a scenario.
Benchmark Details WA_MC_BNCH_SEC Click the View Details link on the Calculate Jobcode Slotting page.
Review the market compensation rate details for a benchmark job selected on the Calculate Jobcode Slotting page.
Job Code Slotting Results WA_MC_SLOT_RSLT Click the View Slotting Results link on the Calculate Jobcode Slotting page.
Review job code slotting results, calculated from criteria selected on the Calculate Jobcode Slotting page.
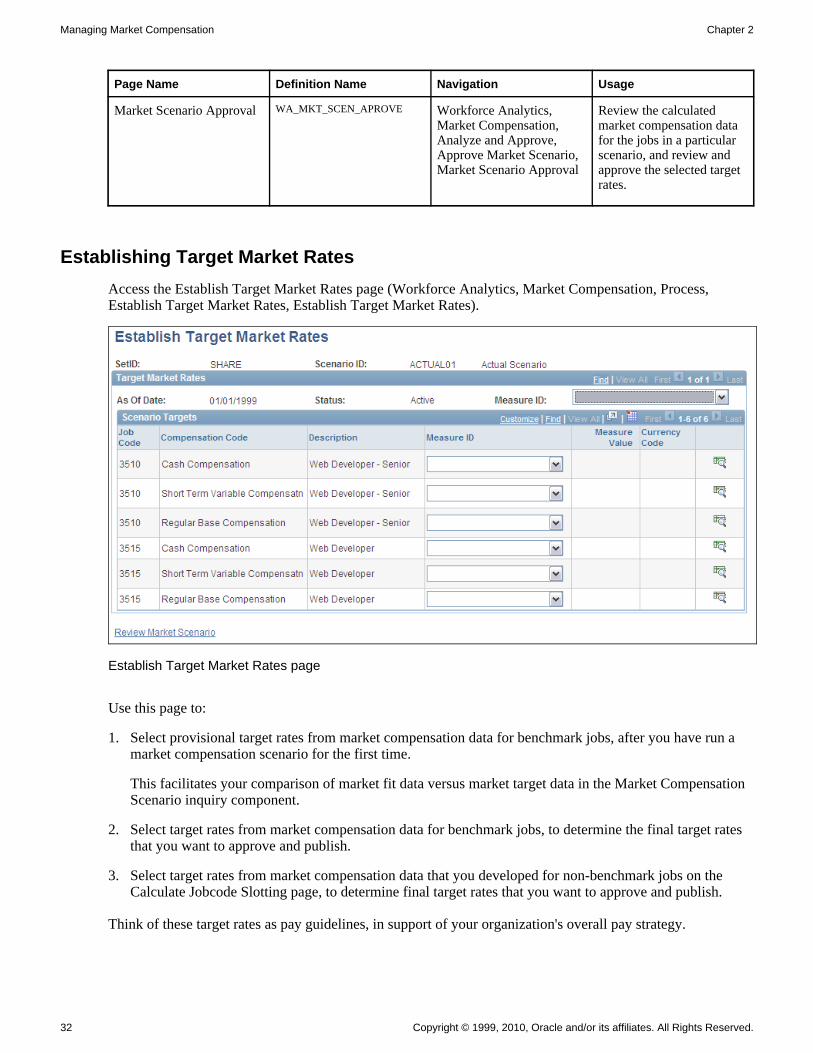
Managing Market Compensation Chapter 2
32 Copyright © 1999, 2010, Oracle and/or its affiliates. All Rights Reserved.
Page Name Definition Name Navigation Usage
Market Scenario Approval WA_MKT_SCEN_APROVE Workforce Analytics, Market Compensation, Analyze and Approve, Approve Market Scenario, Market Scenario Approval
Review the calculated market compensation data for the jobs in a particular scenario, and review and approve the selected target rates.
Establishing Target Market Rates
Access the Establish Target Market Rates page (Workforce Analytics, Market Compensation, Process, Establish Target Market Rates, Establish Target Market Rates).
Establish Target Market Rates page
Use this page to:
1. Select provisional target rates from market compensation data for benchmark jobs, after you have run a market compensation scenario for the first time.
This facilitates your comparison of market fit data versus market target data in the Market Compensation Scenario inquiry component.
2. Select target rates from market compensation data for benchmark jobs, to determine the final target rates that you want to approve and publish.
3. Select target rates from market compensation data that you developed for non-benchmark jobs on the Calculate Jobcode Slotting page, to determine final target rates that you want to approve and publish.
Think of these target rates as pay guidelines, in support of your organization's overall pay strategy.

Chapter 2 Managing Market Compensation
Copyright © 1999, 2010, Oracle and/or its affiliates. All Rights Reserved. 33
Scenario Targets
When you first access the page, the system displays a row for each job code, compensation code description, and job description included in the scenario. This data is from the WA_MKT_SCEN_TBL table. For any particular row, access the market compensation details (measure IDs, measure values, currency code, and sample count) by clicking the Job Code Target Detail button, which accesses the Job Code Details page.
You have three options for setting target rates using these pages:
• Select a default measure id for all rows on the Target Market Rates page. The system sets the selected measure as the target measure for the job code and compensation code combination. Then it enters the corresponding measure value (monetary amount). This assumes that you already know which target measure you want to select, and don't need to review the underlying market compensation data.
• Select/update a measure ID for each row on the Target Market Rates page.
• To view the underlying market compensation data before you select a target, click the Job Code Target Detail button to access the Job Code Details page where you can also select the target.
To store the changes that you make to the scenario in the WA_MKT_SCEN_TBL table, click Save.
Synchronizing With the Market Compensation Scenario Component
When you use the Target Market Rates page to set target rates for benchmark jobs, the system stores the results in the WA_MKT_SCEN_TBL table, meaning that the targets are added to the specified scenario. After you save the results on this page, the WA_MKT_SCEN_TBL table is out of synchronization with the WA_MC_SCEN_FACT and WA_MC_EMPL_FACT tables. This means that you cannot view the new data on the Market Compensation Scenario inquiry pages until you run the MBP_FACT jobstream (which includes the WA_MC_SCEN process) to update the Data Mart.
Reviewing Market Compensation Details
Access the Job Code Details page (Click the Job Code Target Detail button on the Establish Target Market Rates page.).

Managing Market Compensation Chapter 2
34 Copyright © 1999, 2010, Oracle and/or its affiliates. All Rights Reserved.
Job Code Details page
The system displays rows of data for each compensation code and measure ID for the selected job code, as well as the currency and sample count.
To adjust measure values by rounding:
1. Select a value in the Round to Nearest field.
2. Click the Round button.
To adjust measure values by percentages:
1. Enter a percentage value in the % to Adjust Rates (percentage to adjust rates) field.
2. Click the Adjust button.
Target Initially, this check box is available for entry for all rows. Select a particular row as the target rate by selecting the corresponding check box. The system hides all of the check boxes except for the one selected. Think of these target rates as pay guidelines, in support of your organization's overall pay strategy.
Measure ID When you return to the Target Market Rates page, in the Measure ID field, the system enters the value selected from the Job Code Details page.

Chapter 2 Managing Market Compensation
Copyright © 1999, 2010, Oracle and/or its affiliates. All Rights Reserved. 35
OK Click this button or save the changes you make to the scenario, return to the Target Market Rates page.
Establishing Market Rates for Non-Benchmark Jobs
Access the Calculate Jobcode Slotting page (Workforce Analytics, Market Compensation, Process, Calculate Jobcode Slotting, Calculate Jobcode Slotting).
Calculate Jobcode Slotting page
Note. On pages such as this one, you can apply row-level security at the scenario level. This means that if your implementation has scenario security and you don't have security access to view a scenario, you won't. The scenarios that you see on this page can vary, depending upon your level of security access.
The term slotting means determining the market rates for a non-benchmark job by estimating the job's value between two comparable benchmark jobs. While this is true, you can also determine the market rates for a non-benchmark job by direct comparison to a single benchmark job.
Enter an effective date, status, scenario ID, description, and notes (if appropriate).
Rule Definition
To define the rule:
1. Select a slotting job code in the Slotting Job Code field, for the non-benchmark job.
Values are from the WA_MC_NOBNCH_VW table.

Managing Market Compensation Chapter 2
36 Copyright © 1999, 2010, Oracle and/or its affiliates. All Rights Reserved.
2. Select a benchmark job code for the system to use when calculating the market rates for the non-benchmark job.
Values are from the WA_MC_BNCHJB_VW table, a view that limits your choices to jobs included in thescenario. Either select a single benchmark job for a direct estimation, or select two or more benchmark jobs for a more complex estimation.
3. Enter an estimated percent value for the benchmark job in the % of Benchmark (percentage of benchmark) field.
The rows for the Weight % (weight percentage) field must always add up to 100 percent.
View Details Click this link to review the market compensation data for a selected benchmark job. This link accesses the Benchmark Details page. The page also displays the newly calculated market rates for the non-benchmark job after the system has runthe calculation.
Calculate Market Data Click this button to calculate market compensation data for the non-benchmark job, based upon the selected benchmark jobs.
View Slotting Results Click this link to review the calculated market compensation data for the non-benchmark job. This link accesses the Job Code Slotting Results page. The results are from the WA_MKT_SCEN_TBL table.
Synchronizing With the Target Market Rates Page
When you use the Calculate Jobcode Slotting page to create market compensation data for non-benchmark jobs, the results are stored in the WA_MKT_SCEN_TBL table, meaning that the job and data are added to thespecified scenario. After you save the results on this page, view the results in the Target Market Rates page. Then you must use that page to set targets for non-benchmark jobs.
Synchronizing With the Market Compensation Scenario Component
When you use the Calculate Jobcode Slotting page to create market compensation data for non-benchmark jobs, the results are stored in the WA_MKT_SCEN_TBL table, meaning that the job and data are added to thespecified scenario. After you save the results on this page, the WA_MKT_SCEN_TBL table is out of synchronization with the WA_MC_SCEN_FACT and WA_MC_EMPL_FACT tables. This means that you cannot view the new data on the Market Compensation Scenario inquiry pages until you run the MBP_FACT jobstream (which includes the WA_MC_SCEN process) to update the Data Mart.
Reviewing Benchmark Job Details
Access the Benchmark Details page (Click the View Details link on the Calculate Jobcode Slotting page.).
Use this page to review the market compensation details for the benchmark job selected on the Calculate Jobcode Slotting page.

Chapter 2 Managing Market Compensation
Copyright © 1999, 2010, Oracle and/or its affiliates. All Rights Reserved. 37
Measure IDandMeasure Value
For each compensation code included in the scenario for this job code, the systemdisplays the measure IDs and measure values. The measure ID is a percentile of the market rate. The measure value is the calculated market rate value for a particular percentile of a market rate. This is the annual, monetary pay level that you use to compare against the compensation level for similar jobs in your organization.
Calculate Market Data After you click this button on the Calculate Jobcode Slotting page, and the system calculates the market rates for the non-benchmark job, the system displays the new market rates in the Adjusted Value field. Compare the two values side-by-side.
Return to Slotting Rule Click this link to return to the Calculate Jobcode Slotting page.
Reviewing Job Code Slotting Results
Access the Job Code Slotting Results page (Click the View Slotting Results link on the Calculate Jobcode Slotting page.).
Use this page to review the calculated market compensation data for the non-benchmark job selected on the Calculate Jobcode Slotting page.
Compensation Code For each compensation code included in the scenario, the system displays the measure IDs and calculated measure values.
Measure ID A percentile of the market rate.
Measure Value The measure value is the calculated market rate value for a particular percentile of a market rate. This is the annual, monetary pay level that you use to compare against the compensation level for similar jobs in your organization.
Benchmark Count The Benchmark Count column indicates the number of benchmark jobs used to calculate the non-benchmark data.
Approving Market Compensation Target Rates
Access the Market Scenario Approval page (Workforce Analytics, Market Compensation, Analyze and Approve, Approve Market Scenario, Market Scenario Approval).

Managing Market Compensation Chapter 2
38 Copyright © 1999, 2010, Oracle and/or its affiliates. All Rights Reserved.
Market Scenario Approval page
Note. In addition to PeopleTools page security, you can strictly limit access to scenarios for approval using scenario-level security. This means that if an operator doesn't have security access for a particular scenario, the operator cannot approve it. If you grant an operator access to a scenario approval page and a scenario, the operator has access to all scenario data within that scenario approval page, which enables the operator to viewall of the data requiring approval.
Scenario Targets
Scenario Targets Use this group box to review the associated measures for each job code and compensation code combination in the scenario. Measure IDs are percentiles of aset of market rates for a job. They are associated with a statistical range of amount values, called Measure Values, which are centered around the mean market rate. They are calculated from the compensation survey samples that you selected for this scenario.
Benchmark Review the measures that you have decided to use as your targets, which the system indicates by selecting a check box in the Benchmark column.
Using Application Messaging
After you review the data and are satisfied with the results, approve your decision and publish the results of your decision.

Chapter 2 Managing Market Compensation
Copyright © 1999, 2010, Oracle and/or its affiliates. All Rights Reserved. 39
Approve Click to approve the target rates for use in subsequent strategic compensation analyses in the Workforce Rewards system.
The target rates are moved to the WA_MKT_RATE_TBL table, which, unlike the WA_MKT_SCEN_TBL table, is not keyed by scenario ID. After you approve the target rates, use them as strategic references in the Base Pay Structure, Retention Strategy, and Compensation Strategy modules in Workforce Rewards, or in any other PeopleSoft EPM application.
Publish Click to use PeopleTools Application Messaging to publish the new target market rates from the WA_MKT_RATE_TBL table.
Note. After you approve a market compensation scenario, do not run Market Compensation again for the approved scenario. To use the approved scenario settings a second time (meaning that you want to load new surveys in your model and rerun the Market-Based Pricing process), create a new scenario ID referencing the original model, and proceed from there.
Comparing Current Pay Structures With New Target Rates
This section provides an overview of the pay structure compare process and discusses how to:
• View final market compensation scenario data.
• View salary plan gap data.
Understanding the Pay Structure Compare Process
After you approve and publish your new target market rates, and the results are stored in the WA_MKT_RATE_TBL table, compare the target market rates to your current base pay structure and workforce compensation. Determine whether your current base pay structure, or workforce compensation, is in alignment with your new targets, or whether they need to be adjusted. You can:
• Review the new target rate data, using the Review New Market Rate page.
• Compare the target rates to the midpoints of your current base pay structure, using the Salary Plan Gap page.
Pages Used to Compare Current Pay Structures With New Target Rates
Page Name Definition Name Navigation Usage
Review New Market Rate WA_MKT_RATE_VW Workforce Analytics, Market Compensation, Analyze and Approve, Review New Market Rate, Review New Market Rate
View the new target rate data for a job code.

Managing Market Compensation Chapter 2
40 Copyright © 1999, 2010, Oracle and/or its affiliates. All Rights Reserved.
Page Name Definition Name Navigation Usage
Salary Plan Gap WA_MKT_STR_CUR_INQ Workforce Analytics, Market Compensation, Analyze and Approve, Review Salary Plan Gap, Salary Plan Gap
View a comparison of the target market rates against the midpoint of the current pay range for all job codes in a particular salary administration plan. You see the variance expressed as an amount and a percentage.
Viewing Final Market Compensation Scenario Data
Access the Review New Market Rate page (Workforce Analytics, Market Compensation, Analyze and Approve, Review New Market Rate, Review New Market Rate).

Chapter 2 Managing Market Compensation
Copyright © 1999, 2010, Oracle and/or its affiliates. All Rights Reserved. 41
Review New Market Rate page
Use this page to view the compensation codes and associated measures and measure values for a particular scenario ID and job code.
Measure ID A percentile of the market rate.
Measure Value The measure value is the calculated market rate value for a particular percentile of a market rate.
This is the annual, monetary pay level that you use to compare against the compensation level for similar jobs in your organization.
Target Any target rates that you selected on the Market Scenario Approval page appear, selected, on this page in the Target column. This visual cue helps you to see which pay targets you established for the various compensation types paid for a particular job. Think of these target rates as pay guidelines, in support of your organization's overall pay strategy.

Managing Market Compensation Chapter 2
42 Copyright © 1999, 2010, Oracle and/or its affiliates. All Rights Reserved.
Viewing Salary Plan Gap Data
Access the Salary Plan Gap page (Workforce Analytics, Market Compensation, Analyze and Approve, Review Salary Plan Gap, Salary Plan Gap).
Salary Plan Gap page
Use this page to view a comparison of the compensation target rates against the midpoint of the range for the current salary grade.
For a particular salary plan, view the grade midpoint and target value for each job code and grade. The variance of the grade midpoint from the target value appears as a percentage amount. A positive value indicates that the grade midpoint exceeds the target value. A negative value indicates that the grade midpoint is below the target value.

Copyright © 1999, 2010, Oracle and/or its affiliates. All Rights Reserved. 43
Chapter 3
Managing Base Pay Structures
This chapter provides an overview of the Base Pay Structure module and discusses how to:
• Create a base pay structure scenario.
• Evaluate your base pay structure fit.
• Approve and publish base pay structures.
• Analyze your workforce compensation gap to market.
Understanding the Base Pay Structure Module
Base pay structures consist of a series of pay ranges or grades, each with a minimum and maximum value. Most organizations group job codes together into job classes, and then assign those job classes to pay structures. Organizations base these decisions on data from external compensation surveys, as well as their own internal criteria. Companies develop pay structures to support and reinforce their overall compensation strategy, as well as their compensation strategy for specific job codes. For example, a organization's overall compensation strategy might be to pay most of its workers at about the 40th percentile of the market. However, for job codes with essential technological or managerial skills, it might pay at the 80th percentile ofthe market. Companies also use pay structures to communicate pay range opportunity to employees, job candidates, and managers.
The Rewards Base Pay Structure module provides the tools to organize and automate the pay structure development process, so you can:
• Design, analyze, and revise multiple versions of multiple pay structures, including those from your HRMS system.
• Use the target rates from the Market Compensation module to build and evaluate new pay structures, in alignment with your compensation strategy.
• Compare the new structures to current workforce compensation.
• Select for approval the pay structures you prefer, and publish the results of your pay structure decisions.
Base Pay Structure Business Process
The following diagram outlines the main steps in the Base Pay Structure business process.

Managing Base Pay Structures Chapter 3
44 Copyright © 1999, 2010, Oracle and/or its affiliates. All Rights Reserved.
Base Pay Structure business process
Market Compensation Rates
If you plan on using market compensation rates to help you develop and evaluate base pay structures, then first complete the steps needed to import compensation survey data, and define market compensation rates foryour workforce.
See Also
PeopleSoft Enterprise Workforce Analytic Applications 9.1 PeopleBook, "Importing External Survey Data to Data Warehouse Tables"
Chapter 2, "Managing Market Compensation," page 5
Creating a Base Pay Structure Scenario
This section provides an overview of the Base Pay Structure module and discusses how to:
• Assign job codes to job classes.
• Create a base pay structure definition.
• Build the salary grades and ranges for your base pay structure.
• Build steps within a pay grade.

Chapter 3 Managing Base Pay Structures
Copyright © 1999, 2010, Oracle and/or its affiliates. All Rights Reserved. 45
• Assign a pay grade to each job code.
Understanding How to Create a Base Pay Structure Scenario
In the Base Pay Structure module you create base pay structures using online pages, and PeopleCode performs all of the calculations and system processing. In this module, you don't create scenarios in the same manner as you do in the other Workforce Rewards modules. There are no model or scenario definition pages to complete, and there are no Application Engine processes or jobstreams to run.
You use the Base Pay Structure tools to develop base pay structures that fit your organization's pay strategy, according to your target market rates. The basic process for creating base pay structure scenarios involves these steps:
• Assign groups of job codes to a job class, by associating the job class with a node on the JOBCODE tree.
• Create a pay structure definition for the job class. Use the market rates for benchmark jobs developed withthe Market Compensation module, or create new ones.
• Build salary grades and ranges.
• Build steps within pay grades, if applicable.
• For each job class, review the pay grades the system automatically assigns to benchmark jobs, and assign pay grades to the non-benchmark jobs.
Synchronizing Tables in the Base Pay Structure Module
The table behind the grid on the Job Class Definition page is WA_JOBCLS_SEQ. The table behind the grids on the Job Code / Grade Assignment, Structure Fit to Market, and Pay Structure Finalization pages is WA_JOBCLS_PAY. The data between the two tables is synchronized whenever one of the following events occurs:
1. You change and save data on the Job Class Definition page.
2. You change the effective date or job class on the Base Pay Structure Definition component.
This synchronization process works in the background, and affects the way you work with job classes in the Base Pay Structure module. Normally, if you create a job class on the Job Class Definition page and save the data, the system synchronizes the WA_JOBCLS_SEQ and WA_JOBCLS_PAY tables.
If you do not create job classes on the Job Class Definition page (and instead move the Job Class data in with Data Mover or ETL), however, you will not see any job codes on the grids based on the WA_JOBCLS_PAY table. This is because no event occurred to trigger the automatic synchronization of the two tables. That is, no job codes appear in the grids based on the WA_JOBCLS_PAY table until you open the job class on the Job Class Definition page, change something about the job class, and save the changes. This triggers the PeopleCode synchronization process.
For example, open the Job Class Definition page, change one of the job codes in the grid by selecting a value from the list of available options, change it back to what it was before, and click Save. While you have made no net changes to the job class, the page changes can still be saved, and the PeopleCode synchronization process is triggered.
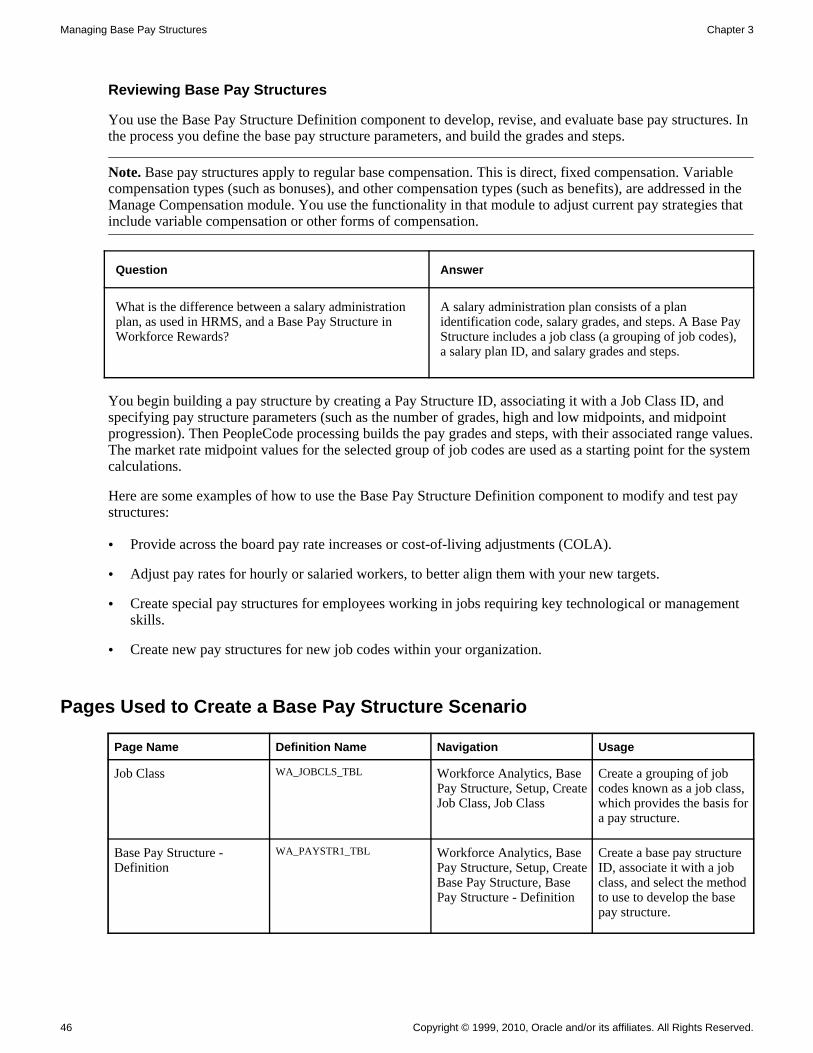
Managing Base Pay Structures Chapter 3
46 Copyright © 1999, 2010, Oracle and/or its affiliates. All Rights Reserved.
Reviewing Base Pay Structures
You use the Base Pay Structure Definition component to develop, revise, and evaluate base pay structures. In the process you define the base pay structure parameters, and build the grades and steps.
Note. Base pay structures apply to regular base compensation. This is direct, fixed compensation. Variable compensation types (such as bonuses), and other compensation types (such as benefits), are addressed in the Manage Compensation module. You use the functionality in that module to adjust current pay strategies that include variable compensation or other forms of compensation.
Question Answer
What is the difference between a salary administration plan, as used in HRMS, and a Base Pay Structure in Workforce Rewards?
A salary administration plan consists of a plan identification code, salary grades, and steps. A Base PayStructure includes a job class (a grouping of job codes), a salary plan ID, and salary grades and steps.
You begin building a pay structure by creating a Pay Structure ID, associating it with a Job Class ID, and specifying pay structure parameters (such as the number of grades, high and low midpoints, and midpoint progression). Then PeopleCode processing builds the pay grades and steps, with their associated range values.The market rate midpoint values for the selected group of job codes are used as a starting point for the systemcalculations.
Here are some examples of how to use the Base Pay Structure Definition component to modify and test pay structures:
• Provide across the board pay rate increases or cost-of-living adjustments (COLA).
• Adjust pay rates for hourly or salaried workers, to better align them with your new targets.
• Create special pay structures for employees working in jobs requiring key technological or management skills.
• Create new pay structures for new job codes within your organization.
Pages Used to Create a Base Pay Structure Scenario
Page Name Definition Name Navigation Usage
Job Class WA_JOBCLS_TBL Workforce Analytics, Base Pay Structure, Setup, CreateJob Class, Job Class
Create a grouping of job codes known as a job class, which provides the basis fora pay structure.
Base Pay Structure - Definition
WA_PAYSTR1_TBL Workforce Analytics, Base Pay Structure, Setup, CreateBase Pay Structure, Base Pay Structure - Definition
Create a base pay structure ID, associate it with a job class, and select the method to use to develop the base pay structure.

Chapter 3 Managing Base Pay Structures
Copyright © 1999, 2010, Oracle and/or its affiliates. All Rights Reserved. 47
Page Name Definition Name Navigation Usage
Base Pay Structure - Grades WA_GRADE_TBL Workforce Analytics, Base Pay Structure, Setup, CreateBase Pay Structure, Base Pay Structure - Grades
Build the grades and ranges for your base pay structure using the specified parameters.
Base Pay Structure - Steps WA_STEP_TBL Workforce Analytics, Base Pay Structure, Setup, CreateBase Pay Structure, Base Pay Structure - Steps
Build, view, and revise salary steps for each pay grade within the base pay structure.
Grade Assignment WA_JOBGRADE_TBL Workforce Analytics, Base Pay Structure, Setup, Assign Pay Grades, Grade Assignment
Assign a grade to each job code within a pay structure.
Assigning Job Codes to Job Classes
Access the Job Class page (Workforce Analytics, Base Pay Structure, Setup, Create Job Class, Job Class).
Job Class page
Using the Selection Criteria Group Box
Tree Node Select from the prompt list to indicate which node on the JOBCODE tree you want to associate with the job class

Managing Base Pay Structures Chapter 3
48 Copyright © 1999, 2010, Oracle and/or its affiliates. All Rights Reserved.
Attach When you click the Attach To List button, the system populates the grid at the bottom of the page with the job codes associated with the Tree Node you have selected.
Remove Click the Remove From List button to remove all the job codes associated with the specified Tree Node from the grid at the bottom of the page.
Using the Grid
Attach to List Click this button once the grid is populated.
Job Code This field becomes editable when you click the Attach to List button.
Note. The remaining fields are display-only.
You may edit the list by:
• Inserting additional rows of data (job codes).
• Adding groups of job codes to the list using the Selection Criteria group box.
• Removing rows of data (job codes) from the list.
In the grid the following fields display:
Job Code If you populated this field using the Selection Criteria group box, this Job Code is associated with the Tree Node you specified.
Target Indicates whether the Job Code has a target market rate developed from a benchmark job in the Market Compensation module.
Tree Node Tree Node to which this Job Code is associated.
Sal Plan (salary plan) Salary administration plan to which this Job Code is associated.
Currency Code Currency Code to which this Job Code is associated. Only one currency code canbe associated with a business unit or setID in PeopleSoft EPM.
Union Code Union Code to which this Job Code is associated, if any.
FLSA Status The classification of the Job Code under the U.S. Fair Labor Standards Act (FLSA), if any.
Creating a Base Pay Structure Definition
Access the Base Pay Structure - Definition page (Workforce Analytics, Base Pay Structure, Setup, Create Base Pay Structure, Base Pay Structure - Definition).

Chapter 3 Managing Base Pay Structures
Copyright © 1999, 2010, Oracle and/or its affiliates. All Rights Reserved. 49
Base Pay Structure - Definition page
Currency Code When the Structure Type is Use Current Pay Structure, the Currency Code for the associated Salary Administration Plan defaults to this field.
For all the other Structure Type options, the system bases the Currency Code on the setID base currency code.
Job Class ID Select for this pay structure from the prompt list values. Valid values are from the WA_JOBCLS_TBL table.
Rate Type Select the compensation frequency (Annual, Monthly, or Hourly) for the pay structure.
Pay Months/Year The number of pay months per year defaults to 12.0. You can change this value.
Pay Hours/Year The number of pay hours per year defaults to 2080. You can change this value.
Number of Grades Use this field to enter the number of salary grades used to build the pay structure.
Base Pay Structure Type
When you select any of the four options in the Base Pay Structure Type group box, you activate different combinations of fields on the Base Pay Structure - Definition page.

Managing Base Pay Structures Chapter 3
50 Copyright © 1999, 2010, Oracle and/or its affiliates. All Rights Reserved.
The following table provides a summary of the options, the fields activated on the Definition page when you select the option, and the purpose for selecting the option.
Base Pay Structure Type Fields Activated Purpose
Use Current Pay Structure Salary Plan ID
Rate Type
Pay Months/Year
Pay Hours/Year
Currency Code
This is the most frequently used option. Choose this option if you believe the pay structure currently in use is close to what you visualizefor the new one, with a few changes.
This enables you to copy the pay structure definition for an existing salary administration plan, and change or modify it as needed. It also enables you to use the existing grades and steps.
The system calculates the minimum, midpoint, and maximum rates, the range width percentage, and the midpoint progression percentage for each grade.
Define Ranges-Number of Grades Rate Type
Pay Months/Year
Pay Hours/Year
Number of Grades
Use Benchmarks For Range?
Midpoint of Lowest Grade
Midpoint of Highest Grade
Midpoint Progression Type
Change in Midpoint Progression (%)
Range Width (%)
Range Width Progression Type
Change In Range Width (%)
Choose this option if there is marketdata available for the job codes involved, and you know how many grades you want in the pay structure.
This option enables you to input thenumber of grades, the midpoint of the lowest and highest grades, the range width, the midpoint progression type, and the range width type.
On the Base Pay Grades page, the system calculates the minimum, midpoint, and maximum rates, the range width percentage, and the midpoint progression percentage foreach grade.

Chapter 3 Managing Base Pay Structures
Copyright © 1999, 2010, Oracle and/or its affiliates. All Rights Reserved. 51
Base Pay Structure Type Fields Activated Purpose
Define Midpoint Progression Rate Type
Pay Months/Year
Pay Hours/Year
Use Benchmarks For Range?
Midpoint of Lowest Grade
Midpoint of Highest Grade
Midpoint Progression (%)
Midpoint Progression Type
Change in Midpoint Progression (%)
Range Width (%)
Range Width Progression Type
Change In Range Width (%)
Choose this option if you know the percentage difference you would like to see between two successive grade midpoints.
This option enables you to input themidpoint of the lowest and highest grades, the midpoint progression percentage and type, and the range width percentage and type.
On the Base Pay Grades page, the system calculates the minimum, midpoint, and maximum rates, the range width percentage, and the midpoint progression percentage foreach grade.
Define Single Rate Grades Rate Type
Pay Months/Year
Pay Hours/Year
Number of Grades
Use Benchmarks For Range?
Midpoint of Lowest Grade
Midpoint of Highest Grade
Midpoint Progression Type
Change in Midpoint Progression (%)
Choose this option to create pay structures that are comprised of grades with no width. That is, there is no difference between the minimum rate, midpoint rate, and maximum rate for a particular grade. There can also be only one step in each grade.
This option enables you to input thenumber of grades, the midpoint for the lowest and highest grades, and the midpoint progression type.
On the Base Pay Grades page, the system calculates a single rate and the midpoint progression percentage for each grade.
Grade Range
Midpoint of Lowest Grade
The midpoint is the middle value in a pay range, halfway between the minimum and the maximum; it is calculated as (Minimum + Maximum) / 2. The field is populated in two ways, automatically by selecting the Use Benchmarks for Range check box, or manually, as described above. The values must correspond to the selected Rate Type.
Midpoint of Highest Grade
The midpoint is the middle value in a pay range, halfway between the minimum and the maximum; it is calculated as (Minimum + Maximum) / 2. The field is populated in two ways, automatically by selecting the Use Benchmarks for Range check box, or manually, as described above. The values must correspond to the selected Rate Type.

Managing Base Pay Structures Chapter 3
52 Copyright © 1999, 2010, Oracle and/or its affiliates. All Rights Reserved.
Use Benchmarks for Range?
When you select this check box, the system uses benchmark target market rates, for this job class, to populate the values for the Midpoint of Lowest Grade and Midpoint of Highest Grade fields with the lowest target market rate within the Job Class, and the highest target market rate within the job class, respectively.
If you do not select this check box, you must manually enter the corresponding annual, monthly or hourly values in the Midpoint of Lowest Grade and Midpoint of Highest Grade fields. The system uses these values to calculate the pay ranges,grades, and steps.
Progression
Midpoint Progression (%)
Enter the midpoint progression percent.
Midpoint progression is the distance from one midpoint to the next higher midpoint. Midpoint progression percentage is the percentage difference from onegrade midpoint to the next higher-grade midpoint, and is calculated as (midpoint2– midpoint1) / midpoint1.
Note. This field only displays if you select the Define Midpoint Progression option in the Base Pay Structure Type group box.
Range Width (%) The range width is the distance between the range minimum and maximum. It is calculated as (Maximum – Minimum) / Minimum. Range Width (%) is not a required field, but if you do not enter a value the system calculates salary grades where the minimum rates, midpoint rates, and maximum rates are all equal.
Midpoint Progression Type
Select a type of Constant or Increasing.
With Constant midpoint progression, the progression is equal between all adjacent pairs of grades in the pay structure. The percentage difference between successive midpoints does not change.
With Increasing midpoint progression, the progression is larger as you move up each adjacent pair of grades in the pay structure. The percentage difference between successive midpoints increases by the percentage specified.
Change in Midpt Progressn (%) (change inmidpoint progression percentage)
When you select a Midpoint Progression Type of Increasing, the Change in MdptProgressn (%) field is activated, enabling you to enter this value as a percentage.
Range Width Progression Type
Select a type of Constant or Increasing.
With Constant range width progression, the progression is equal between all adjacent pairs of grades in the pay structure. The system calculates the minimum and maximum values using the range width and midpoint values.
With Increasing range width progression, the progression is larger as you move up each adjacent pair of grades in the pay structure. The system calculates the minimum and maximum values using the range width and midpoint values. The value for the range width increases as you go up in grades, making the difference between the minimum and maximum greater.

Chapter 3 Managing Base Pay Structures
Copyright © 1999, 2010, Oracle and/or its affiliates. All Rights Reserved. 53
Change in Range Width (%)
When you select a Range Width Progression Type of Increasing, the Change in Range Width (%) field is activated, enabling you to enter this value as a percentage.
Building Salary Grades and Ranges
Access the Base Pay Structure - Grades page (Workforce Analytics, Base Pay Structure, Setup, Create Base Pay Structure, Base Pay Structure - Grades).
Base Pay Structure - Grades page
Use this page to review the effect of changes to the structure on the base pay grades, focus on the distance between midpoints of successive grades (midpoint progression), and evaluate the relative width of the ranges within grades. You can have the system calculate and enter the grade range and midpoint values, view the values calculated by the system, manually enter the values yourself, and manually revise specific values as needed.
Structure Type If you have selected a Structure Type of Use Current Pay Structure for this pay structure, PeopleCode populates the data in the grid at the bottom of the page. If you have specified parameters on the Definition page, PeopleCode uses these parameters to populate the data in the grid.

Managing Base Pay Structures Chapter 3
54 Copyright © 1999, 2010, Oracle and/or its affiliates. All Rights Reserved.
Steps for Using This Page
To use this page:
1. Click the Build Grades button to generate the salary grades for this pay structure.
2. Change the values directly in the grid as necessary (optional).
3. Choose a power of ten for rounding the salaries (optional) and click the Apply Rounding button. The system rounds the salaries accordingly. The system recalculates the Range Width and Midpoint Progression columns to reflect the new values.
4. Enter a percentage for adjusting the salaries (optional) and click the Adjust Grades and Steps button. The system adjusts the salaries accordingly.
Using the Build Grades Button
Build Grades Click this button to generate the salary grades for this pay structure. PeopleCode processing calculates the appropriate rates, range width and midpoint progressionvalues for each grade, using the parameters you specified on the Definition page. The system populates the grid with these calculated values.
Using the Grade Range Grid to View and Edit Salary Rate Data
Once you have built your base pay grades, with their associated rates, range width, and midpoint progression values, use the grid to view and edit the data as needed. The system helps you by recalculating values when you make changes. Here are some examples of how this works:
• When you input new or changed grades, the system leaves the remaining columns unchanged.
• When you change the Range Width (%) or Midpoint Progression (%) values, the system automatically recalculates the Minimum, Midpoint, and Maximum Rate values.
• When you input changes to the Midpoint Rate, the system recalculates the Minimum and Maximum Rate values. The value of the range width for that grade remains unchanged.
• When you change the Minimum Rate value, the system recalculates the Maximum Rate and Range Width(%).
• When you change the Maximum Rate, the system recalculates the Minimum Rate and Range Width (%).
Using the Adjust Grade and Step Rates Button
% to Adjust Rates and Adjust Grade and Step Rates
You can perform global adjustments to all the grade rates in the grid, and to the associated step rates in the Steps page, using the % to Adjust Rates field and the Adjust Grade and Step Rates button.
In % to Adjust Rates, enter the percentage amount you want to adjust the rates by. Enter a positive percentage to adjust the rates upward, or a negative percentage to adjust the rates downward.

Chapter 3 Managing Base Pay Structures
Copyright © 1999, 2010, Oracle and/or its affiliates. All Rights Reserved. 55
Click the Adjust Grade and Step Rates button. The system calculates the adjustedrates and displays the new results automatically. If the grades have associated steps, then the system also adjust the rates for the steps automatically.
Using the Apply Rounding Button
Round to Nearest Once you have built your grades, modify the values to fit the standard rounding rules of your organization. Use the list of Translate table values in the Round to Nearest field to specify a rounding rule to apply to your data.
Click the Apply Rounding button. The system rounds the salary rates accordingly. The system also recalculates the Range Width (%) and Midpoint Progression (%) columns to reflect the new numbers.
The output table that stores the data displayed in the grid is the WA_GRADE_TBL table.
Once you're satisfied with the salary grade structure you have created on this page, you have the option of moving to the Base Pay Structure - Steps page to create salary steps for your grades.
Building Steps within Pay Grades
Access the Base Pay Structure - Steps page (Workforce Analytics, Base Pay Structure, Setup, Create Base Pay Structure, Base Pay Structure - Steps).

Managing Base Pay Structures Chapter 3
56 Copyright © 1999, 2010, Oracle and/or its affiliates. All Rights Reserved.
Base Pay Structure - Steps page
Entering the Number of Steps for the Grade
If you have selected a Structure Type of Use Current Pay Structure and the current pay structure has steps forthis grade, then PeopleCode populates the steps and associated data in the Step Range grid at the bottom of the page. You can change these values as needed.
You can also build the steps manually.
To build steps manually:
1. Enter the number of Steps/Grade.
2. Select whether to build for the Current Grade Only, or for the Current and Following Grades by selecting the appropriate check box.
By selecting Current Grade Only, you can enter a different number of steps for each grade, or for any individual grade.
You can also enter the same number of steps for each grade by selecting Current and Following. Just navigate to the grade you want to use as the current grade. For example, if you want all the grades to have the same number of steps, select the first grade in the list as the current grade. Select the Current and Following Grades check box and click the Build Steps button. The system creates the same number of steps for the first grade and all grades below it in the list on the Grades page.
3. Click the Build Steps button. PeopleCode creates the steps in the Step Range grid at the bottom of the page.

Chapter 3 Managing Base Pay Structures
Copyright © 1999, 2010, Oracle and/or its affiliates. All Rights Reserved. 57
Using the Step Range Grid
Step You can change the Step designations if your organization uses something different from progressive whole numbers.
Hourly Rate, Monthly Rate, and Annual Rate
You can change the Hourly Rate, Monthly Rate, or the Annual Rate for a step. The system recalculates the other rates automatically, based on the values of Pay Months/Year and Pay Hours/Year specified on the Definition page.
Increment Hours and Increment Months
The Increment Hours and Increment Months columns identify when an employee's wages should automatically move up to the next salary step.
The output table that stores the data displayed in the grid is the WA_STEP_TBL table, whether the data is created by PeopleCode or input manually.
Once you have defined your base pay structure, the final step in the process is to assign a grade to each job code within a pay structure, using the Grade Assignment page.
Assigning Pay Grades to Jobs in a Pay Structure
Access the Grade Assignment page (Workforce Analytics, Base Pay Structure, Setup, Assign Pay Grades, Grade Assignment).
Grade Assignment page

Managing Base Pay Structures Chapter 3
58 Copyright © 1999, 2010, Oracle and/or its affiliates. All Rights Reserved.
Using the Grade Assignment Grid
Job Code The system places a row in the grid for each Job Code included in the Job Class for the selected Base Pay Structure. Any jobs for which there is market rate data are benchmark jobs.
Warning! To ensure the correct Job Codes populate the grid on this page, so thatyou can make grade assignments, it is essential that the Job Class and Base Pay Structure ID you specify when opening this page have the same effective date. The selected rows of data on the WA_JOBCLS_TBL and WA_PAYSTR_TBL tables must have the exactly the same effective date. If the Pay Structure has a row with an effective date that the Job Class does not have, the system displays no Job Codes for that particular effective date.
Viewing the Current Tab
On the Current tab you can view but not edit or change the following fields:
Salary Plan, Grade, and Grade Midpoint
For each job the system displays the current salary plan, salary grade, and annual Grade Midpoint rate information. Compare this data against the Market Rate and proposed salary rate information for the other grades.
Using the Proposed Tab
On the Proposed tab, edit the Grade and Step fields to perform your grade assignments. You can view the remainder of the fields.
Grade and Step For each benchmark job, the system automatically assigns it to the pay grade (and entry step if applicable) having a midpoint that is arithmetically closest to the job's target market rate. Review these grade and step assignments, and chooseto accept them, or override them if they need adjusting.
For non-benchmark jobs, the system has no market data and displays a Market Value of 0.00. Compare the current Grade Midpoint rate on the Current tab for a non-benchmark job to the proposed rates and target market rates for other job codes in the job class. Use this information to determine what you think is the best salary grade and step for that job. Then manually enter them in the Grade and Step columns. When you manually enter a new grade or step, and tab out of the field, the system automatically calculates the proposed Minimum Rate, Midpoint Rate, and Maximum Rate.
Market Value System processing populates this field if the pay Structure Type is Current Pay Structure, and some or all of the job codes in the job class have associated marketrates.
Variance % and Variance
For benchmark jobs, the system displays the variance between the Market Value and the Midpoint Rate to help you compare the two.

Chapter 3 Managing Base Pay Structures
Copyright © 1999, 2010, Oracle and/or its affiliates. All Rights Reserved. 59
Evaluating your Base Pay Structures
Evaluating your base pay structures means comparing how well your new or revised base pay structures match to what might be expected. The question you are attempting to answer is �Are my new base pay structures in line with my expectations?
To help you answer this question, we provide the following tools:
• Four Crystal reports to review your proposed pay structure definition.
• An inquiry page to evaluate the gap of your proposed base pay structure to the market rates.
If during this analysis and evaluation phase you find you are not satisfied with the base pay structures, return to the Job Class Definition, Base Pay Structure, and Grade Assignment pages and revise your pay structures. Once you are satisfied with the pay structures then you are ready to approve and publish the results.
Pages Used to Evaluate Your Base Pay Structure
Page Name Definition Name Navigation Usage
Proposed Pay Structure report
RUN_RWA_0008 Workforce Analytics, Workforce Reports, Base Pay Structure Reports, Proposed Pay Structure
Run the Proposed Pay Structure Crystal report (WAC0008).
Grade/Step Definition report
RUN_RWA_0009 Workforce Analytics, Workforce Reports, Base Pay Structure Reports, Grade/Step Definition
Run the Structure by Grade and Step Crystal report (WAC0009).
Job Class Definition report RUN_RWA_0010 Workforce Analytics, Workforce Reports, Base Pay Structure Reports, Job Class Definition
Run the Job Class Definition Crystal report (WAC0010).
Grade Assignment report RUN_RWA_0011 Workforce Analytics, Workforce Reports, Base Pay Structure Reports, Grade Assignment
Run the Grade Assignment Crystal report (WAC0011).
Structure Gap to Market inquiry
WA_MKT_STR_PRP_INQ Workforce Analytics, Base Pay Structure, Analyze and Approve, Review Structure Gap to Market, Structure Gap to Market
Assess the gap of your proposed base pay structure from target market rates developed using the Market Compensation module.

Managing Base Pay Structures Chapter 3
60 Copyright © 1999, 2010, Oracle and/or its affiliates. All Rights Reserved.
Running Base Pay Structure Crystal Reports
We provide four Crystal reports for reviewing your proposed base pay structure. The following tables lists thereports with a description. Samples of the reports are provided with your documentation.
Crystal Report Description
Proposed Pay Structure (WAC0008) Salary rate data for the grades within the proposed pay structure.
Grade / Step Definition (WAC0009) Proposed pay structures along with salary rate data for their grades and steps.
Job Class Definition (WAC0010) Salary plan data for the job codes within the job class.
Grade Assignment (WAC0011) Grade assignments and other proposed pay structure data for job codes within a pay structure and job class.
See Also
Appendix B, "Workforce Rewards Reports," page 183
Reviewing your Base Pay Structure Gap to Market
Access the Structure Gap to Market page (Workforce Analytics, Base Pay Structure, Analyze and Approve, Review Structure Gap to Market, Structure Gap to Market).

Chapter 3 Managing Base Pay Structures
Copyright © 1999, 2010, Oracle and/or its affiliates. All Rights Reserved. 61
Structure Gap to Market inquiry page
Review the gap of your proposed base pay structure from the target market rates developed in the Market Compensation module.
Job Code Job Class and Base Pay Structure ID
The page displays each Job Code in the Job Class of the Base Pay Structure ID.
The fields are the same as those described for the Grade Assignment page.
See Also
Chapter 3, "Managing Base Pay Structures," Assigning Pay Grades to Jobs in a Pay Structure, page 57
Approving and Publishing Base Pay Structures
Once you have evaluated your new or revised base pay structures, and are satisfied with the decisions you have made, you are ready to approve and publish the results of your decisions.
Page Used to Approve Base Pay Structures
Page Name Definition Name Navigation Usage
Pay Structure Approval WA_PAYFINAL_TBL Workforce Analytics, Base Pay Structure, Analyze and Approve, Approve Pay Structure, Pay Structure Approval
Approve and publish the results of your base pay structure decisions.

Managing Base Pay Structures Chapter 3
62 Copyright © 1999, 2010, Oracle and/or its affiliates. All Rights Reserved.
Approving Pay Structures
Access the Pay Structure Approval page (Workforce Analytics, Base Pay Structure, Analyze and Approve, Approve Pay Structure, Pay Structure Approval).
Pay Structure Approval page
Mapping the Base Pay Structure to a Salary Administration Plan
Salary Administration Plan
For each Base Pay Structure ID you want to approve and publish, select a corresponding Salary Administration Plan to which you want to map the base paystructure. This equates the salary grades and steps in the base pay structure to the salary grades and steps for a specific salary administration plan. The prompt list values are from the SAL_PLAN_R00 table.
Note. Don't click the Approve or Publish buttons without entering a salary administration plan. You cannot approve or publish without entering a plan.
When you enter data in the salary administration plan field and click the Approve button, the system performsthe following two actions:
1. The values for the base pay structure grades, ranges, and steps are written to the specified salary administration plan on the SAL_PLAN_R00, SAL_GRADE_D00 and SAL_STEP_D00 tables.
2. For each job code in this job class and effective date, the salary plan and grade are written to JOBCODE_D00.

Chapter 3 Managing Base Pay Structures
Copyright © 1999, 2010, Oracle and/or its affiliates. All Rights Reserved. 63
Include Grade Assignments
The salary administration field works together with the Include Grade Assignments check box. If you select the Include Grade Assignments check box, the system performs actions 1 and 2. This is what you typically want to do.
If you don't select the Include Grade Assignments check box, the system only performs action 1, but not action 2. This means that the system does not update JOBCODE_D00. You might want to do this is when you have made changes to the salary plan or the values of the grades or steps, but not to the job codes or grade assignments. In that case, you don't need to update JOBCODE_D00.
Once you have completed the Salary Administration Plan and Include Grade Assignments fields, Save your changes. Read the rest of this page discussion before using the Approve and Publish buttons.
Using the Grade Assignment Grid to Make a Decision
The data displayed in the grid is the same data displayed on the Structure Fit to Market inquiry page. Compare the proposed base pay structure rates to the market rates and the current midpoint rates, and decide if you want to approve and publish this data.
Note. The usual sequence to follow is to fill out the page, click Save and then click the Approval and Publishbuttons. If you click the buttons before saving any changes you have made to the page, those changes are not approved and published.
Using the Approve Button
When you click the Approve button, you are making a decision to write the new base pay structure data to thefollowing data warehouse tables:
1. SAL_PLAN_R00, SAL_GRADE_D00, SAL_STEP_D00, and JOBCODE_D00 if you select the Include Grade Assignments check box.
2. SAL_PLAN_R00, SAL_GRADE_D00 and SAL_STEP_D00 if you do not select Include Grade Assignments.
When the data is written to these tables, it is staged and available for publication. It is also available for use inthe Market Compensation module in Workforce Rewards.
Using the Publish Button with Application Messaging
When you click the Publish button, you are making a decision to use PeopleTools Application Messaging to publish the new base pay structure data. The message contains the new base pay structure data (salary plan, grade, step, and job code assignment). The Message Definitions are SAL_PLAN_SYNC, SAL_STRUCTURE_WFA_SYNC, and JOBCODE_SYNC.
Understanding the Relationship Between Approving and Publishing Base Pay Structures
You must first approve a pay structure before you publish that pay structure. Here is a table summarizing the sequence in which data is approved and published using the Pay Structure Approval page. The information presented in this table flows sequentially from left to right.

Managing Base Pay Structures Chapter 3
64 Copyright © 1999, 2010, Oracle and/or its affiliates. All Rights Reserved.
Define Base Pay Structure Tables
Approval Action Workforce Analytics Tables
Publishing Action
WA_PAYSTR_TBL WA_GRADE_TBL WA_STEP_TBL WA_JOBCLS_PAY
Click the Approve button,and the system sends datato data warehouse tables.
SAL_PLAN_R00 SAL_GRADE_D00 SAL_STEP_D00 JOBCODE_D00
Click the Publish button, and the system publishes (sends) an application message.
When you publish a pay structure, the system executes a series of checks to make sure changes have not been made to the pay structure since the last time it was approved.
For example, assume that yesterday you approved a pay structure called MSC1. Then today you went back and changed a monetary amount on one of the salary grades in the MSC1 pay structure. If you come back to this page to publish the pay structure, the system displays a warning message:
This message is a warning that the data you are attempting to publish is not up-to-date with the data currently used in the Base Pay Structure module. If you go ahead and publish the pay structure without first going back and re-approving it, outdated data that doesn't include the most recent changes is published. To correct this error, click Cancel, go back and click the Approve button, and then click the Publish button once more.
Analyzing your Workforce Compensation Gap to Market
You have created new base pay structures for your organization, approved them, and published them. Your next step is to evaluate whether your existing workforce compensation is in alignment with these new structures, and determine if it needs adjusting. This process involves analyzing the gap between the current workforce compensation and the new base pay structure targets you have created.
To help you answer this question we provide a Crystal Report to review your approved pay structure.
Page Used to Evaluate Your Workforce Compensation Gap to Market
Page Name Definition Name Navigation Usage
Approved Pay Structure report
RUN_RWA_0007 Workforce Analytics, Workforce Reports, Base Pay Structure Reports, Approved Pay Structure
Run the Approved Pay Structure Crystal report (WAC0007).
Running your Approved Pay Structure Crystal Report
We provide one Crystal report for reviewing your approved base pay structure. A sample of the report is provided with your documentation.

Chapter 3 Managing Base Pay Structures
Copyright © 1999, 2010, Oracle and/or its affiliates. All Rights Reserved. 65
Crystal Report Description
Approved Pay Structure (WAC0007) Review the approved pay structures, or salary plans, in your system, along with data about their associated grades and steps.
See Also
Appendix B, "Workforce Rewards Reports," page 183


Copyright © 1999, 2010, Oracle and/or its affiliates. All Rights Reserved. 67
Chapter 4
Managing Retention Strategy
This chapter provides an overview of the Workforce Retention Strategy module and discusses how to:
• Set up a retention strategy.
• Create a retention scenario.
• Evaluate retention scenarios.
• Approve retention scenarios.
Understanding the Retention Strategy Module
Companies such as yours face the challenge of attracting and retaining the best employees. Traditional turnover analyses provide only lagging indicators in explaining why employees have left. The Retention Strategy functionality in Workforce Rewards provides the tools to model your predictions about why employees may leave, and determine how those retention issues can affect your business.
With the Retention Strategy module you can:
• Set up complex business rules that define the selection and weighting rules for risk, cost, and value factors. Base them on calculations, key performance indicators, or on any data captured in the OperationalWarehouse - Enriched (OWE).
• Define decision rules that delineate the employees to track as high potential or high risk, employees to retain and a factor by which to retain them, and employees to reduce.
• Assess your employees attrition risk, as well as their internal value and replacement cost.
• Determine whom to retain or whom to lose, and determine the cost of retention investment for each individual.
• Track high potential employees .
• Evaluate the impact of current workforce programs on retention.
• Integrate the results of a finalized scenario with the Compensation Strategy module to determine your future strategy.
• Use this data to preempt market and competitive conditions, and reduce turnover in essential areas.
Retention Strategy Business Process
The following diagram outlines the main steps in the Retention Strategy business process.
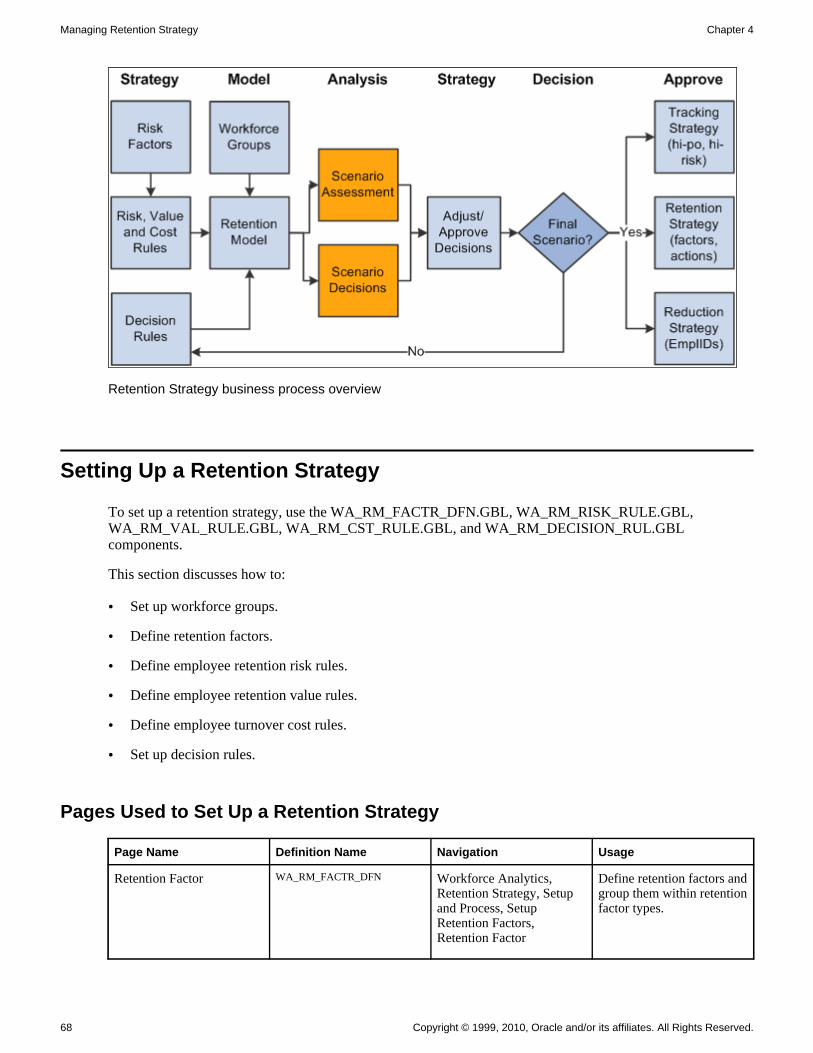
Managing Retention Strategy Chapter 4
68 Copyright © 1999, 2010, Oracle and/or its affiliates. All Rights Reserved.
Retention Strategy business process overview
Setting Up a Retention Strategy
To set up a retention strategy, use the WA_RM_FACTR_DFN.GBL, WA_RM_RISK_RULE.GBL, WA_RM_VAL_RULE.GBL, WA_RM_CST_RULE.GBL, and WA_RM_DECISION_RUL.GBL components.
This section discusses how to:
• Set up workforce groups.
• Define retention factors.
• Define employee retention risk rules.
• Define employee retention value rules.
• Define employee turnover cost rules.
• Set up decision rules.
Pages Used to Set Up a Retention Strategy
Page Name Definition Name Navigation Usage
Retention Factor WA_RM_FACTR_DFN Workforce Analytics, Retention Strategy, Setup and Process, Setup Retention Factors, Retention Factor
Define retention factors andgroup them within retentionfactor types.

Chapter 4 Managing Retention Strategy
Copyright © 1999, 2010, Oracle and/or its affiliates. All Rights Reserved. 69
Page Name Definition Name Navigation Usage
Risk Rule WA_RM_RISK_RULE Workforce Analytics, Retention Strategy, Setup and Process, Setup Risk Rules, Risk Rule
Define retention risk rules and assign a weight to each rule.
Value Rule WA_RM_VAL_RULE Workforce Analytics, Retention Strategy, Setup and Process, Setup Value Rules, Value Rule
Define a rule that assigns a value to retaining employees, based on criteriasuch as competencies, revenue generated, customer satisfaction, and so on.
Cost Rule WA_RM_CST_RULE Workforce Analytics, Retention Strategy, Setup and Process, Setup Cost Rules, Cost Rule
Define rules for assigning costs to losing an employee.This may include recruiting,replacement, lost revenue, or any other cost.
Decision Rule WA_RM_DEC_CRITERIA Workforce Analytics, Retention Strategy, Setup and Process, Setup DecisionRules, Decision Rule
Create your decision rules, and define the selection criteria applied to the retention assessments of risk, value, and cost.
Setting Up Workforce Groups for Retention Strategy Management
The first step in setting up your retention scenario is to define groups of employees based on data in the Operational Warehouse - Enriched (OWE) using the Workforce Groups component.
• Define one overall group for which you are going to do a retention analysis. For example, all active employees, or all employees in the western region, or all employees with an engineering job code.
• Define smaller groups within that overall group to which you can apply specific retention rules. For example, all employees with service less than five years, or employees with no training in the last year, or all employees who have a critical competency.
The Workforce Groups pages are described in the PeopleSoft Enterprise Workforce Analytic Applications 9.1 PeopleBook.
See Also
PeopleSoft Enterprise Workforce Analytic Applications 9.1 PeopleBook, "Setting Up Workforce Groups and Group Sets"
Defining Retention Factors
Access the Retention Factor page (Workforce Analytics, Retention Strategy, Setup and Process, Setup Retention Factors, Retention Factor).

Managing Retention Strategy Chapter 4
70 Copyright © 1999, 2010, Oracle and/or its affiliates. All Rights Reserved.
Retention Factor page
A retention factor is anything that influences whether an employee is inclined to leave or stay at their job. Later you use retention factor codes when you set up risk rules.
Select a Retention Factor Type from the available options. You must associate each factor with a factor type that places it in one of the four quadrants of total rewards. You can have multiple factors within each factor type. This one-to-many relationship enables roll up and drill-down analysis of the risk assessment and enablesyou to be as detailed as you require in your analysis. You use the retention factor in the risk rule definition. The retention factor types that are available and some examples of retention factors that fit into each type are:
Compensation Base compensation, bonus compensation, stock options
Benefits Child care, health and welfare, ESPP, 401(k)
Learning & Development Training, key competencies, mentor, key projects
Workplace Environment Manager, team, commute, activities, culture
Other Other factors you identify
In the Retention Strategy module, there is a hierarchical structure for retention risk assessment: from risk rule code to retention factor code to retention factor type. This hierarchical structure enables roll up and drill downanalysis of this dimension in the system.
Defining Employee Retention Risk Rules
Access the Risk Rule page (Workforce Analytics, Retention Strategy, Setup and Process, Setup Risk Rules, Risk Rule).

Chapter 4 Managing Retention Strategy
Copyright © 1999, 2010, Oracle and/or its affiliates. All Rights Reserved. 71
Risk Rule page
Use the Risk Rule setup page to define a retention risk rule, and assign a weight to the rule. Later you use riskrules in the model definition.
Compile Click this to have the system build, or compile, the underlying SQL.
Retention Factor Code Select a Retention Factor Code from the available options. You create retention factors on the Retention Factor setup page. Select the one that best relates to the retention risk rule you are creating. In the Retention Strategy module, there is a hierarchical structure for retention risk assessment: from risk rule code to retention factor code to retention factor type. This hierarchical structure enables roll up and drill down analysis of this dimension in the system.

Managing Retention Strategy Chapter 4
72 Copyright © 1999, 2010, Oracle and/or its affiliates. All Rights Reserved.
Retention Score Calculation
Select a Retention Score Calculation option from the list of valid values. This is the method the system uses to calculate the total retention risk score for this rule. The available options are:
• Score Only: A constant, fixed amount applied to each employee subject to this rule. For example, use this method to create a rule linked to employees with a highly desirable competency and give it a score of five. Each employee with the given competency gets a score of five added to their total retention risk score. Since the given competency is valuable, it adds to retention risk. When you select this option the system displays the Retention Score field.
• DataSet Amount: A calculation resolved for each employee subject to this rule, based on a Constraint. When you select this option the Constraint Code, Dimension, and Measure fields appear on the page.
• Resolved KPI Amount: A calculation based on a resolved KPI amount for each employee subject to this rule. The resolved KPI amount is the calculatedvalue of the KPI. When you select this option the KPI field appears on the page.
• Assessed KPI Amount: A calculation based on an assessed KPI amount for each employee subject to this rule. The assessed KPI value is a numeric valuefor the assessment, or scoring, of a KPI. The KPI is scored when the system calculates the KPI and compares it to its target value. When you select this option the KPI field appears on the page.
The Retention Score depicts the relative weight you think this rule has as a retention risk. Set up multiple rules with varying weights if you believe there is a different weight for different groups of people. For example, assume your organization does not offer child care, and believes this is a concern for all employees with children, but a larger concern for females. Then you may have a group of males with child dependants whom you relate to a risk rule with a score of 1x. You may then have a group of females with child dependants whom you relate to a different risk rule with a score of 2x. Enter a negative number to decrease a retention risk score.
The Constraint Code field is available if you selected a Retention Score Calculation of DataSet Amount. Constraints are collections of filters you use to define business rules for processing, and return desired data from a given DataMap. Select a constraint for the system to use to calculate risk values for every employee towhich the rule is applied. This field prompts values from constraints you define with the Constraint component. The prompt values for the Constraint Code field are from the PF_CONSTR_DEFN table.
Note. The system only allows the selection of constraints based on WA_JOB_S00 or JOB_F00. That is, the constraints must reference a DataMap that uses a TableMap whose primary table is WA_JOB_S00 or JOB_F00. If you want to include simulated employees (from Workforce Simulation process) in your group, create or select a constraint based on a TableMap with WA_JOB_S00 as the primary table. If you don't want to include simulated employees, then create or select a constraint based on a TableMap with JOB_F00 as the primary table.
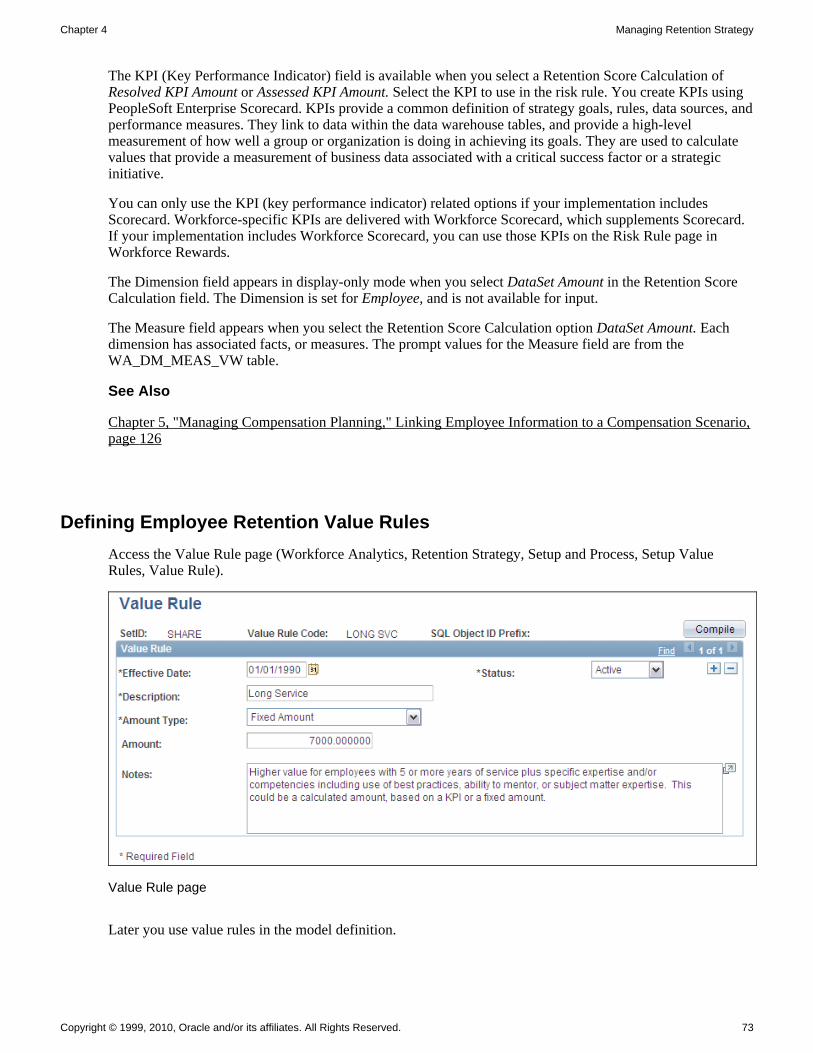
Chapter 4 Managing Retention Strategy
Copyright © 1999, 2010, Oracle and/or its affiliates. All Rights Reserved. 73
The KPI (Key Performance Indicator) field is available when you select a Retention Score Calculation of Resolved KPI Amount or Assessed KPI Amount. Select the KPI to use in the risk rule. You create KPIs using PeopleSoft Enterprise Scorecard. KPIs provide a common definition of strategy goals, rules, data sources, andperformance measures. They link to data within the data warehouse tables, and provide a high-level measurement of how well a group or organization is doing in achieving its goals. They are used to calculate values that provide a measurement of business data associated with a critical success factor or a strategic initiative.
You can only use the KPI (key performance indicator) related options if your implementation includes Scorecard. Workforce-specific KPIs are delivered with Workforce Scorecard, which supplements Scorecard. If your implementation includes Workforce Scorecard, you can use those KPIs on the Risk Rule page in Workforce Rewards.
The Dimension field appears in display-only mode when you select DataSet Amount in the Retention Score Calculation field. The Dimension is set for Employee, and is not available for input.
The Measure field appears when you select the Retention Score Calculation option DataSet Amount. Each dimension has associated facts, or measures. The prompt values for the Measure field are from the WA_DM_MEAS_VW table.
See Also
Chapter 5, "Managing Compensation Planning," Linking Employee Information to a Compensation Scenario,page 126
Defining Employee Retention Value Rules
Access the Value Rule page (Workforce Analytics, Retention Strategy, Setup and Process, Setup Value Rules, Value Rule).
Value Rule page
Later you use value rules in the model definition.

Managing Retention Strategy Chapter 4
74 Copyright © 1999, 2010, Oracle and/or its affiliates. All Rights Reserved.
Compile Click this to have the system build, or compile, the underlying SQL.
Select an Amount Type from the available options. This is the method used to calculate the total value amount for employees subject to this rule. The available options are:
Fixed Amount A constant amount applied to each employee subject to this rule. For example, use this method to create a rule linked to employees with a highly desirable competency and give it an amount of five. Each employee with the given competency gets an amount of five added to their total retention value. The givencompetency is valuable and adds to retention value. When you select this option the Amount field appears.
DataSet A calculation amount resolved for each employee subject to this rule. For example, use this method to create a rule linked to employees who have taken training classes in the past year. You specify a multiple of one for each class taken. Employees who have taken five classes have an amount of five added to their total retention value. The greater the number of classes, the greater the retention value. When you select this option the Constraint Code, Dimension, andMeasure fields appear.
Resolved KPI Amount The resolved KPI amount for each employee subject to this rule. The resolved KPI amount is the calculated value of the KPI. For example, use this method to create a rule linked to employees in a sales department. You specify a multiple ofone for each 1% increase in sales over the past year. Employees in a department with an increase in sales of 11% have an amount of 11 added to their total retention value. The greater the sales increase, the greater the retention value. When you select this option the KPI field appears.
Assessed KPI Amount The assessed KPI amount for each employee subject to this rule. The assessed KPI value is a numeric value for the assessment, or scoring, of a KPI. The KPI is scored when it is calculated and compared to its target value. For example, use this method to create a rule linked to employees in a sales department. You assess each sales target rating giving it one point per rating. Employees in a department with a high KPI assessment, say ten, on sales targets met have a scoreof ten added to their total retention value. The greater number the sales targets met by an employee, the higher the retention value. When you select this option the KPI field appears.
The Amount field is available if you selected an Amount Type of Fixed Amount. Enter the amount assessed toevery employee to which the rule is applied.
The Constraint Code field is available if you selected an Amount Type of DataSet. Constraints are collectionsof filters you use to define business rules for processing, and return desired data from a given DataMap. Select a constraint for the system to use to calculate value amounts for every employee to which the rule is applied. This field prompts values from constraints you define with the Constraint component. The prompt values for the Constraint Code field are from the PF_CONSTR_DEFN table.

Chapter 4 Managing Retention Strategy
Copyright © 1999, 2010, Oracle and/or its affiliates. All Rights Reserved. 75
Note. The system only allows the selection of constraints based on WA_JOB_S00 or JOB_F00. That is, the constraints must reference a DataMap that uses a TableMap whose primary table is WA_JOB_S00 or JOB_F00. If you want to include simulated employees (from the Workforce Simulation process) in your group, create or select a constraint based on a TableMap with WA_JOB_S00 as the primary table. If you don'twant to include simulated employees, then create or select a constraint based on a TableMap with JOB_F00 as the primary table.
The KPI (Key Performance Indicator) field appears if you select an Amount Type of Resolved KPI Amount orAssessed KPI Amount. Select the KPI to use in the value rule. You create KPIs using Scorecard. KPIs providea common definition of strategy goals, rules, data sources, and performance measures. They link to data within the data warehouse tables, and provide a high level measurement of how well a group or organization is doing in achieving its goals. They are used to calculate values that provide a measurement of business data associated with a critical success factor or a strategic initiative.
You can only use the KPI (Key Performance Indicator) related options if your implementation includes Scorecard. Workforce-specific KPIs are delivered with Workforce Scorecard, which supplements Scorecard. If your implementation includes Workforce Scorecard, you can use those KPIs in the Risk Rule page in Workforce Rewards.
The Dimension field appears in display-only mode when you select the DataSet option in the Amount Type field. The Dimension is set for Employee, and is not available for input.
The Measure field appears when you select the Amount Type option DataSet. Each dimension has associated facts, or measures. The prompt values for the Measure field are from the WA_DM_MEAS_VW table.
See Also
Chapter 5, "Managing Compensation Planning," Linking Employee Information to a Compensation Scenario,page 126
Defining Employee Turnover Cost Rules
Access the Cost Rule page (Workforce Analytics, Retention Strategy, Setup and Process, Setup Cost Rules, Cost Rule).

Managing Retention Strategy Chapter 4
76 Copyright © 1999, 2010, Oracle and/or its affiliates. All Rights Reserved.
Cost Rule page
Later you use cost rules in the model definition.
Compile Click this to have the system build, or compile, the underlying SQL.
Select an Amount Type from the available options. This is the method used to calculate the total cost amount for this rule. The available options are:
Fixed Amount A constant amount applied to each employee in the related workforce group. For example, use this method to create a rule linked to the cost to recruit a new employee and give it an amount of ten. Each employee subject to this rule gets anamount of ten added to their total retention cost. There is a cost to recruit a new employee and this adds to retention cost. When you select this option the Amountfield appears.
DataSet A calculation amount resolved for each employee subject to this rule. For example, use this method to create a rule linked to employees to reflect the cost to train a replacement. You specify a multiple of ten for each 10% of market salary. Employees for whom it would cost 20% of their salary to train their replacement have an amount of 20 added to their total retention cost. The greater the cost to train a replacement, the greater the retention cost. When you select this option the Constraint Code, Dimension, and Measure fields appear.
Resolved KPI Amount The resolved KPI amount for each employee subject to this rule. The resolved KPI amount is the calculated value of the KPI. For example, use this method to create a rule linked to the loss of sales for employees in a sales department. You specify a multiple of one for each 1% loss in sales when a position is not filled. Employees in a department where the loss of sales would be 15% have an amount of 15 added to their total retention cost. The greater the loss of sales, the greater the retention cost. When you select this option the KPI field appears.
Chapter 4 Managing Retention Strategy
Copyright © 1999, 2010, Oracle and/or its affiliates. All Rights Reserved. 77
Assessed KPI Amount The assessed KPI amount for each employee subject to this rule. The assessed KPI value is a numeric value for the assessment, or scoring, of a KPI. The KPI is scored when it is calculated and compared to its target value. For example, use this method to create a rule linked to the decrease in customer satisfaction in a sales department when a position is not filled. You assess each customer satisfaction rating giving it one point per rating. Employees in a department with a customer satisfaction KPI assessment of ten have a score of ten added to their total retention cost. The greater dissatisfaction by customers because of an unfilled position, the higher the retention cost. When you select this option the KPI field appears.
The Amount field is available if you selected an Amount Type of Fixed Amount. Enter the cost amount assessed to every employee to which the rule is applied.
The Constraint Code field is available if you selected an Amount Type of DataSet. Constraints are collectionsof filters you use to define business rules for processing, and return desired data from a given DataMap. Select a constraint for the system to use to calculate cost amounts for every employee to which the rule is applied. This field prompts values from constraints you define with the Constraint component. The prompt values for the Constraint Code field are from the PF_CONSTR_DEFN table.
Note. The system only allows the selection of constraints based on WA_JOB_S00 or JOB_F00. That is, the constraints must reference a DataMap that uses a TableMap whose primary table is WA_JOB_S00 or JOB_F00. If you want to include simulated employees (from the Workforce Simulation process) in your group, create or select a constraint based on a TableMap with WA_JOB_S00 as the primary table. If you don'twant to include simulated employees, then create or select a constraint based on a TableMap with JOB_F00 as the primary table.
The KPI (Key Performance Indicator) field appears if you select an Amount Type of Resolved KPI Amount orAssessed KPI Amount. Select the KPI to use in the cost rule. You create KPIs using the Scorecard. KPIs provide a common definition of strategy goals, rules, data sources, and performance measures. They link to data within the data warehouse tables, and provide a high-level measurement of how well a group or organization is doing in achieving its goals. They are used to calculate values that provide a measurement of business data associated with a critical success factor or a strategic initiative.
You can only use the KPI (Key Performance Indicator) related options if your implementation includes Scorecard. Workforce-specific KPIs are delivered with Workforce Scorecard, which supplements Scorecard. If your implementation includes Workforce Scorecard, you can use those KPIs in the Risk Rule page in Workforce Rewards.
The Dimension field appears in display-only mode when you select an Amount Type of DataSet. The Dimension is set for Employee, and is not available for input.
The Measure field appears when you select an Amount Type of DataSet. Each dimension has associated facts, or measures. The prompt values for the Measure field are from the WA_DM_MEAS_VW table.
See Also
Chapter 5, "Managing Compensation Planning," Linking Employee Information to a Compensation Scenario,page 126

Managing Retention Strategy Chapter 4
78 Copyright © 1999, 2010, Oracle and/or its affiliates. All Rights Reserved.
Setting Up Decision Rules
Access the Decision Rule page (Workforce Analytics, Retention Strategy, Setup and Process, Setup Decision Rules, Decision Rule).
Decision Rule page
On this page you define the selection criteria applied to the retention assessments of risk, value and cost. Later you use decision rules to relate to track, retain, or reduce decisions in the model definition.
Note. There is an implied 'and' term between the three group boxes, or sections, of this page. If you enter criteria in each section, the resulting selection logic says, Select if their Retention Risk section is true, and if their Retention Value section is true, and if their Retention Cost section is true.
Enter an effective date, status, description, and any notes.

Chapter 4 Managing Retention Strategy
Copyright © 1999, 2010, Oracle and/or its affiliates. All Rights Reserved. 79
Retention Risk
Total Score Retention Risk score you want to apply to this Decision Rule. You have the option to change the dimension of the score by selecting Less than or Equal to (<=), Greater than or Equal to (>=), or Equal to the Score (None). Changing the dimension is optional.
And/Or Modify the Total Retention Risk Score. You have the option to include a Factor Code (And), use a Factor Code in place of the Retention Risk Score, (Or), or not modify the Total Score (None). Modifying the Total Score is optional.
Selection Type Defines the grouping of the retention risk assessment on which you want to base your selection. Types available are: Retention Factor Code, Retention Factor Type, Retention Risk Rule, and None.
Factor Code If you chose a Selection Type of Retention Factor Code, this field becomes available for input. Select a Factor Code from the available options.
Factor Type If you chose a Selection Type of Retention Factor Type, this field becomes available for input. Select a Factor Type from the available options.
Risk Rule Code If you chose a Selection Type of Retention Risk Rule, this field becomes available. Select a Risk Rule Code from the available options.
Score If you chose a Selection Type of Retention Factor Code, Retention Factor Type, or Retention Risk Rule, select a score you want to apply to this Decision Rule. You have the option to change the dimension of the score by selecting Less than or Equal to (<=) or Greater than or Equal to (>=).
For example, you may define Select an employee for this decision if the Total Retention Risk Score is greater than or equal to 100, AND, using the Selection Type of Retention Risk Rule, the Risk Rule of HI COMMUTE is greater than or equal to 0.
Retention Value
Total Value Retention Value you want to apply to this Decision Rule. You have the option to change the dimension of the value by selecting Less than or Equal to (<=), Greater than or Equal to (>=), or Equal to the Score (None). Changing the dimension is optional.
And/Or Modify the Total Value. You have the option to include a Value Rule Code (And), use a Value Rule Code in place of the Total Value, (Or), or not modify theTotal Value (None). Modifying the Total Value is optional.
Value Rule Code If you chose to modify the Total Value, chose the Value Rule Code from the available options.

Managing Retention Strategy Chapter 4
80 Copyright © 1999, 2010, Oracle and/or its affiliates. All Rights Reserved.
Value If you chose to modify the Total Value with a Value Rule Code, select a value you want to apply to this Decision Rule. You have the option to change the dimension of the value by selecting Less than or Equal to (<=) or Greater than orEqual to (>=).
For example, you may define Select an employee for a decision if the Total Retention Value is greater than or equal to $70,000, AND the Value Rule Code of Web Development Skills is greater than or equal to $20,000.
Retention Cost
Total Cost Retention Cost you want to apply to this Decision Rule. You have the option to change the dimension of the cost by selecting Less than or Equal to (<=), Greaterthan or Equal to (>=), or Equal to the Score (None). Changing the dimension is optional.
And/Or Modify the Total Cost. You have the option to include a Cost Rule Code (And), use a Cost Rule Code in place of the Total Value, (Or), or not modify the Total Cost (None). Modifying the Total Cost is optional.
Cost Rule Code If you chose to modify the Total Cost, select the Cost Rule Code from the available options.
Cost If you chose to modify the Total Cost with a Cost Rule Code, select a cost you want to apply to this Decision Rule. You have the option to change the dimension of the cost by selecting Less than or Equal to (<=) or Greater than or Equal to (>=).
For example, you may define Select an employee for a decision if the Total Retention Cost is greater than or equal to $50,000, AND the Cost Rule Code of Recruiting Expense is greater than or equal to $30,000.
Creating a Retention Scenario
To create a retention scenario, use the WA_RM_MODEL_DEFN.GBL component.
This section provides an overview of how to create a retention scenario and discusses how to:
• Define the overall workforce group for a retention model.
• Relate risk rules to a retention model.
• Relate value rules to a retention model.
• Relate cost rules to a retention model.
• Relate track decision rules to a retention model.
• Relate retain decision rules to a retention model.
• Relate reduce decision rules to a retention model.

Chapter 4 Managing Retention Strategy
Copyright © 1999, 2010, Oracle and/or its affiliates. All Rights Reserved. 81
• Set up a scenario definition.
• Set up the process run control for running the scenario.
• Review the retention assignment process.
Understanding How to Create a Retention Scenario
The retention scenario ties together many of the rules and other elements you have set up. To create a retention scenario you perform the following steps:
1. Define a model consisting of a model ID, a group ID for analysis and, within that, assessment and decision rules and the groups to which each applies. This design enables you to mix, match, and reuse both your rules and your workforce groups.
2. Define a scenario consisting of a model with a time dimension.
3. Run the Retention Assignment Application Engine process (WA_RM_ASSIGN) to assess the workers in the specified groups, and assign them to groups of employees to retain, reduce and track.
Prerequisites
Before you can set up your Retention Model, you must set up model IDs using the EPM Foundation, BusinessMetadata, Business Framework, Models page. This page is documented in the Enterprise Performance Management Fundamentals 9.1 PeopleBook.
See Also
PeopleSoft Enterprise Performance Management Fundamentals 9.1 PeopleBook, "Setting Up Models and Scenarios," Defining Models and Scenarios
Pages Used to Create and Run a Retention Scenario
Page Name Definition Name Navigation Usage
Retention Model - Retention Model
WA_RM_MODEL_DFN Workforce Analytics, Retention Strategy, Setup and Process, Setup Retention Models, Retention Model
Select the overall workforcegroup you want to include in a retention model.
Retention Model - Risk Rules
WA_RM_MODEL_RISK Click the Risk Rules tab from a page in the RetentionModel component.
Designate the risk rules for a retention model.
Retention Model - Value Rules
WA_RM_MODEL_VALUE Click the Value Rules tab from a page in the RetentionModel component.
Designate the value rules for a retention model.

Managing Retention Strategy Chapter 4
82 Copyright © 1999, 2010, Oracle and/or its affiliates. All Rights Reserved.
Page Name Definition Name Navigation Usage
Retention Model - Cost Rules
WA_RM_MODEL_COST Click the Cost Rules tab from a page in the RetentionModel component.
Designate the cost rules for a retention model.
Retention Model - Track Decisions
WA_RM_MODEL_TRACK Click the Track Decisions tab from a page in the Retention Model component.
Designate the track decisionrules for a retention model.
Retention Model - Retain Decisions
WA_RM_MODEL_RETAIN Click the Retain Decisions tab from a page in the Retention Model component.
Designate the retain decision rules for a retention model.
Retention Model - Reduce Decisions
WA_RM_MODEL_REDUCE Click the Reduce Decisions tab from a page in the Retention Model component.
Designate the reduce decision rules for a retention model.
Retention Scenario Run Control
RUN_PF_JOBSTREAM Workforce Analytics, Retention Strategy, Setup and Process, Run Retention Scenario, Run Jobstream
Define the run control parameters and run the retention scenarios.
Defining the Overall Workforce Group for a Retention Model
Access the Retention Model page (Workforce Analytics, Retention Strategy, Setup and Process, Setup Retention Models, Retention Model).
Retention Model - Retention Model page

Chapter 4 Managing Retention Strategy
Copyright © 1999, 2010, Oracle and/or its affiliates. All Rights Reserved. 83
Model ID and Group ID When you add a retention model you have the option of selecting a Clone Model ID, if you want to use an existing model as the basis for the new model. The system populates the retention and decision rules from the existing model onto the remaining six pages of the component, but only after you specify a Group ID.You can then modify the rules and decisions to create your new model. Select theworkforce Group ID to be evaluated in this model. Only employees within this overall workforce group are evaluated.
Notes Enter any Notes as appropriate.
Note. On each of the six other pages in the Retention Model component, the system displays these fields at the top of the page: setID, Model ID, Effective Date, Status, Group ID and group Description.
Relating Risk Rules to a Retention Model
Access the Retention Model - Risk Rules page (Click the Risk Rules tab from a page in the Retention Model component).
Retention Model - Risk Rules page
Retention Risk
In the grid on this page you list all the retention risk rules you want to apply to the model.

Managing Retention Strategy Chapter 4
84 Copyright © 1999, 2010, Oracle and/or its affiliates. All Rights Reserved.
Group ID Enter a Group ID for each risk rule. In the Retention Model page, you defined theoverall workforce group that you want analyzed in your retention scenario. The rules can apply to the same workforce group you have specified for the model, ora subset of that workforce group.
Note. If your subset groups reference employees outside of the models overall group, they are not included in the scenario.
Risk Rule Code Enter a Risk Rule Code. The risk rule is applied to every employee in the workforce group you specify here. To enter multiple risk rules create additional rows.
Relating Value Rules to a Retention Model
Access the Retention Model - Value Rules page (Click the Value Rules tab from a page in the Retention Model component).
Retention Model - Value Rules page
Retention Value
In the grid on this page you list all the retention value rules you want to apply to the model.
Group ID Enter a Group ID for each value rule. In the Retention Model page, you defined the overall workforce group that you want analyzed in your retention scenario. The rules can apply to the same workforce group you have specified for the model, or a subset of that workforce group.
Note. If your subset groups reference employees outside of the models overall group, they are not included in the scenario.

Chapter 4 Managing Retention Strategy
Copyright © 1999, 2010, Oracle and/or its affiliates. All Rights Reserved. 85
Retention Value Rule Code
Enter a Retention Value Rule Code. The value rule is applied to every employee in the workforce group you specify here. To enter multiple value rules create additional rows.
Relating Cost Rules to a Retention Model
Access the Retention Model - Cost Rules page (Click the Cost Rules tab from a page in the Retention Model component).
Retention Model - Cost Rules page
Retention Cost
In the grid on this page you list all the retention cost rules you want to apply to the model.
Group ID Enter a Group ID for each cost rule. In the Retention Model page, you defined the overall workforce group that you want analyzed in your retention scenario. The rules can apply to the same workforce group you have specified for the model, or a subset of that workforce group.
Note. If your subset groups reference employees outside of the models overall group, they are not included in the scenario.
Retention Cost Rule Code
Enter a Retention Cost Rule Code. The cost rule is applied to every employee in the workforce group you specify here. To enter multiple cost rules create additional rows.
Relating Track Decision Rules to a Retention Model
Access the Retention Model - Track Decisions page (Click the Track Decisions tab from a page in the Retention Model component).

Managing Retention Strategy Chapter 4
86 Copyright © 1999, 2010, Oracle and/or its affiliates. All Rights Reserved.
Retention Model - Track Decisions page
Track
In the grid on this page you list all the track decision rules you want to apply to the model.
Decision Rule Select a Decision Rule to relate to employees that you want to track as being a high-retention risk and/or a high-potential employee.
High Risk Flag Select the High Risk Flag check box if you want to track the employees assessed by this decision rule as high risk.
For example, you may have a decision rule that selects high total risks and use that here, with the high risk flag check box selected, so you can monitor their career progress. You may also have a decision rule that selects high total values and use that here, with the high potential flag check box selected, so you can make sure their risk doesn't increase over time. You can select both check boxes, either box, or leave both clear.
To enter multiple decision rules create additional rows.
High Potential Flag Select the High Potential Flag check box if you want to track the employees assessed by this decision rule as high potential.
Relating Retain Decision Rules to a Retention Model
Access the Retention Model - Retain Decisions page (Click the Retain Decisions tab from a page in the Retention Model component).

Chapter 4 Managing Retention Strategy
Copyright © 1999, 2010, Oracle and/or its affiliates. All Rights Reserved. 87
Retention Model - Retain Decisions page
Retain
In the grid on this page you list all the retain decision rules you want to apply to the model.
Retention Factor Code Select a Retention Factor Code to identify a retention factor to act upon to retain employees.
Decision Rule Select a Decision Rule to relate to employees you want to act to retain.
For example, your decision rule may select employees with a high-risk score related to base pay being less than your market target. You may assign them to a retention factor code of Base Pay to indicate you want to act to increase their base pay. Or, you may assign them to a retention factor code of Bonus to indicateyou want to act to give them a one-time bonus.
To enter multiple retain decision rules create additional rows.
In the Compensation Strategy module, simulate taking action on this group by referencing this group of employees and assigning to them a Compensation Rule that increases base pay or provides a one-time bonus.
See Also
PeopleSoft Enterprise Workforce Analytic Applications 9.1 PeopleBook, "Setting Up Workforce Groups and Group Sets"
Relating Reduce Decision Rules to a Retention Model
Access the Retention Model - Reduce Decisions page (Click the Reduce Decisions tab from a page in the Retention Model component).
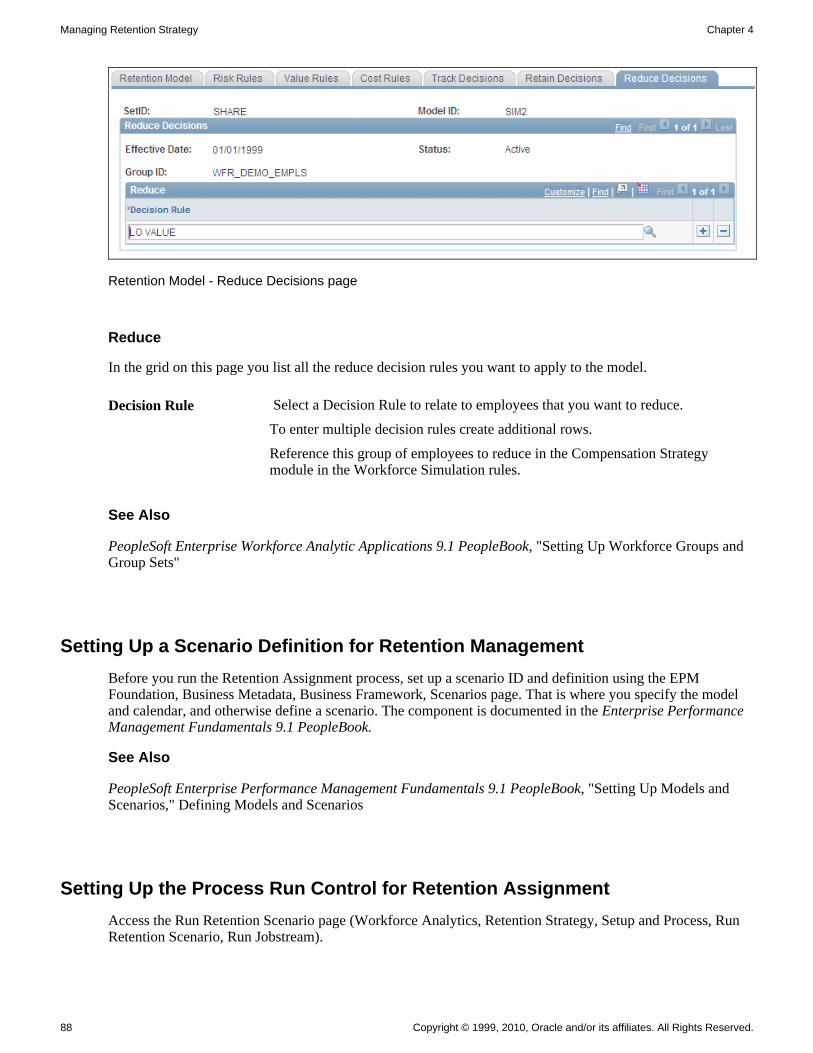
Managing Retention Strategy Chapter 4
88 Copyright © 1999, 2010, Oracle and/or its affiliates. All Rights Reserved.
Retention Model - Reduce Decisions page
Reduce
In the grid on this page you list all the reduce decision rules you want to apply to the model.
Decision Rule Select a Decision Rule to relate to employees that you want to reduce.
To enter multiple decision rules create additional rows.
Reference this group of employees to reduce in the Compensation Strategy module in the Workforce Simulation rules.
See Also
PeopleSoft Enterprise Workforce Analytic Applications 9.1 PeopleBook, "Setting Up Workforce Groups and Group Sets"
Setting Up a Scenario Definition for Retention Management
Before you run the Retention Assignment process, set up a scenario ID and definition using the EPM Foundation, Business Metadata, Business Framework, Scenarios page. That is where you specify the model and calendar, and otherwise define a scenario. The component is documented in the Enterprise Performance Management Fundamentals 9.1 PeopleBook.
See Also
PeopleSoft Enterprise Performance Management Fundamentals 9.1 PeopleBook, "Setting Up Models and Scenarios," Defining Models and Scenarios
Setting Up the Process Run Control for Retention Assignment
Access the Run Retention Scenario page (Workforce Analytics, Retention Strategy, Setup and Process, Run Retention Scenario, Run Jobstream).

Chapter 4 Managing Retention Strategy
Copyright © 1999, 2010, Oracle and/or its affiliates. All Rights Reserved. 89
The run control definition includes these basic elements:
• Business unit
• Scenario ID
• Fiscal year and accounting period
• Jobstream ID
Scenario ID
The scenario ID you select using this page must be a Forecasted scenario.
Fiscal Year and Accounting Period
Run retention scenarios for a fiscal year and accounting period. Do not run them based on an as of dated jobstream.
Jobstream ID
When you use the Run Retention Scenario page you can access and run other jobstreams, but this is the basic jobstream and engine delivered with the Retention Strategy module:
Jobstream ID Job ID Application Engine ID
WA_RETENT WA_RETENT, RM_MERGE WA_RM_ASSIGN, PF_MERGE
Reviewing the Retention Assignment Process
When you run the retention management jobstream, you do not have to run the Workforce Simulation process. The Retention Assignment process fills the WA_JOB_S00 temporary table with historical information from JOB_F00. The Final Table Merge process moves the results to the WA_JOB_S00 permanent table.
The Retention Assignment process calculations use the groups and rules that apply to the specified business unit, setID, model ID, and scenario ID. It calculates the risk scores, value amounts, and cost amounts for employees in the groups. Aggregated information is placed in the WA_RM_TRACK_T, WA_RM_RETN_T, WA_RM_RDCE_T temporary tables. Then the Final Table Merge process populates the following final tables:
Table Purpose
WA_RM_SCEN_FIN Scenario approval table, for every retention management scenario run.
WA_RM_SUM_F00 Retention assessment results, aggregated results for risk,value, and cost by employee.

Managing Retention Strategy Chapter 4
90 Copyright © 1999, 2010, Oracle and/or its affiliates. All Rights Reserved.
Table Purpose
WA_RM_DET_R_F00 Retention risk assessment results.
WA_RM_DET_V_F00 Retention value assessment results.
WA_RM_DET_C_F00 Retention cost assessment results.
WA_RM_TRACK_F00 Tracking decision results.
WA_RM_RETN_F00 Retain decision results.
WA_RM_RDCE_F00 Reduce decision results.
Reviewing Retention Strategy Scenario Data with Workforce Rewards Data Mart
When you run the Retention Assignment process (WA_RM_ASSIGN), the system also calls the Retention Scenario Data Mart process (WA_RM_FACT), which updates the Workforce Rewards Data Mart. This keepsthe data for the Data Mart and the Workforce Rewards tables synchronized. You can also run the Retention Scenario Data Mart process alone, to populate the fact tables for prior periods without having to run the WA_RM_ASSIGN process.
The following table lists the input tables used to populate the Data Mart fact tables:
Reporting Area Input Table (D00, R00, and F00) Output Table (Fact)
Retention Management Uses TEMP tables of the following:WA_RM_SUM_F00, WA_RM_DET_C_F00, WA_RM_DET_R_F00, WA_RM_DET_V_F00, WA_JOB_S00, LOCATION_D00
WA_RM_ASMT_FACT: The final output table of the assessment portion of the engine. Contains all the fact fields required from the assessment portion of the engine based on the retention rules for risk,cost, and value for the appropriate scenario.
Retention Management Uses TEMP tables of the following:WA_RM_SUM_F00, WA_RM_TRACK_F00, WA_RM_RETN_F00, WA_RM_RDCE_F00, WA_JOB_S00, LOCATION_D00
WA_RM_DECN_FACT: The final output table of the decision portion of the engine. Contains all the fact fields required from the decision portion of the engine. Assigns retain, reduce, and track decisions to employees.
In Retention Strategy the fact table data is accessed by delivered inquiry pages in the Retention Scenario inquiry component. You also have the option of selecting a business intelligence application of your own choice, and developing analysis templates for use with Retention Strategy.

Chapter 4 Managing Retention Strategy
Copyright © 1999, 2010, Oracle and/or its affiliates. All Rights Reserved. 91
Evaluating Your Retention Scenario
This section provides an overview of how to evaluate your retention scenario and discusses how to:
• Run Crystal reports to evaluate your retention scenario.
• Review a high-level summary of your retention scenario.
• Review decisions and assessments.
• Review risk, value, and cost rule details.
• Review employee details.
Understanding How to Evaluate Your Retention Scenario Results
Once you have created a scenario and run the Retention Assignment process, your next step is to evaluate your retention scenario results and determine if the scenario needs adjusting. Analyzing and reviewing your retention scenario is an iterative process. If you don't think the data output from your scenario is satisfactory, go back to the various setup steps outlined in this chapter and change the groups and rules as needed. Then run the Retention Assignment process again, and analyze and review the results. You keep doing this until you are satisfied with the results. To help you evaluate your retention scenario we provide the following tools:
• Six Crystal reports, to review the rules and models you have created.
• The Retention Scenario inquiry component comprising nine inquiry pages, to review the scenario assessments, and the track, retain, and reduce decisions.
Retention Scenario Inquiry Component
The Retention Scenario inquiry component consists of nine pages, each of which are discussed in detail in thefollowing sections. You specify a business unit, scenario ID and time period to enter the component. Use these pages to review the data from the WA_RM_ASMT_FACT and WA_RM_DECN_FACT tables, after the Retention Assignment engine is run. The component initially opens to a summary page, but you can navigate into individual pages detailing the scenario results for the retention rules, decision rules, and employee assessments.
Note. This component contains confidential information at both the scenario and employee level. Depending upon your implementation of row-level security, the scenarios and employees a user sees in the Retention Scenario inquiry pages can vary depending upon their level of security access. If you implement row-level scenario security, and a user doesn't have security access for a given scenario, they cannot see it. If you implement row-level employee security, and a user doesn't have security access to see an employee, they won't.

Managing Retention Strategy Chapter 4
92 Copyright © 1999, 2010, Oracle and/or its affiliates. All Rights Reserved.
Pages Used to Evaluate a Retention Scenario
Page Name Definition Name Navigation Usage
Retention Risk Factor report RUN_RWA_0030 Workforce Analytics, Workforce Reports, Retention Strategy Reports, Risk Factor, Retention Risk Factor
Run the Risk Factor Definition Crystal Report (WAC0030).
Retention Risk Rule report RUN_RWA_0029 Workforce Analytics, Workforce Reports, Retention Strategy Reports, Risk Rule, Retention Risk Rule
Run the Risk Rule Crystal Report (WAC0029).
Retention Value Rule report RUN_RWA_0031 Workforce Analytics, Workforce Reports, Retention Strategy Reports, Value Rule, Retention Value Rule
Run the Value Rule Crystal Report (WAC0031).
Retention Cost Rule report RUN_RWA_0032 Workforce Analytics, Workforce Reports, Retention Strategy Reports, Cost Rule, Retention Cost Rule
Run the Cost Rule Crystal Report (WAC0032).
Retention Decision Rule report
RUN_RWA_0033 Workforce Analytics, Workforce Reports, Retention Strategy Reports, Decision Rule, Retention Decision Rule
Run the Decision Rule Crystal Report (WAC0033).
Retention Model report RUN_RWA_0034 Workforce Analytics, Workforce Reports, Retention Strategy Reports, Retention Model
Run the Retention Model Crystal Report (WAC0034).
Retention Scenario - Scenario Summary
WA_RM_SUMMARY Workforce Analytics, Retention Strategy, Analyzeand Approve, Review Retention Scenario, Scenario Summary
Review a high-level summary of the decisions, and the risk, value and cost rules. This is the central page of the Retention Scenario component, from which you access the other Retention Scenario inquiry pages.
Retention Scenario - Reduce Decisions
WA_RM_DECRED Click the Reduce Decisions link from the Scenario Summary page or other pages in the Retention Scenario component.
Review a list of employees who were assigned a reduceaction in a scenario, including their aggregate risk, value, and cost.

Chapter 4 Managing Retention Strategy
Copyright © 1999, 2010, Oracle and/or its affiliates. All Rights Reserved. 93
Page Name Definition Name Navigation Usage
Retention Scenario - Track Decisions
WA_RM_DECTRK Click the Track Decisionslink from the Scenario Summary page, or other pages in the Retention Scenario component.
Review a list of all the employees assigned a track decision in a scenario, including each employee's aggregate risk, value, and cost. Employees are assigned a track decision during scenario processing, if they are assessed by the system as having either a high potential for future development, or a high risk for leaving the organization.
Retention Scenario - Retain Decisions
WA_RM_DECRET Click the Retain Decisions link from the Scenario Summary page, or other pages in the Retention Scenario component.
Review a list of all employees who were assigned a retain action in a scenario, including their aggregate risk, value and cost.
Retention Scenario - Employee Assessments
WA_RM_ASMT Click the Assessments link from the Scenario Summarypage, or the pages in the Retention Scenario component.
Review a list of all the employees who were assessed in a scenario, including each employee's aggregate risk, value, and cost.
Retention Scenario - Cost Rule Detail
WA_RM_CSTDET Click the Cost Rules link from the Scenario Summarypage, or other pages in the Retention Scenario component.
Review a summary of the cost rules and employee assessments included in the specified retention scenario.
Retention Scenario - Risk Rule Detail
WA_RM_RSKDET Access this page by clickingthe Risk Rules link from theScenario Summary page, or the other pages in the Retention Scenario component.
Review a summary of the risk rules and employee assessments included in the specified retention scenario.
Retention Scenario - Value Rule Detail
WA_RM_VALDET Click the Value Rules link from the Scenario Summarypage, or other pages in the Retention Scenario component.
Review a summary of the value rules and employee assessments included in the specified retention scenario.

Managing Retention Strategy Chapter 4
94 Copyright © 1999, 2010, Oracle and/or its affiliates. All Rights Reserved.
Page Name Definition Name Navigation Usage
Retention Scenario - Employee Detail
WA_RM_EEDET Click a particular employee listed on the Employee Assessments, Track Decisions, Reduce Decisions, or Retain Decisions page. The page can also be accessed by clicking the Employee Detail link at the bottom of every page in the Retention Scenario component.
Review details about an employee's risk score, and value and cost assessments.
Running Crystal Reports to Evaluate Your Retention Scenario
Run these Crystal reports to review your scenario:
• Risk Factor Definition report (WAC0030). Use this report to review the retention factors you have defined.
• Risk Rule report (WAC0029). Use this report to review the retention risk rules you have defined.
• Value Rule report (WAC0031). Use this report to review the value rules you have defined.
• Cost Rule report (WAC0032). Use this report to review the retention cost rules you have defined.
• Decision Rule report (WAC0033). Use this report to review the decision rules you have defined.
• Retention Model report (WAC0034). Use this report to review the assessment, and decision rules, included in the retention model you have defined.
See Also
Appendix B, "Workforce Rewards Reports," page 183
Reviewing a High-Level Summary of Your Retention Scenario
Access the Retention Scenario - Scenario Summary page (Workforce Analytics, Retention Strategy, Analyze and Approve, Review Retention Scenario, Scenario Summary).

Chapter 4 Managing Retention Strategy
Copyright © 1999, 2010, Oracle and/or its affiliates. All Rights Reserved. 95
Retention Scenario - Scenario Summary inquiry page 1 of 2

Managing Retention Strategy Chapter 4
96 Copyright © 1999, 2010, Oracle and/or its affiliates. All Rights Reserved.
Retention Scenario - Scenario Summary inquiry page 2 of 2
When this page opens, the system displays the Business Unit, Scenario ID, Period, As of Date, Currency and scenario Approval Status at the top of the page. The system also displays navigation links to the other pages in the component. The system displays these same fields and links at the top of each of the other pages in the component.
Scenario Decisions
The system displays high-level information about the decisions resulting from the scenario. On the left the data is displayed in a bar chart that shows the employee count by decision type. On the right the information is displayed in a table with two columns, Decision Type and Employee Count. The values for decision type are as follows:
Track The number of persons in the specified scenario whose risk assessment placed them on the list of employees to track. Click the Track link to access the Track Decisions page.
Retain The number of persons in the specified scenario whose risk assessment placed them on the list of employees to retain. Click the Retain link to access the RetainDecisions page.

Chapter 4 Managing Retention Strategy
Copyright © 1999, 2010, Oracle and/or its affiliates. All Rights Reserved. 97
Reduce The number of persons in the specified scenario whose risk assessment placed them on the list of employees to reduce. Click the Reduce link to access the Reduce Decisions page.
As you scroll down the page the system displays the Risk Rule Summary, Value Rule Summary, and Cost Rule Summary group boxes.
Risk, Value, and Cost Summary Group Boxes
In each group box the system displays summary data both graphically (in a bar chart to the left) and in a table (to the right).
Risk Rule Summary The system displays the risk rules included in the scenario and the aggregate RiskScore for each rule. Click any Risk Rule listed to access the Risk Rule Detail page for that risk rule.
Value Rule Summary The system displays the value rules included in the scenario and the aggregate Value Amount for each rule. Click any Value Rule listed to access the Value Rule Detail page.
Cost Rule Summary The system displays the cost rules included in the scenario and the aggregate Cost Amount for each rule. Click any Cost Rule listed to access the Cost Rule Detail page.
Reviewing Decisions and Assessments
Access the Retention Scenario - Track Decisions page (Click the Track Decisions link from the Scenario Summary page, or other pages in the Retention Scenario component.).

Managing Retention Strategy Chapter 4
98 Copyright © 1999, 2010, Oracle and/or its affiliates. All Rights Reserved.
Retention Scenario - Track Decisions page 1 of 2

Chapter 4 Managing Retention Strategy
Copyright © 1999, 2010, Oracle and/or its affiliates. All Rights Reserved. 99
Retention Scenario - Track Decisions page 2 of 2
Decision-Related Inquiry Pages
The following four decision-related inquiry pages in the Retention Scenario component are almost identical intheir layout and the fields they contain:
• Track Decisions
• Reduce Decisions
• Retain Decisions
• Employee Assessments
For this reason this documentation provides the example screen of only the Track Decisions page. The other pages look much the same. For the same reason this documentation discusses the fields for all five of these pages just once in the following paragraphs.
On each page the system displays a bar chart. The chart summarizes, for each employee in the scenario assessed with a track, reduce, or retain decision, their risk score, value amount and cost amount. On each page, in the table below the bar chart, the system displays various combinations of the following fields:
Employee ID and Personal Name
The employee identification number, and name, of the employee. Click any Employee ID listed to access the Employee Detail page.
Department The department to which the employee belongs.

Managing Retention Strategy Chapter 4
100 Copyright © 1999, 2010, Oracle and/or its affiliates. All Rights Reserved.
Job Code The code for the employee's job.
Reason The system displays the reason why the employee is assessed with a track decision. The employee is assessed as High Risk, High Potential, High Risk and High Potential, or None.
Action The system displays the Action field when an employee is assessed a retain decision. You can edit this field. Use it to select an action your organization can take to help retain this employee. The action is the retention factor code you usedon the Retention Model - Retain Decisions setup page. The values for this table are from the Retention Factor table.
Risk Score The employee's risk score assessed during scenario processing.
Value Amount The employee's value to the organization, assessed during scenario processing.
Cost Amount The employee's cost to the organization, assessed during scenario processing.
Reviewing Risk, Value and Cost Rule Details
Access the Retention Scenario - Cost Rule Detail page (Click the Cost Rules link from the Scenario Summarypage, or other pages in the Retention Scenario component.).

Chapter 4 Managing Retention Strategy
Copyright © 1999, 2010, Oracle and/or its affiliates. All Rights Reserved. 101
Retention Scenario - Cost Rule Detail page 1 of 2

Managing Retention Strategy Chapter 4
102 Copyright © 1999, 2010, Oracle and/or its affiliates. All Rights Reserved.
Retention Scenario - Cost Rule Detail page 2 of 2
Rule-Related Inquiry Pages
The following three rule-related inquiry pages from the Retention Scenario component are almost identical in their layout and the fields they contain:
• Risk Rule Detail
• Value Rule Detail
• Cost Rule Detail
For this reason this documentation provides the example screen of only the Cost Rule Detail page. The other pages look much the same. For the same reason this documentation discusses the fields for all three of these pages just once, in the following paragraphs.
On each page the system displays either the Risk Rule, Value Rule or Cost Rule field just above a bar chart. Navigate to each of the risk rules, values rules, or cost rules included in the scenario. For each rule a bar chartsummarizes, for each employee assessed in the scenario, their risk score, value amount or cost amount. On each page, in the table below the bar chart, the system displays various combinations of the following fields:
Employee ID and Personal Name
The employee identification number, and name, of the employee. Click any Employee ID listed to access the Employee Detail page.
Department The department to which the employee belongs.

Chapter 4 Managing Retention Strategy
Copyright © 1999, 2010, Oracle and/or its affiliates. All Rights Reserved. 103
Job Code The code for the employee's job.
Risk Score The system displays the employee's assessed risk score for a risk rule.
Value Amount The system displays the employee's assessed value amount for a value rule.
Cost Amount The system displays the employee's assessed cost amount for a cost rule.
Reviewing Employee Details
Access the Retention Scenario - Employee Details page (Click a particular employee listed on the Employee Assessments, Track Decisions, Reduce Decisions, or Retain Decisions page. The page can also be accessed by clicking the Employee Detail link at the bottom of every page in the Retention Scenario component.).
Retention Scenario - Employee Details page 1 of 2

Managing Retention Strategy Chapter 4
104 Copyright © 1999, 2010, Oracle and/or its affiliates. All Rights Reserved.
Retention Scenario - Employee Details page 2 of 2
Employee ID The system displays the employee identification number and name of the employee.
Total Risk Score The system displays the total risk score assessed for an employee during scenarioprocessing.
Total Value Amount The system displays the employee's value to the organization, assessed during scenario processing.
Total Cost Amount The system displays the employee's cost to the organization, assessed during scenario processing.
Note. If, in your implementation, this page is much longer than you can view on a single screen, use the right side scroll bar to view the remainder of the page.
As you scroll down the page the system displays the Risk Rule Summary, Value Rule Summary, and Cost Rule Summary boxes, as shown in the example below.
Chapter 4 Managing Retention Strategy
Copyright © 1999, 2010, Oracle and/or its affiliates. All Rights Reserved. 105
Risk, Value, and Cost Summary
In each box the system displays summary data both graphically (in a bar chart to the left) and in a table (to theright).
Risk Rule Summary The system displays the risk rules applied to this employee in the scenario, and their total Risk Score for each rule.
Value Rule Summary The system displays the value rules applied to this employee in the scenario, and their total Value Amount for each rule.
Cost Rule Summary The system displays the cost rules applied to this employee in the scenario, and their total Cost Amount for each rule.
Approving Your Retention Scenario
This section provides an overview of how to approve your retention scenario and discusses how to:
• Review and modify your track decision results.
• Review and modify your retain decision results.
• Review and modify your reduce decision results.
• Approve your scenario results.
Understanding Retention Scenario Approval
Once you're satisfied with the results of your retention scenario, then it's time to approve the scenario using the Scenario Approval component to manually review your results and make any needed modifications beforeyou approve the scenario.
Note. In addition to PeopleTools page security, you can strictly limit access to scenarios for approval using scenario-level security. This means, if an operator doesn't have security access for a given scenario, they cannot approve it. If you grant an operator access to a scenario approval page and a scenario, they have accessto all scenario data within that scenario approval page to enabling them to view all the data they are approving. Therefore, for those operators to whom you have granted such security, you may also want to grant them employee-level security for all employees within their scenarios. This enables them to review all the employees on other pages with employee-level security, such as the inquiry pages.
To use this component follow these steps:
1. Use the Track, Retain and Reduce Decisions pages to review the scenario results, modify the results as needed, and determine if you are satisfied with the decisions.
2. Access the Scenario Approval page ( to review the scenario status and other information. Approve the scenario results, by clicking the Approval button.
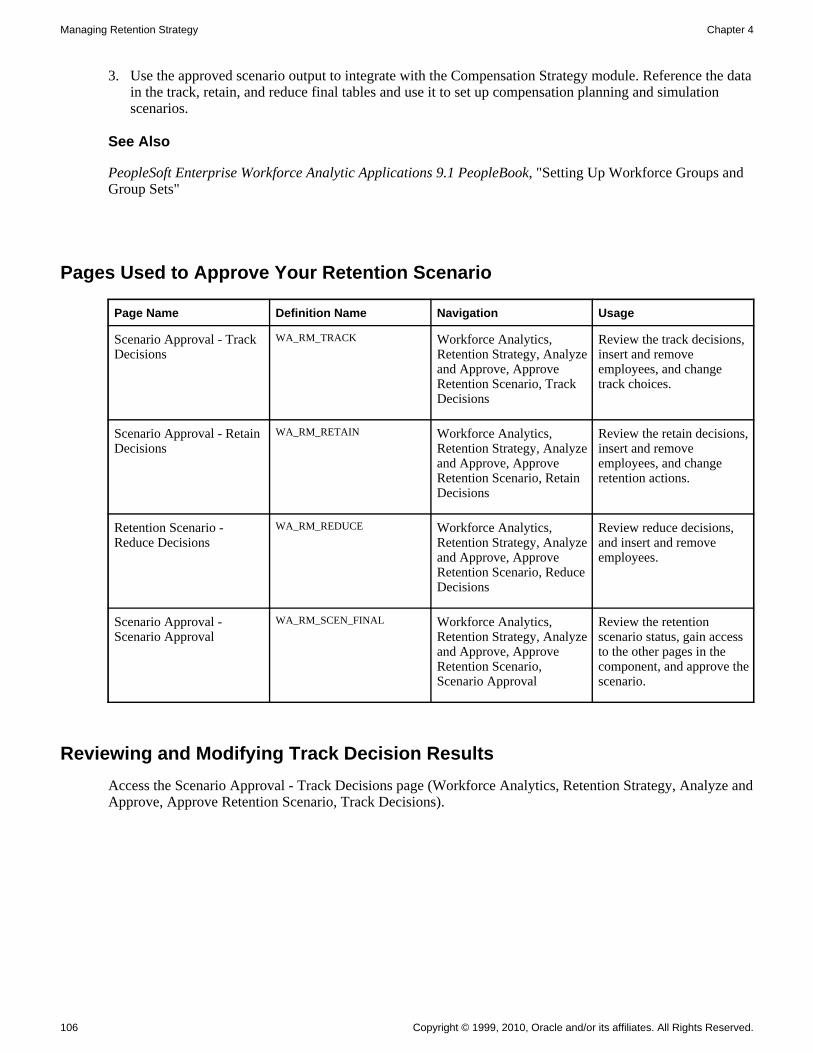
Managing Retention Strategy Chapter 4
106 Copyright © 1999, 2010, Oracle and/or its affiliates. All Rights Reserved.
3. Use the approved scenario output to integrate with the Compensation Strategy module. Reference the datain the track, retain, and reduce final tables and use it to set up compensation planning and simulation scenarios.
See Also
PeopleSoft Enterprise Workforce Analytic Applications 9.1 PeopleBook, "Setting Up Workforce Groups and Group Sets"
Pages Used to Approve Your Retention Scenario
Page Name Definition Name Navigation Usage
Scenario Approval - Track Decisions
WA_RM_TRACK Workforce Analytics, Retention Strategy, Analyzeand Approve, Approve Retention Scenario, Track Decisions
Review the track decisions, insert and remove employees, and change track choices.
Scenario Approval - Retain Decisions
WA_RM_RETAIN Workforce Analytics, Retention Strategy, Analyzeand Approve, Approve Retention Scenario, Retain Decisions
Review the retain decisions,insert and remove employees, and change retention actions.
Retention Scenario - Reduce Decisions
WA_RM_REDUCE Workforce Analytics, Retention Strategy, Analyzeand Approve, Approve Retention Scenario, Reduce Decisions
Review reduce decisions, and insert and remove employees.
Scenario Approval - Scenario Approval
WA_RM_SCEN_FINAL Workforce Analytics, Retention Strategy, Analyzeand Approve, Approve Retention Scenario, Scenario Approval
Review the retention scenario status, gain access to the other pages in the component, and approve thescenario.
Reviewing and Modifying Track Decision Results
Access the Scenario Approval - Track Decisions page (Workforce Analytics, Retention Strategy, Analyze andApprove, Approve Retention Scenario, Track Decisions).

Chapter 4 Managing Retention Strategy
Copyright © 1999, 2010, Oracle and/or its affiliates. All Rights Reserved. 107
Retention Scenario Approval - Track Decisions page
When the page opens, the Business Unit, Scenario ID, As Of Date, and Status display at the top of the page. The Scenario Status and Approval Date Time stamp also display in the lower left hand corner of the page. The system also displays these same fields on the Retain Decisions and Reduce Decisions pages.
Reviewing and Editing Data in the Grid
Employee ID andPersonal Name
The employee identification numbers and names of employees from the TrackingDecision output table (WA_RM_TRACK_F00) are listed in the grid at the bottom of the page. You can add or remove employees from the scenario results. If an employee row exists in this table, it means they are assessed as either a High Potential or High Risk employee.
Decision Rule This field indicates the track decision rule used to assess the employee as High Potential or High Risk.
High Potential If this check box is selected, the employee is tracked as High Potential.
High Risk If this check box is selected, the employee tracked as High Risk.

Managing Retention Strategy Chapter 4
108 Copyright © 1999, 2010, Oracle and/or its affiliates. All Rights Reserved.
Reviewing and Modifying Retain Decision Results
Access the Scenario Approval - Retain Decisions page (Workforce Analytics, Retention Strategy, Analyze and Approve, Approve Retention Scenario, Retain Decisions).
Retention Scenario Approval - Retain Decisions page
Reviewing and Editing Data in the Grid
Employee ID andPersonal Name
The employee identification numbers and names of employees from the Retain Decision output table (WA_RM_RETAIN_F00) are listed in the table at the bottom of the page. You can add or remove employees from the scenario results.
Decision Rule This field indicates the retain decision rule used to assess the employee.
Retention Factor Code The retention factor upon which to act to retain employees selected by a decision rule. You can add or modify the retention factor codes.

Chapter 4 Managing Retention Strategy
Copyright © 1999, 2010, Oracle and/or its affiliates. All Rights Reserved. 109
Reviewing and Modifying Reduce Decision Results
Access the Scenario Approval - Reduce Decisions page (Click the Reduce Decisions link from the Scenario Summary page or other pages in the Retention Scenario component).
Retention Scenario Approval - Reduce Decisions page
Reviewing and Editing Data in the Grid
Employee ID andPersonal Name
The employee identification numbers and names of employees from the Reduce Decision output table (WA_RM_REDUCE_F00) are listed in the table at the bottom of the page. You can add or remove employees from the scenario results.
Decision Rule This field indicates the reduce decision rule used to assess the employee.
Approving Your Scenario
Access the Scenario Approval page (Workforce Analytics, Retention Strategy, Analyze and Approve, Approve Retention Scenario, Scenario Approval).
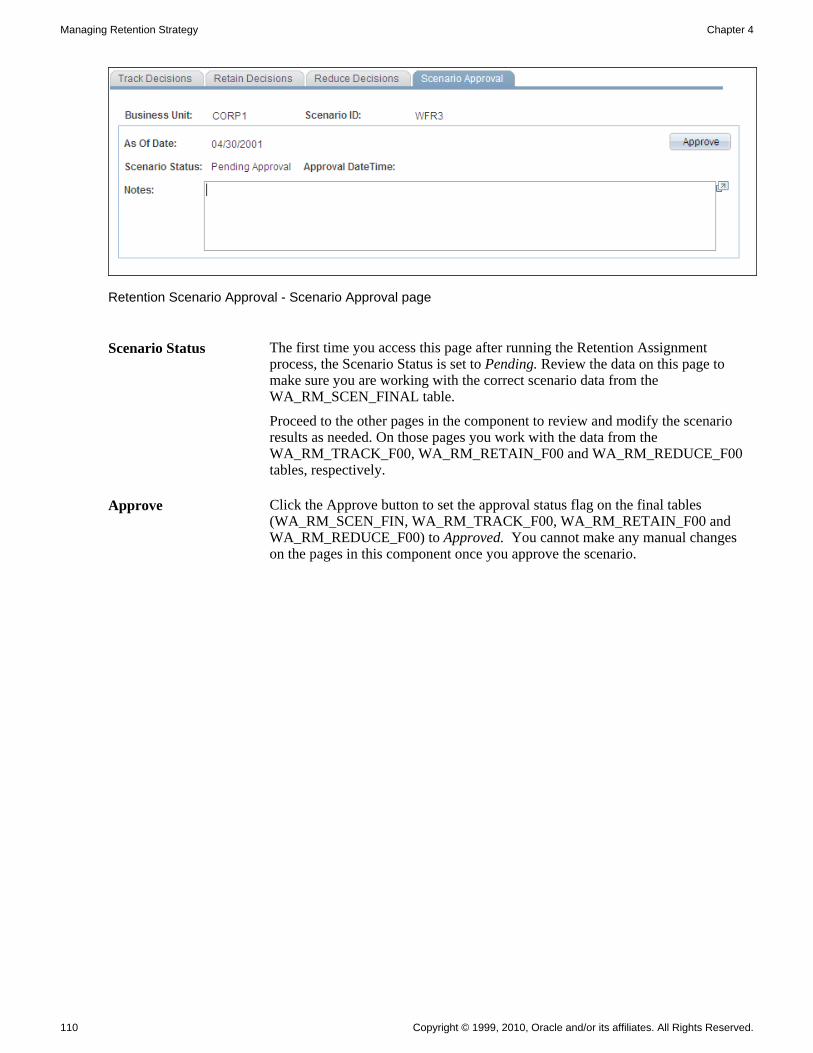
Managing Retention Strategy Chapter 4
110 Copyright © 1999, 2010, Oracle and/or its affiliates. All Rights Reserved.
Retention Scenario Approval - Scenario Approval page
Scenario Status The first time you access this page after running the Retention Assignment process, the Scenario Status is set to Pending. Review the data on this page to make sure you are working with the correct scenario data from the WA_RM_SCEN_FINAL table.
Proceed to the other pages in the component to review and modify the scenario results as needed. On those pages you work with the data from the WA_RM_TRACK_F00, WA_RM_RETAIN_F00 and WA_RM_REDUCE_F00 tables, respectively.
Approve Click the Approve button to set the approval status flag on the final tables (WA_RM_SCEN_FIN, WA_RM_TRACK_F00, WA_RM_RETAIN_F00 and WA_RM_REDUCE_F00) to Approved. You cannot make any manual changes on the pages in this component once you approve the scenario.

Copyright © 1999, 2010, Oracle and/or its affiliates. All Rights Reserved. 111
Chapter 5
Managing Compensation Planning
This chapter provides an overview of Compensation Strategy and discusses how to:
• Set up a workforce simulation rule
• Set up a compensation planning scenario
• Review and analyze a compensation planning scenario
• Alter compensation planning scenario results with Analytic Calculation Engine
• Approve compensation planning scenario output
Understanding Compensation Strategy
This section provides an overview of the Workforce Rewards Compensation Strategy and discusses:
• Compensation strategy definition
• Compensation Strategy business process
• Market compensation rates
Overview
The Compensation Strategy module provides tools to review and analyze the total compensation costs and strategies for your workforce. With Compensation Strategy you can automate and streamline the performanceof these compensation strategy tasks:
• Use data extracted from multiple sources.
• Define compensation rules for any type of compensation, such as base pay, variable compensation, or benefits compensation.
• Create scenarios of your organization's job growth and reduction, or headcount plans.
• Create and analyze multiple compensation scenarios involving combinations of compensation types, such as base pay, variable compensation, and benefits compensation.
• Evaluate the impacts of these scenarios on compensation distribution, costs, and value.
• Once you've identified the scenarios with the desired results, approve the results of your efforts.

Managing Compensation Planning Chapter 5
112 Copyright © 1999, 2010, Oracle and/or its affiliates. All Rights Reserved.
You also utilize a wealth of data in the process. Compensation Strategy integrates data from a variety of sources, such as:
• Workforce compensation data from internal transactional database systems, such as HRMS.
• Market rates developed with the Market Compensation module.
• Base pay structures developed with the Base Pay Structure module.
• Employee retention and reduction data from the Retention Strategy module.
• Key performance indicators (KPIs) from Scorecard and Workforce Scorecard.
You use the Compensation Strategy module to generate differing scenarios of base and variable compensationplans, as well as any other cost-related plans (such as benefits). We designed the module around two main Application Engine processes, Workforce Simulation (WA_WFS) and Compensation Planning & Simulation (WA_CPS).

Chapter 5 Managing Compensation Planning
Copyright © 1999, 2010, Oracle and/or its affiliates. All Rights Reserved. 113
Conceptual relationship between Workforce Simulation and Compensation Planning and Simulation
Compensation Strategy Definition
Before you begin using the Compensation Strategy module, take some time to formulate the questions that you want to answer. The types of questions to consider fall into two broad categories:
1. What is your organization's overall compensation strategy? What changes in the existing compensation system would you like to model, to assess their effects?
2. How can you best use Compensation Strategy to generate scenarios to evaluate and answer these questions?

Managing Compensation Planning Chapter 5
114 Copyright © 1999, 2010, Oracle and/or its affiliates. All Rights Reserved.
One part of understanding your organization's compensation strategy involves knowing what pay components, target pay rates, and pay ranges to apply to various jobs. It also involves understanding your organization's ongoing efforts to attract and retain the right people with the necessary skill levels. Once you have this background you are ready to use Compensation Strategy to perform tasks such as:
• Model the changes from a proposed salary or compensation reorganization, based on market values, to evaluate the cost of moving your workforce up to market levels.
• Create new types of variable compensation to help motivate your workforce, and evaluate the cost impact.
• Target special compensation plans for specific groups of employees, such as executives, salespeople, or workers with mission-critical job skills.
A second part of understanding your organization's compensation strategy involves knowing how the overall compensation strategy cycle is executed, and knowing at what point in the cycle your organization is at a any given time. Equipped with this knowledge, you can use Compensation Strategy to perform these types of tasks:
• Model compensation cost changes based on forecasted workforce growth and reduction.
• Establish a merit matrix or other rules for pay out of annual base pay increases.
• Determine what types of performance goals or related pay out rules you need for any base compensation or variable compensation types in the compensation plan.
• Examine the compensation cost effects based on organizational performance indicators, for periodic bonuses and so on.
• Set proposed compensation budgets for departments or business units.
• Allocate compensation pools across organizations, special classifications, groups, and individuals.
Another part of your strategy involves understanding how to best use Compensation Strategy. You have theseoptions:
• Set up and run Compensation Planning and Simulation (CPS) as a Historical process, using your existing workforce. This means having no inputs from Workforce Simulation.
• Set up and run CPS as a Forecast process, using input from Workforce Simulation, or Retention Strategy, or both, to include simulated changes to your workforce in the scenarios. Follow the retention or workforce simulation results through the completion of the CPS process, and evaluate the cost impacts of your retention, growth, and reduction decisions.
• Set up and run CPS with or without including existing base salary in the compensation rules. This means you can either evaluate the total compensation impact of a scenario, or focus only on the change introduced by new rules.
Compensation Strategy Business Process
The following diagram outlines the main steps in the Compensation Strategy business process.

Chapter 5 Managing Compensation Planning
Copyright © 1999, 2010, Oracle and/or its affiliates. All Rights Reserved. 115
Compensation Strategy business process
Market Compensation Rates
If you plan to use market rates to help you develop and evaluate compensation scenarios for your workforce, make sure you have completed the steps needed to import compensation survey data, and define market compensation rates.
If you plan to use new base pay structures to help you develop and evaluate compensation scenarios for your workforce, make sure you have completed the steps needed to develop new base pay structures.
See Also
Chapter 2, "Managing Market Compensation," page 5
Chapter 3, "Managing Base Pay Structures," page 43
Setting Up Workforce Simulation
To set up workforce simulation, use the WA_CP_WFSIM_DFN.GBL and WA_WFS_MODL_TBL.GBL components.
This section provides an overview of workforce simulation and discusses how to:
Managing Compensation Planning Chapter 5
116 Copyright © 1999, 2010, Oracle and/or its affiliates. All Rights Reserved.
• Set up workforce groups.
• Enter workforce simulation growth and reduction rules.
• Set up model IDs for workforce simulation.
• Define a workforce simulation model.
• Set up a workforce simulation scenario definition.
• Set up the process run control for the Workforce Simulation process.
• Run the Workforce Simulation process.
• Review your workforce simulation scenario setup.
Understanding Workforce Simulation Setup
The Workforce Simulation process serves as a basis for input to the Compensation Planning and Simulation process. The inputs for the Workforce Simulation process are workforce growth and reduction rules, which define your workforce strategy. Run the Workforce Simulation process to generate a simulated workforce, consisting of your existing employees plus any new simulated employees and reduced employees (employees to be removed from your workforce). In the end, the result is a simulated workforce based on assumptions forgrowth and reductions for a given time period. The output is stored in the WA_JOB_S00 table. WA_JOB_S00 is identical to the JOB_F00 table, with SCENARIO_ID added as a key field. Use this simulated workforce in forecast scenarios in Compensation Strategy.
Before you begin working with Workforce Simulation, think about the questions that you want to answer. The questions you ask dictate your strategy for the workforce simulation and compensation rules you create. They also dictate your strategy for which modules and processes to run, and in what sequence to run them. For example, do you want to run the Retention Strategy module first, to generate lists of employees to reduce and retain, and use them in the Workforce Simulation? If you do, then you can follow the retention results right on through to the completion of the Compensation Planning and Simulation process, and evaluate the cost impacts of your retention decisions.
To set up your workforce simulation strategy complete the following steps:
1. Set up workforce groups.
2. Enter growth and reduction rules.
3. Set up a Model ID.
4. Use the rules to define a workforce simulation model.
5. Set up a scenario ID.
6. Run the Workforce Simulation process.
7. Review the workforce simulation scenario

Chapter 5 Managing Compensation Planning
Copyright © 1999, 2010, Oracle and/or its affiliates. All Rights Reserved. 117
Pages Used to Set Up and Run Workforce Simulation
Page Name Definition Name Navigation Usage
Workforce Simulation Rule WA_CP_WFSIM_DFN Workforce Analytics, Compensation Strategy, Workforce Simulation, Setup Simulation Rules, Workforce Simulation Rule
Enter growth and reduction assumptions for your workforce, which you can use to run a workforce simulation scenario.
Workforce Simulation Model
WA_WFS_MODL_TBL Workforce Analytics, Compensation Strategy, Workforce Simulation, Setup Simulation Model, Workforce Simulation Model
Define a workforce simulation model by associating a set of simulation rules with a model ID.
Run Workforce Simulation - Run Jobstream
RUN_PF_JOBSTREAM Workforce Analytics, Compensation Strategy, Workforce Simulation, Run Workforce Simulation, Run Workforce Simulation - Run Jobstream
Generate a workforce simulation scenario.
Workforce Simulation Rules report
RUN_RWA_0019 Workforce Analytics, Workforce Reports, Compensation Strategy Reports, Workforce Simulation Rules, Workforce Simulation Rules
Run the Workforce Simulation Rules Crystal report (WAC0019), summarizing the simulation rules for a given setID and model ID.
Setting Up Workforce Groups for Workforce Simulation
You use workforce groups to set up workforce reduction rules. You set up workforce groups using the Workforce Group component by selecting Workforce Analytics, Workforce Analytics Setup, Setup Groups. This component is documented in the PeopleSoft Enterprise Workforce Analytic Applications 9.1 PeopleBook.
See Also
PeopleSoft Enterprise Workforce Analytic Applications 9.1 PeopleBook, "Setting Up Workforce Groups and Group Sets"
Entering Workforce Simulation Growth and Reduction Rules
Access the Workforce Simulation Rule page (Workforce Analytics, Compensation Strategy, Workforce Simulation, Setup Simulation Rules, Workforce Simulation Rule).

Managing Compensation Planning Chapter 5
118 Copyright © 1999, 2010, Oracle and/or its affiliates. All Rights Reserved.
Workforce Simulation Rule page
Compile Click this button to have the system build, or compile, the underlying SQL.
Selecting a Simulation Type
Simulation Type Enter a simulation type from the list of translate table values. Valid values are Workforce Growth, Requisition Growth and Workforce Reduction. A separate group box appears for each simulation type you select.
You enter your requisition growth, workforce growth, and workforce reduction assumptions in the corresponding group boxes below. Later, when you run the workforce simulation process, the system uses these rules to create a simulated workforce output. The system uses your existing workforce as a starting point. The processing is as follows:
New Simulated Workforce = Existing Employees + Employees Reduced + New Simulated⇒ Employees.
Note. Set up one Simulation Type per rule. When you save the page or change the field for the rule type, the system hides the fields that do not apply to the Simulation Type you select.
Defining a Workforce Growth Simulation
Job Code Enter a new headcount for your organization by specifying the Job Code for the new jobs or positions. Job Codes prompt from the JOBCODE_D00 table.
Department Specify the Department to which the jobs are to be added. Departments prompt from the DEPARTMENT_SRCH table. Always specify both a Job Code and a Department for a workforce growth rule.
Number to Simulate Enter the number of new jobs or positions to add to your workforce.

Chapter 5 Managing Compensation Planning
Copyright © 1999, 2010, Oracle and/or its affiliates. All Rights Reserved. 119
Base Compensation Indicate the Base Compensation type you want the system to use to simulate the compensation cost of the new workers. Valid translate table values are:
• Entry Step Rate: Use this option when the salary plan for the job code has both grades and steps. The system assigns a compensation cost to the new workers by using the salary rate for the entry step of the salary grade applied to this job code. The system warns you if a salary step rate does not exist for the job code.
• Grade Midpoint Rate: Use this option when you want the system to assign a compensation cost to the new workers by using the midpoint salary rate, for the grade assigned to this job code. The system warns you if a salary grade midpoint does not exist for this job code.
• Market Rate: Use this option when you want the system to assign compensation cost to the new workers using a specified percentile of the market rates.
Measure ID Select a Measure ID. Valid values for the Measure ID prompt from the WA_MKT_PCT_VW table. You developed these measure values and their associated measure amounts using the functionality in the Market Compensation module.
Defining a Requisition Growth Simulation
Constraint Code Select a Constraint Code to indicate the constraint to use in determining which job openings to use for simulation. Valid values for the Constraint Code prompt from the WA_WFSCONSTR_VW table.
Note. DataSets for Requisition Growth simulations must be based on TableMaps having STAFFING_F00 as the primary table.
Base Compensation Indicate the Base Compensation type you want the system to use to simulate the compensation cost of the requisitions. The valid translate table values are listed above.
Measure ID Select a Measure ID. Valid values for the Measure ID prompt from the WA_MKT_PCT_VW table. You developed these measure values and their associated measure amounts using the functionality in the Market Compensation module. This field is only required if you pick Market Rate in the Base Compensation field.
Defining a Workforce Reduction Simulation
Group ID To define the group of employees you want to reduce, select a Group ID from theprompt list values, which are from the WA_CP_GROUP_DFN table. For example, you may choose to reference a workforce group based upon the workforce reduction decisions you made in the Retention Strategy module.

Managing Compensation Planning Chapter 5
120 Copyright © 1999, 2010, Oracle and/or its affiliates. All Rights Reserved.
Setting Up Model IDs for Workforce Simulation
Before you use the Compensation Strategy Workforce Simulation Model page, you must have set up model IDs in the Operational Warehouse - Enriched (OWE). You do this using the EPM Foundation, Business Metadata, Business Framework, Models page. This page is documented in the Enterprise Performance Management Fundamentals 9.1 PeopleBook.
See Also
PeopleSoft Enterprise Performance Management Fundamentals 9.1 PeopleBook, "Setting Up Models and Scenarios," Defining Models and Scenarios
Defining a Workforce Simulation Model
Access the Workforce Simulation Model page (Workforce Analytics, Compensation Strategy, Workforce Simulation, Setup Simulation Model, Workforce Simulation Model).
Workforce Simulation Model page
Listing the Rules
Use the grid at the bottom of the page to list the workforce simulation rules you want to include in this model.Add rows to list multiple rules.
SeqNum (sequence number) and Simulation Rule ID
For each rule enter the SeqNum (sequence number) and Simulation Rule ID. Thesystem displays the simulation rule description.

Chapter 5 Managing Compensation Planning
Copyright © 1999, 2010, Oracle and/or its affiliates. All Rights Reserved. 121
Setting Up a Scenario Definition for Workforce Simulation
Before you run the Workforce Simulation process, you must set up a Scenario ID and definition using the EPM Foundation, Business Metadata, Business Framework, Scenarios page. This component is documented in the Enterprise Performance Management Fundamentals 9.1 PeopleBook.
Note. The scenario type for a Workforce Simulation must be a Forecast Scenario.
See Also
PeopleSoft Enterprise Performance Management Fundamentals 9.1 PeopleBook, "Setting Up Models and Scenarios," Defining Models and Scenarios
Setting Up the Process Run Control for Workforce Simulation
Access the Run Workforce Simulation page (Workforce Analytics, Compensation Strategy, Workforce Simulation, Run Workforce Simulation, Run Workforce Simulation - Run Jobstream).
The run control definition includes these basic elements:
• Business unit
• Scenario ID
• Fiscal year and accounting period
• Jobstream ID
Scenario ID
The scenario ID you select using this page must be for a Forecast scenario.
Fiscal Year and Accounting Period
Run Simulation scenarios for a fiscal year and accounting period. Do not run them based on an as of dated jobstream.
Jobstream ID
These are the basic jobstreams and engines delivered for Workforce Simulation:
Jobstream ID Job ID Application Engine ID
WA_WFS WA_WFS WA_WFS

Managing Compensation Planning Chapter 5
122 Copyright © 1999, 2010, Oracle and/or its affiliates. All Rights Reserved.
See Also
Generating the Workforce Simulation Scenario
To generate a workforce simulation scenario, you run a PeopleTools Application Engine (AE) process called Workforce Simulation (WA_WFS).
Workforce Simulation Process Output Tables
The main Workforce Simulation process output table is WA_JOB_S00. It is a clone of JOB_F00 with the addition of the PF_SCENARIO_ID field. This table stores the simulated workforce, which includes the current workforce (based on the date of the simulation scenario) from JOB_F00. This table can also include new simulated employees based on the rules defined in the workforce simulation pages (growth rules), as well as simulated terminated employees (reduction rules). This table is a basis for input into the Compensation Planning and Simulation process. If a reduction rule is specified in a simulation, the WA_GROUP_F00 table is also populated with the employees that are to be reduced from the workforce.
Identifying Reduced and New Simulated Employees
The WA_WFS AE process calculations use the groups and rules that apply to the selected business unit, setID, model ID and scenario ID. The process uses the existing employees from JOB_F00 as a starting point, and puts them in the WA_JOB_S00 table, but only in the first accounting period specified in the scenario. Then the system performs actions for the reduced employees in WA_JOB_S00, if any, and then adds new simulated employees to WA_JOB_S00, if any, to create the new simulated workforce. The process flow is:
New Simulated Workforce = Existing Employees + Employees Reduced + New Simulated⇒ Employees.
For each reduced employee, the row is assigned a personnel Action of TER, and a Reason of WFS.
For each simulated new employee, the row is assigned a personnel Action of HIR, and a Reason of WFG. Thesystem assigns them an employee identification number based on the structure $YYPPRRR###, where:
$ Indicates this is a simulated employee.
YY Indicates the last two digits of the fiscal year.
PP Indicates the accounting period.
RRR Indicates a unique number attached to a WFS rule. Values can range from 001 to 999.
### Indicates a unique number generated for an employee within a rule. The system first uses all numeric values ranging from 001 to 999. Then the system uses a combination of both alphabetic and numeric, such as A01, A02 and so on, ultimately up through ZZZ.

Chapter 5 Managing Compensation Planning
Copyright © 1999, 2010, Oracle and/or its affiliates. All Rights Reserved. 123
Note. Based on this formatting, for a given fiscal year, accounting period, and workforce simulation scenario,you can add a maximum of 46,656 unique, simulated employees.
When the system creates simulated employees using existing job requisition information, from STAFFING_F00, it distinguishes these simulated employees from those created by workforce growth rules. Simulated employees from job requisitions are assigned a personnel action of HIR, and a reason of WFJ.
Effective Dating of Models and Rules in Workforce Simulation
The effective date of the model and rules used in the workforce simulation must be less than or equal to the effective date of the accounting period for the process run. For example, when you run the process for the fiscal year 2000, and accounting period 1, then the system uses all rules that are valid as of the beginning of that fiscal year/accounting period. If you have a rule that has an effective date of 02/01/2000, then it won't be used until you run the process for fiscal year 2000, accounting period 2.
Currency Codes and Currency Conversion in Workforce Simulation
When you run the Workforce Simulation process the system assigns new employees (in WA_JOB_S00) a currency code that is the same as the existing employees for that same scenario.
If your implementation of Workforce Rewards includes working with multiple currencies, you must run the Currency Conversion Application Engine process (PF_MULT_CURR) to populate the annual BCE rate field for employees in the JOB_F00 table. The timing of this step is important. You run this process after you have used the delivered ETL tool to import your source data to the data warehouse tables, and before running the Workforce Simulation process. If you don't run the Currency Conversion process prior to running Workforce Simulation, certain annual BCE rates are populated as zero throughout the JOB_F00 table, and these zero rates can be carried through the Workforce Simulation and Compensation Planning and Simulation processes.Employees' annual BCE rates should always be greater that zero.
Note. Check your Application Engine process messages after running the Workforce Simulation process. Theprocess checks for any rows in WA_JOB_S00 with an annual rate of zero. If it finds such rows an error message is generated stating: "Warning: Annual BCE Rate=0. Must run Processing Multiple Currency or CPSresults will be incorrect."
Synchronizing Workforce Simulation Data with the Workforce Rewards Data Mart
When you run the Workforce Simulation process, the system also calls the Data Mart Dimension process (WA_UPG_DIM), which updates the Workforce Rewards Data Mart dimensions. Workforce Simulation doesnot call any fact processes, but it does call the dimension build process:
1. For the first period the scenario is run for, all Workforce Rewards dimensions are populated.
2. If the scenario is run for additional periods, then only the employee specific dimensions such as WFI_PERSON_DIM and WFI_JOB_DIM are populated. The system does this because Workforce Simulation is creating new employee records in WA_JOB_S00, so the dimensions need to contain a complete list of all employees. Other dimensions do not need to be repopulated as they've already been populated for the first period.
See Also
Appendix A, "Workforce Rewards Data Mart," page 173

Managing Compensation Planning Chapter 5
124 Copyright © 1999, 2010, Oracle and/or its affiliates. All Rights Reserved.
Reviewing Your Workforce Simulation Scenario Setup
Review your workforce simulation rules setup using the following Crystal reports:
• Workforce Simulation Rules report (WAC0019), summarizing the simulation rules for a given setID and model ID.
• Workforce Groups report (WAC0018), summarizing the workforce group setup.
Note. Samples of these reports are provided with your documentation.
See Also
Appendix B, "Workforce Rewards Reports," page 183
Setting Up a Compensation Scenario
To set up a compensation scenario, use the WA_CP_ELEM_DFN.GBL, WA_CP_GOALMTRX_DFN.GBL, WA_CP_MERIT_DFN.GBL, WA_CP_PYOUT_DFN.GBL, WA_CP_BASE_PAY.GBL, WA_CP_RULE_DFN.GBL, WA_CP_OTHER_DFN.GBL, and WA_CP_MODEL_DFN.GBL components.
This section discusses how to:
• Link employee information to a compensation scenario.
• Define performance-based calculation rules with a goals matrix.
• Define base compensation increase rules with a merit matrix.
• Control compensation distribution payout rules.
• Define base pay rules.
• Define variable pay rules.
• Specify other pay rules.
• Define frequency details for compensation models.
• Set up workforce groups for compensation models.
• Set up model IDs for compensation models.
• Define a compensation planning and simulation model.
• Set up compensation scenario IDs.
• Set up the Compensation Planning and Simulation process run control.
• Run the Compensation Planning and Simulation process.

Chapter 5 Managing Compensation Planning
Copyright © 1999, 2010, Oracle and/or its affiliates. All Rights Reserved. 125
• Review and alter compensation planning scenario data using the Analytic Calculation Engine (ACE).
Pages Used to Set Up and Run a Compensation Scenario
Page Name Definition Name Navigation Usage
Data Element WA_CP_ELEM_DFN Workforce Analytics, Compensation Strategy, Setup Compensation Scenario, Setup Data Elements, Data Element
Create data elements that link employee-based information in the system tocompensation planning rules.
Goals Matrix WA_CP_GOALMTRX_DFN Workforce Analytics, Compensation Strategy, Setup Compensation Scenario, Setup Goals Matrix, Goals Matrix
Define performance-based calculation rules for group or employee performance based on a goals matrix.
Merit Matrix WA_CP_MERIT_DFN Workforce Analytics, Compensation Strategy, Setup Compensation Scenario, Setup Merit Matrix, Merit Matrix
Create a merit matrix whichdefines the amount rules forbase compensation increases for your workers.
Payout Rule WA_CP_PYOUT_DFN Workforce Analytics, Compensation Strategy, Setup Compensation Scenario, Setup Payout Rules, Payout Rule
Establish the amount rules for how to pay out compensation based on a flat amount, percentage of base pay, or criteria in a data element.
Base Pay Compensation Rule
WA_CP_BASE_PAY Workforce Analytics, Compensation Strategy, Setup Compensation Scenario, Setup Base Pay Rules, Base Pay Compensation Rule
Create a base pay compensation rule.
Variable Pay Rule WA_CP_VC_PAY Workforce Analytics, Compensation Strategy, Setup Compensation Scenario, Setup Variable Pay Rules, Variable Pay Rule
Create a variable pay compensation rule, for bonuses for example.
Other Pay Rule WA_CP_OTHER_PAY Workforce Analytics, Compensation Strategy, Setup Compensation Scenario, Setup Other Pay Rules, Other Pay Rule
Create other pay rules, for benefits for example.

Managing Compensation Planning Chapter 5
126 Copyright © 1999, 2010, Oracle and/or its affiliates. All Rights Reserved.
Page Name Definition Name Navigation Usage
Compensation Model WA_CP_MODEL_DFN Workforce Analytics, Compensation Strategy, Setup Compensation Scenario, Setup Compensation Model, Compensation Model
Set up a model to bring together the workforce groups and compensation rules needed to run a scenario.
Workforce Group Description
WA_CP_MODEL_SEC1 Click the Workforce Group Info (information) button alongside the group ID fieldon the Compensation Modelpage.
View a description of the workforce group.
Compensation Rule Description
WA_CP_MODEL_SEC2 Select the Compensation Rule Info (information) button alongside the rule IDfield on the Compensation Model page.
View a description of the compensation rule.
Run Compensation Scenario - Run Jobstream
RUN_PF_JOBSTREAM Workforce Analytics, Compensation Strategy, Setup Compensation Scenario, Run Compensation Scenario, Run Compensation Scenario - Run Jobstream
Run the compensation planning and simulation process.
Linking Employee Information to a Compensation Scenario
Access the Data Element page (Workforce Analytics, Compensation Strategy, Setup Compensation Scenario, Setup Data Elements, Data Element).
Data Element page

Chapter 5 Managing Compensation Planning
Copyright © 1999, 2010, Oracle and/or its affiliates. All Rights Reserved. 127
Data elements, at their most simple level, define information that you link to an employee. At a more complex level, you use data elements when you build compensation rules, to tell the system what data to retrieve about your workforce groups, and what performance measures to apply to your compensation scenario.
Selecting a Data Element Type
Select a Data Element Type from the list of translate table values:
DataSet A calculation amount resolved for each employee subject to this rule. DataSets are data pointers from DataMaps. They point to measurable data about an employee, in the data warehouse tables. DataSets provide you a means of defining a set of information to use in Application Engine processes.
When you select the DataSet option the Constraint Code field and Compile button display. Once you select the Constraint Code, the Dimension and MeasureID fields also display. The DataSet definition you specify with these fields determines the type of measure used in the Compensation Planning and Simulation process (WA_CPS).
Goals Matrix Score When you select this option, the Goals Matrix ID field appears. Prompt values for this field are from the WA_CP_GOAL_DFN table. You create goals matricesusing the Goals Matrix page.
KPI Assessment Value The KPI Assessment Value is a numeric value for the assessment, or scoring, of aKPI (Key Performance Indicator). You create KPIs in Scorecard. The KPI is scored when the KPI Resolved Value is compared to a target value.
When you select KPI Assessment Value the KPI ID field displays. Prompt valuesfor this field are from the WA_KPI_DFN_VW table.
KPI Resolved Value The KPI Resolved Value is the calculated value of the KPI. You define them using the KPI Manager, in Scorecard. When it is compared, or scored, against a target value, the result is a numeric KPI Assessment Value.
When you select KPI Resolved Value, the KPI ID field displays. Prompt values for this field are from the WA_KPI_DFN_VW table.
DataSet Data Element Type
Constraint Code For a Data Element Type of DataSet select the Constraint Code for the system to use for every compensation rule to which the data element is applied. Constraintsare collections of filters you use to define business rules for processing, and return desired data from a given DataMap. This field prompts values from constraints you define with the Constraint component. The prompt values are from the PF_CONSTR_DFN table.
Note. When you build Constraints for use with Workforce Rewards, you must base them on DataMaps where the primary table in the TableMap is the simulated workforce job table WA_JOB_S00.

Managing Compensation Planning Chapter 5
128 Copyright © 1999, 2010, Oracle and/or its affiliates. All Rights Reserved.
Dimension Select a dimension from the prompt list values, which are from the WA_DM_DIM_VW table. The most common dimensions for Workforce Analytics that repeatedly appear in the DataMaps are business unit, employee identification, department identification, location code, and job code.
Measure ID Specify the Measure ID for the Dimension. The prompt values are from the WA_DM_MEAS_VW table.
Compile For a Data Element Type of DataSet, click the Compile button. This triggers the system to build the underlying SQL. Otherwise the system builds it automaticallyon saving the page. After building the SQL the system displays the SQL Object ID Prefix, a system-generated number identifying the location of the SQL in the SQL Repository.
Goals Matrix Score Data Element Type
For a Data Element Type of Goals Matrix Score, first create the Goals Matrix on the Goals Matrix page. Then, while still on that page, choose to have the system automatically create a corresponding Data Element with the same name. If you already have a Goals Matrix built, and you want to define a Data Element with a different name, then create the Data Element using this page. In either case, each Goals Matrix ID must be linked to a corresponding Data Element ID.
Some Important Points about Creating KPIs for Use with Workforce Rewards
When you use Scorecard to create KPIs for use in Workforce Rewards, remember the following important points:
• The Enterprise Scorecard pages you use to create KPIs are located by navigating to Key Performance Indicators, Define KPI's. They are as follows:
• Data Element Definition (if you are using data elements in your KPI.)
• Calculation Definition.
• Assessment Definition (if you are using a target rule, then specify the assessment usage as Workforce Analytics to ensure required values are populated.)
• KPI Definition.
• KPI Calculation Rule.
• KPI Object.
• KPI Target Rule (if you are using assessed values then specify the target rule type as Workforce Analytics.)
• Specify the model IDs for your KPIs in the KPI Model column, on the EPM Foundation, Business Metadata, Business Framework, Scenarios - Forecast Business Rules page.
• Processing is done by using the Workforce Rewards jobstreams (either WA_CPS or WA_RETENT). None of the KPI jobstreams need to be run if the KPI is only used in Workforce Rewards.)
Workforce-specific KPIs are delivered with Workforce Scorecard. If your implementation includes Workforce Scorecard, you can use those KPIs on the Data Element page in Workforce Rewards.

Chapter 5 Managing Compensation Planning
Copyright © 1999, 2010, Oracle and/or its affiliates. All Rights Reserved. 129
Note. You can only use the KPI-related options if your implementation includes Scorecard or Workforce Scorecard.
Defining Performance-Based Calculation Rules with a Goals Matrix
Access the Goals Matrix page (Workforce Analytics, Compensation Strategy, Setup Compensation Scenario, Setup Goals Matrix, Goals Matrix).
Goals Matrix setup page
Indicating the Number of Award Levels in the Scale
Number of Levels Select the number of pay out, or performance measure, levels you want to include in your Goals Matrix. Valid values from the translate table are Three Levels, Five Levels and Seven Levels.
Scale and Scale Values Based on the number of levels you select, the corresponding number of level fields display in the Scale group box, and the same number of performance measure columns display on the Scale Values tab at the bottom of the page.
Using the Scale Group Box
The system labels the lowest, middle, and highest levels of the scale the Threshold, Target and Stretch, respectively:

Managing Compensation Planning Chapter 5
130 Copyright © 1999, 2010, Oracle and/or its affiliates. All Rights Reserved.
Threshold This is the performance level for minimum adequate performance, the designatedlevel of performance below which it is inappropriate to pay incentives.
Target This is the performance level your organization establishes as the norm for performance and pay out.
Stretch This is the performance level for which an employee achieves maximum pay out.Performance above this level receives no greater pay out.
Scale Group Box
Scale If you are using the Goals Matrix in a Formula Plan, you enter the exact pay out amounts you want to apply to each level in this group box. The amounts you enter in these fields are paid out based on the pay out scores calculated for the performance goals in the grid at the bottom of the page.
If you use the Goals Matrix in a Target Plan, then you use this group box as a standardizing scale, to standardize data elements to a common scale of measurement. The values you enter in the levels are used by the system to standardize the pay out scores for the performance goals in the grid at the bottom of the page. There are different approaches you can take depending on how diverse your performance goals are:
• If your performance measures are diverse, and do not share a common dimension or even a common range of values, you might want the range of values in these fields to run from 0 to 100, to help standardize the measures. In this case the field values might be 0, 50, and 100, respectively, for a three level scale.
• If your performance measures share a common dimension, such as revenue, then you might want the range of values on the scale to cover a common range of revenue.
Using the Matrix Group Box
Your goals matrix is made up of performance goals (which are the rows), and performance measures (which are the columns). Individual performance goals are defined using data elements. You create data elements using the Data Element page. On the average, a goals matrix may have from three to five goals, but some mayhave as many as ten. To list multiple goals in the Goals Matrix, place the cursor in the Data Element ID field and insert additional data rows.
For each individual goal follow these steps:
1. On the Matrix Elements tab, define the goal by selecting a Data Element ID from the prompt list values from the WA_CP_ELEM_VW table.
2. Enter a weight value for the goal in the Weight% (weight percentage) field. The system totals the weight percentages for all of the goals and displays the figure in the Total Weight field at the bottom of the page. You must ensure that the cumulative weights for all of your goals adds up to 100.00.

Chapter 5 Managing Compensation Planning
Copyright © 1999, 2010, Oracle and/or its affiliates. All Rights Reserved. 131
3. In each of the performance measure columns on the Scale Values tab, enter the Threshold, Target and Stretch values for this specific goal. For example, if the goal is Quarterly Billable Hours, and there are three levels, the performance measure values might be 200, 300, and 400 hours respectively.
Performing Goals Matrix Calculations for a Target Plan
Create a goals matrix with this page for use in conjunction with a compensation plan type called a target plan.The system uses the Goals Matrix to calculate a total score for an employee. The system compares the employee's total score to the scoring criteria defined in the target matrix in the Compensation Rules component, and determines the monetary value of the pay out the employee receives based upon their performance. Here's an example of how this calculation process works:
For this example let's take a goals matrix for employees who are off-site consultants, that calculates their quarterly bonus. We have three goals: billable hours (with values of 200, 300, and 400), customer satisfactionrating (with values of 1,2, and 3), and customer courses taught (with values of 2, 4, and 6). Because the goals are so different, we standardize them using a three level scale of 0, 50, and 100. Our Scale and goals look likethis:
Scale or Goal Weight Threshold Target Stretch
Scale 0 50 100
Billable Hours 50% 200 300 400
Customer Satisfaction Rating
25% 1 2 3
Courses Taught 25% 2 4 6
An employee, William Avery, has 350 billable hours, a customer satisfaction rating of 3, and he has taught 3 customer courses. Here's what happens when the system uses this goals matrix to evaluate his performance.
The system looks at his 350 billable hours, and interpolates this against the scale. (Interpolation means using an equation to calculate the value in between two known values.) The system does the same for his customer rating of 3, and his 3 courses. The results of the interpolation are as follows:
Goal Employee's Performance
Interpolated Scale Value Explanation
Billable Hours 350 75 Because 350 is midway between 300 and 400, the system interpolates that 75 is midway between thestandardized scale values of 50 and 100.
Customer Satisfaction Rating
3 100 3 corresponds exactly to 100 on the scale.

Managing Compensation Planning Chapter 5
132 Copyright © 1999, 2010, Oracle and/or its affiliates. All Rights Reserved.
Goal Employee's Performance
Interpolated Scale Value Explanation
Courses Taught 3 25 Because 3 is midway between 2 and 4, the system interpolates that 25 is midway between thestandardized scale values of 0 and 50.
The interpolated scale value is the employee's actual performance standardized against the scale. Then, for each goal, the system multiplies the interpolated scale value by the weighting, to create a weighted rating for the goal. Then the system adds up the weighted ratings for all of the goals to get a total score.
The calculation process looks like this:
Goal Weight Employee's Performance
Interpolated Scale Value
Weighted Rating
Billable Hours 50% 350 75 .5 x 75 = 37.5
Customer Satisfaction Rating
25% 3 100 .25 x 100 = 25
Courses Taught 25% 3 25 .25 x 25 = 6.25
Total Score 37.5 + 25+ 6.25 = 68.75
The system then compares the employee's total score against the scoring criteria defined in the target matrix in the Compensation Rules component, and determines the monetary value of the pay out the employee receives based upon their performance. For example, if the target matrix indicates that all employees with a goals matrix score between 50 and 75 should receive a bonus pay out equal to 2 percent of their base pay, then the system calculates a 2 percent bonus for William Avery.
Performing Goals Matrix Calculations for a Formula Plan
Create a goals matrix with this page for use in conjunction with a compensation plan type called a formula plan. In the formula plan, the pay out score is calculated in association with a payout rule. The payout rule must have a payout type of data element, where the data element is a goals matrix such as the one in the previous example. The pay out score is calculated from the goals matrix, as in the prior example, and interpolated against the monetary amounts in the scale to determine the actual pay out amount.

Chapter 5 Managing Compensation Planning
Copyright © 1999, 2010, Oracle and/or its affiliates. All Rights Reserved. 133
Creating a Data Element From the Goals Matrix
Create Data Element on Save
You already created the individual data elements used in this goals matrix using the Data Element page. Once the goals matrix is complete, make it into a data element as well. You can do this in two ways. The system creates the data element for you.
If this is a new goals matrix ID, and you want the corresponding data element IDto have the same name, select this check box and save the page. This is the default setting for the check box .
If you want the data element to have a different name to the goals matrix, clear the Create Data Element on Save check box.
Defining Base Compensation Increase Rules with a Merit Matrix
Access the Merit Matrix page (Workforce Analytics, Compensation Strategy, Setup Compensation Scenario, Setup Merit Matrix, Merit Matrix).
Merit Matrix page
Rating Model Select a Rating Model from the prompt list values, which are from the WA_RTGMDL_R00 table.

Managing Compensation Planning Chapter 5
134 Copyright © 1999, 2010, Oracle and/or its affiliates. All Rights Reserved.
Completing and Using the Merit Matrix
Review Rating As in HRMS, a merit matrix provides the salary increase parameters for each review rating in a rating model. To complete the merit matrix, you begin with theReview Rating column. Place the cursor in the Review Rating column, and selecta rating from the prompt list values, which are from the WA_REVWRTG_R00 table.
Insert an additional row of data for each Review Rating in the Rating Model. Then, for each Review Rating, enter the recommended percentage pay increase for each of the employee pay range values as follows:
Default In the Default column, select a single review rating that you want the system to use as a default pay increase guideline, if an employee (or simulated employee) has no review rating.
Below Min % (below minimum percentage)
This is the lowest allowable increase for an employee, if the employee's current base compensation is below their salary grade minimum.
Below Max % (below maximum percentage)
This is the highest allowable increase for an employee, if the employee's current base compensation is below their salary grade minimum. Together with the Below Min % figure, this provides an allowable salary increase range for the employee.
1st Qt Min % (first quartile minimum percentage)
This is the lowest allowable increase for an employee, if the employee's current base compensation falls within the first quartile of their salary grade range.
1st Qt Max % (first quartile maximum percentage)
This is the highest allowable increase for an employee, if the employee's current base compensation falls within the first quartile of their salary grade range. Together with the 1st Qt Min % figure, this provides an allowable salary increaserange for the employee.
2nd Qt Min % (second quartile minimum percentage)
This is the lowest allowable increase for an employee, if the employee's current base compensation falls within the second quartile of their salary grade range.
2nd Qt Max % (second quartile maximum percentage)
This is the highest allowable increase for an employee, if the employee's current base compensation falls within the second quartile of their salary grade range. Together with the 2nd Qt Min % figure, this provides an allowable salary increase range for the employee.
3rd Qt Min % (third quartile minimum percentage)
This is the lowest allowable increase for an employee, if the employee's current base compensation falls within the third quartile of their salary grade range.
3rd Qt Max % (third quartile maximum percentage)
This is the highest allowable increase for an employee, if the employee's current base compensation falls within the third quartile of their salary grade range. Together with the 3rd Qt Min % figure, this provides an allowable salary increaserange for the employee.

Chapter 5 Managing Compensation Planning
Copyright © 1999, 2010, Oracle and/or its affiliates. All Rights Reserved. 135
4th Qt Min % (fourth quartile minimum percentage)
This is the lowest allowable increase for an employee, if the employee's current base compensation falls within the fourth quartile of their salary grade range.
4th Qt Max % (fourth quartile maximum percentage)
This is the highest allowable increase for an employee, if the employee's current base compensation falls within the fourth quartile of their salary grade range. Together with the 4th Qt Min % figure, this provides an allowable salary increaserange for the employee.
When you run the Compensation Planning and Simulation process (WA_CPS) to generate a compensation scenario, the system looks at an employees review rating, and determines where their current grade and pay fits on this matrix. The system then uses the averaged percentage increase recommendations to calculate the simulated percentage pay increase for the employee.
When you enter the recommended pay increase percentages into the merit matrix, take into account your organization's pay strategy, or the pay strategy that you want to model in a scenario. You may want to create multiple merit matrices to test the costs and benefits of changing your pay strategy. For example, you might create one merit matrix that provides higher pay increase percentages for employees who are at the low end oftheir salary ranges, but keeps pay increases at a minimum for employees who are currently at the top of their salary range. Or you may want to create a merit matrix that rewards high performers with higher recommended pay increases, and provides poor performers with lower recommended pay increases.
Controlling Compensation Distribution with Payout Rules
Access the Payout Rule page (Workforce Analytics, Compensation Strategy, Setup Compensation Scenario, Setup Payout Rules, Payout Rule).
Payout Rule page
Compensation Type Select a Compensation Type for the payout rule. Valid values are Currency Amount and Unit of Measure. A separate set of fields appear for each compensation type you select.

Managing Compensation Planning Chapter 5
136 Copyright © 1999, 2010, Oracle and/or its affiliates. All Rights Reserved.
Defining Currency Amount Compensation
Amount Type Select an amount type for the currency compensation.
Valid values are Employee Expense, Employee Val and Employer Exp (employeevalue and employer expense), Employee Value, and Employer Expense.
For example, in the case of a benefit plan such as an Employee Stock Purchase Plan (ESPP), the cost to the employer might be zero, but the value to the employee might be large.
Payout Type Select the type of payout you want to associate with the compensation.
Valid values are Data Element, Flat Amount, and Percent of Base Pay. The subsequent fields change depending on which of these values you select.
This field is only available when you select the Currency Amount compensation type.
Annualize? Select this check box to annualize the calculated payout amount
This field is only available when you select the Percent of Base Pay payout type.
% of Base Pay (Percent of Base Pay)
Define the pay out rule using the % of Base Pay (percentage of base pay) field, basing the pay out rule on a percentage of an employee's base pay.
This field is only available when you select the Percent of Base Pay payout type.
Data Element ID Define the pay out rule using a data element that you have created on the Data Element page, by selecting a Data Element ID from the prompt list values, whichare from the WA_CP_ELEM_VW table. You also have the option of specifying the payout be based on a percentage of the data element.
This field is only available when you select the Data Element payout type.
% of Data Element (Percent of Data Element)
Define the pay out rule using the % of Data Element (percentage of data element)field, basing the pay out rule on a percentage of a specific data element you have already defined on the Data Element page.
This field is only available when you select the Data Element payout type.
Amount Enter a value for the pay out rule when you want a flat monetary amount.
This field is only available when you select the Flat Amount payout type.
Defining Unit of Measure Compensation
You can also base the payout type on a Unit of Measure. Valid values include: Days, Dollars, Each, Man Hours, Number, Percent, Seconds, Square Feet, Stock Units, Time, and Units. If this is the case, then enter theUnits and Value Per Unit.

Chapter 5 Managing Compensation Planning
Copyright © 1999, 2010, Oracle and/or its affiliates. All Rights Reserved. 137
Defining Base Pay Rules
Access the Base Pay Compensation Rule page (Workforce Analytics, Compensation Strategy, Setup Compensation Scenario, Setup Base Pay Rules, Base Pay Compensation Rule).
Base Pay Compensation Rule page
Your next step is to use the setup data you have entered to define compensation rules. Building compensation rules is a little like creating a compensation plan. Except, rather than just specifying the compensation types that go into a compensation plan, you define rules for calculating the predicted pay out for a population of employees who participate in the compensation plan. You define rules for base pay, variable pay, and other pay (for example benefits), either individually or in any given mix that you specify.
Actionand Reason Code Enter an Action and Reason Code for the base compensation rule. The purpose ofthis step is to make the base compensation rules actionable by associating them with personnel actions.
Entering a Rule Type
Enter a Rule Type by selecting from the list of translate table values:
Amount Increase Select this option if your scenario involves an amount increase to an employee's base pay. Use Amount to enter the increase.
Equity Increase Select this option if your scenario involves an equity increase to an employee's base pay. Equity increases are pay increases granted to bring an employee's pay up to some internally specified standard. Select the type of equity in the Equity group box.
For example, you might want to bring the base pay of all your software developers up to at least the market rate midpoint. To do this, grant an equity increase to those developers whose current pay is below that level.

Managing Compensation Planning Chapter 5
138 Copyright © 1999, 2010, Oracle and/or its affiliates. All Rights Reserved.
Merit Matrix Increase Select this option if your scenario involves a merit increase to an employee's basepay. A merit increase is calculated using a merit matrix created on the Merit Matrix page. Select a Merit Matrix Code from the prompt list values, which are from the WA_CP_MERIT_DFN table.
The system uses the amount rules defined in the merit matrix, and an employee's salary review ratings, to determine the level of merit increase to grant the employee.
Percentage Increase Select this option if you want to grant a pay increase to an employee or group based upon a percentage of their current base pay. Enter the desired increase percentage in Percent of Base Pay field.
Step Progression Select this option if you want to grant a step progression increase to an employee or group, as long as their salary plan includes steps within grades. When you select this option, the system advances each affected employee one step up their pay scale.
Specifying the Equity Type
For a Rule Type of Equity Increase, specify the type of equity in the Equity group box from the following options:
Internal Pay Structure This option gives you the ability to define an equity increase based upon an employee's salary Range Penetration. Range Penetration is the degree to which an employee's actual pay has progressed through their salary grade, and is usuallyexpressed as a percentage.
For example, if you enter a value of 20% in the field, the system will not grant anequity increase to any employee in the affected group whose salary has already penetrated to this level. For any employee whose degree of range penetration is below this level, the system grants them an equity increase equal to the monetary amount needed to bring them up to this range penetration level.
The calculation is: Range penetration = (Employee Base Pay Range Minimum/(Range Maximum Range Minimum)
For example: If an employee's pay is 70,000 in a pay range with a minimum and maximum of 40,000 and 80,000, then the calculation is (70,000/ 40,000) / (80,000 / 40,000) = 30/40 = 75% range penetration.
Market Rate Select this option if you want the equity increase to be based upon the market rate values for the employee's job code and salary grade. Select the Measure ID (the percentile of the market rate) that you want to use as the control point.
In this case, for any employee whose current salary is at or above this level, the system grants them no equity increase. For any employee below this level, the system grants them an equity increase equal to the monetary amount needed to bring them up to this level.

Chapter 5 Managing Compensation Planning
Copyright © 1999, 2010, Oracle and/or its affiliates. All Rights Reserved. 139
Defining Variable Pay Rules
Access the Variable Pay Rule page (Workforce Analytics, Compensation Strategy, Setup Compensation Scenario, Setup Variable Pay Rules, Variable Pay Rule).
Variable Pay Rule page
Using this Page
To complete this page follow these three basic steps:
1. Specify the Compensation Code, Compensation Type, and VC Plan ID (variable compensation plan identification code).
2. Specify the compensation distribution Plan Type.
3. Define the compensation rules in one of the three plan type group boxes.
Identifying the Variable Compensation Code and Type
Compensation Code Select the Compensation Code for the variable compensation for which you are defining a rule. This may be any compensation code except regular base pay (600). Prompt list values are from the WA_COMP_TREE_VW table.
Compensation Type. Select a Compensation Type. Valid values are Currency Amount and Unit of Measure.
Earnings Code Select an earnings code (such as Holiday or Bonus) for the variable compensation for which you are defining a rule.

Managing Compensation Planning Chapter 5
140 Copyright © 1999, 2010, Oracle and/or its affiliates. All Rights Reserved.
VC Plan ID Associate the variable compensation rule with a VC Plan ID (variable compensation plan identification) from HRMS.
Identifying the Compensation Distribution Plan Type
Enter a compensation distribution Plan Type by selecting from the list of Translate values.
Discretionary Plan This plan type provides managers ultimate discretion over a pool of money, which is either funded based on organization, group, or employee performance, or is budgeted. The discretionary award determination is sometimes guided by a predetermined percent of the participant's salary, expressed as an opportunity. This figure can then be modified based upon management's perception of actual value created by the group or employee. For example, each participant in an annual bonus plan may have the opportunity to earn 10 percent of base salary, but that amount may be changed based on manager discretion. Some employees may receive less than 10 percent, others may receive more.
Formula Plan This compensation distribution plan type is based on a payout rule. The payout rule can be based on a flat amount, a percentage, or a data element. Whereas a target plan distributes payout based on a comparison of a performance measure against a target, in a formula plan the payout is based just on the payout rule.
Target Plan With this distribution plan type the level of award is linked directly to a predetermined level of performance. For example, a target plan for a group mightbe as follows: A group, increase the business units, net income by 10% and each member of the group is eligible for an award equal to 5% of base pay.
Specifying Discretionary Plan Details
For a Plan Type of Discretionary Plan, select the Distribution Type from the list of translate table values: Business Unit, Department, Group, Job Code, and Location. You can choose to vary the distribution, or compensation pay out, to employees using any one of these dimensions. For any of these options select a Payout Rule ID from the list of prompt values, which are from the WA_CP_PYOUT_DFN table.
The discretionary plan takes the results of a payout rule, but distributes it based on the Distribution Type field. For example, if the Distribution Type is Department, the payout is distributed as a fraction of how manyemployees belong to a particular department. That is, if person X belongs in a department of 10 people and the payout to be distributed is 1000 units, each employee in that department receives 100 units as a pay out.
Specifying Formula Plan Details
The formula plan calculation process takes the results of a payout rule and distributes it to each employee in aworkforce group who has that compensation rule assigned to it, without prorating or otherwise diluting the payout.
Select a Payout Rule ID for the formula plan from the list of prompt values, which are from the WA_CP_PYOUT_DFN table.

Chapter 5 Managing Compensation Planning
Copyright © 1999, 2010, Oracle and/or its affiliates. All Rights Reserved. 141
Specifying Target Plan Details
For a Plan Type of Target Plan, select the Data Element ID from the prompt list values, which are from the WA_CP_ELEM_VW table. The target plan applies a case or evaluation method for determining what payout is paid to an employee. The level of award for an employee is linked directly to a predetermined level of performance.
Note. Remember, if you are using a goals matrix with a target plan, you create a goals matrix on the Goals Matrix page. Then you tie the goals matrix to a data element on the Data Element page. The data element thatyou select using this page is the one that references the goals matrix you want to use with this target plan.
In the Compare Type field specify whether you want the first Data Element compared against a Static Value or against another Data Element. If you select Static Value, then complete the following fields:
Load Sequence Enter a number to indicate the sequence in which you want the rules processed. To enter multiple rules insert additional data rows.
Operator Select an arithmetic operand from the list of values. Valid values include Less Than, Less Than or Equal To, Not Equal To, Equal To, Greater Than, and Greater Than or Equal To.
Value Enter the comparison value as a numeric value.
Payout ID Indicate the Payout Rule ID you want to associate this condition with. Prompt listvalues are from the WA_CP_PYOUT_DFN table.
If you select Data Element, then complete the following fields:
Load Sequence Enter a number to indicate the sequence in which you want the rules processed. To enter multiple rules insert additional data rows.
Operator Select an arithmetic operand from the list values. Valid values include Less Than,Less Than or Equal To, Not Equal To, Equal To, Greater Than, and Greater Thanor Equal To.
Data Element ID Select a Data Element ID from the prompt list values, which are from the WA_CP_ELEM_VW table.
Payout ID Indicate the Payout Rule ID you want to associate this condition with. Prompt listvalues are from the WA_CP_PYOUT_DFN table.
Specifying Other Pay Rules
Access the Other Pay Rule page (Workforce Analytics, Compensation Strategy, Setup Compensation Scenario, Setup Other Pay Rules, Other Pay Rule) entering a setID and compensation Rule ID.
This page is essentially the same as the Variable Pay Rule page, with the following exceptions:
• It does not have the variable compensation plan ID field.

Managing Compensation Planning Chapter 5
142 Copyright © 1999, 2010, Oracle and/or its affiliates. All Rights Reserved.
• Its intended use is for benefits-related compensation, so instead of earning code field it has a benefit plan field
Setting Up Frequency Details for Compensation Models
You use Frequency ID Codes on the Compensation Model page. You set up these codes on the EPM Foundation, EPM Setup, Common Definitions, Calendars, Frequency and Frequency Details pages. You can also access the Frequency Details page directly from the Workforce Analytics, Compensation Strategy menu, enabling you to review the frequency IDs in the system. These pages are documented in the Enterprise Performance Management Fundamentals 9.1 PeopleBook.
See Also
PeopleSoft Enterprise Performance Management Fundamentals 9.1 PeopleBook, "Setting Up EPM Business Rules," Defining Accounting Calendars
Setting Up Workforce Groups for Compensation Models
You use workforce groups on the Compensation Model page. You set up workforce groups using the Workforce Analytics, Workforce Analytics Setup, Workforce Groups component. These pages are documented in the PeopleSoft Enterprise Workforce Analytic Applications 9.1 PeopleBook.
See Also
PeopleSoft Enterprise Workforce Analytic Applications 9.1 PeopleBook, "Setting Up Workforce Groups and Group Sets"
Setting Up Model IDs for Compensation Models
Before you use the Compensation Model page, you must set up a model ID on the EPM Foundation, BusinessMetadata, Business Framework, Models page. This page is documented in the Enterprise Performance Management Fundamentals 9.1 PeopleBook.
See Also
PeopleSoft Enterprise Performance Management Fundamentals 9.1 PeopleBook, "Setting Up Models and Scenarios," Defining Models and Scenarios
Defining a Compensation Planning and Simulation Model
Access the Compensation Model page (Workforce Analytics, Compensation Strategy, Setup Compensation Scenario, Setup Compensation Model, Compensation Model).

Chapter 5 Managing Compensation Planning
Copyright © 1999, 2010, Oracle and/or its affiliates. All Rights Reserved. 143
Compensation Model page
Understanding the Purpose of this Page
The purpose of this page is to tie together the setID, model ID, workforce groups, compensation rules, and calculation frequencies needed to use the model in a scenario. The model definition tells the Compensation Planning and Simulation process (WA_CPS) what compensation data to calculate for what group of employees, and on what frequency.
Two Methods for Beginning the Model Definition
You have option of cloning your model and rules from an existing one. To do this select a model ID in the Clone Model ID field. Prompt values are from the WA_CP_MODL_TBL table. If you choose to do this, edit the model setup and rules to create your new model.
You also have the option of creating your new model manually. To do this bypass the Clone Model ID field and proceed to complete the fields on the remainder of the page.
In the Group ID field, select the overall workforce group which encompasses all of the workers you want to include in the model. Prompt values are from the WA_CP_GROUP_DFN table.

Managing Compensation Planning Chapter 5
144 Copyright © 1999, 2010, Oracle and/or its affiliates. All Rights Reserved.
Select the Include Current Pay check box if you want the system to automatically include employees' current base salary in their compensation calculations. This is useful when you want to model the total compensation impact of compensation changes. Leave it cleared if you want the system to omit current pay from the compensation calculations. This is useful when you want to model only the change in compensation.
Note. Always select the Include Current Pay option if you plan to use the data from a compensation analytic model in the Planning and Budgeting Position Budgeting feature.
Defining the Rule Sequence
Use the Rule Sequence group box to specify the sequence of groups and compensation rules you want to include in the model.
Sequence When you specify multiple compensation rules for your compensation model, you must specify the sequence in which you want them processed. The system inserts default sequence numbers, but the field is editable, so you can change the sequence.
Group ID Select a workforce group ID from the prompt list values, which are from the WA_CP_GROUP_DFN table. The workers in this group must be a subset of the overall group specified above, in the model definition.
Rule ID Select a compensation rule ID from the prompt list values, which are from the WA_CP_RULE_VW3 table.
Frequency ID Select a calculation frequency ID from the prompt list values, which are from thePF_FREQ_DTL table.
Workforce Group Info and Compensation Rule Info
Click the Workforce Group Info or Compensation Rule Info button to the right of the Group ID and Rule ID fields to access the Workforce Group Description and Compensation Rule Description pages, and view the descriptions of the groups or rules.
Setting Up Compensation Scenario IDs
Before you run the Compensation Planning and Simulation process in Compensation Strategy, you must haveset up a scenario ID using the EPM Foundation, Business Metadata, Business Framework, Scenarios page. These pages are documented in the Enterprise Performance Management Fundamentals 9.1 PeopleBook.
See Also
PeopleSoft Enterprise Performance Management Fundamentals 9.1 PeopleBook, "Setting Up Models and Scenarios," Defining Models and Scenarios
Generating the Compensation Planning Scenario
Access the Run Compensation Scenario - Run Jobstream page (Workforce Analytics, Compensation Strategy,Setup Compensation Scenario, Run Compensation Scenario, Run Compensation Scenario - Run Jobstream).
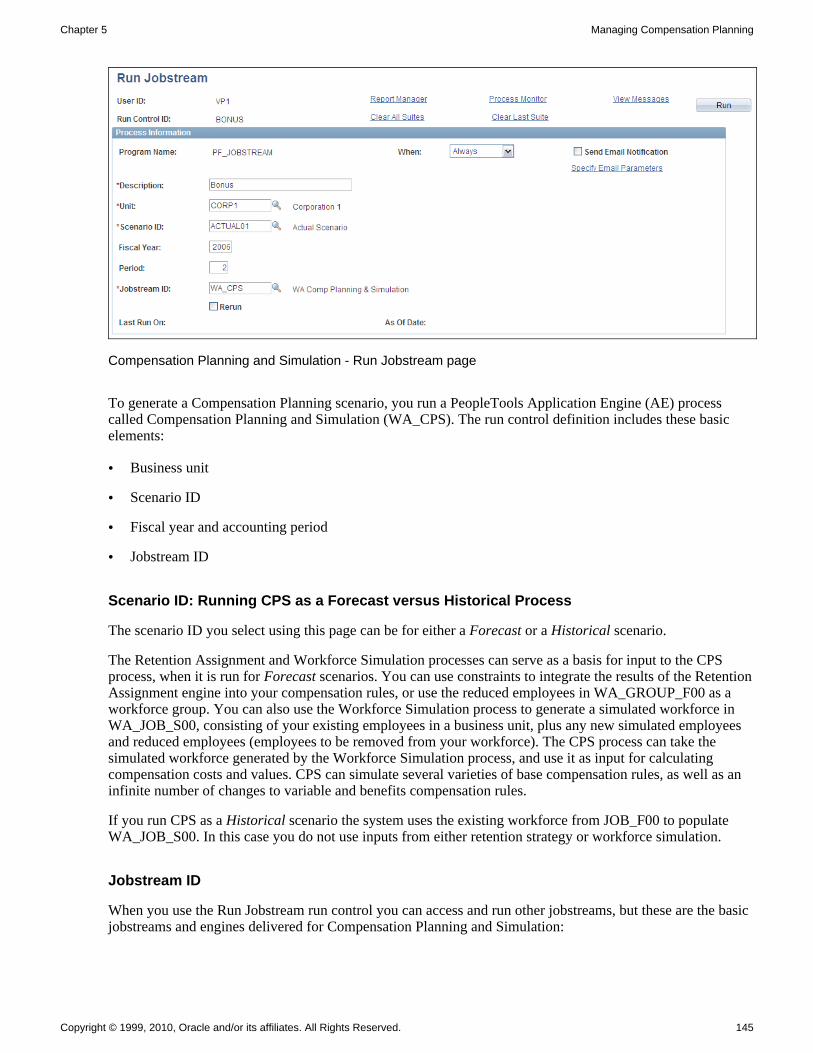
Chapter 5 Managing Compensation Planning
Copyright © 1999, 2010, Oracle and/or its affiliates. All Rights Reserved. 145
Compensation Planning and Simulation - Run Jobstream page
To generate a Compensation Planning scenario, you run a PeopleTools Application Engine (AE) process called Compensation Planning and Simulation (WA_CPS). The run control definition includes these basic elements:
• Business unit
• Scenario ID
• Fiscal year and accounting period
• Jobstream ID
Scenario ID: Running CPS as a Forecast versus Historical Process
The scenario ID you select using this page can be for either a Forecast or a Historical scenario.
The Retention Assignment and Workforce Simulation processes can serve as a basis for input to the CPS process, when it is run for Forecast scenarios. You can use constraints to integrate the results of the RetentionAssignment engine into your compensation rules, or use the reduced employees in WA_GROUP_F00 as a workforce group. You can also use the Workforce Simulation process to generate a simulated workforce in WA_JOB_S00, consisting of your existing employees in a business unit, plus any new simulated employees and reduced employees (employees to be removed from your workforce). The CPS process can take the simulated workforce generated by the Workforce Simulation process, and use it as input for calculating compensation costs and values. CPS can simulate several varieties of base compensation rules, as well as an infinite number of changes to variable and benefits compensation rules.
If you run CPS as a Historical scenario the system uses the existing workforce from JOB_F00 to populate WA_JOB_S00. In this case you do not use inputs from either retention strategy or workforce simulation.
Jobstream ID
When you use the Run Jobstream run control you can access and run other jobstreams, but these are the basic jobstreams and engines delivered for Compensation Planning and Simulation:
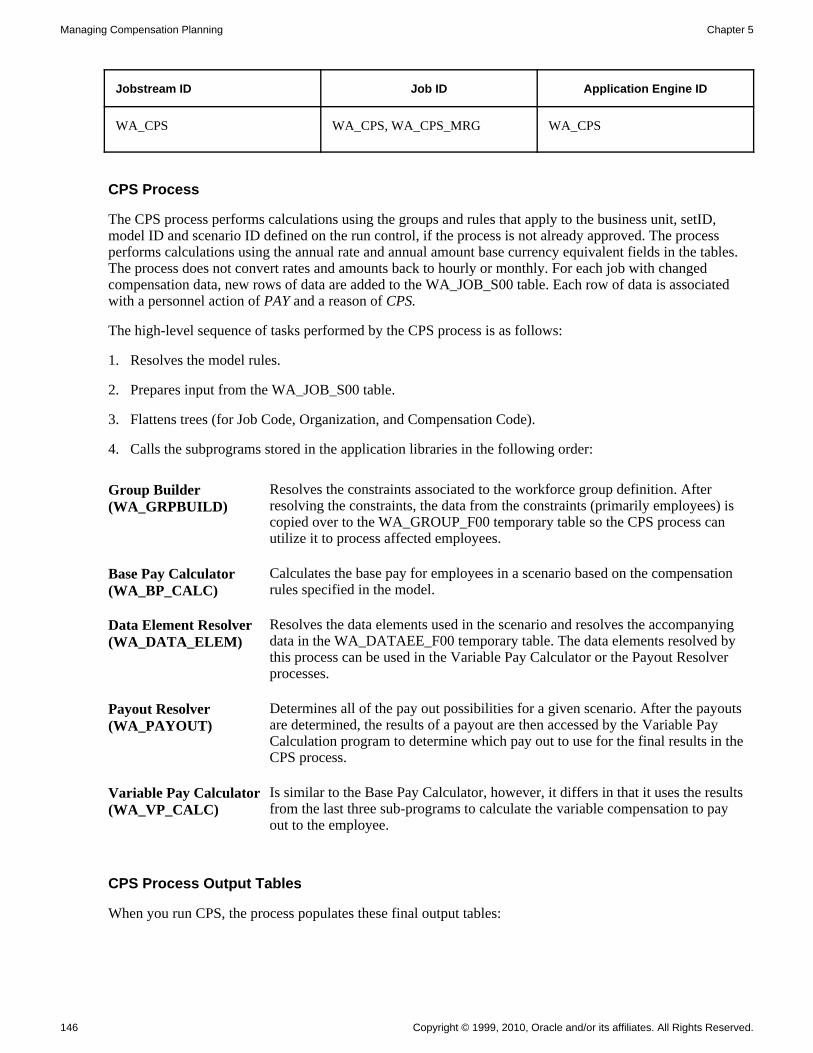
Managing Compensation Planning Chapter 5
146 Copyright © 1999, 2010, Oracle and/or its affiliates. All Rights Reserved.
Jobstream ID Job ID Application Engine ID
WA_CPS WA_CPS, WA_CPS_MRG WA_CPS
CPS Process
The CPS process performs calculations using the groups and rules that apply to the business unit, setID, model ID and scenario ID defined on the run control, if the process is not already approved. The process performs calculations using the annual rate and annual amount base currency equivalent fields in the tables. The process does not convert rates and amounts back to hourly or monthly. For each job with changed compensation data, new rows of data are added to the WA_JOB_S00 table. Each row of data is associated with a personnel action of PAY and a reason of CPS.
The high-level sequence of tasks performed by the CPS process is as follows:
1. Resolves the model rules.
2. Prepares input from the WA_JOB_S00 table.
3. Flattens trees (for Job Code, Organization, and Compensation Code).
4. Calls the subprograms stored in the application libraries in the following order:
Group Builder (WA_GRPBUILD)
Resolves the constraints associated to the workforce group definition. After resolving the constraints, the data from the constraints (primarily employees) is copied over to the WA_GROUP_F00 temporary table so the CPS process can utilize it to process affected employees.
Base Pay Calculator (WA_BP_CALC)
Calculates the base pay for employees in a scenario based on the compensation rules specified in the model.
Data Element Resolver (WA_DATA_ELEM)
Resolves the data elements used in the scenario and resolves the accompanying data in the WA_DATAEE_F00 temporary table. The data elements resolved by this process can be used in the Variable Pay Calculator or the Payout Resolver processes.
Payout Resolver (WA_PAYOUT)
Determines all of the pay out possibilities for a given scenario. After the payouts are determined, the results of a payout are then accessed by the Variable Pay Calculation program to determine which pay out to use for the final results in the CPS process.
Variable Pay Calculator (WA_VP_CALC)
Is similar to the Base Pay Calculator, however, it differs in that it uses the results from the last three sub-programs to calculate the variable compensation to pay out to the employee.
CPS Process Output Tables
When you run CPS, the process populates these final output tables:

Chapter 5 Managing Compensation Planning
Copyright © 1999, 2010, Oracle and/or its affiliates. All Rights Reserved. 147
Table Purpose
WA_CALC_F00 Stores all final calculation results of the CPS process. This includes the appropriate costs or value per employee based on the rules specified in the scenario. The system only performs calculations for, and updates, the annual rate and annual amount base currency equivalent fields in the table. The system does not convert rates and amounts back to hourly or monthly. If part of the scenario process run includes a workforce simulation where simulated employees are added to the workforce, the new employees are assigned a currency code (in WA_JOB_S00) that is the same as the existing employees for that same scenario.
WA_JOB_S00 A clone of JOB_F00 with the addition of PF_SCENARIO_ID in it. For each job with changed base compensation data, new rows of data are added to the table. Each row of data is associated with a personnel action of PAY and a reason of CPS.
WA_GROUP_F00 Contains the list of employees in a workforce group specified in the scenario. WA_GROUP_F00 is populated by both WFS and CPS. If a reduction rule is specified in the scenario, the WA_GROUP_F00 table is populated with the employees that are to be reduced from the workforce during the WFS run. A reduction rule points to a workforce group to be reduced, this forces the WFS process to call the Group Builder process to run and create the group in WA_GROUP_F00.
WA_DATAEE_F00 Contains the resolved values for all data elements specified in the scenario. The table is populated by the WA_DATA_ELEM AE library that is called by CPS.
WA_JOBPAY_F00 Contains base pay compensation data for employees in the scenario calculations. Provides you the ability to direct the CPS process to either include or exclude current base pay from the process calculations.
Loading the Analytic Model
After the CPS Process generates your scenario, it automatically calls the Load Analytic Model (WA_CP_BAM_LD) application engine to generate an analytic model instance with the same ID as the scenario ID. Hence, you need not run the process from the Load Compensation ACE Model page. You can still manually load an analytic model using the page, should you wish to reload the model or to load the scenario results into multiple analytic models.
Immediately after the Load Analytic Model application engine process completes, you can review the scenario results in the ACE model.

Managing Compensation Planning Chapter 5
148 Copyright © 1999, 2010, Oracle and/or its affiliates. All Rights Reserved.
Reviewing and Analyzing a Compensation Scenario
This section provides an overview of compensation scenario review and analysis and discusses how to:
• Run Crystal reports to review your scenario.
• Review results of data elements applied to a scenario.
• Review merit matrix table setup.
• Review pay rules setup.
• Review compensation scenario.
Understanding Compensation Scenario Review and Analysis
By generating a Compensation Planning and Simulation (CPS) scenario and running the Compensation Planning and Simulation Application Engine process (WA_CPS), you produce results that define a compensation strategy and budget. The next step is to review your work and analyze the results of your scenario. To assist you we provide the following analysis tools:
• Six Crystal reports to review the setup for your calculation, payout rules, and compensation rules, and compensation models.
• The Compensation Scenario Analysis component to review and analyze compensation scenario output.
Note. Using this component you can also make changes to the compensation scenario output. However, ifyou save changes to an approved scenario the status is reset to awaiting approval.
Analyzing and reviewing your compensation scenario is an iterative process. If you don not think the data output from your scenario is satisfactory, then go back to the various setup steps outlined in this chapter and change the groups and rules as needed. Then run the Compensation Scenario process over again, and analyze and review the results. Keep doing this until you are satisfied you have identified the scenario with the desired results.
Understanding the Compensation Scenario Analysis Component
The Compensation Scenario Analysis component provides functionality to enable a compensation analyst to review and alter the results of a CPS scenario online using ACE (Analytic Calculation Engine). ACE is a decision support tool that provides real-time, multidimensional modeling. With ACE the compensation analyst can review, analyze and alter CPS scenario results to ensure they meet the overall compensation strategy and budget of your organization. The analyst can analyze and alter scenario results without having to change the model and rules, and rerun the process.
There are nine pages in the Compensation Scenario Analysis component, each designed to analyze a specific aspect of the compensation scenario output. The Compensation Scenario Summary page is designed to view and analyze the compensation allocation in the scenario across any combination of dimensions. The remaining pages provide a preset combination of dimensions that enable you to alter the data at the plan, rule,group, department and employee level, and by amount or percent.

Chapter 5 Managing Compensation Planning
Copyright © 1999, 2010, Oracle and/or its affiliates. All Rights Reserved. 149
Pages in the Compensation Scenario Analysis component display one of two views:
• Budget plan: For base pay rules a budget plan is the roll up of values for action reasons. For variable pay rules a budget plan is the roll up of the values for variable compensation plan IDs. In this view the budget plan roll-ups are displayed, but not the breakdown of data for individual compensation rules.
• Compensation rule: In this view the breakdown of data for individual compensation rules is displayed.
For more information regarding the Analytic Calculation Engine, see the Enterprise PeopleTools PeopleBook: PeopleSoft Analytic Calculation Engine.
Using the Compensation Scenario Analysis Component
Each page in the Compensation Scenario Analysis component has an analytic grid for multidimensional analysis. The grid contains data cubes (categories of data) and dimensions. You can use the analytic grid to edit your data, pivot data cubes and dimensions (move them between the row and column axis of the grid) to gain a different view of your data, and view selected "slices" of your data. Within an analytic grid, you can expand and collapse those dimensions that have a hierarchical structure; you can also drill down into such dimensions.
You can alter the results of the scenario in the grid. For example, you can alter the Employee Value, Employer Expense or the Allocated Stock Units by entering an amount or percentage in the Alter Method andAmount columns. The Current Altered Amount and Altered Stock Units automatically reflect the result of this change. The system also prorates this change across all rows that roll up to this level. Any changes to the Stock Units are reflected in the Employee Value column. The Total Altered Expense and Total Altered Value reflect the aggregated results of all the changes you make in other pages when altering the data by different dimensions. The Average Value reflect the average amount per employee for each dimension members combination (excluding zero amounts). You can also modify preferences within the grid—saving a particular layout that you have created or returning to the default grid layout.
Note. The system does not allow you to alter a value of 0. For example, if a row in the Stock Units column displays "0", you cannot adjust it in the Alter Method and Amount columns.
All prorated amounts are rounded to the nearest cent and stock units are rounded to whole number. This may result in some discrepancy between target amounts and total altered amounts, which is expected due to rounding and aggregation.
If multiple users are altering the same model simultaneously, they may override each other yielding unpredictable results and error messages. It is thus not recommended that multiple users access the same model simultaneously.
Each grid contains a slice bar, which enables you to view a subset of your data. You can slice your data by choosing from any list—representing data cubes or dimensions—that appears on the slice bar by default. In addition, you can add data cubes or dimensions to the slice bar and use them to view alternate slices of your data.
Each page in the component also contains a graphic chart to represent your data. The bar charts compare the total altered Employer Expense to the total altered Employee Value for the scenario, and a specific dimension(such as budget plan or employee). The x axis displays the first dimension in the grid. When you hold the cursor over the charts, they also display the exact monetary amounts for Total Employer Expense and Total Employee Value for the scenario.
Note. Charts can respond to changes you make in the grid, but this requires that you click the Refresh Chart button.

Managing Compensation Planning Chapter 5
150 Copyright © 1999, 2010, Oracle and/or its affiliates. All Rights Reserved.
Although the intersections of data, or dimensions, presented on each page of the Compensation Scenario Analysis component are different, the basic page function and grids are the same. With the Compensation Scenario Analysis component you can:
• Review the compensation allocations in the scenario across a given set of dimensions.
• Determine if the allocations are in alignment with your organization's compensation strategy and budgeting constraints.
• Manipulate the scenario output at the department, group, employee and compensation rule level.
Limiting Access to the Compensation Scenario Analysis Component
You can limit access to the component using PeopleTools security (permission list) so that only certain users can review or alter scenarios. In addition to PeopleTools security, you can strictly limit access to scenarios using scenario-level security. If a user does not have security access for a given scenario, they cannot access it. If you grant users access to a scenario, they have access to all scenario data within that scenario, so that they can view all the data they are approving. Therefore, for those operators you have granted such security, you may also want to grant them department level security for all department within their scenarios. This enables them to review all the employees on pages with department-level security.
Note. When working with the Department dimension in the Compensation Scenario Analysis component, you can only select, view, and drill down to departments and employees for which you are authorized. Non authorized departments and employees are not available. The totals, however, represent the overall total amounts for all employees, regardless of security access.
Pages Used to Review and Analyze Your Compensation Scenario
Page Name Definition Name Navigation Usage
Data Element Definition report
RUN_RWA_0016 Workforce Analytics, Workforce Reports, Compensation Strategy Reports, Data Elements, Data Element Definition
Run the Data Element Definition Crystal report (WAC0016).
Goals Matrix report RUN_RWA_0015 Workforce Analytics, Workforce Reports, Compensation Strategy Reports, Goals Matrix, Goals Matrix
Run the Goals Matrix Crystal report (WAC0015).
Merit Matrix report RUN_RWA_0017 Workforce Analytics, Workforce Reports, Compensation Strategy Reports, Merit Matrix, Merit Matrix
Run the Merit Matrix Crystal report (WAC0017).
Payout Rules report RUN_RWA_0014 Workforce Analytics, Workforce Reports, Compensation Strategy Reports, Payout Rules, Payout Rules
Run the Payout Rules Crystal report (WAC0014).

Chapter 5 Managing Compensation Planning
Copyright © 1999, 2010, Oracle and/or its affiliates. All Rights Reserved. 151
Page Name Definition Name Navigation Usage
Compensation Rules report RUN_RWA_0013 Workforce Analytics, Workforce Reports, Compensation Strategy Reports, Compensation Rules, Compensation Rules
Run the Compensation Rules Crystal report (WAC0013).
CPS Model Definition report
RUN_RWA_0012 Workforce Analytics, Workforce Reports, Compensation Strategy Reports, Compensation Model, CPS Model Definition
Run the CPS Model Definition Crystal report (WAC0012).
Review Data Elements WA_ELEM_INQ Workforce Analytics, Compensation Strategy, Analyze and Approve, Review Data Elements, Review Data Elements
Review the results of the data elements included in a scenario.
Base Pay Rule WA_CP_BP_INQ Workforce Analytics, Compensation Strategy, Analyze and Approve, Review Rules, Base Pay Rule
Review the compensation rules setup for base pay rules.
Variable Pay Rule WA_CP_VC_INQ Workforce Analytics, Compensation Strategy, Analyze and Approve, Review Rules, Variable PayRule
Review the compensation rules setup for variable pay rules.
Compensation Scenario Summary
WA_CP_ACE_BUD_TOT Workforce Analytics, Compensation Strategy, Analyze and Approve, Analyze and Alter Scenario,Compensation Scenario Summary
Review a summary of the employer expenses versus employee values for a compensation planning scenario.
Budget Plan WA_CP_ACE_BUD_ALT Workforce Analytics, Compensation Strategy, Analyze and Approve, Analyze and Alter Scenario,Budget Plan
Review and alter the compensation allocations in the scenario across the budget plan dimension.
Compensation Rule WA_CP_ACE_RULE_ALT Workforce Analytics, Compensation Strategy, Analyze and Approve, Analyze and Alter Scenario,Compensation Rule
Review and alter the compensation allocations in the scenario across the budget plan and compensation rule dimensions.

Managing Compensation Planning Chapter 5
152 Copyright © 1999, 2010, Oracle and/or its affiliates. All Rights Reserved.
Page Name Definition Name Navigation Usage
Group and Plan WA_CP_ACE_BDGR_ALT Workforce Analytics, Compensation Strategy, Analyze and Approve, Analyze and Alter Scenario,Group and Plan
Review and alter the compensation allocations in the scenario across the eligibility group and budget plan dimensions.
Group and Rule WA_CP_ACE_RUGR_ALT Workforce Analytics, Compensation Strategy, Analyze and Approve, Analyze and Alter Scenario,Group and Rule
Review and alter the compensation allocations in the scenario across the eligibility group and compensation rule dimensions.
Department and Plan WA_CP_ACE_BDDP_ALT Workforce Analytics, Compensation Strategy, Analyze and Approve, Analyze and Alter Scenario,Department and Plan
Review and alter the compensation allocations in the scenario across the department and budget plan dimensions.
Department and Rule WA_CP_ACE_RUDP_ALT Workforce Analytics, Compensation Strategy, Analyze and Approve, Analyze and Alter Scenario,Department and Rule
Review and alter the compensation allocations in the scenario across the department and compensation rule dimensions.
Employee and Plan WA_CP_ACE_BDEM_ALT Workforce Analytics, Compensation Strategy, Analyze and Approve, Analyze and Alter Scenario,Employee and Plan
Review and alter the compensation allocations in the scenario across the employee and budget plan dimensions.
Employee and Rule WA_CP_ACE_RUEM_ALT Workforce Analytics, Compensation Strategy, Analyze and Approve, Analyze and Alter Scenario,Employee and Rule
Review and alter the compensation allocations in the scenario across the employee and compensationrule dimensions.
Common Elements Used in the Compensation Scenario Analysis Pages
The following fields are common to each page in the Compensation Scenario Analysis component.
Recalculate and Save Click to recalculate any allocation values you have modified and save those changes to the database.
Refresh Chart Click to refresh the chart and its values when you have modified the results in thegrid by dragging and dropping elements
Chart Type Select the type of chart you would like displayed for your analysis.
You can select Bar or Pie.

Chapter 5 Managing Compensation Planning
Copyright © 1999, 2010, Oracle and/or its affiliates. All Rights Reserved. 153
Return to Search Click link to return to the search page without unloading the current model from the analytic server.
This speeds loading of the page next time you access it.
Unload and Return to Search
Click link to unload the model from the analytic server and return to the search screen.
This action helps to free up memory, in consideration of the limited resources of the analytic server. All your saved entries will show in the grid the next time you load the model. The model will also time out and unload after approximately one hour of inactivity.
EmplID All employee IDs in the Compensation Scenario Analysis component display a value that is comprised of the employee ID concatenated with the employee record number. Hence, if employee A had an employee ID equal to 100 and an employee record number equal to 1, the employee ID displays 1001 for employeeA in the component.
Running Crystal Reports to Review your Scenario
Use the following Crystal reports to review the data setup for your Compensation Strategy system:
• Data Elements Crystal report (WAC0016) for reviewing your data elements.
• Goals Matrix Crystal report (WAC0015) for reviewing your goal matrixes.
• Merit Matrix Crystal report (WAC0017) for reviewing your merit matrixes.
• Payout Rules Crystal report (WAC0014) for reviewing your payout rules.
• Compensation Rules Crystal report (WAC0013) for reviewing your compensation rules.
• Compensation Model Crystal report (WAC0012) for reviewing your compensation models.
Note. Samples of these reports are provided with your documentation.
See Also
Appendix B, "Workforce Rewards Reports," page 183
Reviewing the Results of Data Elements Applied to a Scenario
Access the Review Data Elements page (Workforce Analytics, Compensation Strategy, Analyze and Approve, Review Data Elements, Review Data Elements).

Managing Compensation Planning Chapter 5
154 Copyright © 1999, 2010, Oracle and/or its affiliates. All Rights Reserved.
Review Data Elements page
Entering Search Criteria
Use the active fields at the top of the screen to indicate search criteria for the rows of data you want to see displayed in the grid on the bottom of the page.
Business Unit and Scenario ID
Enter a business unit and a scenario ID from the prompt list values, which are from the SP_BU_PF_NONVW and SCENARIO_SRCH tables, respectively.
Fiscal Year and Accounting Period,
Enter values for fiscal year and accounting period as search criteria.
Data Element ID and Empl ID
Enter data element ID and empl ID values as further search criteria.
These values are optional and are taken from the WA_CP_ELEM_DFN and PERSONAL_SRCH tables, respectively.

Chapter 5 Managing Compensation Planning
Copyright © 1999, 2010, Oracle and/or its affiliates. All Rights Reserved. 155
Search Once you have entered your search criteria, click the Search button.
Data Elements After the search is performed the system retrieves the requested rows of data and displays them in the Data Elements grid on the bottom of the page.
Reviewing the Data Elements Data
Based on your search criteria, the system displays a row of data for each employee in the scenario whose compensation calculations were based on a data element. You use the display to view the results of the data elements after the Compensation Planning and Simulation process is run. For example, if you want to view the results of an employee's goals matrix score, do that here.
Note. If no data is available for the search criteria entered , a note appears in the grid informing you that no data is available.
For each row of data displayed, the system provides the EmplID and:
Empl Rcd# (employment record number)
The Employment Record Number is used for employees with multiple jobs.
Data Element ID The Data Element ID and description that was used in a compensation rule for this employee in this scenario.
Measure Amount The value associated with the data element. For example, if the data element you are looking at is for a goals matrix score, the measure amount is the actual score.
Note. On inquiry pages such as this one, row-level security can go down to the employee level. This means, ifyour implementation has row-level security, and you don't have security to see an employee, you won't. The employees you see in the grid, on this page, can vary depending upon your level of security access.
Reviewing Base Pay Rules Setup
Access the Base Pay Rule (summary) page (Workforce Analytics, Compensation Strategy, Analyze and Approve, Review Rules, Base Pay Rule).
Base Pay Rule page

Managing Compensation Planning Chapter 5
156 Copyright © 1999, 2010, Oracle and/or its affiliates. All Rights Reserved.
This page summarizes the base pay rules you defined in the Base Pay Rules and Other Pay Rules pages. This page displays the setup for the selected compensation rule from the WA_CP_RULE_DFN table, and differentfields display depending upon the compensation rule selected.
Reviewing Variable Pay Rules Setup
Access the Variable Pay Rule (summary) page (Workforce Analytics, Compensation Strategy, Analyze and Approve, Review Rules, Variable Pay Rule).
Variable Pay Rule page
This page summarizes the base pay rules you defined in the Variable Pay Rules and Other Pay Rules pages. This page displays the setup for the selected compensation rule from the WA_CP_RULE_DFN table, and different fields display depending upon the compensation rule selected.
Reviewing the Compensation Scenario Summary
Access the Compensation Scenario Summary page (Workforce Analytics, Compensation Strategy, Analyze and Approve, Analyze and Alter Scenario, Compensation Scenario Summary).

Chapter 5 Managing Compensation Planning
Copyright © 1999, 2010, Oracle and/or its affiliates. All Rights Reserved. 157
Compensation Scenario Summary page 1 of 2
Compensation Scenario Summary page 2 of 2
The Compensation Scenario Summary page displays period level data about the scenario compensation costs.The compensation costs are categorized as either an Employer Expense or an Employee Value. For each accounting Period, the system displays the monetary amounts for the Average Value, total altered Employee Value, and total Altered Employer Expense.

Managing Compensation Planning Chapter 5
158 Copyright © 1999, 2010, Oracle and/or its affiliates. All Rights Reserved.
The page also includes all the dimensions and attributes available for analysis as well as variance columns to reflect the results of your changes in the other pages. These variance columns are: Expense Variance, Value Variance, Stock Units Variance. The variances indicate the difference between the original scenario budgeted amounts and your alterations.
Note. You cannot make alterations in this page.
Reviewing the Budget Plan
Access the Budget Plan page (Workforce Analytics, Compensation Strategy, Analyze and Approve, Analyze and Alter Scenario, Budget Plan).
Budget Plan page 1 of 2

Chapter 5 Managing Compensation Planning
Copyright © 1999, 2010, Oracle and/or its affiliates. All Rights Reserved. 159
Budget Plan page 2 of 2
The Budget Plan page displays budget plan rule level data about the scenario compensation costs. The compensation costs are categorized as either an Employer Expense or an Employee Value. For each budget plan the system also displays the monetary amounts for the Average Value, Current Altered Amount, Altered Employee Value, Total Altered Employer Expense, and Average Altered Value.
You can use this page to alter the amounts using the Alter Method and Amount cells, when available.
Reviewing the Compensation Rule
Access the Compensation Rule page (Workforce Analytics, Compensation Strategy, Analyze and Approve, Analyze and Alter Scenario, Compensation Rule).

Managing Compensation Planning Chapter 5
160 Copyright © 1999, 2010, Oracle and/or its affiliates. All Rights Reserved.
Compensation Rule page 1 of 2
Compensation Rule page 2 of 2
The Compensation Rule page displays budget plan rule level data about the scenario compensation costs. Thecompensation costs are categorized as either an Employer Expense or an Employee Value. For each budget plan the system also displays the monetary amounts for the Average Value, Current Altered Amount, Altered Employee Value, Total Altered Employer Expense, and Average Altered Value.
You can also alter the amounts on this page using the Alter Method and Amount cells, when available.

Chapter 5 Managing Compensation Planning
Copyright © 1999, 2010, Oracle and/or its affiliates. All Rights Reserved. 161
Reviewing the Workforce Group and Budget Plan
Access the Group and Plan page (Workforce Analytics, Compensation Strategy, Analyze and Approve, Analyze and Alter Scenario, Group and Plan).
Group and Plan page 1 of 2
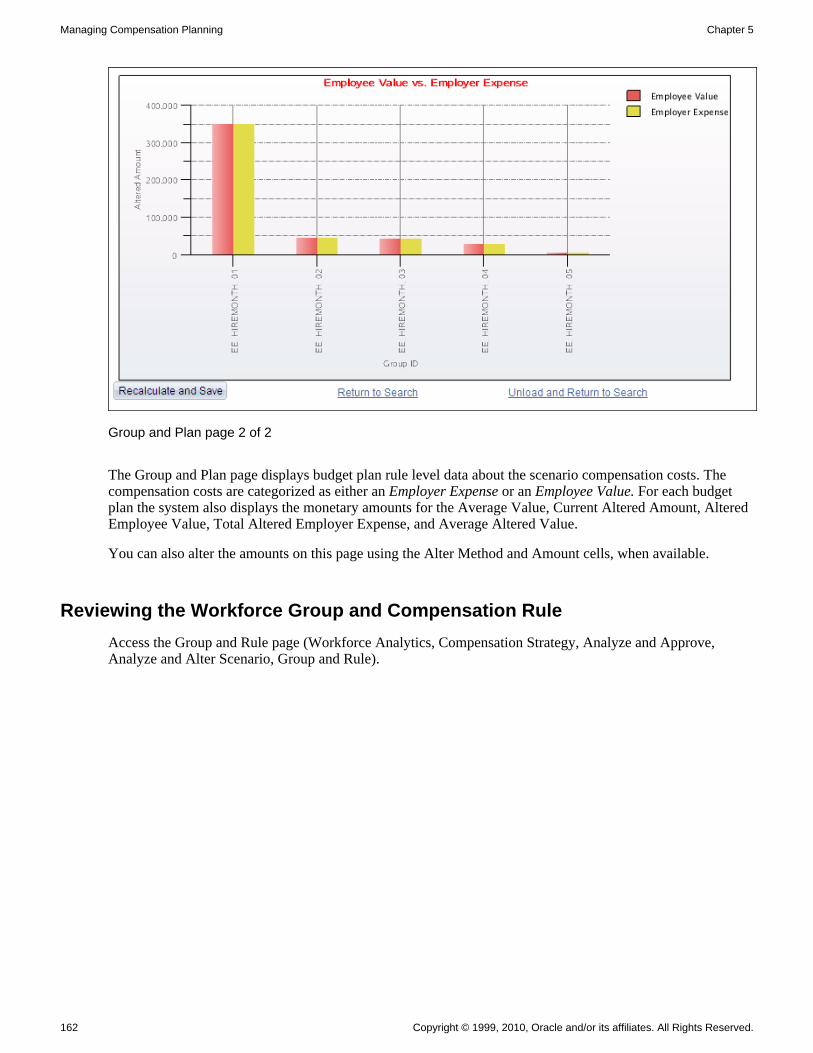
Managing Compensation Planning Chapter 5
162 Copyright © 1999, 2010, Oracle and/or its affiliates. All Rights Reserved.
Group and Plan page 2 of 2
The Group and Plan page displays budget plan rule level data about the scenario compensation costs. The compensation costs are categorized as either an Employer Expense or an Employee Value. For each budget plan the system also displays the monetary amounts for the Average Value, Current Altered Amount, Altered Employee Value, Total Altered Employer Expense, and Average Altered Value.
You can also alter the amounts on this page using the Alter Method and Amount cells, when available.
Reviewing the Workforce Group and Compensation Rule
Access the Group and Rule page (Workforce Analytics, Compensation Strategy, Analyze and Approve, Analyze and Alter Scenario, Group and Rule).

Chapter 5 Managing Compensation Planning
Copyright © 1999, 2010, Oracle and/or its affiliates. All Rights Reserved. 163
Group and Rule page 1 of 2
Group and Rule page 2 of 2

Managing Compensation Planning Chapter 5
164 Copyright © 1999, 2010, Oracle and/or its affiliates. All Rights Reserved.
The Group and Rule page displays budget plan rule level data about the scenario compensation costs. The compensation costs are categorized as either an Employer Expense or an Employee Value. For each budget plan the system also displays the monetary amounts for the Average Value, Current Altered Amount, Altered Employee Value, Total Altered Employer Expense, and Average Altered Value.
You can also alter the amounts on this page using the Alter Method and Amount cells, when available.
Reviewing the Department and Budget Plan
Access the Department and Plan page (Workforce Analytics, Compensation Strategy, Analyze and Approve, Analyze and Alter Scenario, Department and Plan).

Chapter 5 Managing Compensation Planning
Copyright © 1999, 2010, Oracle and/or its affiliates. All Rights Reserved. 165
Department and Plan page
The Department and Plan page displays budget plan rule level data about the scenario compensation costs. The compensation costs are categorized as either an Employer Expense or an Employee Value. For each budget plan the system also displays the monetary amounts for the Average Value, Current Altered Amount, Altered Employee Value, Total Altered Employer Expense, and Average Altered Value.
This page enables you to view the department data by departmental roll-up totals or for one department only. You can also alter the amounts on this page using the Alter Method and Amount cells, when available.

Managing Compensation Planning Chapter 5
166 Copyright © 1999, 2010, Oracle and/or its affiliates. All Rights Reserved.
Reviewing the Department and Compensation Rule
Access the Department and Rule page (Workforce Analytics, Compensation Strategy, Analyze and Approve, Analyze and Alter Scenario, Department and Rule).
Department and Rule page
The Department and Rule page displays budget plan rule level data about the scenario compensation costs. The compensation costs are categorized as either an Employer Expense or an Employee Value. For each budget plan the system also displays the monetary amounts for the Average Value, Current Altered Amount, Altered Employee Value, Total Altered Employer Expense, and Average Altered Value.
You can also alter the amounts on this page using the Alter Method and Amount cells, when available.

Chapter 5 Managing Compensation Planning
Copyright © 1999, 2010, Oracle and/or its affiliates. All Rights Reserved. 167
Reviewing the Employee and Budget Plan
Access the Employee and Plan page (Workforce Analytics, Compensation Strategy, Analyze and Approve, Analyze and Alter Scenario, Employee and Plan).
Employee and Plan page
The Employee and Plan page displays budget plan rule level data about the scenario compensation costs. The compensation costs are categorized as either an Employer Expense or an Employee Value. For each budget plan the system also displays the monetary amounts for the Average Value, Current Altered Amount, Altered Employee Value, Total Altered Employer Expense, and Average Altered Value.
This page enables you to view the department data by departmental roll-up totals or for one department only. You can also see simulated employees belonging to a selected department. To select an individual employee you can drag the employee dimension to the slicer You can also alter the amounts on this page using the AlterMethod and Amount cells, when available.

Managing Compensation Planning Chapter 5
168 Copyright © 1999, 2010, Oracle and/or its affiliates. All Rights Reserved.
Reviewing the Employee and Compensation Rule
Access the Employee and Rule page (Workforce Analytics, Compensation Strategy, Analyze and Approve, Analyze and Alter Scenario, Employee and Rule).
Employee and Rule page
The Employee and Rule page displays budget plan rule level data about the scenario compensation costs. The compensation costs are categorized as either an Employer Expense or an Employee Value. For each budget plan the system also displays the monetary amounts for the Average Value, Current Altered Amount, Altered Employee Value, Total Altered Employer Expense, and Average Altered Value.
You can also alter the amounts on this page using the Alter Method and Amount cells, when available.

Chapter 5 Managing Compensation Planning
Copyright © 1999, 2010, Oracle and/or its affiliates. All Rights Reserved. 169
Manually Loading the Analytic Model
When you run the Compensation Planning and Simulation (WA_CPS) process, it automatically calls the LoadAnalytic Model (WA_CP_BAM_LD) application engine to generate an analytic model instance with the same ID as the scenario ID. Therefore, you can use the Load Compensation Planning Analytic Model run control page to manually load or reload the analytic model. You can also use it to load the scenario results into multiple analytic models to test (and save) different assumptions.
However you cannot load multiple scenarios into a single model—loading a scenario into a model overwritesany preexisting scenario. Also reloading the same scenario into the same analytic model will reset any adjustments made to this scenario. You should create multiple analytic models for different users or different sets of assumptions.
Note. There is no need to load multiple models for analysis only, the default model should be sufficient.
Due to the limited resource of ACE, you should try to reuse the same model ID whenever possible.
Both approved and pending scenarios can be reloaded. If the scenario/model was already approved, the status is reset to awaiting approval.
See Chapter 5, "Managing Compensation Planning," Generating the Compensation Planning Scenario, page 144.
Page Used to Manually Load the Analytic Model
Page Name Definition Name Navigation Usage
Load Compensation Planning Analytic Model
RUN_WA_CP_BAM_LOAD Workforce Analytics, Compensation Strategy, Setup Compensation Scenario, Load Analytic Model, Load CompensationPlanning Analytic Model
Manually load the results ofa compensation scenario into an analytic model.
Running the Load Analytic Model Process
Access the Load Compensation Planning Analytic Model (run control) page (Workforce Analytics, Compensation Strategy, Setup Compensation Scenario, Load Analytic Model, Load Compensation Planning Analytic Model).

Managing Compensation Planning Chapter 5
170 Copyright © 1999, 2010, Oracle and/or its affiliates. All Rights Reserved.
Load Compensation Planning Analytic Model page
Business Unit Select a business unit from the prompt list values.
Scenario ID Select a Scenario ID from the prompt list values.
Analytic Model ID Enter a new or existing ace model ID.
Approving a Compensation Planning Scenario and Passing the Datato the Planning and Budgeting Application
Once you have analyzed your scenario output and made a decision that the scenario has the desired results, your next step is to approve the results. A compensation planning scenario can be approved using the Compensation Scenario Approval (WA_CPS_APPRV) application engine process, accessed via the Compensation Scenario Approval page. Due to the large number of rows of data that need to be moved to the target tables, it is more efficient to use an application engine batch process.
Note. When you run the Compensation Scenario Approval application engine process, the system updates thescenario status to Approved. You can reapprove an approved scenario (destructive load for the selected business unit/scenario), but the system warns you that the scenario was already approved for the specified business unit.
Bringing Altered Scenario Data Back from ACE
When you have worked with an ACE model and run the scenario approval process, the system loads the CPS final output table WA_CALC_TGT, with the new information from the ACE Model.
Loading Compensation Planning Scenario Data Into Planning and Budgeting Tables
The WA_CPS_APPRV application engine process also enables you to load your compensation planning forecast scenario data into Position Budgeting tables in the Planning and Budgeting application. Some of the compensation planning information loaded into the position budgeting tables include:

Chapter 5 Managing Compensation Planning
Copyright © 1999, 2010, Oracle and/or its affiliates. All Rights Reserved. 171
• Employee information: such as existing and simulated employee IDs, employee status, business unit, position, job code, department, and location.
• Salary information: such as annual salary and annualized earning amounts.
• Benefits information: such as benefits plan type and annualized employer expense.
The compensation planning scenario data that is provided to Position Budgeting originates from the followingWorkforce tables:
• WA_JOB_S00
• WA_CALC_F00
• WA_CALC_TGT
• WA_CP_RULE_TBL
• POSITION_DATA
The aforementioned Workforce tables load the following Position Budgeting tables:
• BP_JOB_F00: loaded by the WA_JOB_S00,
• BP_COMP_F00: loaded by the WA_CALC_F00, WA_CALC_TGT, WA_JOB_S00, WA_CP_RULE_TBL tables.
Note. BP_POSITION_D00 is loaded from POSITION_DATA
Once you have specified Workforce tables as a data source in the Position Budgeting feature, simply run this application engine process and the compensation planning scenario data is transferred to the applicable tables.
See PeopleSoft Enterprise Planning and Budgeting 9.1 PeopleBook, "Integrating with Other Applications."
The additional compensation planning data provides the Position Budgeting feature with more granular compensation, employee, and salary information, and more flexibility when planning resource changes, such as headcount and salary.
Warning! When loading compensation planning scenario data into Position Budgeting, do not approve analytic models if they do not include current pay; this may skew the salary amounts.
Page Used to Run the Compensation Scenario Approval Process
Page Name Definition Name Navigation Usage
Compensation Scenario Approval
RUN_WA_CPS_APPROVE Workforce Analytics, Compensation Strategy, Analyze and Approve, Approve Scenario, Compensation Scenario Approval
Run the Compensation Scenario Approval (WA_CPS_APPRV) application engine process.

Managing Compensation Planning Chapter 5
172 Copyright © 1999, 2010, Oracle and/or its affiliates. All Rights Reserved.
Running the Compensation Scenario Approval Process
Access the Compensation Scenario Approval page (Workforce Analytics, Compensation Strategy, Analyze and Approve, Approve Scenario, Compensation Scenario Approval).
Compensation Scenario Approval page
Specify the parameters for running the Compensation Scenario Approval (WA_CPS_APPRV) Application Engine process.
Business Unit and Scenario ID
Approval for CPS scenarios is done by Business Unit and Scenario ID, and the prompt list values are from the WA_CP_APPROV_TBL table. you can only run the scenario approval process from this page. You cannot run the scenario approval process from the Run Jobstreams page.
Note. In addition to PeopleTools page security, you can strictly limit access to scenarios for approval using scenario-level security. This means, if a user doesn't have security access for a given scenario, they cannot approve it. If you grant a user access to a scenario approval page and a scenario, they have access to all scenario data within that scenario approval page, to enable them to view all the data they are approving. Therefore, for those operators you have granted such security, you may also want to grant them department and employee-level security for all departments and employees within their scenarios. This enables them to review all the employees on other pages with department or employee-level security, such as the analysis pages.
Analytic Model ID Select from the list which displays all the analytic models with altered scenario data for this scenario. Leave blank if you didn't use ACE to alter a scenario, or if you wish to approve the original non altered scenario results.

Copyright © 1999, 2010, Oracle and/or its affiliates. All Rights Reserved. 173
Appendix A
Workforce Rewards Data Mart
This chapter provides an overview of the Workforce Rewards Data Mart and discusses the:
• Data Mart data model.
• Source ETL jobs.
• Data Mart dimensions.
• Data Mart facts.
Understanding the Workforce Rewards Data Mart
Workforce Rewards Data Mart is a packaged set of processes, tables, and pages that provide decision-support analysis of the output of the Workforce Rewards analytic application. Workforce Rewards Data Mart consistsof the following delivered elements:
• Dimension and fact tables
• Application Engine processes
• Inquiry pages
You can use the Data Mart with the delivered inquiry pages or with analysis templates.
Using the Data Mart with Inquiry Pages
To use the delivered Data Mart with the delivered inquiry pages:
1. Run the scenario-generating processes in Workforce Rewards (Market-Based Pricing, Retention Assignment, and Workforce Simulation). The Data Mart building processes are called from each of these, and the system builds the dimension and fact tables automatically.
2. Access the related inquiry pages to evaluate the results of the scenarios. These pages retrieve and display data from the underlying Data Mart to help facilitate your analysis.
Using the Delivered Data Mart with Analysis Templates
We do not deliver an embedded reporting tool. You have the option of licensing a reporting tool separately for use with the Workforce Rewards Data Mart. Additionally, we do not deliver any preformatted, sample analysis templates for use with the Workforce Rewards Data Mart. You have the option of creating your own analysis templates. The analysis templates you create will depend on the separately licensed reporting tool you select. Refer to the documentation for your selected reporting tool.

Workforce Rewards Data Mart Appendix A
174 Copyright © 1999, 2010, Oracle and/or its affiliates. All Rights Reserved.
Data Mart Data Model
The Workforce Rewards Data Mart is based on a logical and physical data model. We designed the model to present scenario results from Workforce Rewards in the best manner to support decision analysis. The model features a hierarchical structure for many of the delivered dimensions, and supports multidimensional analyses such as OLAP and ROLAP.
Data Mart Source ETL Jobs
For Workforce Rewards Data Mart, the required ETL (extract, transform and load) jobs are premapped from your HRMS tables. You use these to import data into the Operational Warehouse source tables (OWS). From the OWS tables you use ETL to load the data into the operational warehouse enriched (OWE) tables (F00s, D00s, and R00s). Some of the Data Mart dimensions use the imported information from these data warehousetables. You also use your Workforce Rewards system to enrich and transform this imported data into new data, such as scenario results. This new data is also stored in data warehouse tables, and some of the Data Mart dimensions use this new information.
Warning! Any changes you make to the delivered data warehouse tables may affect Application Engine processes, PeopleCode processing, and pages throughout your system. You must evaluate and execute these types of changes very carefully.
ETL jobs are delivered with your Workforce Rewards system in an IBM WebSphere DataStage Project. We designed these jobs with, and they are intended for use with, IBM WebSphere DataStage. IBM WebSphere DataStage is the ETL tool delivered with EPM. If you choose to use an ETL tool other than IBM WebSphere DataStage, use the delivered ETL jobs as templates and modify them as needed.
See Also
Your IBM WebSphere DataStage documentation.
Data Mart Dimensions
The Workforce Rewards Data Mart contains the following dimensions:
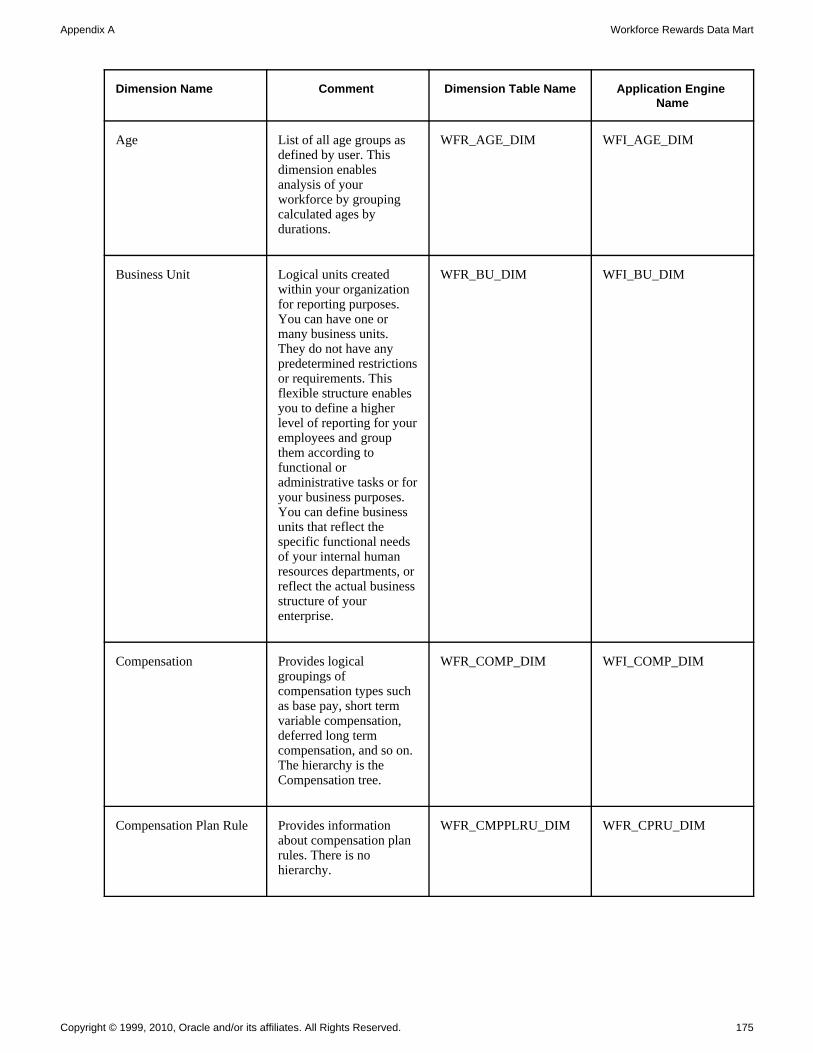
Appendix A Workforce Rewards Data Mart
Copyright © 1999, 2010, Oracle and/or its affiliates. All Rights Reserved. 175
Dimension Name Comment Dimension Table Name Application Engine Name
Age List of all age groups as defined by user. This dimension enables analysis of your workforce by grouping calculated ages by durations.
WFR_AGE_DIM WFI_AGE_DIM
Business Unit Logical units created within your organization for reporting purposes. You can have one or many business units. They do not have any predetermined restrictionsor requirements. This flexible structure enables you to define a higher level of reporting for youremployees and group them according to functional or administrative tasks or foryour business purposes. You can define business units that reflect the specific functional needs of your internal human resources departments, or reflect the actual businessstructure of your enterprise.
WFR_BU_DIM WFI_BU_DIM
Compensation Provides logical groupings of compensation types such as base pay, short term variable compensation, deferred long term compensation, and so on. The hierarchy is the Compensation tree.
WFR_COMP_DIM WFI_COMP_DIM
Compensation Plan Rule Provides information about compensation plan rules. There is no hierarchy.
WFR_CMPPLRU_DIM WFR_CPRU_DIM

Workforce Rewards Data Mart Appendix A
176 Copyright © 1999, 2010, Oracle and/or its affiliates. All Rights Reserved.
Dimension Name Comment Dimension Table Name Application Engine Name
Cost Rule Provides information about retention cost rules.There is no hierarchy.
WFR_COSTRU_DIM WFR_CORU_DIM
Currency Code Provides a way to classifyfinancial amounts, for example USD, FFR, and so on.
WFR_CURCODE_DIM
Decision Provides information about retention decision rules. There is no hierarchy.
WFR_DECISON_DIM WFR_DECI_DIM
Department Service List of department servicegroups as defined by user.This dimension enables analysis of your workforce by groupings of the calculated service duration your employees have been with the department. There is no hierarchy.
WFR_DEPTSVC_DIM WFI_DESE_DIM
Education Level Enables you to analyze your workforce by highest education levels such as Bachelor level degree, Master level degree, and so on. There is no hierarchy.
WFR_EDULVL_DIM WFI_EDLV_DIM
Geography Represents the hierarchical relationship of geographic areas and locations for reporting purposes. The hierarchy is the Geography tree.
WFR_GEO_DIM WFI_GEO_DIM
Group Provides information about workforce groups. There is no hierarchy.
WFR_GROUP_DIM WFR_GRUP_DIM
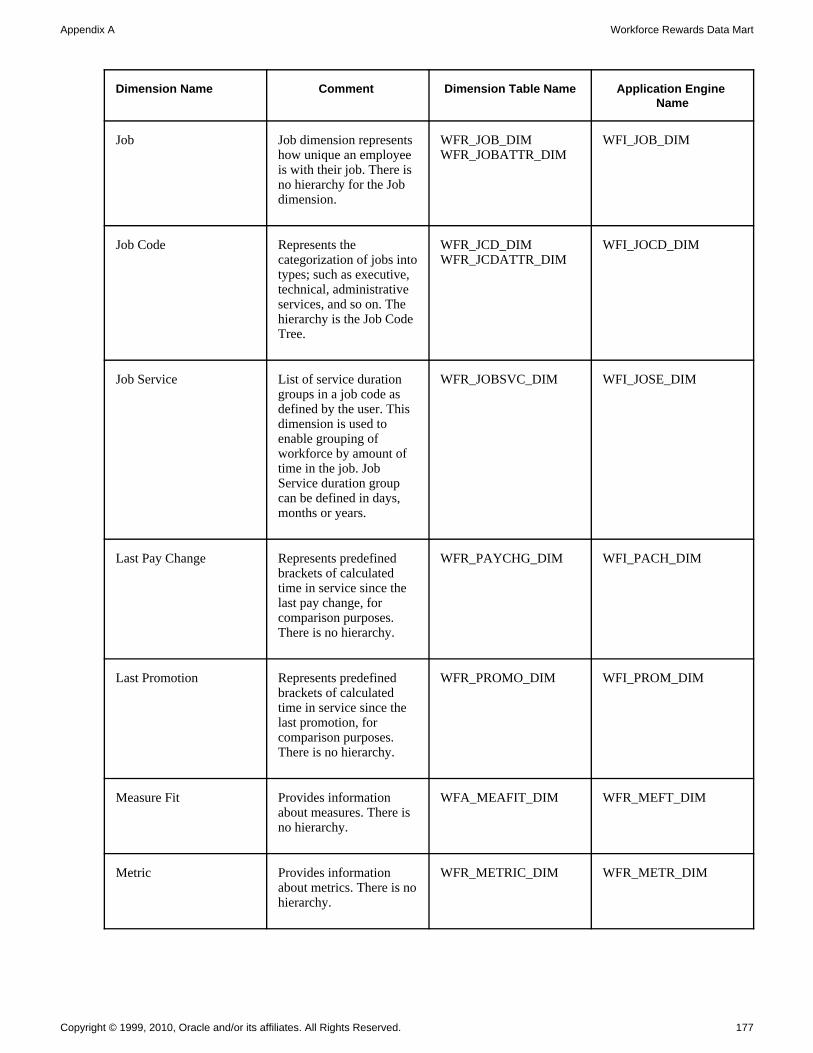
Appendix A Workforce Rewards Data Mart
Copyright © 1999, 2010, Oracle and/or its affiliates. All Rights Reserved. 177
Dimension Name Comment Dimension Table Name Application Engine Name
Job Job dimension represents how unique an employee is with their job. There is no hierarchy for the Job dimension.
WFR_JOB_DIM WFR_JOBATTR_DIM
WFI_JOB_DIM
Job Code Represents the categorization of jobs intotypes; such as executive, technical, administrative services, and so on. The hierarchy is the Job Code Tree.
WFR_JCD_DIM WFR_JCDATTR_DIM
WFI_JOCD_DIM
Job Service List of service duration groups in a job code as defined by the user. This dimension is used to enable grouping of workforce by amount of time in the job. Job Service duration group can be defined in days, months or years.
WFR_JOBSVC_DIM WFI_JOSE_DIM
Last Pay Change Represents predefined brackets of calculated time in service since the last pay change, for comparison purposes. There is no hierarchy.
WFR_PAYCHG_DIM WFI_PACH_DIM
Last Promotion Represents predefined brackets of calculated time in service since the last promotion, for comparison purposes. There is no hierarchy.
WFR_PROMO_DIM WFI_PROM_DIM
Measure Fit Provides information about measures. There is no hierarchy.
WFA_MEAFIT_DIM WFR_MEFT_DIM
Metric Provides information about metrics. There is nohierarchy.
WFR_METRIC_DIM WFR_METR_DIM

Workforce Rewards Data Mart Appendix A
178 Copyright © 1999, 2010, Oracle and/or its affiliates. All Rights Reserved.
Dimension Name Comment Dimension Table Name Application Engine Name
Organization Represents the relationship of departments from an organizational reporting perspective. The hierarchy is the Organization Tree.
WFR_ORG_DIM WFR_MGR_DIM
WFI_ORG_DIM
Personal Identifies the attributes ofa person. There is no hierarchy for the Personaldimension.
WFR_PERSON_DIM WFR_PERSNAT_DIM
WFI_PER_DIM
Previous Job Code Represents the employee's previous Job Code. The hierarchy is the Job Code Tree.
WFR_PRJCD_DIM WFR_PRJCDAT_DIM
WFI_PRJC_DIM
Previous Organization Represents the employee's previous Organization. The hierarchy is the Organization Tree.
WFR_PRORG_DIM WFR_PRMGR_DIM
WFI_PROR_DIM
Previous Salary Grade Represents the employee's previous Salary Grade. There is no hierarchy.
WFR_PRSLGRD_DIM WFI_PRSG_DIM
Retain Action Provides information about retain actions. There is no hierarchy.
WFR_RETACT_DIM WFR_RTAC_DIM
Retention Rule Provides information about retention rules. There is no hierarchy.
WFR_RETENRU_DIM WFR_RERU_DIM
Review Rating Represents the employee's performance rating from their salary/performance review. There is no hierarchy.
WFR_REVRTG_DIM WFI_RERA_DIM

Appendix A Workforce Rewards Data Mart
Copyright © 1999, 2010, Oracle and/or its affiliates. All Rights Reserved. 179
Dimension Name Comment Dimension Table Name Application Engine Name
Risk Rule Provides information about retention risk rules. There is a hierarchy from Risk Rule to Retention Factor to Retention Factor Type.
WFR_RSKRU_DIM WFR_RIRU_DIM
Salary Grade Represents the employee's salary grade. There is no hierarchy.
WFR_SALGRD_DIM WFI_SAGR_DIM
Salary Grade Duration Represents predefined brackets of calculated time in service in the present salary grade, for comparison purposes. There is no hierarchy.
WFR_SLGDDUR_DIM WFI_SAGD_DIM
Service Represents predefined brackets of calculated time in service for comparison purposes. There is no hierarchy for Service Group.
WFR_SERVICE_DIM WFI_SERV_DIM
Scenario Provides information about scenarios. There is no hierarchy.
WFR_SENARIO_DIM WFR_SCEN_DIM
Target Rate Provides information about compensation target rates. There is no hierarchy.
WFR_TGTRATE_DIM WFR_TARA_DIM
Time (Period) Includes the accounting periods for which data is reported. The hierarchy isYear, Quarter, Month, Week and Day.
WFR_YEAR_DIM WFR_QTR_DIM WFR_MONTH_DIM WFR_DAY_DIM
WFI_TIME_DIM
Track Decision Provides information about retention track decisions. There is no hierarchy.
WFR_TRCRSN_DIM WFR_TCRN_DIM

Workforce Rewards Data Mart Appendix A
180 Copyright © 1999, 2010, Oracle and/or its affiliates. All Rights Reserved.
Dimension Name Comment Dimension Table Name Application Engine Name
Value Rule Provides information about retention value rules. There is no hierarchy.
WFR_VALRU_DIM WFR_VARU_DIM
Each dimension, and its corresponding table, is built by an Application Engine (AE) library called by the various Workforce Rewards scenario-building Application Engine processes (Market-Based Pricing, Retention Assignment, Workforce Simulation, and Compensation Planning and Simulation).
Data Mart Facts
The Workforce Rewards Data Mart contains six fact output tables.
Data Mart Fact Name Description Input Tables Output Tables
WA_MC_SCEN_FACT The Market Compensation fact table is generated by an Application Engine program (WA_MC_SCEN), that iscalled by the Market-Based Pricing Application Engine process (WA_MBP), or run by itself. The purposeof WA_MC_SCEN is to populate the WA_MC_SCEN_FACT table in the Data Mart for use in decision reporting.
WA_MKT_SCEN_TBL, WA_MKT_RATE_TBL ,JOB_F00, WA_COMP_HST_F00, JOBCODE_D00, LOCATION_D00, SAL_GRADE_D00
WA_MC_SCEN_FACT, WA_MC_EMPL_FACT

Appendix A Workforce Rewards Data Mart
Copyright © 1999, 2010, Oracle and/or its affiliates. All Rights Reserved. 181
Data Mart Fact Name Description Input Tables Output Tables
WA_EMPL_FACT The Employee fact table is generated by an Application Engine Library (WA_EMPL_FACT), that can be called by any program, but cannot be run by itself. The purposeof WA_EMPL_FACT is to populate the WA_EMPL_FACT table in the Data Mart. Each time this engine is called, it adds employee details to the WA_EMPL_FACTtable, for any employees that the calling engine has. This optional table can then be used later in the reporting process to provide all the employee dimensions and attributes.
WA_JOB_S00, JOBCODE_D00, LOCATION_D00, SAL_GRADE_D00, PERSONAL_D00, JOB_INTRDY_F00, EMPL_REVW_F00
WA_EMPL_FACT
WA_RM_FACT The Retention fact table is generated by an Application Engine program (WA_RM_FACT) that is called by the Retention Assignment Application Engine process (WA_RM_ASSIGN). The purpose of WA_RM_FACT is to populate the two tables inthe Data Mart for use in decision reporting.
Uses TEMP tables of the following: WA_RM_SUM_F00, WA_RM_DET_C_F00, WA_RM_DET_R_F00, WA_RM_DET_V_F00, WA_RM_TRACK_F00, WA_RM_RETN_F00, WA_RM_RDCE_F00, WA_JOB_S00, LOCATION_D00
WA_RM_ASMT_FACT,WA_RM_DECN_FACT
Each fact, and its corresponding table, is built by an Application Engine (AE) library that is called by the various Workforce Rewards scenario-building Application Engine processes (Market-Based Pricing, Retention Assignment).


Copyright © 1999, 2010, Oracle and/or its affiliates. All Rights Reserved. 183
Appendix B
Workforce Rewards Reports
This appendix provides a listing of Crystal reports in Workforce Rewards.
Note. For samples of these reports, see the Portable Document Format (PDF) files that are published on CD-ROM with your documentation.
Report Descriptions
This table lists the Workforce Rewards reports by report ID.
Report ID and Report Name
Description Navigation Run Control Page
WAC0001
Weighting Rules
Review the job code weighting rules for the models used in a market compensation scenario.
Workforce Analytics, Workforce Reports, Market Compensation Reports, Weighting Rules
RUN_RWA_0001
WAC0007
Approved Pay Structure
Review the approved pay structures, or salary plans, in your system, along with data about their associated grades and steps.
Workforce Analytics, Workforce Reports, Base Pay Structure Reports, Approved Pay Structure
RUN_RWA_0007
WAC008
Proposed Pay Structure
Review the salary rate data for the grades within proposed pay structures.
Workforce Analytics, Workforce Reports, Base Pay Structure Reports, Proposed Pay Structure
RUN_RWA_0008
WAC009
Grade / Step Definition
Review proposed pay structures along with salary rate data for their grades and steps.
Workforce Analytics, Workforce Reports, Base Pay Structure Reports, Grade/Step Definition
RUN_RWA_0009
WAC010
Job Class Definition
Review salary plan data for the Job Codes within Job Classes.
Workforce Analytics, Workforce Reports, Base Pay Structure Reports, Job Class Definition
RUN_RWA_0010

Workforce Rewards Reports Appendix B
184 Copyright © 1999, 2010, Oracle and/or its affiliates. All Rights Reserved.
Report ID and Report Name
Description Navigation Run Control Page
WAC011
Grade Assignment
Review grade assignments and other proposed pay structure data for Job Codeswithin a Pay Structure and Job Class.
Workforce Analytics, Workforce Reports, Base Pay Structure Reports, Grade Assignment
RUN_RWA_0011
WAC0012
Compensation Model
Review the compensation models you've created.
Workforce Analytics, Workforce Reports, Compensation Strategy Reports, Compensation Model
RUN_RWA_0012
WAC0013
Compensation Rules
Review the compensation rules you have created.
Workforce Analytics, Workforce Reports, Compensation Strategy Reports, Compensation Rules
RUN_RWA_0013
WAC0014
Payout Rules
Review the payout rules you have created.
Workforce Analytics, Workforce Reports, Compensation Strategy Reports, Payout Rules
RUN_RWA_0014
WAC0015
Goals Matrix
Review the goals matrixes you've created.
Workforce Analytics, Workforce Reports, Compensation Strategy Reports, Goals Matrix
RUN_RWA_0015
WAC016
Data Elements
Review the data elements you have created.
Workforce Analytics, Workforce Reports, Compensation Strategy Reports, Data Elements
RUN_RWA_0016
WAC0017
Merit Matrix
Review the merit matrixes you have created.
Workforce Analytics, Workforce Reports, Compensation Strategy Reports, Merit Matrix
RUN_RWA_0017
WAC0018
Workforce Group
Review workforce groups you have defined.
Workforce Analytics, Workforce Reports, Workforce Group Report
RUN_RWA_0018
WAC0019
Workforce Simulation Rules
Review all of the attributes of the workforce simulation rules for a given setID and model ID.
Workforce Analytics, Workforce Reports, Compensation Strategy Reports, Workforce Simulation Rules
RUN_RWA_0019

Appendix B Workforce Rewards Reports
Copyright © 1999, 2010, Oracle and/or its affiliates. All Rights Reserved. 185
Report ID and Report Name
Description Navigation Run Control Page
WAC0028
Scenario Fit to Structure
Evaluate the validity of a market rate scenario, by comparing the calculated market rates from the scenario to the current base pay structure for your organization.
Workforce Analytics, Workforce Reports, Market Compensation Reports, Scenario/Fit to Structure
RUN_RWA_0028
WAC0029
Risk Rule
Review the retention risk rules you've defined.
Workforce Analytics, Workforce Reports, Retention Strategy Reports, Risk Rule
RUN_RWA_0029
WAC0030
Risk Factor
Review the retention risk factors you've defined.
Workforce Analytics, Workforce Reports, Retention Strategy Reports, Risk Factor
RUN_RWA_0030
WACOO31
Value Rule
Review the value rules you've defined.
Workforce Analytics, Workforce Reports, Retention Strategy Reports, Value Rule
RUN_RWA_0031
WAC0032
Cost Rule
Review the cost rules you've defined.
Workforce Analytics, Workforce Reports, Retention Strategy Reports, Cost Rule
RUN_RWA_0032
WAC0033
Decision Rule
Review the decision rules you've defined.
Workforce Analytics, Workforce Reports, Retention Strategy Reports, Decision Rule
RUN_RWA_0033
WAC0034
Retention Model
Review the retention models you've defined.
Workforce Analytics, Workforce Reports, Retention Strategy Reports, Retention Model
RUN_RWA_0034


Index
Copyright © 1999, 2010, Oracle and/or its affiliates. All Rights Reserved. 187
AApplication Engine processes
Market-Based Pricing (WA_MBP) 20Retention Assignment (WA_RM_ASSIGN)
89Workforce Simulation (WA_WFS) 122
Application Messaging Base Pay Structure module 63Market Compensation module 30
Approved Pay Structure report 64Approved Pay Structure report (WAC0007) 65
BBase Pay Compensation Rule page 137Base Pay Rule (summary) page 155base pay structure
business process overview 43creating a scenario 44
Base Pay Structure Definition component, creating a definition 48
Base Pay Structure Definition component, creating grades 53
Base Pay Structure Definition component, creating steps 55
Base Pay Structure module 43approving and publishing 61business process overview 43Crystal Reports 60, 64evaluating base pay structures 59prerequisites 44synchronizing tables 45
Benchmark Details page 36Budget Plan page 158
CCalculate Jobcode Slotting page 35Compensation Model page 142compensation planning 114Compensation Planning and Simulation AE
process 144Compensation Planning Model
manually loading 169Compensation Rule page 159Compensation Scenario Analysis Component 149
analytic grid 149graphic charts 149securing access to 150
Compensation Scenario Approval (WA_CPS_APPRV) application engine process
running 172Compensation Scenario Approval page 172Compensation Scenarios
reviewing and analyzing 148Compensation Scenario Summary page 156
Compensation Strategy module approving compensation scenarios 170business process overview 114Crystal reports 153defining your compensation scenario strategy
113introduction 111prerequisites 115reviewing and analyzing scenarios 148setting up a scenario 124setting up a workforce simulation 115
Compensation Survey Data Crystal report 8Cost Rule Detail page 100Cost Rule report 94Cost Rule setup page 75Cost Rules page 85CPS process, run control page 144CPS scenario
setting up 124Crystal reports 94, 183
Compensation Survey Data Crystal 8
DData Element page 126Data Mart
dimensions 174facts 180logical and physical data model 174source ETL jobs 174using with inquiry pages 173using with Insight analysis templates 173workforce simulation 123
Decision Rule page 78Decision Rule report 94Definition page 48Department and Plan page 164Department and Rule page 166Discretionary plan 140
EEmployee and Plan page 167Employee and Rule page 168Employee Details page 103employee information, defining as data elements
126employee turnover cost rules, setting up 75engines
delivered engines for Compensation Planning145
delivered engines for Market Compensation module 20
delivered engines for Workforce Simulation 121
Retention Strategy 89Enterprise Scorecard
integration with Compensation Planning 128

Index
188 Copyright © 1999, 2010, Oracle and/or its affiliates. All Rights Reserved.
Retention Strategy module integration 77Establish Target Market Rates page 32
FFACT tables, populating 21, 90, 123Fit to Market page 25Fit to Structure Market Scenario report 23Formula plan 132, 140Frequency Details page 142
GGap to Target page 27Goals Matrix page 129Grade / Step Definition report (WAC0009) 60Grade Assignment page 57Grade Assignment report (WAC0011) 60Grades page 53Group and Plan page 161Group and Rule page 162
Iimplementation tasks 3input and output tables for populating FACT tables
See Also FACT tables, populating, FACT tables, populating
JJob Class Definition report (WAC0010) 60Job Class page 47Job Code Details page 33Job Code Slotting Results page 37Job Code Weighting Definition report 23job IDs
delivered jobs for Compensation Planning 145delivered jobs for Market Compensation 20delivered jobs for Workforce Simulation 121Retention Strategy 89
jobstreams delivered jobstreams for Compensation
Planning 145delivered jobstreams for Market Compensation
20delivered jobstreams for Workforce Simulation
121Retention Strategy 89
KKPIs, integration with Compensation Planning 128
LLoad Compensation Planning Analytic Model page
169
MMarket-Based Pricing AE process
running 20understanding 20
Market Compensation module business process overview 5using base currencies 7using trees 7
market compensation scenario analyzing 21approving and publishing target rates 30comparing current pay structure to target rates
39Crystal reports 23
market compensation scenarios creating 8overview 9pages used to create 10survey data aging 9survey regression 9survey selection 10weighting rules 10
Market Detail page 29market fit, definition of 25Market Model page 11Market Scenario Approval page 37Market Scenario page 11Market Survey Samples page 11market target, definition of 25Market Weighting Rule page 11Merit Matrix page 133Model IDs
setup for the Compensation Model 142setup for workforce simulation rules 120
OOther Pay Rules setup page 141
PPayout Rule page 135Pay Structure Approval page 62PeopleSoft Enterprise Scorecard
integration with retention strategy 73PeopleSoft Workforce Rewards
Data Mart 173processes
Compensation Scenario Approval (WA_CPS_APPRV) application engine process 172
delivered Application Engine processes for Compensation Planning 145
delivered Application Engine processes for

Index
Copyright © 1999, 2010, Oracle and/or its affiliates. All Rights Reserved. 189
Workforce Simulation 121delivered processes for market compensation
20Retention Strategy 89
Proposed Pay Structure report (WAC0008) 60
RReduce Decisions page 87, 109Regression Calculator page 10Regression Statistics page 10reports 183Retain Decisions page 86, 108Retention Assignment AE process 88Retention Factor page 69Retention Model component 82Retention Model page 82Retention Model report 94Retention Scenario Approval component 105Retention Strategy 67Retention Strategy business process 67Retention Strategy module
approving retention scenarios 105creating scenarios 80Crystal reports 94Enterprise Scorecard and Workforce
Scorecard integration 75, 77evaluating your retention scenario 91setting up a strategy 68workforce groups setup 69
Retention Strategy Module 67Review Data Elements page 153Review New Market Rate page 40Risk Factor Definition report 94Risk Rule page 70Risk Rule report 94Risk Rules page 83Run Jobstream page 20Run Market Scenario page 11Run Workforce Simulation page 121
SSalary Plan Gap page 42Scenario Approval page 109scenario IDs
setup for Compensation Planning and Simulation 144
setup for workforce simulation rules 121Scenario Summary page 24, 94Steps page 55Structure Gap to Market page 60
Ttarget plan
distribution plan type 140performing goals matrix calculations 131
Track Decisions page 85, 97, 106
VValue Rule page 73Value Rule report 94Value Rules page 84Variable Pay Rule (summary) page 156Variable Pay Rule page 139
WWA_CPS (Workforce Compensation and
Planning Simulation) AE process 144WA_MBP (Market-Based Pricing) AE process 20WA_RM_ASSIGN (Retention Assignment) AE
process 88, 89WA_WFS (Workforce Simulation) AE process
121workforce groups
Retention Strategy module 69set up for compensation planning rules 142set up for workforce simulation rules 117
Workforce Rewards Data Mart 173dimensions 174facts 180logical and physical data model 174market compensation 21retention management 90source ETL jobs 174workforce simulation 123
Workforce Simulation generating 122process run control page 121reviewing the simulation scenario 124setting up 115
Workforce Simulation Model page 120Workforce Simulation Rule page 117