penang’s organic waste policy · penang, malaysia •penang island was established in 1786 by...
TRANSCRIPT
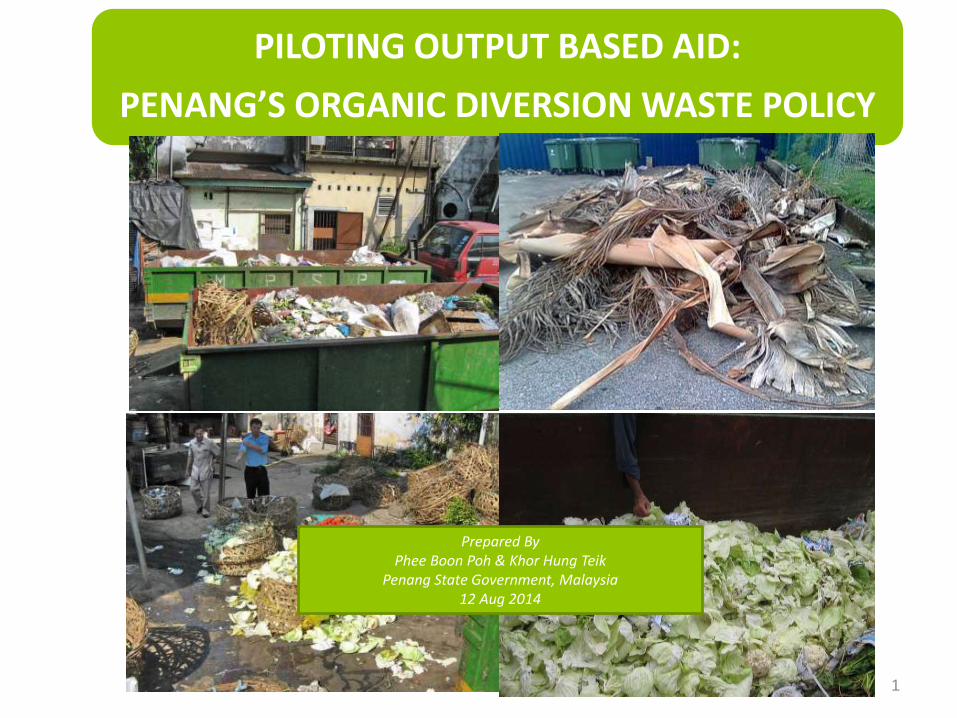
PILOTING OUTPUT BASED AID:
PENANG’S ORGANIC DIVERSION WASTE POLICY
1
Prepared By Phee Boon Poh & Khor Hung Teik
Penang State Government, Malaysia12 Aug 2014
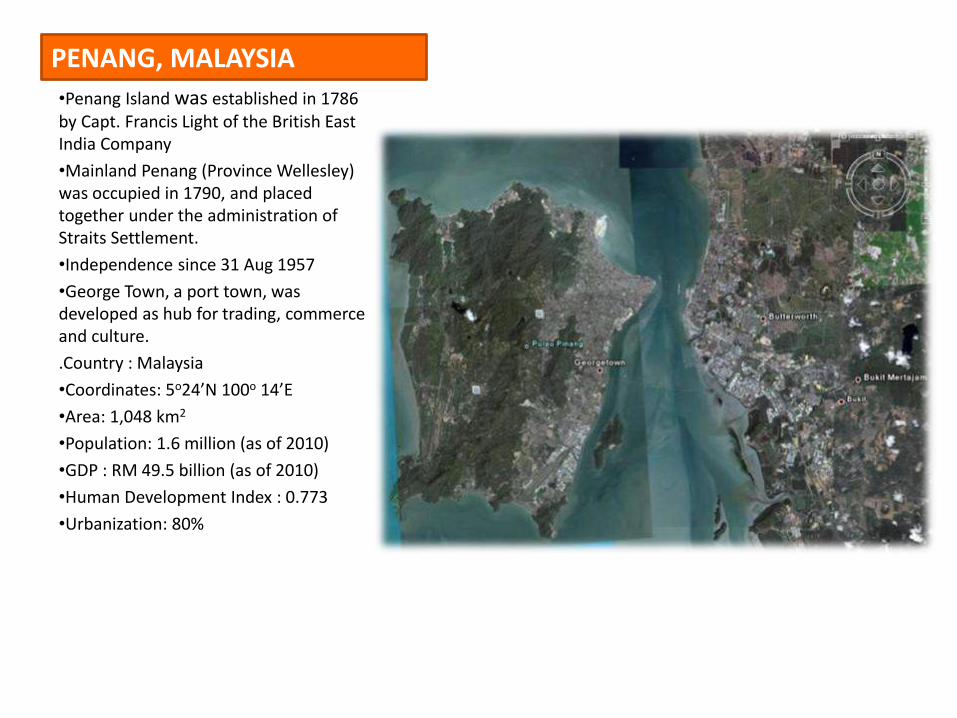
PENANG, MALAYSIA
•Penang Island was established in 1786 by Capt. Francis Light of the British East India Company
•Mainland Penang (Province Wellesley) was occupied in 1790, and placed together under the administration of Straits Settlement.
•Independence since 31 Aug 1957
•George Town, a port town, was developed as hub for trading, commerce and culture.
.Country : Malaysia
•Coordinates: 5o24’N 100o 14’E
•Area: 1,048 km2
•Population: 1.6 million (as of 2010)
•GDP : RM 49.5 billion (as of 2010)
•Human Development Index : 0.773
•Urbanization: 80%
2
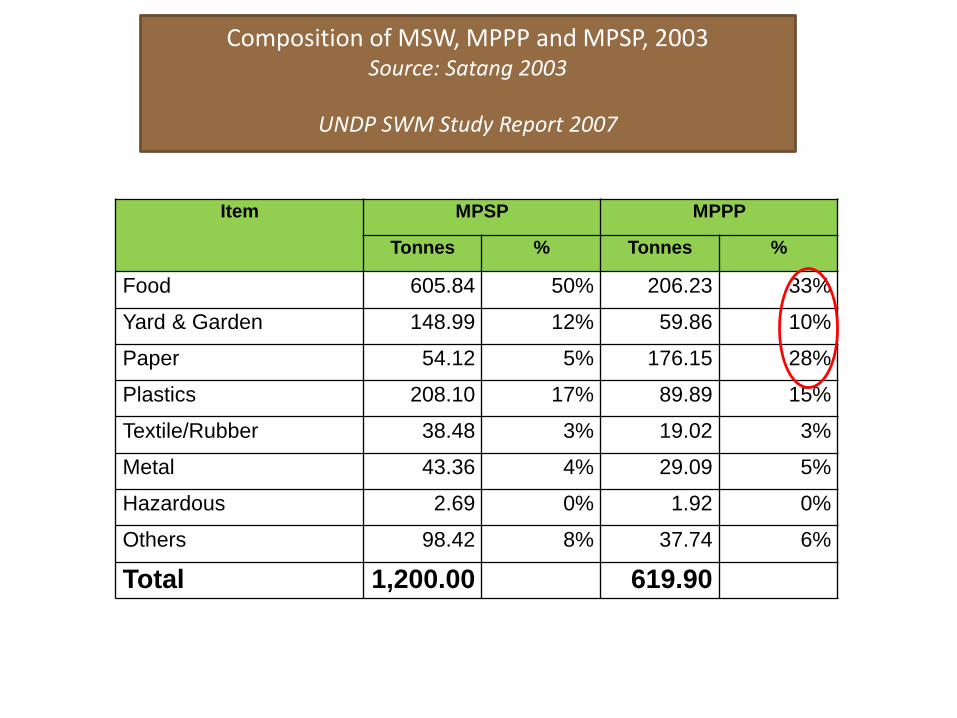
Item MPSP MPPP
Tonnes % Tonnes %
Food 605.84 50% 206.23 33%
Yard & Garden 148.99 12% 59.86 10%
Paper 54.12 5% 176.15 28%
Plastics 208.10 17% 89.89 15%
Textile/Rubber 38.48 3% 19.02 3%
Metal 43.36 4% 29.09 5%
Hazardous 2.69 0% 1.92 0%
Others 98.42 8% 37.74 6%
Total 1,200.00 619.90
Composition of MSW, MPPP and MPSP, 2003Source: Satang 2003
UNDP SWM Study Report 2007
4
Source Waste Generation
rate (kg/c/d)
Amount of Waste
(tonne/day)
Organic Waste
(tonne/day)
Recyclable Waste
(tonne/day)
Non-Recyclable
Waste (tonne/day)
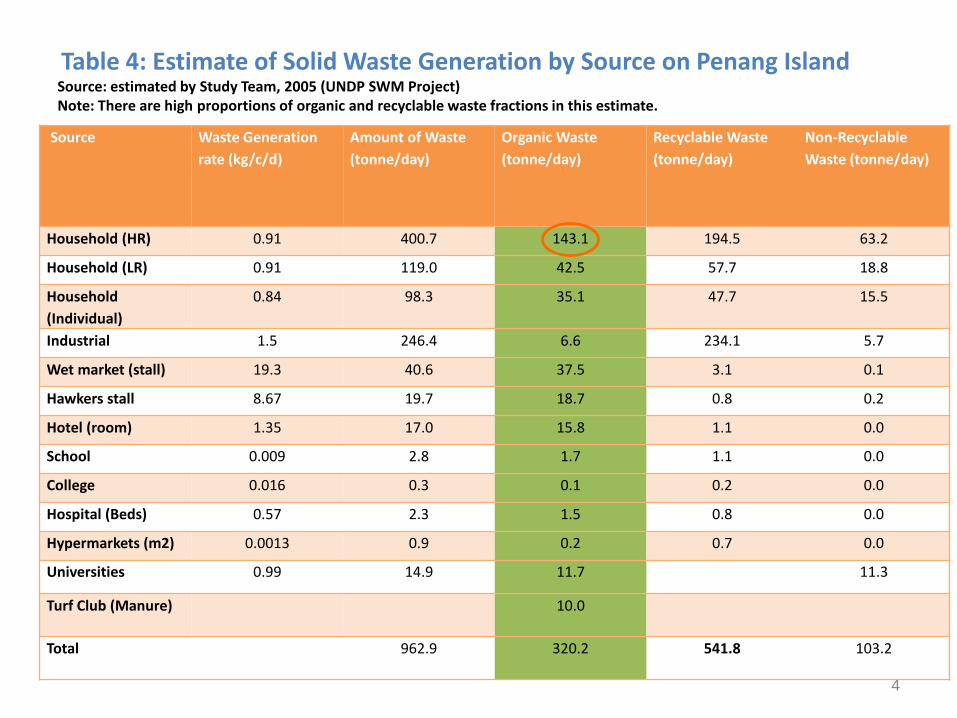
Household (HR) 0.91 400.7 143.1 194.5 63.2
Household (LR) 0.91 119.0 42.5 57.7 18.8
Household
(Individual)
0.84 98.3 35.1 47.7 15.5
Industrial 1.5 246.4 6.6 234.1 5.7
Wet market (stall) 19.3 40.6 37.5 3.1 0.1
Hawkers stall 8.67 19.7 18.7 0.8 0.2
Hotel (room) 1.35 17.0 15.8 1.1 0.0
School 0.009 2.8 1.7 1.1 0.0
College 0.016 0.3 0.1 0.2 0.0
Hospital (Beds) 0.57 2.3 1.5 0.8 0.0
Hypermarkets (m2) 0.0013 0.9 0.2 0.7 0.0
Universities 0.99 14.9 11.7 11.3
Turf Club (Manure) 10.0
Total 962.9 320.2 541.8 103.2
Table 4: Estimate of Solid Waste Generation by Source on Penang IslandSource: estimated by Study Team, 2005 (UNDP SWM Project) Note: There are high proportions of organic and recyclable waste fractions in this estimate.
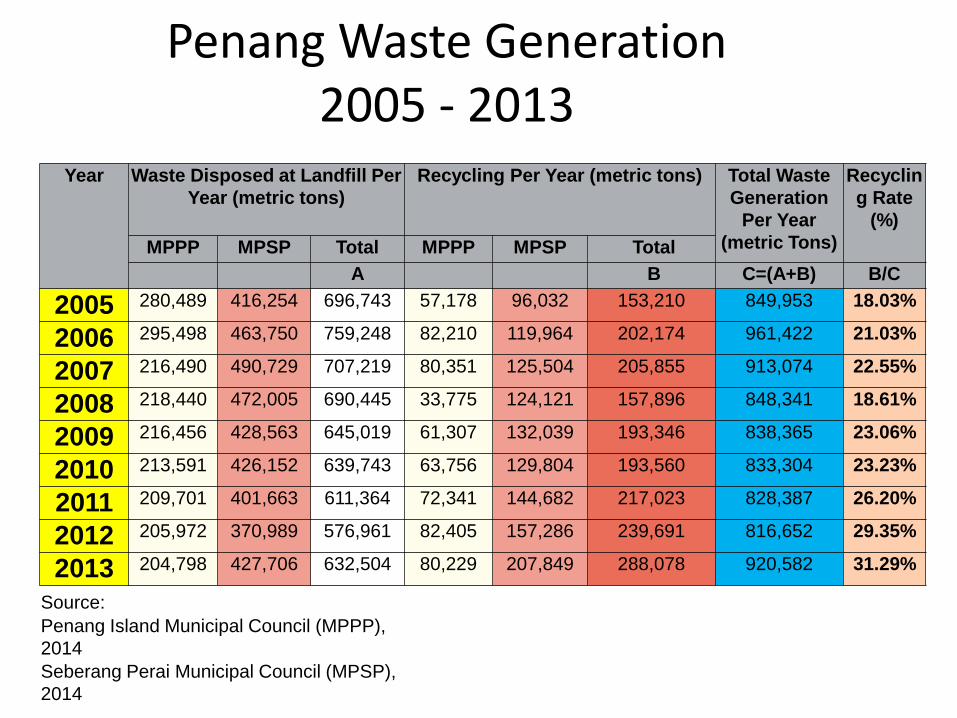
Penang Waste Generation 2005 - 2013
Year Waste Disposed at Landfill Per
Year (metric tons)
Recycling Per Year (metric tons) Total Waste
Generation
Per Year
(metric Tons)
Recyclin
g Rate
(%)
MPPP MPSP Total MPPP MPSP Total
A B C=(A+B) B/C
2005 280,489 416,254 696,743 57,178 96,032 153,210 849,953 18.03%
2006 295,498 463,750 759,248 82,210 119,964 202,174 961,422 21.03%
2007 216,490 490,729 707,219 80,351 125,504 205,855 913,074 22.55%
2008 218,440 472,005 690,445 33,775 124,121 157,896 848,341 18.61%
2009 216,456 428,563 645,019 61,307 132,039 193,346 838,365 23.06%
2010 213,591 426,152 639,743 63,756 129,804 193,560 833,304 23.23%
2011 209,701 401,663 611,364 72,341 144,682 217,023 828,387 26.20%
2012 205,972 370,989 576,961 82,405 157,286 239,691 816,652 29.35%
2013 204,798 427,706 632,504 80,229 207,849 288,078 920,582 31.29%
Source:
Penang Island Municipal Council (MPPP),
2014
Seberang Perai Municipal Council (MPSP),
2014
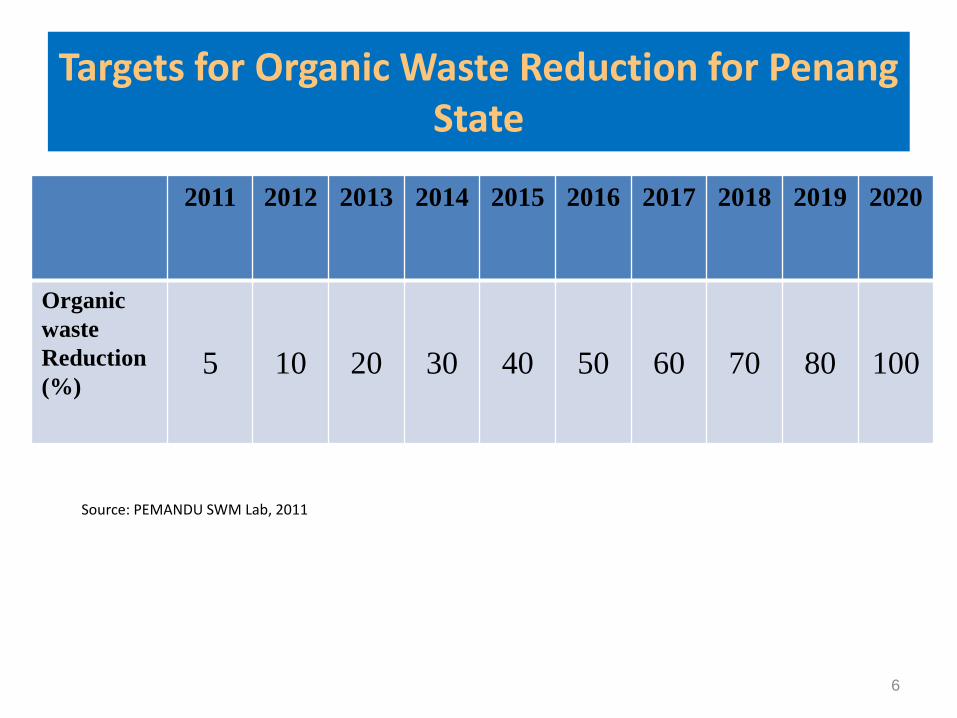
Targets for Organic Waste Reduction for Penang State
2011 2012 2013 2014 2015 2016 2017 2018 2019 2020
Organic
waste
Reduction
(%)5 10 20 30 40 50 60 70 80 100
Source: PEMANDU SWM Lab, 2011
6
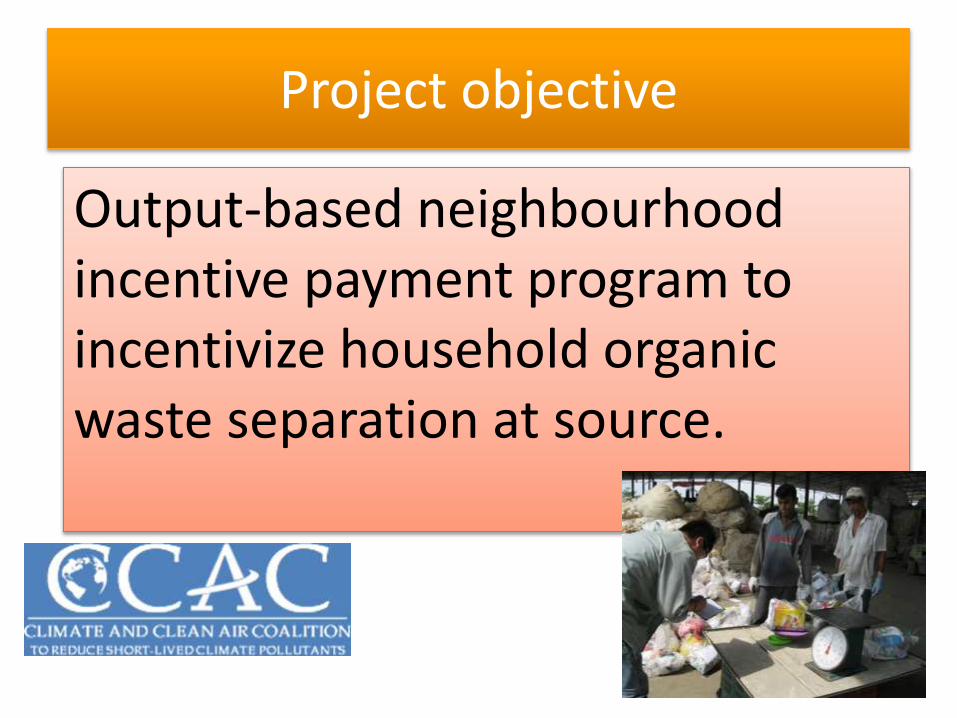
Project objective
Output-based neighbourhood incentive payment program to incentivize household organic waste separation at source.
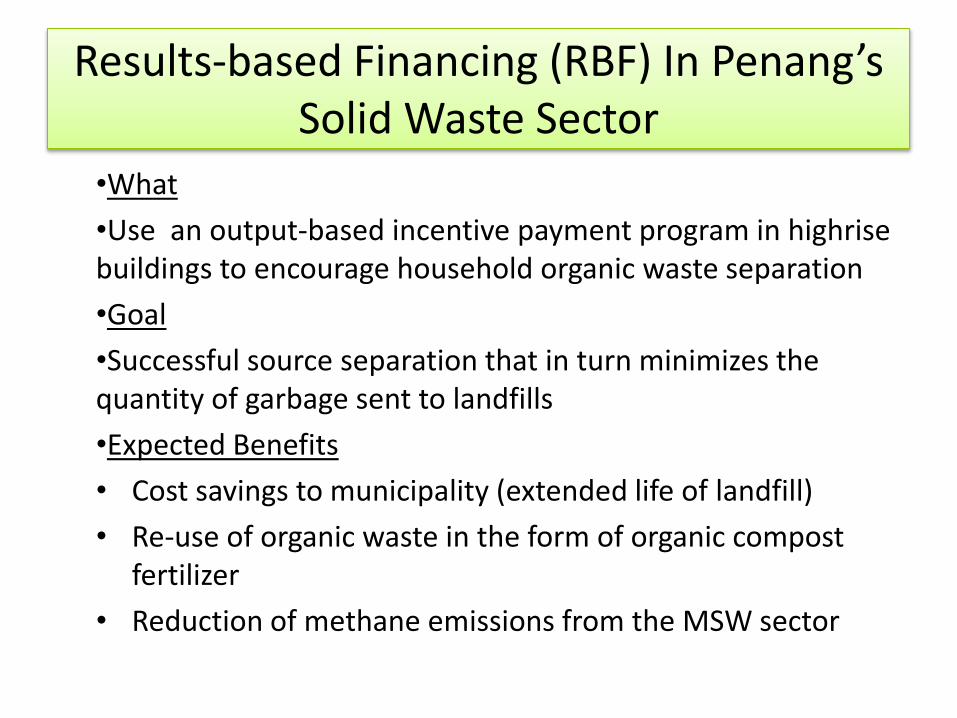
Results-based Financing (RBF) In Penang’s Solid Waste Sector
•What
•Use an output-based incentive payment program in highrise buildings to encourage household organic waste separation
•Goal
•Successful source separation that in turn minimizes the quantity of garbage sent to landfills
•Expected Benefits
• Cost savings to municipality (extended life of landfill)
• Re-use of organic waste in the form of organic compost fertilizer
• Reduction of methane emissions from the MSW sector
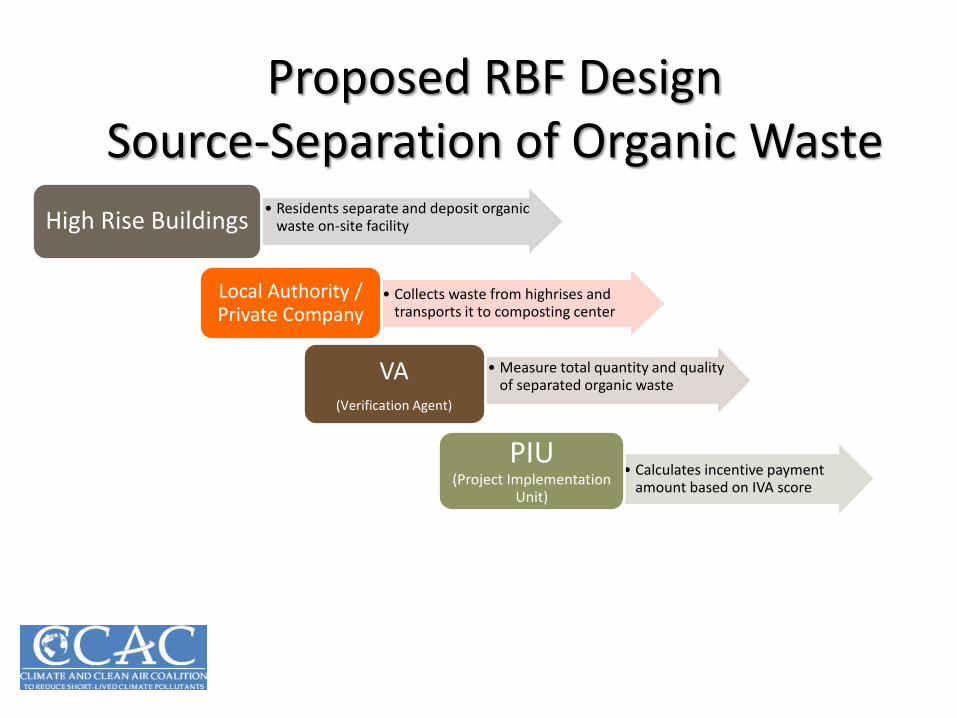
Proposed RBF Design Source-Separation of Organic Waste
• Residents separate and deposit organic waste on-site facilityHigh Rise Buildings
• Collects waste from highrises and transports it to composting center
Local Authority / Private Company
• Calculates incentive payment amount based on IVA score
PIU(Project Implementation
Unit)
• Measure total quantity and quality of separated organic waste
VA (Verification Agent)
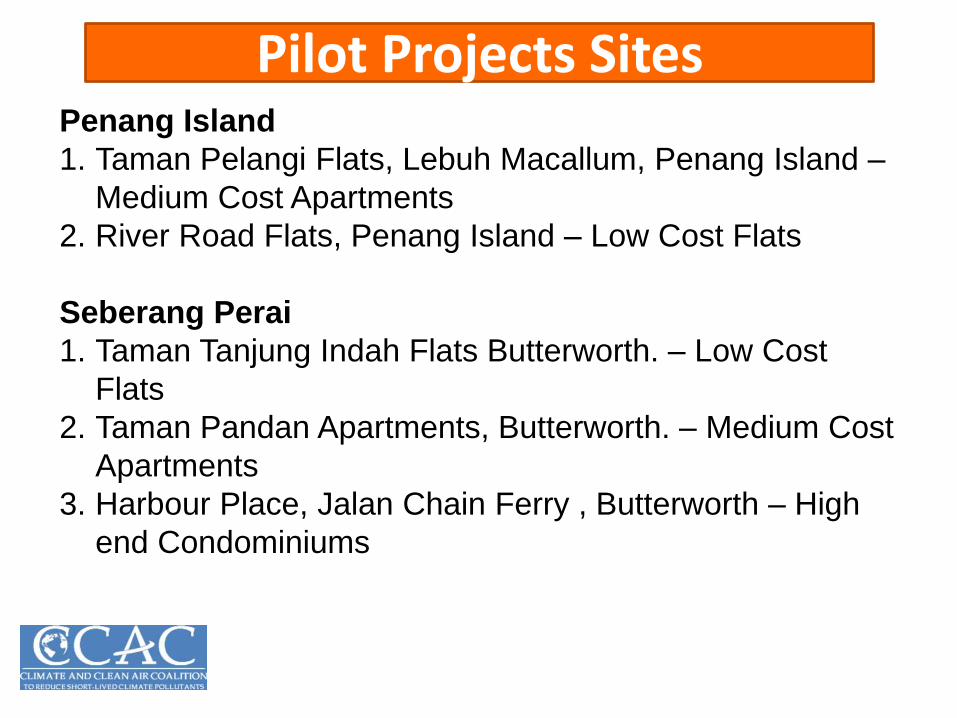
Pilot Projects SitesPenang Island
1. Taman Pelangi Flats, Lebuh Macallum, Penang Island –
Medium Cost Apartments
2. River Road Flats, Penang Island – Low Cost Flats
Seberang Perai
1. Taman Tanjung Indah Flats Butterworth. – Low Cost
Flats
2. Taman Pandan Apartments, Butterworth. – Medium Cost
Apartments
3. Harbour Place, Jalan Chain Ferry , Butterworth – High
end Condominiums
11
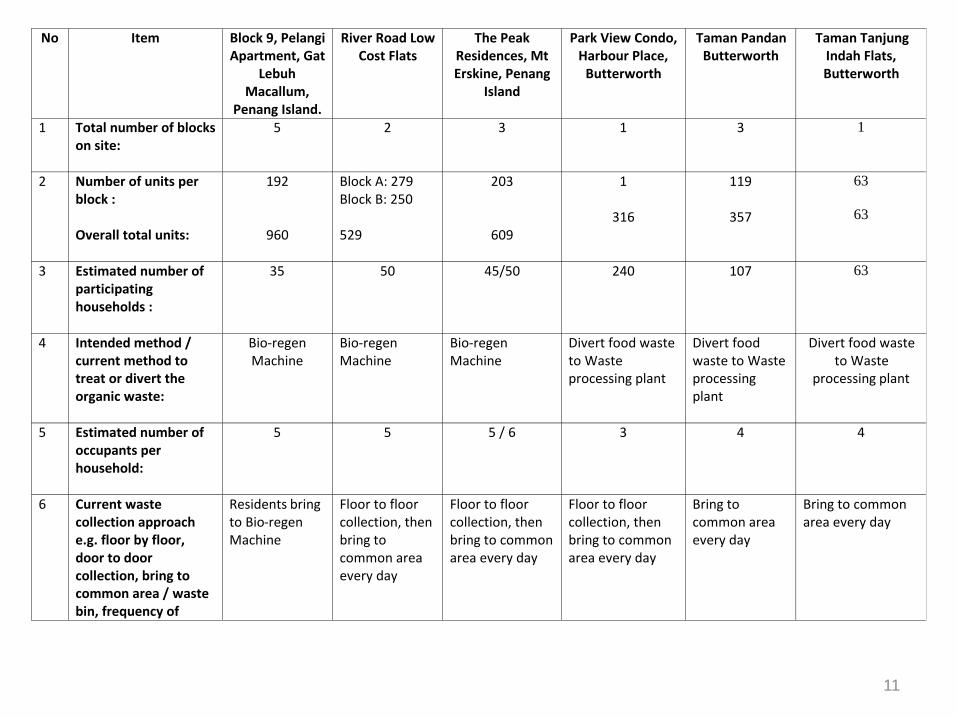
No Item Block 9, Pelangi Apartment, Gat
Lebuh Macallum,
Penang Island.
River Road Low Cost Flats
The Peak Residences, Mt Erskine, Penang
Island
Park View Condo, Harbour Place,
Butterworth
Taman Pandan Butterworth
Taman Tanjung Indah Flats, Butterworth
1 Total number of blocks on site:
5 2 3 1 3 1
2 Number of units per block : Overall total units:
192
960
Block A: 279 Block B: 250 529
203
609
1
316
119
357
63
63
3 Estimated number of participating households :
35 50 45/50 240 107 63
4 Intended method / current method to treat or divert the organic waste:
Bio-regen Machine
Bio-regen Machine
Bio-regen Machine
Divert food waste to Waste processing plant
Divert food waste to Waste processing plant
Divert food waste to Waste
processing plant
5 Estimated number of occupants per household:
5
5 5 / 6 3 4 4
6 Current waste collection approach e.g. floor by floor, door to door collection, bring to common area / waste bin, frequency of
Residents bring to Bio-regen Machine
Floor to floor collection, then bring to common area every day
Floor to floor collection, then bring to common area every day
Floor to floor collection, then bring to common area every day
Bring to common area every day
Bring to common area every day
12
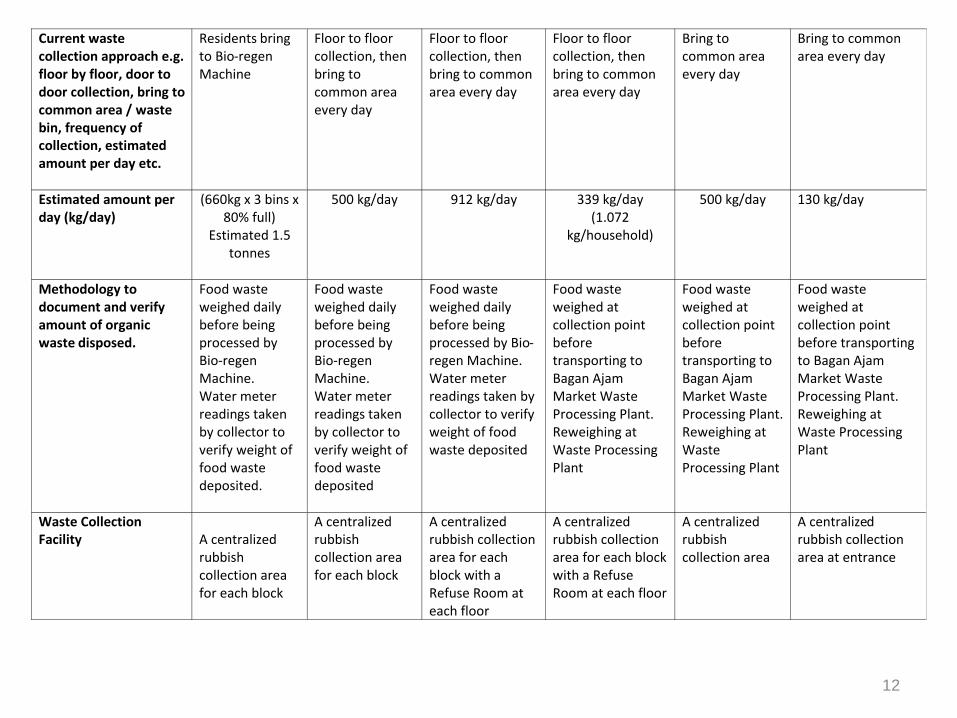
Current waste collection approach e.g. floor by floor, door to door collection, bring to common area / waste bin, frequency of collection, estimated amount per day etc.
Residents bring to Bio-regen Machine
Floor to floor collection, then bring to common area every day
Floor to floor collection, then bring to common area every day
Floor to floor collection, then bring to common area every day
Bring to common area every day
Bring to common area every day
Estimated amount per day (kg/day)
(660kg x 3 bins x 80% full)
Estimated 1.5 tonnes
500 kg/day 912 kg/day 339 kg/day (1.072
kg/household)
500 kg/day 130 kg/day
Methodology to document and verify amount of organic waste disposed.
Food waste weighed daily before being processed by Bio-regen Machine. Water meter readings taken by collector to verify weight of food waste deposited.
Food waste weighed daily before being processed by Bio-regen Machine. Water meter readings taken by collector to verify weight of food waste deposited
Food waste weighed daily before being processed by Bio-regen Machine. Water meter readings taken by collector to verify weight of food waste deposited
Food waste weighed at collection point before transporting to Bagan Ajam Market Waste Processing Plant. Reweighing at Waste Processing Plant
Food waste weighed at collection point before transporting to Bagan Ajam Market Waste Processing Plant. Reweighing at Waste Processing Plant
Food waste weighed at collection point before transporting to Bagan Ajam Market Waste Processing Plant. Reweighing at Waste Processing Plant
Waste Collection Facility
A centralized rubbish collection area for each block
A centralized rubbish collection area for each block
A centralized rubbish collection area for each block with a Refuse Room at each floor
A centralized rubbish collection area for each block with a Refuse Room at each floor
A centralized rubbish collection area
A centralized rubbish collection area at entrance
13
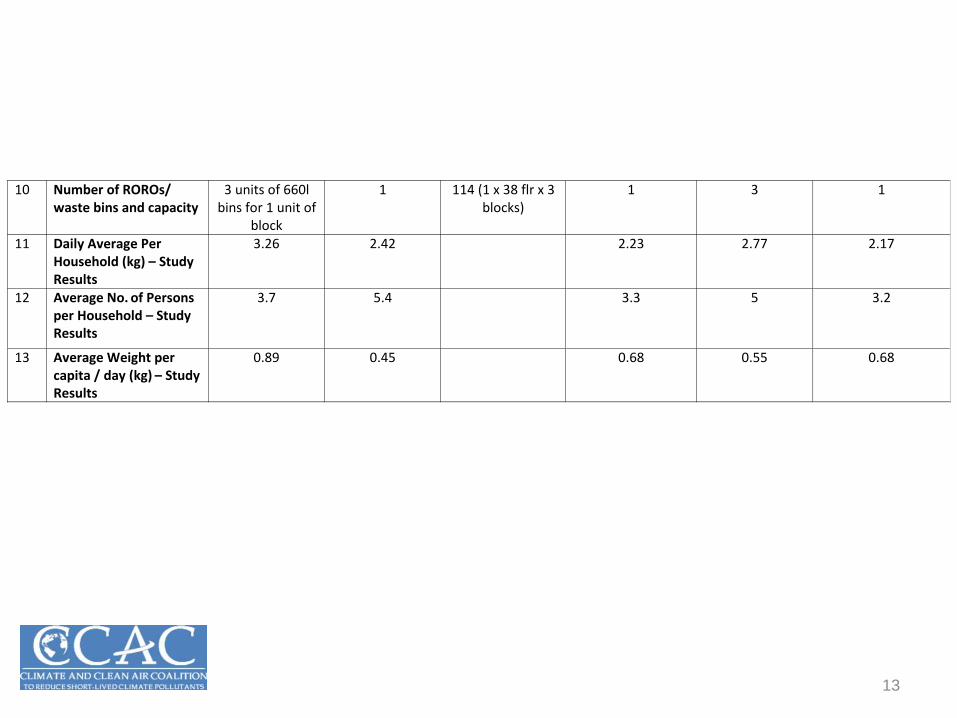
10 Number of ROROs/ waste bins and capacity
3 units of 660l bins for 1 unit of
block
1 114 (1 x 38 flr x 3 blocks)
1 3 1
11 Daily Average Per Household (kg) – Study Results
3.26 2.42 2.23 2.77 2.17
12 Average No. of Persons per Household – Study Results
3.7 5.4 3.3 5 3.2
13 Average Weight per capita / day (kg) – Study Results
0.89 0.45 0.68 0.55 0.68
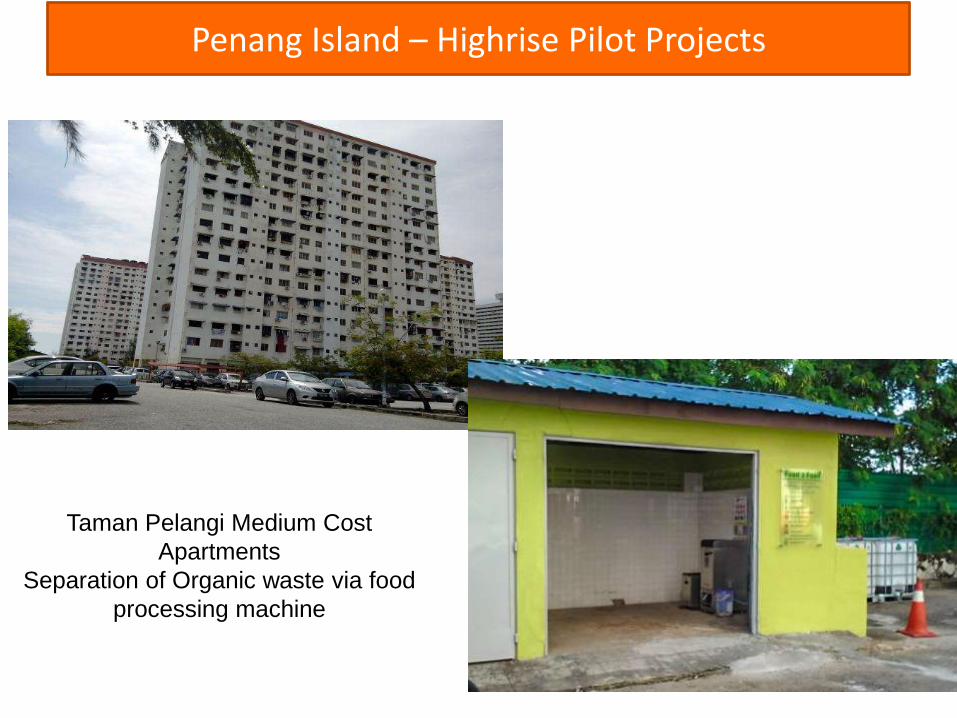
Penang Island – Highrise Pilot Projects
Taman Pelangi Medium Cost
Apartments
Separation of Organic waste via food
processing machine
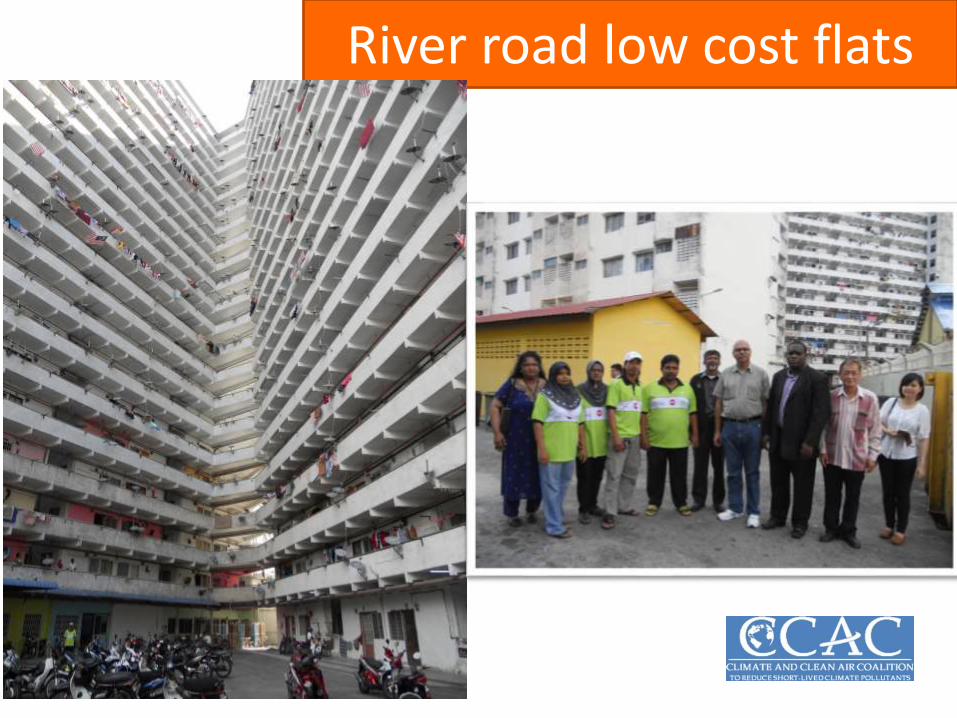
River road low cost flats
16
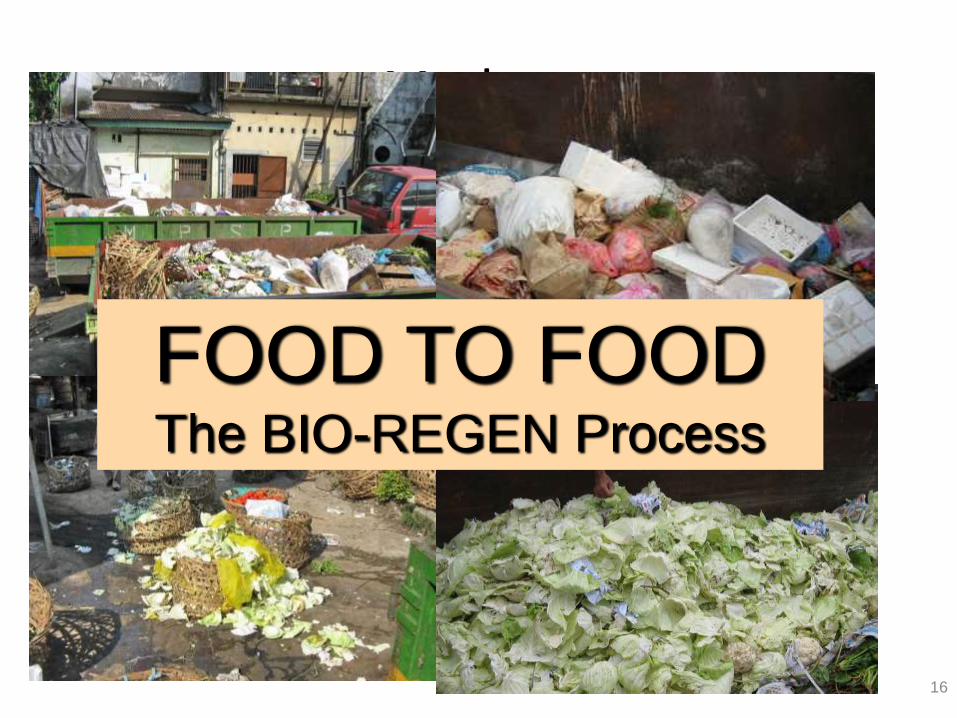
Markets
FOOD TO FOODThe BIO-REGEN Process
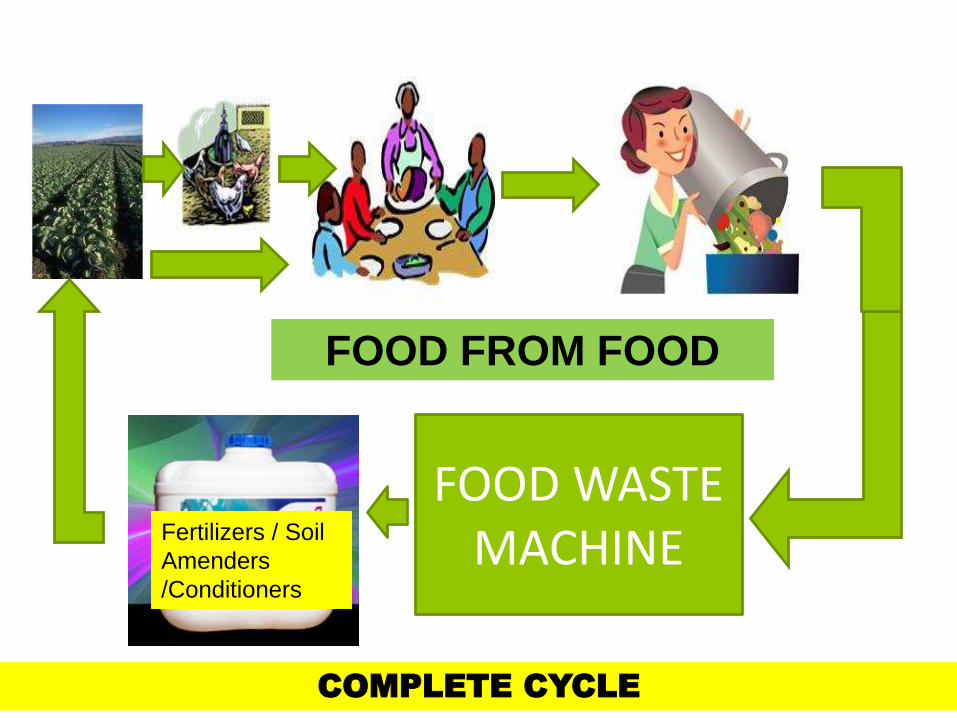
FOOD WASTE MACHINE
FOOD FROM FOOD
COMPLETE CYCLE
Fertilizers / Soil
Amenders
/Conditioners
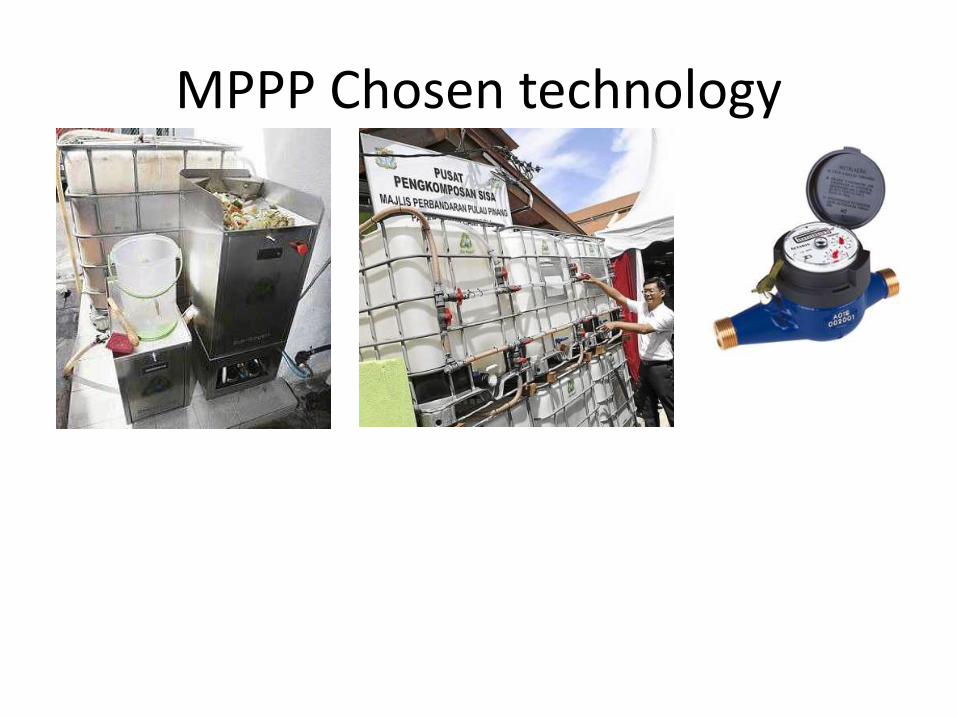
MPPP Chosen technology
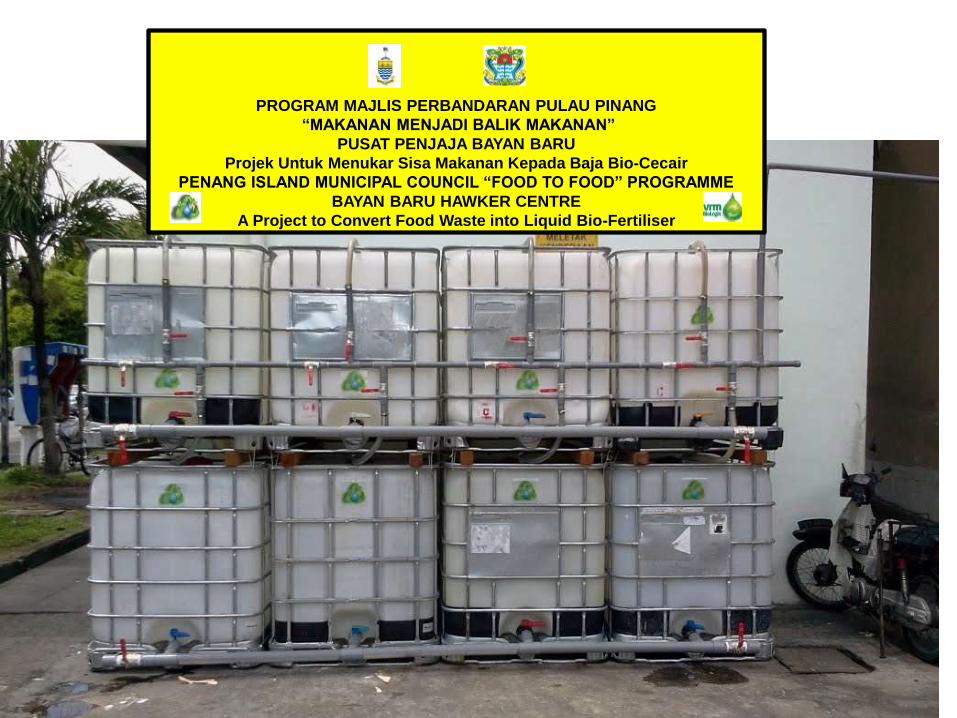
PROGRAM MAJLIS PERBANDARAN PULAU PINANG
“MAKANAN MENJADI BALIK MAKANAN”
PUSAT PENJAJA BAYAN BARU
Projek Untuk Menukar Sisa Makanan Kepada Baja Bio-Cecair
PENANG ISLAND MUNICIPAL COUNCIL “FOOD TO FOOD” PROGRAMME
BAYAN BARU HAWKER CENTRE
A Project to Convert Food Waste into Liquid Bio-Fertiliser
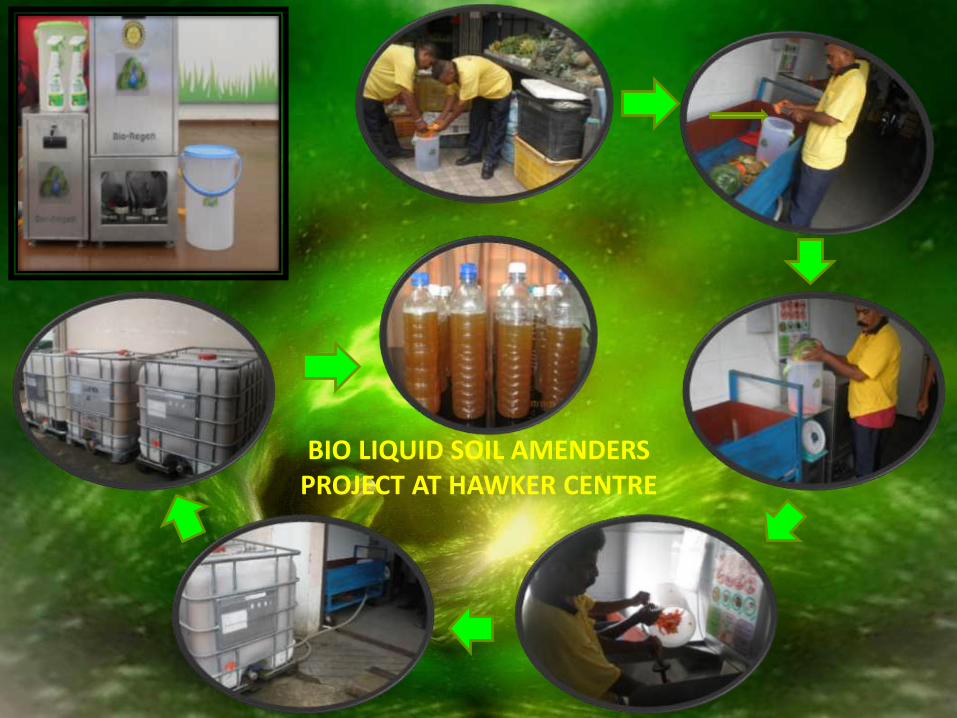
BIO LIQUID SOIL AMENDERSPROJECT AT HAWKER CENTRE
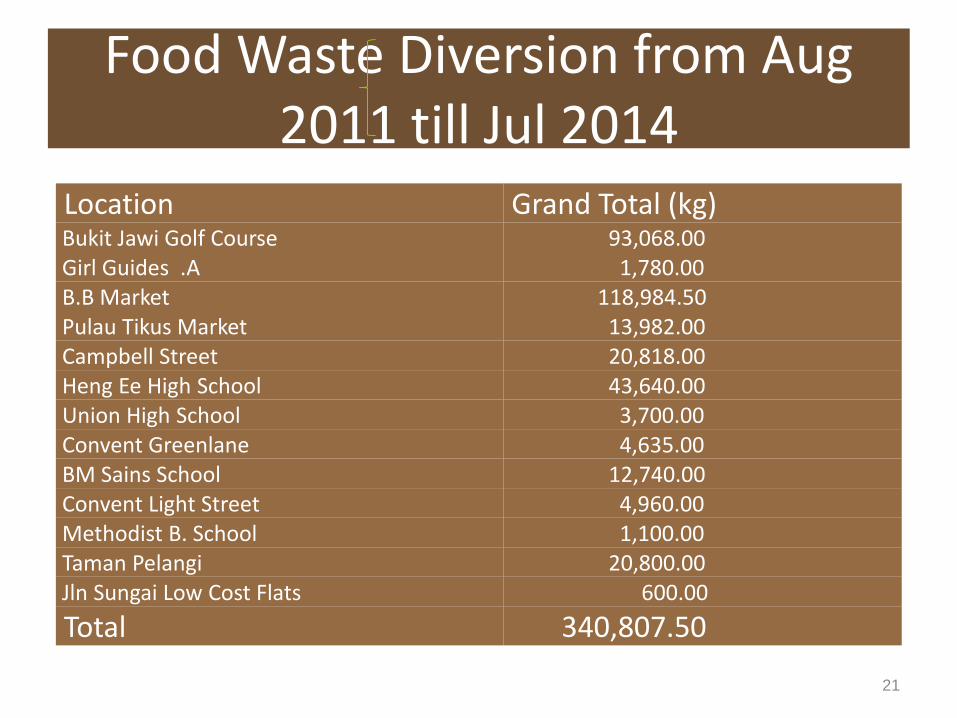
Food Waste Diversion from Aug 2011 till Jul 2014
21
Location Grand Total (kg) Bukit Jawi Golf Course 93,068.00 Girl Guides .A 1,780.00 B.B Market 118,984.50 Pulau Tikus Market 13,982.00 Campbell Street 20,818.00 Heng Ee High School 43,640.00 Union High School 3,700.00 Convent Greenlane 4,635.00 BM Sains School 12,740.00 Convent Light Street 4,960.00 Methodist B. School 1,100.00 Taman Pelangi 20,800.00 Jln Sungai Low Cost Flats 600.00
Total 340,807.50
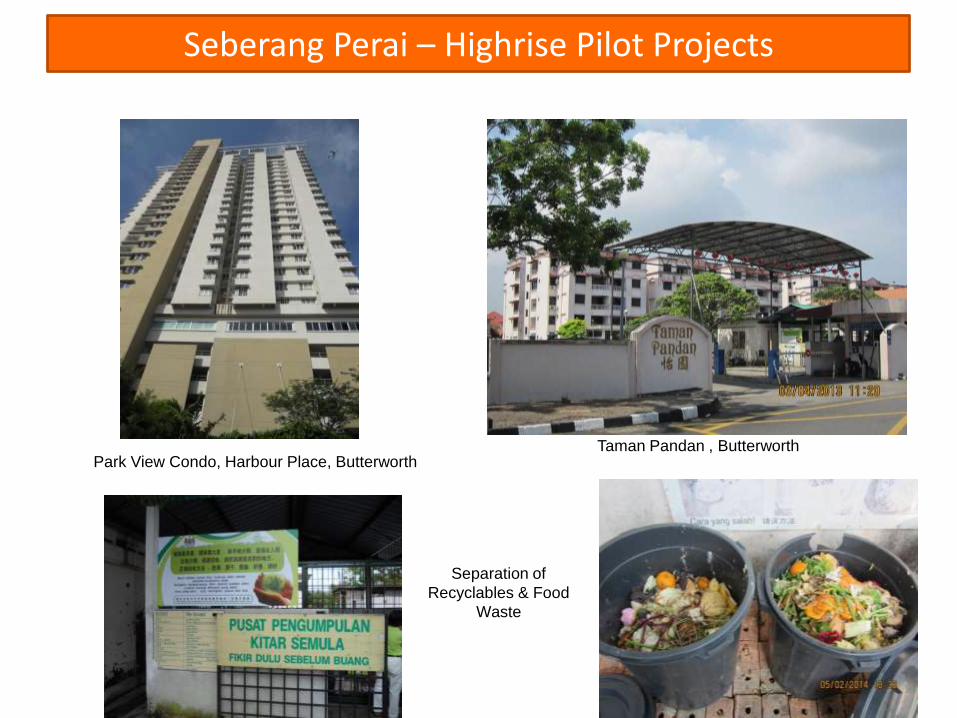
Seberang Perai – Highrise Pilot Projects
Taman Pandan , ButterworthPark View Condo, Harbour Place, Butterworth
Separation of
Recyclables & Food
Waste
23
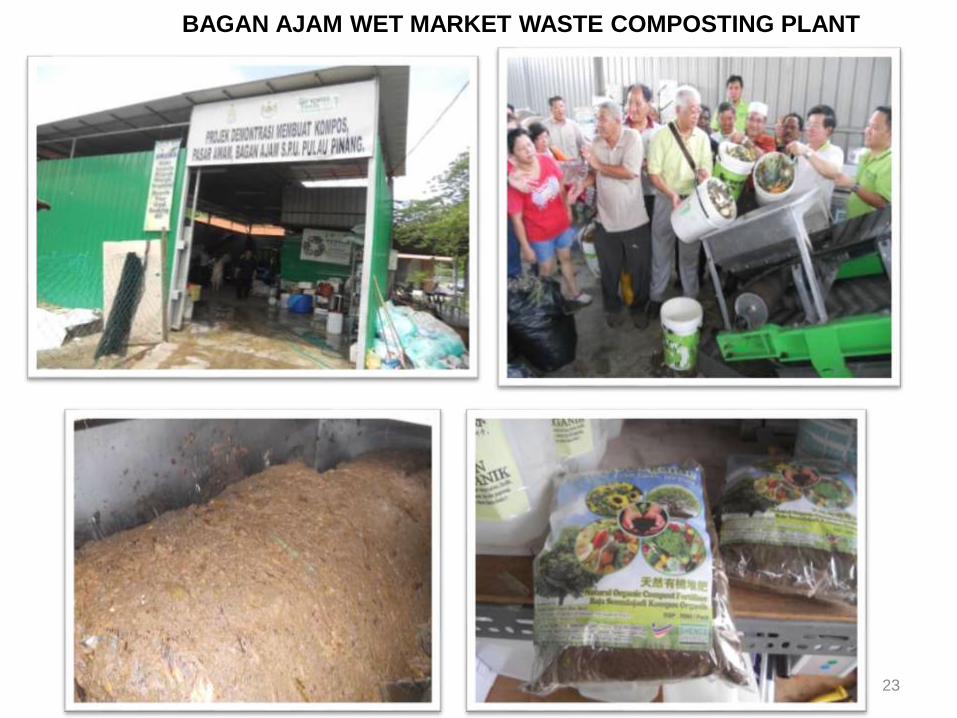
BAGAN AJAM WET MARKET WASTE COMPOSTING PLANT
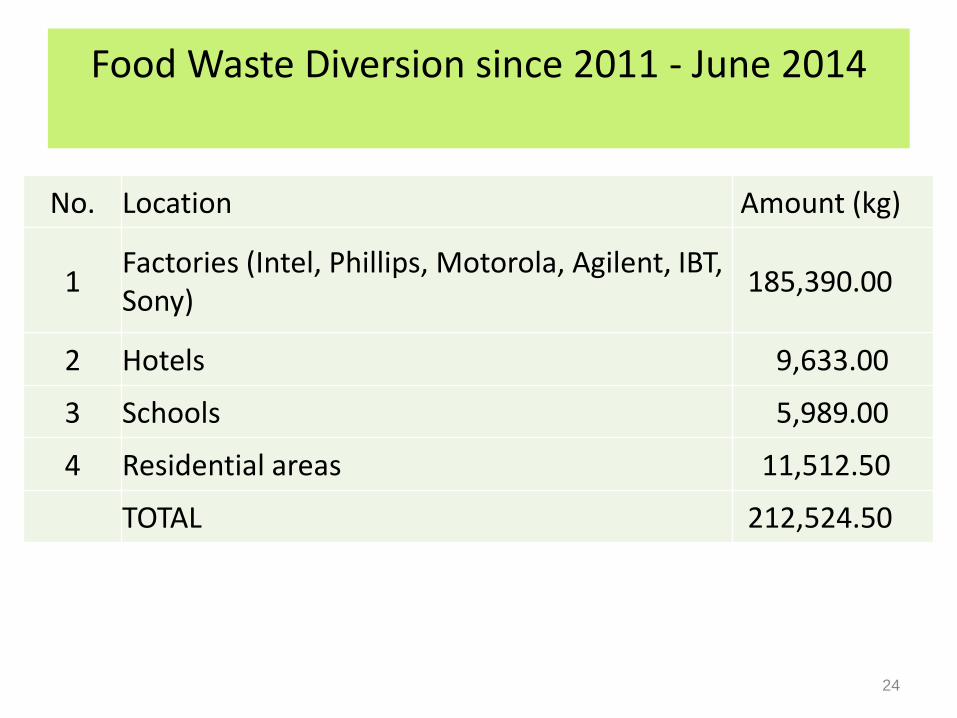
Food Waste Diversion since 2011 - June 2014
24
No. Location Amount (kg)
1Factories (Intel, Phillips, Motorola, Agilent, IBT, Sony)
185,390.00
2 Hotels 9,633.00
3 Schools 5,989.00
4 Residential areas 11,512.50
TOTAL 212,524.50
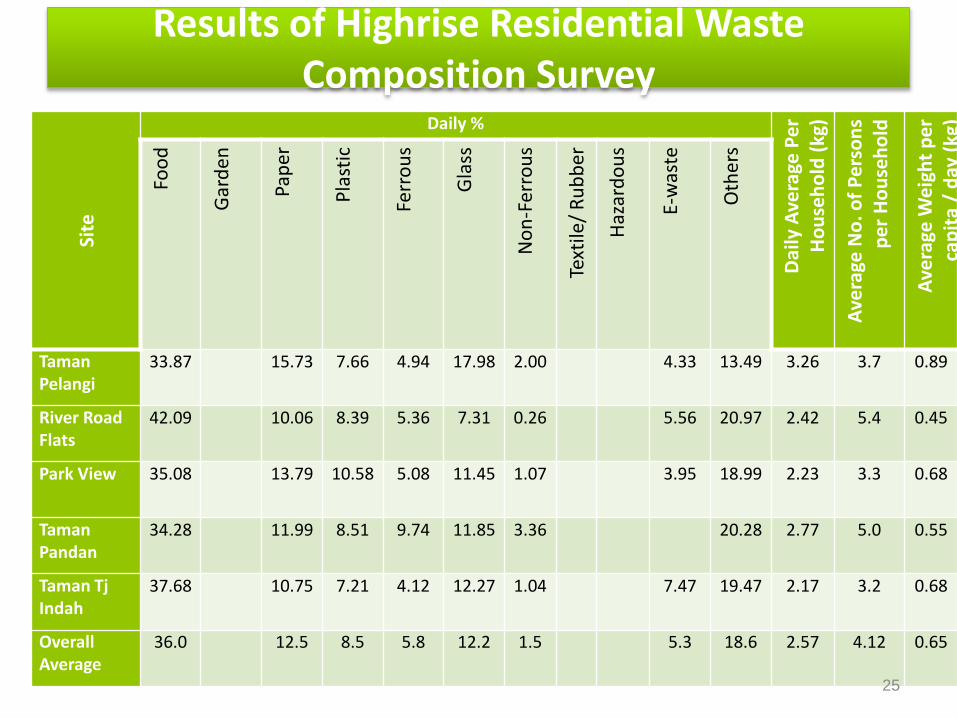
Results of Highrise Residential Waste Composition Survey
Site
Daily %
Dai
ly A
vera
ge P
er
Ho
use
ho
ld (
kg)
Ave
rage
No
. of
Pe
rso
ns
pe
r H
ou
seh
old
Ave
rage
We
igh
t p
er
cap
ita
/ d
ay (
kg)
Foo
d
Gar
den
Pap
er
Pla
stic
Ferr
ou
s
Gla
ss
No
n-F
erro
us
Text
ile/
Ru
bb
er
Haz
ard
ou
s
E-w
aste
Oth
ers
Taman Pelangi
33.87 15.73 7.66 4.94 17.98 2.00 4.33 13.49 3.26 3.7 0.89
River Road Flats
42.09 10.06 8.39 5.36 7.31 0.26 5.56 20.97 2.42 5.4 0.45
Park View 35.08 13.79 10.58 5.08 11.45 1.07 3.95 18.99 2.23 3.3 0.68
Taman Pandan
34.28 11.99 8.51 9.74 11.85 3.36 20.28 2.77 5.0 0.55
Taman Tj Indah
37.68 10.75 7.21 4.12 12.27 1.04 7.47 19.47 2.17 3.2 0.68
Overall Average
36.0 12.5 8.5 5.8 12.2 1.5 5.3 18.6 2.57 4.12 0.65
25
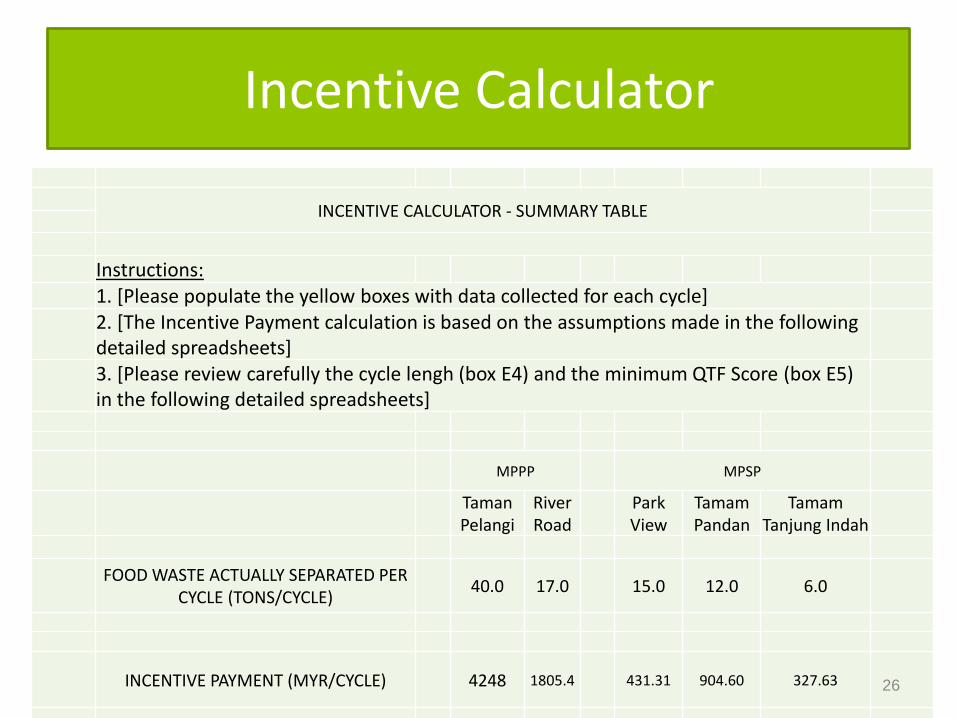
Incentive Calculator
INCENTIVE CALCULATOR - SUMMARY TABLE
Instructions:1. [Please populate the yellow boxes with data collected for each cycle]2. [The Incentive Payment calculation is based on the assumptions made in the following detailed spreadsheets]3. [Please review carefully the cycle lengh (box E4) and the minimum QTF Score (box E5) in the following detailed spreadsheets]
MPPP MPSP
Taman Pelangi
River Road
Park View
Tamam Pandan
Tamam Tanjung Indah
FOOD WASTE ACTUALLY SEPARATED PER CYCLE (TONS/CYCLE)
40.0 17.0 15.0 12.0 6.0
INCENTIVE PAYMENT (MYR/CYCLE) 4248 1805.4 431.31 904.60 327.63 26
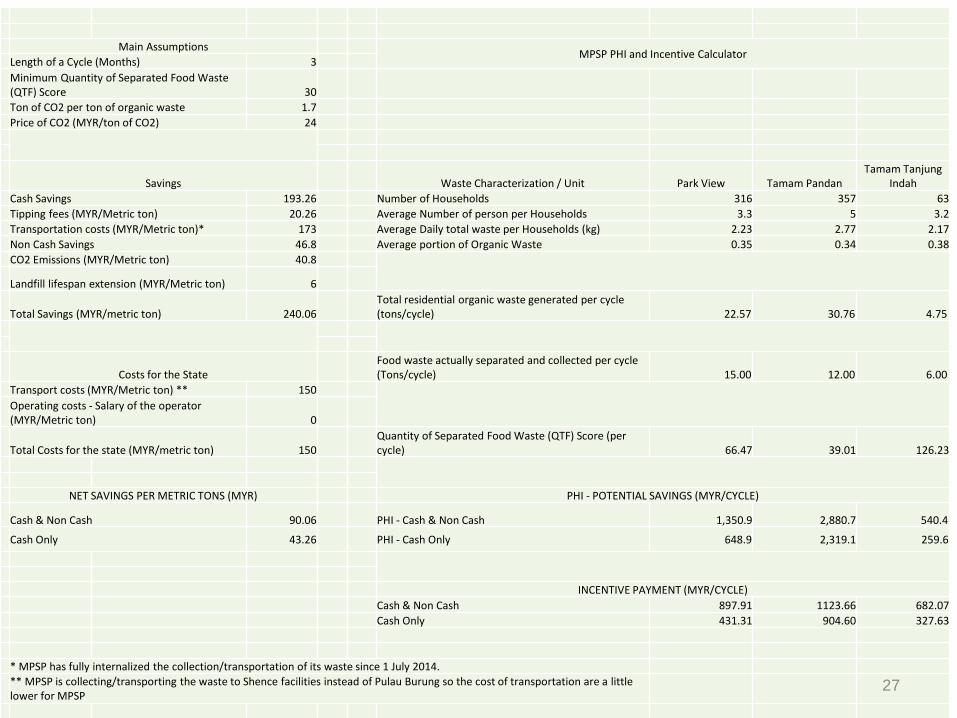
Main AssumptionsMPSP PHI and Incentive Calculator
Length of a Cycle (Months) 3
Minimum Quantity of Separated Food Waste (QTF) Score 30
Ton of CO2 per ton of organic waste 1.7
Price of CO2 (MYR/ton of CO2) 24
Savings Waste Characterization / Unit Park View Tamam PandanTamam Tanjung
Indah
Cash Savings 193.26 Number of Households 316 357 63
Tipping fees (MYR/Metric ton) 20.26 Average Number of person per Households 3.3 5 3.2
Transportation costs (MYR/Metric ton)* 173 Average Daily total waste per Households (kg) 2.23 2.77 2.17
Non Cash Savings 46.8 Average portion of Organic Waste 0.35 0.34 0.38
CO2 Emissions (MYR/Metric ton) 40.8
Landfill lifespan extension (MYR/Metric ton) 6
Total Savings (MYR/metric ton) 240.06Total residential organic waste generated per cycle (tons/cycle) 22.57 30.76 4.75
Costs for the StateFood waste actually separated and collected per cycle (Tons/cycle) 15.00 12.00 6.00
Transport costs (MYR/Metric ton) ** 150
Operating costs - Salary of the operator (MYR/Metric ton) 0
Total Costs for the state (MYR/metric ton) 150Quantity of Separated Food Waste (QTF) Score (per cycle) 66.47 39.01 126.23
NET SAVINGS PER METRIC TONS (MYR) PHI - POTENTIAL SAVINGS (MYR/CYCLE)
Cash & Non Cash 90.06 PHI - Cash & Non Cash 1,350.9 2,880.7 540.4
Cash Only 43.26 PHI - Cash Only 648.9 2,319.1 259.6
INCENTIVE PAYMENT (MYR/CYCLE)
Cash & Non Cash 897.91 1123.66 682.07
Cash Only 431.31 904.60 327.63
* MPSP has fully internalized the collection/transportation of its waste since 1 July 2014.
** MPSP is collecting/transporting the waste to Shence facilities instead of Pulau Burung so the cost of transportation are a little lower for MPSP
27
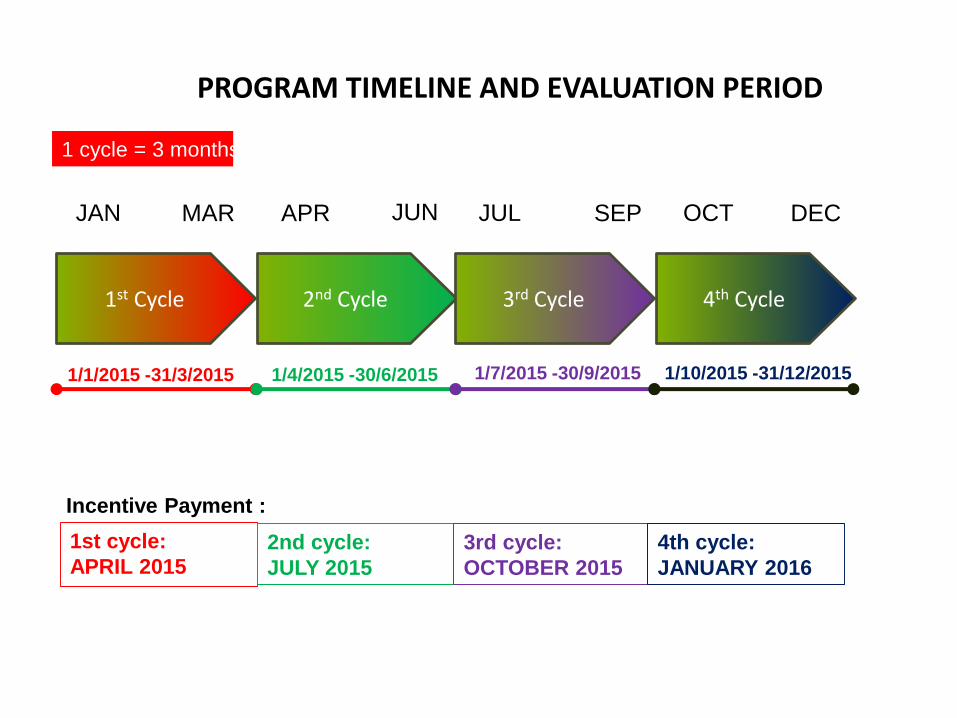
PROGRAM TIMELINE AND EVALUATION PERIOD
1st Cycle 2nd Cycle 3rd Cycle 4th Cycle
JAN MAR APR JUN JUL SEP OCT DEC
1 cycle = 3 months
1/1/2015 -31/3/2015 1/4/2015 -30/6/2015 1/7/2015 -30/9/2015 1/10/2015 -31/12/2015
Incentive Payment :
1st cycle:
APRIL 20152nd cycle:
JULY 2015
3rd cycle:
OCTOBER 2015
4th cycle:
JANUARY 2016
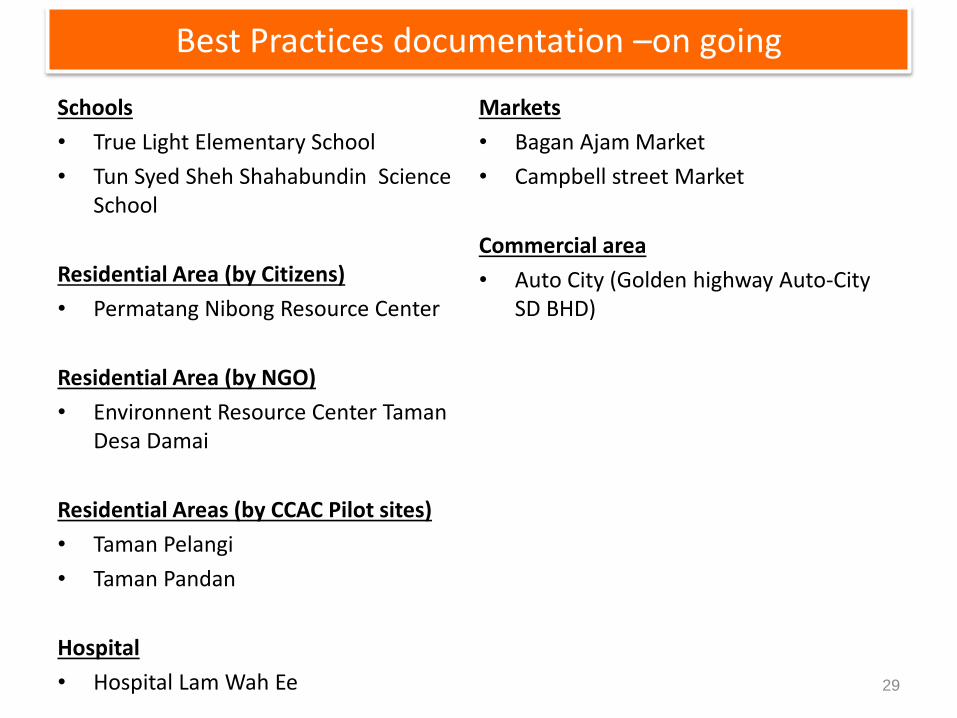
Best Practices documentation –on going
29
Schools
• True Light Elementary School
• Tun Syed Sheh Shahabundin Science School
Residential Area (by Citizens)
• Permatang Nibong Resource Center
Residential Area (by NGO)
• Environnent Resource Center Taman Desa Damai
Residential Areas (by CCAC Pilot sites)
• Taman Pelangi
• Taman Pandan
Hospital
• Hospital Lam Wah Ee
Markets
• Bagan Ajam Market
• Campbell street Market
Commercial area
• Auto City (Golden highway Auto-City SD BHD)

Brochures
30
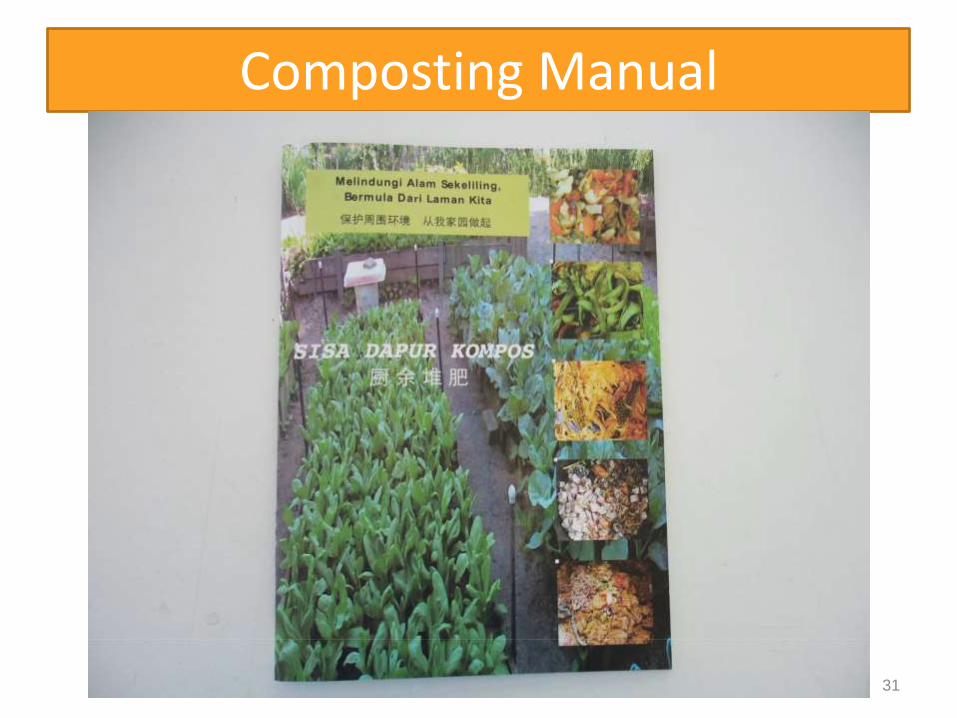
Composting Manual
31
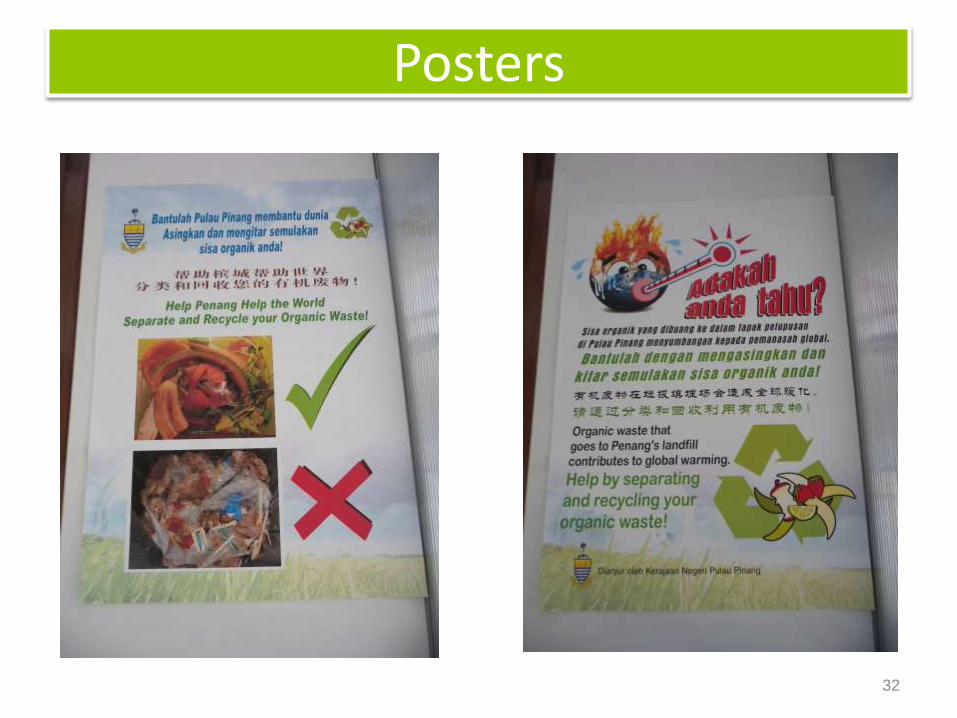
Posters
32
Other on-going Organic Waste Diversion Projects
• Food to Food Programme Residential area composting / Individual household composting
• Green Waste Composting
33
Green Waste TreatmentUtiilisng Methane-free fermentation technologies
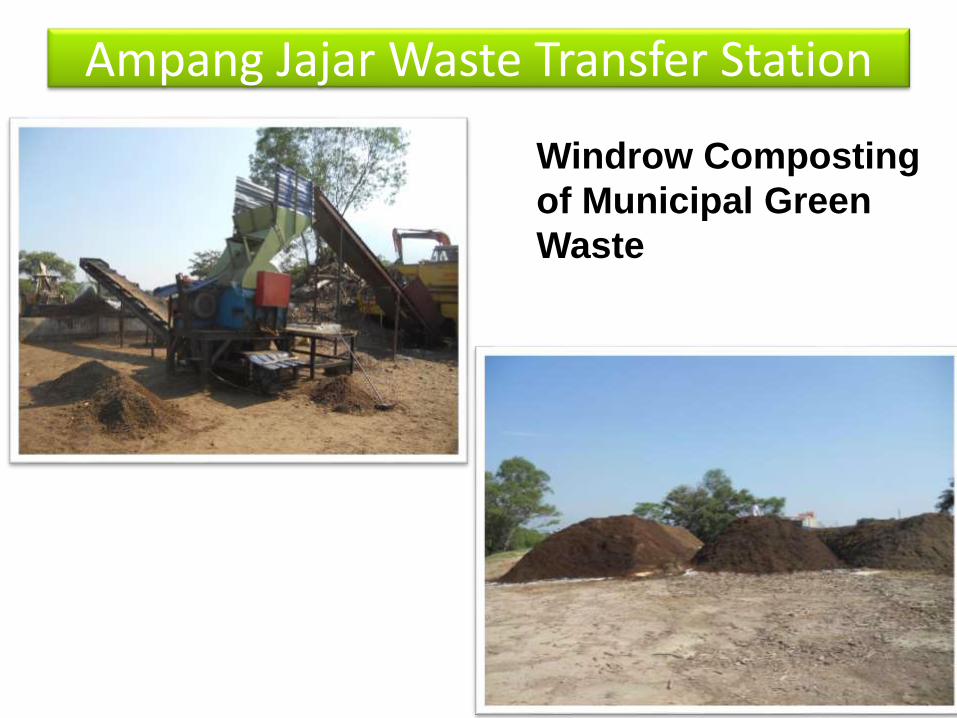
Ampang Jajar Waste Transfer Station
Windrow Composting
of Municipal Green
Waste
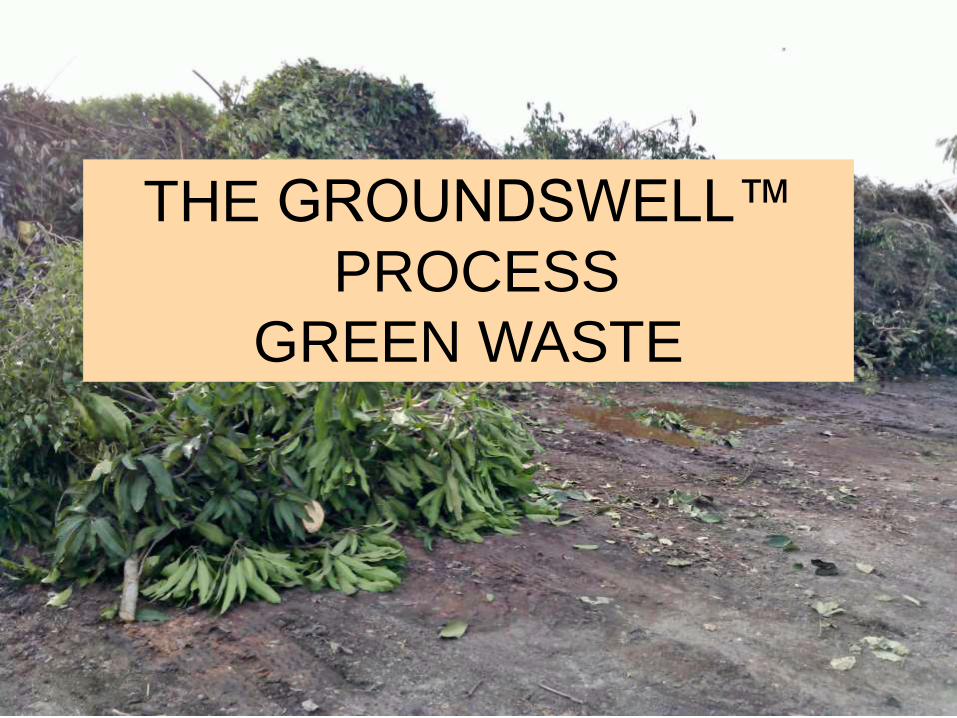
THE GROUNDSWELL™
PROCESS
GREEN WASTE
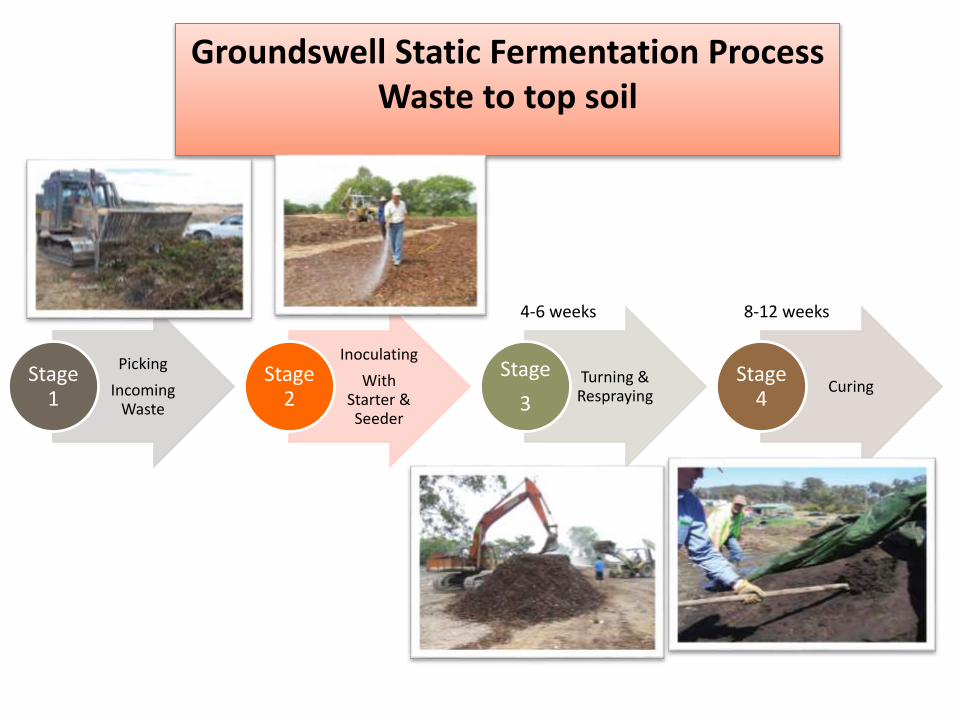
Picking
Incoming Waste
Stage 1
Inoculating
With Starter & Seeder
Stage 2
Turning & Respraying
Stage
3Curing
Stage 4
Groundswell Static Fermentation ProcessWaste to top soil
4-6 weeks 8-12 weeks
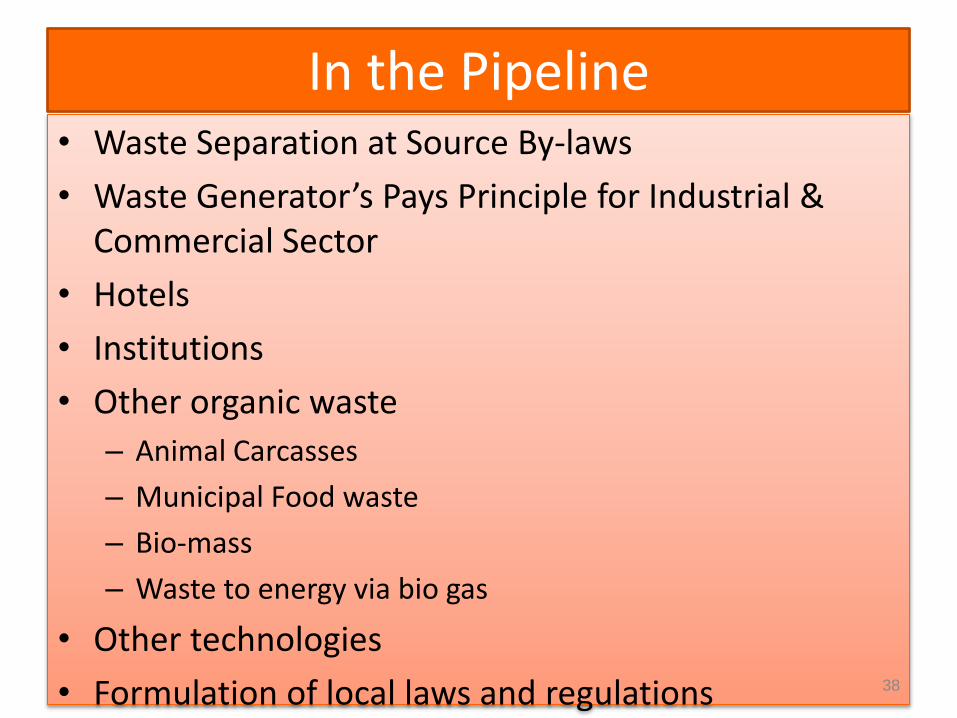
In the Pipeline• Waste Separation at Source By-laws
• Waste Generator’s Pays Principle for Industrial & Commercial Sector
• Hotels
• Institutions
• Other organic waste
– Animal Carcasses
– Municipal Food waste
– Bio-mass
– Waste to energy via bio gas
• Other technologies
• Formulation of local laws and regulations 38
REVIEWING THE PENANG ORGANIC WASTE POLICY
• The Penang Organic Waste Policy seeks to encourage the separation and treatment of organic waste at source in order to divert such away from the landfill prolonging its lifespan and reducing municipal cost. This is part of Penang’s local action towards a global commitment to mitigate the effects of global warming and climate change.
• In any natural system the organic outputs of any natural process become the inputs for another natural process. In this regard, Penang’s Organic Waste Policy will seek to emulate nature and return all organic outputs to food production, parks and gardens
39
In the Pipeline Tackling Organics and Methane Generation at theLandfill
• Possibility of landfill gas extraction in the closed Phase 1 and Phase 2 of the landfill.
• Turning the 300 acres of Oil Palm waste into a resource at the new Phase 3 of the Landfill.
• Establishing an MRF to separate the daily incoming mixed waste and dealing with the organic waste faction (400-600 tons/day) using a bio-digestion technology in Phase 3.
• Regional Workshop March 2015
40
PROPOSED PENANG’S VOLUNTARY CARBON OFFSET SCHEME
Original Photo: churchofnobody.blogspot.com
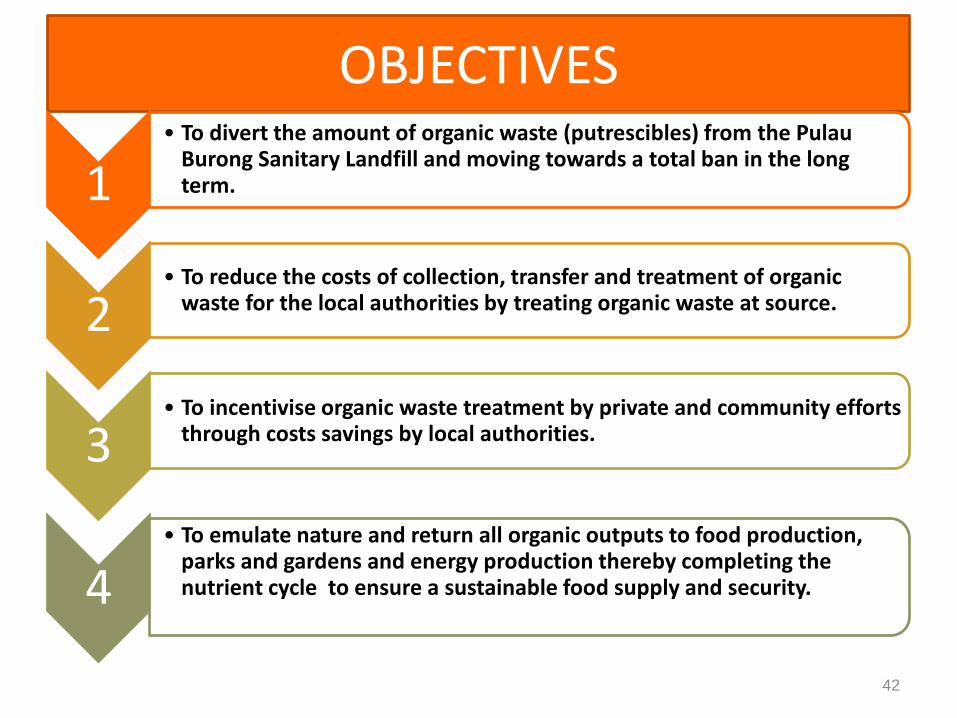
OBJECTIVES
1• To divert the amount of organic waste (putrescibles) from the Pulau
Burong Sanitary Landfill and moving towards a total ban in the long term.
2• To reduce the costs of collection, transfer and treatment of organic
waste for the local authorities by treating organic waste at source.
3• To incentivise organic waste treatment by private and community efforts
through costs savings by local authorities.
4• To emulate nature and return all organic outputs to food production,
parks and gardens and energy production thereby completing the nutrient cycle to ensure a sustainable food supply and security.
42
CONCLUSION
43
• Generate a beneficial by-products = use reduction and conversion of organic waste to earn carbon offsets?
• Reducing the amount of organic waste sent to landfill = reducing greenhouse gas emissions
• Diverting green waste and organics divert up to 40 to 50% of the waste from landfill = cost savings
• Continuous awareness campaigns needed for participation

44