pedestrian countdown at traffic signal junctions … · transport research laboratory pedestrian...
TRANSCRIPT

Transport Research Laboratory
Pedestrian Countdown at Traffic Signal
Junctions (PCaTS) - Road Trial
by Iain York, Simon Ball, Rachel Beesley, David Webster, Phil Knight and Jean Hopkin
TfL 2481
PROJECT REPORT

2
Transport Research Laboratory
PROJECT REPORT
Pedestrian Countdown at Traffic Signal Junctions (PCaTS) - Road Trial
by Iain York, Simon Ball, Rachel Beesley, David Webster, Phil Knight and Jean
Hopkin (TRL)
Prepared for: Project Record: TfL 2481
Pedestrian Countdown at Traffic Signal Junctions (PCaTS) On Street Perception
and Behavioural Analysis
Client: TfL,
Ben Giles
Copyright Transport Research Laboratory May 2011
The views expressed are those of the author(s) and not necessarily those of TfL.

3
Contents 1 Introduction .................................................................................................... 4
2 Methodology ................................................................................................... 6
2.1 Face-to-face questionnaires........................................................................ 6
2.2 Video Surveys .......................................................................................... 6
2.3 Video data collection ................................................................................. 6
2.4 The sites .................................................................................................. 6
3 Pedestrian Attitudes ......................................................................................... 9
3.1 Preference for type of crossing ................................................................... 9
3.2 Perception of time available for crossing .................................................... 11
3.3 Perception of Safety ................................................................................ 14
3.4 Stated ability to continue crossing during countdown ................................... 16
3.5 Stated crossing intentions during countdown .............................................. 16
4 Pedestrian Observations ................................................................................. 20
4.1 How long pedestrians wait to cross ........................................................... 20
4.2 Pedestrian delay ..................................................................................... 20
4.3 When pedestrians start to cross ................................................................ 21
4.4 Pedestrians still on crossing near/at end of pedestrian cycle ......................... 25
5 Walking speeds ............................................................................................. 26
6 Vehicle Observations ...................................................................................... 28
6.1 Vehicle Delay ......................................................................................... 28
6.2 Time of first vehicle starting to move ......................................................... 29
7 Interactions/Conflicts ..................................................................................... 31
7.1 Severity and when they occurred .............................................................. 31
7.2 Vehicle types .......................................................................................... 34
8 Discussion and Conclusions ............................................................................. 36

4
1 Introduction
This report describes an analysis and overview of research findings from TRL‟s
monitoring of Transport for London‟s (TfL‟s) eight trial sites for Pedestrian Countdown at
Traffic Signal junctions (PCaTS).
PCaTS is one of the measures included in the Mayor of London‟s Transport Strategy (TfL,
2010) for smoothing traffic flow, as it has the potential to improve junction efficiency
and help optimise the allocation of „Green time‟ between pedestrians and road traffic. It
was developed following a previous trial of the effects of re-timing pedestrian crossings
at junctions. The previous study found that, while there were no adverse impacts on
safety, some pedestrians (mainly mobility impaired) reported feeling rushed and had
concerns about the time available for safe crossing. These concerns could have stemmed
from the considerable confusion about the meaning of each signal presented to
pedestrians wishing to cross at junctions. In particular, the study found that the meaning
of the „Black-out‟ period (the time between the „Green Man‟ invitation to cross and „Red
Man‟, where no information is displayed) is poorly understood by pedestrians. In
practice, the „Black-out‟ period allows sufficient time for pedestrians to safely complete
their crossing but without further information pedestrians can feel uncertain.
The PCaTS system used in the trials was selected following a review of international
research, discussions with the Department for Transport (DfT) and opinion research of
road users. It consists of a far-side digital count-down time display fitted next to the
pedestrian signal heads. The pedestrian signal phases for PCaTS and standard crossings
are compared in Figure 1 below.
Standard pedestrian crossing at signalised junction (Before Sequence)
Pedestrian signals with PCaTS (After sequence)
Meaning
Green Man
Green Man
Invitation for a pedestrian to cross
Blackout
Countdown
Time between the end of the ‘Green Man’ and the start of the ‘Red Man’, the clearance period for pedestrians already on the crossing to reach the other side.
Red Man Red Man
Time when pedestrians should not cross, including the All Red period (both a Red Man shown to pedestrians and a Red Signal shown to Traffic) and when traffic has or will shortly gain priority.
Figure 1 Pedestrian signal phases for a standard crossing and PCaTS compared

5
By providing a visible countdown of the time remaining before the appearance of the
„Red man‟, PCaTS is intended to give pedestrians a better understanding of the time
available for them to complete crossing, reducing anxiety once the Green Man is no
longer displayed. This additional information is intended to help people to make more
informed crossing choices.
The trial sites included the installation of a Countdown timer alongside changes to the
signal timings at the junctions. This is referred to as the “PCaTS package of measures”
and included:
Reduction in Green Man time to a standard 6 seconds (aligned to DfT guidance)
Increase in „Blackout‟ time (with a countdown timer)
Reduction in „All Red‟ time (to a standard 3 seconds, with a 2 second starting amber to
traffic)
Increase in traffic green time (as a consequence of the above changes).
The trial involved conducting video-based observational surveys, as well as interviews
with groups of pedestrians, before and after the installation of the PCaTS package, to
assess how it influenced both attitudes and understanding of pedestrians, and the
behaviour of pedestrians and drivers.
This report describes an outline of the surveys conducted (Section 2), the results of the
surveys (Sections 3 to 6) and then interprets their meaning (Section 7).
Further details of the methodology and detailed findings are provided in the Technical
Appendix to this report.

6
2 Methodology
The Countdown timers were installed at the eight sites during the summer months of
2010. A series of surveys was conducted at each site before and after the installation of
the PCaTS package. This report focuses on changes between the before situation and
situation after a 3 month settling in period. This is described as the „After 2‟ survey in
the technical appendices where details of the initial „After 1‟ survey can also be found.
Two types of surveys were carried out at each site:
Face-to-face questionnaire surveys of pedestrians‟ perceptions
Video surveys: examining behaviour of pedestrians and drivers and their interactions
In addition, accompanied walk surveys were performed at one site with a group of
mobility impaired pedestrians and with children. This included a questionnaire to obtain
opinions about the crossing experiences at PCaTS and Standard crossings. To
differentiate results from different surveys, the term participants is used for those taking
part in the main surveys, whilst mobility impaired and children are used to refer to those
taking part in the accompanied walks.
2.1 Face-to-face questionnaires
The questionnaire surveys were carried out just after people had used the crossing and
collected information on understanding and perceptions, including:
Preferences for type of crossing
Perception of the time they have available to cross the road
Perception of safety while crossing the road
Their interpretation of the information and how it would affect their crossing
decisions
In these surveys members of the public were selected at random as they completed
using the crossing and asked to take part in a questionnaire survey.
2.2 Video Surveys
The video surveys were used to record the movements and interactions between the
drivers and pedestrians at one arm of each of the junctions in the trial.
2.3 Video data collection
The video surveys were used to obtain information on:
Pedestrian flows according to the pedestrian signal phases
Pedestrian delay, crossing decision and speeds
How pedestrians used the crossing
Interactions and conflicts between pedestrians and vehicles
Vehicle flows
Time vehicles started to move and their delay
2.4 The sites
The sites selected for the trial were chosen by TfL with the aim of including a range of
crossings representing the different situations expected. These included crossings with
varying widths (i.e. number of traffic lanes) and crossings with and without a central
7
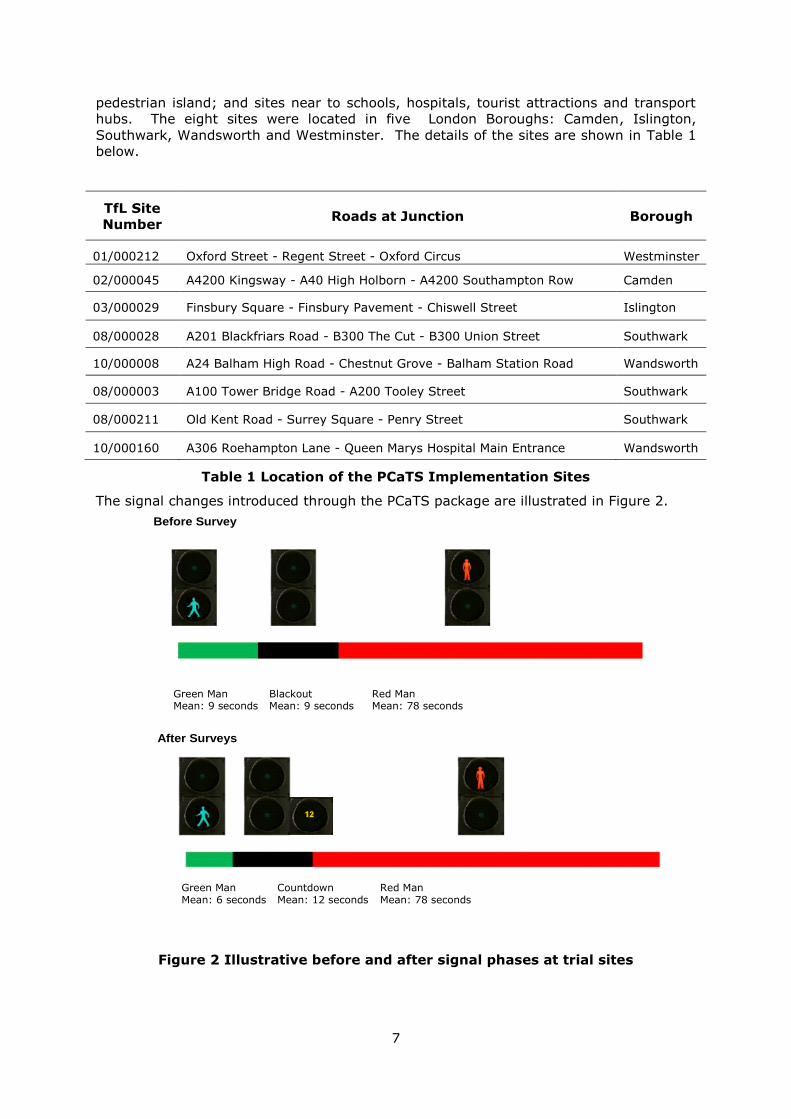
pedestrian island; and sites near to schools, hospitals, tourist attractions and transport
hubs. The eight sites were located in five London Boroughs: Camden, Islington,
Southwark, Wandsworth and Westminster. The details of the sites are shown in Table 1
below.
TfL Site
Number Roads at Junction Borough
01/000212 Oxford Street - Regent Street - Oxford Circus Westminster
02/000045 A4200 Kingsway - A40 High Holborn - A4200 Southampton Row Camden
03/000029 Finsbury Square - Finsbury Pavement - Chiswell Street Islington
08/000028 A201 Blackfriars Road - B300 The Cut - B300 Union Street Southwark
10/000008 A24 Balham High Road - Chestnut Grove - Balham Station Road Wandsworth
08/000003 A100 Tower Bridge Road - A200 Tooley Street Southwark
08/000211 Old Kent Road - Surrey Square - Penry Street Southwark
10/000160 A306 Roehampton Lane - Queen Marys Hospital Main Entrance Wandsworth
Table 1 Location of the PCaTS Implementation Sites
The signal changes introduced through the PCaTS package are illustrated in Figure 2.
Figure 2 Illustrative before and after signal phases at trial sites
Before Survey
After Surveys
Green Man
10 seconds
Blackout
10 seconds
Red man
Up to 72 seconds
Green Man
6 seconds
Countdown
12 seconds
Red man
Up to 72 seconds
Green Man Blackout Red Man Mean: 9 seconds Mean: 8 seconds Mean: 81 seconds
Green Man Countdown Red Man Mean: 6 seconds Mean: 12 seconds Mean: 78 seconds
Green Man Blackout Red Man Mean: 9 seconds Mean: 9 seconds Mean: 78 seconds
Green Man Countdown Red Man Mean: 6 seconds Mean: 12 seconds Mean: 78 seconds

8
Results varied between sites; however, where common trends were evident an overall
change has been reported. It should therefore be noted that the magnitude of reported
changes were site dependent, and reported averages should not be considered
representative of all sites.

9
0.0
10.0
20.0
30.0
40.0
50.0
60.0
70.0
80.0
90.0
100.0
01 / 212 (Oxford St.) 08 / 211 (Old Kent Rd.) Average (all sites)
Pe
rce
nta
ge o
f p
arti
cip
ants
Very much like / Like
Neither / No difference
Dislike / Very much dislike
3 Pedestrian Attitudes
PCaTS increases the amount of information available to pedestrians: by informing them
of the amount of time remaining until the impending change of priority to vehicles at the
junction. Providing such information could affect how people use the crossing and their
opinions of their crossing experience.
In addition, questionnaires were administered to groups of mobility impaired and
children after they had taken part in an accompanied walk. The walks included crossing
both a standard crossing and a PCaTS crossing a number of times. The questions
focussed on the relative opinions of the two types of crossings.
3.1 Preference for type of crossing
Pedestrians in the „After‟ studies were asked whether they liked PCaTS. Their answers
are presented in
Figure 3, for the sites with the least and most preference for PCaTS.
Number of participants
Very much like / Like
Neither / No difference
Dislike / Very much dislike
01 / 212 (Oxford St.) 57 6 1
08 / 211 (Old Kent Rd) 50 14 1
Average (all sites) 409 61 20
Figure 3 Whether pedestrians liked PCaTS (‘After’ Surveys only)
The mobility impaired participants were also asked the same question after their
accompanied walk, see Figure 4.
10
Very much like / Like
Neither / No difference
Dislike / Very much dislike
Number of mobility impaired participants
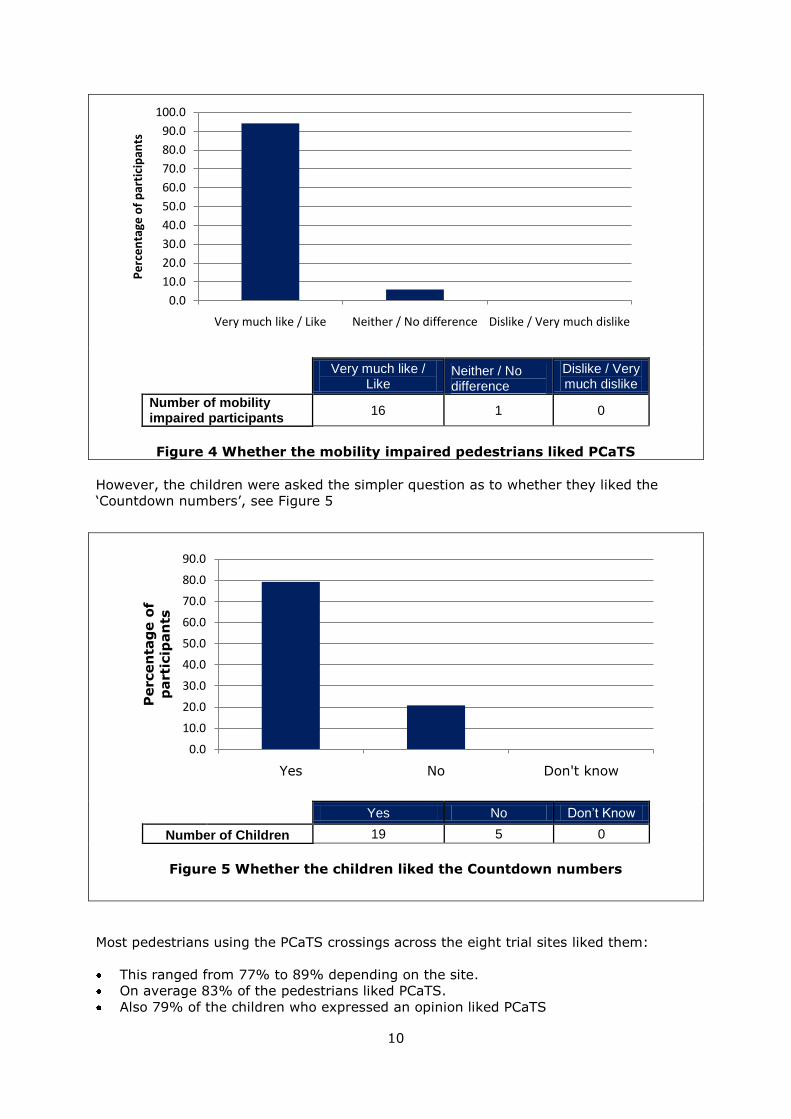
16 1 0
Figure 4 Whether the mobility impaired pedestrians liked PCaTS
However, the children were asked the simpler question as to whether they liked the
„Countdown numbers‟, see Figure 5
Yes No Don’t Know
Number of Children 19 5 0
Figure 5 Whether the children liked the Countdown numbers
Most pedestrians using the PCaTS crossings across the eight trial sites liked them:
This ranged from 77% to 89% depending on the site.
On average 83% of the pedestrians liked PCaTS.
Also 79% of the children who expressed an opinion liked PCaTS
0.0
10.0
20.0
30.0
40.0
50.0
60.0
70.0
80.0
90.0
100.0
Very much like / Like Neither / No difference Dislike / Very much dislike
Pe
rce
nta
ge o
f p
arti
cip
ants
0.0
10.0
20.0
30.0
40.0
50.0
60.0
70.0
80.0
90.0
Yes No Don't know
Percen
tag
e o
f p
arti
cip
an
ts
11
0.0
10.0
20.0
30.0
40.0
50.0
60.0
70.0
80.0
Standard
crossing
PCaTS crossing Neither / Same
Percen
tag
e o
f
parti
cip
an
ts
Mobility Impaired
Children
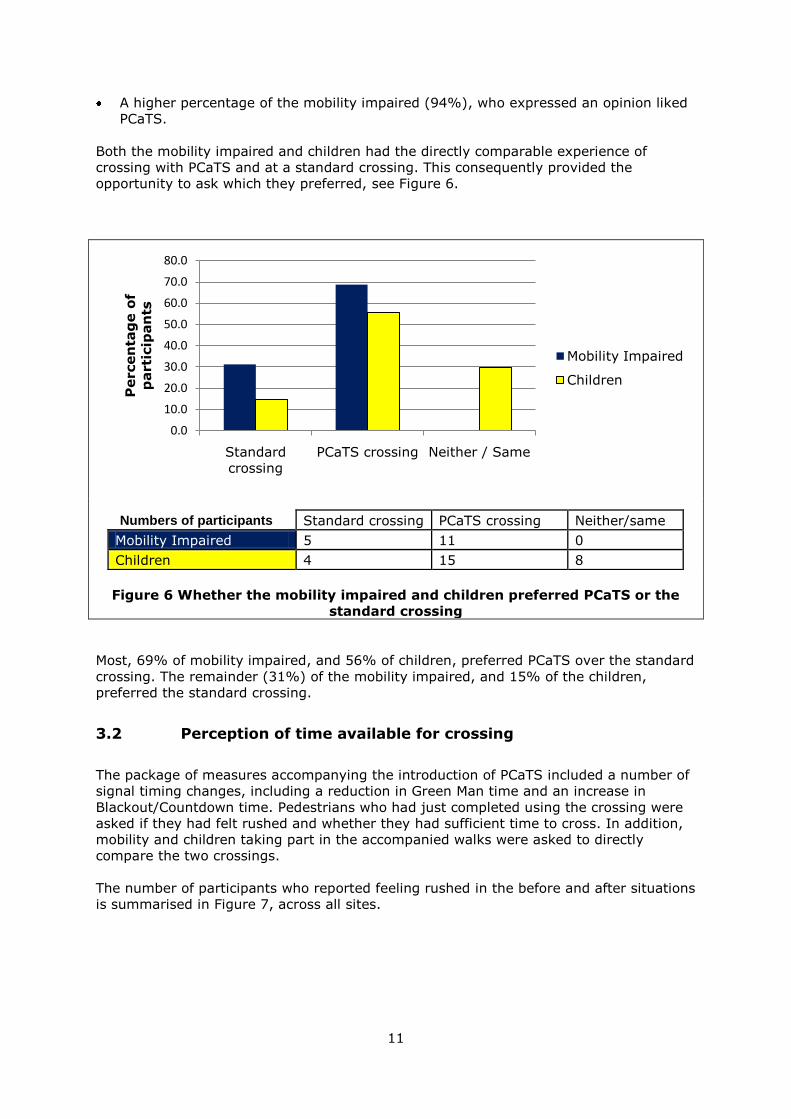
A higher percentage of the mobility impaired (94%), who expressed an opinion liked
PCaTS.
Both the mobility impaired and children had the directly comparable experience of
crossing with PCaTS and at a standard crossing. This consequently provided the
opportunity to ask which they preferred, see Figure 6.
Numbers of participants Standard crossing PCaTS crossing Neither/same
Mobility Impaired 5 11 0
Children 4 15 8
Figure 6 Whether the mobility impaired and children preferred PCaTS or the
standard crossing
Most, 69% of mobility impaired, and 56% of children, preferred PCaTS over the standard
crossing. The remainder (31%) of the mobility impaired, and 15% of the children,
preferred the standard crossing.
3.2 Perception of time available for crossing
The package of measures accompanying the introduction of PCaTS included a number of
signal timing changes, including a reduction in Green Man time and an increase in
Blackout/Countdown time. Pedestrians who had just completed using the crossing were
asked if they had felt rushed and whether they had sufficient time to cross. In addition,
mobility and children taking part in the accompanied walks were asked to directly
compare the two crossings.
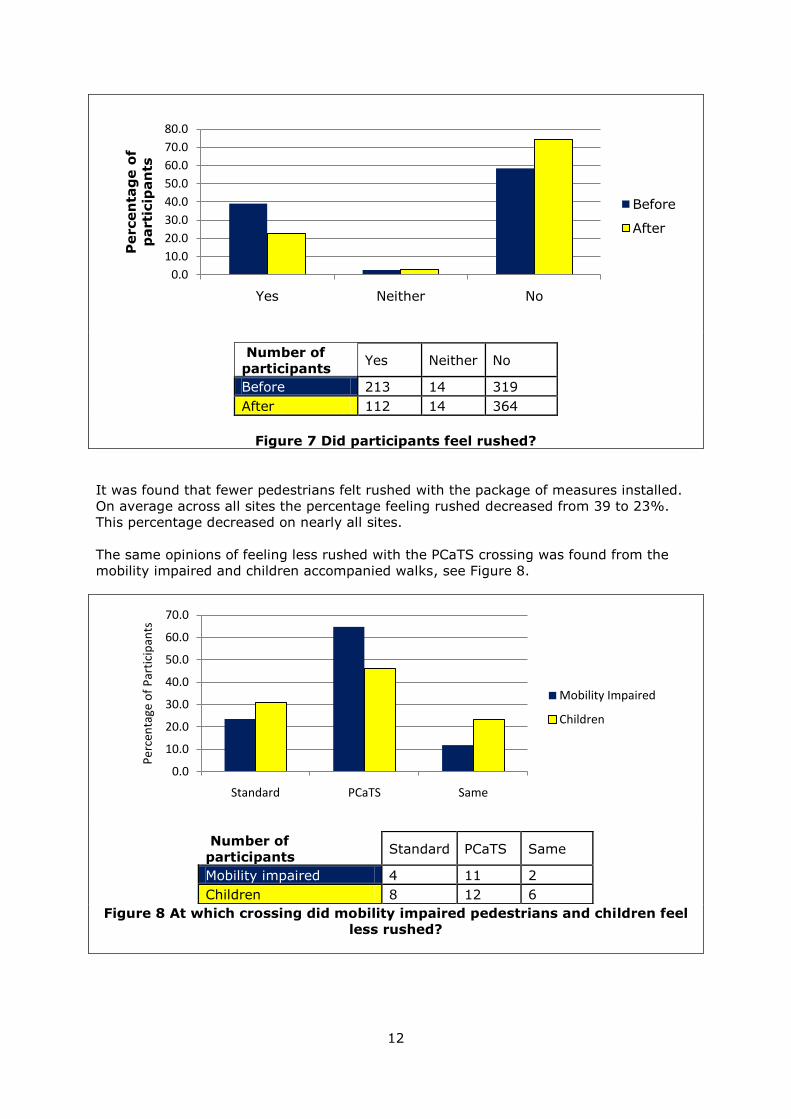
The number of participants who reported feeling rushed in the before and after situations
is summarised in Figure 7, across all sites.
12
0.0
10.0
20.0
30.0
40.0
50.0
60.0
70.0
80.0
Yes Neither No
Percen
tag
e o
f
parti
cip
an
ts
Before
After
Number of
participants Yes Neither No
Before 213 14 319
After 112 14 364
Figure 7 Did participants feel rushed?
It was found that fewer pedestrians felt rushed with the package of measures installed.
On average across all sites the percentage feeling rushed decreased from 39 to 23%.
This percentage decreased on nearly all sites.
The same opinions of feeling less rushed with the PCaTS crossing was found from the
mobility impaired and children accompanied walks, see Figure 8.
Number of
participants Standard PCaTS Same
Mobility impaired 4 11 2
Children 8 12 6
Figure 8 At which crossing did mobility impaired pedestrians and children feel
less rushed?
0.0
10.0
20.0
30.0
40.0
50.0
60.0
70.0
Standard PCaTS Same
Per
cen
tage
of
Par
tici
pan
ts
Mobility Impaired
Children

13
A similar, and highly related question was also asked, as to whether the participants felt
they had sufficient time to cross, their answers are summarised in Figure 9.
Number of
participants Yes No Don’t Know
Before 408 134 4
After 431 57 2
Figure 9 Did participants feel they had sufficient time to cross?
The mobility impaired participants were asked which type of crossing required the most
time to cross, as shown in Figure 10.
The standard
crossing Neither
The crossing with countdown
Don’t know
Number of mobility impaired
pedestrians 7 0 9 1
Figure 10 Mobility impaired participants’ assessment of the crossing requiring
most time to cross
In line with not feeling as rushed with the PCaTS package of measures, more pedestrians
(88% compared to 75%) felt they had sufficient time to cross. The percentage decreased
0.0
20.0
40.0
60.0
80.0
100.0
Yes No Don‟t Know
Perc
enta
ge o
f
Part
icip
ants
Before
After
0.0
10.0
20.0
30.0
40.0
50.0
60.0
The standard
crossing
Neither The crossing
with Countdown
Don't know
Perc
enta
ge o
f part
icip
ants

14
slightly on one site (Finsbury) from 83% to 78%, but increased on all other sites by at
least 4%, with the maximum increase being on Balham from 69% to 97%.
3.2.1 Ability to judge crossing time
Perception of time is not the same as the ability to assess the time correctly. Many
external factors can influence a person to mistake the actual time taken. Participants
were asked to state the time it had taken them to cross the road, as were the mobility
impaired participants in the accompanied walks. Their answers are summarised in Figure
11.
Number of participants
0-5
secs
5-10
secs
10-15
secs
15-20
secs
20-30
secs
Don't
know
Before 185 245 60 29 18 9
After 211 201 29 12 14 23
Figure 11 Participants assessment of their time to cross the road
It is highly unlikely that pedestrians actually crossed in 5 seconds or less, as this implies
that they walked extremely fast or ran across the road: as 4 seconds to cross 14 metres
implies a speed of 8 mph. Therefore, those stating that time are likely to have misjudged
the time taken.
While more pedestrians stated that they had enough time to cross with countdown,
pedestrians‟ ability to judge their actual crossing times appeared to have reduced with
PCaTS at some sites, with an increase from 34 to 43% stating it took them at most 5
seconds to cross, and an increase in the number of „Don‟t know‟ responses. This
qualitative use of the countdown display is discussed further in section 8.
3.3 Perception of Safety
Participants in the questionnaire survey were asked how safe they had felt just after
using the crossing, see Figure 12.
0.05.0
10.015.020.025.030.035.040.045.050.0
0-5 secs 5-10
secs
10-15
secs
15-20
secs
20-30
secs
Don't
know
Perc
enta
ge o
f part
icip
ants
Before
After

15
91%
2%7%
After Safe
Neither
Unsafe
73%
8%
19%
BeforeSafe
Neither
Unsafe
29%
71%
Mobility ImpairedStandardPCaTS
15%
77%
8%
ChildrenStandardPCaTSSame
Number of participants
Safe Neither Unsafe
Before 397 45 104
After 446 11 33
Figure 12 Whether the pedestrians felt safe when crossing
The mobility impaired pedestrians and child participants in the accompanied walks were
asked which crossing at which they had felt safest after using both a standard and a
PCaTS crossing a number of times, as shown in Figure 13.
Number of participants
Standard PCaTS Same
Mobility Impaired 5 12 0
Children 4 20 2
Figure 13 Type of crossing at which the mobility impaired and children felt
safest
The majority of participants felt safe at both types of crossing. However, more felt safe
at the PCaTS crossing than the standard crossing. The average percentage of
16
12%
62%
11%
15%
Before - with Blackout
37%
47%
4%
12%
After - with Countdown
There is time for me to continue and cross safelyI can continue to cross, but time is running outI should turn back or stay on the central refugeOther
participants feeling safe increased across all sites from 73 to 91%, and the increases
were statistically significant at seven of the surveyed sites. Also, 83% of children and
71% of the mobility impaired in the accompanied walks felt safer with PCaTS.
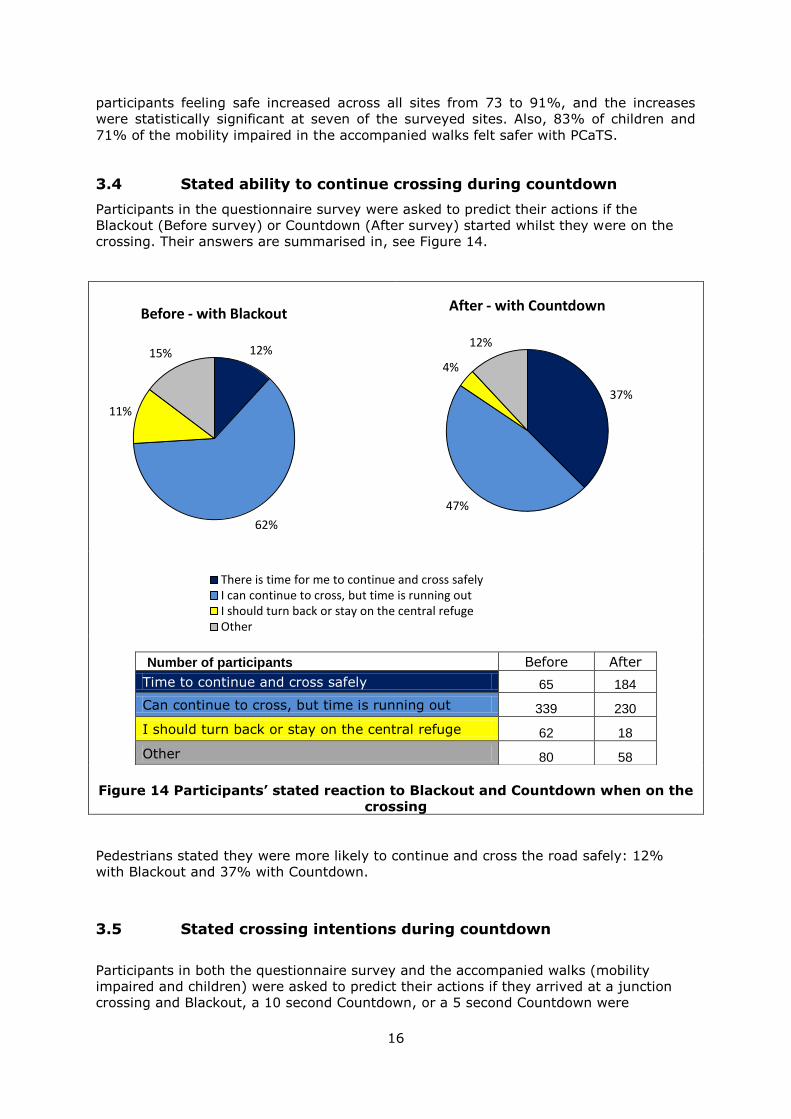
3.4 Stated ability to continue crossing during countdown
Participants in the questionnaire survey were asked to predict their actions if the
Blackout (Before survey) or Countdown (After survey) started whilst they were on the
crossing. Their answers are summarised in, see Figure 14.
Number of participants Before After
Time to continue and cross safely 65 184
Can continue to cross, but time is running out 339 230
I should turn back or stay on the central refuge 62 18
Other 80 58
Figure 14 Participants’ stated reaction to Blackout and Countdown when on the
crossing
Pedestrians stated they were more likely to continue and cross the road safely: 12%
with Blackout and 37% with Countdown.
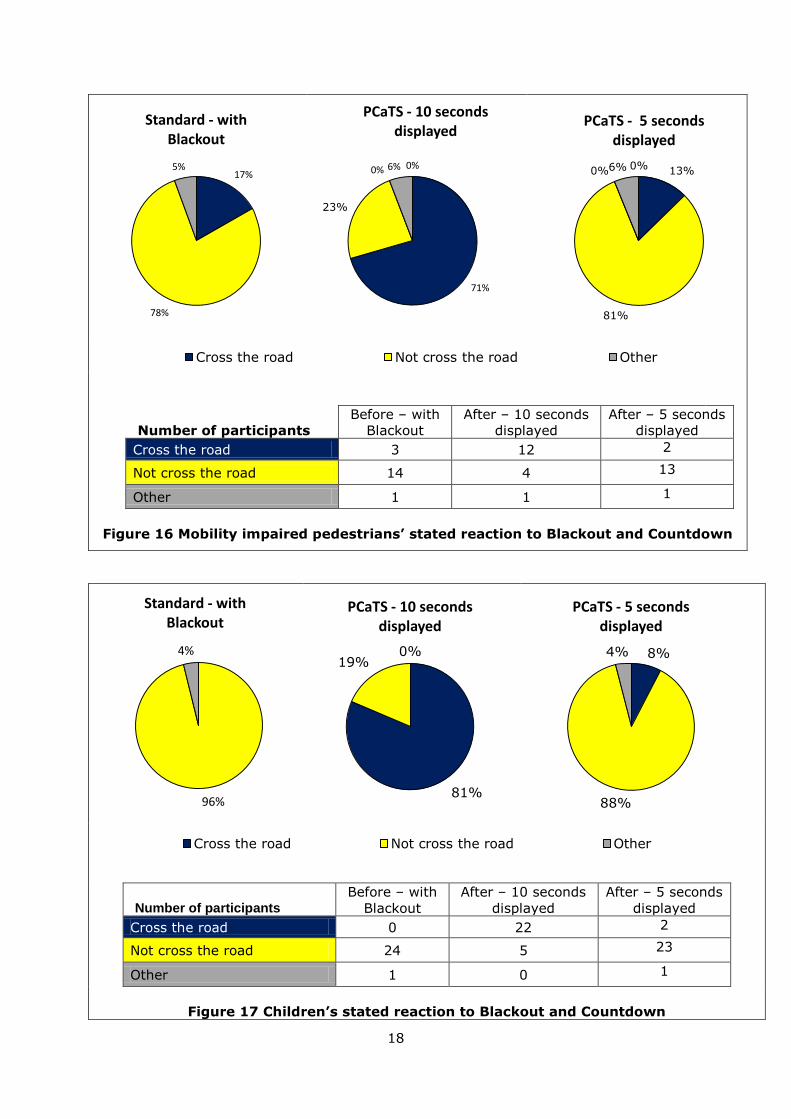
3.5 Stated crossing intentions during countdown
Participants in both the questionnaire survey and the accompanied walks (mobility
impaired and children) were asked to predict their actions if they arrived at a junction
crossing and Blackout, a 10 second Countdown, or a 5 second Countdown were

17
5%
36%
53%
1% 5%
Before -with Blackout
61%19%
17%
0%3%
After - 10 seconds displayed
9%
41%
44%
2% 4%
After - 5 seconds displayed
0500Cross the road confidently Cross the road un-confidently
Not start to cross the road Other
Don't know
displayed. This therefore provides an insight into how they might interpret such
information. Their answers are summarised in Figure 15 to
Figure 17.
Before – with
Blackout
After – 10 seconds
displayed
After – 5 seconds
displayed
Cross the road confidently 28 301 46
Cross the road unconfidently 195 91 202
Not start to cross the road 289 81 215
Other 7 1 9
Don‟t know 27 16 18
Figure 15 Participants’ stated reaction to Blackout and Countdown at 10 and 5
seconds being displayed
18
96%
4%
Standard - with Blackout
81%
19%0%
PCaTS - 10 seconds displayed
8%
88%
4%
PCaTS - 5 seconds displayed
3 14 1
Cross the roadNot cross the roadOther
020Cross the road Not cross the road Other
0%
71%
23%
0% 6%
PCaTS - 10 seconds displayed
0% 13%
81%
0%6%
PCaTS - 5 seconds displayed
17%
78%
5%
Standard - with Blackout
3 14 1
Cross the roadNot cross the roadOther
020Cross the road Not cross the road Other
Number of participants
Before – with
Blackout
After – 10 seconds
displayed
After – 5 seconds
displayed
Cross the road 3 12 2
Not cross the road 14 4 13
Other 1 1 1
Figure 16 Mobility impaired pedestrians’ stated reaction to Blackout and Countdown
Number of participants
Before – with
Blackout
After – 10 seconds
displayed
After – 5 seconds
displayed
Cross the road 0 22 2
Not cross the road 24 5 23
Other 1 0 1
Figure 17 Children’s stated reaction to Blackout and Countdown

19
A larger percentage of all interviewed groups of pedestrians stated that they were
prepared to start crossing during the early part of the Countdown phase (10 seconds
being displayed) than during the Blackout phase. This difference diminished with the
time displayed and there was no significant difference between the willingness to cross
towards to the end of the Countdown phrase (with 5 seconds being displayed) compared
to the Blackout.
This was also in agreement with the higher percentage stating that the meaning of
Countdown was that they could start to cross compared to Blackout: 72% on average
compared to 22%.

20
4 Pedestrian Observations
4.1 How long pedestrians wait to cross
Detailed observations were made of the exact time a sample of pedestrians arrived and
when they started to cross. This provided their waiting times, summarised in Figure 18.
Figure 18 Time that pedestrians started crossing after arriving (seconds)
Irrespective of the type of crossing (PCaTS or standard) the majority of pedestrians
tended to cross as soon as possible after their arrival. Over 54% crossed within 5
seconds of arriving, 70% within 15 seconds and approximately 85% within 30 seconds,
regardless of the pedestrian signals displayed.
4.2 Pedestrian delay
This study used „first person wait time‟ as a consistent measure of how the PCaTS
Package impacted pedestrian waiting times, compared to the before situation. „First
person wait time‟ is calculated by observing individual pedestrians approaching the
crossing from the start of the Red Man, and recording the time at which the first person
stopped and waited. The time then remaining to the next Green Man is then calculated
for each and the average value for the observed sample provides a measure of the
maximum pedestrian delay likely to be experienced.
The average values of these times are summarised in Figure 19.
0%
10%
20%
30%
40%
50%
60%
70%
80%
90%
100%
0 5 10 15 20 25 30 35 40 45 50 55 60 65 70 75 80
Cum
ula
tive D
istr
ibution
[Deta
iled S
am
ple
]
Time that pedestrian started crossing after arriving (secs)
Before
After

21
Before
Wait time
(seconds)
After
Wait time
(seconds)
01/212 (Oxford Street) 72.0 63.3
02/045 (Kingsway) 65.9 68.5
03/029 (Finsbury) 50.1 58.2
08/028 (Blackfriars) 50.4 49.6
10/008 (Balham) 49.7 47.6
08/003 (Tower Br) 48.6 55.7
08/211 (Old Kent Rd) 40.2 39.0
10/160 (Roehampton) 45.6 44.3
Figure 19 Average pedestrian delay
Delay changes experienced by pedestrians, measured as „first person wait times‟ initially
appear variable. At four of the sites the changes were too small to be statistically
different. At the four sites where statistically significant changes in delay did occur, the
delay had increased at three of these sites and reduced at one. The largest increase in
delay was 9 seconds at Finsbury, the site that experienced the largest change in
pedestrian green time.
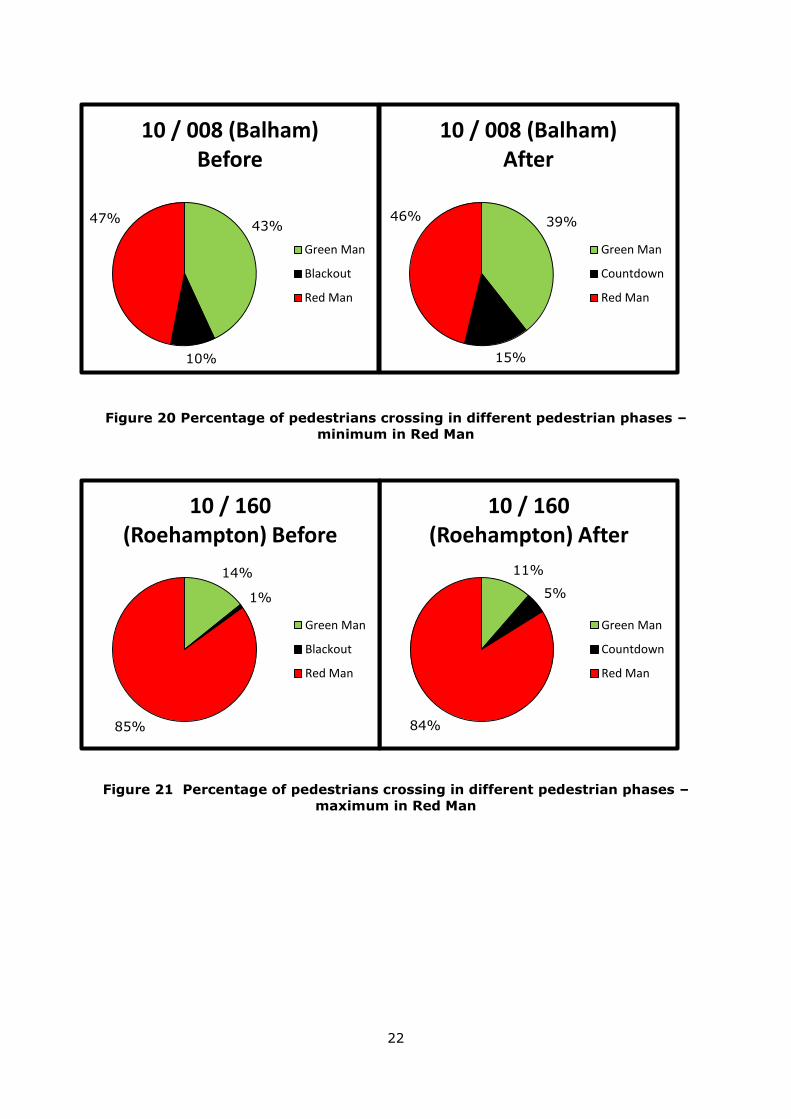
4.3 When pedestrians start to cross
The number of pedestrians crossing in each phase of the signals (Green Man,
Blackout/Countdown and Red Man) was recorded. This information is displayed for the
two sites with the minimum and maximum percentage of pedestrians crossing in the Red
man, see Figure 20, Figure 21 and Figure 22 below.
01020304050607080
01/2
12 (
Oxfo
rd
Str
eet)
02/0
45
(Kin
gsw
ay)
03/0
29
(Fin
sbury
)
08/0
28
(Bla
ckfr
iars
)
10/0
08 (
Balh
am
)
08/0
03 (
Tow
er
Br)
08/2
11 (
Old
Kent
Rd)
10/1
60
(Roeham
pto
n)
Avera
ge w
ait t
ime for
firs
t
pers
on t
o a
rriv
e a
t cro
ssin
g
(secs)
Before
After
22
39%
15%
46%
10 / 008 (Balham) After
Green Man
Countdown
Red Man
43%
10%
47%
10 / 008 (Balham) Before
Green Man
Blackout
Red Man
11%
5%
84%
10 / 160 (Roehampton) After
Green Man
Countdown
Red Man
14%
1%
85%
10 / 160 (Roehampton) Before
Green Man
Blackout
Red Man
Figure 20 Percentage of pedestrians crossing in different pedestrian phases –
minimum in Red Man
Figure 21 Percentage of pedestrians crossing in different pedestrian phases –
maximum in Red Man

23
28%
11%61%
Average Before
Green Man
Blackout
Red Man
22%
16%62%
Average After
Green Man
Countdown
Red Man
Figure 22 Percentage of pedestrians crossing in different pedestrian phases –
maximum in Red Man
A large percentage of pedestrians started to cross whilst the Red Man was showing:
between 46 and 85%. The average across all sites and surveys was 68% of pedestrians
crossing in the Red Man. Table 2 provides both the percentage of pedestrians crossing in
the Red Man and the percentage of the pedestrian cycle when the Red Man was
displayed.
Site Percentage of Red Man Time
Percentage of Pedestrians
Crossing in Red Man
Before After Difference Before After Difference
01/212 (Oxford St.) 82.2% 78.6% -3.6% 62.2% 68.5% 6.3%
02/045 (Kingsway) 81.3% 80.3% -1.0% 54.7% 49.8% -4.9%
03/029 (Finsbury) 77.2% 81.6% 4.4% 69.2% 72.2% 3.0%
08/028 (Blackfriars) 78.9% 78.3% -0.6% 73.1% 74.3% 1.1%
10/008 (Balham) 83.3% 78.8% -4.5% 46.9% 46.2% -0.8%
08/003 (Tower Br) 82.4% 83.4% 1.0% 74.9% 79.1% 4.3%
08/211 (Old Kent) 88.5% 82.6% -5.9% 70.0% 72.2% 2.2%
10/160 (Roehampton) 84.8% 83.8% -1.0% 84.9% 83.8% -1.0%
Table 2: Percentage of pedestrians crossing in the Red Man
The evidence indicates that a large percentage of pedestrians crossed in the Red Man,
consistent with it being displayed for the most time and pedestrians being unwilling to
wait at the crossing, as shown in Section 4.1: most (54%) waiting less than 5 seconds.
It will also be influenced by other site dependent factors, for example, the traffic flow,
and hence the opportunities to cross. So, on the low flow site of Roehampton, the
percentage crossing is approximately the same as the percentage of Red Man time as
pedestrians can easily find acceptable gaps in the traffic. However, the percentages
crossing in the Red Man are generally less where fewer acceptable gaps exist.
Analysis implied that when changes in pedestrian signal timings were taken into account,
PCaTS did result in an increase in the percentage of pedestrians crossing during the Red
Man of up to 6%. The reasons for this cannot be fully explained from this research. It
could be that changes in traffic flow resulted in more suitable gaps for crossing, (as
described above) although this was not evaluated in this study, or that other aspects of
the PCaTS package resulted in this change in behaviour.

24
Detailed analysis was conducted into the crossing decision of a representative sample of
pedestrians arriving at the crossing. Figure 23 shows the percentage that arrived and
chose to cross within 3 seconds at different stages in the cycle at Finsbury where the
traffic on the main road gained priority directly after pedestrians. There were a number
of distinct differences in the crossing behaviour of pedestrians between the Before and
After 2 surveys, as shown in the following figure and table.
Phase Pedestrian phase with
PCaTS
Pedestrian phase
with standard
crossing
Impact on proportion of
pedestrians starting to
cross with PCaTS
A Red Man Red Man No change
B Green Man Green Man No change
C 11 to 3 seconds showing Blackout More crossed with PCaTS
D 3 to 0 seconds showing Red Man No change
E Red Man Red Man Fewer crossed with PCaTS
F Traffic Green Traffic Green Slightly more crossed with
PCaTS (change was not
statistically significant1)
Figure 23 Pedestrians starting to cross during different phases (Finsbury)
The above example was typical of low to medium flow sites. On the highest pedestrian
flow sites PCaTS had little effect on pedestrian decisions to cross the road.
1 The difference was not statistically significant because of the relatively small change compared to
the number crossing during the short time period represented by column F.
0%
10%
20%
30%
40%
50%
60%
70%
80%
90%
100%
Perc
en
t sta
rtin
g t
o c
ross
Pedestrian/Traffic Signal Phase
Before
After
2
Pedestrian - Before
Pedestrians- After
Traffic
Pedestrian - Before
Pedestrians- After
Traffic
A B C D E F
COUNTDOWN

25
4.4 Pedestrians still on crossing near/at end of pedestrian cycle
The previous analysis examined pedestrians‟ decisions to start crossing the road.
However, as it takes a certain amount of time to complete the crossing, it is also
important to consider how many are still present on the crossing near the start of the
traffic green, which is when they could be in conflict with traffic. Therefore, additional
analysis was carried out to assess the extent to which there were pedestrians remaining
on the crossing at the end of the pedestrian phase. The Tower Bridge and Finsbury sites
were selected for this analysis because the traffic given priority immediately after
pedestrians was the main road. Therefore these two sites had the greatest potential for
conflict at the start of the green to traffic.
Analysis accounted for variations in pedestrian flows by measuring the percentage of
pedestrians using the crossing (i.e. on the footway waiting to cross, on the crossing or
on the pedestrian island) who were on the crossing, see Figure 24.
Figure 24 Pedestrians on the crossing at the end of the pedestrian phase
There were significantly more (up to 12%) pedestrians still on the crossing 6 seconds
before traffic gained priority, and this difference remained fairly constant, such that
there were up to 9% more on the crossing at the start of the traffic red/amber (i.e. at -2
seconds). However, this difference then rapidly reduced until there was no difference
between crossing types at the point when the traffic signals changed to green (i.e. at 0
seconds).
0%
10%
20%
30%
40%
50%
60%
70%
80%
90%
100%
-6 -5 -4 -3 -2 -1 0 1
Perc
enta
ge o
f Pedestr
ians o
n
the c
rossin
g
Time Before Start of Vehicle Green on Arm Surveyed (secs)
Finsbury
Before
Finsbury
After
Tower Bridge
Before
Tower Bridge
After

26
5 Walking speeds
Pedestrians‟ walking speed indicates their reactions to the information supplied and their
situation. Individual natural walking speeds vary from relatively slow speeds of
approximately 1.2 m/s (2.7 mph), which is assumed in the design guidance of crossings,
to more brisk pace of say 1.8 m/s (4.0 mph) or higher. Changes in average walking
speed on a survey site indicates whether pedestrians are more likely to take their time
crossing the road, or have increased their pace either through crossing in gaps between
vehicles, or because they perceive they have less time available. Walking speed was
measured for a random sample of pedestrians crossing throughout the cycle, using the
video recordings to identify accurate measurements for the times at which they started
and completed a crossing. The change in average walking speed before and after the
installation of the PCaTS package of measures is summarised in
Figure 25. The results shown only include those sites where the age and gender of the
observed pedestrians was similar in the two surveys, which occurred at the three sites
shown in the figure. This was necessary as on average men walk faster than women,
and walking speed is affected by age. Also, it only includes sites where statistically
significant changes occurred.
Walking speed, m/s
08/028
(Blackfriars)
08/003
(Tower Br)
10/160
(Roehampton)
Before 1.61 1.51 1.3
After 1.68 1.58 1.43
Figure 25 Pedestrian walking speeds
The statistically significant changes implied that walking speeds had increased in the
„After‟ surveys by between 3 and 10%. While this is an average speed that includes
crossing times during the Red Man, a similar percentage increase in walking speed was
observed when Red Man crossings were excluded from the average.
The average speed was calculated over the full width of the crossing2. The number of
pedestrians who were observed to speed up whilst crossing was also recorded.
2 Balham was not included in this calculation, as it was the only site without a pedestrian
island
1.20
1.25
1.30
1.35
1.40
1.45
1.50
1.55
1.60
1.65
1.70
08/028(Blackfriars)
08/003(Tower Br)
10/160(Roehampton)
Wal
kin
g sp
ee
d (
m/s
)
Before
After

27
This was based on a qualitative judgement by the analyst. It was observed that a higher
proportion of pedestrians sped up during the Countdown phase in comparison with
Blackout; and that a greater proportion of those that sped up during the Countdown did
so in the second half of the phase, which was not the case during the Blackout phase.
The measured differences were as follows:
With the Standard crossing, 14% of pedestrians who sped up, did so during the
Blackout: 7% did so in the first half of the Blackout and 7% in the second half.
With PCaTS, 33% of the pedestrians who sped up did so during the countdown: 12%
did so in the first half of the Countdown and 21% in the second half.
The average Blackout time was 7 seconds, whilst the average Countdown time was 11
seconds across the 3 sites (in Figure 25); representing a 47% increase on average. The
increase in the percentage speeding up during the countdown period was much higher
than this, particularly during the second half of the countdown. This behavioural change
cannot therefore be explained by the signal timing changes and was limited to the
Blackout/Countdown period. Observations suggested that some pedestrians used the
extra information provided by the countdown display to cross the road in the latter half
of the countdown period by speeding up.

28
6 Vehicle Observations
All charts in this section report data from the same four sites, which were the sites with
the highest pedestrian flows, chosen because these would represent the strongest test of
the impact of signal timing changes.
6.1 Vehicle Delay
Vehicle delay was measured in a similar way as pedestrian delay. Times were collected
for the first vehicle to stop after the start of the traffic red. The time each of these
vehicles arrived 15 metres before the stop line and 20 metres after the stop line was
recorded. This provided an indication of any maximum changes in delay experienced by
drivers. The average delays are summarised for the four sites with the highest
pedestrian flows in Figure 26, although similar changes were observed on the other four
sites.
Figure 26 Average vehicle delay
The first vehicle wait times reduced on six of the sites in the „After‟ surveys. As with the
pedestrian delay survey, results were dependant on flow through the site and other
factors. This resulted in vehicle delay not decreasing in line with the vehicle signal
changes at two sites. The observed changes on the remaining six sites were in line with
the reduction in vehicle red time that resulted from the signal re-timing element of the
introduced PCaTS package of measures. Across the six sites where the vehicle delay
decreased, the average delay decreased by between 2 seconds at Balham (a low flow
site) and 8 seconds at Blackfriars. Therefore, although these are maximum delay
reductions, as drivers arriving at other times in the cycle will be less affected, this
analysis implies that the signal re-timing element of the PCaTS package of measures did
result in reductions in delay for drivers.
The reductions in delay for vehicles observed in the trial conducted by TRL are consistent
with changes in total vehicle green time reported by TfL. See Table 3
0102030405060708090
01/212 (Oxford
St.)
02/045
(Kingsway)
03/029
(Finsbury)
08/028
(Blackfriars)
Fir
st
Vehic
le t
ime
thro
ugh c
rossin
g
(seconds)
Before
After

29
Extra Green Time to Traffic
(seconds per hour)
01/212 (Oxford Street) 61.4
02/045 (Kingsway) 112.5
03/029 (Finsbury) 270.5
08/028 (Blackfriars) 126.8
10/008 (Balham) 75.0
08/003 (Tower Br) 77.3
08/211 (Old Kent Rd) 76.2
10/160 (Roehampton) 40.9
The PCaTS package includes making adjustments to the timing of traffic signals,
including setting the Green Man (Invitation to Cross) period in line with DfT guidelines.
This generally results in a small reduction in the Green Man period, which can then be
re-allocated to traffic.
When averaged over a one hour period the additional green time available to traffic
ranged from just over 40 seconds at the Roehampton site, to several minutes per hour
at the Finsbury site, as detailed in the table above.
This measure is useful to understand the potential traffic benefits of the PCaTS package.
Source: TfL analysis.
Table 3: Increase in vehicle green time per hour with PCaTS
6.2 Time of first vehicle starting to move
Using the video images, the first vehicle to stop after the end of the traffic phase was
timed when crossing a number of lines at set distances from the junction. In addition,
the time it started to move forward in order to enter the junction was recorded. These
times were related to the signal phases at the junction. So, information was available on
how soon before, or after, the change to traffic green each vehicle started to move, see
Figure 27.
This information is important in understanding consequences, and explaining changes, in
conflicts at the end of the pedestrian phase (or start of the traffic phase). Conflicts can
only occur when a vehicle is moving in the same vicinity as the pedestrians.
Consequently, if traffic starts to move at a different time, then this can assist in
explaining changes in conflicts at that time.

30
Figure 27 First vehicle time to start moving after the start of traffic green
The overall indications were that with PCaTS, vehicles started to move forward slightly
earlier at the majority of sites, up to a maximum of 0.7 seconds earlier in the „After‟
surveys.
Overall, traffic appears to be starting to move slightly earlier, which means that as there
were a higher number of pedestrians deciding to cross after the All Red period, there is a
potential increase in conflicts. This is investigated in the next section and in the
discussion section consideration is given to the possibility that drivers are using the
current un-shrouded countdown display design as an indicator that they are about to be
given priority.
-1
-0.8
-0.6
-0.4
-0.2
0
0.2
0.4
0.6
0.8
1
1.2
01/212 (Oxford St.) 02/045 (Kingsway) 03/029 (Finsbury) 08/028
(Blackfriars)
Fir
st
vehic
le t
ime t
o s
tart
movin
g
rela
tive t
o g
reen (
secs)
Before
After

31
7 Interactions/Conflicts
7.1 Severity and when they occurred
A conflict occurs when two people attempt to use the same space at the same time. In
this project conflicts were recorded between pedestrians and vehicles (including cyclists)
within the vicinity of the pedestrian crossing, and were used as precursors of a collision.
That is, a collision involving pedestrians at the crossing can only occur if there was a
conflict. However, a conflict in the main occurs without a collision. Conflict analysis
therefore provides an indication of the relative safety of the crossings with and without
PCaTS.
Conflicts were classified according to severity level:
Level 1: Precautionary - for example stopping to allow the other road user to pass
Level 2: Controlled – minor deviation from initial route, or controlled braking
Level 3: Near Miss – rapid deceleration, lane change or stopping
Level 4: Very Near Miss – emergency braking or violent swerve
Level 5: Collision – actual contact between road users (none observed during trial).
Increases in conflicts of level 1 and above imply an increased level of interaction and
therefore a higher probability of a collision. However, the higher the level of conflict the
closer to an actual collision. Examples of conflicts are shown below:
Conflict Level 1. The cyclist started through the signals on green. Pedestrians were
still crossing even though the red man is displayed. The slow moving cyclist modified
their speed and course to a small degree (precautionary) to avoid a collision.

32
Conflict Level 2. The pedestrian crossed the road during the red man and was on
the crossing when the taxi started to move from the stop line. The pedestrian
adjusted his crossing speed in a controlled manner to avoid the collision.
Conflict Level 3. The pedestrian started crossing from the island during the red
man. Vehicles were initially queued. The pedestrian had to stop abruptly as vehicles
then started to move in the traffic green. Vehicle speeds were low as there were also
queuing vehicles at the other side of the junction, but the conflict represented a near
miss.

33
The number of conflicts of each level observed on the survey sites with the highest
pedestrian flows are shown in Figure 28.
Figure 28 Observed Conflicts
Conflict rates significantly decreased at Oxford Street, the busiest crossing, but there
were increases at the other sites, from 152 to 342 conflicts in total.
No actual collisions were observed during the surveys. Statistically significant changes
in conflict numbers were only observed with the lowest categories of conflict levels,
those at Levels 3 and 4 remained at very low levels. Large reductions in Level 2 conflicts
0
20
40
60
80
100
120
140
160
Before After Before After Before After Before After
01/212
(Oxford St.)
02/045
(Kingsway)
03/029
(Finsbury)
08/028
(Blackfriars)
Num
ber
of
conflic
ts
Level 1
Level 2
Level 3
Level 4
Conflict Level 4. The pedestrian started to cross during the green man period. The
silver taxi was stationary in a previously formed queue. The taxi began to move as
the queue downstream cleared. This caused the pedestrian to stop suddenly, as it
was a very near miss.

34
(controlled) were observed at the two highest flow sites (Oxford St and Kingsway), from
124 to 28 conflicts; but there were small, but still statistically significant increases at two
lower pedestrian flow sites, from 1 to 8 at Blackfriars, and 3 to 11 at Old Kent Road.
Most conflicts (over 84%) at all sites occurred during the Red Man phase. The remaining
16% occurred during the other signal phases including the All Red phase at the end of
the pedestrian phase, the traffic Red/Amber and traffic Amber phase, which would
therefore involve a degree of non-compliance by vehicles. Interactions could occur when
there are changes in priority, for example it is possible that some of these conflicts may
have been with cyclists either starting before receiving priority, or being unable to clear
the junction before pedestrians received priority.
Overall, safety appears to have improved at the highest flow site, however the
interactions between pedestrians and vehicles increased (albeit at low levels) at the
medium to low flow sites. These changes could have been the result of a higher
percentage of pedestrians deciding to cross at the start of the traffic phase, vehicles
starting to move forward earlier, or more pedestrians deciding to cross during the Red
Man.
7.2 Vehicle types
Information was collected on those involved in conflicts. This includes the type of
vehicles involved. This was separately summarised for single conflicts (one pedestrian
involved) and multiple conflicts (more than one pedestrian at the same time with the
same vehicle), see Figure 29 and Figure 30
Figure 29 Vehicles involved in single person conflicts
0%10%20%30%40%50%60%70%80%90%
100%
Before After Before After Before After Before After
01/212
(Oxford St.)
02/045
(Kingsway)
03/029
(Finsbury)
08/028
(Blackfriars)
Perc
enta
ge o
f conflic
ts
Bicycle
Motorbike
Bus/Coach
HGV
Car/Lgv

35
Figure 30 Vehicles involved in multiple person conflicts3
Most conflicts involved cars and light goods vehicles, but the proportion involving
bicycles increased in the After surveys. Furthermore, the percentage of conflicts
involving bicycles and motorcycles (on high flow sites) was greater than the percentage
of the traffic flow they represented: for example 22% to 64% of the single-person
conflicts in the „After‟ surveys involved cycles whilst they represented less than 18% of
the traffic flow at these sites. Also, 13 to 15% of all conflicts on the highest flow sites in
the „After‟ surveys involved motorcycles, whilst they represented 8 to 11% of the flow.
3 No multiple person conflicts at Level 1 or above were observed at Finsbury
0%10%20%30%40%50%60%70%80%90%
100%
Before After Before After Before After Before After
01/212
(Oxford St.)
02/045
(Kingsway)
03/029
(Finsbury)
08/028
(Blackfriars)
Perc
enta
ge o
f conflic
ts
Bicycle
Motorbike
Bus/Coach
HGV
Cars/LGV
No
t A
pp
licab
le

36
8 Discussion and Conclusions
The study used both face to face questionnaires and video data to assess how pedestrian
perceptions and behaviour, and traffic flows, were affected by the installation of the
PCaTS package. A summary of the key findings is given below. Further details on
observations made are provided in the technical annex to this report.
Pedestrian Perceptions
The Countdown display provides information to pedestrians on the time remaining to
cross before the Red Man appears, with the objective of overcoming the confusion that
has previously been identified in pedestrians‟ understanding of the Blackout phase.
The main conclusion from the attitudinal surveys is that a majority of pedestrians liked
Countdown: 83% of participants in the final „After‟ study, 94% of mobility impaired
pedestrians and 79% of children. PCaTS was preferred over standard crossings by 69%
of mobility impaired pedestrians and 56% of children, who directly experienced both
types of crossing. At all sites there was an increase in the percentage of participants
stating that they felt safe using the crossing in the After survey, this was statistically
significant at 7 out of the 8. The average increase was from 73% Before to 91% After
across all sites. Furthermore, in the separate survey of children and mobility impaired
pedestrians, 83% of children and 71% of mobility impaired stated that they felt safer
with PCaTS.
At all trial sites fewer pedestrians reported feeling rushed when crossing the road with
PCaTS despite a reduction in green man time. The greatest change was at Balham where
the proportion feeling rushed fell from 45% before to 7% in the final after survey.
Furthermore, even though green man invitation time had reduced, the percentage of
pedestrians feeling they had sufficient time to cross the road increased from an average
of 75% in the Before surveys to 88% with PCaTS. In addition, for pedestrians still on
the crossing when the Green Man phase ends, a higher percentage of pedestrians stated
they were able to continue crossing with PCaTS: the average across the survey sites
increased from 12% Before to 37% After. This demonstrates that PCaTS was able to
reduce uncertainty about being able to cross safely.
Interestingly, while more pedestrians stated that they had enough time to cross,
pedestrians‟ ability to accurately report (or measure) their actual crossing times
appeared to have reduced at some sites, despite the presence of a Countdown display.
This suggests that people are using the displays qualitatively to help make crossing
decisions but, once they have started crossing, are not using it to check their own actual
crossing times.
The responses on willingness to cross at different phases suggest that pedestrians are
interpreting the Countdown phase with PCaTS differently from the Blackout phase at
standard crossings. Thus, while across all sites only an average of 22% arriving at the
crossing during the Blackout phase considered that they could start to cross, an average
of 81% of the main sample stated they could start to cross with the Countdown
displayed. The influence on crossing decisions is illustrated by their stated willingness to
start crossing with different amounts of time displayed. A greater proportion of
respondents stated that they would start crossing during the early part of the Countdown
phase (10 seconds or more displayed) than during the Blackout, however there was no
difference in stated intention to cross with 5 seconds or less displayed. How this change
in perception was reflected in actual crossing behaviour is considered in the following
discussion of the observational studies.

37
Pedestrian crossing behaviour
Detailed analysis of the video footage was undertaken to provide an understanding of
how pedestrian behaviour changed in response to the PCaTS package, in particular the
extent to which it influenced crossing decisions, waiting time, crossing speeds and how
people use the crossing space.
Irrespective of the type of crossing (PCaTS or standard) the majority of pedestrians
tended to cross as soon as possible after arrival. Over 54% crossed within 5 seconds of
arrival with both crossing types, 70% within 15 seconds and approximately 85% within
30 seconds. Furthermore, a majority (68% in the After survey) crossed during the Red
Man, in line with what would be expected given that this is displayed for the greatest
amount of time.
Analysis implied that when changes in pedestrian signal timings were taken into account,
PCaTS did result in an increase in the percentage of pedestrians crossing during the Red
Man of up to 6%. The reasons for this cannot be fully explained from this research. It
could be that changes in traffic flow resulted in more suitable gaps for crossing, although
this was not evaluated in this study, or that other aspects of the PCaTS package resulted
in this change in behaviour.
At all but the highest pedestrian flow sites more pedestrians were observed starting to
cross during the Countdown phase with PCaTS than during the Blackout phase with
Standard crossings. However, the difference in crossing decisions between the PCaTS
and Standard crossings diminished rapidly with time at the very end of the Countdown
phase, so that by the point at which traffic is about to be given the Green phase, the
number of pedestrians starting to cross with PCaTS was the same as with the standard
crossing. These observations were consistent with the finding from the attitudinal
surveys that while more pedestrians stated they would use the crossing at the start of
the Countdown, there were no differences in their responses to the different crossing
types by the end of the Countdown phase.
In addition to observations of the time at which pedestrians started to cross, additional
analysis was carried out to assess the extent to which there were pedestrians remaining
on the crossing at the end of the pedestrian phase. This was done at the Tower Bridge
and Finsbury trial sites, where the pedestrian phase was followed by the major
conflicting traffic phase. It was found that there were significantly more pedestrians
remaining during the majority of the Countdown phase in comparison with the Standard
crossing; however the difference between PCaTS and standard crossings reduced rapidly
with time in the final seconds before vehicle green, so that there were no significant
differences between the crossing types at the point when vehicles were released. The
difference between the crossing types was 12% at 6 seconds before vehicles were given
priority, falling to 9% at 2 seconds before, and declining rapidly to 0% by the start of the
traffic vehicle.
At the highest pedestrian flow sites PCaTS had little effect on the decision to cross, with
75% of those arriving at the end of both Countdown and Blackout periods starting to
cross shortly afterwards with both types of crossing.
At four of the sites observed changes in pedestrian delay were too small to be
statistically significant. At the other four, pedestrian delay had increased at three of
these sites and reduced at one. The largest increase in delay was 9 seconds at Finsbury,
the site that experienced the greatest change in pedestrian green time.
The video analysis included a calculation of average walking speeds of pedestrians using
the crossing. Excluding sites where walking speeds had been affected by other changes,

38
and examining only the changes where there was a statistically significant difference,
walking speeds had increased by between 3 and 10% in the After surveys. An estimate
was also made of whether pedestrians changed speed while walking, to provide an
indication of whether pedestrians start to hurry up while crossing if they feel they don‟t
have enough time left to cross. This found that pedestrians did speed up to a greater
extent towards the end of the countdown, although it had no observable effect at other
times in the cycle. As noted earlier, pedestrians‟ responses to the attitudinal surveys
showed that they felt less hurried with PCaTS, suggesting that those pedestrians that are
walking faster have made a positive decision to do so, using the crossing time
information provided.
Vehicle observations
Observations were made of the first vehicle to stop each cycle and assess actual delay
time and the time within the phase at which they started to move forward. As actual
delay time was measured, on those occasions when no vehicles were queuing at the
junction then no delay time is measured and hence there can be no savings in delay. As
would be expected from the increased green time given to road traffic, average delay,
measured as first vehicle wait times, had reduced at six of the sites . The minimum
average decrease in waiting time was from 53 to 51 seconds (a reduction of 2 seconds)
and the largest was from 60 to 52 seconds at Balham (8 second reduction in delay). This
measure provides an indication of the actual maximum delay saving obtained, as other
vehicles later than the first one and therefore are delayed to a lesser extent. The
reductions in delay observed are consistent with the increase in total green time given to
vehicles.
There was some evidence that vehicles started to move forward slightly in advance of
the green phase, in particular motorcycles and cyclists. This may be because they are
able to use the Countdown displays as an indicator themselves.
Analysis of conflicts
A conflict occurs where two people attempt to use the same space at the same time.
Where a conflict occurs frequently it provides an indication of a potential risk that might,
over time, lead to actual collisions. Detailed observations were made of how the trial
schemes affected the level of conflicting behaviour. In this study conflicts were
categorised into 5 main levels of severity, ranging from „precautionary‟ ones at the
lowest level, where one road user has to give way to another, through more serious
conflicts requiring emergency braking or steering. No actual collisions were observed
during the surveys. Statistically significant changes in conflict numbers were only
observed with the lowest categories of conflict levels, those at Levels 3 and 4 remained
at very low levels. Large reductions in Level 2 conflicts (controlled) were observed at the
two highest pedestrian flow sites (Oxford St and Kingsway), from 124 to 28 conflicts;
however, they increased by a small but still statistically significant degree at two lower
flow sites, from 1 to 8 at Blackfriars, and 3 to 11 at Old Kent Road.
Overall, the absence of any increase in higher level conflict types suggests that the
PCaTS package does not introduce any serious risks to safety, which is consistent with
the observation that there are no more pedestrians on the crossing at the time when
vehicles are given priority. Site by site variations in the lower level conflicts suggest that
local factors, in particular flow rates, can have an effect on the minor conflicts, which can
be monitored and, if necessary, addressed on a scheme by scheme basis.
Considerations for future implementation
This trial has demonstrated that the PCaTS package can deliver benefits to both traffic
and pedestrians:

39
1) PCaTS has had a positive response from the public
2) PCaTS has reduced pedestrian uncertainty and more informed crossing choices are
being made
3) With the “PCaTS package” there are significant benefits to traffic
With any type of highway scheme it is necessary to take account of local circumstances,
as is done through the standard safety audit process. PCaTS is no different: this trial has
identified some changes in crossing behaviour, to be taken into consideration in future
implementation. There were indications that some vehicles, in particular motorcyclists
and cyclists, started to move forward slightly in advance of getting a green signal, which
may be linked to the increase in lower level conflicts that were observed. As all of the
trial sites implemented Countdown without a shroud at some sites it may therefore be
appropriate to shroud the countdown display, limiting visibility of the timer to road
traffic.
All sites surveyed as part of this study had “all round pedestrian” phases – a period of
time when only pedestrians have priority and all traffic is held at a red signal. The levels
of non-compliance with the pedestrian signals (the number of pedestrians crossing when
traffic has the priority) observed during this study were very high both with and without
the PCaTS package. This observed behaviour could warrant further research to
understand how junction design could be adapted to improve compliance, or better meet
pedestrian demand.
Overall, the trial has demonstrated that PCaTS is a popular measure that helps
overcome pedestrian misunderstandings about the Blackout period, and so improves the
pedestrian experience at junctions, whilst offering the opportunity to deliver benefits to
vehicle traffic.