faculty.fuqua.duke.edupecklund/wemba/... · web viewa regress “splash screen” displays briefly...
TRANSCRIPT

The Excel Regress Add-InSkill-Building
and
Quick Guide
Supporting web page:http://faculty.fuqua.duke.edu/~pecklund/WEMBA/Regress.htm

Weekend Executive MBASpring 2008

A Brief Guide to Contents
PageSkill-Building
Regress for Class................................................................................................1The Regress Software.........................................................................................1This Skill-Building Session..................................................................................2The Session Demo Files.....................................................................................2Running a Multiple Regression Using SmythPieData.xls
Step 1: Plan the Regression....................................................................2Step 2: Prepare the Data Set..................................................................2Step 3: Start the Regression....................................................................4Step 4: Identify Dependent & Independent Variables..............................4
Identifying the dependent variable...............................................5Identifying the independent variable(s)........................................5
Step 5: Start the Regression – Or – First Choose Outputs......................5Step 6: Choose Other Regression Reports.............................................6Step 7: Manage Your Regress Reports...................................................7
A Special Report: Forecast with Regress.....................................8Step 8 (Optional): Use the Regress Reports in a Word Document..........8Step 9: Interpret Regress’s Results.........................................................9Step 10: Quit Regress (or Run Another Analysis)...................................9
Practice: Running a Multiple Regression Using Calculus.xls..............................10
A Quick Guide to RegressInstalling Regress................................................................................................11Establishing a Regress-ready Data Set in Excel.................................................11Starting Regress from within Excel......................................................................12Using the Regress Interface................................................................................12Selecting Regress Outputs..................................................................................14Managing Report Outputs...................................................................................15Quitting Regress..................................................................................................15Getting Help .....................................................................................................15

Skill-Building
Regress for ClassYou’ll be asked to use Regress software to run multiple regression analyses for your Probability and Statistics class. You should be quite familiar with the mechanics of using Regress software before you reach that topic in the class. These notes to accompany our short classroom session are intended to familiarize you with the key Excel/Regress tools you need to know. That is, how to:
Establish a data set in Excel so it’s suitable for analysis with Regress Invoke Regress from within Excel Use the Regress interface Select Regress outputs Manage Regress output formats
I assume you already have Regress installed on your computer. If you need assistance with this step, contact the WEMBA technical support group at this email address: [email protected]).
The Regress SoftwareThe commercial Excel add-in named Regress is similar to but more flexible than Excel’s built-in regression tool for running multiple regression analyses. Regress can use named ranges of variables no matter where these ranges are located on a worksheet. Compared to Excel’s regression, Regress can produce a wider variety of text and graphical reports. Regress outputs are displayed in an outline type of arrangement, making them easy to expand or collapse.
Because Regress has a 256-observation maximum, if you find you need to run a regression on larger data sets, consider using Statgraphics for which Fuqua and Duke have a site license. (To download a copy of Statgraphics see this website address: http://www.oit.duke.edu/site/software/statgraphics.html)
For the complete Regress documentation — written by Regress’s author — download and print The Regress Author’s Guide from the web page that supports this session.
1

This Skill-Building SessionIn this session we’ll see how Regress works by analyzing two small sample data sets. The first is named SmythPieData.xls. The SmythPieData file contains market demand data for Mrs. Smythe’s frozen fruit pies. We’ll see how to use Regress to find out if a multiple regression analysis can assist in predicting pie sales. Detailed instructions for running this regression are included in this document.
The second sample data set is named Calculus.xls. This file contains data about high school students’ class ranking, math scores, etc. along with their performance in a first-term college calculus class. We see how to use Regress to find out if a multiple regression analysis can show whether or not these high school data are good predictors of college calculus class performance.
Our session will not cover the use of Regress outputs for data interpretation. Your instructor will cover results interpretation in your Probability and Statistics class. However, we will review the mechanics of running the multiple regression for both data sets. So we’ll see how to use Regress to run a multiple regression analysis but not interpret the results of a multiple regression analysis.
The Session Demo FilesIf you’re unfamiliar with Regress, I suggest you reproduce on your own the two practice exercises we’ll cover. Both the SmythPieData.xls and Calculus.xls files can be downloaded from http://faculty.fuqua.duke.edu/~pecklund/WEMBA/Regress.htm.
Running a Multiple Regression Using SmythPieData.xls
Step 1: Plan the RegressionThink about what you want your regression analysis to show. The SmythPieData.xls data set contains information about fruit pie sales for Mrs. Smythe’s Frozen Pies. The management team at Mrs. Smythe’s wants to know what variables affect pie sales and in particular if the number of ads the company runs is increasing their pie sales. They have available for analysis a number of items of information collected over time: quantity (quantity sold), price (Mrs. Smythe’s pie price), ads, comp_price (primary competitor’s price), income, population, and time.
In order to run a multiple regression, the Regress software will ask you to identify one dependent variable and several independent variables. In our sample data set: The Dependent variable: quantity
The Independent variables: ads, price, comp_price, income, population, and time
Step 2: Prepare the Data SetRegress doesn’t make many demands regarding the data set you plan to use for the regression analysis. However, two requirements are that
2

1) All your variables should have the same number of elements, and
2) Your variable ranges must be named.Looking at our data, we can see that all the variables have the same number of elements. That is, there’s the same amount of data available for ads as for quantity, price, etc.
However, our data is not currently in named ranges as required. Our data already has headers, however, and we can use these headers as range names.
Highlight the data and its headers and use Excel’s convenient Insert, Name, Create commands to have Excel name each column range of data using the header at the top of the column.
Provided the labels at the top of each column are in some way distinguished from the data beneath them, Excel recognizes them as headers and uses them to create range names for the data. There are a number of ways you can distinguish your data labels from your data. In our case, the labels are bolded and the data is not. You could also use color, underlining, italicizing, etc.
Check to make sure that your data ranges are properly labeled by clicking the drop-down arrow to the right of Excel’s “name box” on the formula bar.
3
Use these headers as
column range names.

Excel displays a drop-down list of workbook names. In the example to the left, each name in the displayed drop-down list is one of our data set header names.
Click any name to have Excel highlight the range associated with that name. Notice that Excel highlights the data only, not the header. The header label is used to name the range but is not part of the data range itself.
Step 3: Start the RegressionI assume you have Regress installed as an add-in to your copy of Excel. Because Regress is an add-in, start it from within the Excel environment.
Make sure the Excel workbook that contains your data set is open and that you’ve prepared your data set for Regress (i.e., the range-naming step above). Then, from the Excel menus, choose the commands Tools and then Regress.
[At this point, you may see an Excel message display asking for permission to run macros. If you encounter this message, click the “Enable Macros” button to continue.]
A Regress “splash screen” displays briefly and then the small Regress toolbar displays, floating above your Excel workspace. The Regress toolbar buttons will vary, depending on where you are in the regression analysis.
The Regress toolbar indicates that you have an active session going with Regress.
Step 4: Identify to Regress Your Dependent and Independent VariablesClick the left-most “New Model” button on the Regress toolbar to start the regression. The first thing Regress will ask you to do is to identify the dependent and independent variables you want to use in your analysis.
4

Use the instructions on this initial dialog box to select the variables you want to use in the regression. Note that Regress will display in this dialog box all the named ranges you might have in your Excel workbook. If you’ve named many ranges, but don’t plan to use all of them in your analysis, use this dialog to choose just the ones you do want to use.
Identifying the dependent variableThe single dependent variable is named at upper-right, by choosing from a drop-down list. For our SmythPieData example, we choose quantity as the dependent variable.
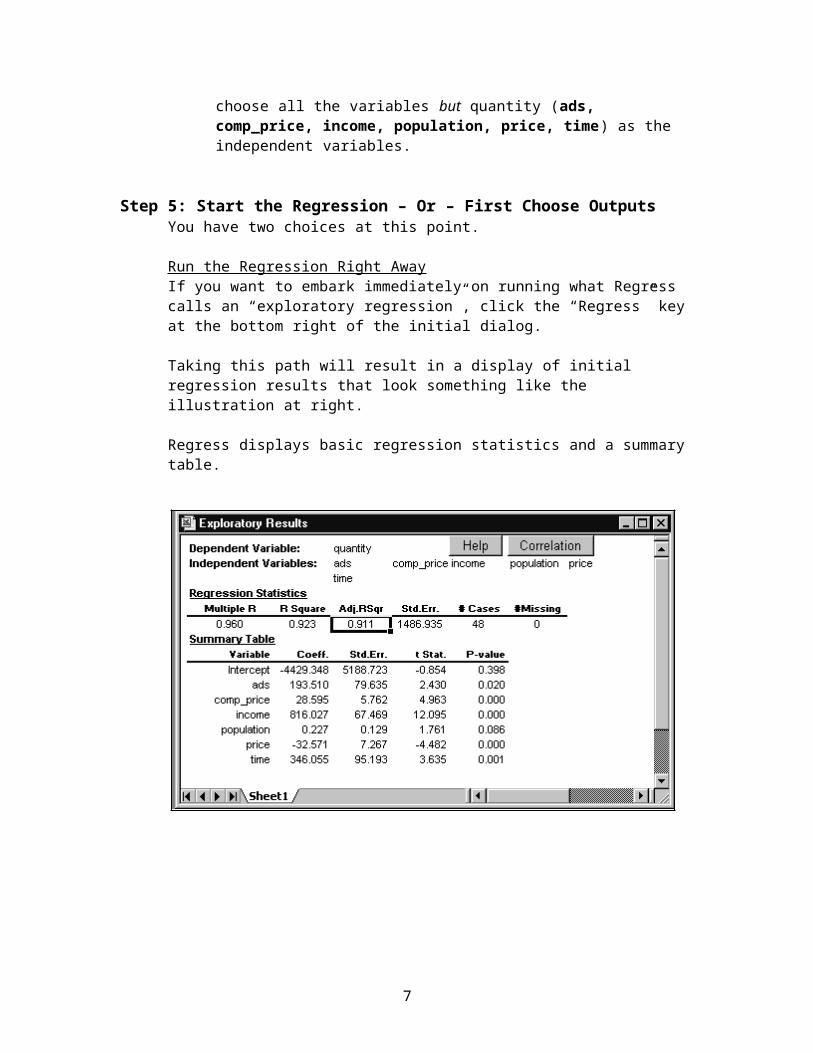
Identifying the independent variable(s)One or more independent variables are chosen from the display at left by holding down the control key and clicking each one. For our SmythPieData example, we choose all the variables but quantity (ads, comp_price, income, population, price, time) as the independent variables.
Step 5: Start the Regression – Or – First Choose OutputsYou have two choices at this point.
Run the Regression Right AwayIf you want to embark immediately on running what Regress calls an “exploratory regression”, click the “Regress” key at the bottom right of the initial dialog.
Taking this path will result in a display of initial regression results that look something like the illustration at right.
Regress displays basic regression statistics and a summary table.
5

Clicking the “Correlation” button generates a correlation matrix of results that Excel displays beneath the summary table.
These regression results are the ones most analysts commonly want to view. So clicking the “Regress” button on the initial dialog is a fine way to proceed.
Choose Options Before Running the RegressionIf you know in advance what outputs you want Regress to produce, you might alternatively want to choose the “Options” button on the initial dialog before clicking the “Regress” button. Clicking the “Options” button displays the dialog at right.
[The “Scan Data” option checks to make sure that all your variables have the same number of values and that there are no text values.]
Choose the initial reports you want. Then click “OK” to return to the main dialog where you can choose the “Regress” button to run the regression. Regress runs the regression and displays the outputs you selected in the “Display Options” dialog.
Step 6: Choose Other Regression ReportsRegress has a large number of other reports to choose from. To see the available selection, click the middle “Create Report” button that now displays on the floating Regress toolbar.
The “Regression Results” dialog opens and provides you with many report choices.
Click the check box to the left of any report you want to see. (The “Descriptive Statistics” selection displays another, sub-level selection box to further refine your selections.)
6

Step 7: Manage Your Regress ReportsBecause you can choose from so many different results reports, Regress displays the reports it generates in a special outline-style format on a new worksheet tab that it inserts in your Excel workbook. This outline-style format permits you to easily “show” or “hide” any or all of the reports you’ve selected using the “plus” and “minus” icons located in the left-hand margin to the left of the report title.
If you select a large number of reports and your data set is large, it may take Regress a few moments to generate all the reports you’ve requested.
At left is a view of almost all of the possible Regress reports, but in their “hidden” mode. The “plus” icon to the left of each report name works like the plus icon in Windows Explorer.
Click a plus icon toggle it to a “minus” icon and expand the associated report so you can see it in full.
At right is a view of the same reports but with the “Correlation Matrix” report expanded. Notice that this report’s “plus” icon has turned into a “minus”. The entire report displays.
7
A Special Report: Forecast with RegressThe last report option in the right-hand “Advanced Options” column of the “Regression Results” dialog is for “Forecast with Regression”. If you select this option, Regress requires that you supply it with some additional data.
To facilitate your providing this data, Regress displays a special dialog named “Forecasting”, like the one illustrated above. Click the “Help” button on this dialog for more information about how to provide the data Regress needs to generate this report.
Optional Step 8: Use the Regress Reports in a Word DocumentYou may find that you want to include one or more of the Regress reports you’ve generated in a Word (or other) document.
If the report is a text report…Expand (show) the report, highlight the report range, depress the shift key, and choose Edit, Copy Picture, As Shown on Screen from the Excel menus and dialog box that appear. Then in Word, position the insertion point where you want the report and choose Edit, Paste Cells. Word pastes the text report into the document as a graphic, making it easy to move and size.
8
Correlation MatrixVariable ads comp_price income population price quantity time
ads 1.000comp_price 0.056 1.000
income 0.561 0.099 1.000population 0.223 0.012 0.435 1.000
price -0.354 -0.084 -0.079 -0.079 1.000quantity 0.650 0.317 0.877 0.449 -0.325 1.000
time 0.058 0.018 0.124 0.043 0.112 0.239 1.000

9

If the report is a graphical report…Expand (show) the report, click the report to select it, and choose Edit, Copy from Excel’s menus. In Word, position the insertion point where you want the report to appear and choose Edit, Paste from Word’s menus.
Step 9: Interpret Regress’s ResultsA critical step, but one not covered in these notes. Look forward to a thorough discussion of regression in your Probability and Statistics class.
Step 10: Quit Regress (or Run another Analysis)
When you have an analysis underway, the Regress toolbar looks different from how it looked when you first started the program. If you click the right-hand “End Current Analysis” button, the toolbar reverts to its original look and the hand icon becomes a “Q”.
To initiate another analysis, click the “New Model” button at the left hand side of the toolbar.
Click the “Q” button to quit Regress. This removes Regress from your current Excel session. It does not de-install Regress. After you click the “Q” button, Regress will still be available to you from the Excel Tools menu if you want to run another analysis.
10
Line Fit P lot
10000
15000
20000
25000
30000
35000
40000
0 10 20 30 40 50 60Case #
ActualP redicted

Practice: Running a Multiple Regression Using Calculus.xls
If you’re new to Regress, the best way to become comfortable with it is to use it. I suggest you repeat the detailed steps outlined above for running a multiple regression analysis using the SmythePieData.xls data set. Then for more practice, run a regression using the Calculus.xls data set as well. I won’t detail the regression steps for Calculus but I’ll provide a few notes below.
The Calculus file contains data collected about a small set of students during their end of their time in high school and the first part of their college careers. The data includes information about various test scores, the students’ gender, their high school rank, etc. as well as how well they did in a first-year college calculus course. Practice using Regress to run a regression on this data to see whether or not information about these students’ high school performance can predict how they’ll do in their college calculus class.
Tips:1. As we did with the SmythePieData data set, you must name the data ranges
you plan to use for your regression.
2. You can’t run a regression on text data. The data you use in your analysis must all be numeric. Notice that the Calculus.xls data set contains two columns of data to indicate gender. One is alphabetic (F or M) and the other substitutes numeric codes (0 or 1). In your regression analysis, ignore the “Gender Code” column of data and use the “Gender” column instead. You can move or delete the “Gender Code” column if you like. However, unlike Excel’s built-in regression requirement that all the data must be contiguous, Regress does not require contiguous data. So you can also safely just ignore the “Gender” column when you run your Regress analysis.
3. In this analysis, “Term 1 Calculus Grade” will be your dependent variable.
When you begin using Regress for class, see the quick guide to Regress that follows to remind you about how to use the software.
11

A Quick Guide to Regress
Installing Regress
Download Regress to your home or office PC using instructions from your CEBE support staff. Also download the appropriate installation instructions when you download Regress. Regress is an Excel “add-in”, meaning that it runs from inside Excel. Two versions are available: One for Excel 2000 and one for Excel 2003. Be sure to install the Regress version that matches your version of Excel. To confirm your Excel version, open Excel and click Help and then About MS Excel. If you need assistance installing Regress, contact the WEMBA Technical Support group at the email id [email protected].
Establishing a Regress-ready Data Set in Excel
Before you start Regress to run a multiple regression, there is one preparatory step you must take. Regress requires that your Excel data be arranged in named ranges. If you think of your Excel data in its row and column orientation, a named range is usually simply a column of the data with a name assigned to the column. Naming each of your columns of data allows Regress to then use these column names in its analyses.
There are several ways to name data ranges in Excel. Assuming your data is arranged in columns (so each row of data constitutes a record), the easiest method is this one:
1) If your data does not already have header names, add a header row and provide a name for each column of data.
2) Select the headers and the data beneath them.
3) Choose the Excel commands Insert and then Name, Create. In the “Create Names” dialog that appears, Create names in Top row should be checked. If not, select it and click OK. Excel names each column using the header label above it. You now have a “named range” for each column of data.
12
Troubleshooting Tip: Don’t make the mistake of including a column header as part of the named range. For convenience, you may certainly use the contents of the column header cell as the name of the named data range. But if your named range includes a text label or a numeric entry that’s not really part of your data, Regress will either not run or will return incorrect results.

4) Test to make sure the range name operation has worked properly by clicking the drop-down arrow to the right of Excel’s “name box” in the formula bar and selecting any range name in the drop-down list. Excel should then highlight whatever range name you select.
Click the drop-down arrow to the right of Excel’s name box to see a list of current range names in the workbook. Click any name to have Excel highlight that named range.
Now your Excel data set is ready for Regress.
starting Regress from within Excel
Since Excel is a Regress add-in, once you’ve installed Regress the command to start Regress becomes part of the Excel menu system. To start Regress, click the Excel Tools command. Then from the drop-down menu that appears, choose Regress.
Using the Regress Interface
When the Regress add-in is loaded into your copy of Excel, a small Regress toolbar floats on top of your Excel workspace and looks like the illustration below.
13

There are three buttons on this toolbar. Use the left-hand “New Model” button to start a new regression analysis. The center blank button is currently unused. Use the right-hand “Quit Regress” button to remove Regress from your current Excel session. (When you’re through working on your regression analyses, use this Q button to remove Regress from Excel and from your computer’s memory. This does not de-install Regress; Regress will still be available from the Excel Tools menu the next time you run Excel.)
The first thing Regress will ask you to do is to identify your dependent and independent variables. Notice that Regress uses your data’s range names.
The illustration at right shows the named ranges from the SmythSmythPieData.xls workbook. The dependent variable in this data set is quantity. All the other variables in the data set are designated as independent variables.
(The instructions in the dialog box remind you how to select the dependent and independent variables.)
You now have two choices:
1) Start the regression right away by clicking the Regress button.
2) Choose the outputs you want to see before running the regression by clicking the Options button.
A Note: While you’re using Regress, the Regress toolbar changes its aspect to reflect that an analysis is underway. During an analysis, the left-hand button becomes the “New Model” button, the middle (formerly unused) button becomes “Create Report”, and the right hand button becomes “End current analysis”. If you choose the “End current analysis” button, the “Q” or quit button appears. Use the quit button to end Regress.
If you chose to run the regression directly (by clicking the “Regress” button on the main dialog), Regress runs the regression. Regress for Excel 97 then displays the “Regression Results” dialog. Regress for Excel 2000 displays standard reports and waits for you to click the middle “Create report” button to see other report options.
14

If instead of running the regression immediately you chose instead to select your reports before running the regression, the “Display Options” dialog opens. Select any or all of the three reports from this dialog. Then click “OK” to return to the main dialog where you can click the “Regress” button to run the regression.
15

Selecting Regress Outputs
Select the regression outputs you want to generate by using the “Regression Results” dialog box. Click the check-box to the left of any report you want Regress to generate for you from your data.
Notice that some of the selections you make on this main dialog may lead you to other, sub-level dialog boxes. For example, if you ask for “Descriptive Statistics” on the main dialog, Regress immediately shows you a “Descriptive Statistics” sub-level dialog, to let you choose which descriptive statistics you want it to generate. Make your choices from this dialog and click the OK button to return to the top-level report dialog.
Also notice that one set of outputs on the top-level dialog are related: Only by selecting the “Predicted and Residual Matrix” can you get the option to select “Leverage Values”. If you don’t select “Predicted and Residual Matrix”, then “Leverage Values” is grayed out.
Once you’ve selected what you want from the top-level reports dialog, click the OK button.
16
The “Regression Results” dialog available after running the regression.
Use this dialog to select the regression reports you want to

Managing Report Outputs
Regress creates the reports you request and locates them on a new tab in the current Excel workbook. It displays the reports in an outline-style format so it’s easy to “show” or “hide” any report using the “plus” and “minus” icons in the left-hand margin.
Quitting Regress
On the floating Regress toolbar, click the right-hand “End current analysis” button (the button with the hand).
When you click the “End current analysis” button, the button turns into a “Q” or quit button. Click the quitbutton to remove Regress from your current Excelsession.
Getting Help
Regress has some online help available. Look for the “Help” button that appears on some of the Regress dialog boxes. For questions about installation, contact the WEMBA technical support center at the email [email protected]. For complete information about Regress, download The Regress Author’s Guide from this support web page: http://faculty.fuqua.duke.edu/~pecklund/WEMBA/Regress.htm
17