drying results of k-basin fuel element 6603m (run 5) cold vacuum drying (cvd) at ~50 °c under...
TRANSCRIPT

PNNL-11841UC-602
Drying Results of K-Basin FuelElement 6603M (Run 5)
G. S. Klinger L. R. GreenwoodB. M. Oliver P. J. MacFarlanS. C. Marschman G. A. RitterJ. Abrefah
September 1999
Prepared for the U.S. Department of Energyunder Contract DE-AC06-76RLO 1830
DISCLAIMER
This report was prepared as an account of work sponsored by an agency of theUnited States Government. Reference herein to any specific commercial product,process, or service by trade name, trademark, manufacturer, or otherwise does notnecessarily constitute or imply its endorsement, recommendation, or favoring by theUnited States Government or any agency thereof, or Battelle Memorial Institute.
PACIFIC NORTHWEST NATIONAL LABORATORYoperated byBATTELLE
for theUNITED STATES DEPARTMENT OF ENERGY
under Contract DE-AC06-76RLO 1830
Printed in the United States of America
Available to DOE and DOE contractors from theOffice of Scientific and Technical Information, P.O. Box 62, Oak Ridge, TN 37831;
prices available from (615) 576-8401.
Available to the public from the National Technical Information Service,U.S. Department of Commerce, 5285 Port Royal Rd., Springfield, VA 22161
This document was printed on recycled paper.

PNNL-11841UC-602
Drying Results of K-Basin FuelElement 6603M (Run 5)
G. S. Klinger L. R. GreenwoodB. M. Oliver P. J. MacFarlanS. C. Marschman G. A. RitterJ. Abrefah
September 1999
Prepared forthe U.S. Department of Energyunder Contract DE-AC06-76RLO 1830
Pacific Northwest National LaboratoryRichland, Washington 99352

iii
Summary
An N-Reactor outer fuel element which had been stored under water in the Hanford 100 Area K-Westbasin was subjected to a combination of low- and high-temperature vacuum drying treatments. Thesestudies are part of a series of tests being conducted by Pacific Northwest National Laboratory on thedrying behavior of spent nuclear fuel elements removed from both the K-West and K-East Basins. Thisreport describes the fuel element, the test methodology, and the testing results.
The drying test series was designed to test fuel elements that ranged from intact to severely damaged.The fuel element discussed in this report was removed from K-West canister 6603M in 1996. Theelement has remained in wet storage in the 327 Postirradiation Testing Laboratory (PTL) since that time.This fuel element had a separated bottom end cap with extensive corrosion on one end. There were spiralcracks at one end causing the breach at that end to open. Small shards of fuel were loosely containedinside the damaged end. While one end was severely damaged, this element had less damage along thelength than those tested in Runs 4, 6, 7, and 8.
The drying test was conducted in the Whole Element Furnace Testing System located in G-cell withinthe PTL. This test system is composed of three basic systems: the in-cell furnace equipment, the systemgas-loop, and the analytical instrument package. The element was subjected to the generalized InterimProcess Strategy drying processes which included a hot drying step. The test cycles included:
• Cold Vacuum Drying (CVD) at ~50°C under vacuum (~16 hr)
• Pressure Rise Tests at ~50°C (~1 hr)
• Hot Vacuum Drying (HVD) for a total of ~68 hr (~25 hr at ~80°C, ~33 hr at ~80°C to ~400°C, and~10 hr at ~400°C)
• System Cooldown to ~50°C (~52 hr)
• Post-Test Pressure Rise Test at ~50°C (~1 hr).
The purpose of the CVD portion of the test was to determine if CVD is successful in removing themajority of the free water from the system in a reasonable length of time. Approximately 4 ml of waterwere observed in the condenser during the pumpdown phase of CVD (collected in the condenser), inreasonable agreement with that calculated from the water release data over the same time period. Anadditional ~0.4 mg of water was removed during the post-CVD pressure rise test. This release is likelyfrom free water that was trapped and not completely released during CVD. Comparison of the totalpressure and moisture pressure rise from the post-CVD and post-HVD pressure rise tests suggests thatother sources of gas are responsible for some of the total pressure rise observed in the post-CVD test.

iv
During the first segment of HVD, ~0.9 g of water was removed at temperatures below 80°C. Thesecond phase of HVD released ~0.4 g of water with a single broad peak at ~138°C. The single broadpeak in the moisture release during this phase indicates water release from chemisorbed sites (i.e.,hydrated species) at higher temperatures. Unlike Run 3 (and similar to Run 4), thermal decomposition ofthe hydrated species was not the most significant factor in controlling the removal of water from thesystem during the HVD. The final phase of HVD at 400°C released ~30 mg of water, with an additional~21 mg of water released during post-HVD cooldown.
The water released after the post-CVD pressure rise test is attributed chiefly to release from regionsbeneath the cladding and from under the corroded regions. Decomposition of metal oxy-hydrates mayalso account for some of the release. This fuel element appeared to have a light coating on the claddingwhich changed color during the test. Water released from the element from isolated regions may be thecontrolling factor in post-CVD water removal. As observed in previous drying tests, a temperature above400°C may be required for complete drying of the fuel element within a reasonable period of time.
Hydrogen data was obtained from the gas chromatograph during HVD when argon was flowingthrough the system. Approximately 66 Torr·l (7 mg) of hydrogen were released during HVD-1.Hydrogen release during HVD-2 occurred in four major peaks (~127°C, ~159°C, ~253°C, and ~332°C),the first of which roughly (~14 Torr·l, or 1.5 mg) corresponded to a similar water release. The molarquantity of hydrogen released is greater than the water release, which suggests that the water released isquickly reacting with the fuel to produce hydrogen. Fission gases measured during this release supportthis hypothesis. A broad hydrogen release peak (~168 Torr·l, or 18 mg) at ~167°C is attributed tooxidation of uranium by water vapor, which shows a small increase with time. The next sharp hydrogenrelease peak (~61 Torr·l) at ~253°C is attributed to uranium hydride decomposition. The largesthydrogen release peak (~376 Torr·l, or 41 mg) was a broad peak centered at ~332°C and is attributed tooxidation of uranium metal, possibly from an additional rupture in the cladding, exposing additionaluranium surfaces, which may have occurred during the temperature ramp. Above ~400°C, the level ofhydrogen decreased with time, with ~58 Torr·l (6 mg) of hydrogen released during HVD-3. Totalhydrogen release during HVD was ~770 Torr·l (83 mg).

v
Quality Assurance
This work was conducted under the Quality Assurance Program, Pacific Northwest NationalLaboratory (PNNL) SNF-70-001, SNF Quality Assurance Program, as implemented by the PNNL SNFCharacterization Project Operations Manual. This QA program has been evaluated and determined toeffectively implement the requirements of DOE/RW-0333P, Quality Assurance Requirements andDescription (QARD). Compliance with the QARD is mandatory for projects that generate data used tosupport the development of a permanent High-Level Nuclear Waste repository. Further, the U.S.Department of Energy has determined that the testing activities which generated the results documentedin this report shall comply with the QARD. Supporting records for the data in this report are located inthe permanent PNNL SNF Characterization Project records, Furnace Testing of SNF Fuel Element6603M.

vii
Contents
Summary ...................................................................................................................................... iii
Quality Assurance......................................................................................................................... v
Acronyms..................................................................................................................................... xiii
1.0 Introduction ........................................................................................................................... 1.1
2.0 Whole Element Furnace Testing System ................................................................................ 2.1
2.1 Major Systems Overview ................................................................................................ 2.1
2.2 Vacuum Pumping System................................................................................................ 2.4
2.2.1 Varian Scroll Pump................................................................................................ 2.4
2.2.2 Water Condenser ................................................................................................... 2.4
2.2.3 Piping, Valves, and Filters ..................................................................................... 2.5
2.2.4 System Line Heaters .............................................................................................. 2.5
2.3 Process Heating System................................................................................................... 2.5
2.4 Gas Supply/Distribution System...................................................................................... 2.7
2.5 Gas Analysis Instrumentation.......................................................................................... 2.8
2.5.1 Balzers Omnistar Mass Spectrometer..................................................................... 2.8
2.5.2 MTI M200 Gas Chromatograph............................................................................. 2.8
2.6 Process Instrumentation................................................................................................... 2.9
2.6.1 Panametrics Moisture Monitor ............................................................................... 2.9
2.6.2 MKS Baratron Pressure Transducers...................................................................... 2.10
2.6.3 Cole-Parmer Pressure Transducers......................................................................... 2.11
2.6.4 Thermocouples ...................................................................................................... 2.11
vii

viii
2.7 Data Acquisition and Control System .............................................................................. 2.11
3.0 Vacuum Drying Testing of Element 6603M ........................................................................... 3.1
3.1 Fuel Element Transfer and Loading................................................................................. 3.1
3.1.1 Pre-Test Visual Inspection ..................................................................................... 3.1
3.1.2 Fuel Element Rinsing............................................................................................. 3.1
3.2 Fuel Element Drying ....................................................................................................... 3.1
3.2.1 Cold Vacuum Drying............................................................................................. 3.3
3.2.2 Pressure Rise Test.................................................................................................. 3.4
3.2.3 Hot Vacuum Drying, Step 1................................................................................... 3.4
3.2.4 Hot Vacuum Drying, Step 2................................................................................... 3.4
3.2.5 Hot Vacuum Drying, Step 3................................................................................... 3.5
3.2.6 System Cooldown and Post-Test Pressure Rise Test............................................... 3.5
3.3 Calculation of Water and Hydrogen Inventories............................................................... 3.5
4.0 Visual Examinations of Element 6603M ................................................................................ 4.1
4.1 Pre-Test Visual Examination ........................................................................................... 4.1
4.2 Post-Test Visual Examination.......................................................................................... 4.2
5.0 Experimental Results ............................................................................................................. 5.1
5.1 Cold Vacuum Drying ...................................................................................................... 5.1
5.2 Pressure Rise Tests.......................................................................................................... 5.3
5.3 Hot Vacuum Drying........................................................................................................ 5.6
5.4 Gas Chromatograph Measurements ................................................................................. 5.8
5.5 Mass Spectrometer Measurements................................................................................... 5.12
5.5.1 Fission Gas Releases.............................................................................................. 5.13

ix
5.5.2 ORIGEN2 Calculations ......................................................................................... 5.13
6.0 Discussion ............................................................................................................................. 6.1
7.0 References ............................................................................................................................. 7.1
8.0 Supporting Documents and Related Reports........................................................................... 8.1

xi
Figures
2.1 Fuel Element Drying System Components (in-cell) ............................................................... 2.2
2.2 Fuel Element Drying System Components (ex-cell) .............................................................. 2.3
2.3 Generalized View of Test System.......................................................................................... 2.6
4.1 Two Pre-test Views of the Damaged End of Fuel Element 6603M......................................... 4.1
4.2 Pre-test (left) and Post-test (right) Views of the Intact End of Element 6603M ...................... 4.2
4.3 Pre-test (left) and Post-test (right) Views of the Damaged End .............................................. 4.3
4.4 Pre- and Post-test View of a Portion of the Side of Element 6603M ...................................... 4.4
5.1 Drying of SNF Element 6603M, Summary Plot..................................................................... 5.2
5.2 Drying of SNF Element 6603M, Cold Vacuum Drying ......................................................... 5.4
5.3 Drying of SNF Element 6603M, Post-CVD Pressure Rise Test ............................................. 5.5
5.4 Drying of SNF Element 6603M, Hot Vacuum Drying – Step 1.............................................. 5.7
5.5 Drying of SNF Element 6603M, Hot Vacuum Drying – Step 2.............................................. 5.9
5.6 Drying of SNF Element 6603M, Hot Vacuum Drying – Step 3.............................................. 5.10
5.7 Drying of SNF Element 6603M, Hydrogen Release During HVD and Cooldown .................. 5.11
5.8 Drying of SNF Element 6603M, Normalized Xenon Release During HVD............................ 5.14
5.9 Concentrations of Krypton and Xenon in Hydrogen Released from Oxidation ....................... 5.16
5.10 Drying of SNF Xenon Isotope Release During Post-CVE Pressure Rise Test......................... 5.18

xii
Tables
2.1 Water and Ice Vapor Pressure Data Versus Temperature ....................................................... 2.10
3.1 Summary of Nominal Test Design Conditions....................................................................... 3.2
5.1 Fuel Element 6603M Drying Run Time Line......................................................................... 5.3
5.2 Calculated Xenon Isotope Generation in Mark IA and IV N-Reactor Fuel ............................. 5.15
xii

xiii
Acronyms
ATS Applied Test SystemsCVD Cold Vacuum DryingDACS data acquisition and control systemDP dew pointET elapsed timeGC gas chromatographHP Hewlett PackardHVD Hot Vacuum DryingID inside diameterIPS Integrated Process StrategyMS mass spectrometerNIST National Institute of Standards and TechnologyOD outside diameterPNNL Pacific Northwest National LaboratoryPTL Postirradiation Testing LaboratoryQA Quality AssuranceQARD Quality Assurance Requirements and DescriptionSFEC single fuel element canisterSNF spent nuclear fuelUHP ultra high purityVP vapor pressure

1.1
1.0 Introduction
The water-filled K-Basins in the Hanford 100 Area have been used to store N-Reactor spent nuclearfuel (SNF) since the 1970s. An Integrated Process Strategy (IPS) has been developed to package, dry,transport, and store these metallic uranium spent nuclear fuels in an interim storage facility on theHanford Site (WHC 1995). Information required to support the development of the drying processes, andthe required safety analyses, is being obtained from characterization tests conducted on fuel elementsremoved from the K-Basins. A series of drying tests (reported in separate documents, see Section 8.0)have been conducted by Pacific Northwest National Laboratory (PNNL)(a) on several intact and damagedfuel elements recovered from both the K-East and K-West Basins.
This report documents the results of the fifth of those tests conducted on an N-Reactor outer fuelelement (6603M) which had been stored under water in the Hanford 100 Area K-West basin from 1983until 1996. This fuel element was subjected to a combination of low- and high-temperature vacuumdrying treatments which were intended to mimic, wherever possible, the fuel treatment strategies of theIPS. The system used for the drying test was the Whole Element Furnace Testing System, described inSection 2.0. The test conditions and methodologies are given in Section 3.0. Inspections on the fuelelement before and after the test are provided in Section 4.0. The experimental results are provided inSection 5.0. Discussion of the results is given in Section 6.0.
(a) Operated by Battelle for the U.S. Department of Energy under Contract DE-AC06-76RLO 1830.

2.1
2.0 Whole Element Furnace Testing System
A complete description for the Whole Element Furnace Testing System, including detailed equipmentspecifications, is provided in Ritter et al. (1998).
2.1 Major Systems Overview
An overview of the furnace testing system is presented in this section. The subsystems pertinent to thistest report are as follows:
• Vacuum Pumping System - This system consists of a scroll-type vacuum pump, a condenser withchiller, filters, valves, and piping, which provide the vacuum pressures and flows required for theproposed IPS vacuum processes.
• Process Heating System - This system consists of a resistively heated clam-shell furnace and samplechamber (retort) to provide heating to the fuel element and to control process temperatures.
• Gas Supply/Distribution System - This system consists of gas bottles; mass flow controllers; piping;and valves for metering argon, air, or oxygen through the system. A bubbler is also available foradding water vapor to the system if desired.
• Gas Analysis Instrumentation - The gas analysis instrumentation includes a 300-amu quadrupolemass spectrometer (MS) and a gas chromatograph (GC) for monitoring selected elements in theprocess gas stream.
• Process Instrumentation - The system is equipped with several instruments for measuring processtemperatures, pressures, and moisture level. An auxiliary turbo vacuum pumping system provideslow system pressures for zero adjustment of the high accuracy retort pressure sensor.
• Data Acquisition and Control System (DACS) - The DACS consists of an IBM-compatible computerand data acquisition/control unit to monitor/store key system parameters (temperatures, pressures,flows, moisture level) along with controlling the process heating system and safety argon system.
Figures 2.1 and 2.2 are photographs of the equipment located inside and outside of G-Cell. Thefurnace (including retort) and some of the process piping, instrumentation, and valves are located insidethe hot cell. The furnace sits on the cell floor and the process piping is routed to a rack that hangs on thewest cell wall. Process piping, electrical power, and instrumentation wires pass through several splitplugs on the west side of the cell. The process piping on the outside of the cell is contained within aglove bag, which provides a secondary containment as a precaution in case the process piping linesbecome contaminated. The vacuum pump, condenser, bubbler, GC, and the remainder of the

2.2
Fig
ure
2.1.
Fue
l Ele
men
t Dry
ing
Syst
em C
ompo
nent
s (i
n-ce
ll)

2.3
Fig
ure
2.2.
Fue
l Ele
men
t Dry
ing
Syst
em C
ompo
nent
s (e
x-ce
ll)

2.4
instrumentation and valves are located inside this glove bag. Instrumentation and electrical power wiresare routed through pass-through sleeves on the sides of the glove bag to the instrument rack and computerconsole.
The instrument rack contains the readout/control units for the pressure sensors, moisture sensor, andflow controllers, along with the heat trace temperature controllers, data acquisition/control unit, turbopump controller, GC laptop computer, and uninterruptable power supplies. The computers for the DACSand MS are located next to the instrument rack. The following sections provide more detaileddescriptions of the components for these subsystems.
2.2 Vacuum Pumping System
The vacuum pumping system provides the pressures and flows required for the proposed IPSprocesses. This system connects the furnace retort with all the other components of the test systemthrough various valves, fittings, and piping. The vacuum pumping system consists of the followingcomponents:
• scroll pump for evacuating the system to pressures below 1 Torr
• water condenser with refrigerated chiller for gross removal of water
• valves and piping for connecting the various components and controlling the flow direction
• particulate filters to prevent the spread of contamination
• heating cords with temperature controllers for preventing condensation in lines.
2.2.1 Varian Scroll Pump
The system vacuum pump is a Varian model 300DS scroll pump. This pump has an ultimate vacuumpressure less than 10-2 Torr and a peak pumping speed of 250 l/min (8.8 cfm). These pressures and flowsare more than adequate for simulating the conditions of the proposed IPS vacuum processes. For a singlefuel element, this amount of flow may be more than desired. Therefore, a metering valve was installed onthe pump inlet to throttle the flow to lower levels as required. The desired system pressure is achieved byeither using the metering valve or flowing ultra high purity (UHP) argon into the system through theentire gas loop or via a direct injection of ballast gas at the pump inlet. The use of argon gas helps toprevent the in-leakage of moisture-containing air through small system leaks (which are difficult toeliminate) that would interfere with process monitoring equipment.
2.2.2 Water Condenser
The scroll vacuum pump can be damaged by condensation of liquid water in the scroll mechanism,and, since each element was wet at the start of each test, the possibility of pump damage was considered.

2.5
A water condenser with corresponding chiller was installed in the system to condense the bulk of thewater before it reaches the pump. This condenser can be valved into the system in series with the scrollvacuum pump or can be bypassed if not needed. The condenser cannot trap all the liberated free water,but is efficient at removing the majority of free water in the system. The condenser is used only duringthe first phase of Cold Vacuum Drying (CVD). The condenser was custom fabricated specifically for thissystem. Detailed sketches and specifications for the condenser are given in Ritter et al. (1998).
2.2.3 Piping, Valves, and Filters
The vacuum pumping system connects the system components through various valves, fittings, andpiping. A simplified piping schematic for the system is shown in Figure 2.3. This schematic shows thebasic flow path of gases through the system that was used for this test, along with the relative locations ofthe major components, valves, and instruments. Detailed system piping diagrams are provided in Ritter etal. (1998) along with approximate lengths for the piping lines. As seen in Figure 2.3, there are numerousvalves in the system that are used to direct the flow to and from the various components. Most of thevalves in the system are ball valves and range from 1/4 in. to 1/2 in. nominal size. The system piping isconstructed of thin wall tubing (1/4 in. to 1/2 in. OD) and is typically connected using simple Swagelokfittings (tees, elbows, unions, etc.). Ports for gas sampling/analysis and monitoring of system pressure,temperature, and humidity are also provided at key locations in the system piping. Special fittings andpipe-threaded fittings are used in some locations for connecting piping to the process instruments.
Particulate filters are installed in the system on both the inlet and outlet to the retort to help preventthe spread of contamination to the system piping on the outside of the hot cell. These filters areconstructed of a microporous fiberglass media in a stainless steel housing. They are 99.9% efficient forparticulates that are 0.2 microns and larger in size. Two different size filters, manufactured by Matheson,are used in the system.
2.2.4 System Line Heaters
All of the stainless steel tubing that carries gases into the furnace retort and resultant gases from theretort is heated to about 75°C to ensure condensable water vapor remains in the gas phase. Simple heat“cords” capable of being wrapped upon each other (as required at tees, elbows, and other connections)were found to be a good heating method for this system. The heating cords are controlled by simpleproportional controllers. Type-K thermocouples are installed on each heated line so that the DACS canmonitor and record the temperature.
2.3 Process Heating System
The whole element furnace is a 4-ft-long resistively heated clam-shell furnace. The furnace, a Series3210 supplied by Applied Test Systems (ATS), has a temperature rating of 900°C and total heatingcapacity of 13,800 W. The internal dimensions are 5 in. ID by 45 in. long. The furnace has three separatesets of heating elements that allow the heating to be controlled in zones; each zone is 15 in. long andsupplies up to 4600 W heating. The zones can be controlled separately to establish a flat temperatureprofile within the furnace, even though heat is lost preferentially out the end with the retort entry flange.

2.6
TE
19
PE
06
TE
04T
E05
TE
06T
E07
TE
08T
E09
TE
10
TE
01T
E02
TE
03
PE
01M
E01
FE
01
PE
07
F6
F3
F2
F1
Tub
e F
urna
ce
Con
dens
er
FE
04
PE
08
Gas
Chr
omat
ogra
ph
UHP Argon
TE
20
Scr
oll
Pum
p
To
Hig
hV
acuu
m(n
ot s
how
n)
UHP Argon
Moi
stur
eP
robe
Pre
ssur
eG
auge
Pre
ssur
eG
auge
Mas
s F
low
Con
trol
ler
Mas
s F
low
Con
trol
ler
Filt
er
Mas
sS
pect
rom
eter
Hot
Cel
l
Var
iabl
eLe
ak V
alve
Met
erin
gV
alve
F5
TE
21
Fig
ure
2.3.
Gen
eral
ized
Vie
w o
f T
est S
yste
m

2.7
A heat reflector consisting of several thin Inconel plates is used to reduce heat loss from the flange end ofthe retort. The furnace controller is an ATS Series 3000, which consists of three programmable, self-tuning proportional with integral and derivative controllers. These controllers are also interfaced to theDACS, which is capable of providing limited input to the controllers as required.
The retort, an ATS Series 3910, is an Inconel tube fitted with a gas inlet tube at one end and agasketed flange at the other. Of all high-temperature materials, Inconel series 600 was selected to reducethe amount of oxidation and water pickup by the retort and associated components. Experience hasshown that stainless steel components were easily affected by corrosion, which could then affect testresults. The body of the retort is fabricated from schedule 40 Inconel pipe (4.5 in. OD, 4.026 in. ID), andthe inside length is about 44.5 in. Seven type-K thermocouples are installed equidistant along one side ofthe retort and extend into the retort interior approximately 1/8 in. These thermocouples are used tomonitor the retort temperature so that if a reaction with the fuel element occurs (which would locally raisethe retort temperature), this event can be correlated with the approximate location on the fuel.
An Inconel sample/transfer boat is used to load the fuel element into the furnace. The boat isfabricated from an 11-gauge (0.120-in.-thick) Inconel 601 sheet, which is formed into a flattened u-shape.The boat has a weir and a swivel handle on each end. The weirs are used to keep free water orparticulates contained in the boat as required.
2.4 Gas Supply/Distribution System
The gas supply system and vacuum pumping system together are capable of controlling the fuelelement environment to vacuum or moderate pressure conditions, and/or exposing the fuel element to avariety of gases or gas mixtures. The gas loop is typically operated as a single-pass system with nocapability for recirculation. The gas supply system consists of gas bottles; mass flow controllers; piping;and valves for metering argon, air, or oxygen through the system. A bubbler is also available for addingwater vapor to the process gas stream as required, but it was not used in these tests.
The gas supply system contains three Matheson mass flow controllers calibrated for argon, air, andoxygen. All gases are typically specified “ultra high purity” and are additionally filtered for water usingmolecular sieve columns. Argon is the principal inert gas used, as it is more dense than air, providesreasonable thermal conductivity, and requires simpler handling procedures than lighter gases such ashelium. The argon purge gas is introduced into the retort through FE-01, which is a Matheson model8272-0422 oxygen controller, recalibrated for argon gas at 25°C using a NIST-traceable bubble flowmeter. Air and oxygen are not currently used because any oxidative steps have been deleted from thecurrent IPS for the SNF. The manufacturer’s specifications for the air and oxygen controllers’ flow rateranges are 0 - 280 sccm argon, 0 - 1000 sccm air, and 0 - 10 sccm oxygen. If higher flow rates aredesired, a new mass flow controller with a higher range could be procured and installed in the system.

2.8
2.5 Gas Analysis Instrumentation
2.5.1 Balzers Omnistar Mass Spectrometer
The Balzers Omnistar MS is a compact, computer-controlled, quadrupole MS capable of scanning to300 amu. The unit is capable of monitoring up to 64 components within a gas stream with a nominaldetection limit of less than 1 ppm for most gases other than hydrogen. The MS was used to monitorhydrogen, nitrogen (for air in-leakage), krypton, xenon, and other elements during the test.
The MS was modified as a result of early system testing and calibration to improve the time responseto small changes in hydrogen pressure. Before testing, the MS was calibrated for hydrogen usingmixtures of hydrogen and helium, and hydrogen and argon gas. The residence time of each gas could bemeasured in the quadrupole chamber, and it was observed that the hydrogen decay time wasapproximately four times as long as helium. This was not unexpected as turbomolecular pumps have alower pumping efficiency for very light gases. In standard practice this is acceptable, but for these tests,where determining hydrogen could be very important, steps were taken to improve the hydrogen decaytime. The MS vacuum system was modified by adding a stainless steel flanged tee, a gate valve, and aroom-temperature hydrogen getter downstream from the quadrupole. Under vacuum the gate valve canbe opened, exposing the getter to the system to help scavenge hydrogen from the system followinganalysis. This modification reduced the residence time of hydrogen in the system substantially, anddecreased the background level of hydrogen by about a factor of 2. The getter improved the systemresponse to transient events that might result in the release of hydrogen.
A Granville-Phillips variable leak valve, series 203, was added to the gas sampling inlet of the MS inorder to permit operation over a wide range of system pressures. Without the leak valve, systempressures above about 40 Torr produce too much flow through the MS capillary tube, which overwhelmsthe turbo pump used to pump down the MS vacuum chamber. Flow through the leak valve can becontinuously varied from 0.4 l/s to 10-11 l/s, which allows the MS inlet pressure to be controlled to anypressure desired, even if the system pressure varies dramatically. The pressure on the low-pressure sideof the leak valve is measured using a Cole-Parmer sensor (PE-07) and recorded by the DACS. The inlethead pressure is divided by the pressure used for the calibration, and this factor is applied to the test datafor calculating actual gas concentrations. The MS was calibrated at ~30 Torr head pressure with acertified gas standard consisting of 1050 ppmv hydrogen in argon.
2.5.2 MTI M200 Gas Chromatograph
The MTI M200 Gas Chromatograph is a high-speed GC that is used to monitor the quantities ofhydrogen and other light gases in the furnace testing system gas loop. This instrument is interfaced with alaptop computer to record data. The GC is designed to operate at near-atmospheric pressure; thus it maybe configured in two different ways for measurement purposes. At system pressures near atmospheric,the GC is configured to sample directly from the gas loop ahead of the system vacuum pump. When thesystem is under vacuum, the GC is configured to sample from the exhaust side of the vacuum pump. Thegas output from the pump is sufficiently compressed that the GC can sample and analyze this gas. TheGC inlet pressure is measured using a Cole-Parmer pressure sensor (PE-08) and recorded by the DACS.

2.9
No correction for the difference in the sample pressure and calibration pressure is applied, since both are~760 Torr (1 atm). The GC was calibrated with a certified gas standard consisting of 1050 ppmvhydrogen in argon.
2.6 Process Instrumentation
The furnace testing system contains several process instruments for monitoring moisture content,pressure, and temperature. The key instruments are as follows:
• Panametrics moisture monitor
• MKS Baratron pressure transducers
• Cole-Parmer pressure transducers
• Type-K thermocouples.
2.6.1 Panametrics Moisture Monitor
The Panametrics moisture monitor model MMS35 uses a solid electrochemical probe (model M2L)that measures moisture by measuring the characteristic capacitance of the probe as a function of themoisture in the gas phase. The sensor has a nominal dew point range of -110°C to 20°C. Previous testingindicated that contamination causes the probe to lose calibration and results in moisture readings that driftwith time. To prevent contamination of the probe tip, the probe is installed in the gas loop downstream oftwo glass particulate filters. Further, the probes are changed following each test and surveyed forradioactive contamination. If no contamination is found, and the data correlate well with the dataobtained from the MS, the readings are accepted.
A calibration verification procedure can be performed using calibrated water “leak” tubes. Thesetubes can be placed inside the furnace and, when heated, will establish a known water vapor pressure inthe system. However, this procedure is time intensive; approximately 2 weeks are required to calibrateone probe over the range of moisture likely to be encountered in these tests. This procedure is used onlyif the moisture monitor results vary widely from the MS data.
Output of the moisture monitor is in dew point (dp) in degrees Celsius. For comparison with othertest data, these DP values were converted to water vapor pressure in Torr using the water and ice vaporpressure data shown in Table 2.1. Interpolation of the data was accomplished using a 6th-orderpolynomial fit to the log of the vapor pressure versus temperature data. The resulting conversionexpression is as follows:

2.10
Table 2.1. Water and Ice Vapor Pressure Data Versus Temperature
Dew Point Vapor Pressure (VP)(°°C) (Pa)(a) (Torr) Log (Torr)-80 5.500E-02 4.126E-04 -3.385E+00-75 1.220E-01 9.151E-04 -3.039E+00-70 2.610E-01 1.958E-03 -2.708E+00-65 5.400E-01 4.051E-03 -2.392E+00-60 1.080E+00 8.101E-03 -2.091E+00-55 2.093E+00 1.570E-02 -1.804E+00-50 3.936E+00 2.952E-02 -1.530E+00-45 7.202E+00 5.402E-02 -1.267E+00-40 1.284E+01 9.631E-02 -1.016E+00-35 2.235E+01 1.676E-01 -7.756E-01-30 3.801E+01 2.851E-01 -5.450E-01-25 6.329E+01 4.747E-01 -3.235E-01-20 1.033E+02 7.746E-01 -1.109E-01-15 1.653E+02 1.240E+00 9.339E-02-10 2.599E+02 1.950E+00 2.899E-01-5 4.018E+02 3.014E+00 4.791E-010 6.113E+02 4.585E+00 6.614E-01
10 1.228E+03 9.212E+00 9.644E-01(a) CRC Press. 1997. Handbook of Chemistry & Physics, 78th edition.
VP (Torr) = log-1[C1·DP6 + C2·DP5 + C3·DP4 + C4·DP3 + C5·DP2 + C6·DP + C7], (2.1)
where C1 = -6.7260E-12C2 = -1.7250E-09C3 = -1.7089E-07C4 = -7.2618E-06C5 = -2.9668E-04C6 = 3.4414E-02C7 = 6.5933E-01
2.6.2 MKS Baratron Pressure Transducers
Two MKS Baratron model 690 calibrated pressure transducers coupled with MKS model 270 signalconditioners are used as the primary measurement for the overall system pressure. As shown inFigure 2.3, PE-01 measures the system pressure downstream of the retort outlet, whereas PE-06 measuresthe system pressure at the retort inlet. PE-01 indicates pressure in the range of 0.1 Torr to 10,000 Torr.The pressure range of PE-06 is 0.01 Torr to 1000 Torr. PE-06 was installed after the first two fuelelement drying tests to provide more accurate measurements than PE-01 for low pressures. PE-06 istherefore considered the primary system pressure measurement. In addition, the 270 signal conditioner

2.11
procured with PE-06 has a special capability to remotely zero the transducer, which provides moreaccurate pressure measurements below 1 Torr.
An auxiliary high vacuum turbo pump is used to evacuate the inlet to PE-06 to well below 10-4 Torr,so that the transducer can be accurately re-zeroed. The 270 signal conditioner used with PE-01 does nothave a remote zeroing capability. Both signal conditioners have analog outputs that are interfaced to theDACS so that system pressure is continuously recorded.
2.6.3 Cole-Parmer Pressure Transducers
Two Cole-Parmer model H-68801-53 calibrated diaphragm pressure transducers are installed on theMS and GC sample lines as indicated by PE-07 and PE-08 in Figure 2.3. These pressure measurementsare used to normalize the MS and GC data so that actual gas concentrations in the system can becalculated from the relative concentrations measured. These sensors have a range of 0 to 1500 Torr witha resolution of 0.1 Torr, and an accuracy of ±1% or ±1 Torr, whichever is larger. Both readout units(model H-68801-03) have analog outputs that are interfaced to the DACS so that these pressures arecontinuously recorded.
2.6.4 Thermocouples
Thermocouples provide a simple, reliable method for measuring system temperatures. As shown inFigure 2.3, over 20 thermocouples are installed at various locations in the system to provide keytemperature measurements. The retort temperatures are of primary importance, and these temperaturesare measured by thermocouples TE-04 through TE-10, which are positioned equidistant along the lengthof the retort. Other key temperature measurements include the retort center temperature (TE-20, which isa 30-in.-long thermocouple installed through the outlet end of the retort); retort inlet temperature (TE-21);condenser gas temperature (TE-19); and the condenser coolant temperature (TE-22). Thermocouples TE-11 through TE-17 are used for controlling the temperature of the heated lines. All thermocouple readingsare continuously recorded using the DACS.
2.7 Data Acquisition and Control System
The DACS monitors system parameters and controls the furnace and safety argon system. TheDACS consists of a Hewlett Packard (HP) 3497A data acquisition/control unit and an IBM-compatiblecomputer. A National Instruments general purpose interface bus card, installed in the IBM-compatiblecomputer, is used to communicate with the HP 3497A. The computer communicates with the furnacetemperature controllers over serial port 0 using an RS-232/RS-485 converter. The DACS uses NationalInstruments LabView for Windows as the control software.
The DACS is designed to measure critical system parameters during fuel conditioning tests, includingtemperatures, pressures, flow rates, and moisture level. The measured parameters are converted toengineering units, displayed on the computer screen, and stored to disk at user-defined intervals. The datafiles are stored in a tab-delimited format to allow importing into a standard spreadsheet or plottingprogram. A plotting screen also allows for plotting of up to six parameters at a time.

2.12
Limited control of the furnace can be performed with the DACS. Each of the three furnace zonetemperatures can be remotely set by the DACS. In addition, the DACS allows the operator to start andstop the furnace and select one of four temperature profiles that are pre-programmed in the furnacetemperature controllers. Note that these profiles must be programmed manually in the furnace controllersbefore using the DACS to select them.

3.1
3.0 Vacuum Drying Testing of Element 6603M
The drying test was performed in accordance with Test Procedure, Furnace Testing of N-ReactorFuel Element 6603M, PTL-106, Revision 0. This document is located in the PNNL permanent projectrecords for this test.
The testing consisted of three parts (discussed in this section):
• removing the fuel from its shipping canister, performing a visual inspection, loading the fuel onto thefurnace system sample boat, and transferring it to the PTL G-Cell for loading into the furnace
• drying the fuel element using a combination of Cold Vacuum Drying (CVD) and Hot Vacuum Drying(HVD) processes
• unloading the furnace, performing a post-test visual inspection, and returning the fuel element to itsshipping canister.
3.1 Fuel Element Transfer and Loading
3.1.1 Pre-Test Visual Inspection
The pre-test visual inspection was conducted using a high-resolution color CCD video camera locatedinside the PTL F-Cell (adjacent to the G-Cell) where the sample was unloaded from the shipping canisterand visually inspected. The results were recorded using a Panasonic Super-VHS resolution videorecorder. This examination was conducted to document the condition of the fuel element prior to the testand to determine if any changes had occurred since it was removed from the K-West Basin and shipped tothe PTL. The results of this inspection are presented in Section 4.0.
3.1.2 Fuel Element Rinsing
Fuel element 6603M had been stored in the PTL water storage pool contained in a single fuel elementcanister (SFEC) that was filled with K-Basin water. Before the start of the drying test, the element wasrinsed in F-Cell. This rinsing involved raising and lowering the element several times in the SFEC usingone of the cell’s manipulators. Following rinsing, the element was transferred to G-Cell for loading intothe element test retort.
3.2 Fuel Element Drying
The fuel element was subjected to cold and hot vacuum drying. The drying test was conducted in sixphases:

3.2
1. Cold Vacuum Drying 2. Pressure Rise Test 3. Hot Vacuum Drying (first step)
4. Hot Vacuum Drying (second step) 5. Hot Vacuum Drying (third step) 6. Post-Test Pressure Rise Test
The nominal design conditions used for these test phases are summarized in Table 3.1. Each phase isdiscussed below.
Table 3.1. Summary of Nominal Test Design Conditions
Test Segment Nominal Test Condition(a)
A. Cold Vacuum DryingSystem Configuration Pump on,(b) argon gas flow during initial condenser pumpdown phaseTest Temperature, °C 50Atmosphere Ar background, VacuumPressure, Torr ~70, <5Gas Flow Rate, cc/min 0Gas Species Monitored H2, H2O, N2, O2, CO2, Ar, Kr, XeDuration, hr CVD is conducted until the total pressure in the retort falls below 0.5 TorrB. Pressure Rise TestSystem Configuration Test Chamber IsolatedTest Temperature, °C 50Atmosphere VacuumInitial Pressure, Torr <5Gas Flow Rate, cc/min 0Gas Species Monitored H2, H2O, N2, O2, CO2, Ar, Kr, XePressure Rise (acceptable level, Torr) <0.5Duration, hr 1C. Hot Vacuum Drying (Step 1)System Configuration Pump on,(b) argon gas flowTest Temperature Range, °C 75Atmosphere Vacuum, Ar backgroundPressure, Torr 15Gas Flow Rate, cc/min 300Gas Species Monitored H2, H2O, N2, O2, CO2, Ar, Kr, XeDuration, hr 24D. Hot Vacuum Drying (Step 2)System Configuration Pump on,(b) argon gas flowTest Temperature Range, °C 75 to 400Temperature Ramp Rate, °C/hr 10Atmosphere Vacuum, Ar backgroundPressure, Torr 15Gas Flow Rate, cc/min 300Gas Species Monitored H2, H2O, N2, O2, CO2, Ar, Kr, XeDuration, hr 35

3.3
Table 3.1. (contd)
Test Segment Nominal Test Conditions(a)
E. Hot Vacuum Drying (Step 3)System Configuration Pump on,(b) argon gas flowTest Temperature, °C 400Atmosphere Vacuum, Ar backgroundPressure, Torr 15Gas Flow Rate, cc/min 300Gas Species Monitored H2, H2O, N2, O2, CO2, Ar, Kr, XeDuration, hr 10F. CooldownSystem Configuration Pump on, argon gas flowTest Temperature, °C 400 to 50Atmosphere VacuumInitial Pressure, Torr 15Gas Flow Rate, cc/min 300Gas Species Monitored H2, H2O, N2, O2, CO2, Ar, Kr, XeDuration, hr ~100G. Pressure Rise TestSystem Configuration Test Chamber IsolatedTest Temperature, °C 50Atmosphere VacuumInitial Pressure, Torr <5Gas Flow Rate, cc/min 300Gas Species Monitored H2, H2O, N2, O2, CO2, Ar, Kr, XeDuration, hr 1(a) Nominal test design conditions. Actual values are given in the text.(b) Vacuum pump was throttled during the drying test.
3.2.1 Cold Vacuum Drying
While the fuel element was being handled and prepared for the drying test, it was kept damp bysprinkling with deionized water. The amount of surplus liquid water, though small, could not beascertained. There were no pools of water in the sample boat; however, water was adsorbed into corrodedareas, cracks, and crevices. The element was then loaded into the furnace and the test started. Anadditional ~10 ml of water were added to the sample boat to ensure sufficient free water in the systemprior to CVD.
The furnace was first purged with argon to remove as much air as possible. It is possible that a small,but unknown, quantity of water could be lost during this step. The furnace was then isolated and thefurnace temperature increased to approximately 50°C and allowed to stabilize. The system vacuum pumpwas then turned on and the system water condenser valved in. Initially, argon was injected for ~80minutes at a rate of 324 cc/min. When the water partial pressure, as indicated by the moisture monitor,began to drop, the flow was turned off. After the system pressure dropped to a reasonable level, thevacuum pump was valved out and only the condenser left in the system. When the system pressurebecame lower than the condenser could extract, the condenser was valved out of the gas loop and the

3.4
vacuum pump valved back in. This process was repeated until the vacuum pump could safely evacuatethe remaining water. No argon was injected during this part of the CVD test. The remainder of CVD wasconducted at an ultimate pressure of ~0.2 Torr for ~16 hr. The purpose of the CVD portion of the testwas to determine if CVD is successful in removing the majority of the free water from the system in areasonable length of time.
3.2.2 Pressure Rise Test
The Pressure Rise Test involved isolating the system and measuring any pressure increase while atCVD pressure and temperature conditions. The purpose of the Pressure Rise Test was to determine theeffectiveness of the preceding CVD process. This test was conducted by valving the vacuum pump out ofthe gas loop and closing the exhaust valves. The condition for acceptance of this portion of the test is atotal system pressure rise of less than 0.5 Torr in a 1-hr time period. If this condition is not met, thesystem is re-opened to the vacuum pump and the Pressure Rise Test repeated.
3.2.3 Hot Vacuum Drying, Step 1
Following completion of the Pressure Rise Test, the vacuum pump was re-opened to the systemretort; argon gas flow was established at a rate of ~324 cc/min; and the retort temperature was increasedto ~76°C. This condition was held for a period of ~25 hr. This portion of the test can be used to obtainisothermal hydrogen and water release data for assessing oxidation of the fuel at low temperatures.
3.2.4 Hot Vacuum Drying, Step 2
The second step of the HVD process involved raising the temperature of the retort from ~80°C to~400 °C at a carefully controlled rate while maintaining the same argon flow and pressure conditions.Thus, any release of gas species during this temperature rise could be assigned to a specific temperature.The second step of the HVD process was conducted for about 33 hr.
During this step, hydrogen may be released from the fuel through the decomposition of uraniumhydride (Cotton 1988); this reaction is rapid at temperatures greater than 250°C.
23 H2
3UUH +→ (3.1)
Water may also be liberated by various hydrated species found on fuel elements, such as hydrates ofuranium oxides, aluminum hydroxides, and hydrated iron oxides. Water is also released slowly along a“tortuous path” from beneath corroded parts of the fuel element and from behind the cladding. Thereleased water can react with the fuel element to generate hydrogen through the reactions:
222 2HUOO2HU +→+ (3.2)
2223 H2
7UOO2HUH +→+ (3.3)

3.5
3.2.5 Hot Vacuum Drying, Step 3
The final step of the HVD process involved holding the temperature of the retort at ~400°C whileagain maintaining the same argon flow and pressure conditions as in steps 1 and 2. This step will yieldisothermal release data for any remaining hydrated species on the fuel element and for oxidation ofuranium by any remaining water. This final step of the HVD process was conducted for about 10 hr.
3.2.6 System Cooldown and Post-Test Pressure Rise Test
Following completion of the final HVD step, the system retort was allowed to cool to ~50°C whilemaintaining the same vacuum and flow conditions, and then another Pressure Rise Test was conducted todetermine the baseline in-leakage rate of air into the retort from the cell environment. Knowing this rateis important to allow for correction of the system and moisture pressure increase rates determined in theinitial post-CVD Pressure Rise Test. Since the conditions for the post-HVD test are identical to thoseused for the initial test, the assumption is made that the air in-leakage rate also should be nearly the same.
3.3 Calculation of Water and Hydrogen Inventories
Assuming ideal gas behavior of the water vapor, total water inventory (m) in the system during thoseportions of the test conducted with argon flowing into the retort can be approximated from the measuredwater vapor pressure and the argon gas flow as follows:
dt
d
dt
d V)P(P
PVMm
wt
w
0⋅
−⋅= (3.4)
where dm/dt is the rate of water removal in grams per minute, M is the molecular mass of water in gramsper mole, dV/dt is the flow rate in liters per minute (at the calibration temperature of 25°C), V0 is themolar volume of gas at 25°C and 1 atmosphere in liters per mole, Pw is the partial pressure of water vaporin Torr, and Pt is the total pressure in Torr. The total amount of water released is given by integrating therate data over time.
The hydrogen inventory may be calculated in a similar fashion with the [Pw/(Pt – Pw)] expression inthe above equation replaced with the measured atom fraction of hydrogen. For the purposes of thisreport, all hydrogen data are plotted in Torr·l rather than grams. At the calibration conditions of the argonflow controller, 1 Torr·l is equivalent to approximately 0.11 mg of hydrogen.
The assumptions made in estimating the water and hydrogen values are
• The flow into the retort is approximately equal to the flow out (i.e., contributions to the flow fromother gas species such as hydrogen are neglected).
• The argon mass flow is referenced to 25°C (as determined from the calibration of the flow gauges).
• The sample gas is at the same temperature as the calibration gas (GC and MS measurements).

4.1
4.0 Visual Examinations of Element 6603M
An N-Reactor fuel assembly consists of an inner element and outer element made from a uraniumalloy co-extruded with a Zircaloy-2 cladding. Both elements are annular, right-cylinders. The innerelement has a smaller outer diameter and is held in place within the outer element.
Fuel element 6603M, chosen for Run 5, was an outer element removed from the K-West Basin in1996. The element had been in sealed water storage in the K-West Basin since 1983. This fuel elementwas selected to represent a classification of fuel damage termed “broken bottom end” (Lawrence 1997).The furnace drying test series (of which this is Run 5 of 8) were intended to progress from intact(unbreached) fuel elements to severely damaged fuel elements. This fuel element, therefore, was torepresent a fuel element which falls between fuel elements which appear to be only broken (as in Run 3)and those which are severely damaged (as will be tested in Runs 6, 7, 8).
The fuel element had been kept in K-Basin water at the PTL storage basin since it was loaded into itsSFEC and shipped to the facility in 1996. The first relatively detailed examination of the fuel elementwas conducted just before the drying test and is discussed below.
4.1 Pre-Test Visual Examination
The fuel element was removed from its SFEC and examined using a CCD color video camera in thePTL F-cell. The fuel element was split open at one end with some of the uranium fuel material missingdue to corrosion. The other end of the fuel element appeared to be intact. The visual inspection of theremainder of the fuel element suggested the element had no additional breaches.
Figure 4.1 shows two views of the damaged end of the fuel element. Portions of the end cap arebroken away and missing from the element. The outer cladding is split and visibly forced out as a result
Figure 4.1. Two Pre-test Views of the Damaged End of Fuel Element 6603M. The exposedcracked uranium fuel matrix can be seen clearly in each view.

4.2
of the fuel corrosion, and the inner cladding is also split. Cracks can be seen in the exposed uranium fuelmaterial as is typical for this type of fuel failure.
The fuel element appeared to have a light coating on the surface. Attempts to collect the coating wereunsuccessful because the material was thin. A large area would have had to be brushed to collect asufficient sample for analysis by XRD or SEM. That would have changed the overall surface condition ofthe fuel element which was not desired.
No other significant features (no apparent cracks and limited surface coatings) were evident in thepre-test visual examination. Additional pre-test views of Element 6603M are presented for comparativepurposes with post-test results in the next section.
4.2 Post-Test Visual Examination
The changes or lack of changes observed between the pre- and post-test analyses are significant. Oneof the obvious changes to the fuel element during this drying test was the change of overall color of thefuel element. The thin coating material darkened as a result of the heat treatment. This could be due tothe transformation of uranium oxy-hydrates releasing water and leaving behind simpler oxide phases.Some oxides are known to be dark colored as observed on the fuel element. Figure 4.2 shows a pre- andpost-test view of the intact end of Element 6603M. This end appears to have been placed in the downposition at one time during storage as it appears similar to other ends stored in sludge (distinct bandrunning circumferentially around the element, different coating appearance). The post-test view of thesame area shows the color difference of the coating, but no other significant changes. The circumferentialband is still visible and some of the other distinct markings that were present in the pre-test view are alsostill present in the post-test views.
Figure 4.2. Pre-test (left) and Post-test (right) Views of the Intact End of Element 6603M. The viewsare of the same region. The circumferential band around the fuel element is visible in bothviews as are the distinctive white markings (which are darker in the post-test view).

4.3
Figure 4.3 shows a pre- and post-test view of the damaged end. The damaged end of the fuel elementdid not appear to undergo any significant visual appearance changes besides the color change. The fuelcladding may have opened up slightly due to fuel oxidation, as small fuel pieces (likely oxidized) fell outof the fuel element as it was rotated for visual examination. These small shard-like particles are visible inthe post-test view of the fuel element in Figure 4.3.
While no significant changes were at first observed in the post-test view, the hydrogen release datafrom this test (Section 5.4) showed a release peak at ~330°C that was not observed in previous tests. Thatrelease was also accompanied by a release of fission gases which suggested that a fresh surface ofuranium metal was exposed during the test. The video tapes were reexamined more closely to determineif there were any differences between the pre- and post-test views. Evidence of a new breach in the fuelcladding was found along the side of the fuel element. Still images captured from the video of one areaalong the side of the fuel element are shown in Figure 4.4. These images were captured from portions ofthe tape during times when the camera was being moved. The resolution of the still images is reduceddue to this movement. However, after careful study, it was concluded that a new breach occurred duringdrying. This breach could have provided the fresh uranium metal surface which would have reacted withresidual water and oxygen in the test system. This reaction would account for the hydrogen release peakand the release of fission gases. No other significant changes were noted in the post-test appearance ofthe fuel element.
Figure 4.3. Pre-test (left) and Post-test (right) Views of the Damaged End. Small shardsof fuel material can be seen in the background of the image. These particlesfell freely from the fuel element as it was rotated for viewing.

4.4
Split
Lateral crackLateral crack
Figure 4.4. Pre- and Post-test View of a Portion of the Side of Element 6603M.A new breach was detected which likely formed during the dryingof the fuel element.

5.1
5.0 Experimental Results
In the following sections, the experimental data collected during the drying test are expanded andplotted for each segment. Summary results from the test are plotted in Figure 5.1. This figure shows thesystem moisture level response to the pressure changes and the retort tube temperatures during the test.Time intervals for the various test segments are shown in the upper section of the plot, and are alsooutlined in Table 5.1. The temperatures shown in Figure 5.1 were recorded from one of seventhermocouples (TE-07) on the system located near the center of the retort. The pressure data were takenfrom the 0 to 1000 Torr Baratron sensor (PE-06) located upstream of the retort.
5.1 Cold Vacuum Drying
The water release from the CVD portion of the test is shown in Figure 5.2. This plot spans the periodwhen the furnace was loaded with the fuel element through to the Pressure Rise Test. The baselinemoisture partial pressure in the system prior to heating was ~14 Torr at a retort temperature of ~24°C.Total system pressure was ~751 Torr, with no argon gas flow. After heating to ~51°C, the moisturepressure and system pressure stabilized at ~12 Torr and ~847 Torr, respectively. Assuming ideal gasbehavior, the pressure after heating is approximately 28 Torr higher than expected. This excess pressurehas been observed in all the previous tests, except for the first dry run, and may have been due to gasesevolved during the heatup, such as hydrogen from moisture reactions, and gases dissolved in the freewater. Another explanation for the calculated pressure difference is that the average retort temperaturewas somewhat greater than 51°C.
The CVD phase started at an elapsed time (ET) of 270 minutes when the vacuum pump was openedbriefly in order to “rough-out” the system retort to ~70 Torr (total pressure). At this point, the vacuumpump was valved out of the system, allowing pumping by only the condenser. Figure 5.2 shows that themoisture pressure indication rose almost immediately to ~14 Torr, and “saturated” at this pressure forabout 50 min. The saturation behavior was the result of the dew point exceeding the maximum of 20°Cfor the Panametrics moisture probe. At an ET of ~343 minutes, the condenser was valved out and thevacuum pump valved back in. By the end of CVD (ET = 1234 min), the moisture pressure had droppedto ~0.3 Torr, whereas the total pressure was indicating a slightly lower value at ~0.2 Torr. The reason forthis apparent discrepancy is not clear, but may indicate the inherent combined accuracies of the Baratronand Panametrics sensors. Approximately 4 ml of water were collected in the condenser during CVD.The reason for the incomplete recovery of water is not clear, but may be due to hold-up in unheatedsystem components such as filters. It is also possible that some evaporation occurred after adding theinitial water to the fuel. The run log indicated the furnace had to be opened after loading the fuel elementprior to the start of the test in order to properly insert the axial thermocouple.

5.2
Ela
psed
Tim
e (m
inut
es)
010
0020
0030
0040
0050
0060
0070
0080
00
Moisture Partial Pressure (mTorr) 10-1
100
101
102
103
104
Retort Temperature (°C)
0100
200
300
400
500
Retort Pressure (Torr)
0200
400
600
800
1000
1200
Tem
pera
ture
Moi
stur
e
Pre
ssur
eHV
D-1
HV
D-2
CO
OLD
OW
NC
VD
PR
T-1
HV
D-3
PR
T-2
Fig
ure
5.1.
Dry
ing
of S
NF
Ele
men
t 660
3M, S
umm
ary
Plot

5.3
Table 5.1. Fuel Element 6603M Drying Run Time Line
Activity Date/TimeElapsed Time
(min)Start of TestHeat furnace to ~50°C 01/06/98 13:09 64Cold Vacuum Drying TestOpen pump valve(a) and condenser to furnace (initial) 01/06/98 16:35 270Open pump valve, close condenser valve (final) 01/06/98 17:48 343Pressure Rise TestClose pump (isolate furnace) 01/07/98 08:39 1234Open pump valve 01/07/98 09:39 1295Hot Vacuum Drying Test (Step 1)Start argon flow (~320 cc/min), raise furnace temperature to~80°C and hold
01/07/98 09:40 1296
Hot Vacuum Drying Test (Step 2)Raise furnace temperature to ~400°C @ 10°C/min 01/08/98 10:26 2781Hot Vacuum Drying Test (Step 3)Hold furnace temperature at ~400°C 01/09/98 19:17 4752System CooldownReduce temperature of retort to ~50°C, maintain argon flow 01/10/98 04:50 5325Post-Test Pressure Rise TestTurn off argon flow, and close pump valve (isolate furnace) 01/10/98 08:23 8418Turn off furnace heaters, end test 01/12/98 09:35 8490(a) Argon flow was set to ~320 cc/min initially and turned off when the condenser was valved out.
The vacuum pump was throttled for the drying test.
5.2 Pressure Rise Tests
The results of the two pressure rise phases of the drying test (post-CVD and post-HVD) are shown inFigures 5.3 and 5.4. As discussed earlier, the purpose of the post-HVD test was to determine as best aspossible the ambient air in-leakage rate into the system as it had been configured for the drying test.While under vacuum conditions, with no argon flow, any air in-leakage will contribute to the data signalsobserved for the various process gases measured during the test, particularly water and hydrogen (fromoxidation). The data plotted for the total pressure are from the 0 to 1000 Torr Baratron sensor (PE-06)located upstream of the retort. This sensor has higher sensitivity and lower noise than the 0 to 10,000Torr Baratron located downstream of the retort. To calculate the total water mass removed from theretort, however, pressure data from the 0 to 10,000 Torr sensor (PE-01) were used as the moisture sensorwas also located on the downstream side of the retort. During argon flow conditions, the pressure dropacross the retort was ~4 Torr.
The post-CVD Pressure Rise Test was conducted over an ET of 1234 min to 1295 min. Both the totalpressure and the moisture pressure showed nearly linear pressure rises over the course of the test.Regression fits (dotted lines in the figure) yielded a total pressure rise rate of ~0.2 Torr/hr (well below the0.5 Torr/hr criterion for the test), and a moisture pressure rise rate of ~0.04 Torr/hr.

5.4
Ela
psed
Tim
e (m
inut
es)
400
600
800
1000
1200
Moisture Partial Pressure (mTorr) 102
103
104
105
Retort Temperature (°C)
4648505254
Retort Pressure (Torr)
10-1
100
101
102
103
Tem
pera
ture
Moi
stur
e
Pre
ssur
e
Arg
on fl
ow o
n (~
324
cc/m
in)
Arg
on fl
ow o
ff
Fig
ure
5.2.
Dry
ing
of S
NF
Ele
men
t 660
3M, C
old
Vac
uum
Dry
ing

5.5
Ela
psed
Tim
e (m
inut
es)
1200
1250
1300
Moisture Partial Pressure (mTorr) 200
300
400
500
Retort Temperature (°C)
5055606570
Retort Pressure (Torr)
0.00
0.25
0.50
0.75
Tem
pera
ture
Moi
stur
e (3
9 m
Tor
r/hr
)
Pre
ssur
e (0
.16
Tor
r/hr
)
Fig
ure
5.3.
Dry
ing
of S
NF
Ele
men
t 660
3M, P
ost-
CV
D P
ress
ure
Ris
e T
est

5.6
Assuming that the water vapor pressure increase is from water sources within the test system, andassuming ideal gas behavior of the water vapor, the rate of desorption of the water (dn/dt) will be givenby:
dt
d
dt
d P
RT
Vn⋅= (5-1)
where n is the number of moles of gas, V is the volume of the system (~10,000 cm3), R is the gas constant(82.06 cm3⋅atm/g-mol⋅K), T is the temperature (~326 K), and dP/dt is the rate of change in the pressuregiven by the slope of the regression line. The total amount of water released to the system during thePressure Rise Test is given by the integral of the above equation. Assuming a total period of 62 min, thetotal amount of water released was ~0.4 mg. Assuming a total surface area of ~8900 cm2 for the system(total surface area of the retort, sample boat, tubing, and an outer fuel element), and 1015 atoms per cm2 asthe monolayer gas density on surfaces, approximately two monolayer equivalents of H2O wereevaporated.
The results of the post-HVD pressure rise measurements are shown in Figure 5.4. Again, both thetotal pressure and the moisture pressure showed essentially linear increases with time, however withsignificantly lower slopes than observed for the earlier post-CVD test. The total pressure rise has aregression slope of ~0.04 Torr/hr, and the moisture pressure rise has a slope of ~0.07 mTorr/hr. The rateof increase in the total pressure is about a factor of three lower than observed in Runs 3 and 4, suggestingimproved system sealing.
The ratio of the water pressure rise to the total pressure rise is ~0.002, which is somewhat lower thanwould be expected just from humidity alone in air in-leakage from the cell environment (air at 20°C and25% relative humidity would yield a water pressure-to-total pressure ratio of ~0.007). A likelyexplanation for the low moisture pressure rise in the post-HVD test is that the previous vacuum drying ofthe fuel element at temperature (during CVD and HVD) resulted in the formation of hygroscopic specieswhich “gettered” most of the moisture from either air in-leakage or moisture remaining on the elementthat would otherwise have been released. A similar, but more noticeable effect was observed in Run 4.
Comparison of the pressure data from the two pressure rise tests indicates that the total pressure riseobserved in the initial post-CVD test is only partially caused by residual moisture and/or air in-leakage.The difference between the total pressure rise and the moisture pressure rise for the post-CVD test(~0.12 Torr/hr) is higher than can be explained by air in-leakage into the retort alone as measured in thepost-HVD test. This suggests that other sources of gas are responsible for some of the observed totalpressure rise in the post-CVD test. A slight increase in the signals for hydrogen and for xenon isotopeswere noted in the MS data during CVD.
5.3 Hot Vacuum Drying
The first segment of HVD, shown in Figure 5.5, includes the ramp and hold from ~50°C to ~80°C inflowing argon gas (325 cc/min) under partial vacuum. HVD-1 occurred over an ET of 1296 min to

5.7
Ela
psed
Tim
e (m
inut
es)
8400
8420
8440
8460
8480
8500
Moisture Partial Pressure (mTorr) 0.0
0.1
0.2
0.3
Retort Temperature (°C)
0100
200
300
Retort Pressure (Torr)
0.0
0.2
0.4
0.6
Tem
pera
ture
Moi
stur
e (0
.071
mT
orr/
hr)
Pre
ssur
e (0
.039
Tor
r/hr
)
Arg
on F
low
~ 0
cc/
min
Fig
ure
5.4.
Dry
ing
of S
NF
Ele
men
t 660
3M, H
ot V
acuu
m D
ryin
g –
Step
1

5.8
2781 min. The moisture pressure decreased steadily from ~400 mTorr to ~7 mTorr during the ~80°Cphase. Total system pressure was essentially constant over this first HVD phase at ~19 Torr. Total waterremoved was ~0.9 g.
The second HVD phase involved maintaining the same system conditions as in HVD-1, but raisingthe temperature slowly from ~80°C to ~400°C at a rate of 10°C/hr. HVD-2 occurred over an ET of2781 min to 4752 min, and is shown in Figure 5.6. During the temperature rise, the moisture pressureincreased, showing three diffuse peaks at ~130°C (~20 mTorr), ~173°C (~19 mTorr), and ~300°C(~10 mTorr). Total system pressure remained essentially constant at ~19 Torr. These peaks are anindication of water release from chemisorbed sites (i.e., hydrated species) at higher temperatures. Totalwater removed during the second phase of HVD was ~0.4 g, approximately one half of that removedduring the first phase.
The third and final phase of HVD is shown in the left-hand side of Figure 5.7 (ET of 4752 min to5325 min), and covered the temperature hold period at ~400°C. This period is characterized by a steadydecrease in the moisture pressure from ~1.3 mTorr to ~0.3 mTorr. Total water removed was ~30 mg.
Following the final HVD phase, the system was allowed to cool to ~50°C in preparation for the post-test pressure rise test discussed above. Water removed during the system cooldown was ~21 mg. Totalsystem pressure remained constant at ~18.5 Torr during HVD-3 and cooldown.
5.4 Gas Chromatograph Measurements
The GC was used to measure hydrogen in the sample gas during the HVD portion of the drying test,when argon was flowing through the system. It was not possible to sample for hydrogen using the gaschromatograph during the CVD portion of the test since that portion of the test was conducted with noflow of argon gas. As discussed earlier, the hydrogen concentration data have been converted from ppmvto Torr·l so that the absolute quantity of hydrogen gas released can be determined independent of argonflow rate. To determine the location of the hydrogen peaks during HVD, and the integrated amounts ofhydrogen involved with each peak, the HVD hydrogen data were deconvoluted using a commercial peakfitting program, PeakFit. A five-parameter asymmetrical fitting function (Pearson IV) was used to fiteach of the separate deconvoluted peaks.
Measured hydrogen release during the HVD segments of the drying test is shown in Figure 5.8.There are five main peaks, four of which occurred during the HVD-2 temperature ramp, and theremaining peak occurred during HVD-1 at ~80°C. Deconvolution of the data places the HVD-2 peaks attemperatures of ~127°C, ~160°C, ~253°C, and ~332°C. Approximately 770 Torr·l (~83 mg) of hydrogenwas released during the entire HVD process, over a time period of ~68 hr, with the majority beingreleased during HVD-2.
As described in Section 3.2.5, HVD-1 is nearly isothermal, and can therefore be used to provideinformation on reaction kinetics. During HVD-1, the hydrogen signal first increases, and then laterdecreases steadily with time. By contrast, the water signal decreases steadily with time during HVD-1.

5.9
Ela
psed
Tim
e (m
inut
es)
1400
1600
1800
2000
2200
2400
2600
2800
Moisture Partial Pressure (mTorr) 100
101
102
103
Retort Temperature (°C)
5060708090
Retort Pressure (Torr)
05101520
Tem
pera
ture
Moi
stur
e
Pre
ssur
e
Beg
in a
rgon
flow
(~
324
cc/
min
)
Fig
ure
5.5.
Dry
ing
of S
NF
Ele
men
t 660
3M, H
ot V
acuu
m D
ryin
g –
Step
2

5.10
Ela
psed
Tim
e (m
inut
es)
5000
5500
6000
6500
7000
7500
Moisture Partial Pressure (mTorr) 02468
Retort Temperature (°C)
0100
200
300
400
500
Retort Pressure (Torr)
05101520
Tem
pera
ture
Moi
stur
e
Pre
ssur
e
Arg
on F
low
~ 3
24 c
c/m
in
Fig
ure
5.6.
Dry
ing
of S
NF
Ele
men
t 660
3M, H
ot V
acuu
m D
ryin
g –
Step
3

5.11
Ela
psed
Tim
e (m
inut
es)
2000
3000
4000
5000
6000
Moisture Partial Pressure (mTorr) 10-1
100
101
102
103
Retort Temperature (°C)
0100
200
300
400
500
Hydrogen (Torr·l/min)
0.01
0.10
1.00
Tem
pera
ture
Moi
stur
e
Hyd
roge
n (G
C)
Hyd
roge
n (M
S)
Fig
ure
5.7.
Dry
ing
of S
NF
Ele
men
t 660
3M, H
ydro
gen
Rel
ease
Dur
ing
HV
D a
nd C
oold
own

5.12
The initial increase in the hydrogen release during the early part of HVD-1 occurs while the water releasewas decreasing rapidly, suggesting that oxidation of the fuel element by water is just beginning to occuras the bulk of the fuel element reaches 75°C. The correlation between the hydrogen and water signalsduring the latter part of HVD-1 suggests that the oxidation at this point is controlled by the availability ofwater.
The 127°C and 167°C peaks correlate closely with water releases at the same time and are likely dueto oxidation of the fuel by water. Approximately 182 Torr·l (20 mg) of hydrogen were released duringthe same period as the water release peaks. The molar ratio of water to hydrogen released during thewater release period (ET 2850 through 3700) is ~0.4. This implies that water is reacting with the fuel at arate higher than it is being released into the vacuum (and thus swept away with the argon flow past themoisture sensor). It is likely that the hydrogen released during this period is due to oxidation of fuel bywater released through oxy-hydrate decomposition in the corrosion regions or in isolated regions underthe cladding.
The 253°C peak is most likely due to the decomposition of uranium hydride. This is furthersupported by the observation that there is no correlation with the water signal during this period, and alsothat this is close to the expected temperature for UH3 decomposition (Cotton 1988). Additionally, only aweak xenon release peak is observed at this time. This is consistent with the hypothesis that thedecomposition of UH3 to uranium metal and hydrogen does not disrupt the crystal lattice of spent fuelmatrix sufficiently to release all the interstitial xenon. This assumes the initial formation of UH3 in thefuel released most of the interstitial fission gases. Conversely, oxidation of the uranium metal doesrelease xenon from the matrix. The quantity of hydrogen released due to UH3 decomposition is, therefore~61 Torr·l (6.6 mg), which equates to ~0.6 g of UH3.
A larger broad peak occurring at ~330°C is likely due to oxidation of uranium from a region in thefuel element under the cladding, which most likely split open during the temperature ramp during thistime. Total integrated hydrogen release under this peak is ~380 Torr·l (41 mg), representing the majorityof the total hydrogen release. The negative “spike” in the hydrogen data just before the peak at 330°C(ET ~4200) is regarded a “noise transient” and thus not included in the hydrogen release estimates.Similar peaks at ~260°C and 300°C (and greater temperatures) were also observed in the hydrogenrelease for the previous two fuel elements 0309M (Run 3) and 5744U (Run 4). The total quantity ofhydrogen released during HVD-2 (until just prior to 400°C) was ~712 Torr·l (~77 mg).
A small rise in the hydrogen release is also evident at a temperature close to 400°C, however it is notclear whether this is a hydrogen release “peak” as this occurred at the end of the temperature ramp cycle.A similar rise was observed during the drying of Element 0309M (Run 3). Approximately 52 Torr·l(6 mg) of hydrogen were released during the final phase of HVD.
5.5 Mass Spectrometer Measurements
The drying system was designed so that the Balzers Omnistar MS could be used in conjunction withthe GC to collect hydrogen and other gas release data over the test run. As is evident in Figure 5.8, the

5.13
MS hydrogen signal showed the same general trends as the GC data, with the magnitude of the peaksbeing somewhat smaller. As has been observed in previous tests, this is likely due to differences in thecalibration pressure for the MS and the actual pressures encountered in these drying tests. Twomodifications are planned to resolve this issue: 1) replacement of the MS inlet pressure gauge with onethat is more accurate in this low pressure range, and 2) recalibration of the MS at lower inlet pressures.These modifications will allow for more accurate normalization of the MS to actual sampling pressures.The sudden decrease in the hydrogen signal at ~5300 ET corresponds with the start of the cooldownphase.
5.5.1 Fission Gas Releases
Fission gases such as xenon and krypton were also measured by the MS during the test. Monitoringof these gases can be useful in categorizing individual hydrogen releases as being from oxidation ofuranium by water or decomposition of metal hydrides. Measured 136Xe releases during HVD are shownin Figure 5.9 along with the corresponding hydrogen and water release signals. For purposes ofcomparison, the 136Xe data have been re-scaled and smoothed using a moving fourth-order polynomialprocedure (Savitzky-Golay).
Xenon is released from the spent fuel matrix during oxidation, and to a much smaller extent duringthe thermal decomposition of UH3. As can be seen, the general trends in the xenon release match similartrends in both the water and hydrogen releases. Both the xenon and hydrogen releases show a broad peakduring the isothermal phase of HVD at ~80°C. In addition, the xenon peaks at ~3300 ET, ~3900 ET, and~4200 ET correspond closely with similar hydrogen and water release peaks, further supporting oxidationof the fuel by released moisture. Except for the broad peak at ~1600 ET, the xenon peaks tend to benarrower than the hydrogen peaks, suggesting combined hydrogen release by more than one mechanism(hydride decomposition and fuel oxidation) or that the heavier fission gases are swept from the retortmore quickly than hydrogen.
5.5.2 ORIGEN2 Calculations
It is also of interest to compare the magnitudes and isotopic composition of the various xenonisotopes released to that expected from fission product generation in the fuel. For this purpose, theORIGEN2 computer code was used to calculate all stable and radioactive isotopes in both Mark 1A andMark IV N-Reactor fuel (Schwarz 1997). Calculations were performed for 240Pu levels ranging from 6 to16% of plutonium in both types of fuel. For Mark IA fuel, this corresponds to exposures ranging from1005 to 3619 MWD at a power level of 10.05 MW. For Mark IV fuel, the exposures ranged from 811 to2921 MWD at a power level of 8.11 MW. Modifications were made to the nuclear cross-section libraries
243Am and Cm. Calculations for the krypton andxenon isotopes are shown Table 5.2. Results are given in grams per metric ton of equivalent to wppm. Total xenon varies from 172 to 754 wppm for the various cases whereas totalkrypton is considerably lower at 14.5 to 57.5 wppm for the same reactor exposures. Figure 5.10 shows
dependency.

5.14
Ela
psed
Tim
e (m
inut
es)
2000
3000
4000
5000
6000
Moisture Partial Pressure (mTorr)
0102030
Hydrogen (Torr·l/min)
0.00
0.25
0.50
0.75
Moi
stur
e
Hyd
roge
n (G
C)
Xen
on (
MS
- s
moo
thed
) ar
bitr
ary
units
Fig
ure
5.8.
Dry
ing
of S
NF
Ele
men
t 660
3M, N
orm
aliz
ed X
enon
Rel
ease
Dur
ing
HV
D

5.15
Table 5.2. Calculated Xenon Isotope Generation in Mark IA and IV N-Reactor Fuel (ORIGEN2)
Mark IA N-Reactor FuelMWD 1005.2 1674.6 2512.9 3618.6
Pu-240 6% Wt% 9% Wt% 12% Wt% 16% Wt%Kr-80 4.72E-06 0.00% 9.54E-06 0.00% 1.69E-05 0.00% 2.78E-04 0.00%Kr-81 1.67E-07 0.00% 4.19E-07 0.00% 8.57E-07 0.00% 1.60E-06 0.00%Kr-82 4.59E-03 0.03% 1.15E-02 0.04% 2.39E-02 0.06% 4.55E-04 0.00%Kr-83 2.43E+00 13.76% 3.89E+00 13.61% 5.59E+00 13.43% 7.58E+00 13.18%Kr-84 4.79E+00 27.12% 7.84E+00 27.44% 1.16E+01 27.81% 1.63E+01 28.31%
Kr-85(a) 1.22E+00 6.91% 1.97E+00 6.89% 2.85E+00 6.84% 3.90E+00 6.78%Kr-86 9.22E+00 52.19% 1.49E+01 52.03% 2.16E+01 51.87% 2.98E+01 51.73%
Kr-Sum 1.77E+01 2.86E+01 4.16E+01 5.75E+01Xe-128 5.02E-03 0.00% 1.52E-02 0.00% 3.69E-02 0.01% 8.29E-02 0.01%
Xe-129(b) 7.51E-06 0.00% 1.83E-05 0.00% 4.62E-05 0.00% 1.24E-04 0.00%Xe-130 2.94E-02 0.01% 8.21E-02 0.02% 1.89E-01 0.04% 4.02E-01 0.05%Xe-131 2.26E+01 10.94% 3.78E+01 10.92% 5.63E+01 10.77% 7.94E+01 10.53%Xe-132 3.48E+01 16.86% 5.93E+01 17.14% 9.14E+01 17.47% 1.35E+02 17.89%Xe-134 5.93E+01 28.72% 9.86E+01 28.48% 1.48E+02 28.29% 2.12E+02 28.08%Xe-136 8.97E+01 43.47% 1.50E+02 43.43% 2.27E+02 43.43% 3.28E+02 43.43%Xe-Sum 2.06E+02 3.46E+02 5.23E+02 7.54E+02
I-127 1.85E+00 22.29% 3.26E+00 22.66% 5.19E+00 23.00% 7.88E+00 23.37%I-129 6.43E+00 77.71% 1.11E+01 77.34% 1.74E+01 77.00% 2.58E+01 76.63%I-Sum 8.28E+00 1.44E+01 2.26E+01 3.37E+01
Mark IV N-Reactor FuelMWD 811.4 1351.8 2028.5 2921.1
Pu-240 6% Wt% 9% Wt% 12% Wt% 16% Wt%Kr-80 4.19E-06 0.00% 8.53E-06 0.00% 1.51E-05 0.00% 2.49E-05 0.00%Kr-81 1.61E-07 0.00% 3.96E-07 0.00% 8.03E-07 0.00% 1.48E-06 0.00%Kr-82 4.03E-03 0.03% 9.99E-03 0.04% 2.06E-02 0.06% 3.92E-02 0.08%Kr-83 2.01E+00 13.86% 3.21E+00 13.72% 4.62E+00 13.57% 6.27E+00 13.35%Kr-84 3.94E+00 27.16% 6.43E+00 27.49% 9.48E+00 27.85% 1.33E+01 28.32%
Kr-85(a) 1.00E+00 6.89% 1.61E+00 6.88% 2.33E+00 6.84% 3.18E+00 6.77%Kr-86 7.55E+00 52.05% 1.21E+01 51.86% 1.76E+01 51.67% 2.42E+01 51.48%
Kr-Sum 1.45E+01 2.34E+01 3.40E+01 4.70E+01Xe-128 4.37E-03 0.00% 1.32E-02 0.00% 3.20E-02 0.01% 7.14E-02 0.01%
Xe-129(b) 6.89E-06 0.00% 1.65E-05 0.00% 4.07E-05 0.00% 1.07E-04 0.00%Xe-130 2.55E-02 0.01% 7.12E-02 0.02% 1.63E-01 0.04% 3.44E-01 0.05%Xe-131 1.90E+01 11.03% 3.19E+01 11.05% 4.76E+01 10.91% 6.72E+01 10.69%Xe-132 2.92E+01 16.97% 4.98E+01 17.26% 7.68E+01 17.59% 1.13E+02 18.01%Xe-134 4.93E+01 28.69% 8.19E+01 28.41% 1.23E+02 28.22% 1.76E+02 28.01%Xe-136 7.44E+01 43.29% 1.25E+02 43.25% 1.89E+02 43.23% 2.72E+02 43.22%Xe-Sum 1.72E+02 2.88E+02 4.37E+02 6.29E+02
I-127 1.64E+00 22.87% 2.90E+00 23.24% 4.62E+00 23.54% 7.00E+00 23.88%I-129 5.52E+00 77.13% 9.58E+00 76.76% 1.50E+01 76.46% 2.23E+01 76.12%I-Sum 7.15E+00 1.25E+01 1.96E+01 2.93E+01
(a) Kr-85 decays with a 10.76 yr half-life.(b) Xe-129 grows due to decay of I-129
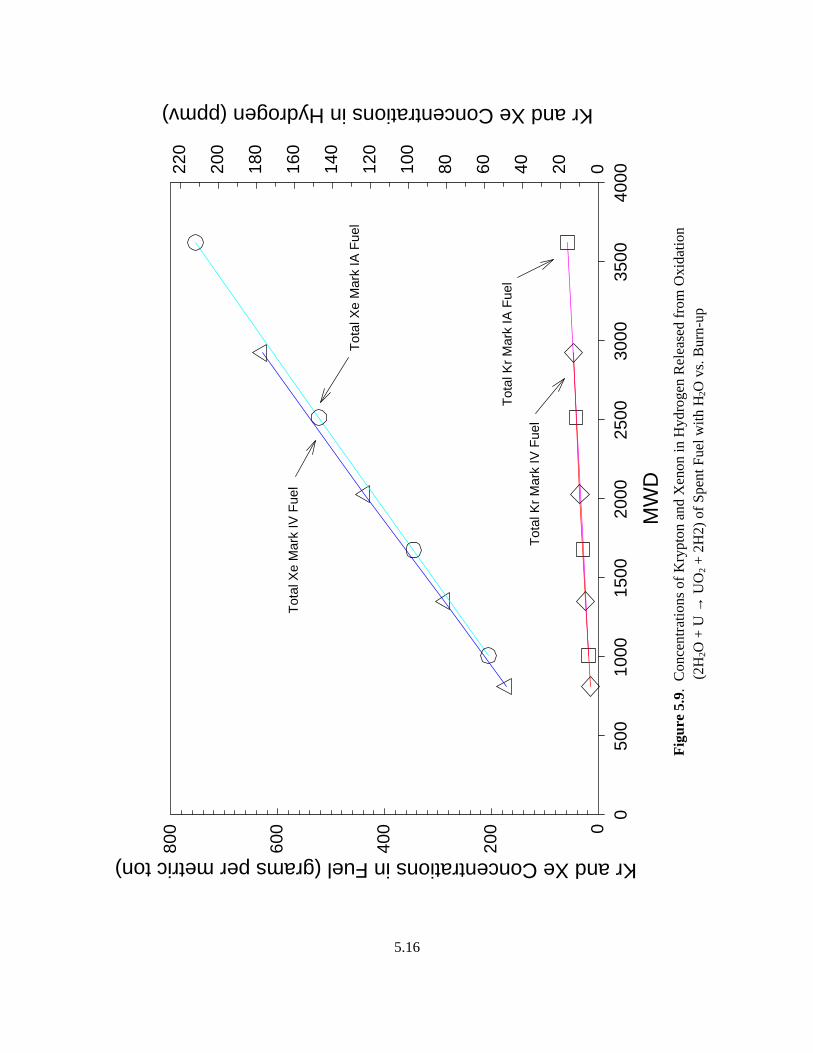
5.16
MW
D
050
010
0015
0020
0025
0030
0035
0040
00
Kr and Xe Concentrations in Fuel (grams per metric ton)
0
200
400
600
800
Kr and Xe Concentrations in Hydrogen (ppmv)
020406080100
120
140
160
180
200
220
Tot
al X
e M
ark
IV F
uel
Tot
al X
e M
ark
IA F
uel
Tot
al K
r M
ark
IV F
uel
Tot
al K
r M
ark
IA F
uel
Fig
ure
5.9.
Con
cent
ratio
ns o
f K
rypt
on a
nd X
enon
in H
ydro
gen
Rel
ease
d fr
om O
xida
tion
(2H
2O +
U →
UO
2 + 2
H2)
of
Spen
t Fue
l with
H2O
vs.
Bur
n-up

5.17
Krypton – Calculations for both types of fuel predict significant production of krypton isotopes atmasses 82, 83, 84, 85, and 86. Only very small quantities of 80Kr and 81Kr are produced. The relativeamounts of each isotope show surprisingly little variation with increasing exposure. 86Kr accounts forabout 52 wt% of the total krypton with 84Kr and 83Kr at about 27 wt% and 14 wt%, respectively. 85Kr hasa half-life of 10.76 years. At the end of each irradiation, the 85Kr amounts to about 6.8 wt% of thekrypton. However, this isotope will eventually decay to stable 85Rb, thereby increasing the relativeamounts of the other krypton isotopes accordingly. For example, after 20 years, the 85Kr would decreasefrom 6.8 wt% to about 1.9 wt% so that 86Kr would then increase from 52 wt% to about 55 wt% withsimilar increases in the other remaining krypton isotopes. 81Kr is also radioactive; however, the half-lifeis so long at 2.3E+5 years that this effect is not important.
Xenon – Calculations for both types of fuel are quite similar and, as with krypton, the relativeisotopic abundances show little variation with increasing exposure. The principal xenon isotopesproduced are at masses 131, 132, 134, and 136. Only trace amounts of 128Xe and 130Xe are produced. Inall cases, 136Xe has the highest abundance at about 43 wt% with 134Xe, 132Xe, and 131Xe at about 29 wt%,17 wt%, and 11 wt%, respectively. 129Xe is produced by the very slow decay of 129I (1.57E+7 years).This growth is so slow that the level of 129Xe will remain negligible.
As with the krypton, the xenon isotopic fractions are relatively insensitive to fuel type and burnup.On average, the relative weight fraction of masses 131, 132, 134, and 136 are 11%, 17%, 28%, and 43%,respectively. Figure 5.11 shows the MS data for masses 131, 132, 134, and 136 during the post-CVDpressure rise test. The slopes are standard error and are given in normalized signal units per minute sinceno absolute calibration was done for these specific xenon isotopes. This portion of the drying run had thelargest xenon signals. The data have been normalized by the mass 138 data to compensate for smallsignal changes due to overall pressure variations in the MS detector. Regression fits to the xenon isotopicdata are also shown in the figure along with the calculated regression slopes. Examination of theregression slopes yields relative xenon isotope release rates during the pressure rise test for masses 131,132, 134, and 136, of 13%, 19%, 29%, and 40%, respectively. These values are very close to thecalculated percentages above, with an average C/E (calculated-to-experimental) value of 0.94, with theerror probably due to uncertainties in the MS measurements. The standard errors for the four xenon MSsignals are ~3%.

5.18
Ela
psed
Tim
e (m
inut
es)
1200
1225
1250
1275
1300
Normalized Xenon Isotope Release 01234
Xe-
136
(slo
pe =
1.6
6 ±
0.0
4)
Xe-
134
(slo
pe =
1.2
0 ±
0.0
3)
Xe-
132
(slo
pe =
0.8
1 ±
0.0
3)
Xe-
131
(slo
pe =
0.5
3 ±
0.0
2)
Fig
ure
5.10
. D
ryin
g of
SN
F X
enon
Iso
tope
Rel
ease
Dur
ing
Post
-CV
E P
ress
ure
Ris
e T
est

6.1
6.0 Discussion
Approximately 4 ml of water were observed in the condenser during the condenser pumpdown phaseof CVD, in reasonable agreement with that calculated from the water release data over the same timeperiod. An additional ~0.4 mg of water was removed during the post-CVD pressure rise test. As thetemperature was only ~50°C, it is unlikely that metal oxy-hydrate decomposition was the source of thisadditional water. Therefore, this release can likely be interpreted as coming from free water that wastrapped and not completely released during CVD. Similar to earlier tests, the source of the total pressurerise observed in the post-CVD test was only partially from residual moisture, suggesting that othersources of gas are responsible for some of the total pressure rise observed in the post-CVD test. The stepappears to remove most of the free water.
During the first segment of HVD, approximately 0.9 g of water was removed at temperatures below~80°C. The second phase of HVD released approximately 0.4 g of water with three main peaks at~130°C, ~173°C, and ~300°C. The final phase of HVD at 400°C released only about 30 mg of water,with an additional ~21 mg of water released during post-HVD cool-down. This indicates that smallresidual quantities of water remained even after the drying test was completed.
The water released after the post-CVD pressure rise test is attributed chiefly to the release of waterfrom regions beneath the cladding and from under the corroded regions. Decomposition of metal oxy-hydrates may also account for some of this water. The pre- and post-run visual examinations indicatedthe presence of a coating on the fuel element, which changed color during the test. Most of the waterremoval occurred during the first phase of HVD which entailed the temperature ramp from ~50°C to~80°C. The peaks in the moisture release during HVD-2 indicates water release from chemisorbed sites(i.e., hydrated species) at higher temperatures or from isolated areas such as beneath the corrosion or thecladding. Similar to the previous run, thermal decomposition of the hydrated species was not the mostsignificant factor in controlling the removal of water from the system during the HVD. Rather, waterreleased from the element from isolated regions along a “tortuous path” may be the controlling factor inpost-CVD water removal. As observed in previous drying tests, a temperature above 400°C may berequired for complete drying of the fuel element within a reasonable period of time.
Hydrogen data was obtained from the gas chromatograph during HVD when argon was flowingthrough the system. Hydrogen was first observed starting at the ramp-up to ∼80°C, reaching a peak at80°C before dropping. Approximately 66 Torr·l (7 mg) of hydrogen were released during HVD-1.Hydrogen release increased again during the ramp from ~75°C to ~400°C, with four noticeable broadpeaks at ~127°C, ~159°C, ~253°C, and ~332°C, the first of which roughly corresponds to a similar waterrelease. The latter hydrogen release peak (~61 Torr·l (6.6 mg)) at ~ 256°C is due to uranium hydridedecomposition, and is equivalent to ~0.6 g of UH3 decomposed. Above ~256°C, the level of hydrogenbegan to increase with time, with ~370 Torr·l (40 mg) of hydrogen released during HVD-3. Totalhydrogen release during HVD was ~770 Torr·l (~83 mg).

6.2
Hydrogen data collected by the MS showed the same general trends as the GC data, but with themagnitude of the peaks being smaller. Unfortunately, the pressure sensor at the inlet to the MS used tocalculate the absolute hydrogen concentration was not accurate enough in the low range, hence theaccuracy of the MS hydrogen data is somewhat poorer than the GC data. The MS inlet pressure sensorwill be replaced with a more accurate sensor for future tests. Xenon data from the MS during HVDcorrelated well with corresponding water and hydrogen data, further supporting the argument thathydrogen release during HVD is due to a combination of oxidation of the fuel by released water, and bydecomposition of metal hydrides. Xenon isotopic release data collected during the post-CVD pressurerise test showed excellent agreement with xenon isotopic ratios calculated for N-Reactor fuel using theORIGEN2 computer code.

7.1
7.0 References
Cotton, F. A. 1988. Advanced Inorganic Chemistry. 5th Edition. John Wiley & Sons, New York.
CRC Press. 1997. Handbook of Chemistry and Physics. 78th Edition. New York.
Lawrence, L. A. 1997. Strategy for Examination of the 15 K-West Basin Fuel Elements. HNF-SD-SNF-SP-018, DE&S Hanford, Inc., Richland, Washington.
Ritter, G. A., S. C. Marchsman, P. J. MacFarlan, and D. A. King. 1998. Whole Element Furnace TestingSystem. PNNL-11807, Pacific Northwest National Laboratory, Richland, Washington.
Schwarz, R. A. 1997. Modification to ORIGEN2 for Generating N Reactor Source Terms.PNNL-11555, Pacific Northwest National Laboratory, Richland, Washington.
Westinghouse Hanford Company (WHC). 1995. Hanford Spent Nuclear Fuel Project IntegratedProcess Strategy for K Basins Spent Nuclear Fuel. WHC-SD-SNF-SP-005, Rev. 0.

8.1
8.0 Supporting Documents and Related Reports
Gerry, W. M. 1997a. Calibration of Mass Flow Controllers. SNF-TP-012, Rev. 0, Pacific NorthwestNational Laboratory, Richland, Washington.
Gerry, W. M. 1997b. Calibration of Balzer Quadstar Mass Spectrometer. SNF-TP-014, Rev. 0, PacificNorthwest National Laboratory, Richland, Washington.
Gerry, W. M. 1997c. Calibration of MTI Gas Chromatograph Model M200. SNF-TP-013, Rev. 0,Pacific Northwest National Laboratory, Richland, Washington.
Serles, J. A. 1997. Furnace Testing of N-Reactor Fuel Element 2660M. PTL-007, Rev. 0, PacificNorthwest National Laboratory, Richland, Washington.
Reports are written separately for the whole element drying test series as follows:
System Design Description for the Whole Element Furnace Testing SystemSpent Fuel Drying System Test Results (First Dry-Run)Spent Fuel Drying System Test Results (Second Dry-Run)Spent Fuel Drying System Test Results (Dry-Run in Preparation for Run 8 [Third Dry-Run])Drying Results of K-Basin Fuel Element 1990 (Run 1)Drying Results of K-Basin Fuel Element 3128W (Run 2)Drying Results of K-Basin Fuel Element 0309M (Run 3)Drying Results of K-Basin Fuel Element 5744U (Run 4)Drying Results of K-Basin Fuel Element 6603M (Run 5)Drying Results of K-Basin Fuel Element 1164M (Run 6)Drying Results of K-Basin Fuel Element 2660M (Run 7)Drying Results of K-Basin Fuel Element 6513U (Run 8).

PNNL-11841UC-602
Distr.1
Distribution
No. ofCopies
OFFSITE
C. L. BendixsenIdaho National Engineering and Environmental LaboratoryP.O. Box 1625Mail Stop 3135Idaho Falls, ID 83415
A. W. ConklinWashington State Department of HealthAirdustrial ParkBuilding 5, Mail Stop LE-13Olympia, WA 98504-0095
M. A. EbnerIdaho National Engineering and Environmental LaboratoryP.O. Box 1625Mail Stop 3114Idaho Falls, ID 83415
A. R. GriffithU.S. Department of Energy, Headquarters19901 Germantown Rd (EM-65)Germantown, MD 20585-1290
T. J. HullU.S. Department of Energy, Headquarters19901 Germantown Road (EH-34)Germantown, MD 20874-1290
M. R. LouthanSavannah River Technology CenterMaterials Technology CenterAiken, SC 29808
No. ofCopies
T. E. MadeyRutgers UniversityBldg. 3865136 Freylinghuysen RdPiscataway, NJ 08854
B. K. NelsonU.S. Department of Energy, Headquarters19901 Germantown Road (EM-65)Germantown, MD 20874-1290
R. G. Pahl, Jr.Argonne National LaboratoryP.O. Box 2528Idaho Falls, ID 83403
R. S. RosenLawrence Livermore National Laboratory20201 Century Blvd., 1ST FloorGermantown, MD 20874
D. SilverWashington State Department of EcologyP.O. Box 47600Olympia, WA 98504-7600
T. A. ThorntonYucca Mountain Project M&O ContractorSUM1/4231261 Town Center DriveLas Vegas, NV 89134

PNNL-11841UC-602
Distr.2
No. ofCopies
ONSITE
B&W Hanford
G. S. Barney T5-12
5 DOE Richland Operations Office
R. M. Hiegel S7-41P. G. Loscoe S7-41C. R. Richins K8-50J-S. Shuen S7-41G. D. Trenchard S7-41
6 Numatec Hanford Company
G. P. Chevrier H5-25T. Choho R3-86E. R. Cramer H0-34T. A. Flament H5-25J. J. Irwin R3-86C. R. Miska R3-86
23 Spent Nuclear Fuel Project
R. B. Baker H0-40S. A. Chastain H0-40D. R. Duncan R3-86J. R. Frederickson R3-86L. J. Garvin R3-26E. W. Gerber R3-11L. H. Goldmann R3-86
No. ofCopies
S. L. Hecht H0-40L. A. Lawrence (5) H0-40P. J. MacFarlan H0-40B. J. Makenas H0-40R. W. Rasmussen X3-85J. A. Swenson R3-11C. A. Thompson R3-86D. J. Trimble H0-40D. J. Watson X3-71J. H. Wicks, Jr. X3-74M. J. Wiemers R3-11SNF Project Files
30 Pacific Northwest National Laboratory
J. Abrefah (5) P7-27J. P. Cowin K8-88S. R. Gano K2-12W. J. Gray P7-27L. R. Greenwood P7-22B. D. Hanson P7-27G. S. Klinger (3) P7-22D. K. Kreid K7-80P. J. MacFarlan P7-27S. C. Marschman (3) P7-27B. M. Oliver P7-22T. M. Orlando K8-88L. R. Pederson K2-44J. K. Tarantino K9-41J. C. Wiborg K7-74Information Release (7)