pca ankita dubey
TRANSCRIPT

Principal Component
Analysis (PCA)
By: Ankita Dubey

Outline • Objective • PCA • Measuring Correlation • Correlation Matrix • PCA Algorithm • Example of feature extraction using PCA • PCA Advantages & Disadvantages • Applications in computer vision • PCA for image compression • Importance of PCA • References
4/7/2017 2 MPSTME, NMIMS, Mumbai

Objective of PCA
• To perform dimensionality reduction while preserving as much of the randomness in the high-dimensional space as possible
4/7/2017 3 MPSTME, NMIMS, Mumbai

Principal Component Analysis
• It takes your cloud of data points, and rotates it such that the maximum variability is visible.
• PCA is mainly concerned with identifying correlations in the data.
4/7/2017 4 MPSTME, NMIMS, Mumbai

Measuring Correlation
• Degree and type of relationship between any two or more quantities (variables) in which they vary together over a period
• Correlation can vary from +1 to -1.
• Values close to +1 indicate a high degree of positive correlation, and values close to -1 indicate a high degree of negative correlation.
• Values close to zero indicate poor correlation of either kind, and 0 indicates no correlation at all
4/7/2017 5 MPSTME, NMIMS, Mumbai

Beware: Correlation does not imply causation
4/7/2017 6 MPSTME, NMIMS, Mumbai

Correlation matrix
It shows at a glance how variables correlate with each other
4/7/2017 7 MPSTME, NMIMS, Mumbai

PCA Algorithm
Step 1: Column or row vector of size N2 represents the set of M images (B1, B2, B3…BM) with size N*N
Step 2: The training set image average (μ) is described as
(1)
4/7/2017 8 MPSTME, NMIMS, Mumbai

Contd.
Step 3: The average image by vector (W) is different for each trainee image
Wi = Bi - μ (2)
• Step 4: Total Scatter Matrix or Covariance Matrix
is calculated from Φ as shown below:
(3)
where A= [W1W2W3…Wn]
4/7/2017 9 MPSTME, NMIMS, Mumbai

Contd.
Step 5: Measure the eigenvectors UL and
eigenvalues λL of the covariance matrix C.
Step6: For image classification, this feature space can be utilized. Measure the vectors of weights
ΩT = [w1, w2, …, wM'], (4)
whereby, Hk = UkT (B - μ), k = 1, 2, …, M‘ (5)
4/7/2017 10 MPSTME, NMIMS, Mumbai

Example: Feature vector extraction
Step 1 : Given Images I1, I2, I3, I4, I5 of size (n×n).
Fig. (a) : Given 5 images
Step 2 : Find average of each image.

Contd.
Step 3 : Find zero mean Images. Subtract average image
from each pixel of an image to find zero mean
images.
Fig. (b) : Zero mean images

Contd.
Step 4: Conversion of zero mean images to one dimension array.
Fig. (c): Conversion of image to 1D array Thus we obtain 5 images in a vector form.
Fig. (d) : Vector form for 5 images

Contd.
Step 5 : Obtain covariance matrix.
Step 6 : Obtain eigen values and eigen vectors
for covariance matrix. Therefore,
Therefore,

Contd.
Solving this for λ we get,
Fig. (e) : Eigen vector of covariance matrix

Contd.
Step 7: Now,
Step 8 : Convert each fi into two dimensional image by
reversing the process of two dimensional to one
dimension. Thus we get 5 eigen fingerprint fi and
their energy µi
Fig. (f): Eigen images with energy
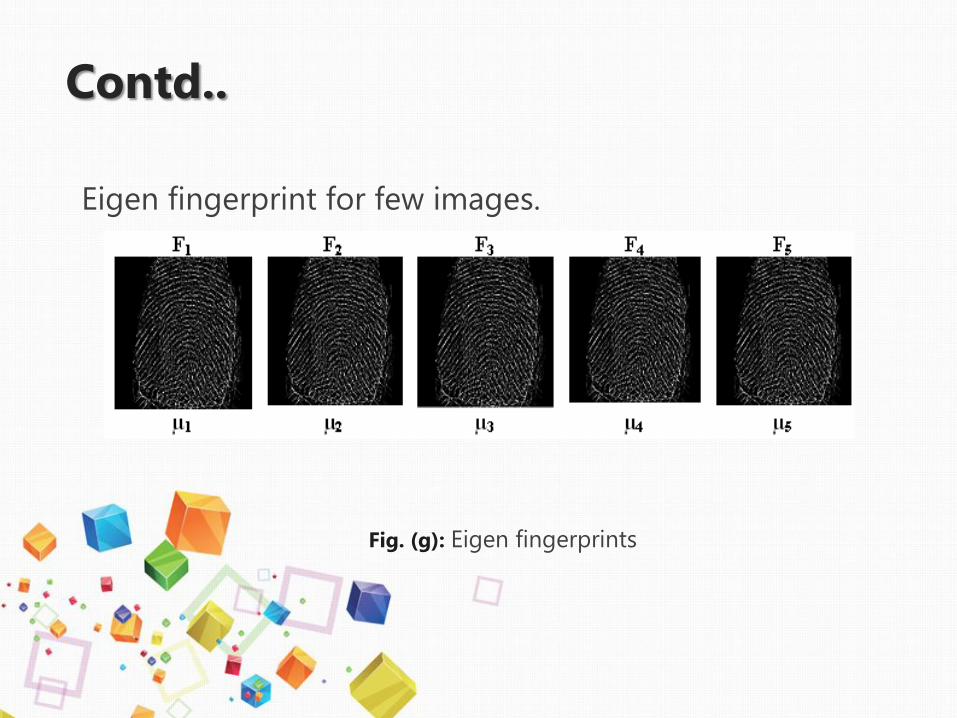
Contd..
Eigen fingerprint for few images.
Fig. (g): Eigen fingerprints

Contd.
Step 9 : These eigen fingerprint are used as basis functions to analyze any new fingerprint.
(7)
(8)
(9)
Step 10 : Stop.
4/7/2017 MPSTME, NMIMS, Mumbai 18

Algorithm for Identification using PCA Step 1 : Start. Step 2 : Input image. Step 3 : Identify EDT of an image. Step 4 : Identify Skeleton of an image. Step 5 : Find average of an image and subtract average from each pixel of an image. Step 6 : Conversion to one dimensional image (say I). Step 7 : Load orthogonal matrix and µ , which are obtained in feature vector extraction algorithm. Obtain I ' * Orthogonal matrix. And then divide this result by each diagonal element of µ, to obtain feature vector. Step 8 : Compare result with feature vector. Step 9 : Obtain match. Step 10 : End.

PCA
Disadvantages
• The covariance matrix is difficult to be evaluated in an accurate manner
• Even the simplest invariance could not be captured by the PCA unless the training data explicitly provides this information.
Advantages
• Low noise sensitivity • Decreased requirements for
capacity and memory • Lack of redundancy of data • Reduced complexity in
images • Smaller database
representation • Reduction of noise since the
maximum variation basis is chosen and so the small variations in the back-ground are ignored automatically
4/7/2017 20 MPSTME, NMIMS, Mumbai

PCA to find patterns-
• 20 face images: NxN size
• One image represented as follows-
• Putting all 20 images in 1 big matrix as follows-
• Performing PCA to find patterns in the face images
• Identifying faces by measuring differences along the new axes (PCs)
Applications in computer vision

• Compile a dataset of 20 images
• Build the covariance matrix of 20 dimensions
• Compute the eigenvectors and eigenvalues
• Based on the eigenvalues, 5 dimensions can be left out, those with the least eigenvalues.
• 1/4th of the space is saved.
PCA for image compression:
Importance of PCA
• In data of high dimensions, where graphical representation is difficult, PCA is a powerful tool for analysing data and finding patterns in it.
• Data compression is possible using PCA
• The most efficient expression of data is by the use of perpendicular components, as done in PCA.

References
• PCA by Ricardo Wendell
• An Overview of Principal Component Analysis by Sasan Karamizadeh, Shahidan M. Abdullah, Azizah A. Manaf, Mazdak Zamani, Alireza Hooman, Journal of Signal and Information Processing, 2013,
4/7/2017 24 MPSTME, NMIMS, Mumbai

4/7/2017 25 MPSTME, NMIMS, Mumbai

Any questions?
4/7/2017 26 MPSTME, NMIMS, Mumbai