paving the way for a transformational future - esmap.org bank publication... · the world bank. it...
TRANSCRIPT

Paving the Way for a Transformational FutureLessons from Jawaharlal Nehru National Solar Mission Phase I
Photo credit: Fortum Corporation
Disclaimer: The information and opinions presented herein are meant only for factual purposes and do not intend to reflect the situation or circumstance of any country or entity. While all efforts have been made in gathering information from reliable sources, neither ESMAP nor the World Bank should be held responsible for the accuracy of the data presented. The report has been discussed with the Government of India, but does not necessarily bear their approval for all its contents, especially where the World Bank has stated any judgment/opinion/policy recommendation.
© Copyright 2013
Energy Sector Management Assistance Program (ESMAP)1818 H Street, NW Washington, DC 20433 USATel: 1.202.458.2321, Fax: 1.202.522.3018Internet: www.worldbank.org/esmapEmail: [email protected]

ESMAP MISSION
The Energy Sector Management Assistance Program (ESMAP) is a global knowledge and technical assistance program administered by the World Bank. It provides analytical and advisory services to low- and middle-income countries to increase their know-how and institutional capacity to achieve environmentally sustainable energy solutions for poverty reduction and economic growth. ESMAP is funded by Australia, Austria, Denmark, Finland, France, Germany, Iceland, Lithuania, the Netherlands, Norway, Sweden, and the United Kingdom, as well as the World Bank.

Paving the Way for a Transformational FutureLessons from Jawaharlal Nehru National Solar Mission Phase I


iii
Paving the Way for a Transformational Future: Lessons from Jawaharlal Nehru National Solar Mission Phase I
Abbreviations and Acronyms vi
Acknowledgments viii
Executive Summary ix
1. A New Sunshine: Achievements of Grid-connected Solar Sector in India 1
1.1 Introduction 1 1.2 Jawaharlal Nehru National Solar Mission: An Overview 2 1.3 Key Achievements of JNNSM Phase I 5 1.4 State Solar Policies 8
2. Scaling up Under JNNSm: Barriers and Challenges 13
2.1 Lack of Participation of Scheduled Commercial Banks in Solar Financing 14 2.2 Bottlenecks in the Enabling Environment 16 2.3 Payment Security for Future Projects 17 2.4 Unintended Technology Outcomes of Phase I of JNNSM 18 2.5 Beleaguered Local Solar Manufacturing Industry 20 2.6 Adequacy of the Current Approach to Developing Solar Thermal Projects 24 2.7 Enforceability of RPOs and Concerns Around Solar RECs 24
3. JNNSm Phase II and Beyond: Essential Policy and Design Choices 27
3.1 Efficacy of Public Funding: Buying Down Tariffs vis-à-vis Addressing Structural Impediments to Financing 27
3.2 Promoting Local Manufacturing: Exploring Customized Industrial Policy Actions 35 3.3 Solar Thermal: Public Private Partnerships (PPPs) vis-à-vis Private-led Development 39 3.4 Role of Central Government: Co-development vis-à-vis Central Sector Projects 40 3.5 Development through Solar Parks (Cluster-based Approach) 43
4. Way Forward 45
5. Annexes 51
Contents

Paving the Way for a Transformational Future: Lessons from Jawaharlal Nehru National Solar Mission Phase I
iv
List of Annexes
Annex 1: Consultative Workshop Details and Key Messages 51Annex 2: Comparison of State Solar Policy Framework with JNNSM 57Annex 3: CSP Players and Status of Implementation 58Annex 4: JNNSM Auction Process and International Experience 59Annex 5: Funding Requirements for JNNSM Phase II 61Annex 6: PPA under JNNSM Phase I – Key Concerns 62Annex 7: Payment Security Scheme and NCEF 64Annex 8: Technology Factors in JNNSM Phase I 65Annex 9: Domestic Content Requirement 70Annex 10: Solar PV Manufacturing in India 72Annex 11: Solar Thermal Manufacturing in India 75Annex 12: International Experience in CSP Projects 77Annex 13: Overall Funds Requirement for JNNSM Phase I 80Annex 14: Key Incentives/Instruments for Solar Promotion in India 81Annex 15: Regulatory and Policy Provisions for Renewable Energy 82Annex 16: Competitive Bidding for Renewable Energy Projects 83Annex 17: Institutional Framework for the Solar Sector 85Annex 18: Gujarat Solar Park—A Case Study 88
List of Boxes
Box 1: Policy Actions for Promotion of Local Manufacturing 36Box A8 1: EC and EIB Support to CSP 66Box A10 1: Indian Manufacturing Landscape 72
List of Figures
Figure E1: PV and CSP Tariff Comparison Across Countries xFigure 1: JNNSM Objective and Strategy 3Figure 2: JNNSM Phase I Chronology of Events 3Figure 3: JNNSM Phase I Capacity Allocation Process 4Figure 4 : Status of JNNSM Capacity Additions—July 2013 6Figure 5: JNNSM Phase I Solar PV Tariff Trends 7Figure 6: JNNSM Phase I Solar Thermal Tariff Trends 7Figure 7: PV and CSP Tariff Comparison Across Countries 8Figure 8: Key Observations of Phase I of JNNSM 14Figure 9: Types of Debt Financing Available to Solar Developers 15Figure 10: Global Solar PV Market Trends 18Figure 11: JNNSM Phase I Solar PV Technologies Used 19Figure 12: Global Solar PV Production Overview—2012 Beginning 20Figure 13: Attractiveness of Solar PV Component Industries In India vis-à-vis
International Benchmarks 21

v
Paving the Way for a Transformational Future: Lessons from Jawaharlal Nehru National Solar Mission Phase I
Figure 14: Cost Comparison - Cell and Module (India, China and Other Asian Countries) 22
Figure 15: Present Local CSP Manufacturing Capability in India 23Figure 16: Attractiveness of CSP Component Industries in India vis-à-vis
International Benchmarks 23Figure 17: Solar RPO and Capacity Addition 25Figure 18: Role of Public Funding in Developmental Life-cycle of Technology 29Figure 19: Comparison of Subsidy Support for Public Financing Options 34Figure 20: Framework to Design Industrial Policy Actions 37Figure 21: Proposed Solar Thermal Roadmap under Subsequent Phases of JNNSM 40Figure A8 1: Global PV & CSP Capacity 65Figure A8 2: TF Market Growth and Polysilicon Spot Prices 67Figure A8 3: Share of TF in Overall PV Installed Capacity 68Figure A9 1: Solar PV Technology, Gujarat 71Figure A11 1: Action Plan for Local Manufacturing of CSP Components (India) 75Figure A12 1: Development of CSP, Spain 78Figure A12 2: Development of CSP, U.S. 79Figure A17 1: Central Institutions with Solar Sector 85Figure A18A: Gujarat Solar Park Layout Plan 88
List of Tables
Table 1: JNNSM Roadmap 2Table 2: Cost of Bundled Power under JNNSM 5Table 3: Solar Policy Capacity Targets and Status 9Table 4: Installed Solar Capacities (MW) under Various Schemes 10Table 5: Direct Support Instruments 30Table 6: Facilitating Public Funding Mechanisms 32Table 7: Analytical Framework for Analyzing Financial Instruments/Mechanism 33Table 8: Institutional Gaps 42Table A2 1: Comparison of State Solar Policies with JNNSM 57Table A3 1: CSP Projects and Implementation Status 58Table A4 1: JNNSM Phase I—Bidding Chronology 59Table A4 2: Level of Participation—JNNSM Phase I 59Table A4 3: Capacity Auction Structure—International Experience 60Table A5 1: Indicative Funding Requirement for Phase II (Central Scheme) 61Table A6 1: PPA under JNNSM Phase I—Key Concerns 62Table A8 1: Comparison of PV and Thin Film Technologies 67Table A9 1: National Experience, DCR 70Table A9 2: International Experience, DCR 71Table A10 1: Performance of Indian Solar PV Manufacturers 73Table A10 2: Solar PV Market—Global and Indian 74Table A12 1: International Experience, CSP Projects 77Table A13 1: Overall Funding Requirement for JNNSM Phase I 80Table A14 1: Key Incentives for Solar Promotion in India 81

Paving the Way for a Transformational Future: Lessons from Jawaharlal Nehru National Solar Mission Phase I
vi
ADB Asian Development BankBG Bank GuaranteeBNEF Bloomberg New Energy
FinanceBOOM Build Own Operate ManageBOOT Build Own Operate
TransferBoS Balance of SystemsCdTe Cadmium tellurideCEA Central Electricity
AuthorityCERC Central Electricity
Regulatory CommissionCoD Commercial Operation
DateCoE Centre of Excellencec-Si Crystalline Silicon CSP Concentrating Solar Power
or solar thermalCSTP Concentrated Solar
Thermal PowerC-WET Centre for Wind Energy
TechnologyDCR Domestic Content
RequirementDIPP Department of Industrial
Policy and PromotionDiscom Distribution companyDNI Direct Normal IrradianceEC European CommissionEIB European Investment BankEPC Engineering Procurement
and ConstructionEPIA European Photovoltaic
Industry AssociationEXIM Export-ImportFICCI Federation of Indian
Chambers of Commerce and Industry
FiT feed-in tariffFSR Financial Stability ReportFY Financial YearGBI Generation based IncentiveGBS Gross Budgetary SupportGDP Gross Domestic ProductGEDA Gujarat Energy
Abbreviations and Acronyms
OPIC Overseas Promotion and Investment Corporation
PBG Performance Bank Guarantee
PPA Power Purchase AgreementPPP Public Private PartnershipPSA Power Sale AgreementPSS Payment Security SchemePTC Parabolic-trough collectorPV PhotovoltaicR&D Research and DevelopmentRBI Reserve Bank of IndiaREC Renewable Energy
CertificateRFP Request for ProposalRfS Request for SelectionRPO Renewable Purchase
ObligationRPS Renewable Portfolio
StandardRPSSGP Rooftop PV and Small
Solar Generation Programme
SCB Scheduled Commercial Bank
SEC Solar Energy CentreSECI Solar Energy Corporation
of IndiaSEGS Solar Energy Generating
SystemSNA State Nodal AgencySPO Solar Purchase ObligationSPSA Solar Payment Security
Account STU State Transmission Utilitysq m square meterSRRA Solar Radiation Resource
AssessmentT&D Transmission and
DistributionTF Thin FilmVGF Viability Gap FundingW WattWp Watt peakWTO World Trade Organization
Development AgencyGERC Gujarat Electricity
Regulatory Commission GoI Government of IndiaGPCL Gujarat Power
Corporation Ltd.GW gigawattHT High TensionIDFC Infrastructure
Development Finance Company
IFC International Finance Corporation
IREDA Indian Renewable Energy Development Agency
JNNSM Jawaharlal Nehru National Solar Mission
kg kilogramkV kilovoltkWh kilowatt hourL&T Larsen and ToubroLC Letter of CreditLCR Local Content
RequirementMNRE Ministry of New and
Renewable EnergyMoF Ministry of FinanceMoP Ministry of PowerMT metric tonMW megawattNAPCC National Action Plan for
Climate ChangeNBFC Non-Banking Finance
CompanyNCEF National Clean Energy
FundNMCC National Manufacturing
Competitiveness Council NOC No Objection CertificateNPA Non-Performing AssetNTPC National Thermal Power
CorporationNVVN NTPC Vidyut Vyapar
NigamO&M Operation and
Maintenance
Currency Conversion: 1 US$ = INR 60

vii
Paving the Way for a Transformational Future: Lessons from Jawaharlal Nehru National Solar Mission Phase I
The preparation of this report—Paving the Way for a Transformational Future: Lessons from Jawaharlal Nehru National Solar Mission (JNNSM) Phase I—was led by Ashish Khanna (Lead Energy Specialist, SASDE) and Kanv Garg (Energy Analyst, SASDE), both from the World Bank’s South Asia Sustainable Development Energy Unit.
At the request of the Ministry of New and Renewable Energy (MNRE), the World Bank has undertaken a study to document the experiences during the implementation of JNNSM and gather lessons for the implementation of the subsequent phases. The report draws from an underlying study prepared by the staff of Deloitte Touche Tohmatsu India Private Limited, who interacted with government agencies, solar power developers, financial institutions, and other stakeholders in the solar space in India to share data and firsthand experiences.
We especially wish to thank Vijay Iyer (Director, SEGEN) and Jyoti Shukla (Senior Manager, SASSD) for their support to the study. The team would also like to thank the peer reviewers—Nataliya Kulichenko (Senior Energy Specialist, AFTG1), Gabriela Elizondo Azuela (Senior Energy Specialist, SEGEN), Silvia Martinez Romero (Senior Renewable Energy Specialist, SEGES), Joerie Frederik de Wit (ET Consultant, SEGEN), Soumya Banerjee (Senior Investment Officer, IFC), Chandrasekeren Subramaniam (Senior Power Engineer, IFC), and Gaetan Tiberghien (Senior Investment Officer, IFC)—for their insightful inputs and assistance during the preparation of the study.
We gratefully acknowledge the cooperation and generous help rendered by officials and counterpartsin MNRE—Mr. R.N. Watal, Mr. Tarun Kapoor, and Dr. Ashvini Kumar—who provided guidance andtechnical inputs through the assignment.
This team is grateful for the funding received from the Energy Sector Management Assistance Program (ESMAP) for the study.
Acknowledgements


ix
Paving the Way for a Transformational Future: Lessons from Jawaharlal Nehru National Solar Mission Phase I
Renewable energy, especially solar power, has been garnering a lot of interest from governments, international development organizations, civil society, and the private sector for the last few years. There has been a huge surge in the popularity of this important energy source from various stakeholders in India as well.
In India, with rising levels of technology maturity, and cost competitiveness, solar power is attracting investments from the private sector. On the other hand, solar power presents a formidable option for addressing pertinent issues being faced in international geopolitical and national macro-economic arenas for the Government of India (GoI).
On the national front, firstly, solar power stands to partially address the issue of shortage of power for economic growth. There is an established positive correlation between energy requirement and Gross Domestic Product (GDP) growth. With energy shortages in excess of 10 percent and with more than 300 million people without access to energy, solar power can potentially address the shortage by both adding to the grid-connected electricity supply and providing a viable energy solution for off-grid areas. Secondly, closely related to the first point, solar power can foster energy security for India by reducing dependence on imported fuel. This will further help in reducing the current account deficit for the country. Grid-connected and off-grid solar power can partially replace the need for imported coal and diesel requirement to power the economy.
On the international front, firstly, India has already demonstrated that it is an industrial low-cost destination worldwide. It has the potential to
Executive Summary
capture cost reduction leadership for solar power as well. Domestic manufacturing and scale of implementation in India can cause a drastic fall in costs to bring solar power costs to grid parity sooner than other parts of the world. Secondly, cleaner energy production through solar power also contributes to India’s international commitment in Copenhagen in 2009 to reduce the emissions per unit of its GDP by 20-25 percent by 2020 over 2005 levels. India is currently the world’s seventh largest emitter of global warming pollution and fifth largest for emissions from fossil fuel combustion.1
Though the World Bank, India considers all market segments of solar power to be important; this report specifically looks at the utility-scale grid-connected segment of solar power in India.
Achievements of JNNSM Phase I
As one of the eight missions under India’s National Action Plan for Climate Change (NAPCC), the Jawaharlal Nehru National Solar Mission (JNNSM) was launched in January 2010 with the aim of accelerating India’s march toward grid parity in solar power. JNNSM envisages the achievement of grid parity through long-term and predictable policy, large-scale deployment, aggressive Research and Development (R&D), and domestic production of critical materials, components, and products along the value chain. Considering that India is blessed with immense solar potential, JNNSM can serve as a crucial element of India’s response to the challenges of energy security and climate change.
Phase I (2010-13) of JNNSM, still under implementation, experienced enthusiastic
1 http://www.nrdc.org/international/copenhagenaccords/
Paving the Way for a Transformational Future: Lessons from Jawaharlal Nehru National Solar Mission Phase I
x
participation from Indian and international investors in the grid-connected segment with substantial discounts to the benchmark tariffs determined by the Central Electricity Regulatory Commission (CERC) for 500 megawatt (MW) each of solar thermal and solar Photovoltaic (PV) projects. Power from these solar projects is being bundled with conventional power from the unallocated quota of power from coal-based stations of the National Thermal Power Corporation (NTPC) on equal capacity basis. The bundling of solar power with cheaper conventional power reduces the tariff impact of solar power on the distribution utilities.
Another unique feature of JNNSM Phase I has been the adoption of a reverse auction method for awarding projects to qualified bidders. The bidding process has been able to fully realize the benefits of declining module prices in the global market and declining demand in key economies, leading to surplus supply in the international market. JNNSM has been instrumental in bringing the purchase price of both PV and Concentrating Solar Power (CSP) to a level that is competitive across the world. The levelized tariffs discovered through the competitive process have been far lower than
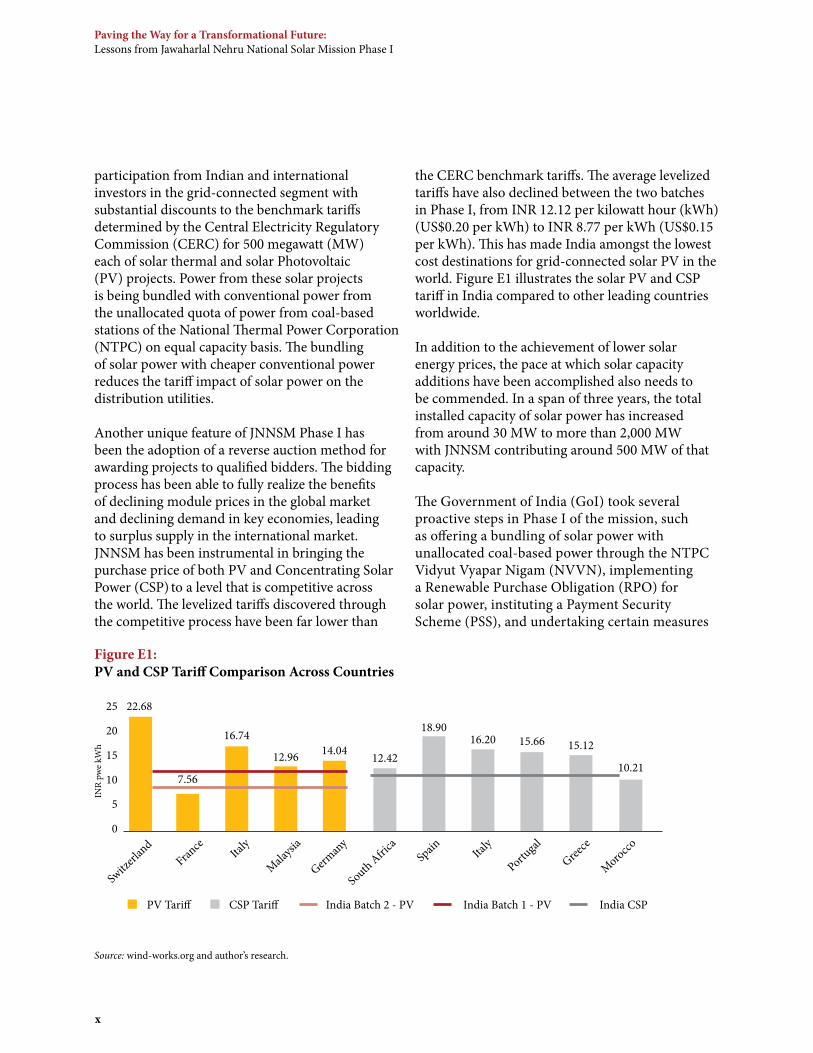
the CERC benchmark tariffs. The average levelized tariffs have also declined between the two batches in Phase I, from INR 12.12 per kilowatt hour (kWh) (US$0.20 per kWh) to INR 8.77 per kWh (US$0.15 per kWh). This has made India amongst the lowest cost destinations for grid-connected solar PV in the world. Figure E1 illustrates the solar PV and CSP tariff in India compared to other leading countries worldwide.
In addition to the achievement of lower solar energy prices, the pace at which solar capacity additions have been accomplished also needs to be commended. In a span of three years, the total installed capacity of solar power has increased from around 30 MW to more than 2,000 MW with JNNSM contributing around 500 MW of that capacity.
The Government of India (GoI) took several proactive steps in Phase I of the mission, such as offering a bundling of solar power with unallocated coal-based power through the NTPC Vidyut Vyapar Nigam (NVVN), implementing a Renewable Purchase Obligation (RPO) for solar power, instituting a Payment Security Scheme (PSS), and undertaking certain measures
Source: wind-works.org and author’s research.
Figure E1: PV and CSP Tariff Comparison Across Countries
25
20
15
10
5
0
INR
pwe
kWh
PV Tariff CSP Tariff India Batch 2 - PV India Batch 1 - PV India CSP
Switz
erlan
dFran
ce Italy
Malaysi
a
German
y
South Africa
Spain Ita
ly
Portugal
Greece
Morocco
22.68
7.56
16.74
12.96 14.04 12.42
18.9016.20 15.66 15.12
10.21

xi
Paving the Way for a Transformational Future: Lessons from Jawaharlal Nehru National Solar Mission Phase I
for promoting local manufacturing, which all combined to ensure the success of Phase I. Starting with the state of Gujarat and buoyed by the success of Phase I, several other states have also instituted state-level policies for encouraging solar energy. Gujarat has been a forerunner in solar capacity addition with Asia’s largest solar park located in Charanka, constituting over 500 MW of multi-investor, multi-technology solar capacity addition at one location.
Amidst developments triggered by Phase I of JNNSM and the Gujarat Solar Policy, it is important to keep sight of JNNSM’s overall objectives, which—apart from targeting a capacity of 20 gigawatt (GW) by 2022—aims at positioning India as a major power in solar manufacturing and R&D. Against this backdrop, the World Bank, in consultation with the Ministry of New and Renewable Energy (MNRE), instituted a study to identify the key barriers and constraints that could come in the way of scaling up the grid-connected solar program to levels envisaged in the subsequent phases of JNNSM.
The study, which culminated in the submission of this report, is based on consultations with key stakeholders and aims to provide an analytical lever to GoI in evaluating certain key policy debates that have emerged at this juncture.
Scaling up under JNNSM: Barriers and Challenges
Phase I of JNNSM, with a capacity target of 1 GW, was positioned to be a cautious beginning in India’s ambitious journey toward 20 GW of capacity addition by the end of Phase III of JNNSM by 2022. Viewed in this context, it is essential to identify and address the key challenges faced by the stakeholders, which could prevent the program from reaching and, possibly exceeding, the scaled-up targets over subsequent phases of JNNSM.
Amongst the issues identified as critical by most stakeholders, which require closer attention and resolution, are the following:
1. Lack of adequate participation of Scheduled Commercial Banks in solar financing
Scheduled Commercial Banks (SCBs) mostly shied away from financing projects under Phase I of JNNSM, with export credit agencies, multilateral financial institutions, and some nonbanking financial institutions accounting for the bulk of debt financing over Phase I of JNNSM, as well as for projects under the Gujarat Solar Policy. Financing of most solar projects also happened on the basis of limited to full recourse.
Infrastructure lending in India, in the absence of an active debt market, has been led by SCBs, which account for more than 80 percent of such debt disbursements. Taking this financing landscape of Indian infrastructure into account, it is inconceivable for JNNSM to scale up to the levels envisaged under subsequent phases and beyond without the active participation of SCBs.
This remains the most significant concern for JNNSM. SCBs consulted during the study indicated several risks that they continue to perceive in lending to solar projects, particularly in the absence of any risk-reducing mechanisms. They also pointed out the crowding out effect of concessional sources of financing in the form of supplier’s credit and direct lending by development banks, without the availability of concessional lines of credit for SCBs.
Phase II of JNNSM is likely to witness a huge scaling up of financing requirement with around US$4.1 billion required for building 3,600 MW of capacity under the central scheme. Another 6,400 MW is proposed to be developed under the state schemes which would further increase the financing requirement of the solar sector.
2. Bottlenecks in the enabling environment
Developers and financiers outline several key bottlenecks in the enabling environment, which have persisted despite significant efforts from MNRE and State Nodal Agencies (SNAs). These

Paving the Way for a Transformational Future: Lessons from Jawaharlal Nehru National Solar Mission Phase I
xii
relate to land acquisition and converting land use designations, delays in approvals and clearances at the state level, limited field-level data availability on solar irradiation, nonavailability of support infrastructure pertaining to water and power evacuation, limited coordination between the central and state institutions, and the absence of a clear mapping of responsibilities of institutions in the public domain.
3. Payment security for future projects
The Phase I policy provided a robust commercial framework with the bundling of 1,000 MW of solar power with 1,000 MW of unallocated coal-based generation capacity from NVVN, which acted as the counterparty to all contracts, and the institution of a PSS, backed by budgetary support from GoI, which assisted in guarding the interests of developers against defaults by distribution utilities.
Bundling is no longer a major option, with limitations on unallocated power. As per JNNSM Phase II Batch I guidelines, the Solar Energy Corporation of India (SECI) shall set up a payment security mechanism to ensure timely payment to the developers. The rules to operate this fund will be framed by MNRE. Although the rapidly decreasing tariff scenario in solar power and increasing knowledge and exposure of all stakeholders shall reduce the need for PSS over time, payment security remains a concern for Phase II. This is because of the increasing concentration of solar projects in some states and the weak financials of distribution utilities in most states in India.
4. Unintended technology outcomes over Phase I
PV technology is broadly classified into Crystalline Silicon (c-Si) and Thin Film (TF). The latter, which emerged as a lower cost option in the era of rising polysilicon prices, has been steadily losing ground over the past few years as c-Si experienced a dramatic decline in prices. From a one-time high of about 30 percent market share, TF accounted for 11 percent of the global PV market at the end of 2011.
Compared with this global scenario, Phase I of JNNSM saw TF accounting for close to 70 percent of PV installations, due to a combination of two factors. First, a Domestic Content Requirement (DCR) under the Phase I policy required c-Si cells and modules to be mandatorily procured from domestic manufacturers over Batch 2, while waiving such requirement for TF owing to the low TF manufacturing base in India. Second, established TF suppliers based out of the United States were ready to supply competitively priced TF modules along with the provision of low-cost, long-tenor debt from the Export-Import (EXIM) Bank of the United States. Faced with an economically attractive option and supply from more established and proven U.S. suppliers compared with domestic manufacturers, developers opted widely for TF.
DCR, which was intended to promote local manufacturing, has thus not been able to provide adequate support to local manufacturers.
5. Beleaguered local solar manufacturing environment
An important objective of JNNSM is to develop India into a major force in low-cost, high-quality solar manufacturing. In Phase I, to provide support to domestic manufacturers, GoI included a DCR for both c-Si and solar thermal-based projects. As is now apparent, this measure did not contribute significantly to the revival of the domestic solar PV manufacturing industry, which continues to operate at an average capacity utilization of less than 50 percent.
Several solar PV manufacturers in India currently face issues related to lack of raw materials, nonavailability of low-cost financing, and an underdeveloped supply chain leading to high inventory costs. Problems faced by local PV manufacturers are multi-fold and have been summarized in the report. Without a comprehensive industrial policy to address

xiii
Paving the Way for a Transformational Future: Lessons from Jawaharlal Nehru National Solar Mission Phase I
all fundamental aspects of competitiveness, DCR alone is unlikely to revive Indian PV manufacturing.
Local manufacturing in solar thermal is complex, as the value chain is globally characterized by oligopolies with technology and product patents. India holds significant potential for emerging as a low-cost destination for solar thermal, as it can exploit the linkages this industry holds with more established industries in India, such as automotive, glass, metal, chemicals, power equipment, process heat, and construction. This, however, requires coordinated ecosystem development, with adequate technology partnerships to move existing industries to commit to such manufacturing.
6. Adequacy of the current approach to developing solar thermal projects
The framework for award of projects under Phase I of JNNSM, similar to that for solar PV, was a reverse auction, which awarded seven projects totaling 470 MW under Batch I. Solar thermal with less than 2.5 GW of installations globally is, however, far from commercially viable compared with solar PV with over 100 GW of installed capacity globally.
Solar thermal projects require a range of preparatory activities including several clearances and consents, detailed field studies as well as on-field Direct Normal Irradiance (DNI) measurement. In the above context and given the initial phase of development of solar thermal technologies in India, it is worth examining whether the existing framework for awarding projects is adequate or a different disposition is required.
7. Enforceability of RPOs and concerns around solar Renewable Energy Certificates
Although several State Electricity Regulatory Commissions have mandatory regulations specifying RPOs, they have so far been lenient in imposing penalties for noncompliance by
distribution utilities. This threatens the very basis of JNNSM as well as other renewable energy programs in the country.
The pricing of solar Renewable Energy Certificates (RECs) is another matter of concern. The current REC framework has a base price range specified up to 2017, and in a rapidly declining solar tariff regime, there are genuine concerns that a purely short-term and market-based REC mechanism will not ensure cash flows to justify long-term investments. These issues are being examined seriously by MNRE and CERC and changes are likely in the near future.
JNNSM Phase II and Beyond: Essential Policy and Design Choices
1. Efficacy of public funding: “buying down” tariffs vis-à-vis addressing structural impediments to financing
Adequately structured public funding is essential to move the solar industry forward, given the evolutionary nature of solar PV and CSP technologies, their higher cost, and the risk perception amongst private investors and financiers in this segment.
Public funding is faced with a choice of two options of supporting the solar program under JNNSM:
• Buy-downthecostofsolargenerationbyfinancing the incremental cost of solar. This is a direct, project-level involvement of the government, financed through instruments such as capital subsidy, Generation-Based Incentive (GBI) or Viability Gap Funding (VGF), and so on; and
• Addressorcoverrisksthatareimpedimentsto investments or optimal financing of solar projects. This could be achieved through structured public debt, risk funds and guarantees to address specific barriers/risks perceived by the lending community.

Paving the Way for a Transformational Future: Lessons from Jawaharlal Nehru National Solar Mission Phase I
xiv
Buying down the cost of solar power in the deployment phase, through direct public funding, leads to the GoI co-financing a large set of private projects. The criticism of this approach is that unless it justifies significant externalities, such funding simply translates to unintended (and not so useful) subsidies for the end consumers of electricity. Cost reduction by itself cannot be argued to accelerate the deployment of solar power, as RPO is the basic demand-pull for solar projects under the existing power sector policy and regulatory framework in India.
Capital subsidy, GBI or VGF are all, however, important funding instruments for technologies, which in the development life-cycle have not achieved the scale or viability to be deployed widely. Lack of public funding at this stage can simply impede deployment and diffusion, irrespective of the long-term economic benefits.
Given the capital intensive nature of the program and the lack of participation of SCBs in it so far, it is more desirable for public funding to address structural impediments to such financing, so that the sector transits to nonrecourse-based financing, which has been absent over Phase I. Transparent disbursements through bidding and penalties for not achieving defined performance parameters can be adopted to enhance the effectiveness of direct funding support.
Access to commercial financing and its pricing can be improved if risk-reducing instruments or financial innovations are implemented with adequate public funding to back such measures. This set of measures is collectively named “facilitating public funding” and the following measures are evaluated further in the report:
• Creditguaranteeenhancementschemes;• Riskguaranteeschemes;• Subordinatedpublicfinancetoprolongtenorof
debt financing; and• Interestsubventionorgovernment-
intermediated concessional lines of credit for financial institutions.
A comparative assessment of the impact of such funding mechanisms on government budgetary support indicates that, compared with direct public funding, facilitating public funding (with the exception of interest subvention) options have lower or zero budgetary requirements (although involving contingent exposure) and consequently offer higher leverage on limited public finance.
The National Clean Energy Fund (NCEF) is proposed to be used as a VGF measure of the last resort during JNNSM Phase II. In addition, there could be a case for the utilization of NCEF for the creation of a Non-Risk Guarantee Fund, which can take care of the payment risk to private utilities under the solar mission.
2. Promoting local manufacturing: DCR vis-à-vis comprehensive industrial policy actions
Recognizing the importance of solar manufacturing, the National Manufacturing Policy of 2011 (Department of Industrial Policy and Promotion (DIPP) 2011) identifies solar energy as among industries of strategic importance where national capabilities are envisaged to be developed to make the country a major force in the sector.
India’s existing solar PV manufacturing capacity is, however, limited and does not straddle the high technology upstream segments of the industry, such as polysilicon, wafers and ingots. The solar PV manufacturing industry in India was historically export-led until 2011 but is beleaguered by the global demand-supply situation, and comparative disadvantages in sourcing and cost of raw materials vis-à-vis global players. Solar thermal manufacturing, on the other hand, will require substantial coordinated actions and technology partnerships to be able to take root locally.
Both solar PV and solar thermal offer potential economy-wide benefits such as job creation. As has been witnessed in the solar PV segment in

xv
Paving the Way for a Transformational Future: Lessons from Jawaharlal Nehru National Solar Mission Phase I
India, the Indian solar PV manufacturing industry provides jobs to more than 25,000 people, with a total installed capacity of 1,100 MW of cells and 1,800 MW of modules.2 Similarly, solar thermal possesses immense potential; to have an installed capacity of 10,000 MW by 2022, the total manpower requirement is expected to be 96,000, with 44 percent of this linked with local manufacturing.3
In Phase I of JNNSM, GoI specified a DCR for cells and modules for c-Si PV projects and a 30 percent requirement for solar thermal projects. These were limited only to JNNSM, with most state government policies having no such requirements.
India’s PV manufacturing industry is, however, confronted with several root cause issues straddling supply-side factors such as relative disadvantages in the cost of sourcing raw materials and resources, lack of access to technology, inverted duty structure for classes of equipment required for manufacturing, and cost and power.
It is essential that the industrial policy aspects are given due consideration since the DCR addresses demand-side actions and may not be sufficient to make local manufacturing self-sustainable and competitive in the long run. Promoting local manufacturing would require coordinated actions on the supply side, involving specific policy interventions.
For industrial policy to be effective, comprehensive actions as outlined under the National Manufacturing Policy 2011 are required to build on comparative local advantages, create adequate forward and backward linkages, and address specific input disadvantages faced by Indian manufacturers vis-à-vis their foreign counterparts.
Solar PV and CSP will solicit customized approaches in terms of an industrial policy action design which will need to consider the overall
objectives of ensuring long-term energy security, ensuring cost effectiveness, and realizing economy-wide benefits. These objectives will need to be evaluated to arrive at a set of prioritized actions.
The policy design choices for solar PV and CSP will need to take cognizance of local capabilities, international market situation, and availability of domestic funds. Drawing up clear technology scenarios for solar (PV and CSP) generation and application would be a key requirement to enable a manufacturing roadmap to be finalized for India. There is a need for developing a shared understanding of a framework to design specific industrial policy actions for solar manufacturing.
DCR needs to be aligned with the technology roadmap and prioritized segments of the value chain (separately for solar PV and CSP) under a comprehensive industrial policy action. A phased approach (which reduces year on year) to DCR is essential to ensure that the domestic industry moves up the competitiveness curve and is globally competitive over a period. In the absence of a roadmap for the promotion of preferred technologies, the DCR should be applicable on the entire value chain (thereby giving the choice of least-cost technology path to the investors).
Without a mission mode focus on increasing domestic value-addition and technology depth, Indian manufacturing in solar is unlikely to progress far. A Task Force, with representation from other concerned government departments (for example, DIPP) and other relevant organizations (such as the National Manufacturing Competitiveness Council (NMCC) and Planning Commission) should be set up to identify specific and coordinated industrial policy actions required by GoI to enhance competitiveness of solar manufacturing in India. An example of such a mission mode approach can be seen in the
2 Source: Federation of Indian Chambers of Commerce and Industry (FICCI) Solar Energy Task Force Report on Securing the Supply Chain for Solar in India. 3 World Bank Report - Development of Local Supply Chain: The Missing Link for Concentrated Solar Power Projects in India.

Paving the Way for a Transformational Future: Lessons from Jawaharlal Nehru National Solar Mission Phase I
xvi
automobile sector, with the Department of Heavy Industries and Public Enterprises, GoI, formulating the Automotive Mission Plan 2006-16 in 2006.
3. Solar thermal: public private partnerships vis-à-vis private-led development
A probabilistic model of procurement followed for both solar thermal and solar PV projects is more suited for commercial technologies, where upfront costs are limited in establishing project feasibility, and knowledge and experience are well-established for developers and financiers.
Solar thermal projects challenged with varying technologies and significant upfront costs in establishing detailed feasibilities are unsuited for a Case 14 kind of probabilistic procurement.
Stakeholders consulted during the study agree that larger public sector involvement in identifying, scoping and undertaking preliminary activities is essential before inviting the participation of private players. This is more akin to the Case 2 mode of technology and site-specific participation by private players adopted for conventional power projects in India.
Given the importance and promise of solar thermal for India, a more hands-on and guided approach from the government is necessary to move the industry forward in the desired direction. The following pathway is envisaged for solar thermal under Phase II and beyond:
• SECIshouldfocus,inPhaseII,ondevelopingdemonstration projects with desirable technology features such as storage, air-cooled condensation, hybridization, and so on. Such projects are envisaged under JNNSM to be developed through public private partnerships;
• Adetailedassessmentisrequiredofthemanufacturing value chain along a framework
of coordinated industrial policy actions and ecosystem development plans to indigenize production;
• AnyfurthercapacitydevelopmentunderPhaseII should ideally be undertaken only under a deterministic model with site identification, preliminary activities, and techno-commercial feasibility completed by a public-sector entity such as SECI, before bidding it out with specific technical specifications through a Build Own Operate Transfer (BOOT) or Build Own Operate Maintain (BOOM) route;
• GatherlessonsfromPhaseIprojectstodecideon the desirable technology standardization for solar thermal projects, which could be adopted into grid connectivity standards of the Central Electricity Authority; and
• BasedonthesuccessofPhaseII,decideonamove to a fully private-led model of procuring power from such projects over Phase III of JNNSM.
4. Role of central government: facilitative coordination vis-à-vis central sector projects
The draft Phase II policy document of JNNSM presents a differentiated pathway for central and state sector projects, with most incentives and support mechanisms under the policy reserved only for central sector projects. Only about 3.6 GW of the 9 GW capacity to be added over Phase II is envisaged in the central sector.
It is important, in this regard, to revisit the role of public support mechanisms under JNNSM. It may be more desirable to reorient GoI’s role to assume a larger and strategic focus of addressing sector-wide barriers and risks to enable a country-wide scale up of the program.
An alternative vision outlined in the report constitutes the following elements, which could be the focus of GoI:
4 ‘Case 1 Renewable Energy’ procurement, where the location or technology of a renewable power project is not specified by the procurer; ‘Case 2 Renewable Energy’ procurement – location specific renewable, which the procurer intends to set up under a tariff-based bidding process.
xvii
Paving the Way for a Transformational Future: Lessons from Jawaharlal Nehru National Solar Mission Phase I
5 There is a strong economic rationale in advancing direct public financing to solar parks, with positive externalities such as optimization in infrastructure use, including land, water and evacuation facilities, and provision of scale to use smart-grid features in grid integration of solar power.
• AllsolarthermalprojectsinPhaseIItobedeveloped through the Case 2 mode with the provision of facilitating financing schemes from GoI;
• GoItoplayanactiveroleindevelopingsolarparks in coordination with state governments. It will ease infrastructure-related challenges faced by developers and ensure coordinated transmission planning and deployment of smart-grid related features at the transmission level. Policy should aim for all projects to be developed through such parks;
• Directpublicfunding5 can be advanced to the solar parks to bring down the cost of such infrastructure for project developers. A standard, concessional charge for infrastructure could be specified for all solar park-based projects in Phase II; and
• Allprojectsadheringtoarobustandsufficientlyimproved standard Power Purchase Agreement (PPA) and set up in solar parks should be able to avail of facilitating public finance through GoI schemes, such as credit enhancements/guarantees and/or subordinated public debt.
A mapping of institutional capabilities of public institutions under JNNSM Phase I points to several gaps in undertaking monitoring, evaluation and coordination activities. The incorporation of SECI is thus a welcome measure and it should be resourced adequately to play a coordination role, including:
• Developdemonstrationsolarthermalprojectsinits capacity as a nodal agency;
• Transitprogrammanagement,monitoringandevaluation in a phased manner from NVVN;
• CoordinateR&Deffortsandecosystemdevelopment efforts;
• Coordinatethedevelopmentofsolarparksthroughout the country; and
• Addresssolarintegrationissuesandfacilitateacomprehensive national plan that coordinates generation scale-up, Transmission and Distribution (T&D) expansion and dispatch systems, and draws up a vision for the implementation of storage systems.
5. Development through solar parks or cluster-based approach
Experiences from Phase I and the Gujarat State Solar Policy indicate the need for organized development of grid-connected projects. A deterministic approach to planning of shared infrastructure through the provision of solar parks is the way forward as it optimizes land, water and evacuation infrastructure, and paves the way for planning and developing transmission and grid management features in a coordinated manner. MNRE should consider making solar park-based development the baseline for large, grid-connected solar projects in Phase II of JNNSM. By providing public funding support for infrastructure development in solar parks, GoI can prompt states as well as private parties to adopt solar parks as the baseline for large, grid-connected solar power development, thus laying the foundation for orderly grid development with optimized use of resources.
Along with the significant achievements of JNNSM Phase I, there are noteworthy barriers in solar sector financing, developing a manufacturing base in the country, and so on, which need to be overcome to meet the long-term objectives of JNNSM. Proactive efforts by all stakeholders in facilitating public funding, creating an enabling environment for manufacturing, and focusing on cluster-based project development would go a long way in augmenting the outcomes of JNNSM during the subsequent phases.

Paving the Way for a Transformational Future: Lessons from Jawaharlal Nehru National Solar Mission Phase I
xviii

1
Paving the Way for a Transformational Future: Lessons from Jawaharlal Nehru National Solar Mission Phase I
1.1 Introduction
Solar power, due to its abundant and sustained availability across the globe, has emerged as a promising long-term option for meeting growing global energy demand while addressing the adverse environmental impacts of conventional fuels. India is blessed with abundant solar insolation and energy generation potential. Recognizing its importance, the Government of India (GoI) launched the Jawaharlal Nehru National Solar Mission (JNNSM or National Solar Mission) which targets 20 gigawatt (GW) of grid-connected solar capacity by 2022.
JNNSM Phase I (2010-13) implementation has witnessed appreciable scaling up of solar capacities in India within a short span of three years. Starting from a negligible base, the total grid-connected solar photovoltaic (PV) capacity base of the country had reached 2,079 megawatt (MW) by the end of September 2013 and the majority of Concentrating Solar Power (CSP) additions (around 500 MW) are also likely to happen by 2014.
Despite developments in the Indian solar energy space, it is critical to focus on the sector’s long-term sustainability against mission objectives. Project developers and technology providers will be looking for sustained long-term market prospects, assured policy continuity from the government beyond the first phase, and availability of public financing support for subsequent phases. Planning for JNNSM Phase II (2013-17), therefore, becomes crucial and should be based on a sound analysis of lessons learnt from Phase I to provide the required contribution to policy design and support.
Several agencies have analyzed and documented the developments in Phase I of JNNSM. GoI, on its part, has taken steps to put forth options for supporting the program in a draft policy document for Phase II of the mission.
The World Bank, in consultation with the Ministry of New and Renewable Energy (MNRE), instituted a study to undertake a wide range of consultations with key stakeholders
1. A New Sunshine:
Achievements of a Grid-connected Solar Sector in India

Paving the Way for a Transformational Future: Lessons from Jawaharlal Nehru National Solar Mission Phase I
2
to identify the critical barriers to scaling up the grid-connected program in the subsequent phases of JNNSM, to provide an analytical basis for addressing some of the key policy debates that have emerged at this stage of the mission. This study is restricted to the large, grid-connected segment and does not address rooftop and off-grid segments, which are each important as subjects of separate studies in the future.
An extensive stakeholder consultation approach has been followed by conducting interviews with a diverse set of stakeholders, namely, developers, manufacturers, Engineering Procurement and Construction (EPC) players, financiers and industry bodies, besides GoI and industry experts (Annex 1). This was followed by two stakeholder workshops organized in Delhi and Mumbai in January 2013 and February 2013, respectively. Certain key public policy and regulatory options for the future were debated, aimed at arriving at a shared understanding of issues and possible approaches to resolving them.
This report aims to document the findings of this study and deliberations thereunder with the objective of providing an analytical lever to GoI in its challenging task of evolving guidelines and policy for subsequent phases of JNNSM.
1.2 Jawaharlal Nehru National Solar Mission: An Overview
1.2.1 Background
On June 30, 2008, the Prime Minister of India released the National Action Plan for Climate Change (NAPCC). It outlines a national strategy on climate change, to enhance India’s ecological sustainability and encourage sustainable energy sources. As part of NAPCC, the JNSSM, launched in 2010, is a GoI initiative to promote the development of solar power in India.
JNNSM provides multi-pronged and long-term strategies for harnessing solar energy in India. Its implementation is based on a three-phase strategy outlined in Figure 1.
JNNSM targets to add around 20,000 MW of solar power generation capacity by 2022. The proposed roadmap for deploying solar power across application segments under the JNNSM is shown in Table 1.
1.2.2 JNNSm Phase I: Chronology of Events
Since the launch of JNNSM in January 2010, several initiatives were implemented during its first phase, which are depicted chronologically in Figure 2.
Table 1: JNNSm Roadmap
Application Segment Target for Phase I(2010-13)
Target for Phase II(2013-17)*
Target for Phase III(2017-22)*
Solar collectors 7 million square meters (sq m)
15 million sq m 20 million sq m
Off-grid solar applications 200 MW 1,000 MW 2,000 MWUtility grid power, including roof top
1,000-2,000 MW 4,000-10,000 MW 20,000 MW
Source: JNNSM policy document. * Cumulative targets

3
Paving the Way for a Transformational Future: Lessons from Jawaharlal Nehru National Solar Mission Phase I
Figure 1: JNNSm Objective & Strategy
Figure 2: JNNSm Phase I Chronology of Events
To establish India as a global leader in solar energy, by creating the policy conditions for its diffusion across the country as quickly as possible
Adopt a three-phase approach:
• PhaseI(upto2012-13)• PhaseII(2013-17)• PhaseIII(2017-22)
Review capacity and targets for subsequent phases at the end of each phase (corresponding to plan period during 12th & 13th plans), as well as conduct a mid-term evaluation based on emerging cost and technology trends, both domestic and global
To protect the government from subsidy exposure in case expected cost reduction does not materialize or is more rapid than expected
Strategy
• Tocreateanenabling policy framework for the deployment of 20,000 mW of solar power by 2022
• Torampupcapacityofgrid-connectedsolarpowergeneration to 1,000 mW by 2013; an additional 3,000 mW by 2017 through the mandatory use of Renewable Purchase Obligation (RPO) by utilities backed with a preferential tariff. This capacity can be more than doubled—reaching 10,000 mW of installed power by 2017 or more—based on an enhanced and enabled international finance and technology transfer. The ambitious target for 2022 of 20,000 MW or more will be dependent on the ‘learning’ of the first two phases.
• Tocreatefavorableconditionsforsolar manufacturing capability, particularly solar thermal, for indigenous production and market leadership
• Topromoteprogramsforoff-grid applications, reaching 1,000 mW by 2017 and 2,000 mW by 2022
• Toachieve15millionsquaremeters(sqm)ofsolarthermal collector area by 2017 and 20 million by 2022
• Todeploy20millionsolarlightingsystemsforruralareas by 2022
TargetsObjective
Jan 2010 Jun 2010Feb 2010 July 2010 Aug 2010
Oct 2010 Jan 2011Dec 2010 Aug 2011 Nov 2011
Dec 2011 Jan 2012Jan 2012 Feb 2013 may 2013
Launch of JNNSM
RPSSGP guidelines issued
Benchmark tariffs - CERC
Batch 1 guidelines issued
RfS for Phase 1 (Batch1)
PPA for migration projects
Batch 1 PPAs signedBatch 1 bidding completed
Batch 2 guidelines issued
RFP for Batch 2 issued
Batch 2 bidding completed
PV (Batch 1) target COD
Batch 2 PPAs signed PV (Batch 2) & CSP (migration) target
COD
CSP (Batch 1) target COD
CERC: Central Electricity Regulatory Commission; RPSSGP: Rooftop PV and Small Solar Generation Programme; RfS: Request for Selection; PPA: Power Purchase Agreement; RFP: Request for Proposal; COD: Commercial Operation Deadline

Paving the Way for a Transformational Future: Lessons from Jawaharlal Nehru National Solar Mission Phase I
4
1.2.3 Capacity Allocation Process in JNNSm Phase I
GoI undertook several proactive steps in Phase I, such as offering a bundling of solar power with unallocated coal-based power through the National Thermal Power Grid (NTPC) Vidyut Vyapar Nigam (NVVN), implementing a Renewable Purchase Obligation (RPO) for solar power, instituting a Payment Security Scheme (PSS), and undertaking measures for promoting local manufacture of solar power; these initiatives combined to ensure the success of Phase I.
A summary of the key features of the capacity allocation process followed during JNNSM Phase I:
• Benchmarktarifffixedforeachfinancialyearbythe Central Electricity Regulatory Commission (CERC), followed by competitive bidding (reverse auction) to allocate projects to a set of successful bidders with the lowest tariffs adding
up to the quantum of capacity earmarked for each batch;
• Discountonafixedtariff(setatthelevelofCERC determined tariffs) used as the evaluation criterion for selecting bidders; and
• Bundlingofsolarpowerwithcheaperconventional thermal power to reduce the impact of higher solar tariff on utilities.
Figure 3 provides an overview of the capacity allocation process along with the key roles played by different stakeholders.
Phase I of JNNSM has witnessed active participation from the private sector in the grid-connected segment with substantial discounts to the benchmark tariffs determined by CERC for solar thermal and solar PV projects, respectively. MNRE played the crucial role of issuing JNNSM Phase I guidelines to select new solar power projects and providing the essential policy framework for the development of solar power projects under
Figure 3: JNNSm Phase I Capacity Allocation Process
Allocation of power from unallocated central quota (from NTPC power stations) for bundling with solar power
4 units of coal power bundled with 1 unit of solar power for sale to utilities
Utilities allowed to use the solar part of bundled power for meeting RPO
Public and private sector financial
institutions
Project Developer
State Utility
Ministry of Power CERC
MNRE
NTPC
NVVN
Back-to-back
Bankability of Power Purchase Agreement
Project/balance sheet financing
Power Purchase Agreement at discounted tariff
Notifications of bundling rates
Guidelines for selection
Benchmark feed-in tariff
Power Sale Agreement at discounted tariff

5
Paving the Way for a Transformational Future: Lessons from Jawaharlal Nehru National Solar Mission Phase I
the bundling scheme for Phase I of JNNSM. The guidelines provided clarity on the bidding process as well as the technical and financial qualifying criteria for bidders to participate in the bidding process (Annex 2).
Bidding for solar thermal and solar PV projects was undertaken separately, with each having a clear target (of 500 MW each) under the JNNSM Phase I guidelines. NVVN, a company engaged in the business of trading of power, was designated as the nodal agency by the Ministry of Power (MoP) for entering into Power Purchase Agreements (PPAs) with solar power developers. The power from the solar power plants is being purchased by NVVN and sold to distribution companies (Discoms) after bundling with power from the unallocated quota of power (at MoP’s disposal for allocation) from NTPC’s coal-based stations on equal capacity basis, thus effectively reducing the average per unit cost of bundled power. Table 2 shows the average per unit cost of bundled power. It can be seen that, due
to continuous reduction in PV prices, the cost of bundled power has also reduced.
1.3 Key Achievements of JNNSM Phase I
1.3.1 Capacity Additions under JNNSm
Capacity allocation under JNNSM Phase I was undertaken in two batches—projects under Batch 1 were awarded in January 2011 and those under Batch 2 in December 2011. These projects are in various stages of implementation, as shown in Figure 4.
JNNSM Phase I implementation witnessed appreciable scaling up of solar capacities within a short span of three years. Starting from a negligible base, the total capacity reached 639.3 MW (including projects under the Rooftop PV and Small Solar Generation Programme (RPSSGP)) by the end of July 2013. CSP additions are likely to happen in 2014 (refer status of CSP projects and key players in Annex 3).
Table 2: Cost of Bundled Power under JNNSm
JNNSm Scheme Technology Type
CERC Tariff -INR/kWh (US$/kWh)
Discounted Tariff Range - INR/kWh (US$/kWh)
Weighted Average Tariff - INR/kWh (US$/kWh)
Bundled Power Tariff Range - INR/kWh (US$/kWh)
Migration scheme
PV 17.91 (0.299) NA – 5.40-5.72 (0.090-0.095)
CSP 15.31 (0.255) NA – 5.31-5.62 (0.089-0.094)
Batch 1 PV 17.91 (0.299) 10.95-12.76 (0.183-0.213)
12.12 (0.202) 4.34-4.67 (0.072-0.078)
CSP 15.31 (0.255) 10.49-12.24 (0.175-0.204)
11.48 (0.191) 4.49-4.81 (0.075-0.080)
Batch 2 PV 15.39 (0.257) 7.49-9.44 (0.125-0.157)
8.77 (0.146) 3.73-4.05 (0.062-0.068)
Source: NVVN. kWh: kilowatt hour; NA: not applicable.

Paving the Way for a Transformational Future: Lessons from Jawaharlal Nehru National Solar Mission Phase I
6
Source: Authors’ research.
Figure 4: Status of JNNSm Capacity Additions—July 2013
1.3.2 Solar Tariff Trends in JNNSm Phase I
Solar PV bidding in Phase I was undertaken in two batches. With JNNSM adopting a reverse auction method for awarding projects to qualified bidders, weighted average levelized tariffs for selected solar PV projects declined sharply between the two batches in Phase1 from INR 12.12 per kilowatt hour (kWh) (22.4 cents per kWh) to INR 8.77 per kWh (16.24 cents per kWh), making India amongst the lowest cost destinations for grid-connected solar PV in the world. A snapshot of the bidding trends that emerged in the solar PV segment during JNNSM Phase I is shown in Figure 5.
There was a decline of around 27.6 percent in the weighted average tariff for the projects bid out in Batch 1 and those bid out in Batch 2. While the tariff range during Batch 1 bidding process was between INR 10.95 per kWh (18.3 cents per kWh) and INR 12.96 per kWh (21.6 cents per kWh), it came down to between INR 7.49 per kWh (12.5 cents per kWh) and INR 9.44 per kWh (15.7 cents per kWh) during the Batch 2 bidding process.
The weighted average bid price for CSP was also lower than the CERC benchmark CSP tariff. The range of bidding was between INR 10 per kWh (16.7 cents per kWh) to INR 12.5 per kWh (20.8 cents per kWh). A snapshot of the bidding trends that emerged in the solar thermal (CSP) segment during JNNSM Phase I is shown in Figure 6.
The open and transparent reverse tariff bidding process has demonstrated an appreciable reduction in the average tariffs for both PV and CSP projects. The weighted average tariff rate for Batch 1 PV projects is around 32 percent below the benchmark tariff set by CERC while the weighted average tariff rate for Batch 2 PV projects is 43 percent below the benchmark tariff set by CERC. For CSP projects, the weighted average bid tariff is around 25 percent below the CERC benchmark tariff (refer Annex 4 for chronology of reverse bidding process adopted and level of participation in JNNSM Phase I and the international experience for auctioning renewable energy-based power capacity).
500450400350300250200150100
500
PPA Signed Commissioned
54 4830
2.5 140 140 470 50 340 310
Migration Scheme PV
Migration Scheme CSP
Batch 1 PV
Batch 1 CSP
Batch 2 PV

7
Paving the Way for a Transformational Future: Lessons from Jawaharlal Nehru National Solar Mission Phase I
Source: NVVN report.
Source: NVVN report.
Figure 5: JNNSm Phase I Solar PV Tariff Trends
Figure 6: JNNSm Phase I Solar Thermal Tariff Trends
The bidding process provided a transparent means of determining tariffs in a highly uncertain global solar PV market and, in the process, benefited from rapidly declining solar PV module prices in
the global market, a result of cut backs in demand from several European economies, increased levels of competition on the supply side, and a resultant surplus in supply in the international market.
INR
per k
Wh
201816141210
86420
JNNSM Phase I: PV segment tariff bidding trends
INR 5.75 (US$0.11)
PV Bid TariffBatch 2 Average Tariff
Batch 1 Average TariffBatch 2 Benchmark Tariff
Batch 1 Benchmark Tariff
INR 3.34 (US$0.06) INR 6.57 (US$0.12)
18
15
12
9
6
3
0
CSP Bid
JNNSM Phase 1 : CSP segment tariff bidding trends
Benchmark Tariff: INR 15.04 per kWh (US$0.25 per kWh)
Average Levelized Tariff: INR 11.71 per kWh (US$0.20 per kWh)
Lanco
INR
per k
Wh
KVK Energy
Megha Engineering
Reliance Power
Aurum Renewables
Godavari Power
Corporate Ispat
Benchmark Tariff Average Tariff

Paving the Way for a Transformational Future: Lessons from Jawaharlal Nehru National Solar Mission Phase I
8
This has definitely helped India in driving down solar tariffs in the short term and moving closer to achieving grid parity in the long term.
JNNSM has been instrumental in bringing the purchase price of both PV and CSP to a globally competitive level. Figure 7 shows India’s experience of very low bid out tariffs against feed-in tariffs (FiTs) across major countries in the world.
1.4 State Solar Policies
Several state governments in India have declared their state-level solar policies to promote solar generation. The following section provides an overview of the developments in various states.
1.4.1 Gujarat
Gujarat has been at the forefront of solar development in India. It was the first state to declare a solar policy in 2009. It has also initiated the development of solar parks, with the provision of publicly developed associated infrastructure,
leaving the private sector to focus only on solar project development.
The first solar park, developed in Charanka (Patan district), is currently the largest cluster of solar capacity in Asia. It provides developed land along with infrastructure, including power evacuation, roads and water for developers, thus ensuring a fast-track development of solar projects. The Gujarat Power Corporation Limited (GPCL) is the nodal agency mandated to develop, operate and maintain the solar park. The state has awarded projects on first-come-first-served basis at the FiT determined by the Gujarat Electricity Regulatory Commission (GERC).
Gujarat has also taken the lead in developing a grid-connected solar rooftop program based on gross metering with the rollout of the 5 MW Gandhinagar solar rooftop program in 2011. Developers have been selected through a competitive bidding process, and a Green Incentive of INR 3 per kWh (US$0.05 per kWh) has been provided to the rooftop owners.
Source: wind-works.org and author’s research.
Figure 7: PV and CSP Tariff Comparison Across Countries
25
20
15
10
5
0
INR
pwe
kWh
PV Tariff CSP Tariff India Batch 2 - PV India Batch 1 - PV India CSP
Switz
erlan
dFran
ce Italy
Malaysi
a
German
y
South Africa
Spain Ita
ly
Portugal
Greece
Morocco
22.68
7.56
16.74
12.96 14.04 12.42
18.9016.20 15.66 15.12
10.21

9
Paving the Way for a Transformational Future: Lessons from Jawaharlal Nehru National Solar Mission Phase I
1.4.2 Rajasthan
Rajasthan Solar Policy (2011) aims to develop the state as a global hub of solar power with around 10-12 GW of capacity to be developed over the next 10-12 years. Focus areas include grid interactive solar power projects, decentralized and off-grid solar applications, setting up of demonstration projects, developing solar parks, and promoting solar thermal collectors.
The allocation of generation projects of 100 MW capacity in Phase I of the state policy was completed recently and projects were awarded through a competitive bidding process along lines similar to those used under JNNSM.
1.4.3 Tamil Nadu
The Tamil Nadu Solar Policy (2012) has targeted a total of 3,000 MW by 2015. Of this, 500 MW is proposed to be achieved through the newly imposed Solar Purchase Obligations (SPOs) on consumers who receive power from Discoms at more than 11 kilovolt (kV).
Around 1,000 MW of grid-connected capacity addition is proposed through the competitive bidding process while another 350 MW would be generated through solar rooftop projects.
Table 3: Solar Policy Capacity Targets and Status
Particulars Gujarat Karnataka Rajasthan madhya Pradesh
Andhra Pradesh
Tamil Nadu
Period (FY) 2010-14 2013-16 2013-17 2012-13 2013-17 2013-15Capacity targets
500 MW 250 MW 600 MW 200 MW 1,000 MW 3,000 MW
Capacity invited (up to March 2013)
972 MW 80 MW 100 MW 200 MW 1,000 MW 1,000 MW
Source: Authors’ research.
1.4.4 Karnataka
The Karnataka State Solar Power Policy (2011) has set the target of achieving 126 MW of solar power up to 2013-14, to meet the RPO imposed by the regulator, of 0.25 percent till 2013-14 from solar sources. A tariff-based competitive bidding process has been proposed for the selection of developers.
1.4.5 JNNSm and State Policies
JNNSM provided an overall national plan for solar power capacity addition which is implemented under the aegis of MNRE (GoI). The state-level policies are designed and implemented by the state governments and work in tandem with the JNNSM. Table 3 shows the capacity targets set under various state policies and a detailed comparison of criteria and processes followed is provided in Annex 2.
JNNSM, along with state solar policies, has led to the rapid augmentation of solar capacity in India within a period of three years. Table 4 shows the installed capacity (as on March 2013) under various initiatives across different states.
The successful implementation of projects under JNNSM Phase I and Gujarat State Solar Policy has firmly established the solar footprint in the

Paving the Way for a Transformational Future: Lessons from Jawaharlal Nehru National Solar Mission Phase I
10
Table 4: Installed Solar Capacities (mW) under Various Schemes
State State Policy JNNSm RPSSGP/GBI REC Scheme Other Projects
Total (mW)
Andhra Pradesh
- 11.40 9.75 - 2.00 23.15
Arunachal Pradesh
- - - - 0.03 0.03
Chhattisgarh - - 4.00 - - 4.00Delhi - - - - 2.53 2.53Goa & UTs6 - - - - 1.69 1.69Gujarat 824.09 - - - - 824.09Haryana - - 7.80 - - 7.80Jharkhand - - 16.00 - - 16.00Karnataka - 5.00 - - 9.00 14.00Kerala - - - - 0.03 0.03Madhya Pradesh
- - 5.25 6.50 - 11.75
Maharashtra - 16.00 5.00 9.50 4.00 34.50Odisha - 5.00 8.00 - - 13.00Punjab - 2.00 6.00 - 1.33 9.33Rajasthan - 372.5 12.00 6.85 50.90 442.25Tamil Nadu - 5.00 6.00 1.055 5.00 17.06Uttarakhand - - 5.00 - 0.05 5.05Uttar Pradesh - 5.00 7.00 - 0.38 12.38West Bengal - - - - 2.00 2.00Total 824.09 421.9 91.80 23.91 78.91 1,440.6
Source: MNRE website/reports.
6 Union Territories: Puducherry, Lakshadweep, Andaman & Nicobar Islands.
Indian power sector. Gujarat State Policy received enthusiastic response and, amongst states, currently has the highest share of solar power installed capacity under state policies due to:
• Gujaratbeingthefirststatetoawardprojectsunder its state solar policy even before projects were awarded under JNNSM;
• Projectsallocationbeingbasedonthefavorable
FiT instead of competitive bidding;• Availabilityofwastelandandgovernment
support in acquiring this land; Gujarat had identified a land bank for solar power development (by developing solar parks) from wasteland areas available in the state;
• Gujaratbeingoneofthefewstateswithprofitable electricity distribution utilities, offering high procurer creditworthiness; and

11
Paving the Way for a Transformational Future: Lessons from Jawaharlal Nehru National Solar Mission Phase I
• ProvisionofatransmissionevacuationfacilitybyGETCO.
The launch of JNNSM provided an opportunity for states such as Rajasthan (with good solar radiation levels and wasteland availability) to procure solar power to meet their solar RPO compliance. The bundled power offered under JNNSM Phase I ensured a lower burden on state utilities, compared to the higher tariff levels of solar power. This has been followed by the separate solar power capacity allocation through state solar policies.
The announcement of JNNSM Phase II and state-level solar policies is likely to accelerate development of the solar sector in coming years. However, there are certain barriers and challenges which need to be addressed in the short to medium term. It is, thus, important, to evaluate the success of JNNSM Phase I, covering broader objectives and actions points rather than focusing only on capacity installations. The following chapters analyze the key barriers and challenges for the solar sector in India and provide the way forward to address them.

Paving the Way for a Transformational Future: Lessons from Jawaharlal Nehru National Solar Mission Phase I
12

13
Paving the Way for a Transformational Future: Lessons from Jawaharlal Nehru National Solar Mission Phase I
There is little doubt that the outcome of the large grid-connected solar PV program under JNNSM has been very encouraging. Most PV projects in Batch 1 were able to achieve financial closure and commissioning within the specified deadline. Projects in Batch 2 have also made good progress in meeting their commissioning schedule in 2013. JNNSM Phase I, despite its emphatic beginning, is modest in its capacity compared with the overall vision for solar energy under the mission. Factors such as creation of policy and a regulatory framework, manufacturing capacity, financing, and so on, are very important for meeting the long-term objectives of the solar mission. Thus, it is essential to view this program in the context of the overall targets under JNNSM. In order to gain a comprehensive understanding of various action points in JNNSM Phase I, the following key JNNSM objectives require a closer look:
• Creatingafunctionalpolicyandaregulatoryframework;
• Facilitatingfavorableconditionsforsolarpowerproduction/manufacturing; and
• Meetingcapacitytargetsundereachphaseandpreparing for the next phase.
These objectives have been qualitatively evaluated in terms of the key actions required to meet them and their outcome during JNNSM’s Phase I implementation. Figure 8 shows the summary of our analysis.
Viewed in the context laid out in Figure 8, it is essential to identify and address the key challenges faced by stakeholders, which could prevent the program from reaching, and possibly exceeding, the target of 20 GW of grid-connected solar capacity in the country by 2022.
Among the various issues identified, the following need closer deliberation to help evolve solutions for subsequent phases of the mission:
• LackofadequateparticipationofScheduledCommercial Banks (SCBs) in solar financing;
• Bottlenecksintheenablingenvironment;• Paymentsecurityforfutureprojects;• UnintendedtechnologyoutcomesoverPhaseI;• Beleagueredlocalsolarmanufacturing
environment;• Adequacyofthecurrentapproachtodeveloping
solar thermal projects; and
2. Scaling up under JNNSM:
Barriers and Challenges

Paving the Way for a Transformational Future: Lessons from Jawaharlal Nehru National Solar Mission Phase I
14
• EnforceabilityofRPOsandconcernsaroundsolar Renewable Energy Certificates (RECs).
This chapter presents these issues in brief as a background to the essential policy and design choices that are debated in the next chapter, and need to be resolved to ensure the success of the mission over subsequent phases.
2.1 Lack of Participation of Scheduled Commercial Banks in Solar Financing
The financial institutions, which led debt financing to solar developers in Phase I, could be classified
Source: Authors’ research.
Figure 8: Key Observations on Phase I of JNNSm
into four categories: SCBs; nonbanking financial services including infrastructure finance companies; bilateral/multilateral financial institutions including their private sector financing arms; and export credit agencies including EXIM banks.
2.1.1 Scheduled Commercial Banks
Several SCBs participated in solar projects in JNNSM Phase I and in projects under state policies. However, their cumulative market share was less than 25 percent and no single SCB featured among the leading lenders to solar projects. Such financing was also available only to established
Creation of functional policy
and regulatory framework
Optimizing public investment utilization
Acceptable risk sharing & reasonable competition
Transparency and nondiscriminatory allocation
Solar manufacturing capacity additions during Phase I
Manufacturing policy for solar sector
DCR
Strong Weak
Grid-based PV capacity additions
Grid-based CSP capacity additions
Developing framework for Phase II
Facilitate favorable
conditions for manufacturing
meeting capacity targets under Phase I and preparedness
for Phase II
Financing of solar projects is a challenge,CSP in particular is facing problems
Risk sharing framework – project financing still some way off; long-term predictability on pricing is uncertain
Competitive bidding allowed achievement of transparency in bidding and nondiscrimination in project award and permitting
Limited success in solar manufacturing capacity; global uncertainty in solar PV manufacturing
Solar policies more focused on power generation; need for integrated industrial policy
Under discussion
Solar PV has met its targets and witnessed huge participation from diverse players
CSP – faced certain challenges during Phase I
Under discussion
JNNSm Objectives Results Key ObservationsActions

15
Paving the Way for a Transformational Future: Lessons from Jawaharlal Nehru National Solar Mission Phase I
Figure 9: Types of Debt Financing Available to Solar Developers
corporates, with SCBs exercising discretion in qualifying borrowers for solar financing. SCBs also participated mostly through consortium lending routes, with even small projects of 5 MW being financed by a group of lenders, resulting in prolonged timelines for arranging finance.
2.1.2 Nonbanking financial services including infrastructure finance companies
In India, a Non-Banking Financial Company (NBFC) can either be an infrastructure debt fund, a dedicated power sector financing company, or an investment company. Select prominent NBFCs such as Larsen and Toubro (L&T) Infra Finance, Infrastructure Development Finance Company (IDFC) and PFC Green Ventures financed several Phase I projects.
2.1.3 Bilateral/multilateral financial institutions including their private sector financing arms
International Finance Corporation (IFC), Asian Development Bank (ADB) and Overseas Promotion and Investment Corporation (OPIC) are some prominent international financial institutions that
have financed private solar projects in India. While financing by international financial institutions was a welcome feature of Phase I, it is limited in its availability for private projects or is tied in nature and cannot form the mainstay of financing for scaled up targets envisaged under subsequent phases of JNNSM.
2.1.4 Export credit agencies including EXIm banks
Equipment-linked financing through foreign EXIM banks had the highest share of debt in Phase I, led by U.S. EXIM bank. This type of funding was available for projects that imported equipment. Although they were technology neutral, a few suppliers emerged as primary beneficiaries of this financing. Projects under the Gujarat Solar Policy too benefitted significantly from low-cost, long-tenor financing available from export credit agencies, including, in particular, the U.S. EXIM bank, which was among the prominent lenders to solar projects in India.
Higher dependence on foreign financing creates mismatches in currency flows, as the revenues
Nonbanking Financial ServicesScheduled Commercial Banks Multilateral/Bilateral Agencies Export Credit Agencies
Example• International Finance
Corporation (IFC)• Asian Development Bank
(ADB)• Overseas Promotion &
Investment Corporation (OPIC)
Example• State Bank of India• Bank of Baroda• State Bank of Patiala• Canara Bank• Yes Bank• IDBI Bank• Axis Bank
Example• L&T Infra Finance, IDFC• PFC Green Ventures• DFC• IREDA
Example• U.S. EXIM Bank• EXIM Bank of China
Debt financing
Domestic sources External sources

Paving the Way for a Transformational Future: Lessons from Jawaharlal Nehru National Solar Mission Phase I
16
of the solar projects are all denominated in INR while overseas debt servicing is in foreign currency. The study also indicated limited or no hedging by developers which was always fraught with risk, as indicated by the unprecedented depreciation in INR in 2013. This will affect the future risk appetite for such structures. From this perspective too, participation of domestic banks becomes even more critical for the success of the program in the future.
The experience from infrastructure financing for private sector projects in India shows that SCBs have led from the front in the absence of a sufficiently active debt market, and account for more than 80 percent of such debt disbursements (ADB 2011). The importance of SCB financing to the power sector can also be ascertained from the fact that it showed a compounded annual growth of 42 percent over a six year period from FY2007-12 (Reserve Bank of India (RBI) Financial Stability Report, 2011 & 2012). It is in this context that the lack of active participation by SCBs in the Indian solar program is worrisome.
Phase II of JNNSM, in which 3,600 MW of capacity is proposed to be developed under central schemes, would require an investment of around US$5.8 billion (Annex 5) which, at 70:30 debt-equity ratio, translates into a financing requirement of around US$4.1 billion. Taking the financing landscape of Indian infrastructure into consideration, it is inconceivable for JNNSM to scale up to the levels envisaged in subsequent phases and beyond without the active participation of SCBs.
SCBs consulted during the study pointed to the following reasons for their lack of serious participation in Phase I of the program:
• Emergingnatureofsolartechnologiesandlack of SCBs’ familiarity with the range of technologies deployed by developers led to
a higher perception of risk. Lack of on-field irradiation data in Phase I added to the risk perception of lenders;
• Solarprojectsinvolvingsmallerticketsizesareata disadvantage when considered within the same sector limits applicable to conventional power projects;
• Concessionalsourcesoffinancingintheform of suppliers’ credit and direct lending by development banks effectively crowded out commercial financing from SCBs, particularly without the availability of any concessional lines of credit for SCBs in Phase I;
• SCBsexpressedconcernswiththebid-outtariffson several projects, which were considered extremely aggressive and unviable with commercial finance even under P90 scenarios.7 Collaterals and securities were not considered substitutes for debt serviceability, as defaults trigger debt restructuring and Non-Performing Assets (NPAs) that create regulatory issues for financiers, even if such defaults may be recoverable against securities;
• SCBs’evaluationofprojectsindicatedseveralinfrastructural bottlenecks, which were additional sources of risks. These included factors that are covered in a subsequent section in this chapter; and
• ThePSSinstitutedbyMNRE,althoughwell received, was considered to have given substantial discretion to NVVN, leading to lack of clarity on its enforceability.
SCBs as well as other lenders, consulted during the study, raised certain issues with the standard PPA. These are briefly summarized in Annex 6.
2.2 Bottlenecks in the Enabling Environment
The promotion of solar power generation in JNNSM Phase I witnessed a number of key bottlenecks8
7 P90 refers to a probabilistic scenario where irradiation profiles are assumed, on average, to be in the 90 percent confidence range.8 Bottlenecks identified based on the stakeholder consultation undertaken; PV and CSP supply chain issues not covered.

17
Paving the Way for a Transformational Future: Lessons from Jawaharlal Nehru National Solar Mission Phase I
in the current enabling environment, spanning administrative and institutional readiness, knowledge and capacity of key stakeholders, and limited data availability. Some of the key bottlenecks are:
• Land acquisition a cumbersome process: Land acquisition is a major stumbling block for the development of solar power projects. According to developers, converting land use designations is extremely time-consuming (involving clearances from Gram Panchayats, Departments of Rural Development and Revenue, and so on) causing unnecessary delays;
• Delays due to approvals and clearances: The absence of a single window clearance mechanism under the state policy framework further delays solar project installation as there is limited coordination between different departments/agencies. Frequent policy and guideline changes further complicate the process, leading to lack of clarity across different agencies/departments;
• Limited data availability: Limited availability of data on solar irradiation levels, land availability, water availability, grid loading and availability, and so on, were bottlenecks experienced by solar projects across regions. A number of financers have raised concerns about lack of ground-level technology performance data and its effectiveness in the Indian environment, especially related to CSP. MNRE, along with the Centre for Wind Energy Technology (C-WET), has initiated steps to overcome the issue related to solar irradiation levels by setting up Solar Radiation Resource Assessment (SRRA) stations;
• Availability of support infrastructure (water/power evacuation): Timely availability of power evacuation continues to be a concern and has resulted in delays in commissioning of solar power projects, including in states that have identified land banks. Around seven solar PV projects in Batch 1 faced similar delays in
commissioning because the State Transmission Utility (STU) had not made the transmission line ready. Many developers indicated that getting right of way for laying the water pipeline or power evacuation line is cumbersome and involves receiving consent from multiple parties; and
• Limited state and center level coordination: With no established framework for coordination between the state agencies and MNRE administered institutions such as SECI, the Solar Energy Center (SEC) and the Indian Renewable Energy Development Agency (IREDA), lack of clear mapping of responsibilities between the various agencies in the public domain, compels developers to navigate on their own. Although most clearances and consent must be obtained at the state level, it is worthwhile for MNRE to establish a procedural roadmap for solar development with a clear mapping of responsibilities of intervening public institutions, both at the state and the center.
2.3 Payment Security for Future Projects
JNNSM Phase I offered bundling of 1,000 MW of coal-based generation capacity from NTPC with solar power of 1,000 MW through NVVN and instituted a PSS. The combination of NVVN as a counterparty to all contracts in Phase I and PSS9 as a security against defaults by Discoms was seen as a robust framework for a fledgling solar industry characterized by new, emerging players with limited financial strength.
The PSS is unique to solar10 power and was instituted by GoI in recognition of the infancy of the solar industry, higher cost of solar with an associated higher risk perception of defaults, and lack of exposure of Indian financial institutions to solar power generation.
9 Concerns were raised by financiers on the discretion accorded to NVVN in defining defaults and in assessing the Solar Payment Security Account (under the PSS).10 For instance, the successful wind energy program with over 18 GW of installed capacity in India was developed without any government financed payment security mechanism.

Paving the Way for a Transformational Future: Lessons from Jawaharlal Nehru National Solar Mission Phase I
18
Over subsequent phases of JNNSM, however, bundling is no longer a major option because of limited availability of unallocated power and, therefore, the continuity of NVVN as the counterparty is in doubt.
As per the JNNSM Phase II Batch I guidelines, SECI shall set up a payment security mechanism to ensure timely payment to the developers. This fund will have a corpus to cover three months’ payment. The rules to operate this fund will be framed by MNRE. As per the draft Phase II policy document, the National Clean Energy Fund (NCEF)11 is proposed to be used as a Viability Gap Funding (VGF) measure in the last resort, ensuring that the minimum possible NCEF funds are made available during the project cash-flow timelines to ensure project viability (refer Annex 7). In addition, there could be a case for utilization of NCEF for the creation of a Non-Risk Guarantee Fund, which can take care of the payment risk to private utilities under the solar mission.
With a rapidly decreasing tariff scenario in solar power and increasing knowledge and exposure of all stakeholders, the need for PSS may gradually dwindle. For Phase II, however, payment security shall remain a concern, particularly with the increasing concentration of solar projects in some states and the weak financials of distribution utilities in most states in India.
2.4 Unintended Technology Outcomes of Phase I of JNNSM
Phase I bidding took place in two batches12 over August 2010 and August 2011—a period that witnessed the sharpest decline in module prices with cut backs in demand from some European countries, following the Eurozone recession. The global trend in polysilicon supply, polysilicon spot prices, and module prices over the last few years has been detailed in Figure 10.
Source: EPIA, REC-SAGE, Bernreuter Research, BNEF, IHS iSuppli Module Price Index, authors’ research.
Figure 10: Global Solar PV market Trends
11 NCEF is expected to generate US$644 million in FY 2012-13.12 For solar PV technology only.
400
350
300
250
200
150
100
50
0
4
3.5
3
2.5
2
1.5
1
0.5
02003 2004 2005 2006 2007 2008 2009 2010 2011 2012 (E)
Poly
silic
on P
rice
(US$
/kg) M
odule Price (US$/W
)
2670028200
31200 3750052000
6600096000
159900
255000235000
35
2.65
3.543.25
0.7
16
Polysilicon Supply (MT) Polysilicon Spot Prices (US$/kg) Module Prices (US$/W)

19
Paving the Way for a Transformational Future: Lessons from Jawaharlal Nehru National Solar Mission Phase I
Figure 11: JNNSm Phase I Solar PV Technologies Used
The consequent over-supply and build-up of inventory affected the prices of cells and modules, resulting in a consistent decline through 2011 and 2012. There has been an upward trend in the prices of key components during the first half of 2013. For example, the Bloomberg New Energy Finance (BNEF) Solar Spot Price Index showing average polysilicon prices just over US$17 per kilogram (kg), up from a low of US$16 per kg in December 2012. Module prices have also risen slightly, with Chinese modules from reputable suppliers widely commanding US$0.75 per watt (W) and international modules US$0.86 per W.13
Several suppliers the world over have struggled to be cost-competitive in this environment, and PV manufacturing continues to experience closures and consolidations. Globally, Thin Film (TF), which once accounted for 30 percent of the market, has been losing share steadily. With the dramatic decline in Crystalline Silicon (c-Si) prices, the value proposition of TF as a lower cost option has eroded over time, and it has continued to lose market share resulting in a long list of suppliers shutting down their manufacturing units. It accounted for only 11 percent of the global PV market at the end of 2011.
In India, on the contrary, the share of TF in overall PV installations over Phase I of JNNSM is close to 70 percent (Figure 11). This unintended outcome (refer Annex 8) is a result of two factors. First, the Domestic Content Requirement (DCR) for c-Si required cells and modules to be mandatorily procured from domestic manufacturers over Batch 2. Owing to a low TF manufacturing base in India, DCR was waived for TFs. Domestic manufacturers have struggled to be competitive in a volatile and rapidly declining price environment led by Chinese suppliers.
Second, established TF suppliers based out of the United States were ready to supply competitively priced TF modules along with the provision of low-cost, long-tenor debt14 from U.S. EXIM. Faced with an economically attractive option and supply from more established and proven U.S. suppliers compared with domestic manufacturers, developers opted widely for TF.
Thus, DCR, which was intended to promote the local manufacturing industry, has actually resulted in a skewed technology choice and Indian manufacturers have derived minimal benefit from the program. Further, both c-Si and TF have relative pros and cons, as various international studies have shown, although TF has steadily lost global market share to c-Si. It is currently almost impossible to predict which technology will perform better in the Indian environment in the long run. This uncertainty, combined with the global preference for c-Si as against the preference for TF in India, might cause potential issues in the unforeseeable future for the rapidly growing Indian solar sector.
13 Source: bnef/PressReleases/text/318 – August 2013.14 Foreign debt has been available for a tenor of 15 years and longer (IFC, OPIC, US EXIM); OPIC/overseas EXIM loans have been available at under 5 percent Fx denominated.
TF c-Si
Batch 2
Batch 1
75%
55%
25%
45%

Paving the Way for a Transformational Future: Lessons from Jawaharlal Nehru National Solar Mission Phase I
20
2.5 Beleaguered Local Solar Manufacturing Industry
JNNSM embodies the significant objective of developing India into a leader in high-quality, low-cost solar manufacturing. In Phase I, to provide support to domestic manufacturers, GoI included a DCR for both c-Si and solar thermal-based projects (refer Annex 9). As is apparent, not only did this measure not contribute to the expansion and development of the Indian manufacturing industry (the Indian solar PV manufacturing industry actually contracted in size during this period), but it also did not provide support for making the industry more competitive in the global solar PV market. The domestic solar PV manufacturing industry continues to operate
at an average capacity utilization of less than 50 percent. On the other hand, lack of solar thermal manufacturing experience limits domestic technology supply options in the absence of critical locally manufactured components.
2.5.1 Solar PV
Globally the upstream segments in solar PV manufacturing are highly competitive, technology- and capital-intensive, and have followed a research-based learning curve. Only seven companies constitute up to 90 percent of the total polysilicon market and five companies provide up to 90 percent15 of the total ingot production in the world. Figure 12 provides a broad overview of the global solar PV production.
Source: GTM research, polysilicon excludes production for semi industry.
Figure 12: Global Solar PV Production Overview—2012 Beginning
15 Exploring the effectiveness of local content requirements in promoting solar PV manufacturing in India, Deutsches Institut für Entwicklungspolitik (German Development Institute), 2013.
Inventory across value
chain carried forward from 2011 to 2012
~5 GW (2011)
Inventory Polysilicon
Total39.82 GW
All Others,9833
All Others,15592 All Others,
17946All Others,
19949
Daqo, 692
Solarfun, 1000
Kyocera, 775 China Sun, 840Sharp, 905
Solarworld,950Jinko Solar,1050Hanwha, 1200
Yingli, 1500Trina, 1550
Canadian, 1675
Suntech, 2140
LDK Solar, 2250
ModuleCellWafer
GreenEner, 1080
Motech, 900Jiangsu, 1200
Gintech, 905SolarWorld 1300
Solarfun, 925Glory Si, 1500
Canadian S, 1050Renesola, 1505Q-Cells, 1100Yingli, 1500
Trina, 1550
Suntech, 1900
JA Solar, 2500
Yingli, 1667
GCL, 2200
REC, 2252
LDK, 2400
KCC, 846Tokuyama, 1354
LDK, 1692
MEMC, 2102
REC, 2923
GCL Solar,4839
Hemlock, 4985
Wacker, 5213
OCL, 5342
Total31.69 GW
Total31.05 GW
Total34.00 GW

21
Paving the Way for a Transformational Future: Lessons from Jawaharlal Nehru National Solar Mission Phase I
Source: The World Bank report - Competitiveness Assessment of MENA countries to Develop a Local Solar Industry.
Figure 13: Attractiveness of Solar PV Component Industries in India vis-à-vis International Benchmarks
16 This was a testing unit which was made available purely for R&D purposes to an Indian solar facility.17 Benchmark based on average for eight countries: Chile, China, Germany, India, Japan, South Africa, Spain and the USA.
India’s existing solar PV manufacturing capacity is, however, limited and does not straddle the high-end technology upstream segments of the industry, such as polysilicon, wafers and ingots. While there is no polysilicon manufacturing capability in India, technically around 15 MW of ingot and wafer manufacturing capacity exists, although this is a pilot unit which is not commercial in nature.16 The Indian solar manufacturing segment is, thus, primarily represented by solar cell and module manufacturers, which are tail-end and lower value addition segments.
Figure 13 highlights the attractiveness of the Indian solar PV industries vis-à-vis international benchmarks.17
Indian solar PV manufacturing, restricted primarily to the lower value-added segments—namely
cells and modules—of the c-Si value chain, has historically catered to exports. With Chinese and Taiwanese manufacturers cornering market share in c-Si solar PV globally through integrated operations and GW scale installations, Indian exports have declined significantly. Indian manufacturers have struggled to be price-competitive in the current environment, mainly due to high input costs of technology, power, and raw materials.
The PV manufacturing industry in India has also not been able to integrate backwards in the areas of wafer and polysilicon manufacturing, thus being substantially dependent on imports for raw materials and consumables. This has resulted in a significantly high cost at cell and module level for Indian manufacturers as compared to competition from Chinese and other Asian countries, as indicated in Figure 14.
Solar Glass
Polysilicon
Modules c-Si
TF Material
TF Modules
InverterIngot Wafers
Cells Support Structure
India Benchmark Average

Paving the Way for a Transformational Future: Lessons from Jawaharlal Nehru National Solar Mission Phase I
22
Source: Securing the Supply Chain for Solar in India by FICCI Subgroup on Securing Solar Supply Chain (2013). Wp: Watt peak.
Figure 14: Cost Comparison—Cell and module (India, China and other Asian Countries)
The development of an appropriate solar manufacturing ecosystem is the key to enhancing the competitiveness of Indian solar PV manufacturing. However, several solar PV manufacturers in India currently face issues related to lack of raw materials, nonavailability of low-cost financing, and an underdeveloped supply chain leading to high inventory costs. Lack of capital also impacts adoption of new technologies and ability to innovate to achieve higher efficiencies and competitive costs.
The status of Indian solar PV manufacturing and its declining exports have been summarized in Annex 10.
2.5.2 Solar Thermal
Local manufacturing in solar thermal is complex as technology suppliers are limited and their products
patented. Despite the presence of large power sector manufacturing capacity within the country as well as availability of a skilled labor force, India has not been able to manufacture or produce some of the critical components for solar thermal projects such as receiver tubes and mirrors. In some cases, such as in the manufacture of reflecting surfaces, the lack of natural resources (low-iron sand, in this case) poses an impediment to indigenization. In other cases, such as in the manufacture of vacuum tubes, the obstacle is the lack of relevant technical know-how that is still proprietary and owned by a select few.
Figures 15 and 16 detail the present local manufacturing capability for CSP in India and attractiveness of CSP component industries vis-à-vis international benchmarks.18
It is well acknowledged that solar thermal products and equipment can be potentially manufactured in
18 Benchmark based on average for eight countries: Chile, China, Germany, India, Japan, South Africa, Spain and the USA
Depreciation Interest (Incl WC) Manpower
Balance of Material (Incl. Duties & Tax)Utility & Spares
Cos
t (C
ents
/Wp)
Module manufacturing cost Cell manufacturing cost
40.00
30.00
20.00
10.00
0.00
34 Cents/Wp
(India) 28 cents/
Wp (India)
19 cents/Wp (Chinese and other Asian countries)
27 Cents/Wp (Chinese and other Asian countries)
28 15
12
22
221.5
1.501.751.25 1
4
3
1
11
5
3 20.75

23
Paving the Way for a Transformational Future: Lessons from Jawaharlal Nehru National Solar Mission Phase I
Source: The World Bank Report - Development of Local Supply Chain: A Critical Link for Concentrated Solar Power in India.
Figure 15: Present Local CSP manufacturing Capability in India
Source: The World Bank report - Competitiveness Assessment of MENA Countries to Develop a Local Solar Industry.
Figure 16: Attractiveness of CSP Component Industries in India vis-à-vis International Benchmarks
Generator
Heat exchanger
HTF pumps
HTF thermal oil
MirrorPumps
Condenser
Receiver
Solar Salt
Steam turbine
Storage tank
Structure & tracker
India Benchmark Average
Receiver (PT)
Receiver (CR)
Mirror (PT)
Mirror (CR)
Drive/Tracking (PT)
Drive/Tracking (CR)
HTF (Synthetic Oil) And
Molten Salts
Turbines
PT: Parabolic Trough, CR: Central Receiver
CO
mPO
NEN
T/m
ATER
IAL
Low or absent Medium High

Paving the Way for a Transformational Future: Lessons from Jawaharlal Nehru National Solar Mission Phase I
24
synergy with other industries such as automotive, glass, metal, chemicals, power equipment, process heat, and construction. Given the presence of well-developed local players across most of these industries in India, the potential for indigenization and cost reduction in solar thermal technologies is very high —provided standardization in configurations, scale, and commercialization are accelerated, prompting investments along the value chain. It, however, requires a coordinated ecosystem development, with adequate technology partnerships to move existing industries to commit to such manufacturing.
The importance of developing a local competitive solar industry cannot be understated. It brings us to the important policy debate on the best set of actions to make Indian solar manufacturing truly global in character. To fully address the objective of making India a leader in solar manufacturing, GoI will need to critically evaluate current domestic strengths in solar manufacturing; international market situation and competitiveness; and availability of domestic funds. This subject is examined further in the next chapter.
2.6 Adequacy of the Current Approach to Developing Solar Thermal Projects
The framework for award of projects in Phase I of JNNSM, similar to that used for solar PV, was the reverse auction, through which seven projects totaling 470 MW were awarded under Batch 1.
Unlike solar PV, which has a range of fully commercial technologies with substantial scale of deployment (over 100 GW installed capacity) as well as manufacturing capacity, solar thermal or CSP with only 2.2 GW of installations globally is far from commercially applicable.
While solar PV bidders under JNNSM benefitted from a rapid post-bid decline in module and cell prices, solar thermal has not experienced any significant price reductions. Solar thermal technologies continue to
suffer from immature manufacturing value chains and have not been able to achieve sufficient scale to drive down costs. The solar thermal industry is made up of oligopolies led by technology developers who also own significant portions of the supply chain. Most technology developers have created their unique, patented products and segments of the value chain with alternative uses,19 and experience periodic capacity gaps and volatility in prices. The status and key action points for Indian solar thermal manufacturing have been summarized in Annex 11.
Solar thermal capacity additions the world over have also been developed with substantial public financing, as appreciation and experience of commercial financiers of such technologies is mostly nonexistent (refer Annex 12).
Solar thermal projects require a range of preparatory activities including clearances and consent as well as on-field Direct Normal Irradiance (DNI) measurement. Given the infancy of the solar market, the absence of on-field radiation data and a lack of familiarity amongst financial institutions when the projects were bid in 2010, JNNSM’s schedule of 28 months for commercial operation date (COD) was ambitious. This is particularly so without a public funding roadmap under Phase I, which seems to be the norm globally for solar thermal projects. It is not surprising, therefore, to note that all solar thermal projects bid under JNNSM are running behind schedule.
In the above context, and given the initial phase of development of solar thermal technologies in India, it is worth examining whether the existing framework for awarding projects is adequate or a different disposition is required.
2.7 Enforceability of RPOs and Concerns around Solar RECs
RPOs are the cornerstone of renewable energy capacity development in India, as envisaged under
19 For example, heat transfer fluids were globally in short supply in 2012 resulting in a spurt in their prices.

25
Paving the Way for a Transformational Future: Lessons from Jawaharlal Nehru National Solar Mission Phase I
the Electricity Act, 2003 and the National Electricity Policy. They provide the necessary demand-pull by mandating distribution utilities and obligated entities to mandatorily procure a proportion of their power requirements from renewable sources, including a specific percentage from solar energy. MNRE estimates solar capacity addition requirement to be 34 GW to achieve the 3 percent solar RPO targeted by 2022 under the National Tariff Policy.
RPOs are enforced by the State Electricity Regulatory Commissions which have, so far, been lenient in imposing penalties in the event of noncompliance to RPO, although most have specific provisions in regulations for imposing such penalties.
The pricing of solar RECs remains a cause for concern in the medium to long term, given the uncertainty attached to the downward cost trends in the solar sector and the market-based pricing of RECs. Under the current REC framework, forbearance and base price range has been set only up
Source: SECI Presentation: Achievements of JNNSM Phase I and Vision for Phase II (2013).
Figure 17: Solar RPO and Capacity Addition
to 2017, and there is likelihood of solar REC prices coming down drastically by the end of the current control period, that is, FY 2017. This is the key issue facing investment or financing of solar projects through the REC route, given the uncertainty of cash flows beyond 2017 and the likelihood of decreasing revenues beyond 2017, with the gap between average power procurement cost of utilities and solar tariffs narrowing with time. As a consequence, the installed capacity for the solar REC market remains negligible and due to demand-supply mismatch, the solar RECs have been trading close to the forbearance price of INR 13,400 per REC (US$223.33 per REC).
These issues have been highlighted by several stakeholders time and again, and our discussions with the government and regulators indicate that certain concerted measures are being formulated to address them. These include changes being contemplated in the framework of RECs by CERC for the period beyond 2017, and a recent petition before the Appellate Tribunal for Electricity seeking stricter enforcement of RPOs.
3.50%
3.00%
2.50%
2.00%
1.50%
1.00%
0.50%
0.00%
40,000
35,000
30,000
25,000
20,000
15,000
10,000
5,000
02012-13 2013-14
1.00%
2.25%
3.00%
2014-15 2015-16 2016-17 2017-18 2018-19 2019-20 2020-21 2021-22
Cap
acity
Req
uire
men
t (M
W)
Solar RPO Targets (%
)
34,152
29,24724,839
20,88515,176
10,1277,5605,2913,2911,536
Solar Capacity Requirement for RPO Compliance Solar RPO

Paving the Way for a Transformational Future: Lessons from Jawaharlal Nehru National Solar Mission Phase I
26

27
Paving the Way for a Transformational Future: Lessons from Jawaharlal Nehru National Solar Mission Phase I
3.1 Efficacy of Public Funding: Buying Down Tariffs vis-à-vis Addressing Structural Impediments to Financing
Investments worth approximately INR 10020
billion (refer Annex 13) were deployed for Phase I of JNNSM and Phase II would require approximately INR 700 billion (US$11.67 billion). These requirements are likely to increase as the program is expected to expand exponentially over the subsequent phases. As public funding is limited, large amounts of private investments need to be mobilized to meet the mission targets; the private-led model adopted under JNNSM is thus appropriate and efficient.
Given the evolutionary nature of a range of solar PV and CSP technologies and comparatively higher tariffs, public funding in one form or the other has been found to be essential to leverage private investments (refer Annex 14 for key incentive/instruments for solar power in India).
For public funding to support the solar program, a choice of the following fundamental options is available:
• Financingincrementalcostsofsolarpower,thus effectively “buying-down” the cost of solar generation. This is a direct, project-level involvement of the government, financed through instruments such as capital subsidy, Generation-Based Incentive (GBI) or VGF, and so on; or
• Addressingorcoveringrisks,whichareimpediments to optimal financing of solar projects. This could be achieved through structured public debt, risk funds and guarantees to address specific barriers/risks perceived by the lending community.
3.1.1 “Buying down” Tariffs or Direct Funding of Solar Projects
In Phase I of JNNSM, GoI structured a bundling scheme through which 1,000 MW of coal-based
3. JNNSM Phase II and Beyond:
Essential Policy and Design Choices
20 INR 100 billion is approximately US$1.67 billion.

Paving the Way for a Transformational Future: Lessons from Jawaharlal Nehru National Solar Mission Phase I
28
thermal power from NTPC (from the unallocated quota, assignable at the government’s discretion) was bundled with 1,000 MW of grid-connected solar projects and sold as “bundled” power to distribution utilities. This measure achieved two objectives: it brought down the cost of bundled power to around INR 5 per kWh (US$0.09 per kWh) and avoided any direct funding support from GoI for Phase I of the program. The program also benefitted immensely from the involvement of NVVN, the trading subsidiary of NTPC, which provided program management support for Phase I and was the counterparty to PPAs signed with all solar developers, on the one hand, and to Power Sale Agreements (PSAs) signed with all distribution utilities, on the other.
With very limited21 unallocated power left for such bundling over subsequent phases, GoI is keen to substitute it with some form of direct funding to make solar power affordable for distribution utilities.
Before dwelling on the efficacy of instruments that are being discussed in this regard, it is important to highlight the policy and regulatory framework that exists in the power sector today for renewable energy. It is apparent that the basic policy and regulatory framework for promoting demand for renewables is focused on the RPO to be enforced upon distribution utilities with tariffs either preferentially set by the State Commission or competitively determined (refer Annex 15).
Given the potential of solar power in India and its importance in the long-term energy security of the country, there is a desire to fast track development without burdening the Discoms or end-consumers substantively. While this is an understandable goal, analysis indicates that the burden on end-consumers is negligible, since the targeted RPO
under the National Tariff Policy is as low as 3 percent by 2022.
To achieve the 3 percent solar RPO targeted by 2022 under the National Tariff Policy, MNRE estimates the solar capacity addition requirement to be 34 GW.22 Even if solar power were to achieve the 3 percent RPO target today, it would effectively translate to an average impact of not more than 15 paisa23/kWh in retail tariffs. This estimate is on the higher side as any such impact will narrow and possibly be bridged with the decline in solar tariffs over the period up to 2022, and a corresponding increase in the average cost of power procurement for distribution utilities, which is substantially dependent on fossil-fuel based sources.
Against this backdrop, “buying down” the cost of solar power through direct public funding translates into two outcomes. It leads to the government cofinancing a large set of projects under subsequent phases of JNNSM and to a lower cost of electricity from solar projects for distribution utilities and end-consumers, which reduces the risk of defaults.
The first outcome—unless it justifies significant externalities such as acceleration in deploying solar power with the attendant economic and strategic benefits envisaged under JNNSM, or addresses certain specific impediments that are hindering growth in the current environment—ends up simply as unintended (and not so useful) subsidies for the end consumers. Mandatory RPOs create the basic demand for solar power as they mandate distribution utilities to procure solar power, irrespective of the cost reductions that GoI is attempting to achieve. Thus, cost reduction cannot be argued to accelerate demand for solar power until the RPO targets are met. Since such direct public funding is intended (MNRE, 2012) only for
21 The Phase II Draft Policy document for JNNSM estimates only1,650 MW of unallocated capacity for Phase II of the program.22 SECI Presentation: Achievements of JNNSM Phase I and Vision for Phase II (2013).23 Computed at an average power procurement cost of INR 3.50 per kWh and an average solar tariff of INR 7.00 per kWh with an assumed average distribution loss of 35 percent. The impact of 0.25 percent minimum solar RPO is thus less than 2 paisa per kWh.

29
Paving the Way for a Transformational Future: Lessons from Jawaharlal Nehru National Solar Mission Phase I
projects selling power to distribution utilities, it also has a limited effect on demand from other segments for solar power.
On the other hand, lower cost of solar power does tend to address certain risk perceptions. First, it ensures lower exposure of financiers to projects, assuming that public funding is utilized on a first charge to repay lenders. Second, it reduces the risk of defaults as cash-strapped distribution utilities are more likely to default to costlier producers of power. Third, lower priced solar power is likely to find third party buyers and is an additional security for investors and lenders. For the scale of the program envisaged, it is unlikely that GoI’s intention is to swap part of the market debt with subsidy on commercial projects. On reducing risk of defaults and improving marketability of solar power, although apparently attractive to investors and lenders, direct subventions can be argued to be less efficient than risk-reducing tools in this regard. This is further addressed in the following
section where the role of facilitating public funding in addressing structural financing impediments is analyzed.
Table 5 debates the pros and cons for each of the direct support instruments, which attempt to buy-down the cost of electricity. The options being considered here are those that have been proposed under the draft policy document for Phase II of JNNSM.
The choice of the public funding instrument should be viewed in the context of the life-cycle of solar development in the country, in particular, the distance the technology has to travel to be purely commercial in nature and to achieve grid parity, as this determines the extent of public funding support required over the entire program cycle.
Figure 18 indicates such a roadmap and outlines the role of public funding in this developmental life-cycle of a technology.
Source: : Authors’ research.
Figure 18: Role of Public Funding in Developmental Life-cycle of Technology
CommercializationDiffusionDeploymentDemonstrationR&D
Tow
ards
Gri
d Pa
rity
/Fin
anci
al V
iabi
lity
Grants, public private venture capital
funds (developers/manufacturers)
Facilitating public financing mechanisms (including
donor financing)
Commercial financingDirect public payment schemes
Grants, soft loans, venture capital funds,
incubators
Risk guarantees, refinancing, lines of
credit
Commercial debt/equity/insurance leveraging risk
guarantees
Commercial debt/equity/insurance leveraging risk
guarantees
Commercial debt/equity/insurance
Calibrate lines of credit, risk guarantees &
refinancing
R&D grants, FiT, capital subsidy (manufacturers)
Capital/interest subsidy
FiT
Technology specific competitive tariff
Technology agnostic competitive tariff
Payment Security Fund, VGF for transmission infrastructure, incentives for exceeding RPO targets, tax incentives on renewable energy equipment, etc.

Paving the Way for a Transformational Future: Lessons from Jawaharlal Nehru National Solar Mission Phase I
30
Table 5: Direct Support Instruments
Public Funding Instrument
Pros Cons
Capital subsidy • One-timeandeasytodisburseforthegovernment.
• Investorsandfinanciersfinditattractive as it limits exposure of lenders and lowers tariff of projects – reduces risk of defaults and opens up option for third-party sale in case of defaults.
• Projects,oncefunded,arenolongerdependent on government budget in the future.
• Notlinkedtooutputandhencedoesnotcreate a positive bias for performance. Not appropriate for commercial technologies.
• RiskofcompromisesinOperationandMaintenance (O&M) and asset replacements.
• Seenasgoingbackintime,asthefocusin other renewable segments (e.g., wind) has moved from capital-based incentives (accelerated depreciation) to GBIs.
Generation-based incentive
• Outputlinked;createsabiasforperformance.
• Incentivizesnotonlydevelopersbutalso more efficient equipment suppliers.
• OutflowfromGoIlikelytobecumulativelyhigher than in the capital subsidy mode because of impact of taxes and time value considerations.
• Dependentoverasubstantiveperiodongovernment funding.
VGF in tranches up to one year post commissioning
• Frontloadedpublicfundingmakesiteasy to administer and disburse.
• Asinthecaseofcapitalsubsidy,investors and financiers find it attractive as it limits exposure of lenders and lowers tariff of projects – reduces risk of defaults and opens up option for third-party sale in case of defaults.
• Notlinkedtooutputandhencedoesnotcreate a positive bias for performance.
• RiskofcompromisesinO&Mandassetreplacements.
• VGFschemeininfrastructurewasdesignedfor economically necessary projects, which were not commercially affordable. Solar has already established itself in India to be commercially viable and tariffs reasonably acceptable
Source: Authors’ research
Capital subsidy, interest subventions, and so on, make sense early in the life-cycle of a technology where the program’s scale and viability are not completely established. Once the viability is established, market mechanisms should take over with public funding then switching to a role of facilitating access to private finance by addressing residual risks and barriers. This is the most economical basis for promoting market development of a renewable technology. Governments will also need to guard against
excessive continuance of public funding in the commercial phase, as it tends to crowd out commercial sources of financing. Similarly, lack of public funding in the early stages of development of a technology can simply impede its deployment and diffusion, irrespective of the long-term economic benefits.
It is also important to realistically estimate the likely time a technology would take to achieve grid parity before designing direct public payment schemes,

31
Paving the Way for a Transformational Future: Lessons from Jawaharlal Nehru National Solar Mission Phase I
such as capital subsidy or VGF, as it can otherwise result in an open exposure of the government to technology-related risks, which should ideally be borne by the market functionaries.
3.1.2 Addressing Structural Impediments to Financing
It is now acknowledged that Phase I of the mission missed a roadmap for financing of solar projects, barring the provision of a payment security fund set up against payment defaults.
Given the capital-intensive nature of solar projects, improving access to commercial financing sources, and identifying and addressing structural impediments to such financing are imperatives for achieving the scale envisaged under subsequent phases of the program. At the very least, factors which enable nonrecourse financing have to be encouraged, without which private players will find it difficult to take on a large number of projects. The introduction of adequate risk-mitigating instruments can also lead to a reduction in tariffs by lowering the cost of financing.
In the course of the study, SCBs highlighted the following specific risks as barriers to financing solar projects:
• RiskofuntriedtechnologiesinIndianconditionsand lack of familiarity with such technologies amongst lenders;
• Riskofpaymentdefaultsonaccountofcomparatively higher tariffs of solar power. This is exacerbated in the form of concentration of solar projects in a few states, most with distribution utilities in poor financial health;
• Instancesofaggressivebiddingbyprojectdevelopers, which render projects unviable without access to concessional sources of financing; and
• Risksinthedevelopmentcycleincludingdelaysin obtaining clearances and consents and/or lack of interconnection facilities, and so on.
Solar projects with smaller ticket sizes are being considered part of the power sector for evaluating sector exposure limits. However, such projects are rarely financed by SCBs that prefer lending to conventional projects over several smaller solar projects. These concerns have reflected in the average cost of commercial finance for solar projects being available at 150-300 basis points more than average cost of financing conventional projects.
Besides risk perceptions, renewable energy projects in India suffer from the lack of sufficient long-tenor finance, which could have potentially reduced tariffs.
Access to commercial finance and its pricing can be improved if risk-reducing instruments are evaluated and implemented with adequate public funding to back such measures. Introducing innovations in financing mechanisms through an appropriate public financing source could also contribute towards addressing this structural inadequacy in financing solar projects. A range of initiatives can be proposed to address the structural bottlenecks and risks outlined above. These measures can collectively be called as “facilitating public funding” mechanisms and can include:
• Creditguarantee/enhancementschemes;• Riskguaranteeschemes;• Subordinatedpublicfinancetoprolongtenorof
debt financing; and• Interestsubventionorgovernment-
intermediated concessional lines of credit for financial institutions.
Table 6 debates the pros and cons of each of these instruments.

Paving the Way for a Transformational Future: Lessons from Jawaharlal Nehru National Solar Mission Phase I
32
Table 6: Facilitating Public Funding mechanisms
Public Funding Instrument
Pros Cons
Credit guarantee/enhancement scheme
• Inthenatureofaguaranteeandhencemore efficient than direct payment tools (e.g., FiTs, GBI, VGF, etc.), as they can leverage bank financing by using little or no public subsidies.
• Creditenhancementscanpotentiallyimprove the credit rating of debt instruments to be issued by borrowers, thus reducing the cost of financing.
• Creditguaranteescanleadtononrecourse financing structures.
• Riskoffree-ridingandmoralhazard,ascommercial debt can effectively ride on the back of public guarantees. This can, however, be suitably minimized by structures such as partial guarantees, etc.
• Canbeanopeningfortransferringcommercialrisks to the government. This can again be minimized by specifying risk-related exclusions, e.g., on account of technology failures, which should ideally be borne by the developer (through a guarantee from the supplier).
Risk guarantee/enhancement scheme
• Addressesspecificriskssuchaspayment defaults by distribution utilities and, thus, enhances bankability of projects. Alternatively, enhances the credit rating of the borrower through partial credit guarantees.
• Moreefficientthandirectpaymenttools (e.g., FiTs, GBI, VGF, etc.), as they can improve bankability by using little or no public subsidies.
• Canbetailor-madefordifferentphasesof technology maturity.
• Transferscommercialrisktothegovernment.Should ideally be linked back comprehensively to all forms of government support to distribution utilities to protect government against free-riding by distribution utilities.
Subordinated public finance to prolong tenor of debt financing
• Moreefficientthandirectpaymentschemes as well as guarantees, as credit is recoverable.
• Hassignificantimpactonreducingthe cost of borrowings and addresses the asset liability management-related issues of commercial banks.
• Governmentbenefitsfromtheduediligence of commercial banks, which are the senior lenders to the project.
• Selectiveattempttoresolveaproblemcurrently faced by all infrastructure projects in the country.
• Requiressubstantiallylargerfinancialcommitment from the government than guarantees (as it is in the nature of co financing projects with the private sector) to be effective. Can be raised from bi/multilateral development banks.
Interest subvention or government intermediated concessional lines of credit for financial institutions
• Directlyreducesthecostoffinancing.• Dedicatedlinesofcreditforsolar
projects can prompt commercial banks to lend to solar projects with a positive externality in building capacity of such institutions in appraising solar projects.
• Effectivelyasubsidyschemeattemptingto“buy-down” the cost of solar generation.
• Concessionalfinanceislimitedandunlessleveraged properly, has the effect of simply crowding out commercial finance. There may also be the propensity of banks to stop lending when such lines of credit are exhausted.
Source: Authors’ research.

33
Paving the Way for a Transformational Future: Lessons from Jawaharlal Nehru National Solar Mission Phase I
3.1.3 Comparative Assessment
For GoI, it will be essential to analyze the extent of financial commitment that would be required for each of the above financial instruments (direct public funding and facilitating public funding) to be utilized over Phase II of the program.
A simple analytical framework was developed to assess the extent of budgetary support required for each instrument/mechanism operating in isolation. The assumptions underlying the analysis and its outcomes are presented in Table 7.
Not surprisingly, the options under direct public funding have the highest impact on budgetary support, while those under facilitating public funding have lower budgetary requirements (and are contingent in nature) while offering substantial leverage. It is essential, however, to appreciate that facilitating public finance or risk-reducing mechanisms play only a limited role in reducing costs/tariffs and their true potential lies in addressing specific long-term risks/barriers that the industry faces, thus paving the way for a market-driven and sustainable cost reduction over time.
Table 7: Analytical Framework for Analyzing Financial Instruments/mechanism
Funding Instrument/mechanism
Capital Subsidy/VGF
GBI Interest Subvention
Subordinated Public Finance to Prolong Tenor
Credit Guarantee/Enhancement
Extent of budgetary support on a per MW basis for achieving a 0.50 paisa reduction in tariff
INR 4.6 million (~US$76,700)
INR 4.8 million (~ US$80,000)
INR 4.4 million (~ US$73,333)
INR 0.8 million (US$13,333)#
# Based on the assumption of 5% NPA
INR 3.7 million (US$61,667)##
## Consists of two components; 5% of NPA and additional GBI
Key additional benefits
• Directimpact on tariff
• Reducescapital exposure of lenders
Emphasis on performance
Draws commercial banks into lending
• Inthenatureofdebtfunds
• Shalldependontheextent of commercial financing
• Canberaisedfrom multilateral development banks as sovereign loans
• Notinthenatureofasubsidy
• Refundablecapitalsupport
• Contingentexposure
• Canberaised from multilateral development banks as loans
• Canleverageinvestments with zero or limited public funding
Key criticism Not appropriate for commercial technologies: low emphasis on actual performance
Extends government support over the life-cycle of the project
• Concessionalfinance is limited
• Effectivelytranslates into subsidy
Attempts to solve a larger financing issue encountered on all infrastructure projects
Propensity for free-riding and moral hazard by financiers/Discoms
Source: Authors’ research.

Paving the Way for a Transformational Future: Lessons from Jawaharlal Nehru National Solar Mission Phase I
34
Key Assumptions for Analysis:• CapitalcostatINR75millionperMW(~US$1.25millionperMW)• Capacityutilizationfactor:17%withannualdegradationof0.25%• Debtconsideredat70%oftheoverallprojectcost• Interestonlong-termloanat11.50%withatenorof10yearsandmoratoriumof2years• Allsubsidycomputationsareinpresentvalueterms• Subsidyincaseofcreditguarantee/enhancementandsubordinatedpublicfinancingoptionsisassumedto
finance 5% contingent defaults/NPAs• Subordinatedpublicfinancingresultsinprolongingthetenorto18yearswithmoratoriumof2yearsto
achieve 50 paisa reduction in tariff• Allscenariosarecomputedtoachieveidenticalinternalrateofreturnforequityholders• VGFhasbeenconsideredasprescribedundertherevisedguidelines.However,thequantumofVGFhas
been considered just adequate to bring down the tariff scenario within comparable limits• VGF,however,ifconsideredaspertheprescribedframeworkinthereviseddocumentsiscapableof
bringing down the tariff by INR 1.46 per kwh
Another scenario has been considered within the same framework of capital cost to analyze the quantum of support required to bring down the tariff to INR 5.45 per kwh. In this framework of analysis, it is observed that if a support of INR 33.3 million (US$0.56 million) per MW is considered, tariff can be brought down to INR 5.45 per kWh. In this analysis, the envisaged support of INR 33.3 million (US$0.56 million) is spread over a period of 6 years as envisaged under the revised framework.
Source: Authors’ analysis and assumptions based on authors’ primary research.
Figure 19: Comparison of Subsidy Support for Public Financing Options
Comparison of Subsidy Support for each Public Financing Options (to achieve an illustrative INR 0.50 reduction in tariff)
6.0
5.0
4.0
3.0
2.0
10.
0.0GBI VGF Interest
SubventionCredit Guarantee/
EnhancementSubordinated
Public Financing to prolong tenor
Pres
ent V
alue
of S
ubsid
y Su
ppor
t in
INR
Mill
ion
per M
W
4.8 2.2
4.4
1.5
4.6
0.8
Additional GBI assumed to achieve
INR 0.50 tariff reduction.
1% improvement in interest cost
improves tariff by INR 0.33; default rate of 5% assumed to be
subsidized.
Figure 19 shows the comparison of subsidy support required for the various public financing options.
Clearly, segments of JNNSM which are guided by considerations of affordability, such as off-grid
35
Paving the Way for a Transformational Future: Lessons from Jawaharlal Nehru National Solar Mission Phase I
applications, rooftop solar and demonstration CSP projects, will require some form of direct public funding support. The efficacy of direct funding support for promoting the bulk of the commercial program under solar PV needs, however, to be carefully evaluated by the government vis-à-vis other forms of public funding. Transparent disbursements through bidding, and penalties for not achieving defined performance parameters can be adopted to enhance the effectiveness of direct funding support. The extent of funding and mix of instruments/mechanisms will also fundamentally be determined by the availability of funds from sources such as NCEF.
Facilitating public financing schemes takes time in designing and monitoring, and the actual outcome is determined by the efficiencies of financial intermediaries. Nevertheless, they are fundamental in addressing key financial impediments and in moving solar development to a largely nonrecourse financing mode in India, critical to the scale of development under subsequent phases of JNNSM
3.2 Promoting Local Manufacturing: Exploring Customized Industrial Policy Actions
JNNSM outlines an ambition to transform India into a solar energy hub including establishing a “leadership role in low-cost, high-quality solar manufacturing, including balance of system components”. Further, the country also desires human resource development and enhancement of Research and Development (R&D) capabilities in the solar energy space.
The desire to be relevant across the manufacturing value chain in both solar PV
and solar thermal technologies is based on the following considerations:
• Thelargeandpredictablelocalsolargeneration capacity addition, envisaged under JNNSM, offers a significant captive market that can be leveraged to develop a local manufacturing base, thus contributing to manufacturing output and employment generation in the country; and
• Acompetitivelocalmanufacturingindustryis critical in the technology-intensive solar industry, as it enhances long-term energy security and creates an ecosystem for local innovation and adaptation.
Recognizing these aspects, the National Manufacturing Policy of 2011 (Department of Industrial Policy and Promotion (DIPP) 2011), identifies solar energy as amongst the industries of strategic importance where national capabilities are envisaged to be developed to make the country a major force.
To promote local manufacturing, Phase I of JNNSM specified DCRs in solar projects. These stipulations, however, were applicable only under JNNSM. Larger solar power generation capacities have been added under state solar policies which do not specify DCRs, and this is likely to be the case over JNNSM Phase II.
The unintended outcome of domestic content stipulations for solar PV projects in JNNSM has already been discussed in the earlier chapter. The form and continuance of domestic content over Phase II of JNNSM has since been keenly debated and evokes strong and contrary reactions from sections aligned on both sides of the debate. It is important, in this scenario, to view the role of DCR in the overall

Paving the Way for a Transformational Future: Lessons from Jawaharlal Nehru National Solar Mission Phase I
36
context of promoting local manufacturing in the country.
It is necessary that the industrial policy aspects are well considered in the current debate on the solar power being centric to the energy security policy in India. DCR thus addresses only one narrow segment of demand-side actions, which in itself may not be sufficient to make local manufacturing self-sustainable and address its competitiveness in the long term. Obvious industrial policy actions are supply and demand measures, as would happen for solar industry anywhere worldwide.
Box 1 indicates the range of demand- and supply-side actions that could be employed by the government in promoting local manufacturing.
Demand-side policy measures focus on providing captive demand and do not address competitiveness vis-à-vis global suppliers. Promoting local manufacturing would require
Possible Policy Actions
Demand Side• Pricepreference/incentivesforlocallyprocuredequipment• DCR• Mandatorylocalmanufacturingfacilitiesforalargerpipelineof“publicprojects”• Tariffbarriersforimports
Supply Side• Rationalizationandsimplificationofbusinessregulationsformanufacturing• Financial/fiscalincentivesformanufacturers• Addressingbackwardlinkagesandinputcosts• ClusteringandaggregationthroughNationalInvestmentandManufacturingZones\andSpecialEconomic
Zones• Exportfinancialassistanceandguarantees
Box 1 : Policy Actions for Promotion of Local manufacturing
coordinated actions on the supply side, which are fundamental and address the root of factors impacting long-range competitiveness of the manufacturing industry.
Demand-side policy measures such as price preference or DCR combined with price support mechanisms or subsidy from the government are also likely to be construed as “specific”24 to the domestic industry and discriminating against imports, running the risk of challenges under the World Trade Organization (WTO). Tariff barriers on imports, on the other hand, may not be acceptable to state governments, whose policies do not distinguish between domestically manufactured products and imports.
In the above context, GoI will need to debate the form of policy actions it wishes to undertake to promote local manufacturing. Figure 20 highlights a broad framework to design specific industrial policy actions.
24 Agreement on Subsidies and Countervailing Measures under WTO defines “specificity” of subsidies, which are prohibited under the Agreement.

37
Paving the Way for a Transformational Future: Lessons from Jawaharlal Nehru National Solar Mission Phase I
25 Source: FICCI Solar Energy Task Force Report on Securing the Supply Chain for Solar in India.26 World Bank Report - Development of Local Supply Chain: The Missing Link for Concentrated Solar Power Projects in India.
Source: Authors’ research.
Figure 20: Framework to Design Industrial Policy Actions
The design of an industrial policy action in this regard needs to consider the overall objectives of ensuring long-term energy security, assuring cost effectiveness, and realizing economy-wide benefits (for example, job creation, sustainable growth, and so on). Each of these objectives will need to be evaluated to arrive at a set of prioritized actions, as outlined in the example below.
• Objective of energy security: Active promotion of next generation solar PV technologies through R&D, international technology collaborations and incentives; roadmap for localization in the CSP value chain;
• Objective of cost effectiveness: Phased DCR to benefit from lower global prices while ensuring
domestic uptake in manufacturing; focus on input-side factors to make domestic industry more competitive; and
• Objective of deriving economy-wide benefits: Focus on job creation and leveraging existing industries for value addition across the solar value chain. (For example, the Indian solar PV manufacturing industry provides jobs to more than 25,000 employees with a total installed capacity of 1,100 MW of cells and 1,800 MW of modules.25 In case of solar thermal, for an installed capacity of 10,000 MW by 2022, the total manpower requirement is expected to be 96,000 and 44 percent of this would be linked with local manufacturing26.)
Iden
tify
set o
f prio
ritiz
ed a
ctio
ns in
line
with
key
obj
ectiv
es fo
r so
lar p
rom
otio
n
Energy security Solar PV
Cost-effectiveness
Solar Thermal
Economy-wide benefits
Which technologies to bet on? How should next generation technologies to be promoted?Are there any critical components which hold the key?
• Identifyrelevantpartofvaluechain for competing
• Supportmanufacturingindustry through addressing structural bottlenecks
• Activepromotionofnext generation solar PV technologies
Key Considerations
• Localcapabilities
• Internationalmarket situation/competition
• Availabilityofdomestic funds
• SolarPV&CSP will solicit customized approaches through an appropriate industrial policy
Need for a detailed technology roadmap developed for both PV and CSP
DCR needs to be aligned with the technology roadmap
Adopt mission mode to focus on increasing domestic value addition and technology depth
Identify trade off between DCR and lower solar tariffs due to international competition
• Needtoadvancedemonstration projects aimed at field evaluation of different configurations
• Leadtoclearerchoicesonthebest suited configurations & facilitate localization
Focus on job-creation and leveraging existing industries for value addition across the solar value chain

Paving the Way for a Transformational Future: Lessons from Jawaharlal Nehru National Solar Mission Phase I
38
In this context, the country faces policy design choices in a framework of cognizance of local capabilities, international market situation, and availability of domestic funds. With solar PV and CSP requiring different manufacturing capabilities and investments, both technologies will require customized approaches from the government through an appropriate industrial policy. One of the key requirements shall be the drawing up of clear technology scenarios for solar (PV and CSP) generation and application to enable a manufacturing roadmap to be finalized for India.
Solar PV manufacturing needs to be seen from the perspective of current global market dynamics as well as the potential it holds in the future for India. The solar PV manufacturing segment has witnessed significant developments in the last few years, with a number of manufacturers announcing bankruptcies. There is also the emergence of technology advancements in the manufacturing procedures as well as use of materials for solar PV cells, including commercialization of measures such as single stage purification of silicon, vapor deposition, and so on, which are likely to lead the wave of next generation of technologies in manufacturing. In India too, MNRE and select public sector undertakings involved in PV manufacturing have been actively looking at the next generation of technologies, which are likely to lead the market. It is opportune time to create a detailed technology roadmap for both PV and CSP, which can lead to a more informed policy on manufacturing with an appropriate focus on next generation of technologies through R&D and appropriate international collaborations.
For a clearer technology roadmap to evolve in solar thermal, there is a need to advance the demonstration projects aimed at field evaluation of different configurations for obtaining feedback on performance, operability and costs of different technology streams. This will hopefully lead to clearer choices on the best suited configurations
for the country, essential for local manufacturing and services to take root in India. Aspects related to the development approach for solar thermal are discussed further in the next section.
DCR needs to be aligned with the technology roadmap and prioritized segments of the value chain (separately for solar PV and CSP) in a comprehensive industrial policy action. This should be promoted in parallel with supply-side measures to achieve the goals. A detailed assessment of the impediments faced by the domestic manufacturing industry and a plan to localize manufacturing of critical components are essential to structure supply-side policy measures.
GoI started with DCR (a demand-side measure) as a policy action to promote manufacturing. A phased approach (which reduces year on year) to DCR is essential to ensure that the domestic industry moves up the competitiveness curve and is globally competitive over a period. In the absence of a roadmap for the promotion of preferred technologies, the DCR should be applicable to the entire value chain (thereby giving the choice of least-cost technology path to the investors).
Without a mission mode focus on increasing domestic value addition and technology depth, Indian manufacturing in solar is unlikely to progress far. A Task Force, with representation from other concerned government departments (for example, DIPP) and other relevant organizations (for example, the National Manufacturing Competitiveness Council (NMCC) and Planning Commission) should be set up to identify specific and coordinated industrial policy actions required by GoI to enhance the competitiveness of solar manufacturing in India. An example of such a mission mode approach can be seen in the automobile sector, with the Department of Heavy Industries and Public Enterprises, GoI, formulating the Automotive Mission Plan 2006-16 in 2006.

39
Paving the Way for a Transformational Future: Lessons from Jawaharlal Nehru National Solar Mission Phase I
3.3 Solar Thermal: Public Private Partnerships (PPPs) vis-à-vis Private-led Development
Phase I of JNNSM adopted a reverse auction approach to project selection and development, which is akin to the Case 1 route followed in the power sector in India, to procure power from conventional power plants or through competitive bidding from renewable sources (refer Annex 16). This approach leaves all activities from project identification, choice of technology, design, development, commissioning and operation in the hands of the developer and focuses on the output, selecting developers based purely on the tariffs they quote.
A solar thermal developer is thus tasked with identifying suitable land, measuring on-site solar radiation, obtaining clearances and consents, arranging water linkage, and so on, before thinking of design, engineering and construction of the plant. Even if a developer undertakes all the initial activities to establish the feasibility of a solar thermal plant, there is no guarantee of emerging successful in a competitive environment under the reverse auction framework.
A probabilistic model of procurement such as this is more suited for fully commercial technologies, where upfront costs incurred in establishing feasibility are limited and the knowledge and experience of developers are well established. It is more appropriate where output or capacity addition is the focus, leaving the means to be determined by private players.
Solar thermal projects, on the other hand, use technologies that are varying and in the initial stages of commercialization, with inadequate
experience and demonstration in the Indian environment. It is desirable for such project developers to invest more in establishing the techno-commercial feasibility before launching into design and development. A Case1 type of probabilistic model of procurement presupposes that a large number of developers have invested upfront in establishing project feasibility before bidding under a reverse auction, which holds only a probability of success. It leads to a scenario where either a large number of unsuccessful bidders will bear the upfront investment costs without economic gains, or the more undesirable prospect of bidders bidding without adequate preparation, which stands to jeopardize project development and the overall program.
When Phase I of JNNSM was bid out, information and on-field data were unavailable. Further, the reverse auction framework, unlike Case 1 in conventional power, did not require bidders to demonstrate land availability, technical competence, other preliminary activities, and consents and clearances for a project,27 as a pre-qualification for bidding. It is thus not surprising to find that several of the solar thermal projects are currently encountering technical and site-related challenges, and are delayed.
Solar thermal is a promising technology for India, with its significant indigenization and cost-reduction potential and its technical ability to be hybridized and offer thermal storage. The most appropriate designs and standardizations in solar thermal are yet to be developed with respect to India’s requirements and should, therefore, be the focus of early development work. Fundamentally, the understanding of solar thermal amongst financiers is, at best, limited and most such projects are not able to obtain financing without recourse to promoters or suppliers.
27 Except for water availability, which was required under Clause 3.5D of the Guidelines for Selection of New Grid Connected Solar Power Projects for Phase 1 of JNNSM.

Paving the Way for a Transformational Future: Lessons from Jawaharlal Nehru National Solar Mission Phase I
40
It is, thus, desirable to adopt a more deterministic model of development with larger public sector involvement than that achieved in Phase I of JNNSM. It is crucial for early developments in solar thermal to build in desirable technology features and to demonstrate on-field performance to evolve an acceptable pathway for large scale deployment. Given the significant preliminary efforts involved, it is desirable for the government to share such responsibility and play a facilitating role in tapping financing for such projects.
Stakeholders consulted during the study agree that larger public sector involvement in identifying, scoping and undertaking preliminary activities is essential before inviting participation of private players. This is more akin to the Case 2 mode of technology and site-specific participation by private players adopted for conventional power projects in India.
The approach to grid-connected solar thermal plants proposed for subsequent phases of JNNSM is depicted in Figure 21.
3.4 Role of Central Government: Co-development vis-à-vis Central Sector Projects
The draft JNNSM Phase II policy document outlines a differentiated pathway for central and state sector projects, with the policy covering incentives and support mechanisms only for central projects. Only 40 percent of the 9 GW of grid-connected capacity in Phase II is planned to be developed by the central government, with the remaining 5.4 GW to be developed by the states.
In the federal structure in India, it is fair to expect states with solar potential to develop their
Source: Authors’ research.
Figure 21: Proposed Solar Thermal Roadmap for Subsequent Phases of JNNSm
Phase II
Phase II
Phase II Phase II
Phase III
Develop Demonstration Projects
PPP Model Private-led model
• UnderaPPProutewithdesirabletechnology features such as storage, air-cooled condensation, hybridization, etc.
• Tapintoconcessionalfunding,suchas Clean Technology Fund or other sources available with multilateral and bilateral development banks
• Projectbiddingwithspecifictechnical specification under a BOOT or BOOM model
• Deterministicapproachwithsite identification, preliminary activities and techno-commercial feasibility completed by a public-sector entity, such as SECI
• Analyzedevelopmentinmanufacturing value chain & explore need for coordinated industrial policy actions and eco-systems development plans in order to indigenize areas of solar thermal manufacturing.
Gather lessons from
Phase II projects: Decide
on desirable technology standardization &
incorporate them into grid-connectivity
standards of Central Electricity Authority
• Evaluateshifttoprojectallocation on a purely private model.

41
Paving the Way for a Transformational Future: Lessons from Jawaharlal Nehru National Solar Mission Phase I
own policies to encourage investments in solar generation. Equally, state governments would welcome investments in the state facilitated by the central government through incentives or otherwise. There is, thus, no apparent conflict between instituting two parallel pathways in developing solar projects in the country, provided however that they are harmonized in some way. Unfortunately, most state governments pursuing solar policies may not have the fiscal space to match the central government with direct public financing mechanisms. In these circumstances, the country will have some 3.6 GW of projects under JNNSM Phase II benefitting from direct public funding schemes, and the remaining 5.4 GW without such an advantage. This will lead to a set of projects with varying tariffs and subsidies which will be consequently perceived quite differently by distribution utilities, financiers and suppliers.
In this regard, it is pertinent to enquire what the desirable role of MNRE should be under JNNSM and whether more harmonized development should be attempted through the central government policy framework.
As discussed earlier in this report, the primary policy/regulatory mechanism for creating the demand pull for grid-connected solar generation is the solar RPO. The route to capacity addition is also acknowledged as private-led. Public support mechanisms thus assume a larger and strategic role of addressing specific barriers and covering key risks in the way of solar development in the country. Viewed in this context, it is questionable whether JNNSM Phase II policies should limit focus only on creation of 3.6 GW of capacity, for which central support is available.
Despite the overwhelming response of the private sector to Phase I of JNNSM and the state solar
policies, it is still early days in the life-cycle of solar development in this country. Progress on solar thermal projects is far from satisfactory, commercial nonrecourse financing has mostly eluded the sector, domestic manufacturing has struggled, and bottlenecks in an enabling environment need to be addressed to scale up the program. These are fundamental issues and need a coordinated, pan-Indian response. GoI, thus, has an important facilitating role in all solar projects, irrespective of their mode of development.
Instead of limiting itself to the 3.6 GW of projects under the central scheme, a better role for GoI could be to outline a coordinated vision of solar development for the entire country and to structure public funding to realize this vision. An alternative vision of this development could include the following elements:
• Allsolarthermalprojectstobedevelopedthrough the Case 2 mode with the provision of facilitating financing schemes from the central government;
• Centralgovernmenttoplayanactiveroleindeveloping solar parks in coordination with state governments and to promote organized development through these parks. This will ease infrastructure-related challenges faced by developers and ensure coordinated transmission planning and deployment of smart-grid related features at the transmission level. Policy to aim for all projects to be developed through such parks;
• Directpublicfunding28 can be advanced to the solar parks to reduce the cost of such infrastructure for project developers. A standard, concessional charge for infrastructure could be specified for all solar park-based projects in Phase II; and
• Allprojectsadheringtoarobustandsufficientlyimproved standard PPA and set up in solar
28 It is worth pointing out that there is a strong economic rationale in advancing direct public financing to solar parks, with positive externalities such as optimization in infrastructure use, including land, water and evacuation facilities, and provision of scale to use smart-grid features in grid integration of solar.

Paving the Way for a Transformational Future: Lessons from Jawaharlal Nehru National Solar Mission Phase I
42
parks should be able to avail of facilitating public finance through central government schemes, such as credit enhancements/guarantees and/or subordinated public debt.
The existing public institutions and their role under the solar program are outlined in Annex 17. Table 8 summarizes the existing institutional roles under Phase I of the program and identifies significant gaps which need to be addressed over subsequent phases of the program.
The mapping (Table 8) shows substantial gaps in institutional capacity in MNRE and its institutions to play the roles expected of them under JNNSM.
The incorporation of the Solar Energy Corporation of India (SECI) is thus a welcome move and could provide the institutional support to undertake
Table 8: Institutional Gaps
Function Institutions under Phase I GapsProgram management, monitoring and evaluation
• MNRE(NVVN)forlargeprojects• IREDAforRPSSGP
• SustainingcapacitydevelopedinPhaseIis a challenge, as substantive support from NVVN was received
• Rooftop,off-gridandsolarapplicationshavenot progressed much
Demonstration projects
• MNRE • LimitedCSPdemonstrationprojects;noperformance data available for CSP
• Needaninstitutionwithearmarkedresources for project development and operation
Resource assessment • C-WET • SatisfactoryprogressInfrastructure development
• Stateagenciesanddevelopersin Phase I
• Land,rightofway,waterandinterconnectionhave been significant bottlenecks; SNAs lack capacity
• Provisionofsharedinfrastructurenecessary– need for dedicated central and state-level institutions to coordinate solar park development
Ecosystem development
• Center/state • Noinstitutionalroleidentifiedforsuchdevelopment
Source: Authors’ research.
several of the roles outlined in Table 8. Strengthening of SECI with appropriate internal resources and external linkages is critical in this regard.
Some of the roles that SECI could play in line with the gaps identified after review of Phase I are:
• DevelopCSP(andothersemi-commercialtechnologies) demonstration projects through private and/or technology partnerships;
• Developsolarparksinassociationwithstates.Support state governments and SNAs in providing technical advisory and administrative support for solar parks;
• Transitionprogrammanagement,Monitoringand Evaluation (M&E) from NVVN in a phased manner;
• Incubateoff-gridbusinessmodelsinpartnershipwith SNAs and hand-hold SNAs to upscale and

43
Paving the Way for a Transformational Future: Lessons from Jawaharlal Nehru National Solar Mission Phase I
replicate successful initiatives through private partnerships;
• AddresssolarPVintegrationissueandfacilitatea comprehensive national plan that coordinates generation scale-up, T&D expansion plans, control and dispatch systems, and draws up a vision for implementing storage systems; and
• Besidestheabove,SECIcouldalsoplayacoordination role in R&D efforts and in ecosystem development, provided internal capacities are built in this regard.
3.5 Development through Solar Parks (Cluster-based Approach)
Experiences from Phase I of JNNSM indicate a strong need for organized development of grid-connected solar projects. A more deterministic approach to planning of shared infrastructure through the provision of solar parks is the way forward to optimize land and water, enhancing grid-connectivity and evacuation infrastructure, and developing transmission in a coordinated manner as envisaged under the green corridor,29 conceptualized by the MNRE. The successful implementation of the first solar park in Charanka, Gujarat (Annex 18), demonstrates the potential for future replication of such model across other states. The Government of Rajasthan has also laid (in August 2013) the
foundation stone for a solar park in Bhadla of Jodhpur district of Rajasthan. The solar park with a proposed generation capacity of 3,000 MW would be commissioned in phased manner. In its first phase, the solar park will generate 1,000 MW.
Such development (public or private) could be promoted through positive incentives in the form of capital subsidy to partly fund the development of the infrastructure. Projects outside such parks may not be prohibited but could be structured to lose out on such incentives.
Solar parks also lend themselves to cluster development, where appropriate, with co-location of industries with forward and backward linkages.
As proposed in the earlier section, MNRE may consider making solar park-based development the baseline in Phase II of JNNSM. The alternative of developing large, grid-connected solar plants in a fragmented and decentralized mode is sub-optimal and damaging in the long run, and procedurally arduous and risky for developers. The provision of public funding for solar park development will prompt states to adopt solar parks as the baseline option and expend efforts in identifying and developing such infrastructure. SECI could provide advisory and administrative assistance in structuring solar parks.
29 Report on the Green Energy Corridor prepared by the Power Grid Corporation of India Ltd. as part of a study commissioned by MNRE and FOR.

44
Paving the Way for a Transformational Future: Lessons from Jawaharlal Nehru National Solar Mission Phase I

45
Paving the Way for a Transformational Future: Lessons from Jawaharlal Nehru National Solar Mission Phase I
JNNSM has signaled a decisive start with strong interest from the private sector matched by bold policy support from GoI. This private-led development model, particularly for grid-connected solar PV, builds a strong base for scaling up the program over subsequent phases of JNNSM.
An evaluation of Phase I through wider stakeholder consultations, while indicating several positives, also points to certain barriers and challenges to scaling up the program to the levels envisaged under JNNSM and beyond. In this context, the report debated certain key policy options to address the existing constraints and to realize the overall benefits of JNNSM outlined in the mission objectives.
Key conclusions on the way forward are:
1. Addressing structural impediments to commercial financing: A sustained participation from commercial lenders is seen as critical for achieving the scale of capacity addition
envisaged under subsequent phases of the National Solar Mission. The role of “facilitating public funding” in enabling implementation of risk-reducing instruments as well as innovations in financing is significant and comes across as an imperative for moving solar development to a largely nonrecourse financing mode in India. The efficacy of direct public funding in “buying-down” the cost of electricity for the bulk of the commercial program under solar PV needs to be carefully evaluated by GoI vis-à-vis other forms of facilitating public financing. Subordinated public finance to prolong tenor of debt as well as credit guarantee enhancement schemes ought to be structured and pursued over subsequent phases of JNNSM.
2. Comprehensive industrial policy actions for promoting solar manufacturing: GoI’s National Manufacturing Policy 2011 recognizes solar manufacturing as a strategic industry requiring the development of national capacities. There is a need to analyze measures for domestic value
4. Way Forward

46
Paving the Way for a Transformational Future: Lessons from Jawaharlal Nehru National Solar Mission Phase I
addition and technology depth to evaluate the segments of the value chain for domestic participation and, thus, customized industrial policy approaches will be required for solar PV and CSP. A shared understanding of a framework to design these specific industrial policy actions for solar manufacturing is solicited. A mission mode approach is essential to analyze and increase domestic value addition and technology depth through the creation of adequate forward and backward linkages, addressing specific input (raw materials and consumables, power, resources, technology, and so on) disadvantages faced by Indian manufacturers vis-à-vis their overseas counterparts.
As far as solar PV is concerned, currently there is immense uncertainty in the global market demand-supply situation. The focus is also beginning to shift towards the newer generation of technologies, which have the potential of cost reduction and/or improvement in efficiencies. It is appropriate for GoI to evaluate a technology roadmap for solar PV and focus on the next generation of technologies through active promotion of R&D and international collaborations. Further, in light of recent international experience, upstream capital intensive investments in polysilicon and solar cell manufacturing need careful analysis before being replicated in India. Downstream investments in modules and Balance of Systems (BoS), including applications, seem to promise a better future for business viability and creation of jobs.
Solar thermal, in particular, holds significant potential for India as it can leverage advanced manufacturing processes from conventional industries such as automotive, metals, power equipment manufacturing, and so on, and develop a local ecosystem for technology adaptation and cost reduction. For this to happen, though, a clearer technology roadmap
needs to emerge for solar thermal as well in the country. It underlines the need for advancing the demonstration projects aimed at field evaluation of different configurations for obtaining feedback on performance, operability and costs. This, in turn, will lead to standardization in configurations, essential for local manufacturing to take root and for the government to commit to the development of local ecosystems for solar thermal manufacturing in India.
3. Phased DCR: Phase I of JNNSM saw demand-side actions, led by MNRE, such as DCRs or tariff barriers on specific imports. These measures have not led to the revival of the local industry and are subject to challenges under international trade regimes.
DCR needs to be aligned with the technology roadmap, and prioritized segments of the value chain (separately for solar PV and CSP) under comprehensive industrial policy action. It may be advisable to adopt a gradually-tapered DCR, which reduces over time, to allow time for the domestic industry to come up to the scale and competitiveness of global competitors. Without a clear technology roadmap, DCR should be applicable to the entire supply chain, with developers allowed to make the choice of technology and components, which can be sourced locally to the extent specified by the government. The manufacturing industry is also better served with a more active mission mode focus on industrial policy actions, combining appropriate demand- and supply-side measures to make it internationally competitive.
4. PPPs for solar thermal development: Given the local manufacturing capability, dispatchability, possibility of hybrids and storage technologies, and cost reduction potential, CSP development holds promise for India. It should be ensured that, given the slow development of CSP projects in Phase I, the technology is not penalized

47
Paving the Way for a Transformational Future: Lessons from Jawaharlal Nehru National Solar Mission Phase I
in Phase II. It is desirable to pursue a more deterministic model of development for solar thermal with larger public sector involvement in project preparation than that achieved under Phase I of JNNSM. There is a need for a more coordinated and guided approach from the government, in terms of more upfront project preparation before bidding, to move the industry forward in the desired direction. Further, sound technical due diligence of bidders should be undertaken as a pre-qualification exercise. The relatively long development time of the CSP projects in India stems in part from lack of expertise of the EPCs and lead members of the consortia. The following pathway is envisaged for solar thermal under Phase II and beyond:
‒ SECI should focus on developing demonstration projects with desirable technology features such as storage, air-cooled condensation, hybridization, and so on. Such projects are envisaged under JNNSM to be developed through PPPs;
‒ A detailed assessment is required of the manufacturing value chain along an outline of coordinated industrial policy actions and ecosystem development plans to indigenize production;
‒ Any further capacity development under Phase II should ideally be undertaken only within a deterministic model with site identification, preliminary activities, and techno-commercial feasibility completed by a public sector entity such as SECI, before bidding it out with specific technical specifications through a Build Own Operate Transfer (BOOT) or Build Own Operate Manage (BOOM) route;
‒ Gather lessons from Phase II projects to decide on the desirable technology standardization for solar thermal projects, which could be adopted in grid connectivity standards of the Central Electricity Authority; and
‒ Based on the success of Phase II, decide on the move to a fully private-led model of procuring
power from such projects over Phase III of JNNSM.
5. Large project development through solar parks: MNRE should consider making solar park-based development the baseline for large, grid-connected solar projects in Phase II of JNNSM. By providing public funding support for infrastructure development in solar parks, GoI can prompt states as well as private parties to adopt solar parks as the baseline for large, grid-connected solar power development, thus paving the way for an orderly grid development with optimized use of resources.
6. Enhancing institutional capacity through SECI: The pan-Indian role of MNRE in ensuring a coordinated development of the solar industry is fundamental to JNNSM. It was argued that incentives and GoI support are better directed at measures which address fundamental structural and administrative barriers to development of large grid-connected solar projects in the country, rather than being reserved for a fraction of projects to be developed in Phase II of JNNSM. SECI could play a facilitative coordination role, encompassing several institutional roles relating to M&E of the programs under JNNSM, which were otherwise being pursued by MNRE. In addition to the M&E roles, SECI has important roles to play in the following aspects:
‒ Act as the nodal agency for developing demonstration CSP projects in JNNSM Phase II. These can be taken up through private/technology partnerships;
‒ Assist states in the development of solar parks across the country through the provision of administrative, advisory and financial support;
‒ Transition program management and M&E from NVVN for the grid-connected segment;
‒ Undertake enhanced reliable forecasting and scheduling of solar farms and work with the

48
Paving the Way for a Transformational Future: Lessons from Jawaharlal Nehru National Solar Mission Phase I
Power Grid Corporation of India on the T&D expansion plans, and control and dispatching systems or storage implementation;
‒ Play a transformative role in off-grid solar through support for incubation of new business models in association with SNAs, and handhold SNAs in scaling up and replicating the successful initiatives through private partnerships; and
‒ Coordinate R&D efforts and ecosystem development.
The Indian solar sector has made commendable progress since the launch of the JNNSM in 2010. In the international arena, India has
substantial learnings and experiences to share on institutional mechanisms, financing, technology, and manufacturing with the rest of the world. The steps taken by GoI in implementing institutional and financing measures to successfully meet the Phase II targets of installing 10 GW of solar power and letting the private sector roll independently in Phase III will be closely observed by the international community. Thus, it is imperative that the government act on measures to scale up the success already achieved in JNNSM Phase I while simultaneously addressing the structural issues which stand to impede the envisioned growth.

49
Paving the Way for a Transformational Future: Lessons from Jawaharlal Nehru National Solar Mission Phase I
Bibliography
• ADB.2011.ProductInnovationsforFinancingInfrastructure:AStudyofIndia’sDebtMarkets,No.6,South Asia Working Paper Series.
• TheWorldBank.2013.DevelopmentofLocalSupplyChain:ACriticalLinkforConcentratedSolarPower in India.
• MNRE.2012.DraftPhaseIIPolicyDocument:JawaharlalNehruNationalSolarMission.• Sahoo,A.andG.Shrimali.2012.AnAnalysisofIndustrialPolicySupportfortheIndianSolar
Photovoltaic Manufacturing Sector.• ForumofRegulators.2012.ReportonGreenEnergyCorridors-TransmissionPlanforEnvisaged
RenewableCapacity.PGCIL.• DepartmentofIndustrialPolicyandPromotion,GovernmentofIndia.2011.NationalManufacturing
Policy (ANNEX to PRESS NOTE NO. 2 (2011 SERIES)).• InternationalEnergyAgency.TrendsinPhotovoltaicApplications.• NREL.2006.LettingtheSunShineonSolarCosts:AnEmpiricalInvestigationofPhotovoltaicCost
Trends in California. • Beck,F.andEricMartinot.TechInternational,SantaFe,NewMexico.PoliciesandBarriers-,SanDiego
- Smart Energy 2020.• FICCISubgrouponSecuringSolarSupplyChain.SecuringtheSupplyChainforSolarinIndia.2013.• DeutschesInstitutfürEntwicklungspolitik(GermanDevelopmentInstitute).2013.Exploringthe
effectiveness of local content requirements in promoting solar PV manufacturing in India.• CEEW/NRDC.2012.LayingtheFoundationforaBrightFutureAssessingProgressUnderPhase1of
India’s National Solar Mission.

50
Paving the Way for a Transformational Future: Lessons from Jawaharlal Nehru National Solar Mission Phase I

51
Paving the Way for a Transformational Future: Lessons from Jawaharlal Nehru National Solar Mission Phase I
5. Annexes
S No Name Organization S No Name Organization1 Mr. A.K. Magu NVVN 14 Mr. Jatin P Singh SBI Caps2 Mr. Anil Mishra GiZ 15 Mr. Michael Richards Energy Unit Chief,
US Embassy3 Mr. Anudeep Yadav IREDA 16 Mr. N. Venkataraman IL&FS4 Dr. Ashish Kulkarni Nereus Capital 17 Mr. Peeyush Mohit KPMG5 Mr. Ashwini Aggarwal AMat 18 Mr. Rajiv Jain ISA6 Mr. Balawant Joshi ABPS 19 Mr. Rakesh Kumar SECI7 Mr. C. Kannan SECI 20 Mr. Ravinder Raina Astonfield8 Mr. Deepak Gupta Shakti Sustainable
Energy21 Ms. Ritika Goel BHC
9 Mr. Gaetan Tiberghien IFC 22 Mr. Salil Dutt Thermax10 Mr.GopalLalSomani KVK Energy 23 Mr. Sandip Ghosh Schneider Electric11 Mr. Hemanshu Sugandhi REC 24 Mr. Satyen Kumar LancoSolar12 Mr. Hemant Bhatnagar GIZ 25 Mr. Siddhartha Ghoshal Areva13 Mr. Girish Narang Azure Power 26 Mr. Sourabh Kaura PTC Financial
(i) Participants in New Delhi Workshop
Annex 1: Consultative Workshop Details and Key Messages

52
Paving the Way for a Transformational Future: Lessons from Jawaharlal Nehru National Solar Mission Phase I
S No Name Organization S No Name Organization27 Mr. Sudhir Kapoor Country Strategy
Business Consultant35 Mr. P.K. Mahajan NVVN
28 Mr. Sumit Pandey Moser Baer 36 Mr. C. Subramaniam The World Bank29 Mr. T.C. Arora Visa Ecotech 37 Mr. Rohit Tyagi ABPS Infra30 Mr. Usha Sunil Energy Unit, US
Embassy38 Mr. Ankit Jain SBI Caps
31 Mr. V.S. Sharma Steag 39 Mr. B. Pandey Cargo Infrastructure32 Mr. Venkataramani CEO, Indo Solar 40 Mr. Jonas Hamberg CSE33 Mr. Vimal IREDA 41 Mr. Anurag Mishra USAID/India34 Mr. Vineeth
VijayaragahavanPanchabuta
contd...
S No Name Organization S No Name Organization1 Mr. A. Shreerang Aurum Ventures 14 Mr. Mehul Desai Yes Bank2 Mr. Anand Jain Kiran Energy 15 Mr. Pashupathy Gopalan SunEdison3 Ms. Anita Karnik SBI Capital Markets 16 Mr. Rahul Sankhe SunEdison4 Mr. Ardeshir
ContractorKiran Energy 17 Mr. Rajat Misra SBI Capital Markets
5 Mr. Balwant Joshi ABPS 18 Mr. Sachin S. Patel Reliance ADAG6 Mr. C. Kannan SECI 19 Mr. Sanjeev Singhal SBI7 Mr. Chetan Krishna IIT Delhi 20 Mr. Sanket Joshi Electrotherm
Immodo Solar8 Mr. Dhananjay
YellurkarL&TInfraFinance 21 Mr. Sunil Jain Hero Future Energies
9 Ms. Eva D’Ambrosio US Embassy 22 Mr. Swapnil Wankhede LaurenCCL10 Mr. Harsh Nanda Goldman Sachs 23 Mr. Vimal Kumar Cargo Infrastructure11 Mr. Jis George LaurenCCL 24 Mr. Vineeth
VijayaragahavanPanchbuta
12 Ms. Jyoti Mistry Welspun 25 Mr. Vish Iyer Mahindra Cleantech13 Mr. Ketan Shukla GERC
Participants in Mumbai Workshop

53
Paving the Way for a Transformational Future: Lessons from Jawaharlal Nehru National Solar Mission Phase I
Financing SessionLenders’ perspective Financial Support Options
• Publicfinancingsupportwasseenascriticaltoaddressing/balancingtwoobjectives:(a) buying down the cost of electricity; and (b) addressing structural barriers and risks which impede the flow of commercial finance to the sector. Five different options were debated for their relative efficiency and efficacy in addressing these twin objectives: • Interestsubvention• Provisionofprolongingtenoroflending• Creditguarantee• VGFintranches• GBI;
• VGFwasseenasattractiveinloweringthecostofelectricityandthusimprovingtheproject economics and risk perception among lenders. Appropriate structuring of VGF and linking it to loan repayments, and so on, were seen as necessary to avoid misuse. It was acknowledged that the leverage of such an option in the hands of the government was minimal and overall cost of supporting the program may be higher for the government in such an option. VGF’s lack of linkages with output and being interpreted as an obvious government subsidy for the project was acknowledged but was not seen as a lenders’ issue;
• GBI,whilebeinganattractiveoption,leaveslenderswithgenerationrisk.Atthisstage,SCBs are particularly concerned with generation risk since solar PV technology is new under Indian conditions with limited ground operating data;
• Assetliabilitymismatchandnonavailabilityoflong-tenordebtwereacknowledgedby lenders. It was recognized that long-tenor debt would improve project economics substantially and such arrangements can also be optimal for the government compared with direct financial support which is envisaged in the other options. A combination of options from the government enabling long-tenor and lower-cost debt along with direct financial support through VGF/GBI was proposed;
• Counterpartyriskfortheprojectswasseenasmostcriticalinlenders’assessmentofsolar projects, given the comparatively higher tariffs for solar and higher concentration of projects in a few states (which are not necessarily performing well in their distribution businesses). Improving the payment security mechanism and considering SECI as a counter party with back-to-back PSAs with Discoms were some of the suggestions made by lenders; and
• Guaranteeproductswouldbetakenpositivelyiftheyaddresscommissioningrisksandalso cover the initial years of operation.
REC/RPOs• RECmaynotbeabankablestructureinitspresentformsforsolar.Inamarket
characterized by falling capital cost, newer projects would be comparatively better positioned in selling RECs than the older ones. As such, there is always a re-negotiation risk that older projects could face; and
• StricterenforcementofRPOwasabsolutelyessential.ArecentcaseintheAppellateTribunal to give more teeth to RPO enforcement.
(ii) Key Messages from the Workshops held in Mumbai and Delhi

54
Paving the Way for a Transformational Future: Lessons from Jawaharlal Nehru National Solar Mission Phase I
Financing SessionDevelopers’ perspective
Financing Structure
• VGFwasnotapanaceaandfailstoaddresssystemicissues.Itwouldmakeprojectsdependent on government budgetary support from year to year and could be risky. Since the pool is also limited, it may not be the most optimal structure;
• Interestsubventionandlong-tenorloanswerebettersuitedforprojects;• PPAsshouldbemadeuniformandrobustallacross,andshouldbecomprehensiveand
bankable. Address issues of force majeure and termination payment, which are missing at the moment;
• Noreasonforconstructionperiodtobesoaggressivelyprescribedbythegovernment,if no support is being provided on preparatory activities; and
• Anyfinancingstructureshouldnotleadtotyingthedevelopertotheproject.Developers should be allowed to freely invest in and exit projects.
REC/RPOs• RECshavelimitedtakersinthelongterm.Itwouldbewisertoinvestingenerating
asset than to buy RECs; and• RECsarenotlegalinstrumentsandtheyalwaysrunregulatorypricingrisks—regulators
could always change the pricing structure.Technology Session
Lenders’ perspective • Theappropriatenessofthelocalcontentrequirementprovisionwasdebated.Theobjective of JNNSM to promote local manufacturing for long-term energy security was acknowledged;
• Lendershadnobiasforeitherlocallymanufacturedorimportedgoodsonprojects.An important consideration, however, was the reliability/bankability of suppliers who are required to offer long-term warranties. The condition/reliability of Indian manufacturers in the current environment was far from good and a matter of concern;
• Forlocalmanufacturing,GoIneedstohaveanappropriateplaninplacetoenhancethe competitiveness of the local industry. The local industry was established ahead of the Chinese industry and was catering to global needs until the JNNSM was initiated. Addressing fundamental input-side concerns of manufacturers was far more important than providing a captive market under JNNSM;
• AlternativestructureswereproposedforLocalContentRequirement(LCR),ifithasto be the way forward to avoid unintended outcomes such as higher penetration of TFinPhaseI.TheexampleofSouthAfricawasdiscussedwhereagradedLCRof30percent was raised to 50 percent in two steps without specifying the category or kind of equipment to be locally sourced. This allowed enough flexibility for the developers to consider the area in which local value addition could be considered;
• Acluster-basedapproachforprojectdevelopmentwashighlyrecommendedbythelenders and developers. GoI incentives for clusters were seen as a healthy way of promoting its stake in all projects across the country and signaling a clear preference for cluster-based development; and
• Federalstructure-relatedissueswerealsodiscussedwithafocusonthedisparitiesbetween central and state sector policies in availability of incentives:‒ Given the fact that India has one central policy and multiple state policies, the aim
should be to standardize the fiscal/support instruments to ensure a homogenous development of the sector. Projects fulfilling certain minimum criteria (such as cluster-based development, adherence to a standard model PPA, and so on) could then qualify for incentives from the central government irrespective of which policy they fall under.
contd...

55
Paving the Way for a Transformational Future: Lessons from Jawaharlal Nehru National Solar Mission Phase I
Developers’ perspective
Issue of LCR
• LCRwasnotsuccessfulinPhaseIandhadunintendedoutcomes.Hence,itmaynotbethecorrectinstrumenttopromotelocalmanufacturing.AlsospecifyingLCRfor modules and cells cannot address energy security considerations, which need investment in polysilicon. Small, largely unreliable players in cells and modules impede rather than aid the program;
• LCRshouldnotbeenforcedwithdevelopers,particularlywhenglobalpriceshavebeenon the decline and manufacturers are unlikely to invest in new capacities. Benefit from cost reduction globally should set up projects in India;
• Adoptanecosystem-basedapproachtomanufacturing.TheGoIshouldtapNCEFfordeveloping an ecosystem for local manufacturing:‒ Provision of domestic financing using options such as NCEF (to compete with U.S.
EXIM bank financing to encourage Indian manufacturers;• ThedefinitionofLCRshouldberevisitedandcanbemadeapercentageofthetotal
value of a project rather than restricting it to the module and cell level. The BoS can be another area where India can develop competitiveness;
• IndiacanadoptBrazil’smodelinwhichlocalmanufacturersareallocatedsolarprojectsfor development:‒ Investors in domestic manufacturing in the approved phased manufacturing
program should be granted special allocation for setting up solar plants with preferential tariff under JNNSM.
• Indianeedstodeveloptheecosystemtomakesolarequipmentmanufacturingcompetitive:‒ GoI needs to revisit the strategy for enhancing solar manufacturing
competitiveness. Manufacturing is the key to energy security, and India needs to learn from China which focused on the complete value chain with emphasis on polysilicon
‒ Industrial policy is the key to enhancing manufacturing competitiveness and manufacturers need long-term clarity on the demand; and
• ImpactofLCRonfinancing‒ It would be difficult for multilateral agencies to support financing of projects where
domestic content is mandatory.
CSP Requires Support• GovernmentalsupportisrequiredforCSPdevelopment;• AllCSPprojectsmustincludestorage/hybridizationasitwillassistIndiainattainingits
objective of energy security as well as grid parity;• CSPprojectsrequirehighlevelofprecisionandquality,anditmaynotbedesirable
to include DCR in this. DCR may not work in the initial phase, but as the market develops, India can develop competence in the area;
• DevelopersarenotquitecomfortablewiththeGlobalHorizontalIndexdata,however,DNI data are still a concern for CSP project developers; and
• AllCSPprojectsshouldbebidoutasCase2projectswithadequatepreparationbygovernment agencies upfront.
Government Involvement Key for Success of Cluster-based Approach• Landacquisitionisamajorissue,andtheGovernment’sroleiscrucialinthisregard:
‒ The state should identify the land and let institutions such as SECI/state institutions develop it and allocate it to private developers; and
• Theaimshouldbetodevelopsmallclustersclosetoelectricityconsumptionareas.
contd...

56
Paving the Way for a Transformational Future: Lessons from Jawaharlal Nehru National Solar Mission Phase I
Policy/Regulatory SessionRPO Compliance Key for Growth
• ThereisaneedtoenforceRPOstringentlyandbringcredibilitytotheRECmarket.• AnotheroptioncouldbetheRenewableGenerationObligationratherthanaRPO
which can be imposed on new generation capacities based on conventional fuels.
VGF Allocations Need to be Designed Properly
• VGFdependsonyearonyearbudgetaryapproval/sanctionoftheCentralMinistry,which may create a problem:
– VGF could take one time financial support from the NCEF to be passed on as a cash subsidy to developers
– Import costs should be validated by an authority, as there can be a tendency to inflate cost to get a higher cash subsidy under VGF; there are also concerns around developers not investing adequate equity with upfront VGF
– Need to clearly define stringent quality and performance criteria before allotment of VGF. It should be ensured that the developer operates the project for the complete life span; and
• Itisimportanttoundertakeacost-benefitanalysisofalltheoptionsproposedinJNNSM Phase II to determine the impact of these on the tariff as well as the overall economics/growth of the sector.
Other Options for Incentive Disbursement
• Insteadofprovidingupfrontsubsidy/VGFtothedevelopersinproposedstages,therecould be a loan guarantee scheme, under which lenders get paid out from the VGF funds on the successful construction of project.
Database Creation
• ConventionalpowerplantdataistrackedbyMoPandisavailableinthepublicdomain,the same approach should be used for solar projects.
PPA Credibility is Important
• JNNSMwassuccessfulastheprocurerofthepowerwasNVVN.HadDiscomsprocured and signed the PPA, JNNSM would not have had the same credibility for financers.
contd...

57
Paving the Way for a Transformational Future: Lessons from Jawaharlal Nehru National Solar Mission Phase I
Description JNNSM Phase I State PoliciesFinancial criteria
Net worth• Upto20MW-INR30
million/MW (US$0.50 million/MW)
• Forcapacity>20MW- INR 20 million/MW (US$0.33 million/MW)
Gujarat• Internalresourcegeneration:INR12million/MW(US$0.20
million/MW) computed as 5 times the maximum internal resources during past 5 years
• Networth:INR20million/MW(US$0.33million/MW)• Annualturnover:INR48million/MW(US$0.80million/MW)Rajasthan & Karnataka• Networth:INR30million/MW(US$0.50million/MW)
Technical criteria
Commercially established technology with at least 1 year of successful operation
Gujarat: Experience of developing any project in last 10 years with capital costs of not less than INR 30 million/MW (US$0.50 million/MW) with a minimum size of 1 project to be INR 5 million/MW (US$0.08 million/MW)Rajasthan: Same as JNNSM
Allocation process
Reverse biddingDiscount to CERC’s FiT
Gujarat: Projects allocated on first-come-first-served basis on GERC’s FiT which provided certainty on revenue flowsRajasthan, Karnataka, Madhya Pradesh, Tamil Nadu: Followed/propose to follow tariff-based competitive bidding route
Security/Performance Bank Guarantee (PBG)
INR 5 million per MW (US$0.08 million per MW)
Gujarat: PBG - INR 5 million per MW (US$0.08 million per MW)Rajasthan: Security – INR 0.5 million per MW (US$8,333 per MW); Bank Guarantee (BG): INR 2 million/MW (US$33,333 per MW)
Evacuation Batch 1: STU’s responsibility; Batch 2: project developer’s responsibility
Gujarat, Rajasthan: Responsibility of the STU for timely completion of transmission line after the solar substation switchyard Madhya Pradesh, Karnataka: Responsibility of the developer to lay the line up to nearest STU/Discom sub-station
Equity lock-in • Nochangeincontrollingshareholding & lead member for a period of 1 year after commencement
• Controllingshareholdingmeans at least 26% of the voting rights in the company
Gujarat, Rajasthan: Developer/consortium has to retain controlling shareholding (51% for first 3 years and 26% from thereafter) throughout the term of the agreement
Financial Closure
• 180daysforBatch1• 210daysforBatch2
Same as JNNSM
Commissioning • 12 months for PV & 28months for CSP in Batch 1
• 13monthsforPVinBatch
• Karnataka: PV - 12 months & CSP - 30 months• Rajasthan: PV - 12 months (for 5 MW) and 15 months (for 10
MW) & CSP - 28 months • Madhya Pradesh: PV - 12 months & CSP - 28 months
Table A2 1: Comparison of State Solar Policies with JNNSM
Annex 2: Comparison of State Solar Policy Framework with JNNSM
Source: Respective state solar policies, JNNSM guidelines, authors’ research.

58
Paving the Way for a Transformational Future: Lessons from Jawaharlal Nehru National Solar Mission Phase I
Table A3 1: CSP Projects and Implementation Status
Details of CSP Players Selected in JNNSM Phase I, Capacity Allocated and Status of Implementation
Annex 3: CSP Players and Status of Implementation
S. No Project Name Promoter Capacity (MW)
Location Technology Supplier/EPC Contractor**
Status*
1 Diwakar Solar Lanco 100 Nachna, Rajasthan
PTC with storage
Siemens/LancoSolar & Initec Energía
Under construction
2 KVK Energy Ventures
Lanco 100 Nachna, Rajasthan
PTC with storage
Siemens/LancoInfratech
Under construction
3 Megha Engineering
Megha Engineering Ltd.
50 Anantpur, Andhra Pradesh
PTC GE/MEILGreenPowerLimited
Under construction
4 Rajasthan Suntechnique
Reliance 100 Bikaner, Rajasthan
Compact LinearFresnel
Areva/Reliance Infrastructure
Under construction
5 Aurum Renewable
Aurum 20 Porbandar, Gujarat
LinearFresnel
Sumitomo Shin Nippon/Indure
Under construction
6 Godawari Power Hira Group 50 Pokaran, Rajasthan
PTC Siemens, Schott Glass, Flabeg, Aalborg/Lauren,Jyoti Structures
Commissioned
7 Corporate Ispat Abhijeet 50 Pokaran, Rajasthan
PTC Siemens turbine & receivers/Shriram EPC
Under construction
Source: “Concentrated Solar Power: Heating up India’s Solar Thermal Market under the National Solar Mission”, EEW/NRDC/Shakti Foundation, September 2012.* Authors’ research; ** Data collected from CSP World.

59
Paving the Way for a Transformational Future: Lessons from Jawaharlal Nehru National Solar Mission Phase I
1. Chronology of JNNSM Phase I reverse bidding-based capacity auction process
Table A4 1: JNNSM Phase I—Bidding Chronology
Annex 4: JNNSM Auction Process and International Experience
Issue of Request for Selection
Submission of Response to Request for Selection
Shortlisting of Bidders and Decision on Tariff Discounting
Proposal Submission
Evaluation of Proposals and Issue of Letter of Intent
PPA Signing
Financial Closure of Projects
COD
Phase I Batch 1 Solar PV
August 2010
September 2010
October 2010
November 2010
December 2010
January 2011
April 2011 January 2012
Phase I Batch 2 Solar PV
August 2011
September 2011
October 2011
November 2011
December 2011
January 2012
September 2012
February 2013
Solar Thermal
August 2010
September 2010
October 2010
November 2010
December 2010
January 2011
April 2011 May 2013
Source: Authors’ research.
2. Level of participation in JNNSM Phase I
Table A4 2: Level of Participation—JNNSM Phase I
S. No Batch/Technology No. of Bids No. of Projects Selected Total Capacity1 Batch 1 – PV 299 30 150 MW2 Batch 2 – PV 183 26 350 MW3 CSP 66 8 470 MW
Source: Draft JNNSM Phase II Policy Document, MNRE.

60
Paving the Way for a Transformational Future: Lessons from Jawaharlal Nehru National Solar Mission Phase I
3. International experience: Capacity auction structure
Table A4 3: Capacity Auction Structure—International Experience
Country Type of Auction Design of Auction Penalties for Noncompliance Domestic ContentIndia (JNNSM)
Reverse auction (ceiling price fixed by the regulator)
Technology specific Clearly defined penaltiesForego the PBG (for delays up to 3 months)Liquidateddamagesfordelays beyond 3 months
For Batch 1 of Phase I, it will be mandatory for projects based on c-Si technology to use the modules manufactured in India.For Batch 2 of Phase I, all projects will have to use cells and modules manufactured in India
Brazil Hybrid auction:First stage – reverse clock auction to determine ceiling price Second stage – sealed bid auction
Could be technology specific, alternate energy auction or technology specificLastauctionwastechnology neutral
Flexible: A 4-year rule offers some flexibility by allowing producers to accumulate and carry over productions within some limits to make up for under production risks in future yearsContract termination for delays greater than 1 year
60% of the cost of equipment spent locally
South Africa
Two stage bidding: First stage - bidders have to meet minimum criteria related to legal, financial, technical and environmental requirements Second stage - sealed bid auction 70% weightage to price and 30% to economic development including local content
Technology specific Contracts will be terminated for bidders who fail to meet their commitment under the PPA
Weightage given to domestic content in the final evaluation of bids
Morocco Two stage bidding: First stage – pre-qualification including experience, financial and technical capabilitySecond stage - sealed bid auction
Technology specific Penalties for delay and underperformance determined in PPAGuarantee paid at signature of PPA Termination of PPA as last resort
30% of the plant’s capital cost (local equipment manufacturing, O&M, R&D)
China Sealed bid auction Technology specific (site specific as well)
No clear penalties for noncompliance
50% domestic content for wind in 2003, increased to 70% in 2005; abolished in 2009
Source: IRENA Report: Renewable Energy Auctions in Developing Countries (2013).

61
Paving the Way for a Transformational Future: Lessons from Jawaharlal Nehru National Solar Mission Phase I
Table A5 1: Indicative Funding Requirement for Phase II (Central Scheme)
Annex 5: Funding Requirements for JNNSM Phase II
Type Indicative Cost Capacity Funding RequirementRooftop & small solar PV
@ INR 80- 90 million (US$1.33 - 1.50 million) per MW
200 INR 16-18 billion (US$270 -300 million)
Ground-mounted solar PV
@ INR 70- 80 million (US$1.17-1.33 million) per MW
2,320 INR 162-186 billion (US$2.7- 3.1 billion)
Solar thermal @ INR 120- 130 Million (US$2.00- 2.17 million) per MW
1,080 INR 130-140 billion (US$2.17- 2.33 billion)
Total 3,600 INR 308-344 billion (US$5.13-5.73 billion)
Solar lending is considered a part of power sector lending by commercial banks. The comparative transaction costs for smaller solar capacities are higher compared to those for large conventional power plants, and with concerns around few public sector banks reaching their sector caps, imposed by them in keeping with prudential norms, the availability of funding from domestic commercial banks becomes an issue.
JNNSM Phase II is envisaged to add higher capacity in comparison to Phase I. As per the draft JNNSM
Phase II policy document, around 3,600 MW solar power capacity is proposed to be added under the central scheme.
Table A5 1 provides an indicative detail of funding requirement to support 3,600 MW of capacity.
Adding solar power capacity only under the central scheme would require around INR 340 billion (US$5.67 billion). At a debt: equity of 70:30, this is an estimated at INR 238 billion (US$3.97 billion) of debt financing.
Source: Authors’ research.

62
Paving the Way for a Transformational Future: Lessons from Jawaharlal Nehru National Solar Mission Phase I
Annex 6: PPA under JNNSM Phase I – Key Concerns
Table A6 1: PPA under JNNSM Phase I—Key Concerns
S. No. Particulars Details1. Limitations on solar
dispatchUnder the PPA, NVVN is not obligated to purchase any additional solar energy generated beyond the amount corresponding to 21% capability utilization factor from the PV project.
Further, there is no compensation for the grid/procurer’s inability to evacuate or transmit solar power, leading to its backing down. Given the lower capacity utilization factors of solar power plants, nonavailability of the grid can be a serious risk for such projects. This is particularly exacerbated by the fact that solar projects have been feeding into primarily rural areas of the state transmission and sub-transmission grid, which are known to suffer from maintenance and availability related issues in several states.
2. Liquidated damages & penalties
Conditions for meeting the Scheduled Commissioning Date in the PPA are supplemented by liquidated damages and penalties to be paid by the developer in the event of delays. The developer is required to forego the PBG of INR 5 million per MW (US$83,333 per MW) submitted in the event of delay beyond 3 months. In case of further delay, the developer is required to submit INR 0.1 million (US$1,667) per day per MW as liquidated damages. Key hurdles in solar project development are land acquisition and laying down transmission lines for evacuation. As land acquisition is a state subject, the chances of projects getting delayed are higher. The bankability of PPA is marred by such stringent timelines coupled with serious monetary implications.
3. Performance guarantee
Under the PPA, the developer is required to submit PBGs to the extent of INR 5 million per MW (USD$0.08 million per MW). This is perceived to be very high in a market characterized by falling project costs and with several smaller companies participating, since it locks in much higher amounts than equity in the project, as bankers insist on margins to extend such guarantees.
1. Review of JNNSM Power Purchase Agreement
Under the JNNSM framework, selected developers have to enter a PPA with NVVN which, in turn, signs to a PSA with respective distribution utilities.
Developers and financiers expressed broad concerns with regard to the PPA in the following areas:
• Limitationsonsolardispatch/assuranceonpower off-take;
• Conditionsofliquidateddamagesandpenalty;• Performanceguarantees;• Creditworthinessofutilities;• Paymentsecuritymechanism;and• Terminationandexitprovisions.
These areas are summarized in Table A6 1.

63
Paving the Way for a Transformational Future: Lessons from Jawaharlal Nehru National Solar Mission Phase I
S. No. Particulars Details4. Creditworthiness of
utilitiesState utilities are the procurers of the solar power under JNNSM and are required to pay as per the provisions of the PSA. The creditworthiness of the state Discoms on timely payments for conventional power purchase has not been impressive so far and, therefore, the lenders view the payments from such utilities as a riskier proposition. The role of NVVN in Phase I had a beneficial effect, given the direct and indirect influence NTPC and NVVN have on distribution utilities. With bundling no longer a sustainable option, NVVN’s role over Phase II is in doubt and raises issues on the creditworthiness of the overall program.
5. Payment security mechanism
UnderthePPA,thepaymentsecuritymechanismisstructuredasaLetterofCredit backed by an Escrow mechanism. NVVN is albeit under no obligation to make payments to the developer in the event of default by the utilities. To mitigate such risks, the JNNSM framework identified a PSS by way of creation of a Solar Payment Security Account (SPSA). To this effect, MNRE has set aside budgetary support of INR 4,860 million (US$81 million) for the period of 2011-15. This third tier of payment security is a fall back arrangement in the event of exhaustion of the payment security as defined in the PPA.
This mechanism, however, provides complete discretion to NVVN in terms of administering PSS and was pointed out by several lenders as ambiguous.
6. Termination payments and exit arrangements
The PPA can be terminated by NVVN on account of the developer not meeting the conditions subsequent in the stipulated time period of 7 months from the effective date without giving any further extension. The PPA does not provide any exit arrangements for the developer or recovery of cost in the event of termination resulting in default by NVVN or the utilities, and is not on an equitable footing.
7. Charge on bundled power
Banks have echoed concern that banks do not have a charge on the bundled power. There should be a scenario in some suitable form for recourse to the bundled power for the lenders to the solar project under the JNNSM.
contd...

64
Paving the Way for a Transformational Future: Lessons from Jawaharlal Nehru National Solar Mission Phase I
Annex 7: Payment Security Scheme and NCEF
Payment Security Mechanism in JNNSM Phase I30
The core component of the PSS is to create a Solar Payment Security Account (SPSA) financed from the Gross Budgetary Support (GBS) to MNRE to ensure availability of adequate funds to address all possible payment-related risks in case of defaults by distribution utilities for the bundled power.
As per available provisions of the PPA, NVVN will raise a provisional bill on the last day of the month. Utilities would get 2 percent rebate if the payment is made on the next working day. The due date of payment would be 30 days from the date of billing. If payment is not made by the 30th day, NVVN can notify default and encash the amount fromtheLetterofCredit(LC).UtilitieswouldopentheLCforsixmonthequivalentamountwhich would be backed by an escrow account. In additiontoencashingtheLC,NVVNhastherightto divert and sell the bundled power in the spot/short-term market. In case the realized amount from the market is lower than the cost of bundled power, the difference is to be paid from SPSA, provided under the PSS. Alternatively, NVVN can continuetosupplypowertotheutilitysincetheLChas six months’ equivalent amount. Even in case of diversion, the defaulting utility is not absolved of the liability to pay capacity charges.
A GBS of up to INR 4,860 million (US$81 million) will be provided to MNRE for the implementation of the PSS, which has been estimated for a default of 35 percent and based on capacity utilization factors on a normative basis.
The funds for each year shall be allocated by MNRE to SPSA which could be deployed in the approved liquid securities with the approval of the PSS Management Committee. However, resulting returns would be treated as accretion to the SPSA after taking into account the management fee of 1 percent of funds handling, to be provided to NVVN.
National Clean Energy Fund
Announced in the Union Budget of 2010-11, the NCEF is a nonlapsable corpus under the Public Accounts of India formed through the levy of a clean energy cess of INR 50 per ton (US$0.83 per ton) on coal produced domestically and imported to India. The cess came into effect from July 2010.
NCEF has collected revenues to the tune of INR 10,660 million (US$177.67 million) in FY 2010-11, an estimated INR 32,490 million (US$541.50 million) in FY 2011-12, and is expected to generate a further INR 38,640 million (US$644.00 million) in FY 2012-13.
30 Source: Press Information Bureau of India,

65
Paving the Way for a Transformational Future: Lessons from Jawaharlal Nehru National Solar Mission Phase I
Annex 8: Technology Factors in JNNSM Phase I
JNNSM Phase I has featured the following technology and price characteristics:
• EqualcapacitydistributionunderPhaseIofthemission for development of both PV and CSP;
• TFmoredesirablethanc-SiinPhaseIofthemission; and
• Aggressivepricebidsfollowedbytheglobalglutin the solar market.
1. Equal capacity distribution under JNNSM Phase I for development of both PV and CSP
The grid-connected solar capacity under JNSSM Phase I was divided equally between PV and CSP (500 MW each), in contrast to the global share of CSP and PV technologies; the total installed capacity of solar PV is as high as 100 GW currently,
compared with CSP at 2.2 GW. CSP projects have primarily been demonstration and semi-commercial projects with substantial public funding.
CSP refers to a range of technologies (parabolic trough, linear fresnel, solar tower, stirling dish, and so on), which are relatively less mature and currently more expensive than PV.
CSP, given its promising potential, including its ability to operate with thermal storage and be hybridized with other fuels, has been widely researched. Most developments so far have also been extensively supported by public financing sources and seen participation of public financiers and international development banks, including the European Commission (EC), European Investment Bank (EIB) and the World Bank.
Source: EPIA.
9.5 15.523
40
70
100
Global PV (GW) Global CSP (GW)
2007 2008 2009 2010 2011 2012
Figure A8 1: Global PV & CSP Capacity
100908070605040302010
0

66
Paving the Way for a Transformational Future: Lessons from Jawaharlal Nehru National Solar Mission Phase I
Solar thermal has suffered globally through comparison with solar PV, the latter experiencing exponential growth between 2004 and 2009 due to the demand from rooftop solar programs in Japan and Germany, followed by a dramatic decline in prices thereafter. Since 2009, solar PV has seen a consistent decline in polysilicon and module prices due to substantial over-capacities across the manufacturing value chain and the emergence of large-scale, integrated and low-cost suppliers in China.
Solar thermal, on the other hand, has not reached a level where scale and competition can affect price reductions. CSP technologies are, at best, at the initial stages of commercialization with the dominance of a few suppliers who also own significant parts of the supply chain, restraining competition.
i. TF more desirable than c-Si in Phase I of the mission
Within PV technology, JNNSM Phase I has witnessed a higher demand for TF compared with c-Si. This is a contrast to the current global scenario. Globally, the share of TF in total PV installations
has been declining in the last few years and was at 13 percent of all PV in 2011.
TF technology historic to current scenario
In the past, TF was considered a very promising technology with a lower efficiency than c-Si but with substantially lower cost. TF’s market share was as high as 30 percent during the late 1980s but started declining thereafter with industry consolidations. Technological advancements returned the focus on TF after 2003; this phase lasted until 2008. However, with the dramatic decline in c-Si prices since 2009, the value proposition of TF has narrowed and it has continued to lose market share resulting in a long list of suppliers shutting down their manufacturing units.
Thin Film growth vis-à-vis polysilicon pricing
It may be argued that market share shifts or global interest in TF are cyclical in nature but the correlation between the decreasing cost of c-Si and decreasing growth of TF cannot be ignored. It can be seen in Figure A8 2 that year on year growth in TF also decreased as polysilicon spot prices decreased.
EC’s support for CSP started with the fourth EU Framework Program in 1994.
• Fourth Framework Program (1994): allocation of €29 million for development/implementation of CSP technologies.
• Fifth Framework Program: €15 million on three major full-scale MW size demonstration projects to:
‒ PS10: 11 MW CR CSP in southern Spain ‒ Andasol: 50 MW parabolic-trough collector (PTC) CSP with storage ‒ SOLARTRES:15MWCRCSPwithsaltstorage• Seventh Framework Program: looking for scaling up of promising CSP technologies. EIB has
partnered EC with an investment of over €70 million between 2004 and 2012.
Source: European Commission.
Box A8 1: EC and EIB Support to CSP

67
Paving the Way for a Transformational Future: Lessons from Jawaharlal Nehru National Solar Mission Phase I
Decreasing cost competitiveness of TF
The decline in TF’s share globally is a result of its decreasing cost competitiveness. As shown in Table A8 1, the performance and efficiency adjusted penalty is higher for TF because of larger area and BoS requirements with this technology. The overall
Table A8 1: Comparison of PV and Thin Film Technologies
Modeled Data from PVSyst LA System
kWh/KW Performance
Performance vs Base
Assumed Efficiency
Efficiency Adjusted Penalty
Performance Adjusted Efficiency
Performance & Efficiency Adjusted Penalty
Poly c-Si (Base) 1,647 100.0% 14.5% US$ 14.5% US$Mono c-Si 1,696 103.0% 15.0% US$ (0.02) 15.4% US$ 0.05a-Si 1,731 105.1% 6.5% US$ 0.91 6.8% US$ 0.83CIGS 1,748 106.1% 12.5% US$ 0.12 13.3% US$ 0.07Cadmium telluride (CdTe)
1,838 111.6% 11.7% US$ 0.18 13.1% US$ 0.08
Source: GTM research.
advantage of TF being cheaper is not easily visible in the future, unless technological advancements drive down costs.
India, on the other hand, has a completely different scenario; the share of TF in PV is not only high but also increasing. As can be seen in Figure A8 3, the share of
Figure A8 2: TF Market Growth and Polysilicon Spot Prices
Historical Polysilicon Spot Prices Historical TF Year-on-year Growth (%)
US$
/kg
Year-on-year growth (%
)
400
300
200
100
0
80%
0%
160%
2003 2004 2005 2006 2007 2008 2009 2010 2011

68
Paving the Way for a Transformational Future: Lessons from Jawaharlal Nehru National Solar Mission Phase I
TF between 2000 and 2011 was quite low globally but quite high in India under JNNSM Phase I. This was driven largely by the availability of low-cost financing fromU.S.EXIMforU.S.-basedTFsupplies.LargeU.S.-based suppliers with proven track records were also preferred by developers and lenders over relatively smaller suppliers of c-Si, which had to be domestic manufacturers on account of the DCR for c-Si.
ii. Aggressive price bids followed by global glut in solar market
The world has been experiencing a secular trend of decline in the cost of generation from solar technologies. The reverse bidding mechanism in JNNSM Phase I (Batch 1 in August 2010 and Batch 2 in August 2011) facilitated the emergence of price bids that are amongst the lowest globally. Access to low-cost financing and technology choice, which is usually a challenge with such tariffs, was facilitated by a few factors outlined below.
Glut in solar PV market
Solar PV has been witnessing a sharp drop on the back of heavy supply and inventories. Polysilicon makes up around one-third of the total cost of a solar PV cell. There have been huge investments in the polysilicon industry over the last five years, leading to over-capacity and build-up of inventories, resulting in a sharp decline in prices, thus pushing down the prices of solar PV modules. This price decline continued well into 2012 and the first few months of 2013.
Aggressive bids vis-à-vis DCR
Aggressive bid price demands availability of either cheaper solar modules and system equipment or low-cost financing. DCR under JNNSM requires developers to use locally manufactured cells and modules (for c-Si technology).
Figure A8 3: Share of TF in Overall PV Installed Capacity
Source: Navigant consulting and authors’ research.
100%
80%
60%
40%
20%
0%
10% 9% 6.50% 5% 5% 6%10.50%
17%13% 11%
55%
75%
7.50%13.50%
2000 2001 2002 2003 2004 2005 2006 2007 2008 2009 2010 2011 JNNSM Batch 1
JNNSM Batch 2
Global TF share in solar PV Indian TF share in solar PV

69
Paving the Way for a Transformational Future: Lessons from Jawaharlal Nehru National Solar Mission Phase I
The possibility of local modules being cheaper than imported modules is low considering the smaller scale of India’s manufacturing capacity and fierce competition from Chinese modules. Even after paying import duty, the selling price of a Chinese cell is lower than an Indian one, because of the availability of low-cost local wafers and lower processing cost due to lower electricity and financing charges in China.
Compared with this domestic scenario, TF suppliers out of the United States were ready to offer competitively produced modules along with low-cost, long-tenor financing from the U.S. EXIM bank.
Substantially higher penetration of TF over c-Si is thus an unintended outcome of the DCR stipulation combined with the low-cost financing which accompanied U.S.-made TF products.

70
Paving the Way for a Transformational Future: Lessons from Jawaharlal Nehru National Solar Mission Phase I
Annex 9: Domestic Content Requirement
The domestic/local content requirements under the power procurement contracts compel the renewable energy power developers to source a particular percentage of equipment from the local
suppliers.ThemainaimofusingtheLCRcriteriaunder the policy framework is to promote local manufacturing as well as attain tangible local economic benefits.
Description JNNSM Phase I State PoliciesDomestic Content
PV• Batch1:c-Si-mandatory
use of domestic modules• Batch2:c-Si-mandatory
use of domestic cells & modules
• TFnotunderDCRpurview
CSP• 30%domesticcontent
mandatory
Gujarat• Noobligationondomesticcontent
Rajasthan• Noobligationondomesticcontent• Separateschemeforpromotinglocalmanufacturing:Solar
producers under this scheme required to source solar PV modules from their own manufacturing units in Rajasthan
‒ Target 200 MW power capacity & 500 MW manufacturing capacity (TF/c-Si) by 2013
‒ Selection through tariff-based bidding (not initiated)
Madhya Pradesh• Domesticcontentclause(exception:TFmodules)
Karnataka• Noobligationondomesticcontent
Table A9 1: National Experience, DCR
1. National Experience
A review of the implementation of solar PV projects under the state policy of Gujarat (with no obligation on domestic content) indicates a TF share of close to 50 percent (for 492.61 MW capacity), in indicated in Figure A9 1.
2. International Experience
Table A9 2 provides brief overview of the international experience across select countries in the area of renewable energy with local content requirements:

71
Paving the Way for a Transformational Future: Lessons from Jawaharlal Nehru National Solar Mission Phase I
Table A9 2: International Experience, DCR
Country ExperienceOntario FiT Program31
The FiT Program was enabled by the Green Energy and Green Economy Act, 2009. The Ontario Power Authority is responsible for implementing the FiT Program. A price-based program, the FiT aims to attract renewable energy companies to the province by providing guaranteed pricing for certain forms of renewable energy projects. The FiT contract requires wind projects greater than 10 kW and all solar projects to include a minimum amount of goods and services that come from Ontario. The minimum requirements are:
• 50%forwindprojectsgreaterthan10kW;and• 60%forallsolarprojects.
Brazil - Wind32
InthefirstandsecondphaseoftheProgramofIncentivesforAlternativeElectricitySources,LCRs(so-called ‘nationalization indices’) were stipulated for equipment and services of 60% and 90%, respectively.
Nevertheless, there are no similar measures to be found in the Portarias approving the guidelines on the tenders held in 2010, and no nationalization index is required to take part in the tender process.
However, the nationalization index of 60% remains as a condition to access funding from the Brazilian development bank, and since its financing comes at a lower cost, this condition establishedadefactoLCRsimilartotheonesstipulatedundertheProgramofIncentivesforAlternative Electricity Sources and the Portarias or the wind-only auction.
China - Wind Wind projects approved by China’s National Development and Reform Commission from 1996 to 2000 were required to source at least 40% of their content from local manufacturers, which was increased to 50% in 2003, and then to 70% in 2004.
The DCR was discontinued in 2009, as it was no longer needed as most turbines exceeded the DCRs.33
31 Source: Report on FiT Program Overview - Ontario Power Authority, 2012.32 Source: Report - Analysis of the regulatory framework for wind power generation in Brazil (REEEP/GWEC).33 Source: Policy Brief - Sustainable Prosperity (2012).
Figure A9 1: Solar PV Technology, Gujarat
Source: Sunrise in Gujarat (2013), RESolve Energy Consultants.
C-Si CIGS CeTd a-Si
49.80%50.20%
16.44%
31.74%
1.62%

72
Paving the Way for a Transformational Future: Lessons from Jawaharlal Nehru National Solar Mission Phase I
Annex 10: Solar PV Manufacturing in India
Solar PV manufacturing in India constitutes an installed capacity of approximately 2,000 MW of modules and 1,000 MW of cells of which, as on date, only about 50 to 60 percent is operational. The manufacturing ecosystem for solar thermal generation is yet to develop and is mostly restricted to small Stirling dish engines for industrial applications. Manufacturing of power block equipment is well established in India for conventional power generation and can adapt itself to solar power generation.
1. Solar PV manufacturing in India
This section covers primarily the experience of solar PV manufacturing in India.
While there is no polysilicon manufacturing capability in India, technically 15 MW of ingot and wafer manufacturing capacity exists, although this is a pilot unit which is not commercial in nature.34 The Indian solar manufacturing segment is thus primarily represented by solar cell and module manufacturers. A few projects have been announced to undertake manufacturing of other components in the value chain such as polysilicon, ingots and wafers; however, none of these have made progress on the ground on account of viability concerns in the current global pricing scenario.
While there has been marginal growth in the installed capacity for solar modules, the average
Box A10 1: Indian Manufacturing Landscape
Polysilicon
• Indiahasnopolysiliconmanufacturingcapacity• Tosustain20GWofinstallation(including
central and state policies), India would need an annual capacity of approximately 14,000 metric ton of polysilicon
Wafer
• Thereisnosignificantwafermanufacturingcapability in India
• Around2,000MWperannumofwafermanufacturing capability would be required for sustaining 20 GW of installation
Cells
• Around1,000MWofcellmanufacturingcapability exists in India
• Policyframeworkinplacetopushconsumptionof cells manufactured in India
• Economicallypricedwaferswouldincreasetheprospects of domestic cells
Modules
• Around2,000MWofdomesticmodulemanufacturing capability exists
• Thiscapabilitycouldberampedupdependingonviable local availability of input materials
34 This was a testing unit which was made available purely for R&D purposes to an Indian solar facility.

73
Paving the Way for a Transformational Future: Lessons from Jawaharlal Nehru National Solar Mission Phase I
capacity utilization for the industry has decreased over the years and is currently at about 50 percent.
Historically, Indian solar PV manufacturers have relied on exports. The balance of payment for this segment until FY 2011 was positive. Exports, however, declined significantly over FY 2012 and continue to do so over FY 2013. This points to a significant erosion in the cost-competitiveness of Indian manufacturers in the face of rapid price competition from Chinese and Taiwanese manufacturers, in particular. On the other hand, domestic demand for solar products picked up over FY 2012 but has been catered to by imports, primarily in the TF segment.
The lack of integrated operations covering wafers and ingots and of GW scale manufacturing, adopted by Chinese competitors, has started eroding the cost-competitiveness of Indian manufacturers in the c-Si segment. Among the differentiating input side factors, which need to be addressed by GoI to make Indian PV manufacturing competitive, are the following:
Table A10 1: Performance of Indian Solar PV Manufacturers
Commodity Export (in US$ Million) Import (in US$ Million)2009-10 2010-11 2011-12 2012-13* 2009-10 2010-11 2011-12 2012-13*
Solar cells/PV cells whether or not assembled in module/panel
290.17 511.69 163.06 77.08 213.75 252.63 1,348.48 449.01
Other photo cells 31.72 37.85 11.76 3.80 22.48 11.19 73.53 53.10Total 321.89 549.54 174.82 80.88 236.23 263.82 1422.01 502.11
*April- December; Source: Department of Commerce, Government of India.
• CapitalsubsidiesavailableunderSpecialIncentive Package Scheme of 20 percent in Special Economic Zones and 25 percent outside the zones are not at par with those provided by China and Taiwan, which are in the range of 50 percent of capital costs;
• Provisionofreliableanduninterruptedpowerat concessional rates is critical to wafer and cell manufacturing. Most Indian manufacturers resort to the use of diesel/gas-based captive generators during production, as supply quality is poor, adding to the cost of production significantly. Co-location and provision of manufacturing with cheaper sources of generation have not been explored in the Indian environment;
• Mostoftherawmaterialsandconsumablesforcell and module manufacturing are imported. This includes all gases, silver paste, ethylene vinyl acetate, and so on. A domestic ecosystem needs to be developed which can make the most of locally accessible components, minimizing supply chain challenges and also exercising control over random price fluctuations; and
• Whileimportofsolarmodules/cellsdoesnotattract duties, manufacturers claimed that import of certain key input material used for solar cell manufacturing attracts import duties. Further, where export-oriented units (such as Indo-solar) propose to sell their output in
Installed Indian Solar Manufacturing CapacityIngots & Wafers: 15 MWSolar PV Cells: 1,000 MWSolar Modules: 2,000 MW

74
Paving the Way for a Transformational Future: Lessons from Jawaharlal Nehru National Solar Mission Phase I
the domestic market (domestic tariff area), manufacturers are required to pay excise duty which makes them less competitive vis-à-vis duty-free imports.
2. BoS manufacturing
With a rapid decline in the cost of solar PV modules, the proportion of BoS in the capital cost of solar PV plants has started rising and currently accounts for almost 40-50 percent of the total capital cost of installations. India has done well in localizing manufacturing in
this segment, with several global solar inverter manufacturers setting up facilities in India in recent times. Structures, connectors and mountings are low value items and are usually locally procured by developers.
Company CapacityBonfiglioli 400 MWABB 500 MWSchneider 400 MWAEG 400 MW
Component Global Market Competition Indian ContextPolysilicon feedstock
90% of the total polysilicon market supplied by the top 7 companies
No polysilicon manufacturing capability in India
Ingots and wafers
The top 5 companies cater to 90% of the total market
Limitedpresenceinthesegment
Cells Fragmented market. Top 10 producers produced 50% of the world demand in 2008
Heavily dependent on imports (nearly 100%), resulting in higher cost compared to Chinese and other Asian countries (28 cents/watt peak (Wp) in India, compared to 19 cents/Wp outside)
Module Very fragmented market. Overlapping segment with cell manufacturers. Differentiating factor is the efficiency on the module
Very heavily dependent on imports (about 90% of the value is imported). Higher costs compared to Chinese and other Asian countries (34 cents/Wp as compared to 27 cents/Wp, respectively)
Inverters Market dominated by a few global players. Economies of scale required to build a production line
Huge base of nonsolar inverter manufacturers in India (estimated at about 3,200 MW manufactured every year). With some technology back up, Indian inverter manufacturers will be able to easily manufacture solar PV inverters
Battery Existing battery manufacturers will easily be able to supply solar PV batteries
High dependence on imports
Transformers Mature and competitive market with room for growth
Mature market
System integration
Mature market Need to develop a network of system integrators
3. Solar PV market – Global and Indian
Table A10 2: Solar PV Market—Global and Indian
Sources: FICCI Solar Energy Task Force Report on “Securing the Supply Chain for Solar in India” (2013), German Development Institute/Deutsches InstitutfürEntwicklungspolitik(DIE):“ExploringtheeffectivenessoflocalcontentrequirementsinpromotingsolarPVmanufacturinginIndia”;GreenRhineLtd.,2013;FraunhoferISE(2012,11-12);IRENA(2011,7-8),authors’research.

75
Paving the Way for a Transformational Future: Lessons from Jawaharlal Nehru National Solar Mission Phase I
Annex 11: Solar Thermal Manufacturing in India
One of the biggest drivers of cost reduction in the solar energy space is the availability of scale across the complete solar manufacturing supply chain as well as the associated ecosystem. Scale of operations and the ability to source all components without price shocks will be the biggest drivers of solar cost reduction in the future. India lags behind in this regard.
The recent World Bank report titled Development of Local Supply Chain: A Critical Link for Concentrated Solar Power in India has mapped the current local manufacturing capability for CSP in India. There is an almost negligible presence in the production of the key components of the CSP supply chain. Some components such as the power block or evacuated tubes might be available in the Indian market (for example, power block components are available due to the presence of established players in thermal
power generation but have not been custom-built for CSP). However, the Indian industry is definitely not geared to the development of a scaled up version of a CSP supply chain.
To realize the CSP potential in India, existing Indian industries must identify the opportunities and react proactively to participate significantly in supplying CSP components and systems. Many traditional industries such as glass, metal, automotive, power and process heat, machine tools and robotics, and chemical industries can play an active role in the development of the Indian CSP industry. Many only need a modest effort to adapt their manufacturing processes to the demands of the CSP industry.
The study also proposes an action plan to stimulate local manufacturing of CSP components in India as shown in Figure A11 1.
Section Action Plan Supportive Responsibility
Y1 Y2 Y3 Y4 Y5
Long-term policy framework for CSTP development
Year-wise allocation for Concentrated Solar Thermal Power (CSTP) power projects
MNRE
Regulatory support & tariff mechanism for solar thermal hybrid projects
MNRE & CERC
Renewable energy certificate mechanism for solar thermal energy generation
CERC
Planning for payment security
Adequate payment security mechanism using the coal cess funds
Ministryof Finance(MoF)/MNRE
Low-cost financing
Enablement of low-cost financing for CSTP from banks & separate exposure limits for CSTP projects
MoF
Financial planning of subsidies and incentives
Concessional customs duty and zero excise duties for materials and components used for manufacturing of solar systems
MoF
Fiscal incentives for sponsored research and in-house R&D expenditure
MoF
Figure A11 1: Action Plan for Local Manufacturing of CSP Components (India)

76
Paving the Way for a Transformational Future: Lessons from Jawaharlal Nehru National Solar Mission Phase I
Section Action Plan Supportive Responsibility
Y1 Y2 Y3 Y4 Y5
Mechanism for promotion of R&D and innovation
Development and maintenance of a public repository of knowledge
MNRE
Development of quality and specification standards
MNRE
Establishment of an R&D framework on a public-private partnership basis
MNRE
Development of solar energy courses MNRESponsored research projects in educational institutions
MNRE
contd...
Source: DevelopmentofLocalSupplyChain:ACriticalLinkforConcentratedSolarPowerinIndia.

77
Paving the Way for a Transformational Future: Lessons from Jawaharlal Nehru National Solar Mission Phase I
Annex 12: International Experience in CSP Projects
Two major markets of CSP, the U.S. and Spain, have been growing with broadly similar approaches of initially applying technology push instruments such as demonstration projects, public financing, R&D, and so on, and thereafter (after proving the technology) utilizing market or demand pull instruments such as FiT, Renewable Portfolio Standard (RPS), and so on, to facilitate the deployment of commercial projects. The difference in approach, however, exists in terms of choice of market instruments. The U.S. is using the RPS mechanism whereas the FiT instrument is being utilized in Spain. Table A12 1 highlights the details of incentives available in Spain and the U.S. for development of CSP.
Also realizing that CSP technology has still a long way to go to match the commercial scale of operation enjoyed by PV technology, both countries use public funding or federal incentives to facilitate development of projects.
1. Development of CSP in Spain
Figure A12 1 shows the chronology of events in shaping Spain as a market for CSP. It has been shown that, initially, public funding was utilized on research and demonstration projects and, subsequently, FiT was introduced to upscale the market with commercial and private projects. The R&D projects35 were implemented to proof the technology and push the supply chain into the market.Later,government-fundeddemonstrationprojects were commissioned.
Public funding for CSP development in Europe: Since 1994 (Fourth Framework Program of EC), the EC has spent some €29 million on the development and implementation of CSP technologies. An additional €15 million has been spent on supporting three major full-scale MW size demonstration projects under the Fifth Framework Program (1998-2002):
Table A12 1: International Experience, CSP Projects
S No Country/State Supply or Technology Push Instruments Demand or Market Pull Instruments and Federal Incentives
1 Spain • SeveralR&DprojectsfundedbyEC• ECfundingfordevelopmentofMWscale
projects – PS 10, Andasol
• FiT
2 U.S. Total • Governmentfundingfordemonstrationprojects
• Institutionalandprivateriskcapitalinvestments backed by government energy procurement
• Accelerateddepreciation• Investmenttaxcredit• Federalloanguarantees• Cleanenergyrenewablebond
3 U.S. California NA • RPS33%by2020• Taxcredit/propertytaxexemption
Sources: OECD Environment Directorate 2004, The World Bank report on CSP in developing countries, European Commission.
35ListofECfundedR&Dprojectscanbeaccessedathttp://ec.europa.eu/research/energy/eu/index_en.cfm?pg=projects#results

78
Paving the Way for a Transformational Future: Lessons from Jawaharlal Nehru National Solar Mission Phase I
2002
2004
2012201120082007
20102007
Royal Decree 841 – Spain becomes the first country in the world to introduce FiT for CSP,
FiT for CSP fixed at €0.12/kWh for plants between 100 kW &
50 MW
Royal Decree 661 increased CSP FiT to €0.269 per kWh & provided a FiT escalation
at annual inflation minus 1 percent point. The decree also increased CSP target to 500 MW by 2010 Andosol1
commissioned
PS10 commissioned Spain adds 400 MW in 2010
Spain stops all FiTs and subsidies for renewable energy including CSP
Spain adds 417 MW in 2011
Royal Decree 436, also provided a premium on top of the FiT of €0.18 per kWh – this effectively implemented the rate of €0.21 per kWh for the first 200 MW of CSP on the ground. This led to
development of around 600 MW of CSP projects by 2010
Royal Decree 436 also allowed CSP plants to use 12-15% natural gas as
back-up fuel for maintaining storage and heat transfer fluid temperature
during non-sunshine hours.
Royal Decree 436 increased CSP FiT to €0.18 per kWh to cover higher costs and
risks of CSP projects. It also guaranteed this tariff for 25 years with annual adjustments
with increasing average electricity price
• PS10:11MWsolarthermalpowerplantinsouthern Spain;
• Andasol:50MWparabolictroughplantwiththermal storage; and
• SOLARTRES:15MWsolartowerwithmoltensalt storage.
In addition to the applicable FiT regime in Spain, CSP research is one of the priorities of the Seventh Framework Program (FP7, 2007-2013) of the EC. The EC is committed to continue supporting the scaling up of promising CSP technologies from research, development and demonstration scale to a pre-commercial feasibility phase in the multi-MW range.
2. Development of CSP in the U.S.
The Solar 1 CSP plant was designed with funding provided by the Department of Energy in the
late 1970s and early 1980s. A consortium of government, national labs, and industry built this 10 MW steam power tower project (1982) for demonstration purposes.
Thereafter,LuzInternationalLtd.builtaseriesofnine solar electric generating systems, from 1984 to 1990 in the Californian Mojave desert, ranging from 14 to 80 MW electric unit capacities and totalling 354 MW electric of grid electricity.
The US$1.2 billion was raised for these plants from private risk capital investors and institutional investors (notably subsidiaries of East Cost utilities). These ventures were significantly aided by federal and state tax incentives (from 35 percent in 1984-86 to 10 percent in 1989) as well as attractive long-term power purchase contracts. With no further R&D in the technology, the development of the market was stalled for more than a decade.
Figure A12 1: Development of CSP, Spain
Source: CSP Today, USA 2012.

79
Paving the Way for a Transformational Future: Lessons from Jawaharlal Nehru National Solar Mission Phase I
Figure A12 2: Development of CSP, U.S.
Source: CSP today, U.S. 2012.SEGS: Solar Energy Generating Systems.
Continued R&D and demonstration projects: Recognizing that the industry could not establish CSP projects for more than a year, the U.S. Government decided to continue to install demonstration projects. Projects such as Saguaro (1 MW) and Tessera (Stirling Dish 1.5 MW) were demonstrated.
Federal loan guarantee in the U.S.: A majority of project developers in the U.S. found it difficult to achieve nonrecourse financing for their CSP projects under the prevalent RPS mechanism. The federal loan guarantee scheme (with a corpus of US$10 billion for renewable energy efficiency and other segments) has enabled projects of Brightsource Energy and Abengoa to achieve financing.
1982 1984 1985 1986 1987 1988 1990 1998 2006 2007 2010
SEGS 1 (14 MW)
Solar 1 goes up
SEGS 2 (30 MW)
SEGS 5 (30 MW)
Solar 2 goes up
Saguaro (1 MW)
Announced Solana (parabolic trough – 280 MW) and
Ivanpah (tower) 392 MW with federal
loan guarantee
SEGS 6, 7 & 8 (30 MW each)
SEGS 9 (80 MW)
SEGS 3 & 4 (30 MW each)
Tessera (Stirling Dish 1. 5 MW)

80
Paving the Way for a Transformational Future: Lessons from Jawaharlal Nehru National Solar Mission Phase I
Annex 13: Overall Funds Requirement for JNNSM Phase I
JNNSM Phase I (Batch 1 and Batch 2) developers would need over INR 110 billion (US$1.83 billion) to implement the conceived 480 MW of solar PV and 470 MW of solar thermal. At a debt: equity of 70:30, this is an estimated INR 76 billion (US$1.27 billion) of debt financing.
This is in addition to about 970 MW of solar projects that have signed PPAs and are under development in Gujarat and several other states that have come up later with their own policies.
Table A13 1: Overall Funding Requirement for JNNSM Phase I
Category Indicative Cost Capacity Funding RequirementSolar PV • @INR110million(US$1.83
million) per MW (Batch 1)• @INR100million(US$1.67
million) per MW (Batch 2)
• Batch1:140MW• Batch2:340MW
• INR15.4billion(US$260million)• INR34billion(US$570million)
Solar thermal (without storage; parabolic trough)
@ INR 120 million (US$2.00 million) per MW
Batch 1: 470 MW INR 56.4 billion (US$940 million)
Total INR 105.8 billion (US$1.77 billion)
Sources: Authors’ research.
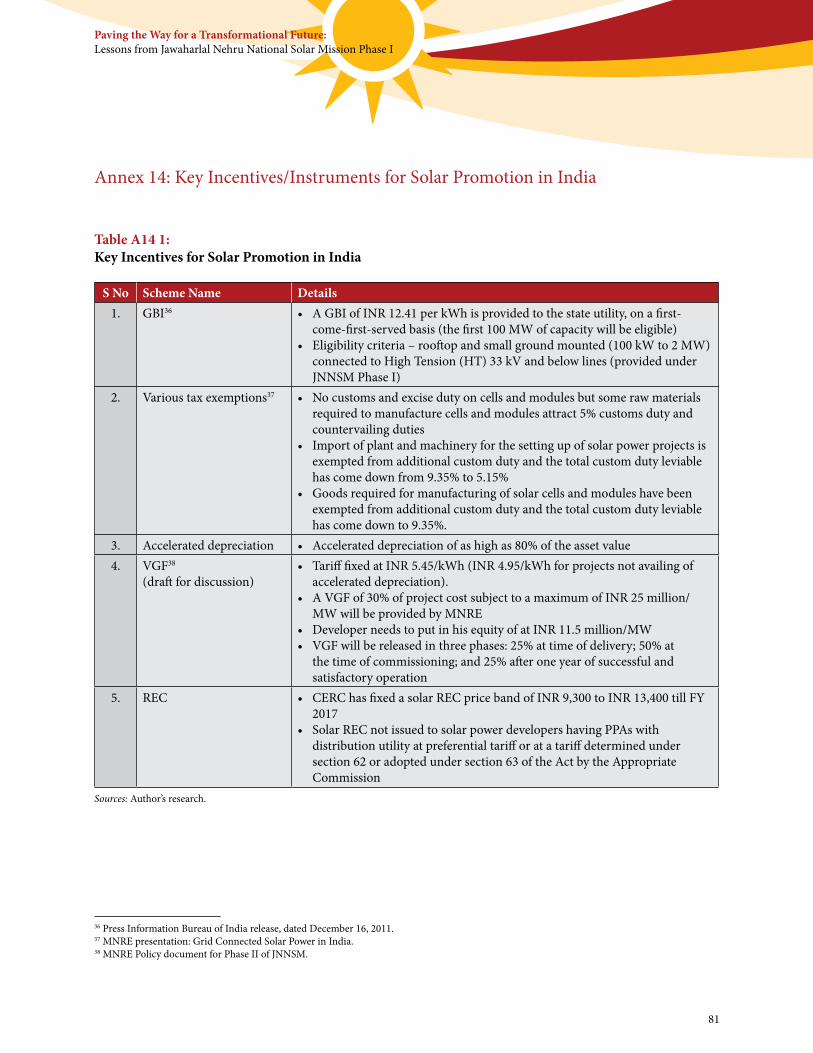
81
Paving the Way for a Transformational Future: Lessons from Jawaharlal Nehru National Solar Mission Phase I
Annex 14: Key Incentives/Instruments for Solar Promotion in India
Table A14 1: Key Incentives for Solar Promotion in India
S No Scheme Name Details1. GBI36 • AGBIofINR12.41perkWhisprovidedtothestateutility,onafirst-
come-first-served basis (the first 100 MW of capacity will be eligible) • Eligibilitycriteria–rooftopandsmallgroundmounted(100kWto2MW)
connected to High Tension (HT) 33 kV and below lines (provided under JNNSM Phase I)
2. Various tax exemptions37 • Nocustomsandexcisedutyoncellsandmodulesbutsomerawmaterialsrequired to manufacture cells and modules attract 5% customs duty and countervailing duties
• Importofplantandmachineryforthesettingupofsolarpowerprojectsisexempted from additional custom duty and the total custom duty leviable has come down from 9.35% to 5.15%
• Goodsrequiredformanufacturingofsolarcellsandmoduleshavebeenexempted from additional custom duty and the total custom duty leviable has come down to 9.35%.
3. Accelerated depreciation • Accelerateddepreciationofashighas80%oftheassetvalue4. VGF38
(draft for discussion)• TarifffixedatINR5.45/kWh(INR4.95/kWhforprojectsnotavailingof
accelerated depreciation).• AVGFof30%ofprojectcostsubjecttoamaximumofINR25million/
MW will be provided by MNRE• DeveloperneedstoputinhisequityofatINR11.5million/MW• VGFwillbereleasedinthreephases:25%attimeofdelivery;50%at
the time of commissioning; and 25% after one year of successful and satisfactory operation
5. REC • CERChasfixedasolarRECpricebandofINR9,300toINR13,400tillFY2017
• SolarRECnotissuedtosolarpowerdevelopershavingPPAswithdistribution utility at preferential tariff or at a tariff determined under section 62 or adopted under section 63 of the Act by the Appropriate Commission
Sources: Author’s research.
36 Press Information Bureau of India release, dated December 16, 2011.37 MNRE presentation: Grid Connected Solar Power in India.38 MNRE Policy document for Phase II of JNNSM.

82
Paving the Way for a Transformational Future: Lessons from Jawaharlal Nehru National Solar Mission Phase I
Annex 15: Regulatory and Policy Provisions for Renewable Energy
Section 86 1(e)“promote cogeneration and generation of electricity from renewable sources of energy by providing suitable measures for connectivity with the grid and sale of electricity to any person, and also specify, for purchase of electricity from such sources, a percentage of the total consumption of electricity in the area of a distribution licence”
Section 5.12.2“……Such percentage for purchase of power from non-conventional sources should be made applicable for the tariffs to be determined by the SERCs at the earliest. Progressively the share of electricity from non-conventional sources would need to be increased as prescribed by State Electricity Regulatory Commissions. Such purchase by distribution companies shall be through competitive bidding process. Considering the fact that it will take some time before non-conventional technologies compete, in terms of cost, with conventional sources, the Commission may determine an appropriate differential in prices to promote these technologies.”
Section 6.4 (1) “Pursuant to provisions of section 86(1)(e) of the Act, the Appropriate Commission shall fix a minimum percentage for purchase of energy from such sources taking into account availability of such resources in the region and its impact on retail tariffs. Such percentage for purchase of energy should be made applicable for the tariffs to be determined by the SERCs latest by April 1, 2006. It will take some time before non-conventional technologies can compete with conventional sources in terms of cost of electricity. Therefore, procurement by distribution companies shall be done at preferential tariffs determined by the Appropriate Commission.”
The National Tariff Policy was amended in January 2011 to prescribe solar-specific RPO be increased from a minimum of 0.25 percent in 2012 to 3 percent by 2022.
Electricity Act, 2003
National Electricity Policy
National Tariff Policy

83
Paving the Way for a Transformational Future: Lessons from Jawaharlal Nehru National Solar Mission Phase I
Annex 16: Competitive Bidding for Renewable Energy Projects
Guidelines for tariff-based competitive bidding process for grid-connected power projects based on renewable energy sources, December 2012
1. Case I: renewable energy procurement, where the location or technology of the renewable power project is not specified by the procurer
To ensure serious participation in the bidding process and timely commencement of the supply of power, the bidder, in case the supply is proposed from a power station to be set up, should be required to submit along with the bid, documents in support of having completed specific actions for project preparatory activities in respect of matters mentioned below:
i) Site identification and land acquisition: The requirement of land would be considered as indicated in the proposal filed with the competent authority for issuing the No Objection Certificate (NOC) for the project. In case of land is to be acquired under the LandAcquisitionAct1894oritsequivalent,the bidder shall submit copy of the notification issued for such land under Section 6 of the LandAcquisitionAct1894oritsequivalent.In all other cases, the bidder shall furnish documentary evidence in the form of certificates by concerned and competent revenue/registration authority for allotment of the land;
ii) Environmental clearance for the power station: The proposal for obtaining NOC should have been submitted to the competent authority responsible for providing final approval at the time of submission of the Request for Proposal (RFP) bid;
iii) Forest clearance (if applicable) for the land for the power station: The bidder should
have submitted the requisite proposal to the concerned administrative authority responsible for according final approval in the central/state government, as the case may be;
iv) Water linkage: For solar thermal and hybrid power projects, the bidder shall have acquired approval from the concerned State Irrigation Department or any other relevant authority for the quantity of water required for the power station; and
v) Technology tie-up: The bidder shall be required to provide proof of the technology tie-up for the renewable power project.
2. CASE II: renewable energy procurement for the location-specific renewable, which the procur-er intends to set up under a tariff-based bidding process
To ensure timely commencement of supply of electricity being procured and to convince the bidders about the irrevocable intention of the procurer, it is necessary that various project preparatory activities are completed in time. For long-term procurement for projects for which pre-identified sites are to be utilized, the following project preparatory activities should be completed by the procurer or an authorized representative of the procurer, simultaneously with the bidding process adhering to the milestones indicated below:
i) Site identification and land acquisition: If the land is required to be acquired for the power station, the notification under section 6 of the LandAcquisitionAct,1894oritsequivalentshould have been issued before the publication of RFP. If the provisions of section 17 of the LandAcquisitionAct,1894oritsequivalentregarding an emergency have not been applied,

84
Paving the Way for a Transformational Future: Lessons from Jawaharlal Nehru National Solar Mission Phase I
theawardundertheLandAcquisitionActoritsequivalent should have been declared before the PPA becomes effective;
ii) Environmental clearance for the power station: The application to the competent authority for grant of NOC should have been submitted before issuing the RFP and the NOC should be in place before the PPA becomes effective;
iii) Forest clearance (if applicable) for the land for the power station: The requisite proposal for forest clearance should have been submitted before the concerned administrative authority responsible for according the final approval in the central/state government, as the case may be, before the issue of the RFP;
iv) Water linkage: For solar thermal and hybrid power projects, approval from the concerned State Irrigation Department or any other relevant authority for the quantity of water required for the power station should have been obtained; and
v) Requisite solar radiation, hydrological, geological, meteorological and seismological data necessary for the preparation of the Detailed Project Report, where applicable: The data should be made available to the bidders during the RFP stage, that is, at least 30 days prior to the submission of the RFP bid. The bidder shall be free to verify geological data through its own sources, as the geological risk would lie with the project developer.

85
Paving the Way for a Transformational Future: Lessons from Jawaharlal Nehru National Solar Mission Phase I
Annex 17: Institutional Framework for the Solar Sector
Key Areas of Institutional Interventions
• Programimplementation The MNRE undertakes various solar energy
specific programs. The SNAs act as the program implementation agencies at the state level. However, at central level, MNRE has been directly overseeing program implementation until now. The SECI has been recently formed to assist MNRE in undertaking solar programs.
• Monitoringandevaluation M&E of the rural solar energy programs has
been an area of concern. Issues related to lack of O&M expertise and equipment availability are faced by the rural solar programs. SNAs, due to their limited capabilities/resources, are not able to overcome these issues on a sustainable basis.
Institutional intervention at the central level is required to overcome these issues, with to establish a well-coordinated arrangement with SNAs.
• Coordinationarrangement State and center coordination: There is no
established framework for coordination between the SNAs and the MNRE’s administered institutions such as SEC, SECI and IREDA. There are a number of solar energy programs which are undertaken and coordination is limited to the specific programs. Institutional intervention at the central level can facilitate in establishing a framework to facilitate state and center coordination aimed at solar sector development, to leverage synergies across different programs;
Figure A17 1 : Central Institutions with Solar Sector
Source: Authors’ research.
Polic
yIn
stitu
tiona
l
Department of Non-conventional
Energy Sources
Institutions associated with the Solar Segment
SEC
Alternate Hydro Energy Centre
IREDA
1982 1987 1992 1993 1998 2003 2004 2006 2008 2010 2012
JNNSMNational
TariffPolicy
Electricity Act 2003
MNRE Policy and Tariff Guidelines
Preferential Tariffs for Renewable
Energy from Science and Engineering
Research Councils
NAPCC
MNRE C-WETCreation of Sardar Swaran Singh National Institute of
Renewable Energy
Creation of
SECI

86
Paving the Way for a Transformational Future: Lessons from Jawaharlal Nehru National Solar Mission Phase I
Coordination among MNRE institutions: SECI has been mandated to undertake program implementation and set up projects in the area of solar energy. In this respect, it will need support from other MNRE institutions such as SEC, IREDA and C-WET on areas like solar radiation data, site attractiveness, technology attractiveness, and financing which will form a major factor in implementation of solar programs (grid and off-grid).
Institutional intervention is required from MNRE administered institutions on aspects related to planning/implementation of evacuation infrastructure in regions (high potential), facilitating approval and clearances for strategic projects. Most issues are related to state-specific implementation. However, the involvement of central-level institution can be crucial in the success of solar projects strategic to sector development.
The solar energy segment has an adequate number of institutions to undertake the mandates required for the growth of the sector:
• SECandC-WETtofocusontechnologydemonstration, resource assessment;
• SECtoassistMNREinimplementationofsolarprograms (grid as well as off-grid);
• StatelevelimplementationbytheSNAs;and• IREDAtofacilitatefinancing.
Role of SEC
The SEC is the primary entity for undertaking activities in the area of technology R&D, testing, evaluation and standards:
• TheJNNSMenvisagesthattheMNRE-administered SEC will become part of the National Center of Excellence. It is expected that, increasingly, SEC will need to move towards being adequately autonomous in its decision-making and flexible in adopting processes and systems to meet its own requirement;
• TheSECwillhavemultiplerolestoexecute,namely, of being a premier center for technology R&D, support the GoI in its solar testing, calibration and benchmarking initiatives, offer knowledge services and, in the long run, facilitate technology commercialization initiatives; and
• Currently,SECisorganizedasadivisionofMNRE. However, SEC being a division (directly) under MNRE may pose a challenge for SEC in undertaking substantive multi-institutional participation (having diverse contractual arrangements, especially with the private sector) and establishing itself as a self-sustainable and accountable institution.
Role of SECI
• Anewlyformedorganizationwithafocusonsolar technologies;
• EstablishedasaSection25companywhichprovides for institutional autonomy; GoI is expected to hold a 100 percent equity stake in the company;
• Rolesandresponsibilities: ‒ To function as a solar development
implementation institution and assist the MNRE as an executing arm for meeting goals
‒ Only institution in the renewable energy sector with a large scope of mandate to implement solar projects in grid as well as off-grid setup (under program administration as well as project management
‒ SECI to play an active role in the implementation of power evacuation arrangements;
• Expectedtobeasteppingstoneforovercomingissues related to program implementation at the central level and other related implementation aspects; and
• SECIisexpectedtotackleissuespertainingtoplanning, management and implementation with a professional and holistic approach. Other MNRE institutions such as SEC, C-WET and IREDA are expected to support SECI in the achievement of JNNSM and other sector requirements.

87
Paving the Way for a Transformational Future: Lessons from Jawaharlal Nehru National Solar Mission Phase I
Role of IREDA
IREDA is a public limited government company established in 1987, under the administrative control of MNRE, to promote, develop and extend financial assistance for renewable energy and energy efficiency/conservation projects.
It has developed norms to undertake its lending functions covering aspects such as loan application registration, project appraisal, sanction of loan, security creation, and disbursement and recovery of loan. In the solar energy segment, IREDA has also played the role of program administrator for the GBI under the RPSSGP scheme in JNNSM Phase I and is responsible for project allotment and disbursement of GBI.
Role of State Nodal Agencies
SNAs play an important role in the implementation of central as well as state-level policies/programs
for renewable energy including solar energy in the state. SNAs are responsible for grid as well as off-grid solar power project/program implementation.
The main roles and responsibilities of the SNAs in the area of solar energy include:
• Policy formulation support: Advocacy of policies, legislation and enforcement mechanisms for promotion of solar energy;
• Implementation: Project registration, facilitation in approval and clearances, coordination with state and central departments;
• M&E: Supervision, monitoring and evaluation of the solar energy programs;
• Resource assessment: Survey and mapping of resource potential and subsequent dissemination to encourage project installation; and
• Awareness generation and capacity building: Undertake activities to raise public awareness and disseminate information related to solar energy.

88
Paving the Way for a Transformational Future: Lessons from Jawaharlal Nehru National Solar Mission Phase I
Annex18:GujaratSolarPark—ACaseStudy
Gujarat Solar Park is the world’s first multi-developer, multi-facility, multi-technology and multi-beneficiary solar park; it is located in Charanka village, district Patan, Gujarat. It was implemented speedily with the entire park becoming operational in one year, starting with land acquisition to commissioning of 214 MW solar projects.
Background
In September 2009, the Clinton Climate Initiative signed a Memorandum of Understanding with the Government of Gujarat for setting up of solar parks. The implementation of the solar park concept was proposed in several phases with the aim to make Gujarat a hub for solar power generation and also to bring in manufacturing and R&D facilities to support this goal.
The initial solar projects in Gujarat had faced problems in terms of private land acquisition leading to legal issues and procedural delays, conversion of agricultural land, transmission connectivity issues, procedural delays due to multiplicity of the agencies, and so on. Considering all these difficulties, the solar park was conceptualized with the purpose of:
• Developingaconcentratedzoneforsolarprojectactivities; and
• Providingalltheprimaryinfrastructuresuchas land allotment, roads, power evacuation network, water supply system, and so on, for ease of operation and rapid development of the solar project at a single location.
The Charanka site in Patan district was identified for the development of first such solar park focused on generation, the foundation stone was laid in December 2010, and 214 MW was commissioned by January 2012.
GPCLwasappointedasthenodalsolarparkdevelopment agency for the execution of solar parks in Gujarat. It has played a crucial role in ensuring the implementation and operations of the Charanka solar park.
Key Features
The solar park presents a plug and play model for potential investors, by designating and developing one or more blocks of land as a concentrated zone for solar development. Individual solar plants share common power evacuation facilities, reducing costs. The major interest in these concentrated hubs has been due to their ability to achieve economies of scale by developing shared infrastructure facilities for each business located in the zone. In addition, they reduce unforeseen risks for investors by acting as a single-window clearance agency and providing certainty with respect to investment and relevant policy, regulatory and incentive frameworks. These zones also serve as centers for targeted social development by virtue of their location in underdeveloped/backward regions. In this manner, these parks provide economic and employment opportunities for specific regions.
Figure A18 A: Gujarat Solar Park Layout Plan

89
Paving the Way for a Transformational Future: Lessons from Jawaharlal Nehru National Solar Mission Phase I
Gujarat Solar Park has large concentration of solar power generating units in a single location in Asia. It has a capacity potential of more than 500 MW, covering a land area of 2,024 hectares, comprising government land (1,080 hectares) and private land (944 hectares).
The park has been able to attract more than 21 developers from India and abroad with varied capacities ranging from 1 MW to 25 MW. The park comprises a mix of technologies, ranging from TF PV, c-Si, tracker-based, and so on.
The park provides a multi-facility infrastructure to the developers, including:
• Requisitesizeplotallotment;• Approachandaccessroads;• Smartpowerevacuationnetworkuptothe
project premises; and• Watersupplysystem.
The solar park provides infrastructure facilities such as roads, water pipeline, water and sewage treatment plant, helipad, fencing, leveled land, fire station, telecom network, 400/220/66 KV sub-station and 66 kV auxiliary sub-station. The within park distribution network development cost for infrastructure and land in the solar park is around INR 5,500 million (US$91.67 million). The land allotment has been done bythenodalagency(GPCL)throughatransparentprocess. The developers have to pay processing fees, allotment fees, security deposit and a development charge based on the area occupied.
Key Benefits
The park has been able to benefit various stakeholders such as government agencies, private developers, financial institutions and the society at large. Some of the benefits include:
• Savingsintermsofclusteredinfrastructuredevelopment instead of segregated development for individual projects as well as cost savings due to sharing of common infrastructure cost;
• OverallemissionreductionandavoidanceofRight of Way issues for transmission evacuation;
• Singlewindowclearanceeasefordevelopers;• Duediligenceassistanceforfinancial
institutions;• Uniquesmartgridfeaturesincorporatedinthe
design;• Developmentofgovernmentwasteland;• Socialupliftaroundsolarparksiteandlocal
employment generation; and• Intangiblebenefitsintermsofincreasein
vegetation cover and water conservation.
The successful implementation of the solar park concept in Gujarat is likely to pave the way for the development of bigger and better infrastructure facilities for solar projects in other parts of India. MNRE is already working on a plan to set up five ultra-mega renewable energy parks across different states. These solar parks are likely to come up in Rajasthan, Gujarat and Jammu & Kashmir. The first ultra-mega solar park of 4 GW capacity is being set up in Sambhar, Rajasthan.
Figure A18 A: Gujarat Solar Park Layout Plan

Notes


Photo credit: Fortum Corporation
Disclaimer: The information and opinions presented herein are meant only for factual purposes and do not intend to reflect the situation or circumstance of any country or entity. While all efforts have been made in gathering information from reliable sources, neither ESMAP nor the World Bank should be held responsible for the accuracy of the data presented. The report has been discussed with the Government of India, but does not necessarily bear their approval for all its contents, especially where the World Bank has stated any judgment/opinion/policy recommendation.
© Copyright 2013
Energy Sector Management Assistance Program (ESMAP)1818 H Street, NW Washington, DC 20433 USATel: 1.202.458.2321, Fax: 1.202.522.3018Internet: www.worldbank.org/esmapEmail: [email protected]