pavement structural evaluation and design of full …docs.trb.org/prp/11-2026.pdfpavement structural...
TRANSCRIPT
Pavement Structural Evaluation and Design of Full-Depth
Reclamation (FDR) Pavement
by
Tommy Nantung, Ph.D., P.E., Section Manager (Corresponding author)
INDOT, Research Division
1205 Montgomery Street
West Lafayette, Indiana 47906, USA
Phone: (765) 463-1521 ext. 248
Yigong Ji, Ph.D., P.E., Pavement Structure Research Engineer
INDOT, Research Division
1205 Montgomery Street
West Lafayette, Indiana 47906, USA
Phone: (765) 463-1521 ext. 252
Todd Shields, P.E., Technical Services Manager
INDOT, Maintenance Management Division
100 North Senate Avenue
Indianapolis, Indiana 46204, USA
Phone: (317) 233-4726
Total Number of Words
Number of words in text: = 4,337 words equivalent
Number of tables: 1 (1*250) = 250 words equivalent
Number of figures: X (9*250) = 2,250 words equivalent
------------------------------------- ------------------------------
Total number of words = 6,837 words equivalent
Submitted for presentation and possible publication
in the 90th
Transportation Research Board Annual Meeting, January 23-27, 2011
November 2010
TRB 2011 Annual Meeting Paper revised from original submittal.
Nantung, Ji, and Shields 1
Pavement Structural Evaluation of Full Depth Reclamation (FDR) Pavement 1
By 2
T.E. Nantung, Y. Ji, and T. Shields 3
4
ABSTRACT 5
This pavement preservation topic has gained significant attention from pavement practitioners in the United States 6
along with important support from the Federal Highway Administration, which has enabled several programs in 7
pavement preservation. In the current SAFETEA-LU and the upcoming Transportation Bill, the emphasis is on 8
transportation infrastructure issues such as pavement preservation and faster rehabilitation/re-construction with the 9
significant topic of the renewal of infrastructure. Preservation of the existing transportation system requires 10
rehabilitation and re-construction techniques that reduce congestion during construction. However, there is need not 11
only of faster construction, but also of more durable pavement that reduces both agency costs and costs to the 12
traveling public. One of the faster pavement construction techniques is FDR (Full-Depth Reclamation). An 13
evaluation project was initiated by INDOT Research and Development to estimate the structural contribution and 14
feasibility of FDR bases for pavement structure under low to medium volume traffic loading. FWD (Falling Weight 15
Deflectometer) tests were conducted, and the layer moduli were back-calculated during different construction phases 16
on the surface of existing HMA (Hot Mixed Asphalt) pavement, the FDR base, the new HMA final surface, and 17
post-construction testing at 9, 20, and 35 months. The results indicated promising results of this recycled base 18
material in pavement construction compared to traditional granular base. This evaluation result indicated that the 19
MEPDG (Mechanistic Empirical Pavement Design Guide) provided comparable thickness to the 1993 AASHTO 20
Pavement Guide if the failure criteria are set reasonably. 21
KEYWORDS 22
Full Depth Reclamation, Pavement Preservation, Pavement Evaluation, Mechanistic Empirical Pavement Design 23
Guide, Falling Weight Deflectometer 24
.25
TRB 2011 Annual Meeting Paper revised from original submittal.
Nantung, Ji, and Shields 2
INTRODUCTION 1
Full-Depth Reclamation (FDR) pavement technology has been recognized for pavement preservation and 2
rehabilitation applications for at least 20 years. During the development of the FDR pavement technology, this 3
technology was viewed as a pavement recycle rather than a potential field application for pavement preservation due 4
to the prohibitive cost and technical challenges in design and construction. Pavement preservation is always 5
associated with low cost and no requirements of pavement design. However, the main concept of FDR is not only to 6
implement a pavement recycling program and rebuild worn out asphalt pavement, but also to preserve the 7
substructure of the pavement’s total structural integrity. Only recently has this FDR technology become more viable 8
in field application when faster construction and more durable pavement are needed in conjunction with pavement 9
preservation program. 10
In the last 15 years, the United States has experienced an exponential increase in traffic volume, especially 11
in urban areas with high population growth; congestion, pollution, and safety are issues related to pavement 12
rehabilitation and reconstruction in such areas. The traveling public demand better pavement rehabilitation and 13
reconstruction techniques to assure travel time reliability. Therefore, user cost is becoming a substitute of the three 14
main issues above as an indicator of the need for faster construction and more durable roads. In addition to 15
pavement infrastructure in urban areas, mainly municipalities, some State Departments of Transportation have 16
already implemented FDR pavement for many years with good performance records, especially in roads that have 17
only a short time window of opportunity to close. 18
Rehabilitation strategies such as milling and filling or simply overlaying worn-out pavements can lead to 19
premature failures due to weak bases or reflective cracking. On the other hand, FDR has been proposed as an 20
alternative in pavement rehabilitation projects [1]. This process makes roads better by combining the old asphalt 21
surface materials with the underlying base and additives such as cement or foamed asphalt to produce a rejuvenated 22
road base that is stronger than new aggregate. The process is performed entirely on site, so the costs of removing, 23
hauling away, and disposing of the old pavement are eliminated. Therefore, FDR has been a technique widely used 24
by DOT, city, and county agencies. 25
Since January 2009, INDOT has adopted the Mechanistic Empirical Design Guide (MEPDG), a newer 26
pavement design guide that incorporates more significant input parameters based on performance criteria. This new 27
MEPDG developed under the National Cooperative Highway Research Program (NCHRP) Project 1-37A [2] is a 28
new pavement design method using a hierarchal approach; different levels of analysis are available depending upon 29
desired reliability and available information. However, the PCA’s Thickness Design for Soil-Cement Pavement and 30
the American Association of Highway and Transportation Officials’ (AASHTO) 1993 Pavement Design Guide can 31
also be used to design FDR. Although an empirical approach provided pavement design thickness for this project, 32
INDOT decided to establish a comparison between empirical and MEPDG procedures. Such a comparison will 33
highlight the difference between these pavement procedures. Therefore, for the Indiana Department of 34
Transportation (INDOT), there is continuity between the empirical design procedure and the newer mechanistic-35
empirical procedure. 36
A study was initiated by INDOT to review the design, construction, and performance of FDR. The 37
objective in the design phase was to estimate the structural contribution and feasibility of FDR bases for a low-38
medium volume typical pavement structure. Falling Weight Deflectometer (FWD) tests were conducted during 39
different construction phases. Laboratory tests were performed in order to quantify and verify the design thickness. 40
The lab results were also used for verification of the quality of construction in the field. The results of the FWD 41
testing and the materials testing in the lab will serve as input parameters for future FDR projects using the new 42
MEPDG procedures. 43
44
LOCATION OF PROJECT 45
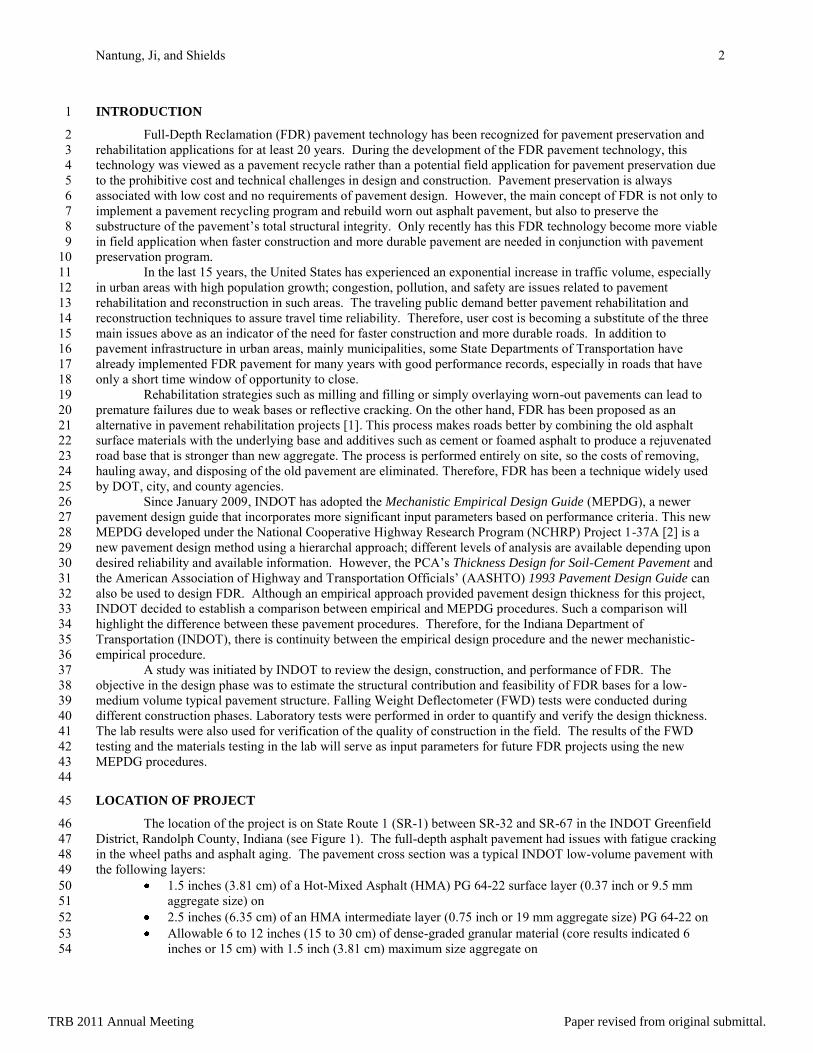
The location of the project is on State Route 1 (SR-1) between SR-32 and SR-67 in the INDOT Greenfield 46
District, Randolph County, Indiana (see Figure 1). The full-depth asphalt pavement had issues with fatigue cracking 47
in the wheel paths and asphalt aging. The pavement cross section was a typical INDOT low-volume pavement with 48
the following layers: 49
1.5 inches (3.81 cm) of a Hot-Mixed Asphalt (HMA) PG 64-22 surface layer (0.37 inch or 9.5 mm 50
aggregate size) on 51
2.5 inches (6.35 cm) of an HMA intermediate layer (0.75 inch or 19 mm aggregate size) PG 64-22 on 52
Allowable 6 to 12 inches (15 to 30 cm) of dense-graded granular material (core results indicated 6 53
inches or 15 cm) with 1.5 inch (3.81 cm) maximum size aggregate on 54
TRB 2011 Annual Meeting Paper revised from original submittal.
Nantung, Ji, and Shields 3
Compacted subgrade soil. 1
2
3 Figure 1 – Location of Indiana FDR Project (from Google maps) 4
5
The project roadway is a two-lane road in a rural area that connects rural commuters in farmlands. The 6
existing pavement was overlaid (mill and fill) with 1.5 inches (3.81 cm) of a Hot-Mixed Asphalt (HMA) surface 7
layer of 0.37 inch (9.5 millimeter) aggregate in September 2004. The International Roughness Indexes (IRI) in 2006 8
were 67 inches/mile (1.05 meters/kilometer) in the North Bound lane and 77 inches/mile (1.21 meters/kilometer) in 9
the South Bound lane. The estimated two-way Annual Average Daily Traffic in 2006 was 600 vehicles/day with 9% 10
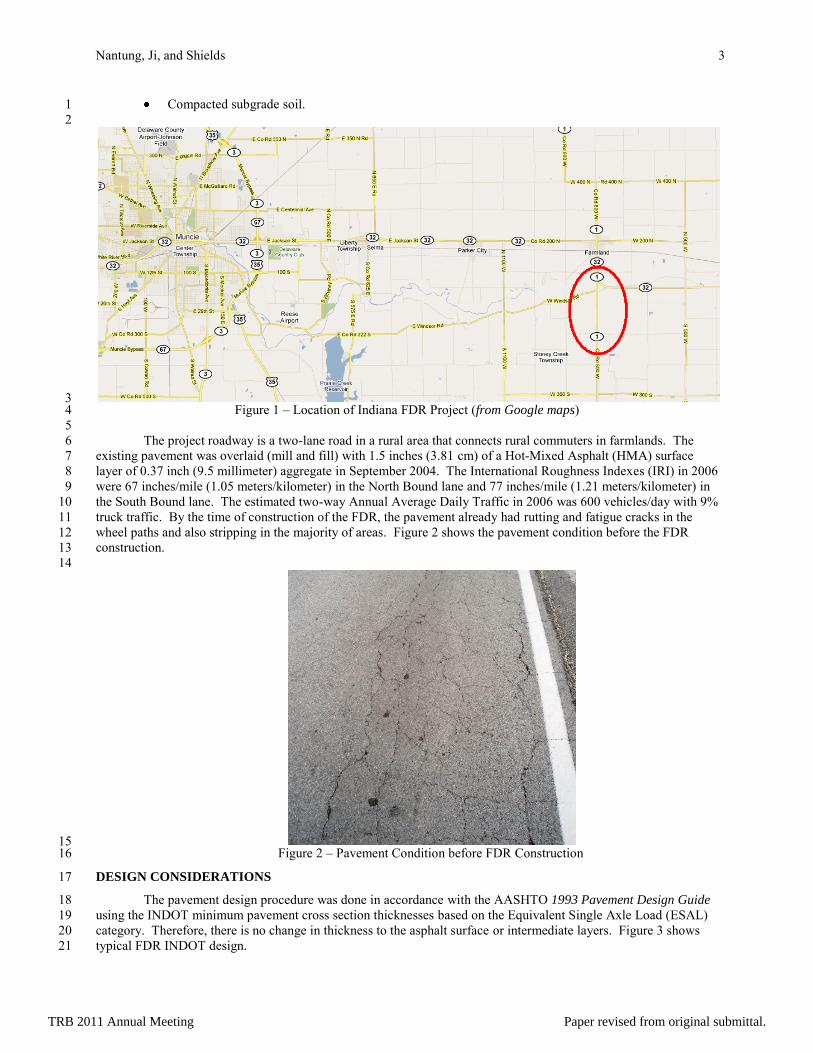
truck traffic. By the time of construction of the FDR, the pavement already had rutting and fatigue cracks in the 11
wheel paths and also stripping in the majority of areas. Figure 2 shows the pavement condition before the FDR 12
construction. 13
14
15 Figure 2 – Pavement Condition before FDR Construction 16
DESIGN CONSIDERATIONS 17
The pavement design procedure was done in accordance with the AASHTO 1993 Pavement Design Guide 18
using the INDOT minimum pavement cross section thicknesses based on the Equivalent Single Axle Load (ESAL) 19
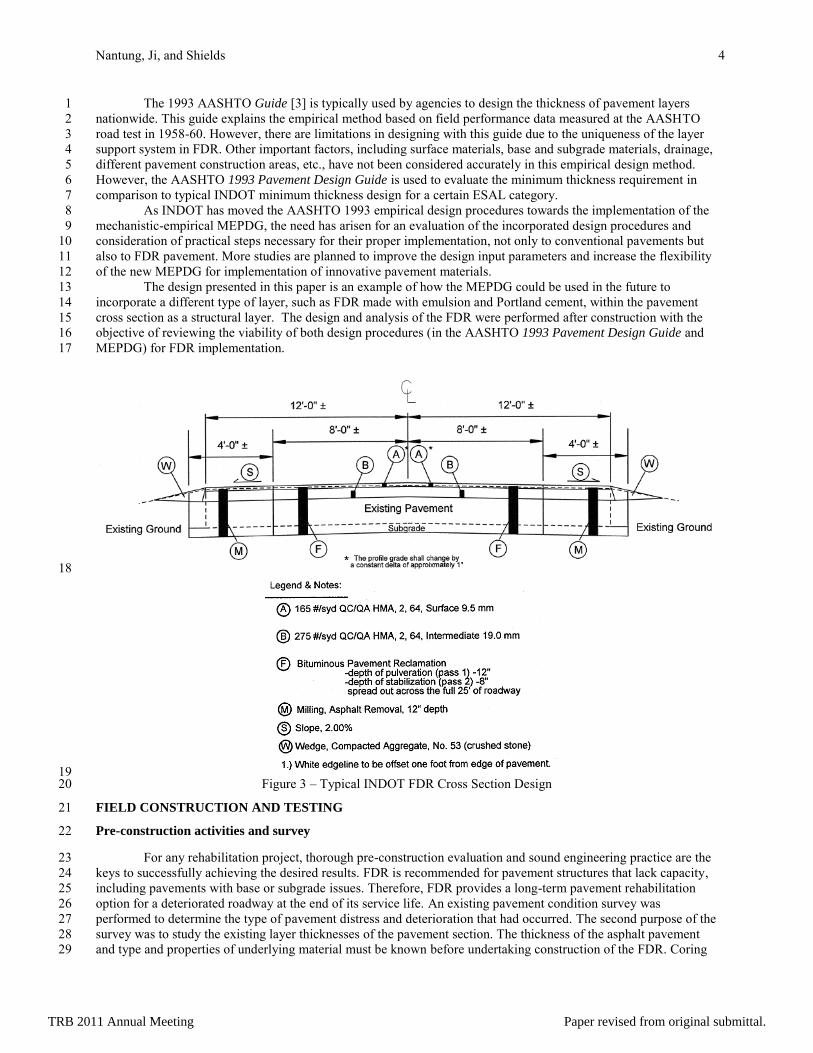
category. Therefore, there is no change in thickness to the asphalt surface or intermediate layers. Figure 3 shows 20
typical FDR INDOT design. 21
TRB 2011 Annual Meeting Paper revised from original submittal.
Nantung, Ji, and Shields 4
The 1993 AASHTO Guide [3] is typically used by agencies to design the thickness of pavement layers 1
nationwide. This guide explains the empirical method based on field performance data measured at the AASHTO 2
road test in 1958-60. However, there are limitations in designing with this guide due to the uniqueness of the layer 3
support system in FDR. Other important factors, including surface materials, base and subgrade materials, drainage, 4
different pavement construction areas, etc., have not been considered accurately in this empirical design method. 5
However, the AASHTO 1993 Pavement Design Guide is used to evaluate the minimum thickness requirement in 6
comparison to typical INDOT minimum thickness design for a certain ESAL category. 7
As INDOT has moved the AASHTO 1993 empirical design procedures towards the implementation of the 8
mechanistic-empirical MEPDG, the need has arisen for an evaluation of the incorporated design procedures and 9
consideration of practical steps necessary for their proper implementation, not only to conventional pavements but 10
also to FDR pavement. More studies are planned to improve the design input parameters and increase the flexibility 11
of the new MEPDG for implementation of innovative pavement materials. 12
The design presented in this paper is an example of how the MEPDG could be used in the future to 13
incorporate a different type of layer, such as FDR made with emulsion and Portland cement, within the pavement 14
cross section as a structural layer. The design and analysis of the FDR were performed after construction with the 15
objective of reviewing the viability of both design procedures (in the AASHTO 1993 Pavement Design Guide and 16
MEPDG) for FDR implementation. 17
18
19 Figure 3 – Typical INDOT FDR Cross Section Design 20
FIELD CONSTRUCTION AND TESTING 21
Pre-construction activities and survey 22
For any rehabilitation project, thorough pre-construction evaluation and sound engineering practice are the 23
keys to successfully achieving the desired results. FDR is recommended for pavement structures that lack capacity, 24
including pavements with base or subgrade issues. Therefore, FDR provides a long-term pavement rehabilitation 25
option for a deteriorated roadway at the end of its service life. An existing pavement condition survey was 26
performed to determine the type of pavement distress and deterioration that had occurred. The second purpose of the 27
survey was to study the existing layer thicknesses of the pavement section. The thickness of the asphalt pavement 28
and type and properties of underlying material must be known before undertaking construction of the FDR. Coring 29
TRB 2011 Annual Meeting Paper revised from original submittal.
Nantung, Ji, and Shields 5
operations were performed to confirm that the existing pavement structural data were correct. The Falling Weight 1
Deflectometer (FWD) testing was conducted to estimate stiffness of the in-situ asphalt, base, and subgrade layers. 2
Field construction activities 3
Construction of this FDR pavement began on August 27th
, 2007. The existing asphalt structural section and 4
a predetermined amount of underlying materials were pulverized and treated to produce an 8-inch (20 centimeter) 5
stabilized base course as a structural foundation for the asphalt pavement layer on the top. Linear grading was 6
completed on both sides of the existing pavement prior to the pulverization process to widen the road from its 7
original width to the new width of 25 feet (7.62 meters). The existing asphalt and base was pre-pulverized to a depth 8
of 11 inches (28 centimeters) using a Wirtgen 2500 reclaimer/stabilizer. The pre-pulverized material was then 9
graded to fill the road-widening trench. In this process, the pulverized pavement materials were treated with the 10
FDR design admixtures. The asphalt emulsion was transported to the road construction site by a transport truck. The 11
transport truck fed the emulsion to the road in the reclaimer/stabilizer. The reclaimer pumped the emulsion from the 12
delivery truck and metered the emulsion into the mixing chamber through a spray bar with nozzles. The emulsion 13
spray rate was proportioned to the forward speed of the reclaimer/stabilizer. The application rate of emulsion and 14
Portland cement was 1.3 gallons/yard2 (5.89 liters/square meters) and 3% by weight, respectively. The amount of 15
cement being placed was verified using a one-square-yard canvas and scale. 16
The surface of the treated material was moisture conditioned prior to the initial breakdown compaction 17
using a Hamm vibratory pad-foot roller. Once the material was initially compacted, a grader established a profile in 18
the treated section. Final compaction of the material was completed using a Hamm HD-120 vibratory double-drum 19
roller, first in the vibratory mode, and finally in the static mode. Several applications of water were distributed as 20
needed on the surface of the treated mat during the final compaction process. The FDR construction was completed 21
on August 29th
, 2007. 22
The finished treated layer serves as a uniform and stable pavement structural foundation for a suitable 23
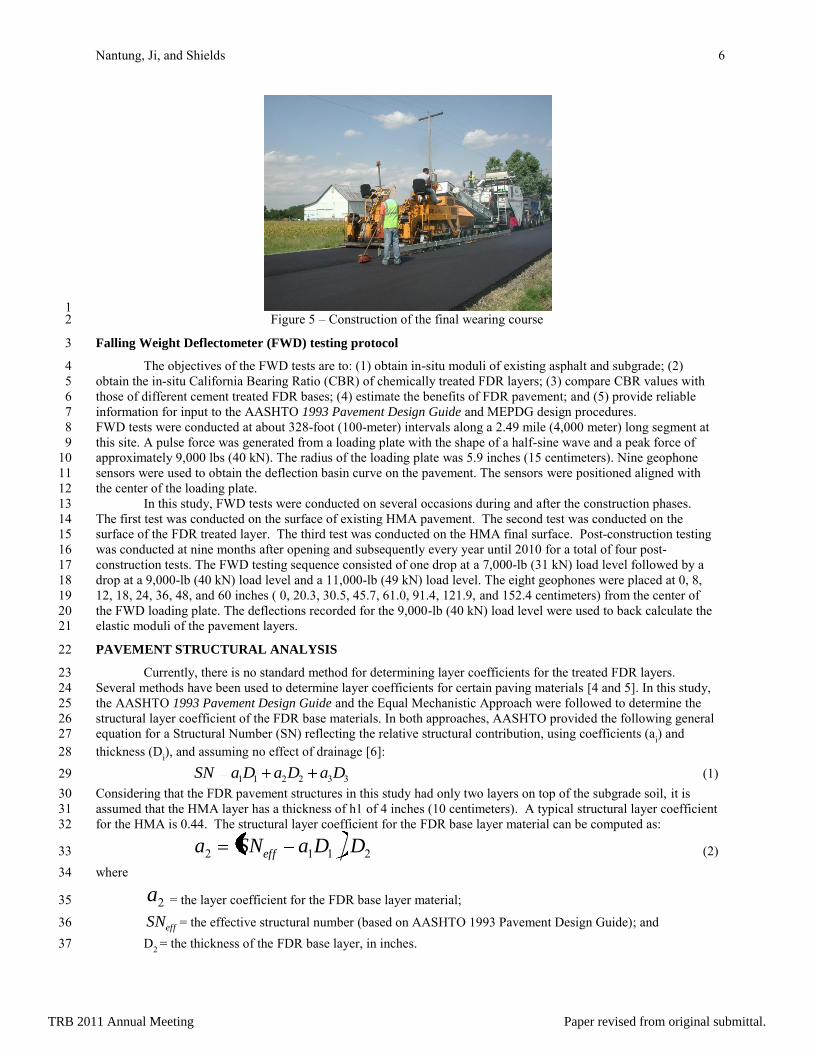
HMA wearing course. This newly constructed treated layer can typically be opened to traffic on the same day. Once 24
the curing period was completed, the final HMA surface was placed on September 4th
, 2007. It should be noted that 25
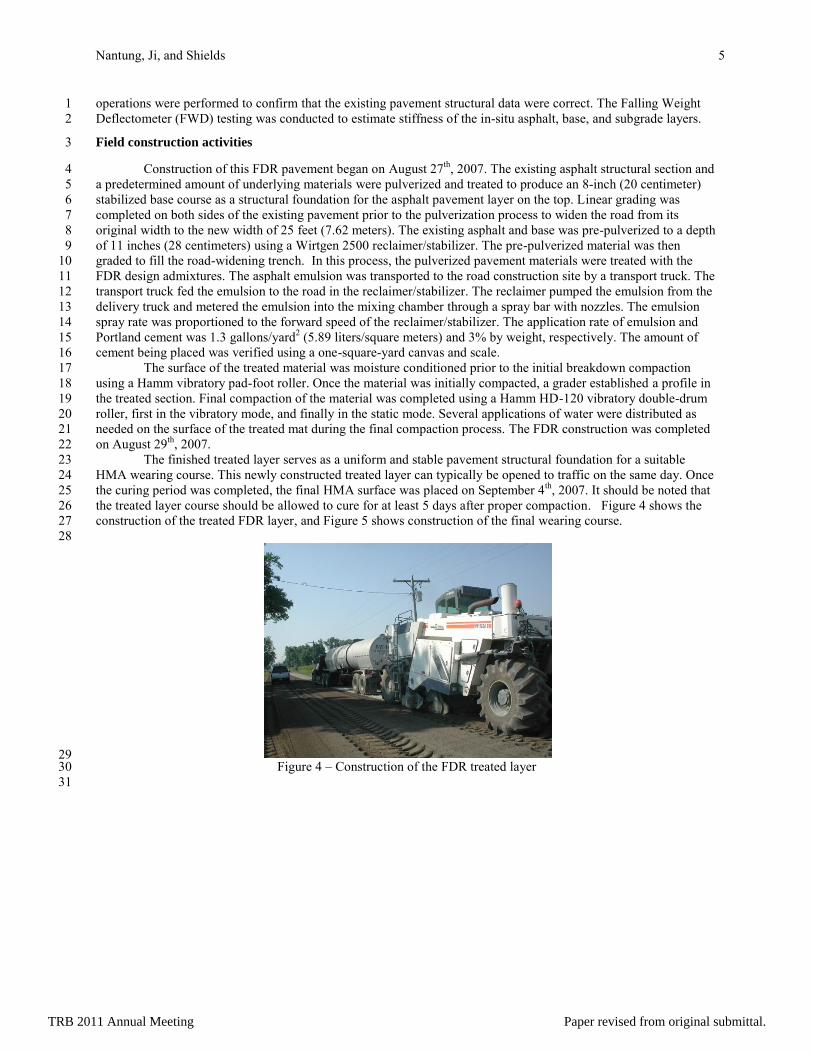
the treated layer course should be allowed to cure for at least 5 days after proper compaction. Figure 4 shows the 26
construction of the treated FDR layer, and Figure 5 shows construction of the final wearing course. 27
28
29 Figure 4 – Construction of the FDR treated layer 30
31
TRB 2011 Annual Meeting Paper revised from original submittal.
Nantung, Ji, and Shields 6
1 Figure 5 – Construction of the final wearing course 2
Falling Weight Deflectometer (FWD) testing protocol 3
The objectives of the FWD tests are to: (1) obtain in-situ moduli of existing asphalt and subgrade; (2) 4
obtain the in-situ California Bearing Ratio (CBR) of chemically treated FDR layers; (3) compare CBR values with 5
those of different cement treated FDR bases; (4) estimate the benefits of FDR pavement; and (5) provide reliable 6
information for input to the AASHTO 1993 Pavement Design Guide and MEPDG design procedures. 7
FWD tests were conducted at about 328-foot (100-meter) intervals along a 2.49 mile (4,000 meter) long segment at 8
this site. A pulse force was generated from a loading plate with the shape of a half-sine wave and a peak force of 9
approximately 9,000 lbs (40 kN). The radius of the loading plate was 5.9 inches (15 centimeters). Nine geophone 10
sensors were used to obtain the deflection basin curve on the pavement. The sensors were positioned aligned with 11
the center of the loading plate. 12
In this study, FWD tests were conducted on several occasions during and after the construction phases. 13
The first test was conducted on the surface of existing HMA pavement. The second test was conducted on the 14
surface of the FDR treated layer. The third test was conducted on the HMA final surface. Post-construction testing 15
was conducted at nine months after opening and subsequently every year until 2010 for a total of four post-16
construction tests. The FWD testing sequence consisted of one drop at a 7,000-lb (31 kN) load level followed by a 17
drop at a 9,000-lb (40 kN) load level and a 11,000-lb (49 kN) load level. The eight geophones were placed at 0, 8, 18
12, 18, 24, 36, 48, and 60 inches ( 0, 20.3, 30.5, 45.7, 61.0, 91.4, 121.9, and 152.4 centimeters) from the center of 19
the FWD loading plate. The deflections recorded for the 9,000-lb (40 kN) load level were used to back calculate the 20
elastic moduli of the pavement layers. 21
PAVEMENT STRUCTURAL ANALYSIS 22
Currently, there is no standard method for determining layer coefficients for the treated FDR layers. 23
Several methods have been used to determine layer coefficients for certain paving materials [4 and 5]. In this study, 24
the AASHTO 1993 Pavement Design Guide and the Equal Mechanistic Approach were followed to determine the 25
structural layer coefficient of the FDR base materials. In both approaches, AASHTO provided the following general 26
equation for a Structural Number (SN) reflecting the relative structural contribution, using coefficients (ai) and 27
thickness (Di), and assuming no effect of drainage [6]: 28
332211 DaDaDaSN (1) 29
Considering that the FDR pavement structures in this study had only two layers on top of the subgrade soil, it is 30
assumed that the HMA layer has a thickness of h1 of 4 inches (10 centimeters). A typical structural layer coefficient 31
for the HMA is 0.44. The structural layer coefficient for the FDR base layer material can be computed as: 32
2112 DDaSNa eff (2) 33
where 34
2a = the layer coefficient for the FDR base layer material; 35
effSN = the effective structural number (based on AASHTO 1993 Pavement Design Guide); and 36
D2 = the thickness of the FDR base layer, in inches. 37
TRB 2011 Annual Meeting Paper revised from original submittal.
Nantung, Ji, and Shields 7
The deflections used in the calculations for the treated FDR layer structural coefficients are those measured 1
corresponding to the load drop at the 9,000-lb load level on September 19th
, 2007, June 2nd
, 2008, April 27th, 2009, 2
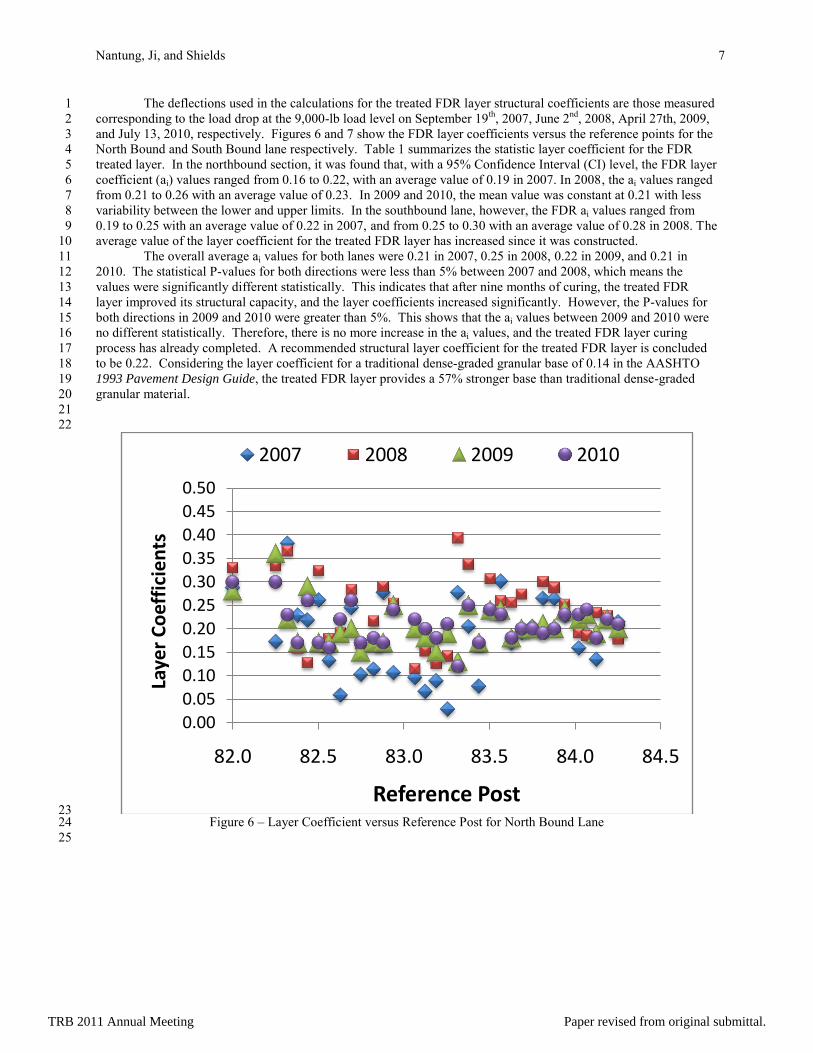
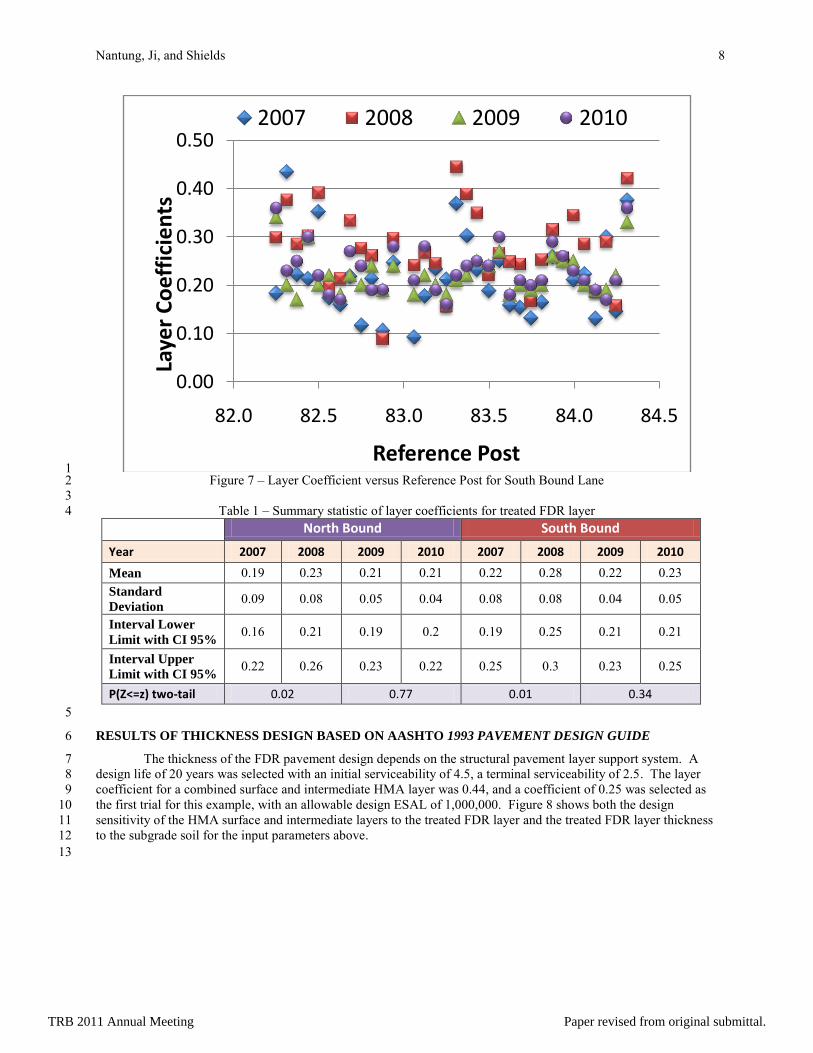
and July 13, 2010, respectively. Figures 6 and 7 show the FDR layer coefficients versus the reference points for the 3
North Bound and South Bound lane respectively. Table 1 summarizes the statistic layer coefficient for the FDR 4
treated layer. In the northbound section, it was found that, with a 95% Confidence Interval (CI) level, the FDR layer 5
coefficient (ai) values ranged from 0.16 to 0.22, with an average value of 0.19 in 2007. In 2008, the ai values ranged 6
from 0.21 to 0.26 with an average value of 0.23. In 2009 and 2010, the mean value was constant at 0.21 with less 7
variability between the lower and upper limits. In the southbound lane, however, the FDR ai values ranged from 8
0.19 to 0.25 with an average value of 0.22 in 2007, and from 0.25 to 0.30 with an average value of 0.28 in 2008. The 9
average value of the layer coefficient for the treated FDR layer has increased since it was constructed. 10
The overall average ai values for both lanes were 0.21 in 2007, 0.25 in 2008, 0.22 in 2009, and 0.21 in 11
2010. The statistical P-values for both directions were less than 5% between 2007 and 2008, which means the 12
values were significantly different statistically. This indicates that after nine months of curing, the treated FDR 13
layer improved its structural capacity, and the layer coefficients increased significantly. However, the P-values for 14
both directions in 2009 and 2010 were greater than 5%. This shows that the ai values between 2009 and 2010 were 15
no different statistically. Therefore, there is no more increase in the ai values, and the treated FDR layer curing 16
process has already completed. A recommended structural layer coefficient for the treated FDR layer is concluded 17
to be 0.22. Considering the layer coefficient for a traditional dense-graded granular base of 0.14 in the AASHTO 18
1993 Pavement Design Guide, the treated FDR layer provides a 57% stronger base than traditional dense-graded 19
granular material. 20
21
22
23 Figure 6 – Layer Coefficient versus Reference Post for North Bound Lane 24
25
0.00
0.05
0.10
0.15
0.20
0.25
0.30
0.35
0.40
0.45
0.50
82.0 82.5 83.0 83.5 84.0 84.5
Laye
r C
oef
fici
en
ts
Reference Post
2007 2008 2009 2010
TRB 2011 Annual Meeting Paper revised from original submittal.
Nantung, Ji, and Shields 8
1 Figure 7 – Layer Coefficient versus Reference Post for South Bound Lane 2
3
Table 1 – Summary statistic of layer coefficients for treated FDR layer 4
North Bound South Bound
Year 2007 2008 2009 2010 2007 2008 2009 2010
Mean 0.19 0.23 0.21 0.21 0.22 0.28 0.22 0.23
Standard
Deviation 0.09 0.08 0.05 0.04 0.08 0.08 0.04 0.05
Interval Lower
Limit with CI 95% 0.16 0.21 0.19 0.2 0.19 0.25 0.21 0.21
Interval Upper
Limit with CI 95% 0.22 0.26 0.23 0.22 0.25 0.3 0.23 0.25
P(Z<=z) two-tail 0.02 0.77 0.01 0.34
5
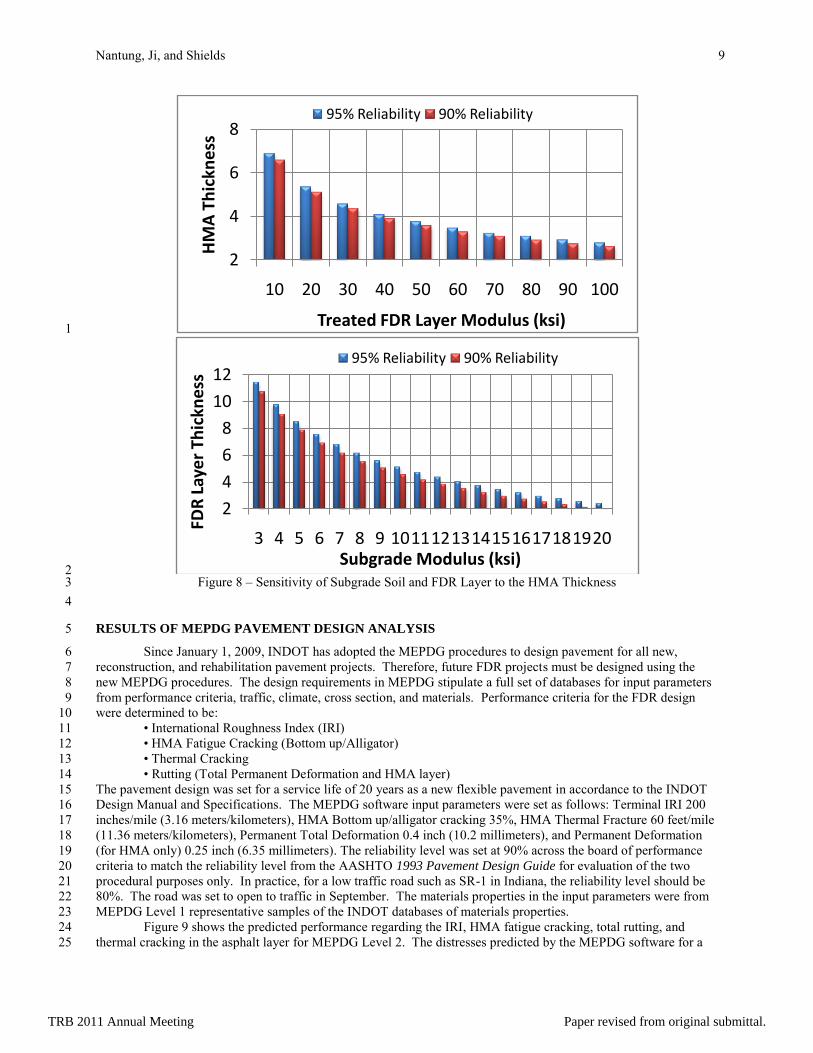
RESULTS OF THICKNESS DESIGN BASED ON AASHTO 1993 PAVEMENT DESIGN GUIDE 6
The thickness of the FDR pavement design depends on the structural pavement layer support system. A 7
design life of 20 years was selected with an initial serviceability of 4.5, a terminal serviceability of 2.5. The layer 8
coefficient for a combined surface and intermediate HMA layer was 0.44, and a coefficient of 0.25 was selected as 9
the first trial for this example, with an allowable design ESAL of 1,000,000. Figure 8 shows both the design 10
sensitivity of the HMA surface and intermediate layers to the treated FDR layer and the treated FDR layer thickness 11
to the subgrade soil for the input parameters above. 12
13
0.00
0.10
0.20
0.30
0.40
0.50
82.0 82.5 83.0 83.5 84.0 84.5
Laye
r C
oe
ffic
ien
ts
Reference Post
2007 2008 2009 2010
TRB 2011 Annual Meeting Paper revised from original submittal.
Nantung, Ji, and Shields 9
1
2 Figure 8 – Sensitivity of Subgrade Soil and FDR Layer to the HMA Thickness 3
4
RESULTS OF MEPDG PAVEMENT DESIGN ANALYSIS 5
Since January 1, 2009, INDOT has adopted the MEPDG procedures to design pavement for all new, 6
reconstruction, and rehabilitation pavement projects. Therefore, future FDR projects must be designed using the 7
new MEPDG procedures. The design requirements in MEPDG stipulate a full set of databases for input parameters 8
from performance criteria, traffic, climate, cross section, and materials. Performance criteria for the FDR design 9
were determined to be: 10
• International Roughness Index (IRI) 11
• HMA Fatigue Cracking (Bottom up/Alligator) 12
• Thermal Cracking 13
• Rutting (Total Permanent Deformation and HMA layer) 14
The pavement design was set for a service life of 20 years as a new flexible pavement in accordance to the INDOT 15
Design Manual and Specifications. The MEPDG software input parameters were set as follows: Terminal IRI 200 16
inches/mile (3.16 meters/kilometers), HMA Bottom up/alligator cracking 35%, HMA Thermal Fracture 60 feet/mile 17
(11.36 meters/kilometers), Permanent Total Deformation 0.4 inch (10.2 millimeters), and Permanent Deformation 18
(for HMA only) 0.25 inch (6.35 millimeters). The reliability level was set at 90% across the board of performance 19
criteria to match the reliability level from the AASHTO 1993 Pavement Design Guide for evaluation of the two 20
procedural purposes only. In practice, for a low traffic road such as SR-1 in Indiana, the reliability level should be 21
80%. The road was set to open to traffic in September. The materials properties in the input parameters were from 22
MEPDG Level 1 representative samples of the INDOT databases of materials properties. 23
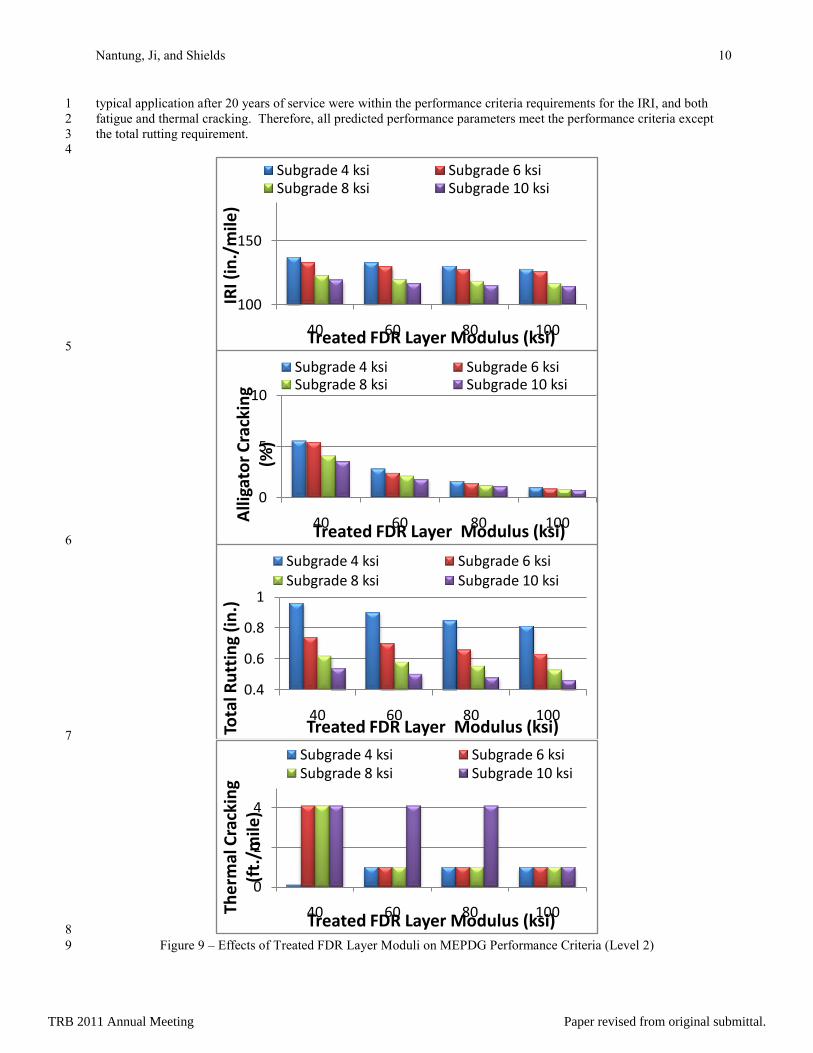
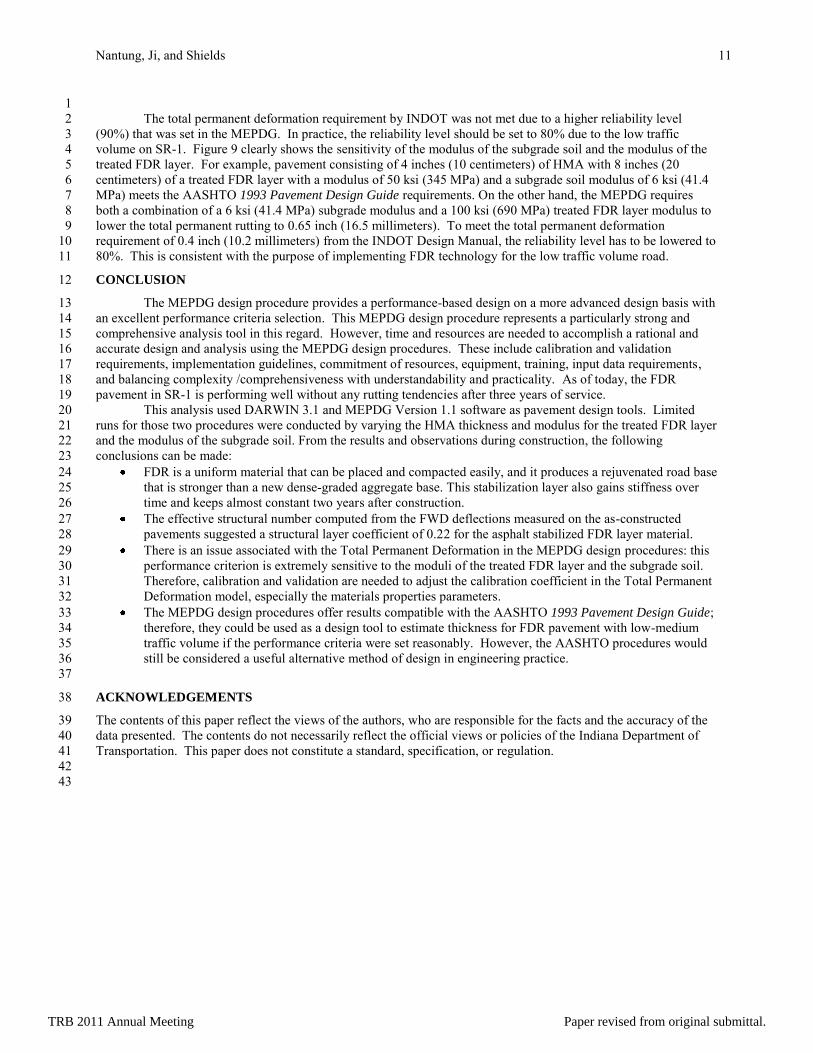
Figure 9 shows the predicted performance regarding the IRI, HMA fatigue cracking, total rutting, and 24
thermal cracking in the asphalt layer for MEPDG Level 2. The distresses predicted by the MEPDG software for a 25
2
4
6
8
10 20 30 40 50 60 70 80 90 100
HM
A T
hic
kne
ss
Treated FDR Layer Modulus (ksi)
95% Reliability 90% Reliability
2
4
6
8
10
12
3 4 5 6 7 8 9 1011121314151617181920
FDR
Lay
er
Thic
kne
ss
Subgrade Modulus (ksi)
95% Reliability 90% Reliability
TRB 2011 Annual Meeting Paper revised from original submittal.
Nantung, Ji, and Shields 10
typical application after 20 years of service were within the performance criteria requirements for the IRI, and both 1
fatigue and thermal cracking. Therefore, all predicted performance parameters meet the performance criteria except 2
the total rutting requirement. 3
4
5
6
7
8
Figure 9 – Effects of Treated FDR Layer Moduli on MEPDG Performance Criteria (Level 2) 9
100
150
40 60 80 100
IRI (
in./
mile
)
Treated FDR Layer Modulus (ksi)
Subgrade 4 ksi Subgrade 6 ksiSubgrade 8 ksi Subgrade 10 ksi
0
5
10
40 60 80 100Alli
gato
r C
rack
ing
(%)
Treated FDR Layer Modulus (ksi)
Subgrade 4 ksi Subgrade 6 ksiSubgrade 8 ksi Subgrade 10 ksi
0.4
0.6
0.8
1
40 60 80 100
Tota
l Ru
ttin
g (i
n.)
Treated FDR Layer Modulus (ksi)
Subgrade 4 ksi Subgrade 6 ksiSubgrade 8 ksi Subgrade 10 ksi
0
2
4
40 60 80 100The
rmal
Cra
ckin
g (f
t./m
ile)
Treated FDR Layer Modulus (ksi)
Subgrade 4 ksi Subgrade 6 ksiSubgrade 8 ksi Subgrade 10 ksi
TRB 2011 Annual Meeting Paper revised from original submittal.
Nantung, Ji, and Shields 11
1
The total permanent deformation requirement by INDOT was not met due to a higher reliability level 2
(90%) that was set in the MEPDG. In practice, the reliability level should be set to 80% due to the low traffic 3
volume on SR-1. Figure 9 clearly shows the sensitivity of the modulus of the subgrade soil and the modulus of the 4
treated FDR layer. For example, pavement consisting of 4 inches (10 centimeters) of HMA with 8 inches (20 5
centimeters) of a treated FDR layer with a modulus of 50 ksi (345 MPa) and a subgrade soil modulus of 6 ksi (41.4 6
MPa) meets the AASHTO 1993 Pavement Design Guide requirements. On the other hand, the MEPDG requires 7
both a combination of a 6 ksi (41.4 MPa) subgrade modulus and a 100 ksi (690 MPa) treated FDR layer modulus to 8
lower the total permanent rutting to 0.65 inch (16.5 millimeters). To meet the total permanent deformation 9
requirement of 0.4 inch (10.2 millimeters) from the INDOT Design Manual, the reliability level has to be lowered to 10
80%. This is consistent with the purpose of implementing FDR technology for the low traffic volume road. 11
CONCLUSION 12
The MEPDG design procedure provides a performance-based design on a more advanced design basis with 13
an excellent performance criteria selection. This MEPDG design procedure represents a particularly strong and 14
comprehensive analysis tool in this regard. However, time and resources are needed to accomplish a rational and 15
accurate design and analysis using the MEPDG design procedures. These include calibration and validation 16
requirements, implementation guidelines, commitment of resources, equipment, training, input data requirements, 17
and balancing complexity /comprehensiveness with understandability and practicality. As of today, the FDR 18
pavement in SR-1 is performing well without any rutting tendencies after three years of service. 19
This analysis used DARWIN 3.1 and MEPDG Version 1.1 software as pavement design tools. Limited 20
runs for those two procedures were conducted by varying the HMA thickness and modulus for the treated FDR layer 21
and the modulus of the subgrade soil. From the results and observations during construction, the following 22
conclusions can be made: 23
FDR is a uniform material that can be placed and compacted easily, and it produces a rejuvenated road base 24
that is stronger than a new dense-graded aggregate base. This stabilization layer also gains stiffness over 25
time and keeps almost constant two years after construction. 26
The effective structural number computed from the FWD deflections measured on the as-constructed 27
pavements suggested a structural layer coefficient of 0.22 for the asphalt stabilized FDR layer material. 28
There is an issue associated with the Total Permanent Deformation in the MEPDG design procedures: this 29
performance criterion is extremely sensitive to the moduli of the treated FDR layer and the subgrade soil. 30
Therefore, calibration and validation are needed to adjust the calibration coefficient in the Total Permanent 31
Deformation model, especially the materials properties parameters. 32
The MEPDG design procedures offer results compatible with the AASHTO 1993 Pavement Design Guide; 33
therefore, they could be used as a design tool to estimate thickness for FDR pavement with low-medium 34
traffic volume if the performance criteria were set reasonably. However, the AASHTO procedures would 35
still be considered a useful alternative method of design in engineering practice. 36
37
ACKNOWLEDGEMENTS 38
The contents of this paper reflect the views of the authors, who are responsible for the facts and the accuracy of the 39
data presented. The contents do not necessarily reflect the official views or policies of the Indiana Department of 40
Transportation. This paper does not constitute a standard, specification, or regulation. 41
42
43
TRB 2011 Annual Meeting Paper revised from original submittal.
Nantung, Ji, and Shields 12
REFERENCES
1. Asphalt Institute. The Asphalt Handbook. 7th
edition. 2007.
2. Guide for Mechanistic-Empirical Design of New and Rehabilitated Pavement Structures. www.trb.org/mepdg.
National Cooperative Highway Research Program, Transportation Research Board, Washington, D. C. 2004.
3. American Association of State Highway and Transportation Officials. Guide for Design of Pavement
Structures. Washington, D.C. 1993.
4. Hossain, M., Habib, A., and Latorella, T. M... Structural Layer Coefficients of Crumb Rubber-Modified
Asphalt Concrete Mixtures. Journal of the Transportation Research Board, 1997, (1583): 62-70.
5. Poloruto, M.. Procedure for use of Falling Weight Deflctometer to Determine AASHTO Layer Coefficients.
Journal of the Transportation Research Board 2001, (1764): 11-19.
6. Huang, Y. H.. Pavement Analysis and Design. New Jersey: Prentice Hall, 1993.
TRB 2011 Annual Meeting Paper revised from original submittal.