pavement preservation report to legislature
TRANSCRIPT

WSDOT STRATEGIES REGARDING
PRESERVATION OF THE STATE ROAD NETWORK
A Report to the State Legislature
in Response to SB 6381
Prepared by:
Washington State Department of Transportation
State Materials Laboratory
September 1, 2010
I
TABLE OF CONTENTS 1. COMPENDIUM OF EXECUTIVE SUMMARIES .......................................................... 1
2. INTRODUCTION................................................................................................................. 7
3. BACKGROUND ................................................................................................................. 11
3.1 Monitoring Pavement Performance .................................................................................. 12 3.2 Preservation Funding ......................................................................................................... 14 3.3 Managing to the Lowest Life-Cycle Cost .......................................................................... 16 3.4 Pavement Type Selection ................................................................................................... 17 3.5 Pavement Rehabilitation Backlog ...................................................................................... 20 3.6 Preventive Maintenance Strategies: Extending Life and Reducing Costs ......................... 22 3.7 Maintaining Quality with Reduced Funding...................................................................... 23
3.8 References for Section 3 .................................................................................................... 24
4. STRATEGIES FOR MANAGING THE BACKLOG OF PAVEMENT NEEDS ........ 26
4.1 Concrete Pavement ............................................................................................................ 26 4.2 Chip Seal (BST) Pavements............................................................................................... 27 4.3 Asphalt Pavements ............................................................................................................. 30
5. SUMMARY OF 10-YEAR CONCRETE PAVEMENT PLAN...................................... 36
5.1 Concrete Pavement ............................................................................................................ 36 5.2 Concrete Pavement Evaluation Process ............................................................................. 38
6. SUMMARY OF 10-YEAR PLAN FOR FLEXIBLE PAVEMENTS ............................ 41
6.1 Chip Seal (BST) Pavement ................................................................................................ 41
6.2 Asphalt Pavement Two-Year Plan ..................................................................................... 42 6.3 Ten-Year Integrated Plan for Flexible Pavements ............................................................. 43
7. STRATEGIES FOR ADDRESSING ESCALATION OF ASPHALT PRICES ........... 45
7.1 Asphalt Cost Price Adjustment .......................................................................................... 45 7.2 Strategies for Addressing Escalation of Asphalt Prices ..................................................... 48
8. USING RECYCLED ASPHALT AND CONCRETE IN STATE HIGHWAY CONSTRUCTION ...................................................................................................................... 53
8.1 Recycled Asphalt in Washington State .............................................................................. 53 8.2 Recycled Concrete Pavement ............................................................................................ 60
8.3 References for Section 8 .................................................................................................... 62
9. PERMEABLE PAVEMENTS ........................................................................................... 64
9.1 What is Permeable Pavement? ........................................................................................... 65 9.2 Permeable Pavement Applications in Washington State ................................................... 66 9.3 Potential Permeable Pavements for Very Low-Volume Roads ......................................... 68 9.4 Current Permeable Pavements not Suited to Typical Traffic Levels on State Highways . 68 9.5 Specialized Types of Permeable Pavements: Open-Graded Friction Courses ................. 69
APPENDIX A. PAVEMENT TYPE SELECTION CRITERIA ........................................... 70

II
A.1 Pavement Design Analysis................................................................................................ 70
A.2 Life-cycle Cost Analysis ................................................................................................... 75 A.3 Project Specific Details ..................................................................................................... 86
APPENDIX B. DETAILED 10-YEAR CONCRETE PAVEMENT PLAN ......................... 88
B.1 Data Preparation ................................................................................................................ 89 B.2 Concrete Pavement Rehabilitation and Reconstruction Alternatives ............................... 90 B.3 Concrete Pavement Index.................................................................................................. 92 B.4 Concrete Pavement Evaluation Process ............................................................................ 94
APPENDIX C. 2-YEAR PLAN FOR FLEXIBLE PAVEMENTS ..................................... 103
C.1 Asphalt Pavement Plan for 2011-2013 Biennium ........................................................... 103 C.2 Chip Seal (BST) Pavement Plan for 2011-2013 Biennium ............................................. 104
APPENDIX D. PERMEABLE PAVEMENT LITERATURE REVIEW ........................... 106
D.1 Introduction ..................................................................................................................... 106 D.2 Design of Conventional Pavement .................................................................................. 107 D.3 Introduction to Literature Review ................................................................................... 108 D.4 Cost ................................................................................................................................. 137 D.5 Use of Permeable Pavement in the Pacific Northwest .................................................... 138 D.6 Permeable Pavement Installations at High Traffic Sites ................................................. 162 D.7 Meetings with Department of Ecology, the County Road Administration Board and the Trasnportation Improvement Board ........................................................................................ 165 D.8 References for Appendix D ............................................................................................. 174

1
1. COMPENDIUM OF EXECUTIVE SUMMARIES
This document was prepared by the Washington State Department of Transportation (WSDOT) State Materials Laboratory, in response to a request by the State Legislature to provide detailed information on certain topics related to the state’s roadways. For each section of the report an Executive Summary was prepared. This portion of the report is a compendium of the Executive Summaries for the individual sections found in this document.
Executive Summary for Section 2. Introduction
The 2009 State Legislature, in SB 6381, requested that specific topics related to the state road system be evaluated and reported back to the Legislature by September 1, 2010. The Introduction provides a guide to where in the document each topic is covered. There are nine sections, and four appendices in the report. Hyperlinks are provided to the particular portions of the report that may be of interest to certain readers.
Executive Summary for Section 3. Background
Pavements are managed to the lowest life-cycle cost through the diligent monitoring of performance to determine when they have reached the optimum time for rehabilitation. The optimum point for rehabilitation is determined by the Washington State Pavement Management System (WSPMS), which monitors pavement performance indexes related to pavement structure, rutting, and roughness. Experience has shown that performing rehabilitation before this optimum time results in a waste of the available life in a pavement, and rehabilitation after this optimum point results in higher costs due to additional repairs that need to be made to bring the pavement back to an acceptable standard of performance. Over the past 10 years the state’s Roadway Preservation (P1) budget was reduced over $.58 billion (constant 2010 dollars). Even with this reduction in funding, the road conditions statewide have been good. This result has been due to the many innovative and cost effective pavement solutions that have been implemented by the State Materials Laboratory. However, continuing budget shortfalls are developing a backlog of pavement rehabilitation needs that must be addressed in the future. Funding forecasts for future biennia are currently at a level roughly one-half of funding levels prior to 2000. The Pavements Division goes through an extremely detailed four-step process to select the type of pavement to be used on a project. The pavement must first be designed, then the cost of the various alternatives must be calculated, and then other factors specific to the particular project location must be considered before a recommendation can be made for the optimum pavement type for a project. The ability to maintain a good performance level with reduced funding comes from using innovative techniques and picking the best investment alternatives wherever possible. The tight budget situation has resulted in the development of preventive strategies for the purpose of delaying or avoiding capital construction spending. In these strategies, preservation funds are

2
being specifically allocated for preventive measures to extend pavement life. The use of the state’s pavement management system (WSPMS) provides a framework for evaluating and continually monitoring the performance of our roadway investments.
Executive Summary for Section 4. Strategies for Managing the Backlog of Pavement Needs
With a mainline road network of 18,500 lane-miles, every year a certain number of those lane-miles will require rehabilitation, or possibly reconstruction. If those needs are not addressed during the year the pavement section is “Due”, then a backlog of required construction begins to develop.
WSDOT has about 2,400 lane-miles of mainline concrete pavements. These pavements have far exceeded their original design lives and have carried several times the traffic loading originally anticipated. The use of Dowel Bar Retrofit has resulted in $220 million of accumulated savings since being implemented in 1993. Chip Seals (Bituminous Surface Treatments) currently make up approximately 4,580 lane-miles (25 percent) of the WSDOT system. WSDOT typically recommends chip seals for traffic levels less than 5,000 vehicles per day. The ratio of relative cost to relative performance for a chip seal over an asphalt pavement is roughly a factor of three. For this reason, chip seals will have high priority for programming and a backlog of chip seal lane-miles is not expected. This section analyzes three different scenarios for investigating the backlog of asphalt pavement rehabilitation:
- 1) Funding to eliminate the backlog in 10 years. The number of lane-miles of asphalt resurfacing in each of the next 10 years is determined, with the associated cost, in order to reduce the asphalt backlog to zero at the end of 10 years. This scenario takes into consideration the conversion of 2,300 asphalt lane-miles to chip seal lane-miles over the next 15 years. The total amount of funding over 10 years to achieve the objective of eliminating the asphalt pavement backlog is $ 2.00 billion, or $200 million per year. This total is $1.079 billion more than is currently budgeted over the next five biennia.
- 2) Funding to maintain the current backlog for 10 years. The backlog of asphalt pavement rehabilitation (at the end of the 11-13 Biennium) is expected to be approximately 1,360 lane-miles. This scenario determines the funding needed to maintain the status quo and not allow the backlog to grow over the next 10 years. A budget of $1.76 billion would be required for flexible pavements (asphalt and chip seal) to maintain the status quo, or $ 176 million per year. This is $ 834 million more than is currently budgeted for the 10 year period.

3
- 3) Maintain current projected budgets and allow backlog to grow for 10 years. The projected budgets will provide for a certain number of lane-miles each year. The difference between the need, and the available funding, will continue to grow the backlog over the next 10 years. This is slightly less than half of the funding required to maintain a status quo performance - no increase in backlog (Scenario 2 was $1.76 billion over the same time period). Instead, the lack of funding resulted in an estimated backlog of 4,420 asphalt lane-miles at the end of 10 years.
Executive Summary for Section 5. Summary of 10-year Concrete Plan
An evaluation of future needs was performed for WSDOT’s concrete pavements. This evaluation was developed in two parts: one for near term (2011 – 2013 Biennium), and one for long term (10 years, FY 2012 – 2021). Strategies to repair poorly performing concrete pavements fall into two categories: rehabilitation and reconstruction. Rehabilitations are temporary methods to preserve the existing pavement and extend the remaining service life. They can typically extend the pavement life 10 to 20 years, and consist of surface grinding, dowel bar retrofit (DBR), and asphalt overlay. Reconstruction will create a new structure that will have 50 – 60 years of expected pavement life. WSDOT is faced with a growing backlog of concrete pavement rehabilitation and reconstruction needs. With limited funds it is necessary to develop priorities for pavement preservation spending. The following priorities have been developed with regard to concrete pavement preservation:
High Risk that Requires Reconstruction. This situation relates to a pavement in very poor condition (PSC < 25), with the very real risk that severe cracking followed by rapid roadway failure could develop. When this occurs, all long-term options are very expensive, and the travelling public and commerce are adversely affected. The only alternative to reconstruction is a temporary asphalt overlay.
DBR and/or Grinding to Postpone Reconstruction. The importance of this priority is to intercept the pavement condition before it reaches the point of reconstruction, and achieve another 10 to 20 years of pavement life before reconstruction. DBR and/or Grinding are accomplished at a fraction of the capital cost of reconstruction.
Grinding. Grinding is a very economical method of improving the surface of a concrete pavement. Priority is given to projects that can achieve another 10 to 15 years of pavement life at a relatively low cost.

4
Executive Summary for Section 6. Summary of 10-year Plan for Flexible Pavements
Approximately 87 percent of the state roadway network consists of flexible (asphalt and chip seal) pavements. These pavements are managed mostly on a repeating cycle of 7 – 17 year rehabilitations/resurfacings. In order to determine a statewide plan for addressing pavement preservation needs, the number of Due and Past Due miles were summarized for each region, and characterized as a percentage of the total Due miles statewide. Once funds were determined according to the need of each region, the projects were selected according to the region’s recommendations. The highest priority projects from each region were then pooled into a statewide group of projects which needed to be prioritized. Several priority weighting schemes were tested which included weighting factors for total traffic, truck volume, functional class, and various categories of percent Due. This weighting process was then used to prioritize the proposed asphalt projects.
Executive Summary for Section 7. Strategies for Addressing Escalation of Asphalt Prices
WSDOT began adjusting the payment that contractors receive for asphalt pavement in 2006. The adjustment was necessary because of the worldwide fluctuations in the price of crude oil. The initial adjustment was for projects that extended over more than one construction season. The subsequent adjustment, initiated in the 2009 construction season, applies to all projects that use asphalt pavement. The contractor is paid either more for asphalt if the price increases during the project or less if the price decreases. The adjustment was needed to provide protection against some of the uncertainties of cost increases and to maintain the competitive bidding environment. It reduces the risk for contractors of being underpaid for asphalt pavement and protects WSDOT from paying too much. There are limited options to reduce the amount of asphalt used for roadway construction. All of the pavement types currently used by WSDOT utilize asphalt; even concrete pavements use asphalt in the base layer. The only viable alternative for asphalt is concrete pavement. Unfortunately, concrete pavement does not compete economically with asphalt pavement, except on more heavily trafficked roadways. This is the reason why concrete pavements are mainly confined to the urban areas of the larger cities in the state. There are processes in place to use less asphalt, which include recycling old asphalt pavements into new asphalt pavement and building asphalt pavements that last longer. Virtually all of the asphalt milled from state highways is reused either on state projects or on city or county paving projects.

5
There is a constant pursuit of improvements that will extend the life of asphalt pavements. There is a new design process for the pavement mix, a more refined approach to selecting the best performing grade of asphalt cement, solutions have been found regarding problems with achieving the correct pavement compaction where two lanes of pavement meet, and more chip seal (BST) pavements are being used, which consume less asphalt.
Executive Summary for Section 8. Using Recycled Asphalt and Concrete in State Highway Construction
WSDOT continues to be a leader in using reclaimed asphalt pavement (RAP) in highway construction. When a pavement approaches the end of its service life, it exhibits various distresses which warrant rehabilitation or reconstruction. In the case of pavement rehabilitation or reconstruction, all or a portion of the existing asphalt pavement could be either removed for land filling or recycled to make new asphalt. Asphalt surfacing is one of the most recycled products in the U.S. Nationally, it is estimated that as much as 100 million tons of asphalt pavement are milled off roads during resurfacing and widening projects each year. WSDOT practice only allows up to 20 percent of RAP to be incorporated into newly produced asphalt, but even with this allowance almost all of the RAP produced on state projects is being reused not only by WSDOT but also cities, counties and in private construction. The estimated cost savings to WSDOT alone is between $15 and $26 million per year. WSDOT is exploring the potential of incorporating even larger percentages of RAP into asphalt construction but challenges with mix design issues and pavement performance concerns must be overcome. Other applications of incorporating RAP into WSDOT construction processes include: (1) Hot In-Place Recycling (HIPR), (2) Cold In-Place Recycling (CIPR), and (3) crushed asphalt as an aggregate used in the underlying layers of a pavement structure. The HIPR process includes heating and removing a portion of the asphalt surface, remixing the material with asphalt binder and paving the mixture back on the roadway. Experimental projects have been constructed and are under evaluation. Preliminary results show there may be up to a 20 percent reduction in paving costs for simple overlays of existing structurally sound pavements. The CIPR processes is similar to the HIPR process except that the existing asphalt surface is reclaimed by a cold milling process combined with asphalt emulsion to create a new bituminous base, which is then surfaced with a chip seal or asphalt overlay. This work is limited to Eastern Washington where climatic conditions allow proper curing. The use of recycled asphalt as aggregate in base courses is being investigated in Washington and other states. There are concerns about the performance of this material and its affect on the long-term performance of pavements. Recycling concrete pavement into new concrete does not produce a mixture that is similar to the original concrete. The cement paste that clings to the aggregate after crushing creates problems with handling and finishing the concrete, creates the need for more water and cement, and can

6
cause performance problems in the pavement itself. WSDOT, with some of the best aggregate in the world encapsulated within its existing concrete pavements in the Puget Sound area, could be a prime candidate to be a leader in solving the problems associated with concrete pavement recycling. Experimental use of recycled concrete pavement to make new concrete pavements is an area that deserves attention as opportunity and funding permit.
Executive Summary for Section 9. Permeable Pavements
Effective stormwater management is a high priority for WSDOT. Conventional impermeable pavement does not allow water to penetrate the ground where it can be naturally filtered and cleaned before entering streams and underground water supplies. To ensure water falling on conventional impermeable pavement meets water quality requirements and does not cause localized erosion and flooding, WSDOT constructs stormwater facilities to collect, clean and store excess water before it enters streams or infiltrates into the soil. Permeable pavements are a potential method of managing stormwater that eliminates the need for a separate collection, treatment and storage system. Water simply flows through the permeable pavement and directly into the underlying soil. The permeable pavement removes pollutants as water flows through it and a layer of gravel under the permeable pavement stores excess water, preventing localized erosion and flooding. The strongest potential use of current permeable pavements is in new construction of very low volume, slow speed locations with lightly loaded vehicles. Common applications to date include pedestrian facilities (sidewalks, paths and parks), driveways and parking lots. There has been limited use of permeable pavement on very low-volume residential streets and other very low-volume roads with limited truck traffic. Life-cycle information for nearly all of these installations remains unavailable, due to both missing data (not tracking life-cycle cost and performance) or due to the relatively recent construction of these facilities. Permeable pavements suit new construction, as the pavement is designed from the subgrade (soil) up. Retrofitting existing pavements would entail removing not only the existing pavement, but also the aggregate base beneath it and any compacted soil below the aggregate. Depths of excavation would typically be approximately two feet. In new construction, this can be designed into the new road before construction, which would not be the case if trying to retrofit an existing road. Permeable pavements by design contain a significant volume of air voids in the pavement (holes in the pavement). Rainfall then flows through these voids in the pavement, into a gravel bed for storage and ultimately percolates into the ground, mimicking natural infiltration. The necessary air voids reduce the strength of the pavement and reduce the pavement’s ability to resist loading from high traffic volumes or from truck traffic. The infiltration of water into the soil below the pavement structure reduces the soil strength, again reducing the pavement’s ability to resist loading from high traffic volumes or from truck traffic. For these reasons most applications of permeable pavement are on facilities with no heavy vehicle traffic (bike lanes, pedestrian paths, sidewalks, areas of parked traffic (parking lots) or areas of very low speed, very low-volume traffic (residential streets).

7
Executive Summary for Section 2. Introduction
The 2009 State Legislature, in SB 6381, requested that specific topics related to the state road system be evaluated and reported back to the Legislature by September 1, 2010. The Introduction provides a guide to where in the document each topic is covered. There are nine sections, and four appendices in the report. Hyperlinks are provided to the particular portions of the report that may be of interest to certain readers.
2. INTRODUCTION
This document was prepared by WSDOT’s State Materials Laboratory in response to specific requests by the 2009 State Legislature, found in SB 6381, Section 304 (see Exhibit 2-1). The legislative proviso calls for certain actions and studies related to the preservation of the state roadway network. This introduction provides a reference guide to specific sections of the report that address individual items in the proviso. Request:
Relevant Sections: Information related to paragraph (7) is found in:
- 3. Background o 3.1 Monitoring Pavement Performance o 3.2 Preservation Funding o 3.3 Managing to the Lowest Life-Cycle Cost o 3.5 Pavement Rehabilitation Backlog
Request:

8
Relevant Sections: Information related to paragraph (8)(a)(i) and (8)(a)(ii) is found in:
- 4. Strategies for Managing the Backlog of Pavement Needs o 4.1 Concrete o 4.2 BST o 4.3 Asphalt
Request:
Relevant Sections: Information related to paragraph (8)(a)(iii) is found in:
- 7. Strategies for Addressing Escalation of Asphalt Prices o 7.1 Construction Price Adjustment o 7.2 Alternatives to Hot Mix Asphalt
Request:
Relevant Sections: Information related to paragraph (8)(a)(iv) is found in:
- 3.4 Pavement Type Selection - Appendix A. Criteria for Selection of Pavement Type
Request:
Relevant Sections: Information related to paragraph (8)(a)(v) is found in:
- 8. Using Recycled Asphalt and Concrete in State Highway Construction o 8.1 Recycled Asphalt o 8.2 Recycled Concrete

9
Request:
Relevant Sections: Information related to paragraph (8)(b) is found in:
- 9. Potential Use of Permeable Asphalt or Concrete Pavement - Appendix D Permeable Pavement Literature Review

10
Exhibit 2-1. Excerpt from Senate Bill 6381 related to state roadway pavements.
Excerpt from Senate Bill 6381
Section 304

11
Executive Summary for Section 3. Background
Pavements are managed to the lowest life-cycle cost through the diligent monitoring of performance to determine when they have reached the optimum time for rehabilitation. The optimum point for rehabilitation is determined by the Washington State Pavement Management System (WSPMS), which monitors pavement performance indexes related to pavement structure, rutting, and roughness. Experience has shown that performing rehabilitation before this optimum time results in a waste of the available life in a pavement, and rehabilitation after this optimum point results in higher costs due to additional repairs that need to be made to bring the pavement back to an acceptable standard of performance. Over the past 10 years the state’s Roadway Preservation (P1) budget was reduced over $.58 billion (constant 2010 dollars). Even with this reduction in funding, the road conditions statewide have been good. This result has been due to the many innovative and cost effective pavement solutions that have been implemented by the State Materials Laboratory. However, continuing budget shortfalls are developing a backlog of pavement rehabilitation needs that must be addressed in the future. Funding forecasts for future biennia are currently at a level roughly one-half of funding levels prior to 2000. The Pavements Division goes through an extremely detailed four step process to select the type of pavement to be used on a project. The pavement must first be designed, then the cost of the various alternatives must be calculated, and then other factors specific to the particular project location must be considered before a recommendation can be made for the optimum pavement type for a project. The ability to maintain a good performance level with reduced funding comes from using innovative techniques and picking the best investment alternatives wherever possible. The tight budget situation has resulted in the development of preventive strategies for the purpose of delaying or avoiding capital construction spending. In these strategies, preservation funds are being specifically allocated for preventive maintenance activities. The use of the state’s pavement management system (WSPMS) provides a framework for evaluating and continually monitoring the performance of our roadway investments.
3. BACKGROUND
There are approximately 20,500 lane-miles of roadway (including ramps and special use lanes) that are owned by the State of Washington. This network is roughly 9 percent of the total roadway miles in the state. Other road networks in Washington are managed by municipalities, counties, and federal agencies (i.e., Forest Service and Bureau of Indian Affairs). There are three basic pavement types used by WSDOT:
– Asphalt Pavement. A typical asphalt pavement has an asphalt surface and a granular (stone) base. Engineers classify this as a “flexible” pavement. The average life (time period between resurfacings) in the Western part of the state is 16-17 years, but only 10-11 years in the Eastern part of the state because of more severe climate conditions. The

12
current (2010) asphalt pavement resurfacing cost averages (statewide) approximately $250,000 per lane-mile.
– Chip Seal (also Bituminous Surface Treatment or BST). A chip seal is constructed by rolling stones into a thin layer of asphalt emulsion, which when cured provides a durable pavement surface for 6-8 years. A chip seal, also considered a flexible pavement, has a current average (statewide) resurfacing cost of $40,000 per lane-mile.
– Concrete Pavement. New concrete pavements are designed for a life of 50 years at an initial cost of $2.5 million per lane-mile. Engineers classify concrete as a “rigid” pavement, which are typically used where high volumes of truck traffic occur.
The lane-mile breakdown of the three pavement types by WSDOT Region is shown below in Table 3-1. Ramps and special use lanes are tabulated separately because they are not considered “mainline” road segments; however they still need to be maintained. Table 3-1. Lane-mile breakdown of pavement type for WSDOT roads (1).
Region
Asphalt
(lane-miles)
Chip Seal
(lane-miles)
Concrete
(lane-miles)
Ramp/
Special Use
Total
(lane-miles)
Northwest 2,998 55 930 788 4,772
North Central 1,189 1,343 5 97 2,634
Olympic 2,304 402 185 393 3,285
Southwest 1,916 385 133 200 2,634
South Central 1,461 691 883 262 3,297
Eastern 1,698 1,706 270 186 3,860
Total 11,566 4,582 2,407 1,927 20,482 The State Legislature has established the Preservation Program to provide for the management of the state’s road assets. The mission of the Preservation Program is: “To maintain, preserve, and extend the life and utility of prior investments in transportation systems and services.” (RCW 47.04.280). Three basic steps are used by WSDOT to address this mission:
1) Monitor the condition of the road network on a continuing basis; 2) For those road segments that are at the end of their pavement life, evaluate rehabilitation
alternatives based on a Life-Cycle Cost Analysis (LCCA); 3) Develop short term (2-year) and long term (10-year) plans for preservation of the road
network based on rehabilitation needs and available resources. The methods used to accomplish these steps, and the recent history of the Preservation Program, are discussed in this background section of the report.
3.1 Monitoring Pavement Performance
WSDOT monitors pavement performance using an annual condition survey. The survey rates the pavement condition based on a scale of 0 – 100 in three areas: a) pavement cracking and patching, b) rutting, and c) roughness.
13
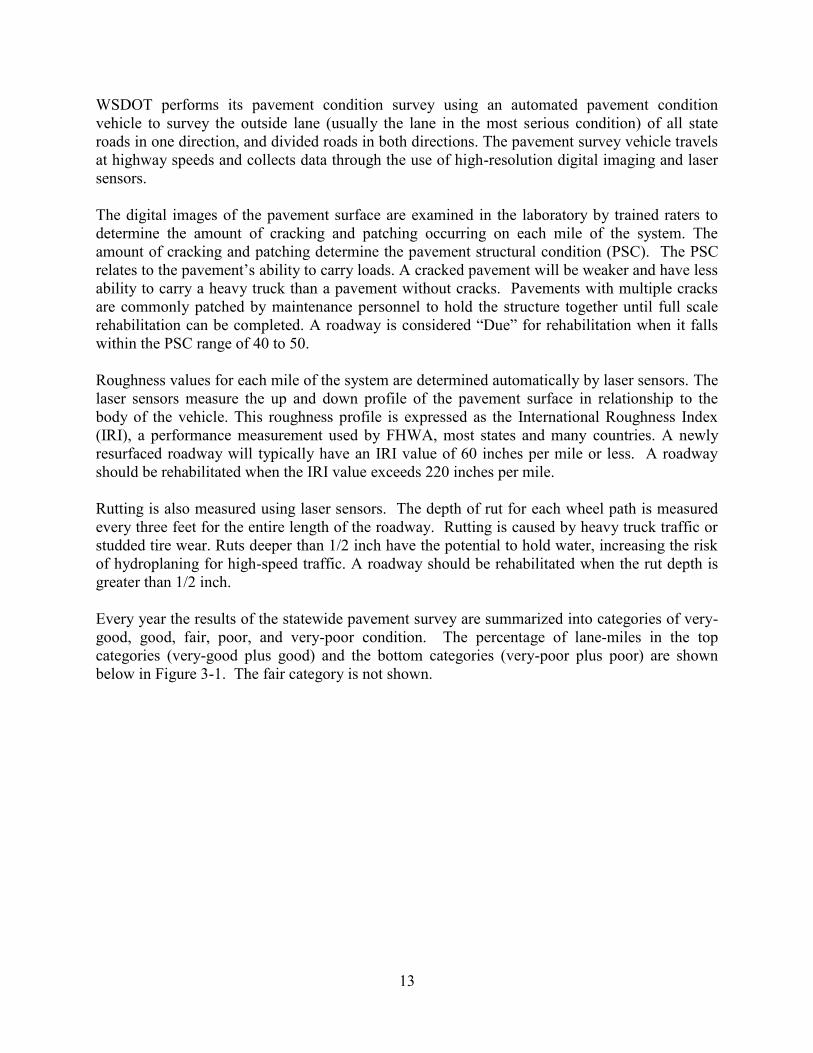
WSDOT performs its pavement condition survey using an automated pavement condition vehicle to survey the outside lane (usually the lane in the most serious condition) of all state roads in one direction, and divided roads in both directions. The pavement survey vehicle travels at highway speeds and collects data through the use of high-resolution digital imaging and laser sensors. The digital images of the pavement surface are examined in the laboratory by trained raters to determine the amount of cracking and patching occurring on each mile of the system. The amount of cracking and patching determine the pavement structural condition (PSC). The PSC relates to the pavement’s ability to carry loads. A cracked pavement will be weaker and have less ability to carry a heavy truck than a pavement without cracks. Pavements with multiple cracks are commonly patched by maintenance personnel to hold the structure together until full scale rehabilitation can be completed. A roadway is considered “Due” for rehabilitation when it falls within the PSC range of 40 to 50. Roughness values for each mile of the system are determined automatically by laser sensors. The laser sensors measure the up and down profile of the pavement surface in relationship to the body of the vehicle. This roughness profile is expressed as the International Roughness Index (IRI), a performance measurement used by FHWA, most states and many countries. A newly resurfaced roadway will typically have an IRI value of 60 inches per mile or less. A roadway should be rehabilitated when the IRI value exceeds 220 inches per mile. Rutting is also measured using laser sensors. The depth of rut for each wheel path is measured every three feet for the entire length of the roadway. Rutting is caused by heavy truck traffic or studded tire wear. Ruts deeper than 1/2 inch have the potential to hold water, increasing the risk of hydroplaning for high-speed traffic. A roadway should be rehabilitated when the rut depth is greater than 1/2 inch. Every year the results of the statewide pavement survey are summarized into categories of very-good, good, fair, poor, and very-poor condition. The percentage of lane-miles in the top categories (very-good plus good) and the bottom categories (very-poor plus poor) are shown below in Figure 3-1. The fair category is not shown.

14
Figure 3-1. 30-year trend in statewide pavement condition. The Governor’s Cabinet Strategic Action Plan has set a goal to maintain 90 percent of all state highway pavements in good or fair condition. As shown in Figure 3-1, this goal has been met since 1999 (less than 10 percent in poor condition).
3.2 Preservation Funding
The average amount of funding required for pavement preservation for asphalt and chip seals can be estimated very simply by taking the number of lane-miles and dividing by the average pavement life, then multiplying by the average cost per lane-mile. For example, with 11,566 lane-miles of mainline asphalt pavement and a statewide average life between resurfacings of 14 years, an average year would require that 826 (11,566 / 14) lane-miles be resurfaced. This is a simple approximation but it provides a reasonable estimate for the funding required to preserve the flexible pavements, which are 87 percent of the WSDOT road system. Table 3-2 shows the number of lane-miles estimated for resurfacing each year by Region. The estimated costs in this table were developed using appropriate unit costs for each Region. Unit costs vary across the state due to local availability of aggregate, location of construction companies and equipment, and the variable cost of asphalt. Preservation of the concrete network is considered separately because of its longer pavement life.
0%
10%
20%
30%
40%
50%
60%
70%
80%
90%
19
79
19
81
19
83
19
84
19
86
19
88
19
89
19
90
19
91
19
92
19
93
19
94
19
95
19
96
19
97
19
98
19
99
20
00
20
01
20
02
20
03
20
04
20
05
20
06
20
07
20
08
Pavement Condition Statewide - All Pavement Types30-Year Trend
V.Good+Good
V.Poor+Poor
Limiting Criterion:(< 10% in Poor Condition)

15
Table 3-2. Annual lane-miles (and expected cost) for flexible pavement resurfacing.
Region
Avg.
Asphalt
Life (yrs)
Avg. Asphalt
lane-miles/yr
Avg. Chip
Seal Life
(yrs)
Avg. Chip
Seal lane-
miles/yr
Northwest 17 176 7 8
North Central 11 108 6 224
Olympic 16 144 7 57
Southwest 17 113 7 55
South Central 11 133 7 99
Eastern 11 154 6 284
Total 828 727
$39,220,000
$249,510,000
Avg. $/yr
$62,250,000
$35,000,000
$48,630,000
$28,880,000
$35,530,000
Comparing the average scenario in Table 3-2 with historical funding for Roadway Preservation provides a startling contrast. As shown in Figure 3-2 below, average funding for the four biennia before 2000 was $220 million per year. However, significant and unsustainable cuts had to be made in the Roadway Preservation budget from 2000 - 2009. All dollar values in this figure are expressed in 2010 constant dollars (dollar amounts from other years are converted to 2010 dollars by using the WSDOT Construction Cost Index).
Figure 3-2. Washington State roadway preservation funding 1992 – 2017.
$0
$50,000,000
$100,000,000
$150,000,000
$200,000,000
$250,000,000
$300,000,000
1992 1994 1996 1998 2000 2002 2004 2006 2008 2010 2012 2014 2016
Fiscal Year
26-year Roadway Preservation Annual Funding (Constant 2010 Dollars)
average funding over 4 Biennia is $220 million per year
"Stimulus"(ARRA)
total expected funding reduction over 9 Biennia is $1.32 billion (average of $73 million per year)
total budget reduction over 5 Biennia is $595 million
Projected

16
Over the decade from 2000 – 2009, more than $.59 billion was removed from the previous level of funding. The “stimulus” funding available from the American Recovery and Reinvestment Act of 2009 (ARRA) provided crucial relief during the 2009 – 2011 Biennium. However, funding forecasts for future biennia are currently at a level roughly one-half of funding levels prior to 2000.
3.3 Managing to the Lowest Life-Cycle Cost
Life-Cycle Cost Analysis (LCCA) is a process where alternative investment strategies are compared on the basis of which strategy provides adequate performance at the lowest cost over the entire life-cycle of the investment. Each strategy considers not only the initial capital construction cost, but also maintenance, rehabilitation and user costs over the entire life-cycle period. The time value of money is taken into consideration by using a discount rate to convert future expenditures into equivalent present values. The State Materials Lab determined in the 1980s that the state’s road network should be managed by Lowest Life-Cycle Costs. This concept was then mandated by RCW 47.05.030 in the 1993 legislative session. WSDOT experience is that the lowest life-cycle cost is obtained by rehabilitating pavement structures when they are Due. WSDOT determined that this “due” date is an optimal timing window (a range of approximately one to three years) when an asphalt pavement can be rehabilitated at the lowest life-cycle cost. A pavement rehabilitated too soon will have wasted pavement life, while a pavement rehabilitated late will have higher associated repair and rehabilitation costs. History has shown that the condition indicators that “trigger” rehabilitation are usually the cracking and rutting indices (described in Section 3.1). This is because roughness tends to be a lagging indicator that appears later because the road was not rehabilitated when it was Due. The lowest cost network preservation strategy requires that a certain number of miles of pavement be rehabilitated each year on a continuing basis. The condition at which a pavement is rehabilitated is carefully analyzed by the Washington State Pavement Management System (WSPMS). Long-term analysis has shown that repairing a pavement structure before it reaches a condition of severe structural failure greatly reduces the life-cycle cost. Therefore, monitoring pavement performance is an important aspect of pavement management. The WSPMS has evolved over more than 40 years, and WSDOT’s experience over these decades has led to the pavement management process the agency uses today.
Economic Performance Indicators
The performance indices discussed above relate to the functional and structural performance of the pavement. The State Materials Lab has also recently developed performance indicators related to the economic performance of the pavement structure. The legislature specified, in their request for this document, that WSDOT shall “… encourage the most effective and efficient use of pavement preservation funds.” Economic performance indicators are important measures in determining how effectively and efficiently the road assets are being managed.

17
One such indicator is the Historical Annual Cost, which is defined as the discounted Equivalent Uniform Annual Cost (EUAC) of one or more pavement performance periods, expressed in terms of dollars per lane-mile per year. The Historical Annual Cost can be used to compare the long-term costs of one road segment versus another, and to determine the best management practices relative to efficient pavement management. The second indicator is the Equivalent Single Axle Load (ESAL) Efficiency Factor. The determination of ESAL volumes is important in characterizing the amount of truck traffic for a given roadway since pavements are designed primarily to carry the heavy axle loads from trucks. The ESAL Efficiency Factor is defined as the discounted EUAC of one or more pavement performance periods, divided by the number of ESALs over the same time period, expressed in terms of dollars per ESAL-mile. The ESAL Efficiency Factor relates to how efficiently the pavement is carrying truck loads. Roads that are under-designed will be very inefficient in carrying truck traffic, and require excessive and costly maintenance. These new economic performance indicators, the Historical Annual Cost, and the ESAL Efficiency Factor, are potential tools in monitoring how economically the state’s roadways are performing. They are currently being evaluated by the State Materials Lab, and it is anticipated that future reports will include these new performance measurements.
3.4 Pavement Type Selection
There are three primary areas that need to be addressed to select a pavement type: pavement design analysis, life-cycle cost analysis, and project specific details. Each of these areas can have a significant impact on the selected pavement type and requires a detailed analysis. The overall Pavement Type Selection Process is shown in Figure 3-3. The specific requirements for each step are explained in more detail in Appendix A. Pavement type selection is applicable to all new alignment, ramps, collector-distributors, acceleration-deceleration lanes, and existing pavement reconstruction on interstate, principal arterials, and any other roadway that may benefit from this analysis. Pavement type selection is not necessary for chip sealed (BST) roadways. For mainline widening, if the selected pavement type is the same pavement type as the existing, then a pavement type selection is not required. When comparing life-cycle costs of the different alternatives, the comparison must be based on the total of all costs through the pavement life-cycle, which include initial construction, maintenance, rehabilitation, and user delay costs. Following completion of a LCCA, pavement type alternatives shall be considered equivalent if the total costs (including user costs) do not differ by more than 15 percent.
Application of Pavement Type Selection
The following is a list of considerations for new construction or reconstruction of mainline, ramps, collector-distributors, acceleration-deceleration lanes, and intersections.
– Mainline new and reconstructed. A pavement type selection must be completed on all mainline pavements that are more than ½ lane mile in length or more than $0.5 million,

18
except those highways designated as having a chip seal surface. Decisions on whether to run a pavement type selection process for roadway segments shorter in length or lower in cost are made on a case-by-case basis.
– Ramps. Both concrete and asphalt should be considered for ramps with mature geometrics (where lane configuration or right of way restricts the expansion of the roadway footprint), high traffic and high truck percentages.
– Collector-Distributors. Collector-distributors should be designed similar to ramps above.
– Acceleration-Deceleration Lanes. Treat the same as collector-distributors. – Intersections. Most intersections will not require an analysis separate from the rest of the
highway. However, intersections with chronic rutting should be examined in detail to determine the nature and cause of the rutting and whether alternate pavement types should be considered.
Submittal Process
The pavement type selection, including all applicable subsections (pavement design analysis, cost estimate and life-cycle cost analysis including the results of the RealCost evaluation [RealCost is LCCA software developed for and maintained by the FHWA], all applicable RealCost input files and project specific details) are submitted electronically to the Pavement Design Engineer at the State Materials Laboratory Pavements Division. The pavement type selection analysis is reviewed and distributed to the Pavement Type Selection Committee for approval. The Pavement Type Selection Committee consists of:
- Chief Engineer - State Materials Engineer - State Design Engineer - Director, Capital Program Development - Regional Administrator
The report submittal includes a detailed explanation of the various applicable items, as outlined above, that support the selection of the recommended pavement type.

19
Step 1.Pavement design
analysis
Expected long-term settlement > 2 inches
Selected pavement
type is HMA
Step 2.Life cycle cost
analysis
Is the LCCA between alternatives > 15 percent?
Lower cost alternative is selected
Step 3.Project Specific
Details
Is there a preferred alternative?
Preferred alternative is selected
Lowest cost alternative is selected
Step 4.Submit pavement type
selection to the Pavement Type Selection Committee
yes
no
yes
no
yes
no
Figure 3-3. Pavement type selection flow chart
20
3.5 Pavement Rehabilitation Backlog
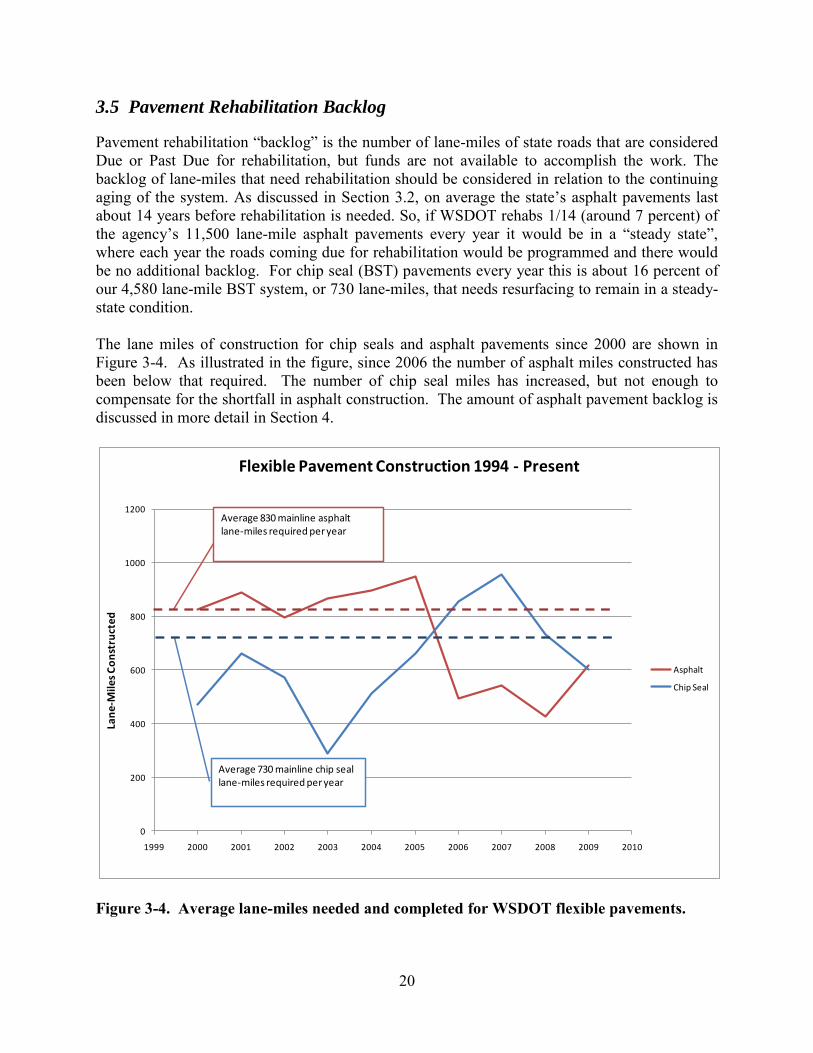
Pavement rehabilitation “backlog” is the number of lane-miles of state roads that are considered Due or Past Due for rehabilitation, but funds are not available to accomplish the work. The backlog of lane-miles that need rehabilitation should be considered in relation to the continuing aging of the system. As discussed in Section 3.2, on average the state’s asphalt pavements last about 14 years before rehabilitation is needed. So, if WSDOT rehabs 1/14 (around 7 percent) of the agency’s 11,500 lane-mile asphalt pavements every year it would be in a “steady state”, where each year the roads coming due for rehabilitation would be programmed and there would be no additional backlog. For chip seal (BST) pavements every year this is about 16 percent of our 4,580 lane-mile BST system, or 730 lane-miles, that needs resurfacing to remain in a steady-state condition. The lane miles of construction for chip seals and asphalt pavements since 2000 are shown in Figure 3-4. As illustrated in the figure, since 2006 the number of asphalt miles constructed has been below that required. The number of chip seal miles has increased, but not enough to compensate for the shortfall in asphalt construction. The amount of asphalt pavement backlog is discussed in more detail in Section 4.
Figure 3-4. Average lane-miles needed and completed for WSDOT flexible pavements.
0
200
400
600
800
1000
1200
1999 2000 2001 2002 2003 2004 2005 2006 2007 2008 2009 2010
Lan
e-M
iles
Co
nst
ruct
ed
Flexible Pavement Construction 1994 - Present
Asphalt
Chip Seal
Average 830 mainline asphalt lane-miles required per year
Average 730 mainline chip seal lane-miles required per year

21
The concrete pavement rehabilitation backlog is more difficult to estimate, because of the uneven age of these pavements. About 60 percent of our 2,500 lane-miles of concrete pavements are currently over 30 years old, while the design life of these older pavements is only 20 years. The strategies used to manage backlogs for chip seal, asphalt, and concrete pavements are discussed below.
Chip Seal (BST) Pavements
Chip seals are low cost pavement structures that are appropriate for low-volume roads (previously used in Washington on roadways under 2,000 vehicles per day, but now expanded to all roadways carrying less than 5,000 vehicles per day). They are also used on higher volume roads to extend the pavement life before a major resurfacing is needed (see Preventive Strategies in Section 3.6). Because these pavements are so cost effective, they receive the highest priority when programming the pavement preservation funds. Due to this approach, we do not expect to experience a backlog of chip seal lane-miles.
Asphalt Pavements
The strategy for asphalt pavements, which make up 62 percent of WSDOT’s road network, is to use innovative practices wherever possible to stretch the pavement life. These techniques are described in more detail in the section on Preventive Strategies below. Even with the implementation of these techniques, there is an increasing backlog of needs for asphalt pavement resurfacing. The backlog is expected to grow in the next several years, as the miles programmed for resurfacing are not enough to keep up with the increasing lane miles of pavement due for rehabilitation. The change in backlog each year is calculated by taking the Due miles in a given year, and subtracting the “Programmed” miles for the same year. A small decrease in the backlog occurred in the 2009-11 Biennium due to the effects of the ARRA stimulus, but this effect is temporary. Although the 2011-13 Biennium preservation program has not yet been determined, the current budget shortfall will not be able to address current asphalt needs and the backlog will continue to grow.
Concrete Pavements
The 2,500 miles of concrete pavement in Washington State (13 percent of the state system) has been a high performance “workhorse”, especially for our high-traffic corridors. Over 700 miles (30 percent) have survived more than 45 years with little or no maintenance, while being originally designed for a 20-year life. With long pavement lives, the concrete pavements have low life-cycle costs, but they have high initial construction costs. Newly constructed concrete pavements are now designed for 50 years, but the initial construction cost of $2,500,000 per lane mile leads to an emphasis on preserving the life of existing pavements. This strategy involves the use of:
– Surface grinding – to smooth ruts and rough locations, especially at cracks and joints. – Dowel bar retrofit (DBR) – to retrofit dowel bars at joints in order to provide better
structure and extend the pavement life another 15 years.

22
– Selective panel replacement – to replace only the worst slabs, and leave the sound slabs for more years of service.
Even though these techniques extend the pavement life as much as possible, they still require funds to do the work. Considering the age of the concrete pavement network, the need for more and more maintenance and rehabilitation, in addition to reconstruction where it is necessary, creates a significant funding need for the future. The anticipated funding need is approximately $900 million over the next 10 years for the concrete pavement network. The methods of evaluating and planning for these aging concrete pavements are discussed further in Section 5 of this report, and Appendix B.
3.6 Preventive Strategies: Extending Life and Reducing Costs
Current budget constraints in Washington State necessitate the use of new strategies with regard to preventive measures to extend pavement life. Even if the optimum long-term rehabilitation plan for a particular section of roadway calls for a capital construction rehabilitation project, there may not be funds available to complete the construction. This situation has resulted in the development of preventive strategies for the purpose of delaying or avoiding capital construction spending. In these strategies, preservation funds are being specifically allocated for preventive measures. Preventive Activities to Address Early Distress. In this situation, premature distress may be occurring relatively early in the performance period. This may be due to construction problems, reflection cracking, or some other factors, but if those premature distresses are not addressed, then an early rehabilitation may be required which will substantially increase the life-cycle costs. It has been recognized that applying preventive treatments early in a performance period is far more effective than applying it to a pavement in poor condition. Strategies that are Correcting Short Distressed Sections. This strategy involves using preventive measures to repair distresses in short (less than 0.5 mile) sections which may be causing longer sections of roadway to be programmed for rehabilitation. In this case, the analysis is not simply project oriented (regarding one pavement section), because the evaluation is being done for a number of adjacent pavement sections. Maintaining Sections That Are Currently Due. As discussed above, sometimes a section may be due for rehabilitation, but no funds are available. In this case maintenance is performed as an effort to hold the pavement together until the rehabilitation can be performed, and may prevent further damage that could lead to reconstruction. It is recognized that this is not an efficient or effective long-term use for funds, but it is sometimes necessary for short-term situations. Integrating Preventive Activities with Rehabilitation Strategies. One strategy employed by WSDOT to delay the effect of the growing backlog of asphalt pavement rehabilitation has been to use chip seals (BST) for lower-volume roadways. The chip seals cost less, but do not last as long as asphalt rehabilitations. By resurfacing lower-volume asphalt pavements with chip seals, WSDOT has added five to seven more years to its life for one-third to one-fourth the equivalent

23
annual cost ($5,000 vs. $15,000-$20,000 per lane mile per year). About 40 percent of WSDOT asphalt roads are “lower volume” (average daily traffic of 5,000 or less). Eventually an asphalt rehabilitation may be necessary for structural reasons, but this chip seal strategy stretches the funds available for pavement preservation over more road miles, allowing for the use of scarce capital funds for locations that have higher priority.
Evaluating Future Risk: Good Roads Cost Less
Although the current condition of Washington State pavements is good, the looming backlog of rehabilitation and reconstruction needs for asphalt and concrete pavements provides a significant future risk for the state’s roadways. As pavement condition deteriorates, it causes more damage to the underlying pavement structure. That is why pavement conditions are carefully monitored and rehabilitations are scheduled when the lowest life-cycle cost can be realized. If needed repairs are deferred too long, then the costs to rebuild the pavement structure are much higher, and the opportunity to capture the lowest life-cycle cost is lost. These higher costs then result in fewer miles being rehabilitated, causing more pavements to deteriorate, resulting in a downward spiral of decreasing road quality and increasing pavement costs. It is absolutely true that “good roads cost less”.
3.7 Maintaining Quality with Reduced Funding
The ability to maintain the good performance level with reduced funding comes from using innovative techniques and picking the best investment alternatives wherever possible. Keeping pavement condition at a high performance level, and preserving the road investment, is far more economical than waiting until the pavement undergoes serious damage (when much more investment will be required to rebuild the pavement to a desired standard). In short, it has been proven that “good roads cost less”. In 2008 a national research report prepared for AASHTO (2) named WSDOT as one of five “top performing states” with regard to smoothness of Interstate Highways. There were five agency practices that were identified for the top performing states. They were:
1) strong performance management orientation 2) use of end-result pavement construction specifications with incentive bonuses 3) building close working relationships with paving contractors 4) integrating customer input 5) pavement management.
WSDOT has been able to maintain the high level of road quality desired by the people of the state through careful management strategies, evaluation of alternative pavement investments, and the exploitation of technology. Some of the management strategies, such as life-cycle cost evaluation, use of BSTs to extend service life, and the triage approach to concrete pavement preservation were discussed above. The WSDOT Materials Lab is considered a national leader when it comes to implementing new and innovative technology. Some examples of this are:
Dowel bar Retrofit. Installing dowel bars in aging concrete pavements to improve load transfer and extend the life of the pavement.

24
Pavement Recycling. Reclaiming asphalt from older, failed pavements and blending the reclaimed asphalt into the new asphalt mix.
Warm-Mix Asphalt. Using chemical additives in the asphalt mix which allows construction at lower temperatures, resulting in lower emissions and improved construction.
Implementation of Performance Graded Binders. Use of asphalt binders that have been specially engineered for different traffic and climate conditions.
Infared Thermography for Asphalt Paving. Use of infrared cameras to monitor asphalt mix placement to provide uniform placement of asphalt thus increasing pavement life.
Hot In-Place and Cold In-Place Recycling. Reprocessing the existing asphalt surface using hot or cold in place construction practices to conserve natural resources.
These innovations not only reduce costs and provide better road performance, they also reduce the environmental impact of our road system and contribute to the long-term sustainability of the natural resources we use. The use of the state’s pavement management system (WSPMS) provides a framework for evaluating and continually monitoring the performance of our roadway investments. In 2008 the FHWA published a Transportation Asset Management Case Study: “Pavement Management Systems – The Washington State Experience” (3). In this publication the FHWA states that the WSPMS “can serve as a model for other States.” WSDOT will continue to implement the best strategies possible for the preservation of the road network. It is important to realize, however, that continued under-funding will generate large backlogs of rehabilitation projects which eventually will reduce the quality of the road system and lead to excessive long-term costs.
3.8 References for Section 3
1. State Highway Log – Planning Report 2009, WSDOT Strategic Planning Division. 2. Comparative Performance Measurement: Pavement Smoothness 2008, AASHTO
Publication CPM-1, Washington, DC, 2008. 3. Pavement Management Systems: The Washington State Experience, FHWA Publication
IF-08-010, Washington, DC, 2008.

25
Executive Summary for Section 4. Strategies for Managing the Backlog of
Pavement Needs
With a mainline road network of 18,500 lane-miles, every year a certain number of those lane-miles will require rehabilitation, or possibly reconstruction. If those needs are not addressed during the year the pavement section is Due, then a backlog of required construction begins to develop.
WSDOT has about 2,400 lane-miles of mainline concrete pavements. These pavements have far exceeded their original design lives and have carried several times the traffic loading originally anticipated. The use of Dowel Bar Retrofit has resulted in $220 million of accumulated savings since being implemented in 1993. Chip Seals (Bituminous Surface Treatments) currently make up approximately 4,580 lane-miles (25 percent) of the WSDOT system. WSDOT typically recommends chip seals for traffic levels less than 5,000 vehicles per day. The ratio of relative cost to relative performance for a chip seal over an asphalt pavement is roughly a factor of three. For this reason, chip seals will have high priority for programming and a backlog of chip seal lane-miles is not expected. This section analyzes three different scenarios for investigating the backlog of asphalt pavement rehabilitation:
- 1) Funding to eliminate the backlog in 10 years. The number of lane-miles of asphalt resurfacing in each of the next 10 years is determined, with the associated cost, in order to reduce the asphalt backlog to zero at the end of 10 years. This scenario takes into consideration the conversion of 2,300 asphalt lane-miles to chip seal lane-miles over the next 15 years. The total amount of funding over 10 years to achieve the objective of eliminating the asphalt pavement backlog is $ 2.00 billion, or $200.4 million per year. This total is $1.079 billion more than is currently budgeted over the next five biennia.
- 2) Funding to maintain the current backlog for 10 years. The backlog of asphalt pavement rehabilitation (at the end of the 11-13 Biennium) is expected to be approximately 1,360 lane-miles. This scenario determines the funding needed to maintain the status quo and not allow the backlog to grow over the next 10 years. A budget of $1.76 billion would be required for flexible pavements (asphalt and chip seal) to maintain the status quo, or $ 176 million per year. This is $ 834 million more than is currently budgeted for the 10 year period.
- 3) Maintain current projected budgets and allow backlog to grow for 10 years. The projected budgets will provide for a certain number of lane-miles each year. The difference between the need, and the available funding, will continue to grow the backlog over the next 10 years.

26
This is slightly less than half of the funding required to maintain a status quo performance - no increase in backlog (Scenario 2 was $1.76 billion over the same time period). Instead, the lack of funding resulted in an estimated backlog of 4,420 asphalt lane-miles at the end of 10 years.
4. STRATEGIES FOR MANAGING THE BACKLOG OF PAVEMENT NEEDS
With a mainline road network of 18,500 lane-miles, every year a certain number of those lane-miles will require rehabilitation, or possibly reconstruction. If those needs are not addressed during the year the pavement section is Due, then a backlog of required construction begins to develop. How this backlog is managed, particularly in times of reduced budgets, is critically important. This section of the report will discuss WSDOT’s strategies for managing pavement backlog for the three main pavement types.
4.1 Concrete Pavement
WSDOT has about 2,400 lane-miles of concrete pavements. The majority of these pavements were constructed during the late 1950s and 1960s as part of the interstate highway construction program. At that time, the pavement design life for these roadways was estimated to be about 20 years. These pavements have far exceeded their original design lives and have carried several times the traffic loading originally anticipated. The methods of handling these aging concrete pavements are discussed further in Section 5 of this report, and Appendix B.
Figure 4-1. Age of WSDOT concrete pavement lane-miles in 2010
0
50
100
150
200
250
300
350
400
450
0 5 10 15 20 25 30 35 40 45 50 55 60 65 70 75 80 85
Lan
e m
iles
Age (years since original construction or reconstruction)

27
In light of the rising cost of construction materials and budget constraints, many proposed concrete pavement projects were underfunded and either had to be reduced in scope, delayed or completed using temporary alternatives (such as asphalt overlays) which are not economically efficient in the long term. The amount of funding applied to PCC pavements has been minimal given the needs. The average annual budget for concrete pavement was $15 million per year (in 2010 constant dollars) for the 18-year period 1991 through 2008. This represents only 7.8 percent of the total preservation spending during that period, even though 28 percent of the total state vehicle miles traveled (VMT) is on concrete pavement. One important rehabilitation method that significantly improved the longevity of the state’s concrete pavements was the use of dowel bar retrofit (DBR). As mentioned in Section 3.5, DBR is used to establish load transfer at joints for concrete pavements that were built prior to 1995 (which were originally constructed without dowel bars). This procedure extends the pavement life approximately 15 years, where the alternative would be an expensive reconstruction project. Since 1993, WSDOT has constructed about 290 lane-miles of DBR rehabilitation. Because of the substantial cost savings of DBR ($.7 million per lane-mile) versus reconstruction ($2.5 million per lane-mile), it is estimated that the use of this procedure has resulted in $220 million of accumulated savings (2010 dollars). These savings in capital expenditures were then used to fund needs in asphalt and chip seal pavements. The lack of funding for concrete pavements was temporarily aided with the help of American Recovery and Reinvestment Act (ARRA) stimulus funds, as $103 million was programmed for concrete pavements for the 2009-2011 biennium. WSDOT still faces a very large backlog of concrete pavement rehabilitation and reconstruction needs throughout the state, most of which are critically important interstate system pavements. WSDOT will need to significantly increase the preservation funding for concrete pavements in order to maintain the road network in good condition. A short term 2-year plan (for the 2011-2013 Biennium), and a long term 10-year plan have been developed to address the backlog of rehabilitation and reconstruction needs for concrete pavements. This plan is summarized in Section 5 of this report, and discussed in detail in Appendix B.
4.2 Chip Seal (BST) Pavements
Chip seals (Bituminous Surface Treatments) currently make up approximately 4,580 lane-miles (25 percent) of the WSDOT system. As stated in Section 3, historically the life of a typical chip seal is 6-7 years. So, under average circumstances 16 percent of the network can be expected to require resurfacing on an annual basis, approximately 730 lane-miles per year. The construction cost of an asphalt resurfacing is roughly 5 to 7 times the cost of a chip seal, so there is a strong economic incentive to maximize the use of chip seals when budgets are tight. Asphalt pavements will last 1.5 to 2.5 times the life of a chip seal, so the ratio of relative cost to relative performance for a chip seal over an asphalt pavement is roughly a factor of 3. Because they have a rougher surface texture, are noisier, and could lead to chipped windshields

28
during construction, chip seals are usually selected for lower volume roadways. WSDOT has studied this issue, and typically recommends chip seals for traffic levels less than 5,000 vehicles per day. For this reason, chip seals will have high priority for programming and a backlog of chip seal lane-miles is not expected. This approach serves to minimize the expense of the flexible pavement network, and provide the lowest possible life-cycle cost. For locations inside city limits, and at intersections where there is a high volume of turning movements, asphalt is preferred over chip seals because of the smoother and longer lasting surface. Because of the economic advantage of chip seal surfacing, an evaluation was performed of existing asphalt pavements to determine which may be candidates to convert to a chip seal surface. To be a candidate for conversion, the following conditions would need to be met:
1) Existing asphalt pavement with traffic volume less than 5,000 vehicles per day (both directions). (Approximately 31 percent of statewide asphalt roads, or 3,610 lane-miles are initially candidates.)
2) Road should not be in city limits or built-up area. (Assumed to be 10 percent of candidates.)
3) Road needs to be structurally sound for immediate traffic needs. A chip seal provides a new pavement surface, but does not add structure; therefore, an under-designed or heavily distressed asphalt would need to be rehabilitated with asphalt before it could be converted in the future to a chip seal pavement.
4) No special conditions exist (e.g., heavy truck traffic, previous problems with chip seal performance, etc.). (Assumed that 15 percent of candidates may have special conditions and not be viable for conversion.)
Based upon the above criteria, approximately 2,300 lane-miles of asphalt pavement would be expected to eventually be converted to chip seal surfaces. This would occur over time, when each candidate asphalt pavement section reached the optimum time for conversion. After 15 years, it could be assumed that all of the 2,300 lane-miles would be converted. Figure 4-2 shows the expected rate of asphalt to chip seal conversion. After 15 years, this asphalt to chip seal conversion process results in a 50 percent increase in the total lane-miles of chip seal pavements in the state (from 4,580 lane-miles today to 6,880 lane-miles). Because of this 50 percent increase in the size of the BST network, the average number of lane-miles for resurfacing will increase from 730 lane-miles to 980 lane-miles (including the asphalt to chip seal conversions).

29
Figure 4-2. Proposed asphalt lane-miles converted to chip seal over time. Based on the current age of chip seal pavements in the state, and the planned conversion of asphalt to chip seal over the next 15 years, a comprehensive plan for chip seal construction can be developed. This plan is illustrated below in Figure 4-3, showing the number of statewide chip seal miles due for resurfacing each year. As stated earlier, because chip seal surfaces provide the best (per lane-mile) economics, it is expected that chip seals will receive top funding priority and that a backlog will not develop for chip seal lane-miles.
0
500
1000
1500
2000
2500
2010 2012 2014 2016 2018 2020 2022 2024 2026
Lan
e-M
ile
s
Year
Total Asphalt Lane-Miles Converted to Chip-Seal

30
Figure 4-3. Statewide chip seal resurfacing needs for next 10 years. Note that the average lane-miles per year of chip seal resurfacing has increased from the 730 lane-miles mentioned at the beginning of this section, to the 980 lane-miles per year shown in Fig. 4-3. This conversion of 2,300 lane-miles from asphalt to chip seal surface will result in an annual savings of $29 million to the preservation program. While these estimated savings show the potential annual benefit (after 15 years) from converting asphalt surfaces to chip seals, some of these pavements may deteriorate and require future asphalt overlays. Additionally, roadways with traffic growth may require a more substantial pavement structure. The number of roadways requiring asphalt overlays and the cost for this future work is unknown, but will be carefully monitored in future pavement preservation plans.
4.3 Asphalt Pavements
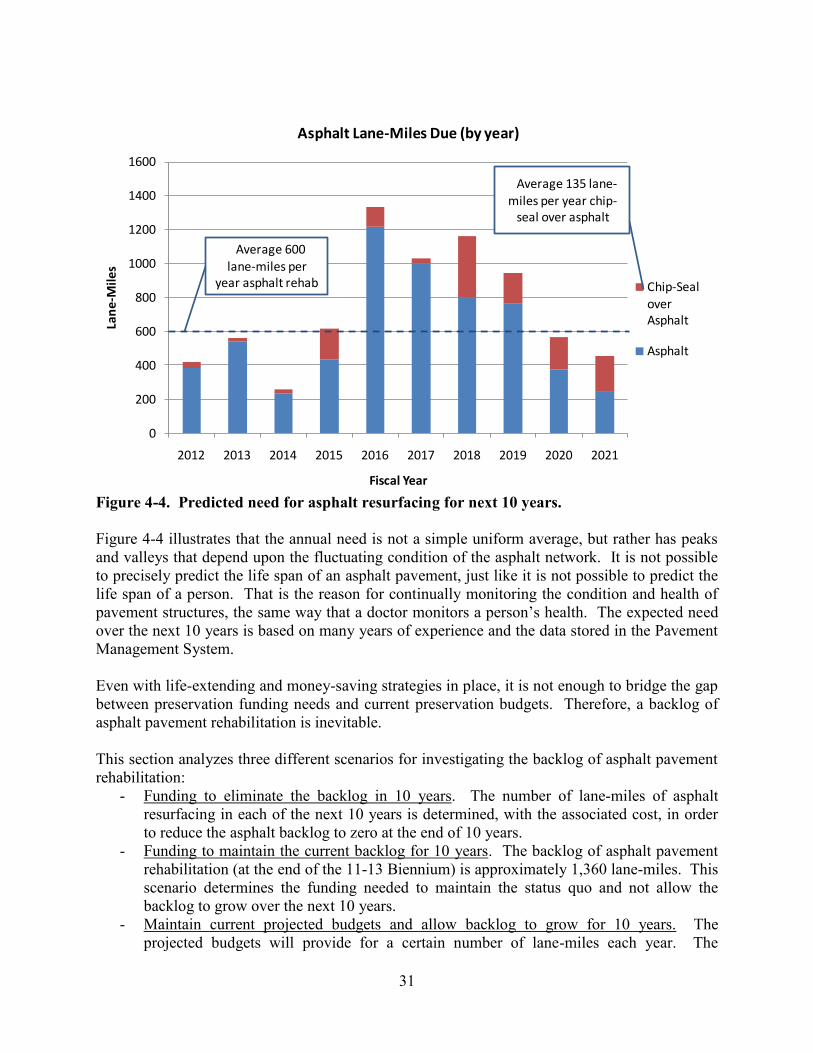
Different strategies for stretching pavement life and reducing life-cycle cost were discussed in Sections 3.6 (Preventive Strategies: Extending Life and Reducing Costs) and 3.7. (Maintaining Quality with Reduced Funding). In Section 4.2 (above), the use of chip seals to reduce the annual lane-miles of asphalt rehabilitation was presented. The expected future need for asphalt rehabilitation is shown below in Figure 4-4. The significant reduction in asphalt lane-miles due to chip seal conversion is also noted in the figure.
0
200
400
600
800
1000
1200
1400
2012 2013 2014 2015 2016 2017 2018 2019 2020 2021
Lan
e-M
ile
s
Fiscal Year
Chip Seal Lane-Miles Due (by year)
Average 980 lane-miles per
year chip-seal construction
31
Figure 4-4. Predicted need for asphalt resurfacing for next 10 years. Figure 4-4 illustrates that the annual need is not a simple uniform average, but rather has peaks and valleys that depend upon the fluctuating condition of the asphalt network. It is not possible to precisely predict the life span of an asphalt pavement, just like it is not possible to predict the life span of a person. That is the reason for continually monitoring the condition and health of pavement structures, the same way that a doctor monitors a person’s health. The expected need over the next 10 years is based on many years of experience and the data stored in the Pavement Management System. Even with life-extending and money-saving strategies in place, it is not enough to bridge the gap between preservation funding needs and current preservation budgets. Therefore, a backlog of asphalt pavement rehabilitation is inevitable. This section analyzes three different scenarios for investigating the backlog of asphalt pavement rehabilitation:
- Funding to eliminate the backlog in 10 years. The number of lane-miles of asphalt resurfacing in each of the next 10 years is determined, with the associated cost, in order to reduce the asphalt backlog to zero at the end of 10 years.
- Funding to maintain the current backlog for 10 years. The backlog of asphalt pavement rehabilitation (at the end of the 11-13 Biennium) is approximately 1,360 lane-miles. This scenario determines the funding needed to maintain the status quo and not allow the backlog to grow over the next 10 years.
- Maintain current projected budgets and allow backlog to grow for 10 years. The projected budgets will provide for a certain number of lane-miles each year. The
0
200
400
600
800
1000
1200
1400
1600
2012 2013 2014 2015 2016 2017 2018 2019 2020 2021
Lan
e-M
ile
s
Fiscal Year
Asphalt Lane-Miles Due (by year)
Chip-Seal
over Asphalt
Asphalt
AAverage 600 lane-miles per
year asphalt rehab
AAverage 135 lane-miles per year chip-
seal over asphalt

32
difference between the need, and the available funding, will continue to grow the backlog over the next 10 years.
All three scenarios contain two important assumptions: - They assume that the 11-13 Biennium has funding of $289 million for flexible pavements
($200 million for asphalt and $89 million for chip seal). This results in an asphalt backlog of 1,359 lane-miles at the end of the 11-13 Biennium.
- They all assume the same fixed funding for future biennia for chip seals. This follows the strategy described in this report of making chip seal projects a top priority for funding in each biennium.
Scenario 1: Eliminate Backlog in 10 Years
This scenario considers the funding required to eliminate the asphalt pavement backlog in 10 years. The numbers related to chip seal (BST) cost, asphalt cost, and lane-miles of backlog are shown in Table 4-1 below. These values are also illustrated in Figure 4-5. Table 4-1. Funding required to eliminate asphalt backlog in 10 years.
Biennium 11-13 13-15 15-17 17-19 19-21 10-Yr Total
BST Cost ($million) $89 $81 $63 $69 $95 $398
Asphalt Cost ($million) $200 $250 $331 $413 $413 $1,606
Total ($million) $289 $331 $395 $482 $507 $2,004
Current Asphalt and BST Budget $289 $121 $173 $177 $165 $925
Difference ($million) $0 -$210 -$222 -$305 -$342 -$1,079
Asphalt Backlog (lane-miles) 1359 367 237 437 5

33
Figure 4-5. Scenario 1: Funding required to eliminate backlog in 10 years. As noted in Table 4-1, the total amount of funding over 10 years to achieve the objective of eliminating the asphalt pavement backlog is $2.0 billion, or $200.4 million per year. This total is $1.079 billion more than is currently budgeted over the next five biennia. The funding requirements rise sharply later in the decade, following the increase in Due Years shown in Figure 4-4.
Scenario 2: Maintain Same Backlog Over 10 Years
The funding required to maintain an asphalt backlog of 1,359 lane-miles over 10 years is addressed in Scenario 2. Table 4-2 and Figure 4-6 provide the detailed results. Over this period of time, a budget of $1.76 billion would be required for flexible pavements (asphalt and chip seal), or $176 million per year. This is $834 million more than is currently budgeted for the 10-year period.
0
500
1000
1500
2000
2500
3000
3500
4000
4500
5000
$0
$100
$200
$300
$400
$500
$600
11-13 13-15 15-17 17-19 19-21
Lan
e-M
iles
Bie
nn
ium
Co
st (
$ m
illi
on
)Scenario 1: Eliminate Backlog in 10 Years
Chip Seal Cost
Asphalt Cost
Asphalt Backlog (lane-miles)

34
Table 4-2. Funding required to maintain same backlog over 10 years.
Biennium 11-13 13-15 15-17 17-19 19-21 10-Yr Total
BST Cost ($million) $89 $81 $63 $69 $95 $398
Asphalt Cost ($million) $200 $108 $297 $378 $378 $1,361
Total ($million) $289 $189 $360 $447 $473 $1,759
Current Asphalt and BST Budget $289 $121 $173 $177 $165 $925
Difference ($million) $0 -$68 -$187 -$270 -$308 -$834
Asphalt Backlog (lane-miles) 1359 967 1062 1512 1330
Figure 4-6. Scenario 2: Funding to maintain same backlog over 10 years.
Scenario 3: Use Current Budget for 10 Years
This scenario evaluates the existing budget for P1 paving over the next five biennia. Assuming that the existing budget will not change, the effect of this scenario is presented in Table 4-3 and Figure 4-7 below.
0
500
1000
1500
2000
2500
3000
3500
4000
4500
5000
$0
$100
$200
$300
$400
$500
$600
$700
11-13 13-15 15-17 17-19 19-21
Lan
e-M
iles
Bie
nn
ium
Co
st (
$ m
illi
on
)
Scenario 2: Same Backlog in 10 Years
Chip Seal Cost
Asphalt Cost
Asphalt Backlog (lane-miles)
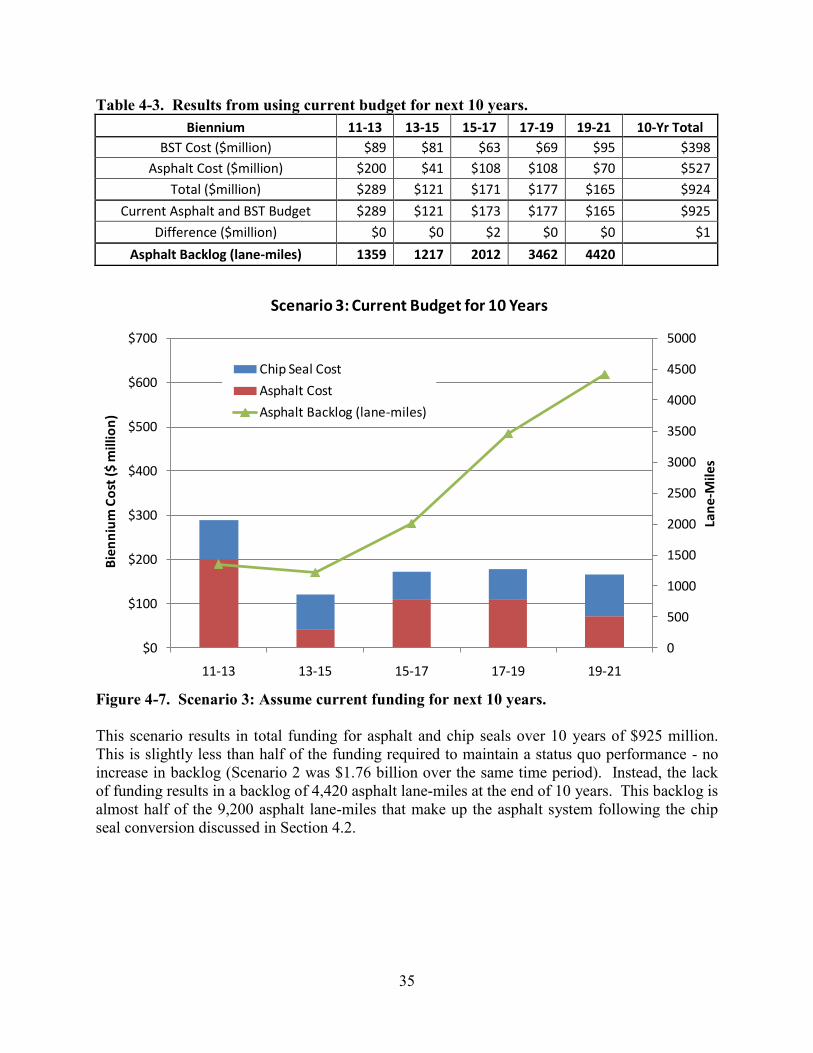
35
Table 4-3. Results from using current budget for next 10 years. Biennium 11-13 13-15 15-17 17-19 19-21 10-Yr Total
BST Cost ($million) $89 $81 $63 $69 $95 $398
Asphalt Cost ($million) $200 $41 $108 $108 $70 $527
Total ($million) $289 $121 $171 $177 $165 $924
Current Asphalt and BST Budget $289 $121 $173 $177 $165 $925
Difference ($million) $0 $0 $2 $0 $0 $1
Asphalt Backlog (lane-miles) 1359 1217 2012 3462 4420
Figure 4-7. Scenario 3: Assume current funding for next 10 years. This scenario results in total funding for asphalt and chip seals over 10 years of $925 million. This is slightly less than half of the funding required to maintain a status quo performance - no increase in backlog (Scenario 2 was $1.76 billion over the same time period). Instead, the lack of funding results in a backlog of 4,420 asphalt lane-miles at the end of 10 years. This backlog is almost half of the 9,200 asphalt lane-miles that make up the asphalt system following the chip seal conversion discussed in Section 4.2.
0
500
1000
1500
2000
2500
3000
3500
4000
4500
5000
$0
$100
$200
$300
$400
$500
$600
$700
11-13 13-15 15-17 17-19 19-21
Lan
e-M
ile
s
Bie
nn
ium
Co
st ($
mill
ion
)
Scenario 3: Current Budget for 10 Years
Chip Seal Cost
Asphalt Cost
Asphalt Backlog (lane-miles)

36
Executive Summary for Section 5. Summary of 10-year Concrete Plan
An evaluation of future needs was performed for WSDOT’s concrete pavements. This evaluation was developed in two parts: one for near term (2011 – 2013 Biennium), and one for long term (10 years, FY 2012 – 2021). Strategies to repair poorly performing concrete pavements fall into two categories: rehabilitation and reconstruction. Rehabilitations are temporary methods to preserve the existing pavement and extend the remaining service life. They can typically extend the pavement life 10 to 20 years, and consist of surface grinding, dowel bar retrofit (DBR), and asphalt overlay. Reconstruction will create a new structure that will have 50 – 60 years of expected pavement life. WSDOT is faced with a growing backlog of concrete pavement rehabilitation and reconstruction needs. With limited funds it is necessary to develop priorities for pavement preservation spending. The following priorities have been developed with regard to concrete pavement preservation:
High Risk that Requires Reconstruction. This situation relates to a pavement in very poor condition (PSC < 25), with the very real risk that severe cracking followed by rapid roadway failure could develop. When this occurs, all long-term options are very expensive, and the travelling public and commerce are adversely affected. The only alternative to reconstruction is a temporary asphalt overlay.
DBR and/or Grinding to Postpone Reconstruction. The importance of this priority is to intercept the pavement condition before it reaches the point of reconstruction, and achieve another 10 to 20 years of pavement life before reconstruction. DBR and/or Grinding are accomplished at a fraction of the capital cost of reconstruction.
Grinding. Grinding is a very economical method of improving the surface of a concrete pavement. Priority is given to projects that can achieve another 10 to 15 years of pavement life at a relatively low cost.
5. SUMMARY OF 10-YEAR CONCRETE PAVEMENT PLAN
An evaluation of future needs was performed for WSDOT’s concrete pavements. This evaluation was developed in two parts: one for near term (2011 – 2013 Biennium), and one for long term (10 years, FY 2012 – 2021). This section includes a summary of the evaluation procedure and results. The details are documented in Appendix B.
5.1 Concrete Pavement
Strategies to repair poorly performing concrete pavements fall into two categories: rehabilitation and reconstruction. Rehabilitations are temporary methods to preserve the existing pavement and extend the remaining service life. They can typically extend the pavement life 10 to 20 years, and consist of surface grinding, dowel bar retrofit, and asphalt overlay. Reconstruction involves the removal of the existing concrete and pavement reconstruction, sometimes including

37
increasing the thickness and improving the pavement base. Reconstruction will create a new structure that will have 50 – 60 years of expected pavement life.
Grinding
New concrete pavements in Washington State are built with dowel bars for good load transfer at the joints. These pavements should last for 20 years with no need for maintenance beyond joint sealing or minor patching. Because Washington is one of a few states that still allow the use of studded tires, some of the need for early rehabilitation will be due to the damaging effect of the tire studs. The studs wear against the concrete, causing spalling of the surface and ruts in the wheelpaths. Once the ruts in the wheelpath exceed a certain trigger point, the concrete pavement is considered Due for diamond grinding. This grinding should restore good pavement performance for another 10 to 15 years. One or possibly two grindings can be performed before the structure of the concrete pavement is negatively affected. Another operation included with diamond grinding is panel replacement. Slab replacement on concrete roadways includes removing and replacing in-kind individual or series of cracked or settled concrete pavement panels. The amount of slab replacement typically ranges from 2 percent to 5 percent of the total panels.
Dowel Bar Retrofit (DBR)
Concrete pavements that were constructed prior to 1994 in Washington State were built without dowel bars at the joints. These undoweled pavements are subject to “faulting” (the small drop in elevation at the joints that is noticeable by the driver). Not all undoweled pavements will develop faulting, but the State Materials Lab monitors the amount of joint faulting on each state route with the annual pavement condition survey. If the faulting is slight to moderate it can often be temporarily removed by diamond grinding. If the faulting is in the severe category, it requires another rehabilitation alternative called dowel bar retrofit (DBR), which installs dowel bars at the joints and has been very successful at establishing load transfer and increasing the pavement life another 15 years or so. When grinding or DBR are performed, there are usually a small number of slabs (2 percent - 5 percent) that will be cracked and will need replacement. Once the amount of individual slab replacement exceeds 10 percent - 15 percent, then economically it becomes less expensive to do total reconstruction since the unit costs of small repairs are much higher than the economies achieved with reconstruction.
Reconstruction
Concrete pavements in Washington State should last 30 – 50 years before substantial cracking develops. Advanced cracking cannot be repaired by grinding or DBR. If cracking develops in isolated areas, then panels can be replaced, but if the surrounding pavement is over 50 years old, then it will just be a matter of time before more cracking develops to the point that total reconstruction is required. The planning for total reconstruction is important because as the

38
pavement structure deteriorates the potential increases for catastrophic (sudden and total) failure. When this happens, road closures and expensive emergency construction will cause serious problems for WSDOT and the public. Under certain conditions, it is not practical to perform grinding or DBR, yet the pavement does not need total reconstruction. In these circumstances a temporary asphalt overlay may be used to add another 10 to 15 years of pavement life until reconstruction is needed, or the asphalt requires rehabilitation.
5.2 Concrete Pavement Evaluation Process
Based on the all-lane survey data on all State concrete pavements in 2009, WSDOT is able to monitors the performance of each 0.1 lane-mile pavement section by checking the pavement indexes from 100 to 0. The indexes measure structure (faulting, cracking, settlement), rutting (due to studded tire wear), and smoothness (affected by surface conditions, faulting, and cracking). When any of these indexes reaches a value of 50, it has reached the “trigger” value for rehabilitation. The small sections and their associated Due Years are then aggregated into Preservation Units for rehabilitation or reconstruction.
Reconstruction and Risk of Catastrophic Failure
The concept of the different concrete pavement alternatives, and when they are applicable, is illustrated in Figure 5-1. As the pavement ages, grinding and/or DBR with selective panel replacement are appropriate. Eventually the pavement will deteriorate to the point where grinding and DBR are not appropriate, and the pavement condition will worsen until total reconstruction is required. Sometimes this can be a number of years, and it is advantageous to delay the large capital cost of reconstruction as long as possible. But as the figure shows, this is also the point in the life of the pavement structure when risk is higher, so it is important to closely monitor the condition of the pavement structure.
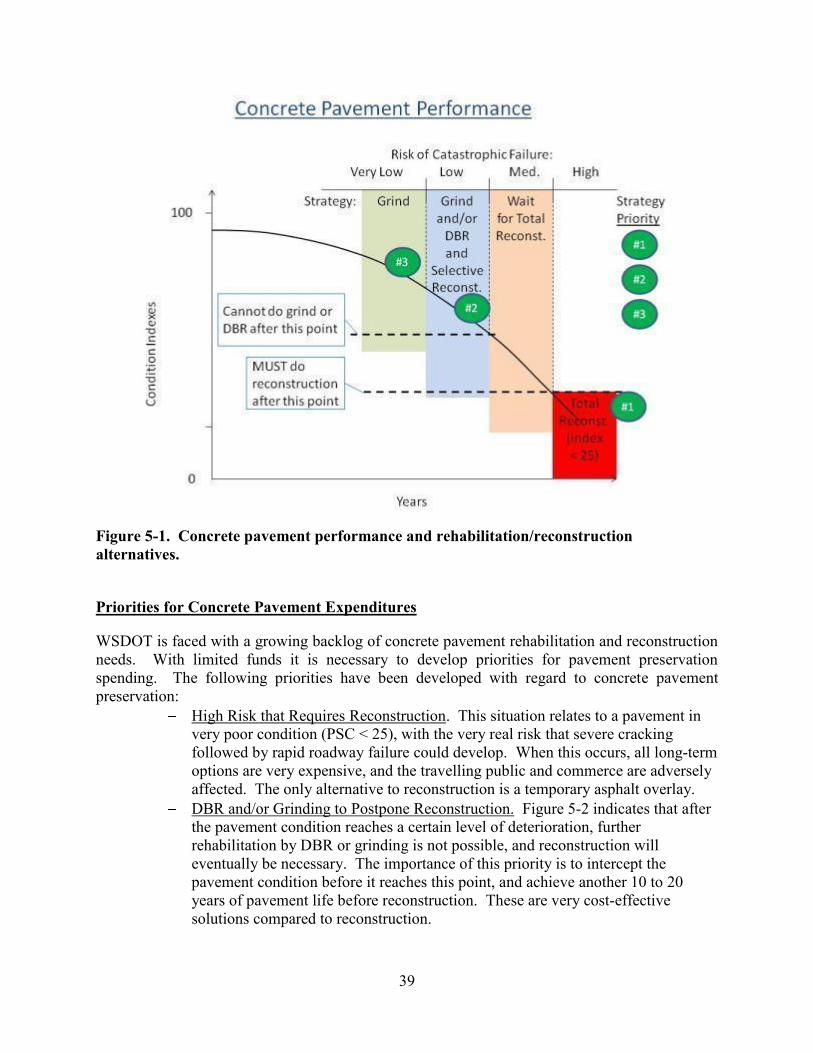
39
Figure 5-1. Concrete pavement performance and rehabilitation/reconstruction alternatives.
Priorities for Concrete Pavement Expenditures
WSDOT is faced with a growing backlog of concrete pavement rehabilitation and reconstruction needs. With limited funds it is necessary to develop priorities for pavement preservation spending. The following priorities have been developed with regard to concrete pavement preservation:
High Risk that Requires Reconstruction. This situation relates to a pavement in very poor condition (PSC < 25), with the very real risk that severe cracking followed by rapid roadway failure could develop. When this occurs, all long-term options are very expensive, and the travelling public and commerce are adversely affected. The only alternative to reconstruction is a temporary asphalt overlay.
DBR and/or Grinding to Postpone Reconstruction. Figure 5-2 indicates that after the pavement condition reaches a certain level of deterioration, further rehabilitation by DBR or grinding is not possible, and reconstruction will eventually be necessary. The importance of this priority is to intercept the pavement condition before it reaches this point, and achieve another 10 to 20 years of pavement life before reconstruction. These are very cost-effective solutions compared to reconstruction.

40
Grinding. Grinding is a very economical method of improving the surface of a concrete pavement. Priority is given to projects that can achieve another 10 to 15 years of pavement life at a relatively low cost.
Therefore, not only the pavement index but also the relative distresses should be considered for a proper rehabilitation method and timing. Table 5-1. WSDOT 10-year rehabilitation length summary for concrete pavements.
Length Grind DBR Reconstruction Panel Replacement
(Lane-mile) (Lane-mile) (Lane-mile) (# of slabs)
2011-2013 497.3 31.2 92.5 4009
2014-2020 445.2 38.4 152.1 2257
10-Year total 942.4 69.7 244.6 6266 Table 5-2. WSDOT 10-year rehabilitation cost summary for concrete pavements.
Cost ($ million) Grind DBR Reconstruction Panel
Replacement Total
2011-2013 63.4 21.9 231.3 63.0 379.7
2014-2020 55.6 26.9 380.3 45.1 508.0
10-Year total 119.1 48.8 611.6 108.2 887.6

41
Executive Summary for Section 6. Summary of 10-year Plan for Flexible Pavements
Approximately 87 percent of the state roadway network consists of flexible (asphalt and chip seal) pavements. These pavements are managed mostly on a repeating cycle of 7 – 17 year rehabilitations/resurfacings. In order to determine a statewide plan for addressing pavement preservation needs, the number of Due and Past Due miles were summarized for each region, and characterized as a percentage of the total Due miles statewide. Once funds were determined according to the need of each region, the projects were selected according to the region’s recommendations. The highest priority projects from each region were then pooled into a statewide group of projects which needed to be prioritized. Several priority weighting schemes were tested which included weighting factors for total traffic, truck volume, functional class, and various categories of percent Due. This weighting process was then used to prioritize the proposed asphalt projects.
6. SUMMARY OF 10-YEAR PLAN FOR FLEXIBLE PAVEMENTS
Approximately 87 percent of the state roadway network consists of flexible (asphalt and chip seal) pavements. These pavements are managed mostly on a repeating cycle of 7 – 17 year rehabilitations/resurfacings. The approach used to develop a 10-year plan for flexible pavements is described in this section of the report. Concrete (rigid) pavements have much longer lives and require different types of rehabilitation. Concrete pavements are addressed in Section 7.
6.1 Chip Seal (BST) Pavement
In previous sections of this report (Section 3.5, Section 4.2), the use of chip seals has been thoroughly discussed. It has been noted that this type of pavement surfacing is particularly economical for roads with traffic volumes less than 5,000 vehicles per day. It has also been discussed that chip seal lane-miles will receive a high priority when it comes to determining annual construction programs, and that a backlog of chip seal lane-miles is not expected to develop. The expected need over the next 10 years for chip seal construction was shown in Figure 4-3. A proposed list of projects that address this need in the 2011-2013 Biennium is included in Appendix C (Flexible Pavement Plan). The proposed projects are weighted by the combination of pavement surface age and average daily traffic (ADT) level.

42
6.2 Asphalt Pavement Two-Year Plan
In order to determine a statewide plan for addressing pavement preservation needs, the number of Due and Past Due miles were summarized for each region, and characterized as a percentage of the total Due miles statewide. This information is shown in Table 6-1 below. Table 6-1. Distribution of Due and Past Due lane-miles by region.
Regions Eastern North Central
North west Olympia South
Central South west Total
Total Asphalt 1,695 1,191 3,058 2,327 1,465 1,921 11,659
Lane Miles Due & Past Due 458 135 565 258 664 144 2,225
% Due&PastDue in Region 27% 11% 18% 11% 45% 7% 19%
% of Statewide Due & Past Due 21% 6% 25% 12% 30% 6% 100%
The information in Table 6-1 was used to determine which WSDOT Regions had the greatest need with regard to pavement preservation. Each Region then provided a prioritized list of which projects they felt needed to be performed during the 2011-2013 Biennium. So, once funds were determined according to the need of each Region, the projects were selected according to the Region’s recommendation. The highest priority projects from each Region were then pooled into a statewide group of projects which needed to be prioritized. Several priority weighting schemes were tested which included weighting factors for total traffic, truck volume, functional class, and various categories of percent Due. A weighting factor was selected that combined the effects of truck volume (since high truck volumes lead to faster pavement deterioration), and percent Due. Pavements that were far Past Due, or Future Due, had lower rankings than projects that were Due or slightly Past Due. The weighting values are shown below in Table 6-2 and 6-3. Table 6-2. Weighting factors for Due Year in consideration of asphalt project priority ranking.
Due Year Type Due Year Weighting Factor
Far Past Due ≤2006 10
Past Due 2007~2009 60
Due 2010~2013 30
Future Due ≥2014 -10

43
Table 6-3. Weighting factors for truck volume in consideration of asphalt project priority ranking.
Truck Volume Weighting Factor (sliding score)
From To Lower Upper 0 2,000 1 1
2,000 5,000 1 2 10,000 unlimited 2 2
Using this methodology a proposed list of over 50 projects was given a statewide priority ranking (see Appendix C for a table that contains the project listing). A summary of the projects by Region is shown in Table 6-4. Table 6-4. Summary description of asphalt pavement projects by Region for 2011-2013 Biennium.
Region Lane-miles Estimated Cost ($ millions)
Average Unit Cost ($ millions/ln-mi)
Eastern 124.8 22.6 0.18
North Central 26.8 6.7 0.27
Northwest 58.4 24.9 0.47
Olympia 42.2 12.2 0.31
South Central 137.3 29.2 0.23
Southwest 40.1 6.4 0.22
Total 429.5 102.0
6.3 Ten-Year Integrated Plan for Flexible Pavements
A combined chip seal and asphalt pavement approach for 10 year evaluation was examined in Section 4 for three scenarios: 1) a plan that would eliminate the asphalt pavement backlog after 10 years, 2) a plan that would maintain the same level of pavement backlog that we have today (status quo), and 3) a plan that would follow the current budget over the next 10 years. The results of analyzing these three scenarios are summarized in Table 6-5.

44
Table 6-5. Overall 10-year cost versus 10 year asphalt backlog for three scenarios.
Scenarios 10-Year Asphalt &
BSTCost ($ millions)
Asphalt Backlog after 10 Years
(lane-miles)
Scenario 1: Eliminate Backlog $2,004 0
Scenario 2: Status Quo $1,759 1,330
Scenario 3: Current Budget $925 4,420

45
Executive Summary for Section 7. Strategies for Addressing Escalation of
Asphalt Prices
WSDOT began adjusting the payment that contractors receive for asphalt pavement in 2006. The adjustment was necessary because of the worldwide fluctuations in the price of crude oil. The initial adjustment was for projects that extended over more than one construction season. The subsequent adjustment, initiated in the 2009 construction season, applies to all projects that use asphalt pavement. The contractor is paid either more for asphalt if the price increases during the project or less if the price decreases. The adjustment was needed to provide protection against some of the uncertainties of cost increases and to maintain the competitive bidding environment. It reduces the risk for contractors of being underpaid for asphalt pavement and protects WSDOT from paying too much. There are limited options to reduce the amount of asphalt used for roadway construction. All of the pavement types currently used by WSDOT utilize asphalt; even concrete pavements use asphalt in the base layer. The only viable alternative for asphalt is concrete pavement. Unfortunately, concrete pavement does not compete economically with asphalt pavement, except on more heavily trafficked roadways. This is the reason why concrete pavements are mainly confined to the urban areas of the larger cities in the state. There are processes in place to use less asphalt, which include recycling old asphalt pavements into new asphalt pavement and building asphalt pavements that last longer. Virtually all of the asphalt milled from state highways is reused either on state projects or on city or county paving projects. There is a constant pursuit of improvements that will extend the life of asphalt pavements. There is a new design process for the pavement mix, a more refined approach to selecting the best performing grade of asphalt cement, solutions have been found regarding problems with achieving the correct pavement compaction where two lanes of pavement meet, and more chip seal (BST) pavements are being used, which consume less asphalt.
7. STRATEGIES FOR ADDRESSING ESCALATION OF ASPHALT PRICES
7.1 Asphalt Cost Price Adjustment
History of Asphalt Cost Price Adjustment
In September of 2006, following a summer of steadily rising prices for asphalt binder, WSDOT and the Washington Asphalt Paving Association (WAPA) agreed to implement a General Special

46
Provision (GSP) that would provide for price adjustments to temper some of the risk (for both the State and contractors) of volatile asphalt binder prices. The specification was to be applied to only large projects that would extend over multiple construction seasons. Pay adjustments would be made when the price index established at bid opening varied by more than 10 percent in either direction. Guidance for estimating the price escalation was included in the instruction for use of the GSP. At the time, it was estimated that the cost would continue to rise to $425 per ton. A 4 percent growth factor was applied to that amount and estimates were provided for the second through the fifth contract year. Using that growth rate the price of asphalt binder was expected to be $497 per ton after five years. For the 2007 season, the index price for asphalt was relatively stable ranging from $332 to $358 per ton during the traditional paving season. In March 2008, the price of asphalt binder started to climb rapidly, and reached an average, at the end of July 2008, of $587.50 per ton in the Seattle area and $715.63 per ton in the Spokane area, substantially beyond the five-year estimate used as guidance for budgeting.
Impact of the 2006 Asphalt Cost Price Adjustment
A total of $449,352 was paid out for asphalt cost price adjustments for all contracts with the asphalt cost price adjustment through the end of July 2008. Based on the amount of paving that was to be done through the end of 2008, the amount to be paid out for the remainder of 2008 was estimated to be $5,751,700. For the list of future projects that have the asphalt cost price adjustment GSP, the amount of payment for the 2009 season and beyond is estimated to be between $18,800,000 and $25,400,000.
Changes for 2009
With the volatility in the oil market and recent supply issues that have come into play, there is a concern that the bidding climate will be very risky in the upcoming paving seasons. If the cost escalation provision is not extended to include single season projects instead of only projects that extend over multiple seasons, only the largest paving companies will be willing to bid on WSDOT paving projects, and then only with a substantial risk built into the bid. In order to be sure there are enough bidders for paving projects to ensure a competitive bidding environment for the foreseeable future, the following changes to the asphalt cost price adjustment provision were made:
1. The asphalt cost price adjustment provision is now applied to all projects with asphalt rather than just the multi-year projects.
2. The action threshold is now +/- 5 percent rather than that previous +/- 10 percent. 3. The Asphalt Binder Reference Cost that tracks changes in the price of asphalt binder
is updated twice monthly rather than the previous monthly update.
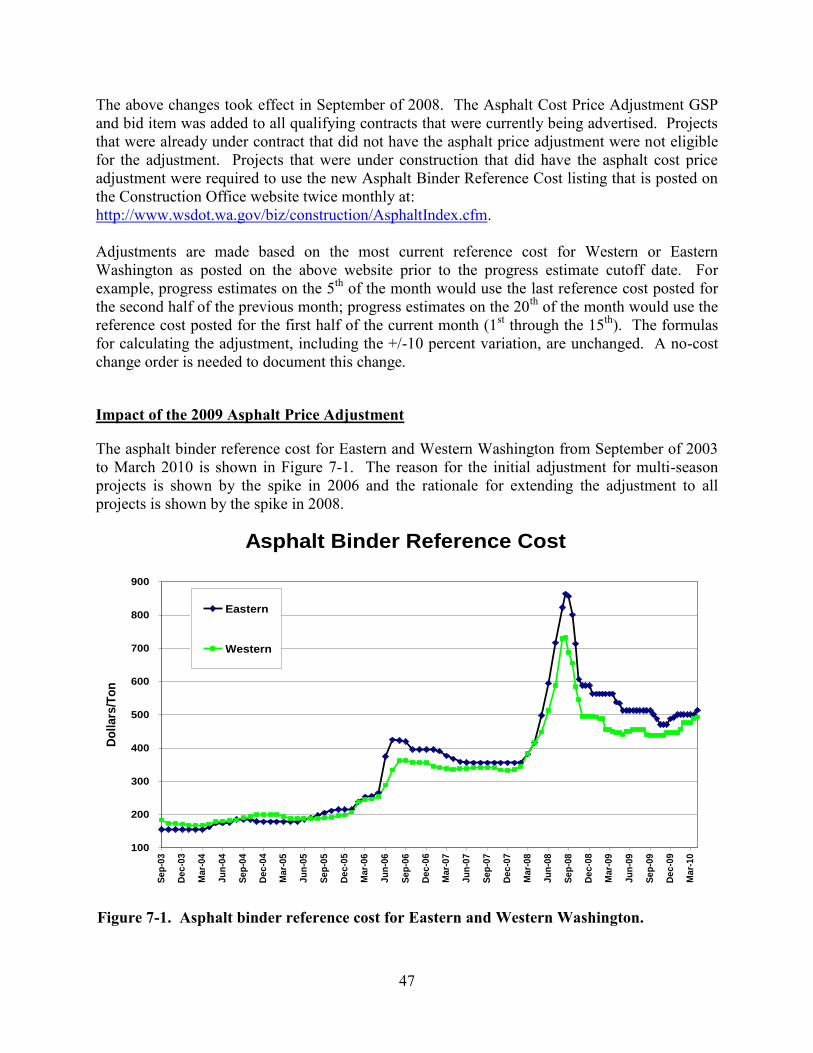
47
The above changes took effect in September of 2008. The Asphalt Cost Price Adjustment GSP and bid item was added to all qualifying contracts that were currently being advertised. Projects that were already under contract that did not have the asphalt price adjustment were not eligible for the adjustment. Projects that were under construction that did have the asphalt cost price adjustment were required to use the new Asphalt Binder Reference Cost listing that is posted on the Construction Office website twice monthly at: http://www.wsdot.wa.gov/biz/construction/AsphaltIndex.cfm. Adjustments are made based on the most current reference cost for Western or Eastern Washington as posted on the above website prior to the progress estimate cutoff date. For example, progress estimates on the 5th of the month would use the last reference cost posted for the second half of the previous month; progress estimates on the 20th of the month would use the reference cost posted for the first half of the current month (1st through the 15th). The formulas for calculating the adjustment, including the +/-10 percent variation, are unchanged. A no-cost change order is needed to document this change.
Impact of the 2009 Asphalt Price Adjustment
The asphalt binder reference cost for Eastern and Western Washington from September of 2003 to March 2010 is shown in Figure 7-1. The reason for the initial adjustment for multi-season projects is shown by the spike in 2006 and the rationale for extending the adjustment to all projects is shown by the spike in 2008.
Figure 7-1. Asphalt binder reference cost for Eastern and Western Washington.
Asphalt Binder Reference Cost
100
200
300
400
500
600
700
800
900
Se
p-0
3
De
c-0
3
Ma
r-0
4
Ju
n-0
4
Se
p-0
4
De
c-0
4
Ma
r-0
5
Ju
n-0
5
Se
p-0
5
De
c-0
5
Ma
r-0
6
Ju
n-0
6
Se
p-0
6
De
c-0
6
Ma
r-0
7
Ju
n-0
7
Se
p-0
7
De
c-0
7
Ma
r-0
8
Ju
n-0
8
Se
p-0
8
De
c-0
8
Ma
r-0
9
Ju
n-0
9
Se
p-0
9
De
c-0
9
Ma
r-1
0
Do
llars
/To
n
Eastern
Western

48
The amounts paid out per year for the asphalt cost price adjustment are shown in Table 7-1. Table 7-1. Asphalt cost price adjustment for each year.
Year Total Cost ($)
2008 5,957,390
2009 1,181,252
2010* 82,307 * Paid out through March 10, 2010.
7.2 Strategies for Addressing Escalation of Asphalt Prices
Washington’s highways are made up a three pavement types: chip seal (BST), asphalt, and concrete pavement. All three pavement types use asphalt either directly or indirectly in their construction. Chip seals and asphalt pavements use asphalt as the “glue” that holds the aggregate together. Concrete pavement itself does not require asphalt but a base of asphalt is placed beneath concrete to improve its performance. Asphalt is the most expensive material component in asphalt and chip seal pavements making the cost of asphalt an important consideration in road construction. Even before the escalation of asphalt prices, WSDOT researched and implemented strategies to reduce asphalt use as a method to lower pavement cost. The strategies can be broken down into three basic categories: (1) use pavement types that do not require asphalt, (2) replace some of the new asphalt with recycled asphalt and (3) reduce the need for more asphalt by building longer lasting pavements.
Strategy 1: Use Pavement Types that do not Require Asphalt
There are limited alternatives to asphalt in use today. The Federal Highway Administration keeps statistics of the nation’s highway system based on surface types. According to FHWA in 2008 the federal and state road systems consisted of 642,000 centerline miles of flexible pavement (BST, Hot Mix Asphalt (HMA), brick or block) and 33,800 centerline miles of rigid (concrete) pavement. Another 84,300 centerline miles was classified as composite pavement, a combination of flexible pavement over rigid (FHWA 2008). WSDOT classifies pavements slightly differently, but the pavement types follow a similar pattern consisting of 4,582 lane miles of chip seals, 11,566 lane miles of asphalt and 2,407 of concrete. The statistics indicate that the vast majority of pavement in the United States and Washington State are constructed using asphalt. Brick and block pavement types are listed by FHWA but these pavements are rare and usually used for ornamental reasons or are remnants of old pavement. Brick and block pavements are not practical or durable enough for new highway construction. That leaves only concrete as an alternate to asphalt pavements in widespread use today. Paving materials (other than concrete) that do not use asphalt do exist. An example is epoxy and polyester concrete that WSDOT occasionally uses to overlay bridge decks. These materials provide durable waterproof driving surfaces that do not require asphalt. They are used on bridge

49
decks where asphalt will not adequately waterproof the deck but heavy traffic requires that closure times that are too short for a conventional concrete overlay to harden. These materials are very expensive relative to current asphalt prices. They are only practical on bridge decks because the cost of repairing or replacing a bridge is expensive compared to pavement and the surface area to be overlaid is a small part of the overall highway system. WSDOT evaluates concrete pavement as an alternative to asphalt pavement on newly constructed roadway using its pavement type selection process. The process compares concrete and asphalt pavement based on their suitability to the location, their life-cycle cost and other factors that are unique to the corridor. Assuming both pavement types are suitable to the location and all other factors are equal the selection process comes down to an engineering economic analysis of the two alternatives. The economic analysis compares the initial cost of construction, the cost of future rehabilitations, and construction-related user delay costs over a 50-year pavement life. The economic analysis takes into account the price of asphalt when comparing the two alternatives. As the price of asphalt increases the asphalt option becomes less competitive and concrete is more likely to be selected. The pavement type selections process provides WSDOT a means to evaluate using concrete as an alternative to asphalt when asphalt prices escalate. To provide adequate long-term performance, WSDOT requires concrete pavement be at least eight inches thick. On low-volume routes the pavement can be thinner than eight inches and still perform adequately over its life. Asphalt is much more competitive on lower volume routes because a thinner asphalt pavement design is less costly compared to a thicker PCCP design. This is why concrete pavement is generally only used on highways with the highest truck volumes such as interstates and some urban principal arterials. Concrete is not competitive in the pavement type selection process on lower traffic highways. Another way WSDOT has used concrete as an alternative to asphalt is called a bonded concrete overlay. Traditionally, asphalt rehabilitation consisted of placing new asphalt over the old. A bonded concrete overlay consists of new concrete pavement placed over the old asphalt instead of new a new asphalt overlay. The old asphalt pavement is a stable base allowing a bonded concrete overlay to be placed more thinly than regular PCCP; however, it must still be thicker than a conventional asphalt overlay to prevent cracking. Most asphalt overlays placed by WSDOT are about two inches thick, while the minimum recommended thickness for a bonded concrete overlay is six inches. The minimum thickness of a bonded concrete overlay makes it less competitive when compared to asphalt. Presently WSDOT does not use bonded concrete overlays as an alternative to asphalt because of the higher cost and because it is a relatively new technology with less of a track record which carries more risk than asphalt. However, if asphalt prices increase to a point where bonded overlays are competitive with asphalt, it is a potential tool for pavement rehabilitation.
Strategy 2: – Replace New Asphalt with Recycled Asphalt
The most common method of reducing the amount of new asphalt in HMA is to replace it with asphalt from recycled materials. The two principal sources of recycled asphalt are reclaimed asphalt pavement (RAP) and recycled asphalt shingles (RAS). RAP consists of old asphalt

50
pavement that is ground off of the road as part of pavement rehabilitation. RAS is made up of scrap asphalt shingles after they have been torn off an old roof or waste from the manufacture of new shingles. The asphalt in both RAP and RAS will offset the new asphalt needed to produce asphalt pavement. WSDOT has allowed the use of RAP for many years and RAP is discussed further in Section 8.1. Using RAS in asphalt is relatively new in the US. Only a few states are allowing widespread use and the percentage allowed in the asphalt is low (usually around 3 percent). WSDOT does not currently allow RAS in asphalt mixes but is evaluating their potential use. Old asphalt pavement can also be recycled using hot in-place recycling (HIPR). Instead of hauling the recycled asphalt back to the asphalt plant, HIPR recycles it at the project site in one continuous process and paves the asphalt back on the roadway. HIPR recycles 100 percent of the old asphalt pavement and only requires about 20 percent new asphalt. HIPR is discussed further in Section 8.1. Another way that WSDOT is using recycling to reduce asphalt use is cold in place recycling (CIPR). CIPR is used for roadways where the pavement distress dictates removal and replacement of a substantial portion of the asphalt structure. CIPR is a process by which the existing pavement is recycled in place to rehabilitate the pavement which reduces the need for new asphalt. The recycled pavement is then paved with an asphalt wearing surface and correspondingly less new asphalt material in the total pavement structure. WSDOT designs pavements that are perpetual, that is to last indefinitely, with only periodic surface rehabilitation needed to maintain them. Major reconstruction on existing Washington highways is rare limiting the use of CIPR.
Strategy 3: Reduce the Need for More Asphalt by Using Pavements that Last Longer
By making pavements last longer WSDOT reduces the need for new asphalt. All pavements eventually need to be replaced or overlaid. The longer the time period between replacements or overlays the less asphalt is needed. WSDOT is continuously looking for ways to increase pavement life. Some of the innovations implemented to improve asphalt pavement lives include:
– Superpave – WSDOT implemented new methods to design asphalt mixes which improve pavement performance. These new methods were developed by the Strategic Highway Research Program (SHRP), a five-year national research program conducted in the late 1980s.
– Performance Graded Asphalt Binders – Performance grading of asphalt allows selection of the correct asphalt grade for the local climate. Performance graded binders help prevent rutting and cold temperature cracking in asphalt.
– Cyclic Density – WSDOT was a leader in developing thermal imaging to detect cyclic density in asphalt. New specifications based on research findings were implemented to improve the quality of asphalt pavements.
– Warm Mix Asphalt (WMA) – WMA reduces energy consumption and may improve pavement performance by reduced aging of the asphalt. WSDOT is monitoring several test sections of WMA throughout the state. WSDOT now allows contractors to use WMA in place of hot mix asphalt on many projects.
– Longitudinal Joint Construction – WSDOT has implemented new specifications that improve the durability of the paving joint between lanes of HMA.

51
– Increased Chip Seal Use – WSDOT revised the criteria to allow chip seals to be used on more routes, reducing the amount of asphalt needed.
– Preventive Activities – WSDOT is implementing a program of applying low-cost pavement preservation techniques to extend pavement life (see Section 3.6 for more information on Preventive Strategies).
– Forensic Investigations – WSDOT investigates asphalt pavement projects that develop problems early in their life. The investigations attempt to determine the cause of the distress being displayed by the pavement in order to prevent similar problems on other projects and the shorter pavement life associated with these problems.
Not all pavement innovations investigated by WSDOT are implemented. Many of the innovations do not perform up to expectations. Occasionally they do perform well but are not implemented because their life-cycle cost is higher than other methods already employed by WSDOT. If asphalt prices continue to increase, innovations that do perform well but have a high life-cycle cost may become viable. Some of these innovations include:
– Nova Chip – Asphalt is often used in low-volume urban areas on BST routes to provide a smoother surface for pedestrians and bicyclists. Nova Chip (a proprietary ultra-thin HMA product) may be a lower life-cycle cost solution in these areas if asphalt prices increase.
– Stone Mastic Asphalt (SMA) – SMA is a more durable asphalt pavement used by some states. WSDOT built several tests section of SMA to determine whether the added life provided by SMA justifies the cost. Further investigation determining the cost effectiveness of SMA is warranted.
– Asphalt Modifiers – WSDOT investigated using rubber and polymer asphalt modifiers to improve asphalt pavement performance. Although they did appear to improve performance the increase in pavement life did not justify the added cost of the modifier.
An advantage of using longer lasting asphalt pavements to address the escalating cost of asphalt is that enhanced long-term pavement performance can be expected. A disadvantage of using longer lasting asphalt pavements is that any cost saving will not be realized until the end of the pavement’s life and that the amount of asphalt is the same. There is no cost savings now as higher construction costs will be realized. The cost savings occur by not replacing or rehabilitating the pavement as often which would move the savings into the future. This strategy would not be the best for a volatile market where the price of asphalt could go down as well as up.
52
Executive Summary for Section 8. Using Recycled Asphalt and Concrete in
State Highway Construction
WSDOT continues to be a leader in using reclaimed asphalt pavement (RAP) in highway construction. When a pavement approaches the end of its service life, it exhibits various distresses which warrant rehabilitation or reconstruction. In the case of pavement rehabilitation or reconstruction, all or a portion of the existing asphalt pavement could be either removed for land filling or recycled to make new asphalt. Asphalt surfacing is one of the most recycled products in the U.S. Nationally, it is estimated that as much as 100 million tons of asphalt pavement are milled off roads during resurfacing and widening projects each year. WSDOT practice only allows up to 20 percent of RAP to be incorporated into newly produced asphalt, but even with this allowance almost all of the RAP produced on state projects is being reused not only by WSDOT but also cities, counties and in private construction. The estimated cost savings to WSDOT alone is between $15 and $26 million per year. WSDOT is exploring the potential of incorporating even larger percentages of RAP into asphalt construction but challenges with mix design issues and pavement performance concerns must be overcome. Other applications of incorporating RAP into WSDOT construction processes include: (1) Hot In-Place Recycling (HIPR), (2) Cold In-Place Recycling (CIPR), and (3) crushed asphalt as an aggregate used in the underlying layers of a pavement structure. The HIPR process includes heating and removing a portion of the asphalt surface, remixing the material with asphalt binder and paving the mixture back on the roadway. Experimental projects have been constructed and are under evaluation. Preliminary results show there may be up to a 20 percent reduction in paving costs for simple overlays of existing structurally sound pavements. The CIPR processes is similar to the HIPR process except that the existing asphalt surface is reclaimed by a cold milling process combined with asphalt emulsion to create a new bituminous base, which is then surfaced with a chip seal or asphalt overlay. This work is limited to Eastern Washington where climatic conditions allow proper curing. The use of recycled asphalt as aggregate in base courses is being investigated in Washington and other states. There are concerns about the performance of this material and its affect on the long-term performance of pavements. Recycling concrete pavement into new concrete does not produce a mixture that is similar to the original concrete. The cement paste that clings to the aggregate after crushing creates problems with handling and finishing the concrete, creates the need for more water and cement, and can cause performance problems in the pavement itself. WSDOT, with some of the best aggregate in the world encapsulated within its existing concrete pavements in the Puget Sound area, could be a prime candidate to be a leader in solving the problems associated with concrete pavement recycling. Experimental use of recycled concrete pavement to make new concrete pavements is an area that deserves attention as opportunity and funding permit.

53
8. USING RECYCLED ASPHALT AND CONCRETE IN STATE HIGHWAY CONSTRUCTION
8.1 Recycled Asphalt in Washington State
WSDOT has been in the forefront of using asphalt recycling processes. When a pavement approaches the end of its service life, it exhibits various distresses which warrant rehabilitation or reconstruction. In the case of pavement rehabilitation or reconstruction, all or a portion of the existing asphalt pavement could be either removed for land filling or recycled to make new asphalt. Asphalt surfacing is one of the most recycled products in the U.S. Nationally, it is estimated that as much as 100 million tons of asphalt pavement are milled off roads during resurfacing and widening projects each year (1). Of this amount, 80 million tons are recycled as “reclaimed asphalt pavement” (RAP). RAP can be used as:
– Hot Mix Recycling o Recycled Asphalt Pavement (RAP) o Hot In-Place Recycling (HIPR) o Cold In-Place Recycling (CIPR)
– A granular base course. The most often used process for recycling asphalt pavement is to grind off the existing pavement and transport the material by truck to a hot mix plant where it is remixed with additional asphalt binder and aggregate, and then hauled back to the roadway for placement as new pavement. Hot In-Place Recycling and Cold In-Place Recycling (CIPR) are processes that take place on the roadway itself where the ground-up pavement runs through a recycling train that remixes the material with additional asphalt binder and aggregate and places it on the roadway in one continuous process. The HIPR is a hot process where the pavement is heated before it is ground up and CIPR is a cold process where the pavement is ground up cold. An alternative to hot mix recycling is to blend the ground-up pavement with granular base material in various percentages for use as a granular base course beneath HMA layers. The following discussion highlights the use of recycled asphalt in WSDOT highway construction and the effect on highway pavement replacement needs.
Recycled Asphalt Pavement (RAP)
Since the early 1990s WSDOT has used RAP as a routine process for both new and rehabilitation road construction projects. The following discussion highlights the use of RAP in state highway construction and the effect on highway pavement replacement needs.

54
Historical Use of RAP
WSDOT first utilized RAP in roadway construction in 1977, during the height of the United States energy crisis (2). The increasing cost of construction materials and the desire to conserve natural resources led many road building agencies, including WSDOT, to evaluate the merits of reusing all or portions of existing worn-out pavements as raw materials for new pavements (3). A five-mile section on I-90 near Ellensburg was selected for the first experimental use of RAP. The project removed two inches of the existing pavement and recycling it to produce a new asphalt pavement. All of material removed from the existing pavement was used to produce the new pavement. The only materials added to the RAP were additional asphalt binder and a rejuvenating agent to restore the liquid properties of the binder in the RAP. Construction operations (both placement and compaction) were identical to a mix with 100 percent virgin aggregate. The recycled pavement was capped with a 3/4 inch thick open-graded friction course overlay. This first attempt by WSDOT to recycle asphalt pavement, as documented in an Federal Highway Administration (FHWA) report (3), seemed to be successful with regards to cost, energy use, conservation of natural resources, constructability and performance. The FHWA report documented certain issues with the process such as the proper selection of a rejuvenating agent, the breaking down of the aggregate particles, the pollution produced during the production of the new mix, the need for additional amounts of aggregates and other minor problems (3). WSDOT learned that the mix design portion of any asphalt recycling project, particularly one using 100 percent RAP, is critical. The mix design process for a project using a high percentage of RAP involves sampling the exiting roadway and using that material mixed with virgin material in the mix design process. Overall, the performance of this first test section was good with no early rutting occurring in the roadway. The pavement showed good wear characteristics over the next 10 years. The success of this initial project gave WSDOT the incentive to consider addition RAP projects. A second RAP experimental project was construction on I-90 from the Yakima River to West Ellensburg I/C (4). In this project WSDOT specified that the asphalt pavement be recycled 100 percent, and that the contractor crush the existing pavement to meet WSDOT Standard Specifications for new asphalt pavement aggregate to try to overcome the problem of too many fine particles due to the breaking down of the aggregates during the grinding and crushing operations. As with the first experiment, WSDOT verified that pre-design work and mix evaluation are critical to a successful project. Problems encountered on this second project included selecting the proper type and amount of rejuvenator, estimating the degradation of aggregates due to milling and subsequent increase of fine material and determining the proper amount of new aggregate to add to the RAP. As with the initial project, a 3/4 inch thick open-graded friction course overlay was applied over the recycled pavement. The performance of this second project was similar to the first with no early rutting occurring in the roadway. Air quality tests on the stack emissions all met specification requirements. Construction costs and energy consumption seemed to validate the advantages of recycling.
55
A disadvantage of the two experimental projects is that the pavements produced with 100 percent RAP were both overlaid with a 3/4 inch thick open-graded friction course. The overlay masks the RAP surface and does not expose the pavement directly to the environment or traffic. Normally, WSDOT does not overlay asphalt pavements with open-graded friction courses, thus the overlay becomes an additional expense to WSDOT and reduces the cost advantages of recycling the old pavement. WSDOT continued experimenting with RAP mixtures from 1977 to 1986. Project specification allowed RAP percentages up to 100 percent; however, out of 16 projects built in that time period, the actual percentage of RAP used varying between 8 and 79 percent. The successful bidder on these projects was allowed the choice of what percentage of RAP he used. All RAP sections were covered with a 3/4 inch thick open-graded friction course as WSDOT continued to be cautious about exposing RAP mixes to traffic and the environment. The service life for these RAP projects ranged from 10 to 15 years before rehabilitation was required. The financial incentive to utilize RAP was high with a 34 percent reduction in the unit bid price for the asphalt pavement on these 16 projects.
Challenges with Using RAP
WSDOT has experienced some difficulties with the use of 100 percent RAP mixtures. RAP mixtures require an extensive amount of preliminary mix design effort. A substantial amount of sampling of the existing roadway is required to develop a mix design and additional mix designs are necessary if the material quality of the pavement varies substantially from one location to the next. Each sample must be broken down into its aggregate and binder components using a process called extraction. In the past, a chemical called trichloroethylene was used to separate the asphalt binder from the aggregate, but due to environmental and disposal concerns WSDOT severely limits its use. Extraction procedures used today are costly and are not as accurate in determining the actual amount of binder in a sample. An additional concern deals with the quality of RAP used to produce the recycled asphalt mix. The consistency of aggregate gradation, aggregate properties, asphalt binder content, and asphalt characteristics of the existing pavement are vital to a successful RAP mix. RAP on some projects come from a single source, provide a consistent RAP, and the material properties are uniform. Other projects use RAP from a combination of sources, where, if not processed properly, inconsistencies occur in mix production. Higher percentages of RAP also require more processing such as crushing and screening and incorporating individual stockpiles, which many asphalt plants in Washington are not equipped to handle (5). As a result of this early work WSDOT recognized the economic and environmental benefit to allow RAP for roadway construction. To allow the use of RAP to become a statewide practice WSDOT realized that projects with lesser amount of RAP posed less risk of problems than higher percentages. WSDOT experienced little to no impact to asphalt characteristics for mixes with less than 20 percent RAP. Experience had shown that for asphalt mixes with 10 percent or less RAP a majority if not all of the extra preliminary sampling and design work could be eliminated. This practice was implemented in 1988 for selected projects. In 1990, based on the success of these projects, the allowable percentage was increased to 20 percent on all WSDOT

56
projects. The benefit to WSDOT was cost savings as reflected in contractors’ unit bid prices. WSDOT’s use of up to 20 percent RAP on all projects with asphalt pavement has resulted with little to no impact to construction practices.
Other State DOTs Use of RAP
So, how does WSDOT line up with current national practices of using RAP? A survey of State Departments of Transportation (6) was taken in April 2009 by the FHWA Recycled Asphalt Pavement Expert Task Group to investigate the use of RAP on a national basis. The first question asked was what percentage of RAP is allowed in their Standard Specifications. The second was what percentage of RAP is actually being used in current practice. The response from 50 states showed the contrast between what is allowed and what is actually being used (Table 8-1). Table 8-1 shows that for almost half of the states (23 states) the percentage of RAP allowed in surface courses was in excess of 20 percent. The table also shows that while states often allow higher percentages the actual percentage used is much less, typically between 15 and 20 percent. Responses to the survey indicated that the barriers to using higher RAP percentages on a routine basis include: managing and controlling the aggregate gradations of RAP stockpiles, questions about the origin and quality of the RAP aggregate, long-term performance of RAP mixtures due to the variability of the materials, and issues associated with the mixing of the RAP with new asphalt binder to produce the new asphalt mix. Table 8-1. Comparison of the percent of RAP allowed versus used by the 50 states.
Percent of RAP No Limit > 30% 25% 20% 15% 10% 0% No
Response
Number of States
Allowed to be Used 9 10 4 10 12 1 4
Actually Used 9 32 2 6 1
WSDOT’s Current use of RAP
The effect of using RAP on WSDOT highway replacement needs is substantial but not easily quantifiable. WSDOT’s current practice is to allow 20 percent maximum RAP in asphalt production on all construction contracts. Limiting RAP below 20 percent, as was discussed in previous sections, allows the streamlining of asphalt mix designs and construction practices and eliminates concerns common to higher percent RAP mixtures. An additional driver for limiting RAP to 20 percent is that current stockpiles of RAP are being used, a huge excess does not exist (7). The actual percentage of RAP used on any construction project will vary depending on such factors as the availability of RAP, asphalt production requirements, plant capabilities and experience level of the asphalt production facility - all factors which vary from one project to the next. The average percentage of RAP used on WSDOT projects statewide, based on discussions with the Washington Asphalt Paving Association (WAPA) (7), is believed to be in the 15 percent range.

57
RAP Cost Savings
The cost savings statewide depends on a host of market factors including asphalt haul distance for a specific project, quality of the asphalt binder within the RAP material, gradation of the RAP aggregate, asphalt plant capabilities and contractor processes to name a few. WAPA (7) estimates the cost savings per ton of asphalt using RAP is approximately $1.50 to $2.50 per ton per percent of RAP used. WSDOT is forecasted to place an estimated 1,000,000 tons of asphalt during the 2010 construction season. If 70 percent of the asphalt tonnage uses 15 percent RAP the cost savings could be as high as $15.8 to $26.3 million. As is seen with these numbers, the impact to WSDOT highway construction needs is substantial and based on the good performance of asphalt mixtures with up to 20 percent RAP these cost savings will continue to be realized in the future.
Increasing RAP Use in Asphalt Pavement
WSDOT is the most consistent producer of all RAP stockpiles. It is estimated that WSDOT roadways produce 70 percent of the available RAP resource (7). The remaining 30 percent come from private sources, airports, city and county roadways. In urban areas the RAP that is generated is used for all customers of asphalt so that RAP that is produced on WSDOT projects does not solely go back on WSDOT projects. In urban areas huge stockpiles of RAP do not exist, therefore, there is a reduced need to increase the allowable RAP percentage which we know creates additional problems. Even so, in some cases a higher allowable percentage of RAP may lead to competitive bidding practices which could lower overall asphalt cost. Stockpiled RAP is more of a concern in rural locations where the opportunity to use RAP material is less. With RAP limited to 20 percent, new asphalt stockpiles of RAP can accumulate for isolated locations. Asphalt roadways are paved, depending on location, every 12 to 16 years. In some instances more RAP is generated than can be used with WSDOT’s current 20 percent maximum RAP specification. WSDOT is committed and working with the WAPA to determine a protocol to allow higher percentages of RAP. Difficulties that must be overcome include the necessity to adequately sample and characterize the existing roadway surface, determine streamlined procedures to test the combined RAP asphalt binder properties, overcome RAP production concerns including the crushing and grading of RAP aggregates, overcome issues with the non-uniformity of RAP materials, and finally, concerns about paving with mixes containing higher percentages of RAP. Lastly, even if material testing and production difficulties can be overcome, WSDOT has concerns about the performance of pavement built with higher percentages of RAP. Using higher percentages of RAP does Washington State no benefit if it results in reduced pavement life.
Hot In-Place Recycling
Hot in-place recycling (HIPR) is a technology that promises to reduce energy consumption and lower the cost of hot mix asphalt pavement rehabilitation. The traditional method of recycling asphalt pavement in Washington is to grind the top layer of the existing pavement, truck it back to the asphalt plant, stockpile it, and then incorporate it back into new asphalt. HIPR is a process

58
by which rehabilitation of the existing pavement occurs on site in one operation. The process begins by heating the existing asphalt pavement to a temperature high enough to allow milling or scarifying equipment to easily remove the upper layer of the pavement from the roadway surface. After removal from the roadway, some HIPR processes improve the properties of the asphalt by adding aggregate, asphalt and rejuvenator to the hot millings. Finally, conventional paving equipment spreads and recompacts the recycled pavement. HIPR eliminates the trucking and handling of RAP by performing the complete process in one pass on the roadway. A survey conducted by the FHWA indicated that 10 states utilize HIPR on a somewhat regular basis while 32 states have utilized the technique for demonstration projects over the years. In a typical three-year period, the states of Arizona, Colorado, New Mexico and Utah will perform approximately 5 to 15 HIPR projects per state. Limited performance information is available from these states. It should also be noted that HIPR has been performed in a number of countries outside of North America including Italy, Germany and Japan. British Columbia has over 25 years of extensive hot in-place recycling experience. This experience includes projects performed on high traffic and low traffic volume facilities as well in very cold to coastal, milder climates (8). WSDOT has constructed two HIPR projects. The first was constructed in 1995 on SR 97 in the Yakima vicinity (9). The second was constructed in the summer of 2009 on SR 542 east of Bellingham. The second project was different than the first in that an asphalt overlay was not placed on the roadway following the HIPR process. The pavement on SR 542 was rehabilitated by reusing the existing pavement and incorporating a minimal amount of new material. Preliminary indications are that the HIPR paving on SR 542 was a success. The cost savings over conventional paving practices is estimated at 15 to 20 percent. Pavement performance over time will determine if HIPR is a viable alternative to traditional asphalt. A report is available on the construction of the SR 542 project (9) with a final report due at the conclusion of the five year evaluation period in 2014. HIPR is a recognized tool for rehabilitating asphalt roadways, but it has not become a routine process for WSDOT for a variety of reasons. WSDOT has investigated many roadways as possible candidates for HIPR but for engineering reasons the process was not pursued. WSDOT pursued HIPR on a section of SR 20 east of Anacortes but did not use it due to the presence of paving fabric that was found in the upper lift of the existing HMA pavement. A major concern is the potential for raveling of the completed HIPR surface. A number of states allow HIPR but additionally require that the HIPR surface be overlaid with a asphalt wearing surface to eliminate pavement performance concerns. Other concerns include the non-uniform material properties of the existing roadway pavement. Pavement sections can vary in material quality throughout the length of any HIPR project. HIPR requires that materials be consistent; otherwise numerous mix designs and construction operational changes are necessary. The reason WSDOT used HIPR on SR 542 was to evaluate the performance of HIPR without a wearing surface. WSDOT’s preservation program, in order to obtain the lowest life-cycle cost, typically only inlays and overlays roadway surfaces. Using HIPR with an additional overlay would greatly increase preservation costs and render it non-competitive with the more traditional recycling discussed previously.

59
Cold In-Place Recycling
WSDOT is using cold in-place recycling (CIPR) to rehabilitate roadways that otherwise would require thick structural hot mix asphalt overlays or complete reconstruction. The cold in-place (CIPR) process involves milling and crushing the existing bituminous pavement, mixing in measured amounts of emulsified liquid asphalt and lime slurry, and placing and compacting the recycled material to construct a new road base. Following CIPR, the recycled base is overlaid with hot mix asphalt or, in some cases, a chip seal (10). Compared to other Western States the use of CIPR by WSDOT has been minimal. Since 1981 only 17 projects representing 250 lane miles have been recycled. The performance of these roadways has been excellent. On the few projects that are not performing as expected the problem is not with the CIPR base material but with the overlying asphalt surface or chip seal. Acceptance by WSDOT of CIPR as a rehabilitation strategy has derived from the recognition that CIPR provides a sound foundation for placement of either an asphalt or chip seal surface. Additionally, CIPR emphasizes several desirable sustainability concepts in pavement design and construction: (1) reuse of existing materials, (2) minimizing transport resources, and (3) minimizing waste materials. WSDOT’s preservation program currently focuses on preserving roadway by applying a thin asphalt overlay or inlay or chip sealing roadway surfaces. Although the life-cycle cost of rehabilitating roadways with CIPR is attractive, much of WSDOT’s roadway network does not require the extensive repairs that CIPR provides. The majority of WSDOT’s pavements do not require substantial structural improvements. Additionally, CIPR work is limited to the Eastern Washington environment where warm temperatures are required to adequately cure this recycling work. WSDOT will continue to utilize CIPR for roadways requiring pavement structural improvements and realize the benefits of this recycling work as necessary.
Recycled Asphalt as a Granular Base Course
The use of recycled materials in roadway construction continues to increase nationwide. The incorporation of recycled asphalt pavement (RAP) in asphalt pavements and in base course materials is also increasing and may result in substantial cost savings to a specifying agency, and a reduction of energy consumption and greenhouse gas emission. Currently, the WSDOT allows up to a bitumen content of 1.2 percent (about 20 percent RAP to be blended with crushed aggregates) in base course materials. WSDOT is concerned that the incorporation of too much RAP into base course materials may degrade the overall structural performance of both flexible and rigid pavement structures. Many studies (11, 12, 13) have shown that RAP has the potential to be a good base course material, but it also has some issues that need to be resolved. These issues related to RAP need to be addressed before higher quantities of RAP can be used as base course material for routine highway construction. Some studies have been conducted on recycled materials in other states, primarily focusing on laboratory evaluation of physical properties. Little work has been done that considers field performance, life-cycle analysis of costs, construction practices, energy savings and greenhouse gas emissions. WSDOT does not currently have a procedure in place to accept and test RAP materials for use in base course applications. To investigate these needs
60
Washington State University is performing a study entitled “Evaluate High Percentage Recycled Asphalt Pavement as Base Material” (14). The findings from this study may lead to WSDOT using RAP as base aggregate on a more routine basis for highway construction projects.
Recommendations/Conclusions
The following recommendations/conclusions are made concerning the recycling of asphalt pavements:
– While huge stockpiles of RAP do not generally exist in Washington, WSDOT should continue to work with WAPA to develop protocol that allows the use of higher percentages of RAP in asphalt pavement where practical.
– WSDOT has limited experience rehabilitating roadways with HIPR. Increasing the use of HIPR on WSDOT projects must be predicated on the successful performance of projects built by WSDOT. WSDOT should construct additional HIPR projects to determine the effectiveness of this recycling process.
– CIPR has been highly successful with rehabilitating low-volume roads in Eastern Washington. Increasing the use of CIPR will be based on finding roadway sections needing structural improvement in Eastern Washington.
– Increasing the use of higher percentages of recycled asphalt pavement in granular base courses needs future research to determine the cost effectiveness. Research being conducted at WSU may provide insight for the use of RAP in construction projects and overall performance.
8.2 Recycled Concrete Pavement
Recycling concrete pavement is very different from recycling asphalt pavement. Asphalt pavements can be ground up, reheated and mixed with some additional aggregate and asphalt binder to produce a new mix that is almost identical to the original mix pavement. Placing and compacting processes are unchanged from any other asphalt project. Recycling concrete pavement involves pulverizing the original pavement to produce aggregates that are the same size as the original aggregates, but they are not like the original aggregates. The original aggregates were clean rounded gravels, or clean, angular rock. The recycled aggregates have cement paste still attached and as a result are very angular with a rough surface texture. When these aggregates are used to produce a new concrete mix the resultant mix is very different from the original concrete mix. Fresh concrete made with recycled concrete aggregate tends to be very harsh due to the angular shape and rough surface of the aggregate. Harsh mixes are more difficult to place and finish with the result that the ride qualities of the finished pavement may suffer. Adjustments must also be made to the composition of the concrete mix that uses recycled concrete aggregate. More water is needed because of additional water absorbed by the cement paste and more cement is needed due to the inherent lower strengths of mixes made with recycled aggregate.

61
Michigan, Wisconsin, Iowa, Minnesota, and Wyoming have built multiple numbers of projects over the years with recycled concrete aggregate. Fifteen other states have built at least one trial project. The performance of these projects has been generally good. Performance problems have usually been traced to the marginal quality of the original aggregates. Only one state, Michigan, has a moratorium on the use of RCA due to excessive cracking. Of the states that have built multiple projects, only Wyoming continues to use recycled concrete aggregate to make new concrete pavements with the remainder electing to use the material as either a base or shoulder material. In many states the specifications leave it up to the contractor to decide where the recycled concrete aggregate will be used. Most contractors choose not to use it in the pavement, but as base course under the pavement.
Current Use of Recycled Concrete Pavement
Recycled concrete pavement has been accepted for a variety of uses by our Standard Specifications since 2004. These uses included ballast, gravel base, crushed surfacing, backfill for foundations, walls and drains, gravel, select and common borrow foundation material, and bank run gravel for trench backfill. It is not acceptable as aggregate for concrete pavement, asphalt pavement, asphalt-treated base or backfill for drywells. Recycled concrete pavement has been used for gravel base on a number of projects since the specification was put in place; however, details on its use are sparse since we tend to track items that are not in the standard specifications and not track those that are in them. Three projects that we know of that used or are using recycled concrete aggregate as base course material are:
– Federal Way to S. 317th Street HOV Direct Access, I-5, MP 143.25 to 144.74 – I-90 - Lake Easton Vic. to Bullfrog Rd I/C Vic WB - Replace PCCP – I-90 - Lake Easton Vic. To Big Creek Br Vic EB - Replace/Rehab Concrete
The first project on I-5 removed all four lanes of concrete for a length of 0.61 miles and replaced it with new concrete. The old concrete was crushed and reused as crushed surfacing base course. Approximately 5, 200 cubic yards of concrete weighing 10,300 tons were recycled on this project. The Lake Easton Vic to Bullfrog RD I/C Vic WB project is recycling the concrete from the outside westbound lane of I-90 into crushed surfacing base course. A total of 31,000 tons will be recycled by the completion of the project this year. The eastbound project, scheduled to start this year and be completed in 2011, will also recycle approximately 31,000 tons of old concrete to make crushed surfacing base course.
Discussion
The literature indicates that the majority of problems with pavements built with recycled concrete aggregate occurred where the original concrete was of marginal quality. The aggregates that compose our older pavements in Western Washington are some of the hardest and most durable aggregates in the world. Washington would, therefore, be one of the states that would be expected to have the least problems using recycled concrete aggregate in its concrete pavements.

62
That does not mean that caution should not be practiced. Several experimental projects should be built to evaluate the variables associated with the mix, the placement and finishing, and the quality of the final product. The process used to crush the pavement needs to be given the utmost attention with the goal being aggregates that have the least amount of cement paste attached. If that can be achieved the chances of success are very high.
Recommendations For the Use of Recycled Concrete Pavement
The following steps may be taken to initiate the use of recycled concrete pavement aggregate into new concrete pavement:
– Investigate crushing processes that can remove most of the cement paste from the aggregate.
– If step one is successful, build some small experimental projects using the recycled concrete aggregate.
– Evaluate the performance of the experimental sections for a minimum of 10 years before proceeding with full-scale use of recycled concrete aggregate in concrete pavement.
This cautious approach to the use of recycled concrete aggregate is dictated by the necessity of producing a pavement with a 50 year life. Anything less would not meet our lowest life-cycle cost requirements.
8.3 References for Section 8
1. Asphalt Pavement Alliance (APA). (2001a). Recycling Asphalt Pavement Background. Paper posted on the APA website ([[2]]) as a .pdf file. Accessed 6 November 2001. http://www.asphaltroads.org/
2. Sullivan, John, Pavement Recycling Executive Summary and Report, Report No. FHWA-SA-95-060.
3. LeClerc, R. V., Schermerhorn, R. L. and Walter, J. P., Washington State Department of Transportation’s First Asphalt Concrete Recycling Project – Renslow to Ryegrass, Washington State Department of Transportation, Olympia, WA., July 1978.
4. Walter, J. P., Washington State Department of Transportation’s Second Asphalt Concrete Recycling Project – Yakima River to West Ellensburg Interchange, Washington State Department of Transportation, Olympia, WA., March 1981.
5. Processing and Handling Reclaimed Asphalt Pavements (RAP), Information Series 123, National Asphalt Pavement Association, Lanham, MD, January 2007.
6. Jones, Cecil, Recycling/Reclaiming Renewable Energy, Roads and Bridges, Page 38-45, October 2009.
7. Communication with Tom Gaetz, Executive Director Washington Asphalt Pavement Association, Seattle, WA, May 17, 2009.

63
8. Granite Construction Engineering Services, Washington State Department of Transportation Materials Laboratory, Green Roads Recycling. Hot In-Place Recycling Lessons Learned – Washington State Route 542 – Bellingham, Draft Report November 24, 2009.
9. Russell, Mark, Uhlmeyer, Jeff, Devol, Joe and Weston, Jim, Evaluation of Hot In-Place Recycle – SR 542, Washington State Department of Transportation, Olympia, WA, April 2010.
10. Uhlmeyer, J.S., Pierce, L.M., Kinne, C.T., Anderson, K.W., Muench, S., Mahoney, J.P., Valentine, C. (2008). Cold In-Place Recycling In Washington State. Proceedings, Tenth International Conference on Asphalt Pavements, International Society for Asphalt Pavements.
11. Jeon, E., Steven B. and Harvey, J., “The Performance Evaluation of Recycled Pulverized Asphalt Concrete Material Based on Comprehensive Laboratory Testing,” paper presented at 2009 Transportation Research Board Meeting, Washington D.C., 2009.
12. McGarrah, E., “Evaluation of Current Practices of Reclaimed Asphalt Pavement/Virgin Aggregates as Base Course Materials,” a research paper submitted in partial fulfillment of the requirements for degree of Masters of Science Civil Engineering University of Washington, 2007.
13. Wen, H., Warner, J., and Edil, T., “Laboratory Comparison of Crushed Aggregate, Recycled Pavement Materials with and Without High Carbon Fly Ash,” Compendium of Paper CD-ROM for 87th Transportation Research Board Meeting, Washington D.C., 2008.
14. Wen, Haifang, New Research Proposal – Evaluate High Percentage Recycled Asphalt Pavement as Base Material, Washington State University, Pullman, WA, February 2009.

64
Executive Summary for Section 9. Permeable Pavement
Effective stormwater management is a high priority for WSDOT. Conventional impermeable pavement does not allow water to penetrate the ground where it can be naturally filtered and cleaned before entering streams and underground water supplies. To ensure water falling on conventional impermeable pavement meets water quality requirements and does not cause localized erosion and flooding, WSDOT constructs stormwater facilities to collect, clean and store excess water before it enters streams or infiltrates into the soil. Permeable pavements are a potential method of managing stormwater that eliminates the need for a separate collection, treatment and storage system. Water simply flows through the permeable pavement and directly into the underlying soil. The permeable pavement removes pollutants as water flows through it and a layer of gravel under the permeable pavement stores excess water preventing localized erosion and flooding. The strongest potential use of current permeable pavements is in new construction of very low volume, slow speed locations with lightly loaded vehicles. Common applications to date include pedestrian facilities (sidewalks, paths and parks), driveways and parking lots. There has been limited use of permeable pavement on very low-volume residential streets and other very low-volume roads with limited truck traffic. Life-cycle information for nearly all of these installations remains unavailable, due to both missing data (not tracking life-cycle cost and performance) or due to the relatively recent construction of these facilities. Permeable pavements suit new construction, as the pavement is designed from the subgrade (soil) up. Retrofitting existing pavements would entail removing not only the existing pavement, but also the aggregate base beneath it and any compacted soil below the aggregate. Depths of excavation would typically be approximately two feet. In new construction, this can be designed into the new road before construction, which would not be the case if trying to retrofit an existing road. Permeable pavements by design contain a significant volume of air voids in the pavement (holes in the pavement). Rainfall then flows through these voids in the pavement, into a gravel bed for storage and ultimately percolates into the ground, mimicking natural infiltration. The necessary air voids reduce the strength of the pavement and reduce the pavement’s ability to resist loading from high traffic volumes or from truck traffic. The infiltration of water into the soil below the pavement structure reduces the soil strength, again reducing the pavements ability to resist loading from high traffic volumes or from truck traffic. For these reasons most applications of permeable pavement are on facilities with no vehicle traffic (bike lanes, pedestrian paths, sidewalks, areas of parked traffic (parking lots) or areas of very low speed, very low-volume traffic (residential streets).
9. PERMEABLE PAVEMENTS
Effective stormwater management is a high priority for WSDOT. Conventional impermeable pavement does not allow water to penetrate the ground where it can be naturally filtered and cleaned before entering streams and underground water supplies. To ensure water falling on

65
conventional impermeable pavement meets water quality requirements and does not cause localized erosion and flooding, WSDOT constructs stormwater facilities to collect, clean and store excess water before it enters streams or infiltrates into the soil. Permeable pavements are a potential method of managing stormwater that eliminates the need for a separate collection, treatment and storage system. Water simply flows through the permeable pavement and directly into the underlying soil. The permeable pavement removes pollutants as water flows through it and a layer of gravel under the permeable pavement stores excess water preventing localized erosion and flooding.
9.1 What is Permeable Pavement?
Permeable pavement passes stormwater through the pavement structure into the underlying soil, mimicking the natural process of infiltration. To do this, the pavement structure contains many air holes, or voids, to allow free flow of water through the pavement. Below the pavement is a layer of aggregate, designed to act as a reservoir, holding the rainwater until it naturally infiltrates into the soil below.
Figure 9-1. Cutout of a permeable pavement system. Note that pavement thicknesses are for low-volume applications.

66
Figure 9-2. Typical conventional pavement. Note that thicknesses are for both low and high volume applications. Permeable pavement must pass water though its structure and must allow infiltration into soil below the pavement structure. Both of these requirements tend to decrease the strength of the pavement. Adding air voids (air holes or spaces in the pavement) to pass water decreases the strength of the pavement (air has no compressive strength to resist traffic loads). Allowing the rainwater to infiltrate into the soil beneath the pavement decreases the strength of that soil. Picture driving on a dry dirt road compared to driving on a muddy dirt road: the muddy road will not support much weight. Permeable pavements show promise in the construction of new very low-traffic-volume roads or similar facilities. While more expensive to build than conventional pavements, they reduce the cost of stormwater management facilities and have the possibility of decreasing the extent of the stormwater drainage system. Note that while the stormwater drainage system may be decreased in size, in some situations a smaller system will still be needed to handle major storm events. Sizing the crushed rock storage layer to hold major storm events is neither practical nor cost effective.
9.2 Permeable Pavement Applications in Washington State
Almost all permeable pavement constructed has been for low volume, slow speed locations with lightly loaded vehicles. The most common applications in Washington State and nationwide have been pedestrian facilities (sidewalks, paths and parks), driveways and parking lots. There have been very few higher traffic applications until recently. Increased emphasis on stormwater management has resulted in more permeable pavement use on residential streets in new housing developments. None of these applications see traffic volumes approaching the levels on the least travelled of Washington’s highways. The few test sections constructed on roadways with traffic level comparable to the lowest volume highways in Washington are too recent to make any conclusion regarding permeable pavement’s performance under highway traffic. One

67
documented long-term performance on a high-volume roadway is an installation of permeable asphalt on Route 87 in Chandler, Arizona. The pavement is reported to have performed well under the higher traffic volumes on Route 87 in Arizona but the performance in the warmer and dryer climate may not indicate that permeable asphalt will perform well in Washington. Another permeable pavement application heralded as being similar in traffic count and truck loads to typical highways in Washington is the approaches to the Miles Sand and Gravel concrete plant in Kent, Washington. This section has performed well considering the thick concrete depth and daily use of only 30 trucks per day. The truck loading per year are shown below as well as the loadings on typical urban state highways where permeable pavements would likely be used.
Figure 9-3. Comparison of truck loadings of permeable pavements versus typical WSDOT conventional pavements (Columns in black are permeable pavements, orange for conventional pavements). The lack of a track record in higher volume applications is a serious impediment to the implementation of permeable pavement on driving lanes of Washington highways. Traffic volume has a drastic influence on how long a pavement lasts. An asphalt pavement with little or no traffic (such as shoulders, rest areas and residential streets) can last decades longer than the same pavement under typical highway traffic. Concrete pavement has a longer life than asphalt pavement, lasting 50 years or more on the highest traffic routes, but concrete pavements with little or no traffic can last indefinitely. Placing permeable pavement on Washington highways would be risky unless it can demonstrate it can withstand higher traffic volumes.
-
500,000
1,000,000
1,500,000
2,000,000
2,500,000 ESALs Per Year

68
9.3 Potential permeable pavements for very low-volume roads
There are documented examples of permeable pavement performing successfully in very low-volume applications, such as residential streets. WSDOT constructed a permeable concrete test section in the Anacortes ferry terminal holding lanes on October 22, 2009. When evaluating permeable pavement as a stormwater management option, tradeoffs should be taken into consideration including: higher initial cost, potentially increased maintenance requirements, potentially shorter pavement life and the risk of total replacement of the pavement at the end of its life. Project managers need to evaluate these tradeoffs against the traditional option of collecting and transporting the stormwater away from the pavement to another type of stormwater management facility. Permeable pavement may have both higher costs and higher benefits from directly infiltrating stormwater into the soil under the pavement.
Increased Maintenance
Permeable pavements can require periodic pressure washing and vacuuming to remove debris that may clog the pavement.
Life-Cycle Unknown
By nature a structure with a lot of void space is weaker than one made of the same material with less void space. This means that permeable pavements may be less durable than conventional pavements, requiring more frequent rehabilitation or replacement.
9.4 Current permeable pavements not suited to typical traffic levels on state
highways
Current designs for permeable pavements cannot handle the traffic levels and truck levels of most typical state highways. Trial installations to date have been either on sections of pedestrian travel or on very low-volume roads. These trial installations also lack the time history and performance data to confidently predict the life-cycle, and life-cycle cost of the pavement. Permeable pavement works best on:
Pedestrian areas Parking areas Very low-volume roads (e.g., residential streets) Very low truck traffic areas New construction Flat areas West side of the state (where infiltration and stormwater are most important)

69
Permeable pavements are more problematic, or impractical, on: Higher traffic volume roads Higher truck traffic areas Existing roads not needing full depth reconstruction Slopes (water drains to the low point then comes out the top of the road surface). Super-elevated roads (water drains to the low point then comes out the top of the road
surface).
9.5 Specialized Types of Permeable Pavements: Open-Graded Friction Courses
A specialized type of permeable pavement is one in which the top wearing surface is permeable, but the pavement structure underneath is not. This type of pavement is called an Open-Graded Friction Course (OGFC). It drain stormwater off to the side of the road through the wearing course, where the water is then distributed to a typical stormwater system. The advantage of OGFCs is they reduce splash and spray from vehicles, reducing the “washing effect” on the underside of vehicles. Less washing means more contaminants stay on the vehicle. Of course, those contaminants eventually fall to the pavement somewhere else. OGFC pavements have also been found to reduce tire/pavement noise, although tests in our state have shown them to be ineffective. WSDOT installed three test installations of OGFC “quieter pavements” (Ctrl + Click to follow link to website on Quieter Pavement Evaluation) one on I-5 north of Lynnwood, one on SR 520 near Medina and one on I-405 in South Bellevue. While showing audible noise reductions initially, these pavements lost their audible noise reductions within about six months. Two of the pavements have shown severe signs of wear after just a few years in service.

70
APPENDIX A. PAVEMENT TYPE SELECTION CRITERIA
The information presented in this Appendix is intended as a guide for determining the pavement type selection for individual projects. Pavement type selection is a three-part process which include a pavement design analysis, life-cycle cost analysis and evaluation of specific project details. Each of the following section provides examples and discussion necessary to prepare the final pavement type selection determination.
A.1 Pavement Design Analysis
The pavement design should be performed first, since the results may preclude the need to continue with the remainder of the pavement type selection process (life-cycle cost analysis and project specific details). The pavement design analysis includes the review and analysis of the following: subgrade competency, traffic analysis, materials, climate/drainage, environment, construction considerations, and any other pavement design factors.
Subgrade Competency
This is the only “go/no go” decision to be made under the pavement design analysis. Asphalt tends to perform better in situations where long-term settlement is expected. If the engineering evaluation of the subgrade concludes the presence of peat or organic silts, or the potential for long-term settlement exceeds two or more inches, then the pavement type selection is complete and asphalt is the selected pavement type. If the engineering evaluation of the subgrade concludes that either pavement type is viable, then the pavement type selection process proceeds to the next step.
Classification for Pavement Design
Pavements can be divided into different traffic classes depending on light to heavy traffic. Flexible and rigid pavements can be designed to accommodate these wide traffic ranges. For each of the pavement classes, traffic is quantified according to the number of equivalent single axle loads (ESALs). Based on the traffic volume and traffic growth rate, the design traffic loading can be estimated over the structural design period or the analysis period. The design traffic loading determines the pavement thickness needed to support the traffic loading over the structural design period. Correctly estimating design traffic is crucial to selecting an appropriate pavement type. To calculate the total design traffic per lane that a pavement will carry over its structural design life, it is necessary to estimate present traffic loading. To estimate future traffic loadings, traffic growth rates should be used. Depending on the roadway segment’s importance, conducting a

71
sensitivity analysis to compare growth rates and the impact of the growth rate on pavement thickness may be worthwhile.
Materials
Selecting materials for a road pavement design is determined by the availability of suitable materials, environmental considerations, construction methods, economics, and previous performance. To select the materials that best suit the conditions, these factors must be evaluated during the design to ensure a whole life-cycle strategy.
Availability and Performance
Most road construction materials have been classified and specifications prepared for each of the material classes. Every road pavement, independent of its type and applied materials, is subjected to certain traffic loads and environmental factors. These factors create various deterioration modes under in-service conditions. Deterioration modes and the pavement’s susceptibility to various deteriorating factors depend on the type of pavement and materials applied. Table A-1 shows the pavement deterioration modes for asphalt and concrete pavements. Table A-1. Pavement deterioration modes
Asphalt Pavements Concrete Pavements Surface deterioration Surface deterioration
Decrease in friction Decrease in friction Rutting Surface cracking Surface cracking Curling and warping Raveling (stripping) Joint raveling Roughness Roughness Studded tire wear Studded tire wear
Structural deterioration Structural deterioration
Base and subgrade rutting Cracking Fatigue cracking Pumping Reflective cracking Faulting
Pavement surface defects may only require surface course maintenance or rehabilitation. Structural deterioration is a defect of the whole pavement structure and treating it may require more extensive pavement rehabilitation. Knowing the difference between these two types of deterioration is important to maintaining and properly understanding pavement durability (or pavement life). Past performance with a particular material should be considered in tandem with applicable traffic and environmental factors. The performance of similar pavements or materials under similar circumstances should also be considered. Information from pre-existing designs, material tests, and pavement management data can help characterize a specific material’s suitability for pavement applications.

72
WSDOT’s experience has been that all pavement types are affected by studded tire wear (see Figures A-1 and A-2). The abrasion on pavement surfaces caused by studded tires wears down the pavement surface at a much greater rate than any other pavement/tire interaction. The same can be said for open-graded surface courses and wear due to buses with snow chains. Significant surface deterioration has occurred in as little as 4 to 6 years on asphalt and 10 to 15 years on concrete pavements. For the pavement type selection process, this implies that future rehabilitation timing may be reduced for each pavement type due to the damaging effect of studded tires and should be considered in the analysis until such a time that studded tire use is prohibited.
Recycling
To enhance sustainable development, consider using recycled materials in roadway construction. Future rehabilitation or maintenance treatments, if applicable, should incorporate recycled materials whenever possible.
Figure A-1. Studded tire wear on Concrete Figure A-2. Studded tire wear on a asphalt
mixes
WSDOT uses four basic types of dense-graded mixes which are described by the nominal maximum aggregate size (NMAS). These are 3/8-inch, ½-inch, ¾-inch, and 1-inch. Binder selection for asphalt mixes is based on the PG grading system and the following criteria:
Base PG grades with no adjustment for traffic speed or ESAL level o Western Washington: PG 58-22 o Eastern Washington: PG 64-28
Adjustment for traffic speed o Standing (0 to 10 mph): Increase PG high temperature by 2 grades (12°C) o Slow (10 to 45 mph): Increase PG high temperature by 1 grade (6°C) o Free flow (45+ mph): No adjustment
Adjustment for traffic loading o 10,000,000 ESALs: No adjustment

73
o 10,000,000 to 30,000,000 ESALs: Consider an increase in the PG high temperature by 1 grade (6°C)
o 30,000,000 ESALs: Increase PG high temperature by 1 grade (6°C) Maximum PG high temperature: The maximum increase in the PG high temperature
for any combination of conditions should not exceed a 2 grade increase (or 12°C) over the base PG grade.
Climate/Drainage
Both surface runoff and subsurface water control must be considered. Effective drainage design prevents the pavement structure from becoming saturated. Effective drainage is essential for proper pavement performance and is incorporated in the structural design procedure. WSDOT rarely includes open-graded drainage layers in its pavement structures. This does occur only for extreme subsurface drainage issues.
Pavement Design
Pavement design shall be conducted in accordance with the AASHTO Guide for Design of Pavement Structures – 1993 and this Pavement Policy. All pavement designs, rehabilitation strategies, and rehabilitation timing must be submitted, for approval, to the Pavement Design Engineer at the State Materials Laboratory Pavements Division.
Additional Concrete Issues
WSDOT has demonstrated that the concrete pavements constructed in the late 1950s through the 1960s are able to obtain a 50-year or more pavement life as long as joint faulting can be overcome. The ability to provide adequate joint design to minimize joint faulting is addressed by requiring the use of non-erodible bases and dowel bars (1-½ inch diameter by 18 inch length) at every transverse joint. The use of epoxy-coated dowel bars, both locally and nationally, does not necessarily ensure that a 50-year performance life will be obtained. Dowel bar specifications require the use of corrosion resistant dowel bars (stainless steel alternatives, MMFX-2 or zinc clad) on all newly constructed concrete pavements (Appendix 2). Rehabilitation of concrete pavements will potentially require diamond grinding following 20 to 30 years of traffic to address studded tire wear.
Additional Asphalt Issues
For heavily trafficked roadways (primarily the interstate and principal arterials), the pavement thickness should be designed to such a depth that future roadway reconstruction is not necessary. The pavement thickness should be designed such that 50 years of traffic will not generate significant bottom up (fatigue) cracking. Future mill and fill or asphalt overlays will be required to address surface distress (rutting or top down cracking) and aging of the asphalt surface.

74
Effect of Studded Tire Wear
WSDOT is currently in the process of investigating a number of mitigation techniques for the wear that results on concrete pavements due to studded tires. These include increasing the concrete flexural strength and utilization of a combined aggregate gradation. At this time, both of these studies are still in progress and conclusions are yet to be drawn. In the past, WSDOT has increased the concrete slab thickness by one inch to accommodate future diamond grinding(s). With the current concrete slab thicknesses contained in the Pavement Policy, this is no longer encouraged. Studded tire damage is also a concern for asphalt pavements. WSDOT has constructed a number of stone matrix asphalt (SMA) pavements, but have had a number of construction related difficulties, such that the ability to determine the impact that a SMA will have on reducing studded tire damage is unknown. In the life-cycle cost analysis, the accelerated wear on asphalt pavements will be incorporated through a shorter performance period on future overlays (but only as supported by Pavement Management data).
Construction Considerations
Pavement construction issues are an important component of the selection of pavement type. These issues can include:
Pavement thickness constraints. Consider the impact of utilities below the pavement and overhead clearances may have on limiting the layer thickness and type, and/or limit future overlay thickness.
Effects on detours, bypasses, and alternate routes. Consider the geometric and structural capacity of detours, bypasses and alternate routes to accommodate rerouted traffic.
Effects of underground pipes and services on performance. Determine the impact of existing utilities and future utility upgrades on initial and future rehabilitation treatments.
Anticipated future improvements and upgrades. Consider if the pavement type restricts or minimizes the ability to efficiently and cost effectively upgrade and/or improve the roadway width, geometry, structural support, etc.
Impact on maintenance operations, including winter maintenance. Will the selected pavement type have impacts due to freeze-thaw (surface and full-depth) or snow and ice removal?
Grades, curvature, and unique loadings (slow-moving vehicles and starting and stopping). How will steep grades, curvature and unique loadings impact pavement performance? Slow moving vehicles will generate increased strain levels in the asphalt pavement structure and these strains can significantly impact pavement performance (i.e. rutting and cracking).
A schedule analysis may need to be conducted to determine critical construction features (haul truck access, traffic control constraints – road closures, etc) and their impact on the project. This should also include staging analysis for multiple projects within the project corridor (to ensure that alternate routes are free of traffic delay due to construction activities). The Construction Analysis for Pavement Rehabilitation

75
Strategies CA4PRS1 software is useful in determining construction impacts and duration.
Other Factors
Evaluate other factors that are unique to the project or corridor.
A.2 Life-cycle Cost Analysis
Life-cycle cost analysis provides a useful tool to assist in the pavement type selection. The alternative resulting in the lowest net present value or annualized cost over a given analysis period is considered the most cost efficient. Life-cycle costs refer to all costs that are involved with the construction, maintenance, rehabilitation and associated user impacts of a pavement over a given analysis period. Life-cycle cost analysis is an economic comparison of all feasible construction or rehabilitation alternatives, evaluated over the same analysis period. A feasible alternative meets the required constraints, such as geometric alignment, construction period, traffic flow conditions, clearances, right-of-way, etc. At a minimum, one asphalt and one concrete alternative should be evaluated. The life-cycle cost analysis is conducted using the FHWA life-cycle cost analysis software, which is available through the State Materials Laboratory Pavements Division. The Federal Highway Administration’s policy on life-cycle cost analysis “is that it is a decision support tool, and the results of the life-cycle cost analysis are not decisions in and of themselves. The logical analytical evaluation framework that life-cycle cost analysis fosters is as important as the life-cycle cost analysis results themselves.” Net present value is the economic efficiency indictor of choice. The annualized method is appropriate, but should be derived from the net present value. Computation of benefit/cost ratios is generally not recommended because of the difficulty in sorting out costs and benefits for use in the benefit/cost ratios. Future costs should be estimated in constant dollars and discounted to the present using a discount rate. The use of constant dollars and discount rates eliminates the need to include an inflation factor for future costs.
Net Present Value
The present value method is an economic method that involves the conversion of all of the present and future expenses to a base of today's costs. The totals of the present value costs are then compared one with another. The general form of the present value equation is as follows:
i) (11 F NPV
n

76
where, NPV = Net Present Value F = Future sum of money at the end of n years n = Number of years i = Discount rate
Annualized Method
The annualized method is an economic procedure that requires converting all of the present and future expenditures to a uniform annual cost (Dell’Osola). This method reduces each alternative to a common base of a uniform annual cost. The costs are equated into uniform annual costs through the use of an appropriate discount rate (Kleskovic). Recurring costs, such as annual maintenance, are already expressed as annual costs. A given future expenditure, such as a pavement overlay, must first be converted to its present value before calculating its annualized cost. The general form of the annualized cost equation is as follows:
1i)(1i)i(1PV A n
n
where, A Annual cost PV Present Value n Number of years i Discount rate
Economic Analysis
The costs to be included in the analysis are those incurred to plan, work on and maintain the pavement during its useful life. All costs that can be attributed to the alternative and that differ from one alternative to another must be taken into account. These include costs to the highway agencies and user costs.
Performance Period
As a pavement ages, its condition gradually deteriorates to the point where some type of rehabilitation treatment is necessary. The timing between rehabilitation treatments is defined as the performance life. An example of this is illustrated in Figure A-3. Performance life for the initial pavement design and subsequent rehabilitation activities has a major impact on life-cycle cost analysis results.

77
Figure A-3. Example of pavement performance life
When available, the performance life of the various rehabilitation alternatives should be determined based on past performance history. In these cases, the WSPMS provides history on past pavement performance lives. In instances where the anticipated performance life is not well established (i.e., due to improved engineering and technologies), selection of the performance life will be coordinated and concurred upon by the State Materials Laboratory Pavements Division.
Initial Construction Costs
Unit costs vary according to location, the availability of materials, the scope of the project and any applicable standards. They can be estimated based on previous experiences, generally by averaging the bids submitted for recent projects of similar scope. Typical item costs can be located in bid item tabulations. The bid item costs may need to be adjusted according to local availability and work constraints. Mobilization, engineering and contingencies, and preliminary engineering can be excluded (sales tax should be included) for the initial construction cost estimate, since these costs are similar for asphalt and concrete.
Maintenance and Rehabilitation Costs
The type and frequency of future maintenance and rehabilitation operations vary according to the pavement type being considered. Knowing how a particular pavement type performed in the past is a valuable guide in predicting future performance. The WSPMS should be reviewed for past performance of rehabilitation and maintenance schedules. Costs must always be determined as realistically and accurately as possible based on local context and specific project features. When calculating the rehabilitation costs, include the cost of pavement resurfacing or concrete rehabilitation, planing or diamond grinding, shoulders, pavement repair, drainage and guardrail adjustments, maintenance and protection of traffic, etc. Mobilization (5 percent), engineering and contingencies (15 percent), preliminary engineering (10 percent), and sales tax should be included in all rehabilitation costs.
Pave
men
t Con
ditio
n
Time
Analysis Period
Terminal Quality Level
Structural Design Period
Rehabilitation Treatments
Condition trend if pavement is not maintained
Performance Life

78
Construction duration should reflect the actual construction time that is required for each pavement type. Construction durations should consider improvements, proposals or innovative contracting procedures in construction processes. If a difference exists in routine maintenance costs between the various alternatives, these costs should be included in the life-cycle cost analysis. A-2 contains a probable scenario corresponding to average traffic and climate conditions, assuming that state-of-the-art practices have been followed during construction and that maintenance and rehabilitation projects are carried out efficiently and on schedule. Table A-2. Rehabilitation scenario for asphalt and concrete pavements Year Asphalt Pavement Concrete Pavement
0 Construction or reconstruction Construction or reconstruction 15 0.15’ mill and asphalt overlay 20 Diamond grinding 30 0.15’ asphalt overlay 40 Diamond grinding 45 0.15’ mill and asphalt overlay 50 Salvage value (if applicable) Salvage value (if applicable)
Salvage Value
Salvage value is the asset value at the end of the analysis period. The difference between the salvage values of the various alternatives for a project can be small, because discounting can considerably reduce this value, but the size of this reduction is influenced by the actual discount rate chosen. As for the value assigned to the pavement materials, or terminal value, predicting the proportion of recovery or recycling of these materials on-site at the end of the analysis period is uncertain. If an alternative has reached its full life-cycle at the end of the analysis period, it is generally considered to have no remaining salvage value. If it has not completed a life-cycle, it is given a salvage value, which is usually determined by multiplying the last construction or rehabilitation cost, by the ratio of the remaining expected life-cycle to the total expected life.
TELERL x CC ValueSalvage
where, CC = Last construction or rehabilitation project costs ERL = Expected remaining life of the last construction or rehabilitation project TEL = Total expected life of the last construction or rehabilitation project
User Costs
It is difficult to determine whether or not one rehabilitation alternative results in a higher vehicle operating cost than another. Therefore, the user costs associated with each of the rehabilitation

79
alternatives shall be determined using only costs associated with user delay. This shall be based on the construction periods and the traffic volumes that are affected by each of the rehabilitation alternatives. Several studies have been performed that associate cost with the amount of time the user is delayed through a construction project. The method used is not as important as using the same method for each of the alternatives. The costs associated with user delays are estimated only if the effects on traffic differ among the alternatives being analyzed. For future rehabilitation work, user costs associated with delays can be substantial for heavily travelled roadways, especially when work is frequent. While there are several different sources for the dollar value of time delay, the recommended mean values and ranges for the value of time (in 2006 dollars) shown in Table A-3, are reasonable. Table A-3. Recommended dollar values per vehicle hour of delay (FHWA) (adjusted to 2006 dollars)2
Vehicle Class Value Per Vehicle Hour
Value Range
Passenger Vehicles $13.96 $12 to $16
Single-Unit Trucks $22.34 $20 to $24
Combination Trucks $26.89 $25 to $29
Other Costs
Surfacing types and characteristics influence the noise emitted on tire-to-pavement contact. If construction of a noise attenuation structure is planned, the cost of that structure must be included in the treatment costs of the alternative being analyzed. The issue of safety can be addressed similarly.
Discount Rate
"In a life-cycle cost analysis, a discount rate is needed to compare costs occurring at different points in time. The discount rate reduces the impact of future costs on the analysis, reflecting the fact that money has a time value". The discount rate is defined as the difference between the market interest rate and inflation, using constant dollars. Table A-4 shows recent trends in the real treasury interest rates for various analysis periods published in the annual updates to OMB Circular A-94 (OMB).

80
For all life-cycle cost analysis, a discount rate of four percent shall be used as is supported by the long term rates shown in Table A-4.
Analysis Period
The analysis period is the time period used for comparing design alternatives. An analysis period may contain several maintenance and rehabilitation activities during the life-cycle of the pavement being evaluated (Peterson). In general, the recommended analysis period coincides with the useful life of the most durable alternative. Table A-5 contains WSDOT recommended analysis periods.

81
Table A-4. Real treasury interest rates (OMB)
Year 3-Year 5-Year 7-Year 10-Year 30-Year
1979 2.8 3.4 4.1 4.6 5.4 1980 2.1 2.4 2.9 3.3 3.7 1981 3.6 3.9 4.3 4.4 4.8 1982 6.1 7.1 7.5 7.8 7.9 1983 4.2 4.7 5.0 5.3 5.6 1984 5.0 5.4 5.7 6.1 6.4 1985 5.9 6.5 6.8 7.1 7.4 1986 4.6 5.1 5.6 5.9 6.7 1987 2.8 3.1 3.5 3.8 4.4 1988 3.5 4.2 4.7 5.1 5.6 1989 4.1 4.8 5.3 5.8 6.1 1990 3.2 3.6 3.9 4.2 4.6 1991 3.2 3.5 3.7 3.9 4.2 1992 2.7 3.1 3.3 3.6 3.8 1993 3.1 3.6 3.9 4.3 4.5 1994 2.1 2.3 2.5 2.7 2.8 1995 4.2 4.5 4.6 4.8 4.9 1996 2.6 2.7 2.8 2.8 3.0 1997 3.2 3.3 3.4 3.5 3.6 1998 3.4 3.5 3.5 3.6 3.8 1999 2.6 2.7 2.7 2.7 2.9 2000 3.8 3.9 4.0 4.0 4.2 2001 3.2 3.2 3.2 3.2 3.2 2002 2.1 2.8 3.0 3.1 3.9 2003 1.6 1.9 2.2 2.5 3.2 2004 1.6 2.1 2.4 2.8 3.5 2005 1.7 2.0 2.3 2.5 3.1 2006 2.5 2.6 2.7 2.8 3.0 2007 2.5 2.6 2.7 2.8 3.0 2008 2.1 2.3 2.4 2.6 2.8 2009 0.9 1.6 1.9 2.4 2.7
Average 3.1 3.5 3.8 4.0 4.3

82
Table A-5. WSDOT recommended analysis periods by traffic level
Traffic Level Analysis Period (years) All WSDOT Highways 50
Risk Analysis
The deterministic approach to life-cycle costs involves the selection of discrete input values for the initial construction costs, routine maintenance and rehabilitation costs, the timing of each of these costs, and the discount rate. These values are then used to calculate a discrete single value for the present value of the specified project. The deterministic approach applies procedures and techniques without regard for the variability of inputs. An example of the deterministic approach is shown in below. Initial Cost = $1,000,000
Year 0 Year 10 Year 20 Year 30 Year 40
Rehabilitation costs = $500,000 Salvage value
= $50,000
Discount rate = 4 percent
$50,000(1.04)
$500,000(1.04)
$500,000(1.04)
$500,000(1.04)
$500,000$1,000,000PW 40302010
= $1,709,720 The deterministic approach is a viable method for determining life-cycle costs; however, life-cycle cost analysis contains several possible sources of uncertainty. In certain cases, the uncertainty factors may be sizeable enough to affect the ranking of the alternatives. To obtain more credible results, a systematic evaluation of risk should always be carried out. The primary disadvantage of the deterministic approach is that it does not account for the input parameter variability. The concept of risk comes from the uncertainty associated with future events – the inability to know what the future will bring in response to a given action today (FHWA). Risk analysis is concerned with three basic questions (FHWA):
1. What can happen? 2. How likely is it to happen? 3. What are the consequences of it happening?
Risk analysis answers these questions by combining probabilistic descriptions of uncertain input parameters with computer simulation to characterize the risk associated with future outcomes (FHWA). It exposes areas of uncertainty typically hidden in the traditional deterministic

83
approach to life-cycle cost analysis, and it allows the decision maker to weigh the probability of an outcome actually occurring (FHWA). The two most commonly used methods of assessing the risk are probabilistic analysis and sensitivity analysis. The probabilistic approach combines probability descriptions of analysis inputs to generate the entire range of outcomes as well as the likelihood of occurrence. Probabilistic analysis represents uncertainties more realistically than does a sensitivity analysis. Sensitivity analysis assigns the same weighting to all extreme or mean values, whereas probabilistic analysis assigns the lowest probability to extreme values. A probabilistic analysis is advocated, but if this is not possible, a sensitivity analysis at the very least should be carried out.
Probabilistic Analysis
The probabilistic approach takes into account the uncertainty of the variables used as inputs in the life-cycle cost analysis. The probability distribution is selected for each input variable, which are then used to generate the entire range of outcomes and the likelihood of occurrences for both the associated costs and the performance life. The procedure often used to apply a probability distribution is a “Monte Carlo Simulation”. The Monte Carlo Simulation is a computerized procedure that takes each input variable, assigns a range of values (using the mean and standard deviation of the input variable), and runs multiple combinations of all inputs and ranges to generate a life-cycle cost probability distribution. Using the probabilistic approach allows for the ability of determining the variability or “spread” of the life-cycle cost distributions and determining which alternative has the lower associated risk (see Figure A-4). An example of a probabilistic analysis is included in Appendix 5. WSDOT input values for the probabilistic analysis are contained in Appendix 4. By performing the Monte Carlo computer simulation, thousands, even tens of thousands of samples are randomly drawn from each input distribution to calculate a separate what-if scenario (FHWA). Risk analysis results are presented in the form of a probability distribution that describes the range of possible outcomes along with a probability weighting of occurrence (FHWA). With this information, the decision maker knows not only the full range of possible values, but also the relative probability of any particular outcome actually occurring (FHWA).

84
Pro
ba
bil
ity
Life-Cycle Cost
Alternative A
Alternative B
The narrower the distribution - the less associated risk
Figure A-4. Probability distribution
Sensitivity Analysis
Sensitivity analysis is a technique used to determine the influence of major input assumptions, projections, and estimates on life-cycle cost analysis results. In a sensitivity analysis, major input values are varied (either within some percentage of the initial value or over a range of values) while all other input values remain constant and the amount of change in results is noted (FHWA). An example of a sensitivity analysis is shown below.
Two pavement design strategies with discount rates that vary from two to six percent over a 35-year analysis period will be described.
Figure A-5 summarizes Tables A-6 and A-7 show the comparison of net present value at the various discount rates. For this example, Alternative 1 is more expensive at discount rates of five percent and lower, while Alternative 2 is more expensive at discount rates six percent and above.

85
Figure A-5. Sensitivity of net present value to discount rate Table A-6. Sensitivity analysis – alternative 1 (FHWA)
Activity Year Cost Net Present Value
2% 3% 4% 5% 6%
Construction 0 975 975 975 975 975 975
User Cost 0 200 200 200 200 200 200
Rehab #1 10 200 164 149 135 123 112
User Cost #1 10 269 220 200 182 165 150
Rehab #2 20 200 135 111 91 75 62
User Cost #2 20 361 243 200 165 136 113
Rehab #3 30 200 110 82 62 46 35
User Cost #3 30 485 268 200 150 112 85
Salvage 35 -100 -50 -36 -25 -18 -13
TOTAL NPV 2,266 2,081 1,934 1,815 1,718
1,600
1,700
1,800
1,900
2,000
2,100
2,200
2,300
2,400
2.0% 3.0% 4.0% 5.0% 6.0%Discount Rate
To
tal
Ne
t P
res
en
t V
alu
e
Alternative 1Alternative 2

86
Table A-7. Sensitivity analysis – alternative 2 (FHWA)
Activity Year Cost Net Present Value
2% 3% 4% 5% 6%
Construction 0 1,100 1,100 1,100 1,100 1,100 1,100
User Cost 0 300 300 300 300 300 300
Rehab #1 15 325 241 209 180 156 136
User Cost #1 15 269 200 173 139 129 112
Rehab #2 30 325 179 134 100 75 57
User Cost #2 30 361 199 149 111 84 63
Salvage 35 -217 -108 -77 -55 -39 -28
TOTAL NPV 2,112 1,987 1,886 1,805 1,739 A primary drawback of the sensitivity analysis is that the analysis gives equal weight to any input value assumptions, regardless of the likelihood of occurring (FHWA). In other words, the extreme values (best case and worst case) are given the same likelihood of occurrence as the expected value, which is not realistic (FHWA).
A.3 Project-Specific Details
After completing the pavement design analysis and the life-cycle cost analysis, evaluation of project-specific details must be identified when there are two or more viable alternatives. Finding the asphalt and concrete alternatives to be approximately equivalent, in regards to life-cycle cost, the Region must provide project specific details that support the selected pavement type. The fact that these are not easily quantified does not lessen their importance; in fact, these factors may be the overriding reason for making the final pavement type selection. These decision factors should be carefully reviewed and considered by WSDOT engineers most knowledgeable of the corridor and the surrounding environment. When reporting the project-specific details for pavement type selection, the Region must not use reasoning or examples that have already been taken into account within the pavement design analysis or the life-cycle cost analysis. Examples of reasoning that should not be presented in the project specific details include:
1. Availability of funds for the more expensive pavement type. 2. Supporting the choice for pavement type based on ESALs or average daily traffic (ADT)
that has already accounted for in the life-cycle cost analysis. 3. Supporting the choice for pavement type based on user delay that has already accounted
for in the life-cycle cost analysis. The Region should include the engineering reasons that suggest the selection of one pavement type over another, given that their life-cycle costs are approximately equivalent. Not all factors

87
will come into play on every project, nor will all factors have equal weight or importance on each project. Refer to Appendix 6 for a listing of these considerations.

88
APPENDIX B. DETAILED 10-YEAR CONCRETE PAVEMENT PLAN
WSDOT has about 2,400 lane-miles of portland cement concrete pavements. The majority of these pavements were constructed during the late 1950s and 1960s as part of the interstate highway construction program. At that time, the pavement design life for these roadways was estimated to be about 20 years. These pavements have far exceeded their original design lives and have carried several times the traffic loading originally anticipated.
Figure B-1. WSDOT concrete pavement lane-miles in 2010. In light of the rising cost of construction materials and budget constraints, many proposed concrete pavement projects were underfunded and either had to be reduced in scope, delayed or completed using temporary alternatives (such as asphalt overlays) which are not economically efficient in the long term. The amount of funding applied to concrete pavements has been minimal given the needs. The average annual budget for concrete pavement was $14 million per year (in 2007 constant dollars) for the 18-year period 1991 through 2008. This represents only 7.8 percent of the total preservation spending during that period, even though 28 percent of the total state vehicle miles traveled (VMT) is on concrete pavement. This lack of funding is beginning to be addressed, and with the help of American Recovery and Reinvestment Act (ARRA) stimulus funds $103 million was programmed for concrete pavements for the 2009-11 biennium. WSDOT still faces a very large backlog of concrete pavement rehabilitation and reconstruction needs throughout the state, most of which are critically important interstate system pavements. WSDOT must significantly increase the preservation funding for concrete pavements in order to maintain the road network in a satisfactory condition. Given the current condition of these concrete pavements, WSDOT is undertaking a major effort to identify both rehabilitation and reconstruction projects to determine the best long-term
0
50
100
150
200
250
300
350
400
450
0 5 10 15 20 25 30 35 40 45 50 55 60 65 70 75 80 85
Lan
e m
iles
Age (years since original construction or reconstruction)

89
approach for the concrete pavement network. This process includes identification of specific candidate projects, type of rehabilitation or reconstruction, and timing. This section describes the process to prepare a 10-year rehabilitation plan for the WSDOT concrete pavement network. This effort includes preparing the current WSDOT concrete pavement distress data, selecting the rehabilitation alternatives, updating pavement condition indexes, and listing of the 10-year concrete pavement rehabilitation plan.
B.1 Data Preparation
WSDOT monitors the performance of each 0.1 lane-mile pavement section until the data show they are projected to need rehabilitation or reconstruction. And the year is termed the Due Year. The small sections and their associated Due Years are then aggregated into project units, called Preservation Units that are programmed for rehabilitation or reconstruction.
WSPMS Data of Road Configurations, Location, Structure
The Washington State Pavement Management System (WSPMS) is a historical archive of WSDOT highway pavement data of road configuration, rehabilitation history, location, structure and traffic. Bridges were excluded, and the WSPMS contains no significant bridge-related information. The 2,400 lane-miles of WSDOT concrete pavements vary in age between 1 and 85 years, with the bulk (82 percent) being between 25 and 55 years old. All but a few hundred lane-feet are jointed plain concrete pavements (JPCP), with 95 percent originally constructed without dowels. Older WSDOT concrete pavements are generally 7 to 9 inches thick and built on a granular or asphalt-treated base of 3 to 10 inches. Concrete pavements built within the last 10 years tend to be about 12 to 13 inches thick on a dense, graded hot mix asphalt base of 3 to 5 inches. Joint spacing on all pavements is typically about 15 feet or less. About 77 percent of WSDOT concrete pavements have never been rehabilitated. Rehabilitation that has occurred has generally been limited to isolated diamond grinding projects, dowel bar retrofits (DBR) in severely faulted areas, or asphalt overlays. Most of the severely faulted undoweled concrete pavement (about 404 lane-miles) was retrofitted with dowel bars from 1994 to 2009. These DBR pavements are located on I-5 near Bellingham and Olympia, on I-90 between Snoqualmie Pass and Ellensburg, and on I-82 between Ellensburg and Yakima.
Pavement Distress Data
Normally, WSDOT surveys the outside lane distress and the data are stored in the WSPMS. In 2009, all-lanes of the state concrete pavement routes were surveyed. Cracking, faulting, patching and spalling are categorized in 2 to 3 severity levels. Cracking (multiple cracking, longitudinal cracking and transverse cracking)

90
MC Percent of slabs with multiple cracking LC Percent of slabs with 1 longitudinal cracking TC Percent of slabs with 1 transverse cracking Faulting (high, medium and low severities by the average faulting heights) HFLT Percent of panels with greater than ½” faulting at joints or cracks MedFLT Percent of panels with ¼” to ½” faulting at joints or cracks LowFLT Percent of panels with 1/8” to ¼” faulting at joints or cracks Patching (high, medium and low severities by the areas covered) HPT Percent of panels patched with 25 percent or more of panel surfaces covered MedPT Percent of panels patched with 10 to 24 percent of panel surfaces covered LowPT Percent of panels patched with 1 to 9 percent of panel surfaces covered Spalling (high and medium by the width of the spalling) HSP percent of joints and cracks with spalls 1greater than 3” wide MedSP percent of joints and cracks with spalls 1”- 3” in width The pavement condition survey also conducted the rutting and roughness data collection at the same time. From 2009, rutting data is collected using the new Institut National d’Optiqie (INO) laser-scan technology for better results.
B.2 Concrete Pavement Rehabilitation and Reconstruction Alternatives
Strategies to repair poorly performing concrete pavements fall into two categories: rehabilitation and reconstruction. Rehabilitations are temporary methods to preserve the existing pavement and extend the remaining service life. They can typically extend the pavement life 10 to 20 years, and consist of surface grinding, dowel bar retrofit, and asphalt overlay. Reconstruction involves the removal of the existing concrete and pavement reconstruction, sometimes including increasing the thickness and improving the pavement base. Reconstruction will create a new structure that will have 50 to 60 years of expected pavement life. New concrete pavements in Washington State are built with dowel bars for good load transfer at the joints. These pavements should last for 20 years with no need for maintenance beyond joint sealing or minor patching.
Grinding
Because Washington is one of a few states that still allow the use of studded tires, some of the need for early rehabilitation will be due to the damaging effect of the tire studs. The studs wear against the concrete, causing spalling of the surface and ruts in the wheelpaths. Once the ruts in the wheelpath exceed a certain trigger point, the concrete pavement is considered “due” for diamond grinding. This grinding should restore good pavement performance for another 10 to 15 years. One or possibly two grindings can be performed before the structure of the concrete pavement is negatively affected.

91
The rutting trigger value for the grinding procedure was changed from 0.4 inches to 0.5 inches because WSDOT made the move from the 3-point laser rut measurement to the new INO technology in 2009. Both 3-point and INO rut measurements were collected and analyzed from 2004 to 2008, and the INO results were found to be more consistent and accurate because INO measures many more points than the traditional 3-laser point. The annual average rut of all state concrete pavements with the INO was about 0.11 to 0.13 inches higher than the 3-point rut. Therefore, the grinding criterion is increased accordingly.
Dowel Bar Retrofit (DBR)
Concrete pavements that were constructed prior to 1994 in Washington State were built without dowel bars at the joints. These undoweled pavements are subject to “faulting” (the small drop in elevation at the joints that is noticeable by the driver). Not all undoweled pavements will develop faulting, but the State Materials Lab monitors the amount of joint faulting on each state route with the annual pavement condition survey. If the faulting is slight to moderate it can often be temporarily removed by diamond grinding. Another rehabilitation alternative for faulting is to perform dowel bar retrofit (DBR), which installs dowel bars at the joints and has been very successful at establishing load transfer and increasing the pavement life another 15 years or so. When grinding or DBR are performed, there are usually a small number of slabs (2 percent - 5 percent) that will be cracked and will need replacement. Once the amount of individual slab replacement exceeds 10 percent - 15 percent, then economically it becomes less expensive to do total reconstruction since the unit costs of small repairs are much higher than the economies achieved with reconstruction.
Reconstruction
Concrete pavements in Washington State should last 30 to 50 years before substantial cracking develops. Advanced cracking cannot be repaired by grinding or DBR. If cracking develops in isolated areas, then panels can be replaced, but if the surrounding pavement is over 50 years old, then it will just be a matter of time before more cracking develops to the point that total reconstruction is required. The planning for total reconstruction is important because as the pavement structure deteriorates, the potential increases for catastrophic (sudden and total) failure. When this happens, road closures and expensive emergency construction will cause serious problems for WSDOT and the public. Under certain conditions, it is not practical to perform grinding or DBR, yet the pavement does not need total reconstruction. In these circumstances a temporary asphalt overlay may be used to add another 10 to 15 years of pavement life until reconstruction is needed, or the asphalt requires rehabilitation.

92
B.3 Concrete Pavement Index
The pavement indexes are used to monitor the pavement overall conditions and indicate the pavement reconstruction and rehabilitation needs. Performance monitoring is based on tracking pavement condition indexes. When any of the indexes reaches a trigger value for rehabilitation, the year is termed the Due Year.
Previous Concrete Pavement Index
The previous concrete pavement indexes include Pavement Structure Condition (PSC) for cracking, faulting and settlement; Pavement Rutting condition (PRC) for rutting due to studded tire wear; and Pavement Profile Condition (PPC) for smoothness affected by surface conditions, faulting, and cracking). And they are defined as
PSC=100-18.6*EC0.43
EC=CREC+FLTEC+PTEC+JSEC CREC=0.24*MC1.16+0.0054*LV1.84+0.0054*TC1.84 FLTEC=HFLT+0.0915*MedFLT1.46+0.0015*LowFLT2.32 PTEC=0.103*HPT1.19+0.0079*MedPT1.55+0.00194*LowPT1.57
JSEC=0.075*HSP1.14+0.0061*MedSP1.27+0.0034*LowSP1.03
PRC=100-3.3*Rut1.18 PPC=IRI
PSC Pavement structural condition (Concrete) EC Total equivalent cracking CREC Slab cracking component of equivalent cracking FLTEC Faulting component of equivalent cracking PTEC Patching component of equivalent cracking PRC Pavement rutting condition Rut mm PPC Pavement profile condition IRI cm/km The rehabilitation trigger value for PSC and PRC is 50, and PPC is 350. Very few sections are triggered for rehabilitation by using this logic. The problems of using the scores are:
– None of the pavement index can indicate the proper rehabilitation method that should be taken according to the given pavement distress conditions.
– PSC values are too high, and it cannot accurately demonstrate the actual pavement structure condition.
New pavement indexes, then, were created to accurately present the pavement performance conditions and the proper rehabilitation method should be taken to maintain the pavements in satisfactory conditions. Performance monitoring is based on tracking pavement condition indexes that range in value from 100 (perfect) to 0 (complete failure). 50 is the “trigger” value for rehabilitation.

93
Rehabilitation Logic for the New Concrete Pavement Index
The logic for determining the rehabilitation options are now changed and defined for two groups of data according the rehabilitation history of the selected sections.
For Sections that have been DBRed before
Reconstruction, when – More than 15 percent cracked panels (multiple cracking), or – More than 60 percent of slabs have transverse or longitudinal cracking, or – More than 47 percent of slabs have high patch, or – More than 73 percent have high spalling
Grinding, when
– More than 25 percent of slabs have faulting more than 1/8”, or – Rutting greater than 0.5”, or – IRI greater than 220 inch/mile
For Sections never been DBRed before
Reconstruction, when – More than 15 percent cracked panels (multiple cracking), or – More than 60 percent of slabs have transverse or longitudinal cracking
DBR, when
– More than 10 percent of slabs have high faulting (or more than 25 percent of slabs have medium faulting; or more than 50 percent have low faulting), and
– pavement age < 50, and – all type of cracking or high patching < 10 percent (4 slabs per 35 slabs of each 0.1-
mile segment) Grinding, when
– More than 25 percent of slabs have faulting, or – Rutting greater than 0.5”, or – IRI greater than 220 inch/mile
New Concrete Pavement Index
Accordingly, the indexes for reconstruction and DBR should be separated. And, high level faulting should be considered differently from the low and medium levels, since the rehabilitation options are different. The new indexes include a reconstruction index, DBR index and grinding index.

94
Reconstruction Index
ReconIndex = PSC= 100-14.782*EMC0.45 EMC=MC+15*((LC+TC)/60+HPT/47+MedPT/100+LowPT/231
+HSP/73+MedSP/340) EMC Equivalent multiple cracking
Grind Index
GrindIndex = Min (PFCG, PRC, PPC) PFCG = 100-2*( HFLT+MedFLT+LowFLT)
PRC=100-147.4*Rutting1.18 (trigger value is 0.4 inches) PRC=100-113.288*Rutting1.18 (trigger value is 0.5 inches) PPC=100-0.05355*IRI1.268
Where, PFCG Pavement faulting condition for grinding. Rutting inch IRI inch/mile
DBR Index
The DBR index is only for sections that have never been dowel bar retrofitted before. It considers all level faulting.
DBR_Index = PFCD=100-18.6*( HFLT+MedFLT*10/25+LowFLT*10/50)0.43
Where, PFCD Pavement faulting condition for DBR.
B.4 Concrete Pavement Evaluation Process
Based on the all-lane survey data on all state concrete pavements in 2009, WSDOT is able to monitors the performance of each 0.1 lane-mile pavement section by checking the pavement indexes from 100 to 0. The indexes measure structure (faulting, cracking, settlement), rutting (due to studded tire wear), and smoothness (affected by surface conditions, faulting, and cracking). When any of these indexes reaches a value of 50, it has reached the “trigger” value for rehabilitation. The small sections and their associated Due Years are then aggregated into Preservation Units for rehabilitation or reconstruction.
Reconstruction and Risk of Catastrophic Failure
The concept of the different concrete pavement alternatives, and when they are applicable, is illustrated in Figure B-2. As the pavement ages, grinding and/or DBR with selective panel replacement are appropriate. Eventually the pavement will deteriorate to the point where

95
grinding and DBR are not appropriate, and the pavement condition will worsen until total reconstruction is required. Sometimes this can be a number of years, and it is advantageous to delay the large capital cost of reconstruction as long as possible. But as the figure shows, this is also the point in the life of the pavement structure when risk is higher, so it is important to closely monitor the condition of the pavement structure.
Figure B-2. Concrete pavement performance and rehabilitation/reconstruction alternatives.
Priorities for Concrete Pavement Expenditures
WSDOT is faced with a growing backlog of concrete pavement rehabilitation and reconstruction needs. With limited funds it is necessary to develop priorities for pavement preservation spending. The following priorities have been developed with regard to concrete pavement preservation:
– High Risk that Requires Reconstruction. This situation relates to a pavement in serious condition (PSC < 25), with the potential that catastrophic failure could develop. The only alternative to reconstruction is a temporary asphalt overlay.
– DBR and/or Grinding to Postpone Reconstruction. Figure B-2 indicates that after the pavement condition reaches a certain level of deterioration, further rehabilitation by DBR or grinding is not possible, and reconstruction will eventually be necessary.

96
The importance of this priority is to intercept the pavement condition before it reaches this point, and achieve another 10 to 20 years of pavement life before reconstruction.
– Grinding. Grinding is a very economical method of improving the surface of a concrete pavement. Priority is given to projects that can achieve another 10 to 15 years of pavement life at a relatively low cost.
Therefore, not only the pavement index but also the relative distresses should be considered when a proper rehabilitation method and timing is chosen (shown in Table B-1). Table B-1. Rehabilitation bins and priority levels
Bin Rehabilitation Method
Sub Bin
Strategy Priority Criteria
1 Reconstruction
1.1 High PSC≤25
1.2 High 25<PSC≤50, and MC≥10%
1.3 High 25<PSC≤50, and HPT≥40%
2 Do Nothing and wait until reconstruction
2.1 Med. 25<PSC≤50, and ΣCrack*≥10%
2.2 Med. 25<PSC≤50, and PFCD≤50
2.3 Low other PSC≤50
3 Grind and wait until reconstruction
3.1 Med. PFCD≤50, and ΣCrack*≥10%
3.2 Med. PSC≤50, and (PFCD≤50 or HPT≥40%)
3.3 Low PFCD≤50, and DBRed before
3.4 Low PFCD≤50, and Age>50
4 DBR & Slab Replacement 4.1 High PSC>50, PFCD≤50, 0<ΣCrack<10%,
HPT<10%, and Age<50
5 DBR 5.1 High PSC>50, PFCD≤50, ΣCrack=0, HPT=0, and Age<50
6 Grinding
6.1 High PRC≤50
6.2 Med. PFCG≤50
6.3 Med. PPC≤50
7 Do Nothing and wait until DBR 7.1 Med. 50<PFCD≤55, and PFCG≤50
Note: ΣCrack=MC+TC+LC

97
Developing Concrete Pavement Projects
The data collected during the annual pavement condition surveys, and the analysis of the data described above to determine the best rehabilitation/reconstruction plan, is used to develop capital projects that incorporate the recommended alternatives. This is often a complicated process, since pavement conditions are not uniform and there are multiple recommended rehabilitation activities within a road section. Figure B-3 helps to illustrate the complexity of this process, showing the various conditions within a project area. This data is evaluated in conjunction with other factors like construction procedures and economies of scale to develop project limits for larger construction projects. This section includes a detailed list of proposed projects for the 2011-2013 Biennium, and an estimate of scope for 2013 - 2021.
Figure B-3. Example data used to evaluate rehabilitation projects.
WSDOT Concrete Pavement Rehabilitation 2-Yr Plan (2011-13)
Various scenarios were considered for concrete pavements for the two-year period 2011 – 2013. Following a detailed process that evaluated the pavement cracking, roughness, rutting, faulting, and pavement age, alternative rehabilitation and reconstruction scenarios were evaluated for concrete pavements that had passed the Due Year. The most reasonable alternatives were selected that produced the longest pavement life for the lowest cost. The cost estimates are generated using the following generic costs for each project:
0
1
2
3
4
5
150 151 152 153 154 155 156 157 158 159 160
Lan
e n
um
be
r
Milepost
I-5 MP 150-160 (I) PCCP 2011-2013 Rehabilitation Plan
Reconstruction
Grinding
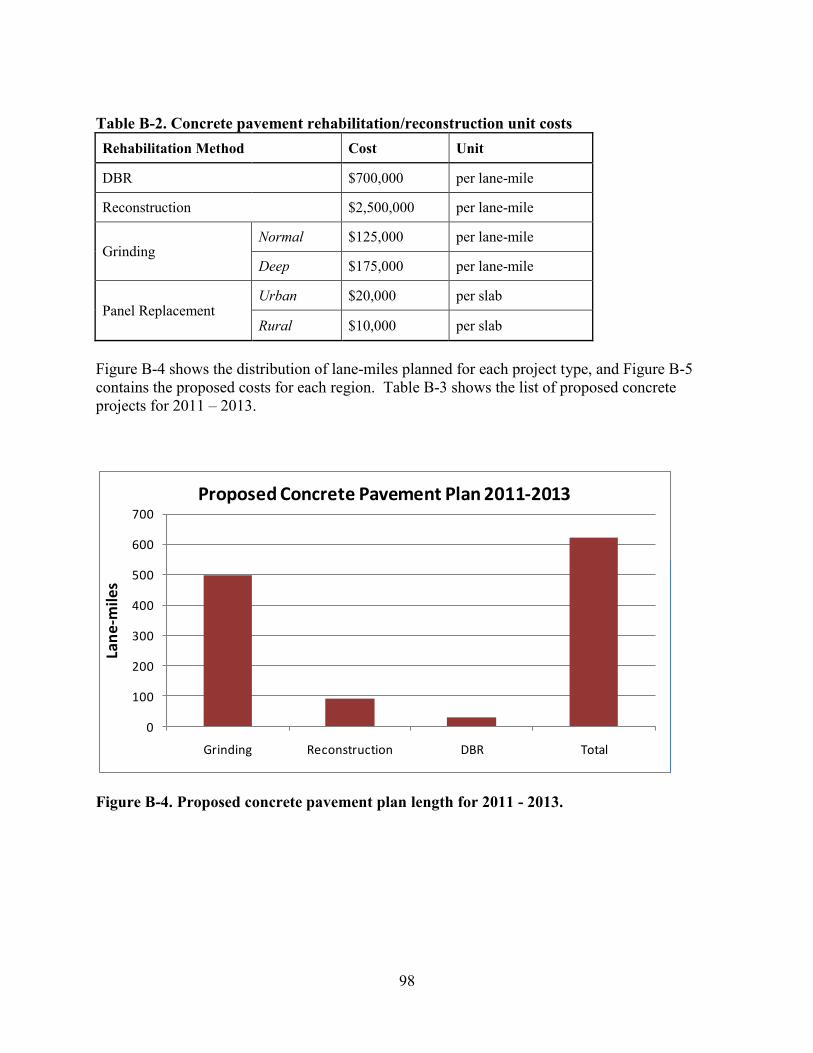
98
Table B-2. Concrete pavement rehabilitation/reconstruction unit costs Rehabilitation Method Cost Unit
DBR $700,000 per lane-mile
Reconstruction $2,500,000 per lane-mile
Grinding Normal $125,000 per lane-mile
Deep $175,000 per lane-mile
Panel Replacement Urban $20,000 per slab
Rural $10,000 per slab
Figure B-4 shows the distribution of lane-miles planned for each project type, and Figure B-5 contains the proposed costs for each region. Table B-3 shows the list of proposed concrete projects for 2011 – 2013.
Figure B-4. Proposed concrete pavement plan length for 2011 - 2013.
0
100
200
300
400
500
600
700
Grinding Reconstruction DBR Total
Lan
e-m
iles
Proposed Concrete Pavement Plan 2011-2013

99
Figure B-5. Proposed concrete pavement plan costs for 2011 - 2013.
$0
$100
$200
$300
$400
ER NW OR SC SW Total
$ (m
illi
on
)
Region
Proposed Concrete Pavement Plan Cost 2011-2013

100
Table B-3. Proposed concrete pavement rehabilitation plan for 2011 - 2013
ID Region SR Begin SRMP
End SRMP
Dir Lane-miles
Estimated Cost ($ million)
Cumulative Cost ($ million)
1 Olympic 5 131.15 135.28 I 12.39 3.0 3.0
2 Northwest 405 12.09 16.39 I 17.20 10.7 13.7
3 Southwest 411 0.00 1.57 I/D 6.28 5.2 18.9
4 Olympic 5 131.15 135.22 D 13.86 3.2 22.1
5 Northwest 518 3.06 3.75 I/D 4.14 0.5 22.6
6 Northwest 900 6.91 9.87 I/D 11.84 5.6 28.2
7 Northwest 164 8.06 10.05 D 12.67 0.6 28.8
8 Northwest 5 149.70 157.75 D 20.93 35.1 64.0
9 Eastern 195 87.80 95.79 D 16.00 10.0 74.0
10 Northwest 5 144.69 156.00 I 52.77 43.4 117.4
11 South Central 90 52 55.5 I 10.85 7.2 124.6
12 South Central 90 79.41 102.39 D 16.76 62.2 186.8
13 South Central 90 67.40 69.52 I 4.24 5.7 192.5
14 Southwest 205 27.10 31.36 I/D 29.82 6.7 199.2
15 South Central 90 33.00 52.00 I 57.00 17.6 216.8
16 Northwest 5 209.46 219.60 I 14.24 10.2 227.0
17 South Central 90 67.00 69.49 D 7.47 7.0 234.0
18 Northwest 90 18.11 33.20 I 45.27 18.6 252.6
19 Eastern 195 53.53 62.15 I/D 16.90 13.6 266.2
20 Eastern 90 284.41 287.99 D 12.80 2.2 268.5
21 Eastern 90 284.41 287.99 I 12.67 2.2 270.7
22 Eastern 27 0.20 0.87 I/D 2.68 1.3 271.9
23 South Central 90 33.00 52.00 D 57.00 9.8 281.7
24 Northwest 90 18.11 33.20 D 45.27 22.1 303.8
25 South Central 90 79.42 102.39 I 48.07 62.2 366.0
26 Northwest 5 192.46 194.79 D 10.49 1.3 367.3
27 Northwest 164 8.06 10.05 I 12.70 0.6 367.9
28 Northwest 5 209.09 219.69 D 27.32 8.5 376.4
29 Olympic 705 0.54 1.04 I/D 2.85 1.4 377.8
30 Eastern 395 93.18 93.28 I 0.20 0.7 378.5
31 Northwest 5 191.57 194.79 I 9.84 1.2 379.7
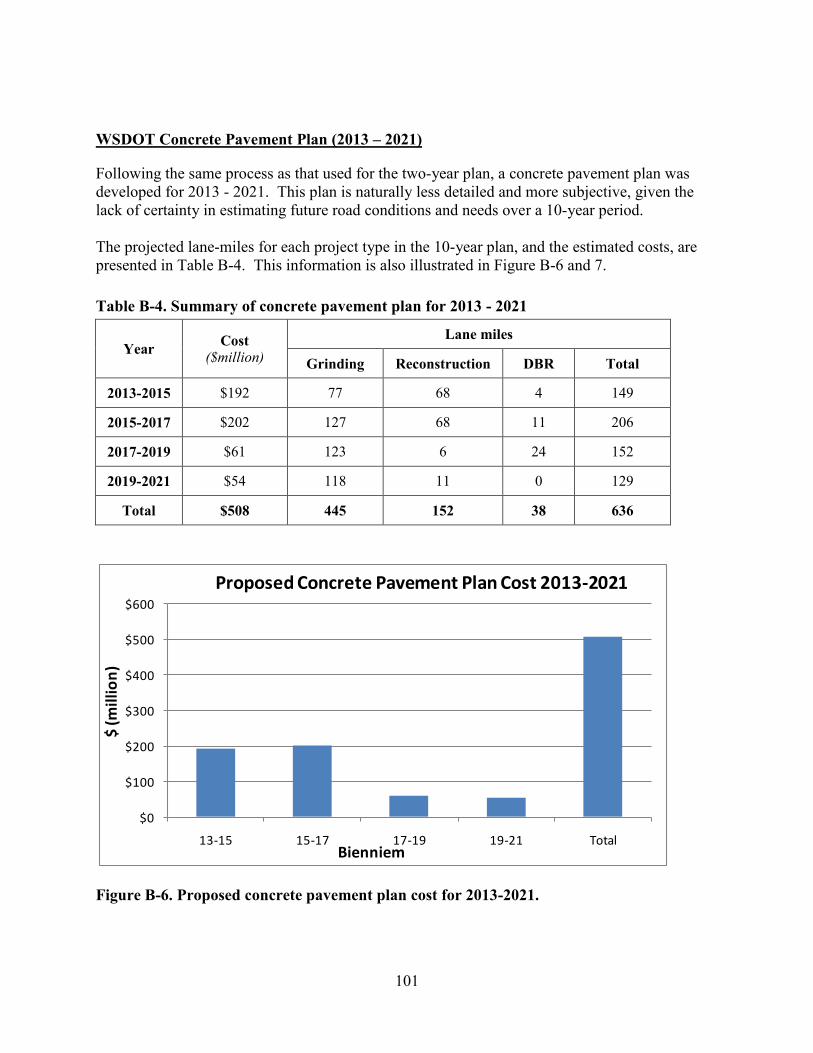
101
WSDOT Concrete Pavement Plan (2013 – 2021)
Following the same process as that used for the two-year plan, a concrete pavement plan was developed for 2013 - 2021. This plan is naturally less detailed and more subjective, given the lack of certainty in estimating future road conditions and needs over a 10-year period. The projected lane-miles for each project type in the 10-year plan, and the estimated costs, are presented in Table B-4. This information is also illustrated in Figure B-6 and 7. Table B-4. Summary of concrete pavement plan for 2013 - 2021
Year Cost ($million)
Lane miles
Grinding Reconstruction DBR Total
2013-2015 $192 77 68 4 149
2015-2017 $202 127 68 11 206
2017-2019 $61 123 6 24 152
2019-2021 $54 118 11 0 129
Total $508 445 152 38 636
Figure B-6. Proposed concrete pavement plan cost for 2013-2021.
$0
$100
$200
$300
$400
$500
$600
13-15 15-17 17-19 19-21 Total
$ (m
illi
on
)
Bienniem
Proposed Concrete Pavement Plan Cost 2013-2021

102
Figure B-7. Distribution of project types in 2013 – 2021 concrete pavement plan. The process of full reconstruction of concrete mainline pavement could have potential complications. Even though WSDOT has negotiated with FHWA that pavement rehabilitation does not require the full development of highway standards, this could be complicated when doing full reconstruction. Some areas that could heavily inflate project costs if an expanded scope was required would be: stormwater (retention and treatment), Intelligent Transportation Systems (ITS), electrical, added capacity and operation improvements, drainage, noise walls, safety, or other areas. The strategy presented in this section was developed for review and refinement. It shows an enormous need for concrete pavement restoration over the next several years. The proposed plan for the 11-13 Biennium has been developed with carefully collected data and detailed analysis. For the future biennia through 2021, the estimates are developed more subjectively and are therefore only approximations.
0
100
200
300
400
500
13-15 15-17 17-19 19-21 Total
Lan
e-m
iles
Bienniem
Proposed Concrete Pavement Plan 2013-2021
Grinding
Reconstruction
DBR

103
APPENDIX C. PROPOSED 2-YEAR PLAN FOR FLEXIBLE
PAVEMENTS
C.1 Proposed Asphalt Pavement Plan for 2011-2013 Biennium
Region SR Begin SRMP
End SRMP Dir PIN
Number Lane-miles
Estimated Cost
($million)
Cumulative Cost
($million) Eastern 90 270.13 275.55 B 609027Y 21.38 3.4 3.4
Southwest 5 0.27 2.54 B 400513P 13.62 4.1 7.6
Northwest 9 4.03 6.89 B 100904A 9.27 3.4 10.9
South Central 241 7.44 8.33 B 524102J 2.42 0.8 11.7
Eastern 195 29.14 37.02 B 619502J 18.4 3.0 14.6
South Central 395 16.85 20.54 B 539503S 2.95 2.6 17.2
Olympic 8 7 17.25 B 300821A 5.8 1.5 18.7
South Central 97 133.95 134.9 B 509703U 4.33 1.6 20.3
Eastern 27 83.1 87.7 B 602708F 18.38 4.2 24.5
Northwest 9 26.83 27.07 B 100927E 0.74 0.7 25.2
Eastern 2 271.02 275.24 B 600227L 9.12 1.6 26.8
South Central 12 432.54 434.1 B 501214J 5.58 2.1 28.9
Northwest 522 19.02 20.5 B 152235G 3.9 1.8 30.7
Eastern 291 5.24 11.07 B 629100G 10.06 1.7 32.3
Olympic 107 6.82 7.87 B 310703A 2.08 0.6 32.9
Eastern 2 306.05 314.94 B 600230G 20.19 3.2 36.1
North Central 90 137.82 148.45 B 209000I 31.89 7.6 43.7
South Central 14 175 180.77 B 501401N 11.54 4.8 48.5
Eastern 2 263.45 271.02 B 600226N 15.14 2.3 50.8
Eastern 270 0 3.88 B 627000U 12.08 3.3 54.1
South Central 12 366.3 368 B 501214K 3.71 1.5 55.6
South Central 82 82.14 90.17 I 508208L 16.06 8.1 63.7
Olympic 3 0 3.65 B 300301B 6.41 1.5 65.2
Northwest 5 179.07 179.52 B 100530F 2.59 1.4 66.6
Northwest 90 9.72 14.32 B 109051C 11.5 9.6 76.2
Southwest 504 17.86 51.81 B 450410A 63.34 5.7 81.9
South Central 97 62.62 69.28 B 509703V 29.14 5.7 87.6
Northwest 203 5.28 23.77 B 120306B 20.41 6.0 93.7
Olympic 512 0 8.77 B 351236A 14.34 4.9 98.6
Olympic 19 9.5 13.99 B 301917A 8.98 1.8 100.4
Olympic 3 42.7 52.75 B 300399A 7.15 1.9 102.3
South Central 82 36.95 38.78 B 508208K 3.66 1.0 103.3
South Central 906 0.07 2.65 B 590601G 5.44 2.1 105.4
Northwest 18 19.54 21.04 D 101821F 3.23 1.6 107.0

104
Region SR Begin SRMP
End SRMP Dir PIN
Number Lane-miles
Estimated Cost
($million)
Cumulative Cost
($million) Northwest 202 4.51 13.94 B 120205B 4.42 2.2 109.2
Olympic 16 4.98 29.19 I 301606B 3.65 1.1 110.4
North Central 17 43 50.4 B 201700N 14.8 0.9 111.3
C.2 Proposed Chip Seal (BST) Pavement Plan for 2011-2013 Biennium
Region SR Begin SRMP
End SRMP
Dir PIN
Number Lane-miles
Estimated Cost
($million)
Cumulative cost
($million)
South Central 97 134.9 137.41 B 509704R 4.76 0.2 0.2
South Central 12 411.26 413.36 B 501214A 6.28 0.3 0.5
South Central 12 358.2 366.3 B 501214C 16.20 0.7 1.1
South Central 970 0.75 10.08 B 597001S 18.81 0.7 1.9
South Central 12 413.36 418.96 B 501214B 16.80 0.6 2.5
South Central 193 0.51 3.09 B 519301C 5.16 0.2 2.7
Eastern 2 207.78 220.88 B 600220R 26.20 0.7 3.4
Olympic 101 296.65 299.5 B 310101M 6.00 0.5 3.9
Olympic 113 0 9.98 B 311303A 19.92 1.4 5.3
South Central 127 0.05 9.65 B 512701G 19.18 1.1 6.4
Olympic 110SP 7.8 10.47 B 311006B 5.22 0.4 6.8
South Central 241 9.05 12.7 B 524102L 7.30 0.4 7.2
Olympic 119 7.13 10.93 B 311905A 7.60 0.6 7.8
Olympic 706 0.72 8.45 B 370605A 12.74 1.0 8.8
Eastern 211 0.11 15.11 B 621100U 29.98 0.1 8.9
Olympic 110 0 11.1 B 311006A 22.08 1.4 10.2
Olympic 112 0 20.55 B 311238B 36.68 2.5 12.8
Olympic 101 192 193.26 B 310188M 2.52 0.3 13.1
North Central 97 314.73 326.41 B 209700P 23.36 1.3 14.4
Eastern 278 0 5.5 B 627800U 11.00 1.1 15.5
Olympic 101 207 219.22 B 310102N 20.76 1.5 17.0
North Central 20 209 227.47 B 202000F 36.94 1.8 18.8
Eastern 26 61.58 83.15 B 602606L 43.10 1.3 20.2
Eastern 26 102.76 116.75 B 602610M 27.90 0.8 20.9
Eastern 20 404.41 422.92 B 602040O 36.92 0.8 21.7
Eastern 21 0.1 24.2 B 602111A 48.28 1.1 22.8
Eastern 261 15.2 29.39 B 626101P 28.34 0.6 23.4
Eastern 261 35.83 44.85 B 626103F 18.04 0.4 23.7
Eastern 271 0 8.37 B 627100K 16.74 0.3 24.1

105
Region SR Begin SRMP
End SRMP
Dir PIN
Number Lane-miles
Estimated Cost
($million)
Cumulative cost
($million)
Eastern 274 0 1.92 B 627400K 3.84 0.1 24.1
North Central 174 0 21.44 B 217400C 45.40 2.0 26.2
Eastern 27 24.78 68.73 B 602702E 87.60 3.0 29.2
Eastern* 90 191.89 208.16 B 609019C 65.08 0.2 29.4
North Central 20 261.95 274.66 B 202000G 25.42 0.5 29.9
South Central 97 58.29 61.44 B 509703R 6.30 0.3 30.2
Northwest 410 26.02 57.59 B 141018B 45.26 4.7 34.9
Eastern 904 12.74 16.83 B 690401W 8.18 0.0 34.9
South Central 12 345 348.3 B 501214E 6.60 0.3 35.2
South Central 12 306.9 311.31 B 501214D 9.89 0.4 35.6
South Central 12 348.3 351.15 B 501214I 9.08 0.4 35.9
South Central 12 368 372.91 B 501214F 9.82 0.4 36.3
South Central 97 35.93 48.46 B 509703Q 24.94 0.9 37.2
South Central 223 0 2.1 B 522301F 4.52 0.2 37.4
South Central 410 78.58 92.04 B 541001U 26.68 1.0 38.4
South Central 241 12.7 20.18 B 524102M 14.96 0.6 39.0
South Central 24 23.05 30.4 B 502403N 14.80 0.6 39.6
South Central 124 22.62 28.65 B 512402H 11.89 0.5 40.0
South Central 410 69.21 78.57 B 541001Q 18.48 0.7 40.8
South Central 410 92.07 104.58 B 541001V 25.77 1.0 41.7
South Central 12 418.96 424.99 B 501214G 11.92 0.5 42.2
Eastern* 90 293.15 293.55 B 609029O 0.40 0.0 42.2
South Central 128 0.5 2.24 B 512801H 3.48 0.1 42.3
South Central 24 35.55 38.71 B 502403Q 6.16 0.3 42.6
Eastern* 90 239.12 265.84 B 609023U 104.21 0.3 42.9
South Central 10 88.29 104.45 B 501001M 34.01 1.3 44.2
Eastern 902 0.15 3.85 B 690200K 7.40 0.2 44.4
Eastern 231 31.08 40 B 623103L 17.84 0.9 45.3
Eastern 904 0.18 9.1 B 690400K 17.84 0.4 45.8
Eastern 25 0 38.1 B 602500U 75.48 1.8 47.5
Eastern 23 43.82 53.99 B 602304N 20.20 0.7 48.2
Eastern 28 103.15 117.7 B 602810X 29.10 0.7 48.9
Eastern 231 0 28.11 B 623100K 55.96 1.9 50.8
Eastern 23 0 43.59 B 602300U 87.14 2.8 53.6
North Central 097AR 214.29 232.49 B 209790I 41.31 0.3 53.9
North Central 26 0.47 18.88 B 202600B 41.15 2.2 56.1
North Central 20 288.87 297.23 B 202000I 16.72 1.5 57.6
Note: * projects are fog seal only.

106
APPENDIX D. PERMEABLE PAVEMENT LITERATURE REVIEW
D.1 Introduction
Water quality regulations demand increasing attention to both the amount and quality of the water leaving paved surfaces. Consequently, the Washington State Department of Transportation (WSDOT) is interested in implementing new techniques for controlling the runoff from highways, parking lots, rest areas and other impervious surfaces that are within its jurisdiction. Permeable pavements, although not a new technique, are being implemented around the world as a means of decreasing the volume and pollutant load of runoff from highways, parking lots, residential streets, and other paved surfaces.
Senate Bill 6381
Senate Bill 6381 (2010) Section 304 (7b) directed the Washington State Department of Transportation to “work with the Department of Ecology (ECY), the County Road Administration Board (CRAB), and the Transportation Improvement Board (TIB) to explore and explain the potential use of permeable asphalt and concrete pavement in state highway construction as an alternative method of storm water mitigation and the potential effects on highway pavement replacement needs.”
Purpose of Report
This report documents the findings of a search of the available literature concerning the use of permeable pavement.
Organization of Report
The report begins with a description of what constitutes a permeable pavement and how the design of such pavements differs from the design of conventional pavements. This difference is important in the understanding of how permeable pavements may or may not be integrated into our current highway system. A review of the literature on permeable pavements is the next portion of the report and it is followed by descriptions of the types of permeable pavement installations sound in the Pacific Northwest. A description of permeable pavement built at high volume traffic and heavy truck loading sites is the next section of the report. This section is included to show how these sites differ in orders of magnitude from the volumes and truck loadings at typical Washington urban highway sites. The last section of the report includes minutes from two meetings held with representatives of the ECY, CRAB, and TIB to discuss the use of permeable pavements in Washington. This section also includes a letter from CRAB outlining their position on the use of permeable pavements and a link to the TIB Project Selection Criteria which includes points for the use of permeable pavements.
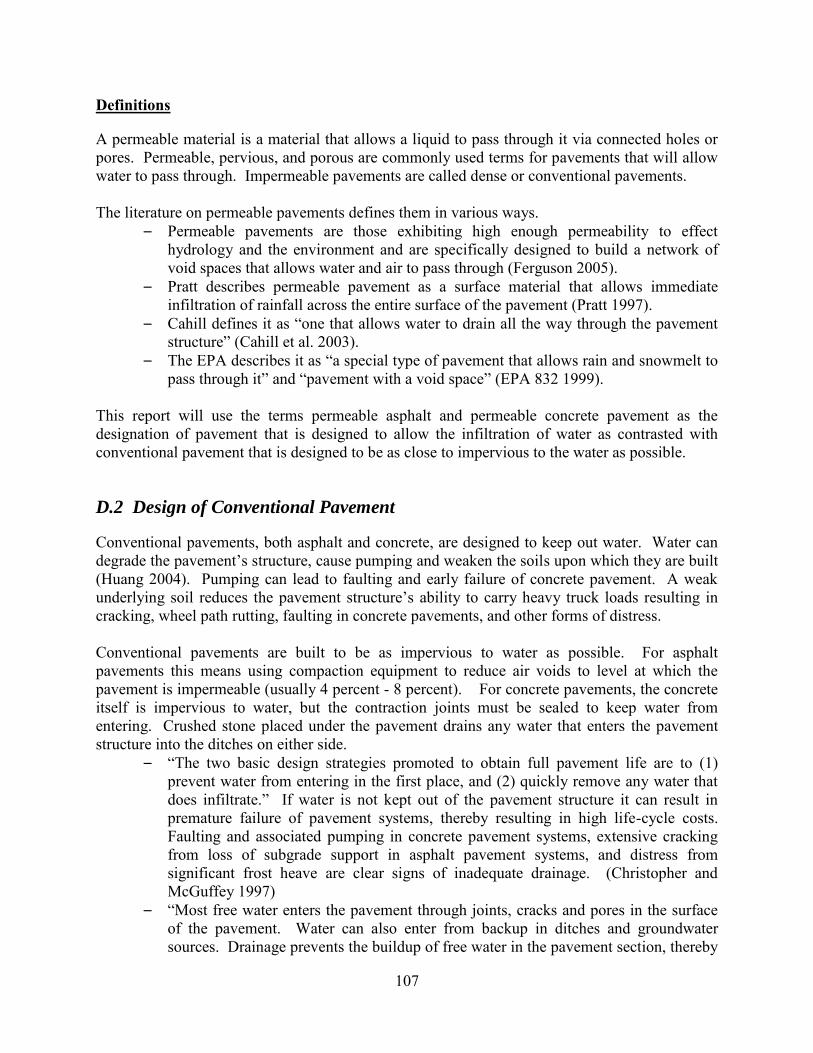
107
Definitions
A permeable material is a material that allows a liquid to pass through it via connected holes or pores. Permeable, pervious, and porous are commonly used terms for pavements that will allow water to pass through. Impermeable pavements are called dense or conventional pavements. The literature on permeable pavements defines them in various ways.
– Permeable pavements are those exhibiting high enough permeability to effect hydrology and the environment and are specifically designed to build a network of void spaces that allows water and air to pass through (Ferguson 2005).
– Pratt describes permeable pavement as a surface material that allows immediate infiltration of rainfall across the entire surface of the pavement (Pratt 1997).
– Cahill defines it as “one that allows water to drain all the way through the pavement structure” (Cahill et al. 2003).
– The EPA describes it as “a special type of pavement that allows rain and snowmelt to pass through it” and “pavement with a void space” (EPA 832 1999).
This report will use the terms permeable asphalt and permeable concrete pavement as the designation of pavement that is designed to allow the infiltration of water as contrasted with conventional pavement that is designed to be as close to impervious to the water as possible.
D.2 Design of Conventional Pavement
Conventional pavements, both asphalt and concrete, are designed to keep out water. Water can degrade the pavement’s structure, cause pumping and weaken the soils upon which they are built (Huang 2004). Pumping can lead to faulting and early failure of concrete pavement. A weak underlying soil reduces the pavement structure’s ability to carry heavy truck loads resulting in cracking, wheel path rutting, faulting in concrete pavements, and other forms of distress. Conventional pavements are built to be as impervious to water as possible. For asphalt pavements this means using compaction equipment to reduce air voids to level at which the pavement is impermeable (usually 4 percent - 8 percent). For concrete pavements, the concrete itself is impervious to water, but the contraction joints must be sealed to keep water from entering. Crushed stone placed under the pavement drains any water that enters the pavement structure into the ditches on either side.
– “The two basic design strategies promoted to obtain full pavement life are to (1) prevent water from entering in the first place, and (2) quickly remove any water that does infiltrate.” If water is not kept out of the pavement structure it can result in premature failure of pavement systems, thereby resulting in high life-cycle costs. Faulting and associated pumping in concrete pavement systems, extensive cracking from loss of subgrade support in asphalt pavement systems, and distress from significant frost heave are clear signs of inadequate drainage. (Christopher and McGuffey 1997)
– “Most free water enters the pavement through joints, cracks and pores in the surface of the pavement. Water can also enter from backup in ditches and groundwater sources. Drainage prevents the buildup of free water in the pavement section, thereby

108
reducing the damaging effects of load and environment. The gains in design life are significant.” It is impossible to prevent water from entering a pavement so it has become essential to provide a system to remove the water. The two most commonly used methods of removing water are to use permeable bases and edge drains either separately or in combination. (Christopher and McGuffey 1997)
– “Good drainage is defined as the condition where the internal-drainage characteristics are such that there will be no accumulations of water that will develop soft areas in the subgrades.” (Yoder 1959)
Summary on Design of Conventional Pavement
– Conventional pavement system are designed to exclude water by first using an impermeable surface layer to keep rainfall out and using a layer of crushed stone to allow any water that gets into the structure to drain off into shoulder ditches.
D.3 Introduction to Literature Review
The following review of the literature describes the types of permeable pavements, how they are designed, where they can be used, what limitations there are to their use, their advantages and disadvantages, keys to successful installations, overall performance, stormwater treatment performance, maintenance requirements, and costs. The literature review is followed by a pictorial review of some of the permeable pavement installation in the Northwest.
Types of Permeable Pavements
There are two types of permeable pavements; (1) permeable asphalt, and (2) permeable concrete. Each can be constructed as part of a stormwater management system that includes a layer of crushed rock that stores stormwater. Permeable pavement can also be used as an overlay over conventional non-pervious pavement or as a shoulder treatment. When used as a stormwater management system the multi-layer structures treat the water and infiltrate it directly into underlying soils. When used as an overlay permeable pavements have been found to treat the water as it flows through the pavement to eventually run off to the shoulder of the roadway. Asphalt permeable pavement overlays are called open-graded friction courses (OGFC). OGFC’s have been used since the 1980’s by many states, including Washington, to drain the water off of the surface of the pavement which reduces tire spray thereby increasing visibility, improving traction, and reducing noise and glare. OGFC’s are also used by many states, including trials in Washington, to mitigate tire/pavement noise. The void spaces in the surface of the pavement help to dissipate the noise produced by vehicle tires. The use of permeable concrete as an overlay is very new and has only been attempted in Minnesota. It is one of the experimental cells on the MnROAD Low-volume Road. MnROAD is a test track with a high speed, high volume loop and the aforementioned low speed low-volume loop. Traffic from Interstate 94 can be diverted onto the high speed high volume loop to

109
provide real traffic loadings. The Low-volume Road is traversed only by a loaded semi-trailer truck that makes 80 circuits per day.
Permeable Asphalt Pavement
Permeable asphalt pavement is produced in a standard asphalt plant and placed on the roadway the same as conventional asphalt pavement. It differs from conventional asphalt in that there are very few fine aggregate particles in the mix leaving the remaining particles all very similar in size. This is called gap grading and as the name implies there are gaps between the sizes of the aggregates. The similar sizes of the aggregates do not allow them to be compacted into a dense final pavement. It is similar to a container filled with marbles of all the same size which cannot be packed together without leaving holes for air or water to pass. A permeable asphalt pavement will allow water to run through it as and not puddle on the surface as shown in Figure D- 1. The literature describes permeable asphalt pavement as:
– Permeable asphalt is manufactured in a standard asphalt plant using similar aspects to conventional dense asphalt except fewer fines are used making it permeable to water (Cahill et al. 2005).
– Jackson describes permeable asphalt as an open-graded mix with little or no sand or dust having a void content of 16 percent or more as compared to typical dense asphalt pavement’s 2 to 3 percent void content (Jackson 2003).
– The voids typically range between 18 and 20 percent in a permeable asphalt pavement (Ferguson 2005).
– It is an open-graded mixture comprised of coarse aggregate, fines aggregate, asphalt binder, and stabilizing additives. The stabilizing additives attempt to counteract the phenomena known as “drain-down.” Binder tends to slump off or “drain-down” from the aggregate at production and construction temperatures. This leaves the aggregate with either too little or too much binder. Too little binder and the aggregate breaks loose and ravels and too much binder and the pavement becomes slick or has less frictional grip (Cooley et al. 2009).
Figure D-1. Permeable asphalt pavement. (National Asphalt Paving Association)

110
Permeable Concrete Pavement
Permeable concrete pavements are a mixture of portland cement, coarse single size aggregate, little or no sand, admixtures and water. They can be produced in a standard ready mix plant but are placed using special techniques unlike conventional concrete pavement as described later in this report. The permeable concrete allows air and water to pass through (Figure D-2). The literature describes it as:
– Tennis described permeable concrete as a mixture of water, cement, and aggregate without fines. It uses the same materials as conventional concrete with the exception that the fine aggregate is typically eliminated and the size distribution of the coarse aggregate is kept narrow allowing for relatively little particle packing (Tennis et al. 2004).
– The American Concrete Institute (ACI) describes permeable concrete as an open-graded mixture of portland cement, coarse aggregate, little or no fines, admixtures, and water. A zero slump mixture that hardens into a material of connecting pours sized between 0.08 to 0.32 inches capable of passing water (ACI 2006).
– “Void ratio of typical pervious concrete ranges from 14 percent to 31 percent and permeability ranges from 0.0254 to 0.609cm/sec” (Schaefer et al., 2006).
– Ferguson indicates that permeable concrete is chemically identical to dense concrete with the difference being that permeable concrete is made with open-graded aggregate, which creates the voids in the concrete structure (Ferguson 2005).
– Joung and Grasley state that permeable concrete has lower compressive and flexural strength compared to ordinary concrete. The high porosity of permeable concrete and lack of fine aggregate are the cause of these lower strengths (Joung and Grasley 2008).
Figure D-2. Permeable concrete pavement. (TecEco Pty. Ltd.)

111
Summary of the Types of Permeable Pavement
– There are two types of permeable pavement, asphalt and concrete. – There are two types of installations, stormwater management systems that allow
water to pass all the way through the pavement to infiltrate into the underlying soil and OGFC’s which that treat water as it passes through the pavement to eventually run of to the shoulder.
– Permeable asphalt pavement is mixed and placed the same as conventional asphalt pavement.
– Permeable concrete pavements are mixed like conventional concrete pavements, but are generally placed by hand instead of by machine.
– The aggregates used in both permeable asphalt and permeable concrete are all similar in size resulting in gaps between aggregates that allow water to pass through.
– The air void content of permeable asphalt pavement ranges from 16-20 percent and for permeable concrete 14-31 percent.
Permeable Pavement Design
A permeable stormwater system consists of pavement with its fines screened out allowing water to flow through it. Beneath the pavement is a uniformly graded bed of washed aggregate. The void space within the bed is about 40 percent of the aggregates volume. Stormwater flows through the permeable asphalt pavement, is stored in the void spaces of the stone bed, and then infiltrates into the underlying soil at its natural rate. A layer of geotextile filter fabric is placed between the stone bed and the underlying soils to keep fines from clogging the soils (Cahill et al. 2005). Typical cross sections for both types of permeable pavement are shown in Figure D-3 and Figure D-4.
– Nearly all permeable pavement types have the same general make-up (Hunt & Collins 2008).
– Permeable pavement is the key component that makes the system possible, but each component is necessary and is optimized to perform a certain special purpose. Components that make up the permeable pavement stormwater system are permeable pavement, base and subbase courses pavement, filter layers, reservoir, subgrade, and lateral outlets. The pavement is composed of the surface, base, and subbase layers. Surface permeable pavement layer receives the traffic load directly. It provides initial load support, the abrasive wearing surface, appearances, and ride quality. It is made from relatively expensive materials that disintegrate over time. The base and subbase course pavements layer are beneath the surface pavement layer and above the subgrade. It transfers and spreads the surface pavement layer load through the course base pavement to the subgrade. A subbase course pavement layer is added to extend the thickness base pavement layer. The reservoir is any portion of the pavement that stores and transmits the infiltrated runoff. The subgrade contains the underlying soils beneath the pavement courses that ultimately receive the traffic load. Sometimes, a filter layer is inserted between pavement layers to segregate, filter, or to maintain the structural integrity or porosity. Lateral drainage outlets are often used for overflow or outlet control (Ferguson 2005).

112
– The storage bed thickness for a permeable asphalt pavement is typically 18 to 36 inches depending on storage, frost depth, and grading requirements, has a 40 percent void space, and provides considerable structural base improving the permeable pavement performance over conventional pavement (Cahill et al. 2003).
– The storage bed for a permeable concrete pavement falls in the same range as the permeable asphalt pavement although EPA recommends a minimum thickness of six inches (EPA 832 1999).
– “A typical cross-section of the pervious pavement used in parking lots consists of a pervious concrete layer with a thickness of 4 to 6 inches, a permeable base with a thickness up to 18 inches, and a permeable subgrade. If the subgrade permeability is low, drainage pipes can be used to drain water, but drainage pipes increase the cost of the system” (Schaefer et al. 2006).
Figure D-3. Typical permeable asphalt pavement section (diagram adapted from US EPA)
Figure D-4. Typical permeable concrete pavement section (diagram adapted from US EPA).

113
Summary of Permeable Pavement Design
– All permeable pavements have the same basic design with a top pavement layer, a base/subbase stone aggregate layer, a filter fabric separator layer, and an uncompacted subgrade. A choker course may be used between the subbase and pavement to facilitate construction of the pavement.
– The thickness of the top pavement layer is from two to four inches for permeable asphalt and from four to eight inches for permeable concrete.
– The thickness of the base/subbase storage layer is from 18 to 36 inches for permeable asphalt and a minimum of six inches for permeable concrete.
– The base/subbase storage layer has an air void content of 40 percent.
Permeable Pavement Applications
Most of the literature supports the use of permeable asphalt and concrete pavements for light traffic and light load applications. Primary uses are for parking lots, sidewalks, alleys, driveways, residential streets, and roadway shoulders.
Permeable Asphalt
– Permeable asphalt pavement is especially well suited for parking lot areas as an effective, affordable, and long lasting stormwater management and development tool. It has been used as a successful solution to mitigate the impervious surface impacts of pavements at small and large educational, government, and commercial sites (Cahill et al. 2003).
– Light trafficked areas such as parking lots and low-volume roads are good opportunities to exchange permeable pavement for typical pavement if suitable site conditions exist (EPA 832 1999).
– Likely successful outcomes for permeable pavements use are low and moderate trafficked pavements without structural concerns. Single family dwelling driveways, local streets, and pedestrian sidewalks should all be considered. Selectively, multifamily parking lots, residential streets and a large portion of commercial parking lots should also be considered as possible candidates for permeable pavements. “It is possible to select porous pavement for approximately half the cover in most urban uses” (Ferguson 2005).
– Permeable pavement can be used on residential streets and rural highways, residential development, institutional development, commercial and office developments, non-industrial rooftops, pervious areas, except golf courses and nurseries (Swisher 2002)
– Permeable asphalt’s best application is parking lots and low-volume roads and in high activity recreational areas like basketball and tennis courts or playground lots. Areas such as sport complex parking lots that get infrequent use are also excellent candidates for the use of permeable asphalt pavement (Jackson 2003).

114
Permeable Concrete
Permeable concrete is used for the same applications as permeable asphalt with one additional use - sound walls.
– Permeable concrete roadway related application include parking lots, better sound absorption walls, and roadway base course (ACI 2006).
– Potential roadway related uses for permeable concrete are low-volume pavements, residential roads, alleys, and driveways, sidewalks and pathways, parking lots, subbase for conventional concrete pavements, slope stabilization, tree grates in sidewalk, and pavement edge drains (Tennis et al. 2004).
Summary of Permeable Pavement Applications
– Permeable pavements can be used for parking lots, low-volume residential streets, housing development streets and driveways, sidewalks, pathways and recreational facilities.
– The key descriptors for permeable pavement use are low-volume and light traffic.
Application Limitations
Permeable pavements are not suitable for sites with slopes greater than five percent, where the soils do not have an infiltration rate of at least 0.5 inches per hour, where prevailing winds can blow sand or silt onto the pavement, and where there is a possibility of contamination of drinking water supplies. As mentioned previously, permeable pavements have been limited to sites with light traffic and minimal heavy trucks as evidenced by very few examples in the literature of installations on mainline routes. The lower strength of both permeable asphalt and concrete also have limited there use to areas with lower volumes of traffic and little to no trucks.
Geographic Location
Climate and the physical location of an installation can limit permeable pavement use: – Dusty and sandy desert or other location where constant prevailing winds carrying
eroded soil or sand onto permeable pavement surface making the risk of clogging likely should be avoided (Pratt 1997).
– One common concern about permeable asphalt pavement is cold weather. (Cahill et al. 2003) Permeable concrete cold climate durability has not been proven. Water can enter permeable concrete’s cement micropores and freeze weakening the cement matrix (Ferguson 2005). EPA has recommended restricting permeable pavement use in cold climates (US EPA 832 1999), but the evidence has not always supported this, “Although anecdotal evident may suggest otherwise, freezing related damage, even in serve climates, has not been a concern. Water has a tendency to drain through to the void space of the storage bed beneath thus preventing heave or damage. Forming of “black ice” is rarely seen” (Cahill et al. 2003). Studies done in New Hampshire found no performance issues with the use of permeable asphalt pavement. Frost

115
depth penetration and freeze-thaw temperature cycles did not compromise the integrity of the system structurally, visually, or hydraulically (Houle 2008).
– Locations where sand, silt and other fine materials will be placed onto the permeable pavement surface need to be avoided. Locations where extended periods of snowfall requiring removal operation, sanding, salting, and other deicing chemicals typically associated with snow cleaning activities should be avoided (US EPA 832 1999). Report of plow damage and reduced infiltration related to snow removal activities were reported (Briggs 2006). Permeable asphalt pavements’ darker color absorbs heat more readily, making them more efficient at clearing snow and requiring less deicer than lighter color permeable concrete (Houle 2008).
Site Specific Factors
Specific site selection can be a limiting factor due to localized topography, soils, and water table. Sites must be carefully selected to assure the viability of the permeable pavement and to make sure localized factors do not prohibits it from being used. A permeable pavement stormwater system is not ideally suited for all sites (Cahill 1994):
– Flat sites are preferred over hilly or sloped sites. Runoff stored beneath the pavement needs to be static or at rest across the reservoir to promote natural infiltration. Building on a slope causes the stormwater to flow laterally within the reservoir, limits the amount of area available for infiltration into the reservoir’s subsoils, and if the slope is too steep and not enough storage volume is available the hydraulic gradient may be exceeded, allowing stormwater to flow out the surface of the pavement at the low point. The floor of the reservoir can be constructed using terrace, but with limits (Ferguson 2005). The floor of the reservoir needs to be level to allow evenly distributed infiltration (Cahill et al. 2003).
– It recommended that conventional pavement be used at vehicular traffic locations where pavement slopes exceed 5 percent. Permeable asphalt is not recommended for slopes over 6 percent (Cahill et al. 2003).
– The soil and geology present at the site must allow for adequate infiltration or this approach towards stormwater management makes no sense (Cahill 1994). The sites broad infiltration rate should be adequate enough to prevent ponding and overflow and drain reasonably enough to allow the drying out of the underlying soil between events. The drying out prevents an anaerobic condition from developing in the underlying soils that impedes microbiological decomposition. Soils containing significant amount of clay and silt should be avoided. The infiltration should not be so high that it allows contaminates to enter the groundwater (Swisher 2002).
– The minimum infiltration rate three feet below the bottom of the stone reservoir should be 0.5 inches per hour and complete drainage should occur within a 24-hour period (EPA 832 1999). Optimal performance requires the bottom of the stormwater reservoir be three feet above the seasonal high water table and two feet above bedrock (Cahill et al. 2003). The amount of soil depth available between the bottom of the reservoir and bedrock relates directly with the amount of pollutant that can be removed. The distance between the bottom of the reservoir and seasonal high water mark relates directly to how much filtration occurs in the soil prior to pollutant

116
reaching the water table and amount of pollutants being carried away in the groundwater (Swisher 2002).
– Permeable pavements are not recommended for locations where localized groundwater provides drinking well water (Pratt 1997), locations near foundations (US EPA 832 1999), where contaminated soil is present (Ferguson 2005), where sinkholes could develop (Swisher 2002), and where it is likely it could be inadvertently overlaid by mistake (Cahill et al. 2003).
– Not all sites or soils are suitable for infiltration. Development of these sites can utilize permeable pavement installations as a method to reduce the overall amount of impervious pavement or help increase water quality. For these installations other drainage tools must be provided to dispose of the water collected by the permeable pavement (Cahill et al. 2003).
Traffic Limitations
Proposed use can be a limiting factor due to the volume and types of traffic expected at the facility: Permeable Asphalt
– Most of literature supports restricting permeable pavement use to sites with low-volume or light traffic and minimal heavy trucks (US EPA 832 1999, Cahill et al. 2003, ACI 2006, Swisher 2002, Jackson 2003, Ferguson 2005).
– The use of a permeable pavements stormwater system in high volume situation has been limited. In the summer of 2009 the state of Maine constructed a permeable pavement system in an environmentally sensitive area adjacent to a shopping mall on Maine Mall Road in South Portland. The five-lane roadway, four through lanes with raised median and turn pockets, had an average daily traffic count of 16,000 and posted speed of 25-mph. Conventional pavement was used at the turn pockets and beginning and ending of the project. Only about a 0.10-mile of permeable pavement was placed along the project’s centerline (Maine DOT 2009).
– The other high volume traffic installation was a 3,500-ft test section of roadway constructed on State Route 87 in the city of Chandler, Arizona in 1986. The section was constructed with permeable and conventional asphalt pavement placed side by side. The average daily traffic was (ADT) 30,000. It was evaluated in 1991 and found to be performed satisfactorily (Hossain et al. 1992).
– Permeable pavement use should be restricted at sites where high concentration of contaminates are present: fueling areas, truck stops, toxic chemical industrial areas, potential spill areas, maintenance facilities, vehicle and equipment cleaning facilities, and bus and truck storage lots (US EPA 832 1999, Cahill et al. 2003, Swisher 2002).
Permeable Concrete
– A study evaluating permeable concrete parking lots for high traffic areas recommended restricting its use to the parking stalls and excluding its use at entrance and exit points. These areas should be constructed with conventional pavements. And, it recommended conventional pavements be used in places subject to repeated heavy loads, such as dumpster bin drops (Wanielista & Chopra 2007).
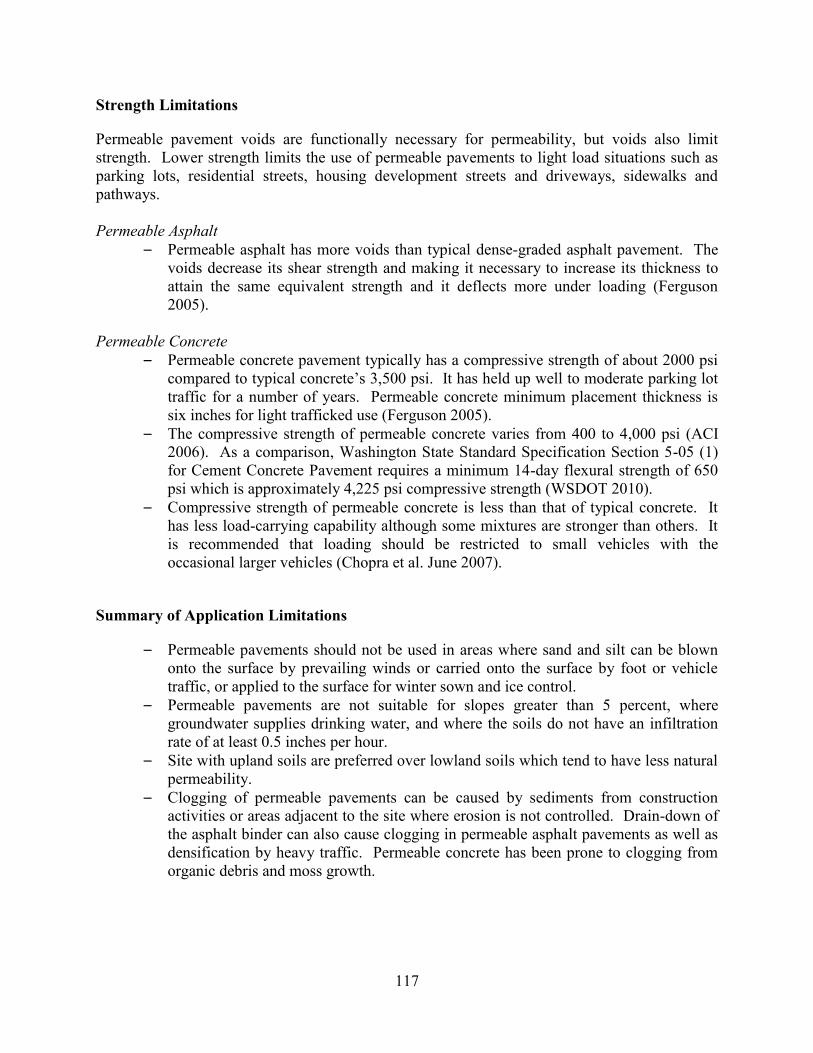
117
Strength Limitations
Permeable pavement voids are functionally necessary for permeability, but voids also limit strength. Lower strength limits the use of permeable pavements to light load situations such as parking lots, residential streets, housing development streets and driveways, sidewalks and pathways. Permeable Asphalt
– Permeable asphalt has more voids than typical dense-graded asphalt pavement. The voids decrease its shear strength and making it necessary to increase its thickness to attain the same equivalent strength and it deflects more under loading (Ferguson 2005).
Permeable Concrete
– Permeable concrete pavement typically has a compressive strength of about 2000 psi compared to typical concrete’s 3,500 psi. It has held up well to moderate parking lot traffic for a number of years. Permeable concrete minimum placement thickness is six inches for light trafficked use (Ferguson 2005).
– The compressive strength of permeable concrete varies from 400 to 4,000 psi (ACI 2006). As a comparison, Washington State Standard Specification Section 5-05 (1) for Cement Concrete Pavement requires a minimum 14-day flexural strength of 650 psi which is approximately 4,225 psi compressive strength (WSDOT 2010).
– Compressive strength of permeable concrete is less than that of typical concrete. It has less load-carrying capability although some mixtures are stronger than others. It is recommended that loading should be restricted to small vehicles with the occasional larger vehicles (Chopra et al. June 2007).
Summary of Application Limitations
– Permeable pavements should not be used in areas where sand and silt can be blown onto the surface by prevailing winds or carried onto the surface by foot or vehicle traffic, or applied to the surface for winter sown and ice control.
– Permeable pavements are not suitable for slopes greater than 5 percent, where groundwater supplies drinking water, and where the soils do not have an infiltration rate of at least 0.5 inches per hour.
– Site with upland soils are preferred over lowland soils which tend to have less natural permeability.
– Clogging of permeable pavements can be caused by sediments from construction activities or areas adjacent to the site where erosion is not controlled. Drain-down of the asphalt binder can also cause clogging in permeable asphalt pavements as well as densification by heavy traffic. Permeable concrete has been prone to clogging from organic debris and moss growth.

118
Advantages of Permeable Pavement
Primary Benefits
The consensus of the literature concludes the primary benefit of permeable pavement is that over a large surface area it captures, manages, and infiltrates most of the runoff at its source, recharging local aquifers without concentration and downstream consequences. Other advantages include a reduction in tire/pavement noise, reduction in the heat island effect in urban areas, and reduction in the need for snow plowing.
– The primary benefits of permeable pavement are to decrease the amount and rate of runoff, enhance erosion control, and improve water quality of runoff containing source pollutants (Fields et al. 1982).
– Substituting permeable pavement in parking lots and low-volume road applications may provide an alternative stormwater management practice that both reduces runoff and decreases runoff pollution (Fields et al. 1982).
– Permeable pavements provide direct surface infiltration and are one of the best methods for maintaining the hydrologic cycle in its pre-development condition. This assures recharge of aquifers and reduces runoff pollutants (Cahill 1994).
– The advantage of permeable pavement is it infiltration instantly across its entire surface directly into the underlying materials. An installation showed stormwater management benefits in quality and a reduction in peak flow and volume (Pratt 1997).
– Permeable pavement provides stormwater pollutant removal treatment and recharging of the local aquifers (US EPA 832 1999).
– Permeable asphalt pavement allows infiltration improving both water quality and eliminating the need for a detention basin for runoff control (Cahill et al. 2003).
– Vehicle drips accumulate on roadways surface for a period of time until first rainfall flushes these gathered concentrations of pollutants into downstream eroding runoff or into detention facilities. Detentions facilities are designed to help slow the progress of the runoff but do not fully eliminate flow and volume downstream erosion consequences and fail to capture the critical first flow concentrated pollutant. Permeable pavement functions to naturally infiltrates runoff over a large surface area more efficiently and effectively over a period of time than detention ponds and stores and recharges groundwater for long term downstream flow, and its porous surface tend to hold these accumulated pollutants within its pour structure where micro-ecosystem filters and biodegrades them (Ferguson 2005).
– Permeable asphalt pavements provide a stormwater management practice that both limits peak runoff and reduces the amount of total runoff and recharges groundwater (Cahill et al. 2005).
– Permeable pavement systems can replenish the groundwater table, reduce the amount of runoff and pollutants from entering streams during large storms, and reduce the magnitude of potential flooding (TERRA 2008).
– Permeable pavements are one class of low-impact development that can address both stormwater quality and quantity issues. Permeable pavement provides a decentralized infiltration stormwater management alternative at its source without distribution. Permeable pavements address both stormwater quality and quantity treatment. The surface layer filtration and retention of pollutants and the reservoir quantity treatment provides for an improved overall stormwater management benefits (Briggs 2006).

119
– Permeable pavement stormwater management benefits over conventional pavement management practices since it is possible to control stormwater runoff and pollution at its source (ACI 2006).
– EPA regulation set limits on the level of pollution entering streams and lakes. To meet these goals, local regulations mitigate these impacts by reducing the volume of runoff and the level of pollutants in runoff. Permeable pavement can do both. The moisture that falls onto the permeable pavement surface seeps directly into the ground recharging groundwater, reducing runoff, and meeting stormwater regulations of and is listed as Best Management Practice by the U.S. Environmental Protection Agency (EPA) (Tennis et al. 2004).
– Open-Graded Friction Courses, being a thin layer placed on top of conventional impermeable asphalt, enhance water quality by infiltrating and removing surface pollutants. The infiltrated surface water reduces the amount tire spray produced. Pollutants are then less likely to be washed from bottoms of engine compartment and eventually flushed, gathered, and flow with the runoff downstream. Instead, pollutants accumulated on the surface are infiltrates into the pours and trapped and held between the bottom of the permeable layer and impermeable surface (Barrett 2006).
Secondary Benefits
Beside the primary benefits the consensus of the literature conclude secondary benefits are reduced noise and blinding spray from the surface of permeable pavements, improved skid resistance, cost savings by not having to build stormwater treatment systems, lessening the need for plowing snow, and reductions in the heat island effect when used in urban environments:
– Permeable pavement provides water resources to plant and a tree roots, reduce the heat island effects of ambient and runoff temperatures, absorbs vehicle and tire noise instead of reflecting them, improves driving condition by infiltrating and removing surface water and oil that cause hydroplaning, blinding tire spray, and reduced skid resistance. Since permeable pavement stores, infiltrates, and provides treatment, potential cost saving may be possible by elimination of pipes, basins, detention reservoirs, and a more effective utilization land. Ecological permeable pavement groundwater recharge helps preserve ecosystems. It promotes aesthetic stewardship by blending with the environment instead of competing against it (Ferguson 2005).
– Permeable pavement eliminates curbing and storm sewers, provides better skid resistance improving safety, and recharges the local groundwater (US EPA 832 1999).
– Less snow plowing is needed on the permeable pavement surfaces (Cahill et al. 2003).
– The extra construction costs for the permeable pavement stormwater treatment system are usually offset by the elimination of the pipes, basins, and detention facilities cost associated with the typically stormwater management (Cahill et al. 2005).
– Savings in land cost and effective use benefits both the overall project costs and eliminates land requirement needed to construct detention ponds and other alternative stormwater management practices. Permeable pavement reduces tire noise.

120
Permeable concrete pavement reduces heat-island effects in densely populated areas (TERRA 2008).
– Unlike typical pavement, permeable pavements reduce hydroplaning, reduce lighting glare and tire noise, increase land use for other purposes, eliminates and reduces sizes of downstream piping, and provides watering source for trees (ACI 2006).
– Permeable concrete pavement’s light reflective color and open pore structure reduces the heat island effect. It eliminates surface ponding that causes tire spray, and hydroplaning (Tennis et al. 2004).
– New Hampshire found that the cost of parking stalls for permeable asphalt parking to be only slightly higher than conventional pavement (Briggs 2006), and the amount of deicing salt required was considerable less than what would be required for conventional asphalt pavements (Houle 2008).
Summary of Permeable Pavement Advantages
– The advantages of permeable pavement are that they reduce the amount of impervious surface, decrease runoff to the storm sewer system, remove pollutants, recharge groundwater, reduce or eliminate the need for other stormwater collection or retention systems, reduce tire/pavement noise, reduce heat island effect in urban areas, and reduce the need for snow plowing.
Disadvantages of Permeable Pavement
Permeable pavement use has been limited by concerns over its high failure rate due to clogging of the surface, the lack of contractors knowledgeable on how to properly construct a permeable pavement, the requirements for periodic inspection and maintenance and getting owners to commit to these requirements, the requirements for a redundant stormwater collection and storage system if the permeable pavement fails, the risk of groundwater contamination by pollutants spilled on the pavement, and the risk of freeze-thaw damage in cold climates.
– “Porous pavement has a high rate of failure” (EPA 832 1999). – There is a lack of installation expertise by contractors in many areas of the country. – Avoid constructing permeable pavement at locations where the lack of knowledge
about its intended purpose or existence runs the risk of it being covered or seal coated inadvertently rendering it impervious and non-functional (Cahill et al. 2003).
– A redundant conveyance and storage system needs to be available in case clogging occurs. Constructing an edge drain around the perimeter of the parking lot provides one type of safeguard measure to capture the runoff and re-directed it into the permeable pavement’s storage reservoir (Cahill 1994).
– Lack of communication between contractors and the owners sometimes has left the owner uninformed about the maintenance required for a permeable pavement. In most situations the pavement continues to function. Recommendations are that copies of maintenance specification be left with the owner to be disseminated to staff and crew and several signs posted around the facility to inform maintenance personnel of the special nature of the pavement (Ferguson 2005).
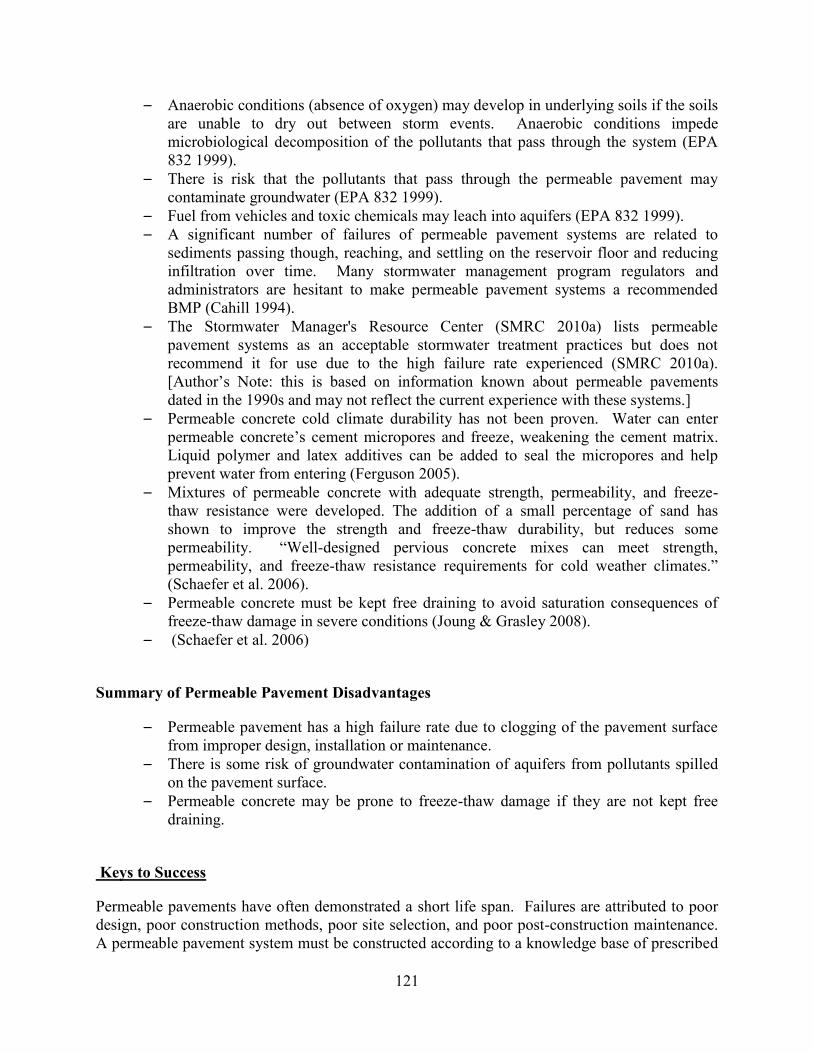
121
– Anaerobic conditions (absence of oxygen) may develop in underlying soils if the soils are unable to dry out between storm events. Anaerobic conditions impede microbiological decomposition of the pollutants that pass through the system (EPA 832 1999).
– There is risk that the pollutants that pass through the permeable pavement may contaminate groundwater (EPA 832 1999).
– Fuel from vehicles and toxic chemicals may leach into aquifers (EPA 832 1999). – A significant number of failures of permeable pavement systems are related to
sediments passing though, reaching, and settling on the reservoir floor and reducing infiltration over time. Many stormwater management program regulators and administrators are hesitant to make permeable pavement systems a recommended BMP (Cahill 1994).
– The Stormwater Manager's Resource Center (SMRC 2010a) lists permeable pavement systems as an acceptable stormwater treatment practices but does not recommend it for use due to the high failure rate experienced (SMRC 2010a). [Author’s Note: this is based on information known about permeable pavements dated in the 1990s and may not reflect the current experience with these systems.]
– Permeable concrete cold climate durability has not been proven. Water can enter permeable concrete’s cement micropores and freeze, weakening the cement matrix. Liquid polymer and latex additives can be added to seal the micropores and help prevent water from entering (Ferguson 2005).
– Mixtures of permeable concrete with adequate strength, permeability, and freeze-thaw resistance were developed. The addition of a small percentage of sand has shown to improve the strength and freeze-thaw durability, but reduces some permeability. “Well-designed pervious concrete mixes can meet strength, permeability, and freeze-thaw resistance requirements for cold weather climates.” (Schaefer et al. 2006).
– Permeable concrete must be kept free draining to avoid saturation consequences of freeze-thaw damage in severe conditions (Joung & Grasley 2008).
– (Schaefer et al. 2006)
Summary of Permeable Pavement Disadvantages
– Permeable pavement has a high failure rate due to clogging of the pavement surface from improper design, installation or maintenance.
– There is some risk of groundwater contamination of aquifers from pollutants spilled on the pavement surface.
– Permeable concrete may be prone to freeze-thaw damage if they are not kept free draining.
Keys to Success
Permeable pavements have often demonstrated a short life span. Failures are attributed to poor design, poor construction methods, poor site selection, and poor post-construction maintenance. A permeable pavement system must be constructed according to a knowledge base of prescribed

122
methods and techniques that are properly communicated to the contractor. Permeable pavements must be designed so that the water is not retained in the stone reservoir. Retained water can freeze and damage the structure and can also weaken the entire pavement structure making it susceptible to rutting and cracking of the pavement. The soils underlying the permeable pavement system need minimal compaction to avoid disturbing their natural infiltration rate.
Installation Methods
A permeable pavement system must be constructed according to a knowledge base of prescribed methods and techniques that are properly communicated to the contractor. Failure to follow proper construction techniques can severely limit the functionality of the installation:
– Knowledge of the specifications, the reasons behind them, and why compliance is so important needs to be communicated one-on-one with the contractor and workers. The purpose and reason behind construction methods needs to be addressed and understood by everyone. The installation needs to be monitored and spot checked continually and more so at the beginning construction phase. Good records need to be kept on all construction aspects. Site inspection and supervision needs to make sure that only equipment directly involved in the construction are allowed to traverse excavated recharge beds or enter the completed permeable pavement, and that all erosion control measure are in place (Cahill 1994).
– Strict adherence to erosion control is critical. Without these control measures, sediment clogs permeable pavement making it impervious to stormwater, or if the sediment filters into the reservoir it can clog geotextile fabric beneath the reservoir reducing the infiltration rate into the soil (Cahill 1994).
– The underlying soils natural or pre-construction infiltration rate must be preserved. Compaction of these soils and sedimentation during construction reduces their infiltration rates unpredictably. Compaction can be avoided if unyielding attention is given to its prevention. During construction, rainfall reduces infiltration by forming a crust on the soil’s surface making it necessary to restore infiltration by raking (Ferguson 2005).
– A suggested technique to safeguard against sediment clogging of subgrade during construction is to excavate to within six inches of final grade and then use it as a sediment basin and stormwater measure. Once the project gets to the final stages of construction the sediments in the basin can be removed and the basin excavated to final grade. This technique limits the amount of exposure of the subgrade to compaction and sedimentation and reduces the potential clogging risk (Jackson 2003).
– ACI 522 says, “Construction starts with thorough planning.” It recommends that a pre-construction conference and test sections be constructed to assure that all phases of the process are understood, the proper equipment is on site, the rate of concrete delivery is determined, assess to the site for the concrete trucks has been arranged, testing equipment and inspectors are in hand, the concrete mix will perform as designed, and that the contractor is qualified to do the work (ACI 2006).
– Because most contractors will not be familiar with the construction of permeable pavement, a pre-construction meeting should be held to discuss the need to prevent heavy equipment from compacting soils, the need to prevent sediment-laden waters

123
from washing on to the pavement, the need for clean stone, etc. Designers should review the installation process with the project foreman and routinely stop by the site or provide construction advice. Successful installation of any infiltration BMP is a hands-on process that requires an active role for the designer (Cahill et al. 2003).
– National Asphalt Pavement Association (NAPA) recommends that a preconstruction meeting be held to familiarize the contractor with sedimentation and compaction control practices in constructing a permeable pavement system (Jackson 2003).
– Only minimal compaction effort can be used on permeable asphalt pavement as compared to conventional pavement. Over-compaction will reduce the permeability of the pavement to unacceptable levels for a permeable pavement (Swisher 2002).
– Equipment and material should be stored off the pavement surface after construction to protect against any unintentional clogging mishaps from taking place before the project is completed (Swisher 2002).
Design
Permeable pavements must be designed so that the water is not retained in the stone reservoir. Retained water can freeze and damage the structure and it can also weaken the entire pavement structure making it susceptible to rutting and cracking of the pavement.
– Permeable pavement needs to be designed so that retention of the stormwater in the stone reservoir is kept to a minimum to protect against freezing and heaving damage to the pavement structure. Soils with adequate infiltration rates are capable of draining water fast enough to prevent it from freezing during extreme cold snaps. A pipe can be placed laterally along the floor of the reservoir to drain any remaining water present before it can freeze (Ferguson 2005).
– Purposely allowing moisture to be present in a pavement structure is contrary to most design principles and considered undesirable. “Traffic loads combined with moisture variations are the most harmful for road structures” (Nuth & Laloui 2007).
– Conventional pavements are intentionally designed to keep moisture from reaching the supporting foundation and weakening the soils. Permeable pavement, on the other hand, must compensate for the present of moisture by increasing the pavement structure to spread out the load (Ferguson 2005).
– Although moisture weaken the supporting soils beneath the permeable pavement, the thickness of the combined pavement structure, permeable pavement and the combined base and storage bed have proven to be structurally adequate. “Over time, we have found that the porous asphalt material has held up as well as, or better than, the conventional asphalt, largely due to the solid subbase provided by the stone storage/infiltration bed” (Cahill et al. 2003).
Site Conditions
The soils underlying the permeable pavement system need minimal compaction to avoid disturbing their natural infiltration rate.
– The infiltration rate of the underlying soils depends on the soil composition, relative orientation of the soil and aggregate to each other, and its level of compaction.

124
Infiltration rate influences the reservoir’s storage time, depth, and available capacity remaining between subsequent storms, water quality capabilities, freezing susceptibility, and design overflow depth (Ferguson 2005).
– Infiltration rates too high may require amended soil layer between the reservoir and the underlying soils to slow infiltration to improve water quality (Cahill 1994).
– Permeable pavement systems need minimal compaction of the underlying soils to avoid disturbing their natural infiltration rate (Ferguson 2005).
Summary of Keys to Success
– Knowledge of how permeable pavements work, by both the designer and especially the contractor that builds the system, are essential.
– Proper construction techniques, adherence to specifications, inspection and testing, and close attention to every detail of the construction process are essential for success.
– Controls to prevent sediments from entering the location both during and after construction are essential to keep permeable pavements from clogging issues.
– Subgrade soils must not be compacted by construction equipment prior to placement of the rest of the system.
– The design of the permeable pavement system must account for the type of loading expected, the infiltration rates of the materials and the subgrade soils, and the need for additional drainage features if infiltration rates are minimal.
Performance
The performance reported in the literature of both asphalt and concrete permeable pavement has been generally very good. Installations of asphalt permeable pavements are reported as having some issues with reduced permeability due to clogging from either lack of maintenance or drain down. Minor cracking, raveling, rutting, and compaction that reduce permeability are reported in asphalt permeable pavements. The defects reported for concrete permeable pavements include minor cracking and raveling, but no problems with clogging if proper maintenance procedures for cleaning are followed.
Overall Performance
Permeable Asphalt Performance of permeable asphalt pavement at northeast parking lots and Arizona roads:
– A parking lot in Annapolis, Maryland built in 1990, was inspected after 10 years of service. They found that minimal binder was present on the pavement surface and drained down binder mixed with debris filled pores a half inch below the surface. Some infiltration was maintained due to the remaining void space and structure (Ferguson 2005).
– Inspection of a parking lot in Great Valley, Pennsylvania after 18 years of service found that the limestone aggregate pavement surface was white and binder had

125
drained down and formed clogged pockets, small aggregate was present on the surface, infiltration rate was moderate due to the hard angular aggregate, some pooling of water was noted during heavy downpours, and no evidence of surface repairs. No maintenance or cleaning reported since construction. This confirmed the durability of the permeable asphalt pavement in moderate freeze-thaw conditions (Ferguson 2005).
– A parking lot in Concord, Massachusetts that receives around 600,000 visitors per year was built in 1978 as an US EPA technology transfer project. The site was a level gravel parking lot with well draining soils prior to construction of the permeable asphalt pavement. A 1999 survey indicated superb structural condition despite 22 years of traffic and deep winter freezes. The surface of the pavement was devoid of asphalt binder and binder mixing with organic matter clogging the pores of the pavement. Infiltration declined to less than one inch per hour after 22 years. Sand carried by vehicle tires from nearby beach and trails could be seen on the pavement surface. Signs warning of the importance of keeping the sand off the pavement were not heeded by either those using the beach or the maintenance staff. No vacuuming had been performed at any time during the life of the pavement (Ferguson 2005).
– A parking lot was constructed in 1987 in Philadelphia, Pennsylvania with permeable pavement parking stalls and dense-graded pavement travel lanes. The entire parking lot area served as an infiltration bed and dense grass provided good sediment control of the surrounding pervious surfaces. Evaluation of the site after 14 years of service found no signs of raveling, cracking, deformation, or other structural concerns, however, drain-down had occurred and it formed a black clogging layer below the surface loosening aggregate. Infiltration rate was low and considerably less in high trafficked areas. Some of the infiltration loss may be the result of the degradation of the poor quality aggregate. No vacuuming or cleaning maintenance had been performed during the life of the pavement (Ferguson 2005).
– A 3,500 foot section of permeable asphalt pavement roadway with an ADT of 30,000 was constructed alongside a dense-graded section in 1986 in Chandler Arizona. Installation was deemed a success after five years of use. A slight decrease in the infiltration rate was noted, but it was still well above the design values. The permeability in the wheel paths was less than that of the between wheel path locations (Hossain et al. 1992). The pavement was still functional as of 2003 (Jackson 2003).
– A parking lot in New Hampshire showed little distress after two years of service. Strength tests showed that a control section of conventional dense asphalt pavement was substantially stronger than the permeable asphalt pavement which was as expected due to the difference in air void content. Observation of pavement condition has not shown this strength difference to be a significant factor in its durability. Infiltration rates have been steady although some areas are decreasing substantially, indicating clogging of air voids due to introduction of sediments and/or drain-down of asphalt binder. Sediment sources were sand applied during deicing operations, aggregate and speed bump material sheared off during plowing, and organic materials from offsite. Binder drain-down could have occurred during the summer, a possibility since the binder was unmodified (Briggs 2006).
– Permeable asphalt pavement parking lot performed extremely well in the northern climate of New Hampshire after two years. No signs of structural pavement

126
degradation, hydraulic compromise, or visual distress from freeze-thaw cycles. Surface test performed indicated superior fictional resistance. Pavement cleared of snow and ice more quickly that typical pavement and required less deicing salt (Houle 2008).
– Two permeable asphalt parking lots located in Chester County, Pennsylvania have been in service for seven years as of 2002. The pavement in the aisles and access road were conventional asphalt, while the parking stalls were constructed with permeable asphalt pavement. Using the conventional pavement in areas of high traffic reduced compaction of the permeable pavement and increases the durability and lifespan of the entire facility. (Swisher 2002).
– A 115-acre development of a Medical Systems Corporate Campus located Chester County, Pennsylvania parking lot was constructed in 1984 using a permeable pavement. The area has been prone to the development of sinkholes which are formed when water dissolves the underlying limestone bedrock. The site manager did not account the sinkhole problem to permeable pavement. Instead the manger accounted the problem to the concentration of water at the inlets in the conventional portion of the parking lots. The manager reported little or no clogging or infiltration loss and minimal winter maintenance cost for snow removal (Swisher 2002).
– An example of excessive compaction of permeable asphalt pavement occurred at the East Whiteland Township Building in Chester County, Pennsylvania. This small porous parking lot has experienced a significant number of large dump trucks constantly driving over its surface. Ruts and compacted areas are clearly visible where the tires of the trucks have driven. In addition, minor rutting has occurred in the porous parking lots at the Visitor’s Center, as shown in Figure D-5 below. (Swisher 2002)
Figure D-5. Compacted and rutted area at the Visitor’s Center parking lot. (Swisher 2002)

127
– A study in the mid-1990s in Redmond, Washington evaluated various shoulders treatments for their runoff volumes and water quality. Runoff from heavily traveled two lane roadway flowed onto conventional asphalt, permeable asphalt, and gravel shoulders. The one-year study concluded that the permeable asphalt shoulders reduced runoff volume, reduced peak discharge and improved runoff quality more than the conventional and gravel shouldered sections. Permeable asphalt acted as a storage reservoir, containing runoff volumes within the void spaces in the asphalt. Consequently, there was a lag in the discharge of runoff from the permeable asphalt shoulders, which likely reduces peak discharge rates in drainage catchments. Based on the test conducted, clogging at the site would not occur before five years (St. John & Horner 1997).
Permeable Concrete Permeable concrete pavement is a more recent development than permeable asphalt pavement and there are thus fewer reports on its performance:
– A one-year study in Florida evaluated a permeable concrete shoulder at a rest area. The shoulder sometimes served as overflow parking for trucks and counts of 500 axles per week were reported. Based on surface wear from the starting, stopping, and parking and water quantity and quality reduction benefits, the permeable concrete shoulder use was judged a success. Recommendation of using permeable concrete shoulder on highways should be considered a viable option. The permeable concrete shoulder would provide infiltration, runoff volume reduction, water quality improvements, and structural stability (Wanielista and Chopra June 2007).
– A recent study evaluated 18 permeable concrete sites mostly in the Midwest constructed between 2003 and 2006 as parking lots, sidewalks and pathways, and commercial industrial sites. The permeable concrete generally performed well in freeze-thaw conditions with minimal damage and maintenance reported. Infiltration rates were fair to good expect for one parking lot where construction was an issue. Some raveling was found related to early age or structural overloading. No raveling was found related to widespread freeze-thaw disintegration. Most sites require no maintenance. Vacuuming and pressure washing have been used to improve infiltration. Aggressive pressure washing at one site had damaged the surface (Delatte et al. 2007).
– A New Hampshire study showed permeable concrete had better infiltration performance during winter months than permeable asphalt pavement. Permeable concrete’s greater tolerance to clogging from sand and organic debris makes it likely to have more serviceable life than permeable asphalt. Permeable concrete does not suffer the drain-down phenomenon of permeable asphalt (Houle 2008).
– A field investigation of permeable concrete parking lots and storage facilities with 6 to 20 years of service life was conducted in the Southeast. The installations were of similar structure integrity, infiltration, cross sections, and depths. Soils ranged from sandy to clay. The field investigation found only minor structural distress at all sites (Chopra et al. January 2007).
– Inspection of a sidewalk and bike lane project in Olympia, Washington revealed problems with a proprietary permeable concrete mix. Lack of controls on the

128
batching of the mix produced variations in the appearance and performance of both the sidewalks and the bike lane as noted in Figures D-33 and 40.
Summary of Overall Performance
– The reported performance of both asphalt and concrete permeable pavement installations is generally very good in spite of the lack of maintenance of the facilities. There are some reports of decreased infiltration rates; however, most indicates are that the infiltration raters are adequate to provide drainage for the site.
– There are some reports of raveling, rutting, cracking and other minor surface defects in asphalt pavements.
– Drain-down seems to be a consistent problem with permeable asphalt pavement installations.
– Minor raveling is the defect most reported for permeable concrete pavement. – One sidewalk installation was plagued with the growth of moss on the surface and
another with variations in the composition of the mix from the ready mix plant that resulted in visual and performance differences in the sidewalk.
– The EPA continues to lists permeable pavement as a Best Management Practice for stormwater treatment.
Infiltration Performance
Permeable pavements are built to serve two functions with respect to stormwater, (1) collect and hold stormwater runoff until it can infiltrate into the soil, and (2) improve the quality of the water infiltrating into the soils by removing pollutants. The first of these functions will be discussed in this section and the second in the section that follows. Permeable pavements depend on the pavement remaining functionally permeable initially and over its entire service life. Permeability can be decreased by clogging of the surface due to sands and silts being blown onto the pavement, being carried onto the pavement by people and vehicles especially during construction, or from sediment bearing runoff from adjacent impermeable areas. Asphalt permeable pavements can become clogged internally due to drain-down of the asphalt binder. Heavy traffic can also compact asphalt pavements and reduce permeability. Concrete permeable pavements seem to be less prone to clogging due to their much higher initial permeability, although, they may be susceptible to clogging by organic materials in certain locations. The filter fabric that separates the stone storage bed from the underlying soils in both asphalt and concrete permeable pavements can become clogged which limits the flow of water out of the pavement causing ponding on the surface of the pavement.
Permeable Asphalt
– “The greatest concern with using permeable pavement is its susceptibility to clogging,” “Porous pavement has a tendency to become clogged if improperly installed or maintained” (Fields et al. 1982, EPA 832 1999).

129
– Permeable pavement can become clogged over time and the geotextile filter fabric beneath the reservoir can also clog (Briggs 2006):
– Construction runoff must be kept from entering the recharge bed, and the infiltration system should not be placed into service until all disturbed land that drains to the system has been stabilized by vegetation. Strict erosion and sediment controls during construction or re-landscaping is a must to prevent clogging of the system (EPA 821 1999). Poor quality control during the initial construction phase and after placement have both contributed to permeable pavement failures. Many contractors lack of knowledge about permeable pavement stormwater system functionality has allowed clogging to occur because of sediments being carried onto the pavement surface during the construction phase (Cahill 1994).
– A significant number of failures of permeable pavement systems are related to sediments passing though, reaching, and settling on the reservoir floor and reducing infiltration over time. Many stormwater management program regulators and administrators are hesitant to make permeable pavement systems a recommended BMP (Cahill 1994). The Stormwater Manager's Resource Center (SMRC) lists permeable pavement systems as an acceptable stormwater treatment practice but does not recommend it for use due to the high failure rate experienced (SMRC 2010a).
– Empirical evidence suggests that permeable asphalt may experience gradual drain-down after placement. It is suggested that hot summer heat causes the binder to flow downward carrying accumulated dust and sand with it until it reaches a cooler lower portion where the pore matrix becomes clogged (Ferguson 2005). This hypothesis was supported by core samples taken at each of three study locations (Houle 2008). High trafficked area infiltration may be reduced from stripping and related drain-down in permeable asphalt pavement. Abrasive wear at these frequently used locations loosen aggregate that frees binder up to drain-down with other attached dust particles and clog pores (Ferguson 2005).
– Early permeable asphalt mixtures suffered drain-down (a phenomenon where the asphalt binder flows off the aggregate) during transport and installation. New mix designs using polymer additives along with mineral and cellulose fibers have reduced the occurrence of drain-down. These additives allow the mixture to be heated to a higher temperature and allows for more binder to be added. The higher temperatures drive off more water allowing for a better bond between the aggregate and binder. The additional binder provides for better coating of the aggregate which decreases the effects of oxidation degradation (Ferguson 2005).
– Declines in permeable asphalt infiltration rates have been related to the influence of traffic types and locations. Infiltration is reduced in areas where brake and turn motions tend to drag the plastic asphalt across the surface of the pavement. Field test in France conducted on residential and parking lots indicated most infiltration reduction occurred in the first couple of years. Infiltration rates of permeable pavements with smaller sized aggregate declined rapidly initially and then gradually, whereas larger aggregate mixes had little decline. Maintenance on high speed and trafficked roadways has not been required because the suction produced by numerous fast-moving tires tends to pull sediment out of the pores (Ferguson 2005).
– Permeable pavements are ineffective where pores become plugged from sediment flowing onto them from runoff (EPA 821 1999). Washington State DOE limits

130
runoff from impervious areas from entering permeable pavement, “No run-on from impervious surfaces is preferred. If runoff comes from minor or incidental impervious areas, those areas must be fully stabilized” (WA ECY 2005).
– The site needs to be designed to direct sediment-laden runoff, such as from landscaping activities that happen after construction, away from the permeable pavement (Cahill 1994).
– Avoid sites where clogging material could be directed onto the pavement surface (Ferguson 2005).
Permeable Concrete
– Sidewalks that are subject to organic debris from overhanging trees and plants may not be the best choice for a permeable pavement application. Needles, leaves, and moss clogged a permeable concrete sidewalk in Olympia, WA after only four years of service. Before building in this type of environment, a decision to use permeable concrete should be based on a solid commitment by the owner to perform annual maintenance (Ferguson 2005). Figures D-6 ,7 and 8, taken in March 2010, show the extent of the moss growth and the absence of moss on the conventional concrete placed at the same time.
Figure D-6. Moss covered permeable concrete sidewalk on North Street in Olympia, WA (March 2010)

131
Figure D-7. Another view of moss covered sidewalk on North Street. (Mar. 2010)
Figure D-8. Conventional concrete next to permeable concrete on North Street both placed at the same time. Note the absence of moss on the conventional concrete. (March 2010)
– A study on the Southeastern portion of the United States reported after years of
service the permeable concrete parking lots showed little clogging even though

132
vacuum or pressure sweeping maintenance had not been performed. It concluded that the degree of clogging is related to location, traffic loading and quality of construction and making any comparison is dependent on local factors (Chopra et al. January 2007).
Stormwater Treatment Performance
Vehicles and not the pavements themselves are the source of most of the pollutants in the runoff from pavements. Permeable pavements remove high percentages of the suspended sediments, total phosphorus, total nitrogen, organic compounds, zinc, and lead. Asphalt permeable pavements are reported to be effective at removing oil and other hydrocarbons spilled on their surfaces. Permeable asphalt pavement placed on the roadway or shoulder as an open-graded friction course have similar pollutant removal attributes as the multi-layered systems, with high percentages of sediments, total phosphorus, total nitrogen, organic compounds, and heavy metals being removed.
Source of Pollutants
Vehicles are the source of most of the pollutants in the runoff from pavements. The pavements would be the source of only small particles derived from the wear on the surface as found National Cooperative Highway Research Program (NCHRP) study summarized below:
– Laboratory testing of material commonly used in highway construction and repair such as asphalt binder, portland cement, fly ash, scrap tires, and wood preservatives revealed that some of the materials in their pure form were toxic to aquatic organisms. In most cases, however, when these materials are mixed with other components (such as asphalt binder mixed with aggregates) the risks to the environment are markedly reduced or eliminated. Some of the exceptions are wood preservatives, scrap tires and recycled shingles. Additional tests were run to determine how the leachates from the combined materials would be absorbed into various soils. Almost all of the materials were absorbed and posed no risk to the environment. The only exceptions being the wood preservatives (designed to be toxic to organisms) and methacrylate concrete sealer. The conclusions were that all of the conventional materials as well as most of the recycled materials commonly used in highway construction are not toxic to the environment (NCHRP 443 2000).
The Stormwater Manager’s Resource Center has also produced a list of pollutant found in stormwater and their primary sources as shown in Table D-1 (SMRC 2010b).

133
Table D-1. Highway runoff constituents and their primary sources (US EPA, 1993)
Constituent Primary Sources
Particulates Pavement wear, vehicles, atmosphere
Nitrogen, Phosphorus Atmosphere, roadside fertilizer application
Lead Tire wear, automobile exhaust
Zinc Tire wear, motor oil, grease
Iron Auto body rust, steel highway structures, moving engine parts
Copper Metal plating, brake lining wear, moving engine parts, bearing
and bushing wear, fungicides and insecticides
Cadmium Tire wear, roadside insecticide application
Chromium Metal plating, moving engine parts, brake lining wear
Nickel Diesel fuel and gasoline, lubricating oil, metal plating, brake
lining wear, asphalt paving
Manganese Moving engine parts
Cyanide Anticake compound used to keep deicing salt granular
Sodium, Calcium,
Chloride Deicing salts
Sulphate Roadway beds, fuel, deicing salts
Petroleum Spills, leaks, or blow-by of motor lubricants, antifreeze and
hydraulic fluids, asphalt surface leachate
Removal of Pollutants by Permeable Asphalt and Permeable Concrete
– EPA 832 cites a study conducted in Rockville, MD and Prince William, VA that indicated removal efficiencies of between 82 and 95 percent for sediment particles, 65 percent for total phosphorus, and between 80 and 85 percent total nitrogen. The Maryland site also reported high removal rates for zinc, lead, and chemical oxygen demand (COD) (EPA 832 1999). Chemical oxygen demand is commonly used to measure the amount of organic compounds in water. A high COD removal rate translates to water low in organic compounds.
– Cahill reports similar results to EPA’s with 92 percent removal of total suspended solids (TSS), 68 percent for total phosphorus, 83 percent for total nitrogen, 82 percent for total organic compounds (TOC), 74 percent for lead and 81 percent for zinc (Cahill 2005).

134
– The University of New Hampshire reported in removal of 99 percent of total suspended solids (TSS), 38 percent of total phosphorus, 96 percent of zinc and 99 percent of petroleum hydrocarbons (University of New Hampshire 2007).
– Newman et al. did a study in which motor oil was purposely pored onto a permeable asphalt pavement parking lot to see if the system could clean up the oil. Despite elevated levels of oil input, the clean-up capability of the structure has been retained for over 4 years of operation. This was due to a combination of efficient retention and biological breakdown. Bacteria carry on the primary breakdown of the oil, but the protozoan community is also important in the entire process. Continuing results from the long-term experiment indicate that appropriately constructed and managed porous pavements can be used successfully to both trap and biodegrade oil which is accidentally released onto parking surfaces over a long period (Newman et al. 2002).
– Swisher found that the parking lot he investigated was operating similarly to others reported in the literature with respect to the treatment of heavy metals and organic materials. He concludes that permeable pavements are better at removing toxic metals than other stormwater management practices such as sewers and detention basins which collect and store rather than remove these pollutants. There is also little potential for petroleum hydrocarbon contamination of groundwater because of the storage beds’ ability to biologically degrade the hydrocarbons in the top few inches of soil beneath the storage bed (Swisher 2002).
Removal of Pollutants by Permeable Asphalt (OGFC) Overlays
– Water collected from a two inch thick permeable asphalt overlay was of better quality than runoff from a conventional non-permeable asphalt overlay. Concentration of total suspended solids, total forms of lead and zinc were often one order of magnitude lower in the runoff from the permeable pavement. Average concentrations of organic nitrogen, ammonia and ammonium (collectively know as TKN), organic compounds (COD), nitrate-nitrite, and the dissolved forms of lead, zinc, and phosphorus show little change between the two surface types (Barrett 2006).
– Barrett cited the improvement noted in the runoff from the permeable asphalt overlay as compared to conventional pavement may be the result of the pollutants being retained in the pores of the permeable pavement. It could also be attributed to a reduction of the amount of pollutants derived from the bottoms of vehicles as a result of less splash and spray (Barrett 2006).
– The Barrett study also included the evaluation of an 8-meter wide grass strip to improve the water quality. Collection points were at the edge of the pavement and at the edge of the grass strip. No difference was detected between the two collection points (Barrett 2006).
– The long-term benefits in water quality provided by the permeable asphalt surface were not determined in the Barrett study. The author cited a study in the Netherlands that showed water quality improvements after 3 years, however, the Dutch have a program of aggressive cleaning of their permeable asphalt surface pavements with specially designed vehicles that use vacuum and pressure washing (Barrett 2006)
– St. John and Horner measured the runoff from a permeable pavement shoulder and compared it to the runoff from a conventional asphalt shoulder and a gravel shoulder.

135
Runoff volumes and pollutant loads were considerably less from the permeable asphalt shoulder than for the conventional asphalt shoulder. The gravel shoulder also reduced runoff volumes and pollutant loads over the conventional asphalt shoulder, but not as dramatically as the permeable pavement shoulder (St. John & Horner 1997).
– Pollution removal rates were highest for those pollutants that are correlated with total suspended solids indicating the physical mechanism of settling and filtration were critical in removing pollutants. Removal of both particulate and soluble pollutants can be attributed to infiltration of runoff in the soils beneath the permeable asphalt. “The pollutant removal rates of the porous asphalt shoulders, particularly during the wet season, equaled or exceeded the removal rates reported in other studies on permeable pavement installations, as well as removal rates of infiltration basins and constructed wetlands.” Infiltration rates after one year measured 1750 inches per hour. There remains a question of how long the permeable pavement will maintain these rates. (St. John & Horner 1997)
Summary of Stormwater Treatment Performance
– The source of pollutants in runoff from pavements is not the pavement itself. – Permeable pavements remove high percentages of total suspended solids (TSS), total
phosphorus, total nitrogen, organic compounds and heavy metals. – Permeable pavements also remove oil and other hydrocarbon pollutants. – Open-graded friction course permeable pavements have similar pollution removal
rates. – The longevity of the pollution removal properties of permeable pavements is
unknown.
Maintenance
The proper maintenance of permeable pavements requires annual or more frequent inspections and cleaning with vacuum sweepers and high-pressure washers. Street sweepers are not an acceptable maintenance tool for permeable pavements.
– “Surfaces should be swept with a high-efficiency or vacuum sweeper twice per year; preferably, once in the autumn after leaf fall, and again in early spring. As long as annual infiltration rate testing demonstrates that a rate of 10 inches per hour or greater is being maintained, the sweeping frequency can be reduced to once per year. For permeable asphalt and concrete surfaces, high pressure hosing should follow sweeping once per year” (WA ECY 2005).
– Permeable pavements should be maintained four times a year by vacuum sweeping followed by high-pressure hosing to free up clogged surface pores. The vacuumed materials need to be properly disposed (EPA 832 1999).
– Often overlooked, it recommend permeable asphalt pavement be vacuumed twice a year. Evidence suggests that even without maintenance, permeable asphalt pavement systems manage to function (Cahill et al. 2005).

136
– Most permeable concrete pavement installations function with little maintenance. Vacuuming permeable concrete pavement annually or as required to remove debris from the surface of the pavement is common. Other permeable concrete pavement cleaning options include power blowing and pressure washing. Pressure washing of permeable concrete pavement may restore infiltration by 80-90 percent. Additional maintenance practices are being developed (Tennis et al 2004).
– NCHRP Report 640 on the construction and maintenance of permeable pavement overlays identified 3 methods of unclogging: fire hose, high-pressure washing, and specialized equipment that wash and vacuum the pavement in one pass. The wash and vacuum cleaning was found most effective and a study was noted that suggested cleaning is more effective if done when pavement is still permeable (Cooley et al. 2009).
– Preventative measures to avoid clogging should be considered the primary maintenance tool. Runoff from the surrounding landscape should be designed to not flow onto the pavements surface prior to construction. Rock, leaves, and debris can potentially reduce infiltration. Landscaping materials should never be stored on the permeable pavement surface (Tennis et al 2004).
– Educational signs listing the benefits of permeable pavement system should be posted at all permeable pavement parking lot sites (Cahill 1994).
– Signs should be posted to educate the public about permeable pavement materials and functions, to warn then against disposing pollutants, instructing how to maintain it, and warn against using sand or other clogging material (Ferguson 2005).
– A southeastern study performed on parking lots in the southeastern part of the country analyzed the benefit of two maintenance techniques of restoring infiltration in permeable concrete. The two methods evaluated were pressure washing and vacuuming sweeping. The pressure washing dislodged and washed clogged materials from and off the pavement and/or pushed the clogged material though the pavement. A small test patch was used to evaluate the amount of pressure applied so that the pavement was not damaged. Vacuum sweeping mechanically loosens particles so that they can be removed by the suction. Pressure washing and vacuum sweeping proved to be equally effective by themselves, but the combination of the two worked best. It was recommended that one or both be performed whenever the infiltration falls below acceptable levels (1.5 inches per hour) as measured by infiltration meter (Chopra et al. 2007).
– A study done on a permeable concrete parking lot in Vermont clogged the surface with as much sand as possible and reduced the hydraulic conductivity by 35-40 percent. This did not interfere with the function of the parking lot as the hydraulic conductivity was well above typical design storms. Vacuuming was successful in restoring the hydraulic conductivity to within 10 percent of the initial value. Salting the parking lot alone reduced the hydraulic conductivity by about 10 percent but sand and salt in a 2:1 ratio reduced it by 96 percent. (McCain 2010)
– Research in Oregon found seal coating permeable asphalt pavement reduces it porosity (Cooley et al. 2009).
– Permeable asphalt pavement must never be fog sealed. Before permeable asphalt pavement can be rehabilitated the existing permeable pavement porosity must be found adequate (Ferguson 2005).

137
– Potholes and cracks can be filled with patching mixes unless more than 10 percent of the surface area needs repair. Spot-clogging may be fixed by drilling 1.3 centimeter (half-inch) holes through the permeable pavement layer every few feet (US EPA 832 1999).
Summary of Maintenance
– Periodic inspection and cleaning of permeable pavements is required to maintain the infiltration properties of the systems.
– Vacuum sweepers and pressure washers are required to remove the sand and other debris that accumulates in the pores of permeable pavement. Street sweepers are not adequate.
– Preventative measures to avoid clogging should be considered the primary maintenance tool.
D.4 Cost
The costs cited in the literature for permeable pavement installations are difficult to synthesize into real numbers that can be compared to conventional pavement costs. The cost of using these pavements for parking lots and sidewalks and for very short lengths of residential streets is not readily translated into costs for the construction of highways. Installations of these types of pavement are often much higher because of the small quantities used and the unfamiliarity and thus higher risk to most contractors bidding on permeable pavement projects.
– Cost per parking space for permeable asphalt pavement and stormwater management was only slightly more than conventional asphalt pavement design. When the thinner ideal reservoir thickness was considers, the permeable stormwater system turn out to be less than a comparable conventional pavement construction. The results confirmed that permeable asphalt systems were cost effective and a viable alternative (Briggs 2006).
– The cost difference between permeable and conventional asphalt pavement is small. Stone base and storage bed costs are generally higher due to the reservoir requirements. Additional costs are generally offset by reduction in stormwater pipes, inlets, and excavation, design topography conformity earthwork reduction, and elimination of detention basins. Cost per parking space in 2003 dollars for parking, aisles, and stormwater management are $2,000-2,500. A North Carolina project that included construction of permeable asphalt and concrete estimated permeable concrete were four times higher (Cahill et al. 2003).
– Cost per parking space was approximately $3,337 for the permeable asphalt pavement system. This includes some demolition, removal of stone masonry walls, and installation of emergency telephones and security cameras (Beta Group, Inc. 2003).
– The parking lot cost for the permeable asphalt pavement stormwater system is competitive with a conventional dense-graded stormwater system. The cost adjusted to 2008 dollars found the permeable asphalt system was $2,600 compared to $3,500 for the conventional system per parking space. When factoring in the annual 75 percent reduction in winter salting load cost over the life-cycle of the two alternatives,

138
the permeable asphalt becomes even more cost effective. Cost of the permeable concrete parking lot adjusted to 2008 dollars was $2,700 per parking space. The cost of the permeable concrete parking lots per parking space was 18 percent greater than permeable asphalt. Taking into account the suggested 40 years serviceable life expected for permeable concrete and 8 to 10 years expected for permeable asphalt, this represents a two-third cost saving over 40 years for permeable concrete (Houle 2008).
– WSDOT recently built a small section of permeable concrete at the Anacortes Ferry Terminal. The section is 20 feet wide by 150 feet long in holding lanes 9 and 10. Lane 9 is used occasionally as an overflow holding lane during the day. Lane 10 is used daily as an early morning holding lane for 12 to 20 trucks ranging from 22-ft to 78-ft long trucks. The design called for 8 inches of permeable concrete pavement over and 8 layer of shoulder ballast over the subgrade. A geotextile was placed between the subgrade and the shoulder ballast. Keeping in mind that this is a very small quantity and cost are always much higher, the cost of the project was $100 per square yard.
Summary of Cost Information
– The cost of permeable pavement is always higher than conventional pavement, but most references indicate this higher cost is offset by the additional cost of stormwater treatment measures required for conventional pavement installations.
D.5 Use of Permeable Pavement in the Pacific Northwest
Permeable pavements, both asphalt and concrete, have been used in Western Oregon and Washington for sidewalks, pathways, driveways, parking lots, and a few streets. Some of the more notable projects are described below with photos and summarized in Tables D-2, D-3, and D-4.
Salem, OR - Residential Development
http://www.pringlecreekcommunity.com Pringle Creek Community, located in South Salem, OR, is an entire development devoted to environmental and social sustainability. The community’s “Green Streets” are all permeable asphalt pavement. It is believed that this is the largest residential application of permeable asphalt in the country.

139
Figure D-9. Contrast between permeable asphalt in background and conventional asphalt pavement in foreground. (Pringle Creek Community, Salem, OR.)
Figure D-10. Conventional asphalt on the left, permeable asphalt on the right. (Pringle Cr. Com., Salem, OR)

140
Portland, OR - Port of Portland Auto Parking Lot
The Port of Portland used 35.7 acres of permeable asphalt pavement and 15.4 acres of conventional asphalt pavement to expand their Terminal 6 facility to hold additional new vehicles coming into the port from abroad.
Figure D-11. Finished permeable asphalt auto storage yard. (Port of Portland)
Figure D-12. Coarse aggregate for the storage bed on the left, geotextile fabric in the middle separating it from the scarified subgrade soil on the right. (Port of Portland)

141
Figure D-13. Permeable asphalt pavement over coarse aggregate storage bed. (Port of Portland)

142
Olympia, WA - Decatur Street
The City of Olympia used permeable asphalt pavement on a short section of a residential street as part of a LID improvement that also included rain gardens and cartridge filtration of water collected under the roadway.
Figure D-14. Decatur project site map. (City of Olympia)

143
Figure D-15. Design details of the permeable asphalt pavement on constructed in 2007 on Decatur street. Section A is a regular asphalt pavement with cartridge filter for treatment and under the road infiltration. Section C is a regular asphalt pavement with rain garden for treatment and under the road infiltration. (City of Olympia)
Figure D-66. Surface of the permeable asphalt pavement on Decatur Street. Some raveling is apparent as evidenced by the loose aggregate in the photo. (Photo from March 2010)

144
Issaquah, WA - Rainier Boulevard
A permeable asphalt pavement was installed in 2007 on a section of Rainier Boulevard. The 560 foot and 37 foot wide section was paved on one 7 inch thick lift. Most of the traffic in Issaquah is carried by Front Street, NW Gilman Boulevard, and Newport Way NW. The pavement is in very good condition with no cracking or raveling detected to date. Design and construction costs were $173,500.
Figure D-17. Permeable asphalt pavement on Rainier Blvd looking south. (Photo from April 2010)
Figure D-18. Permeable asphalt pavement on Rainier Blvd looking north, wear pattern in the wheel paths and patch in front of white pick-up truck. (Photo from April 2010)
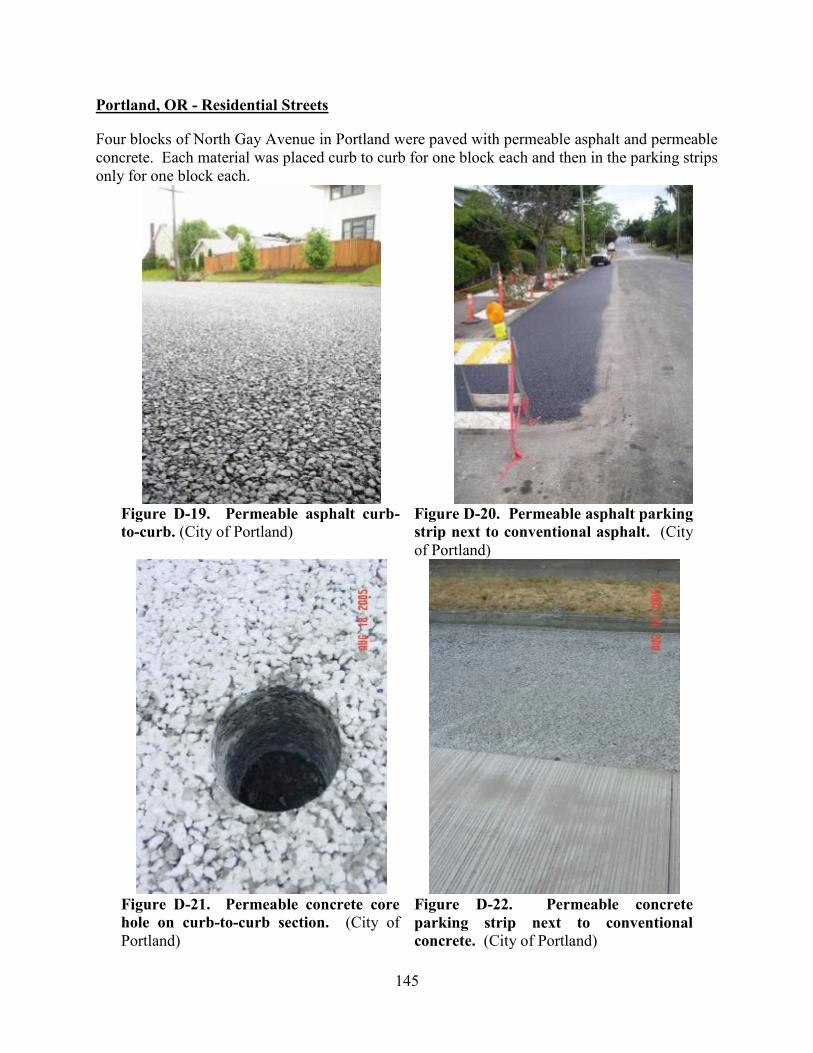
145
Portland, OR - Residential Streets
Four blocks of North Gay Avenue in Portland were paved with permeable asphalt and permeable concrete. Each material was placed curb to curb for one block each and then in the parking strips only for one block each.
Figure D-19. Permeable asphalt curb-to-curb. (City of Portland)
Figure D-20. Permeable asphalt parking strip next to conventional asphalt. (City of Portland)
Figure D-21. Permeable concrete core hole on curb-to-curb section. (City of Portland)
Figure D-22. Permeable concrete parking strip next to conventional concrete. (City of Portland)

146
Vancouver, WA - Grand Central Station Shopping Center
Permeable concrete pavement was placed for the parking stalls and conventional asphalt pavement for the driving lanes for the parking lots in this shopping center.
Figure D-23. Fred Meyer parking lot at the Grand Central Station shopping center in Vancouver, WA with permeable concrete parking stalls and conventional asphalt pavement drive areas. (Evolution Paving Resources)
Seattle, WA - High Point Residential Redevelopment
High Point is a 100-acre master planned community located in West Seattle. It features a single permeable concrete street and adjacent driveways and sidewalks built in 2005.
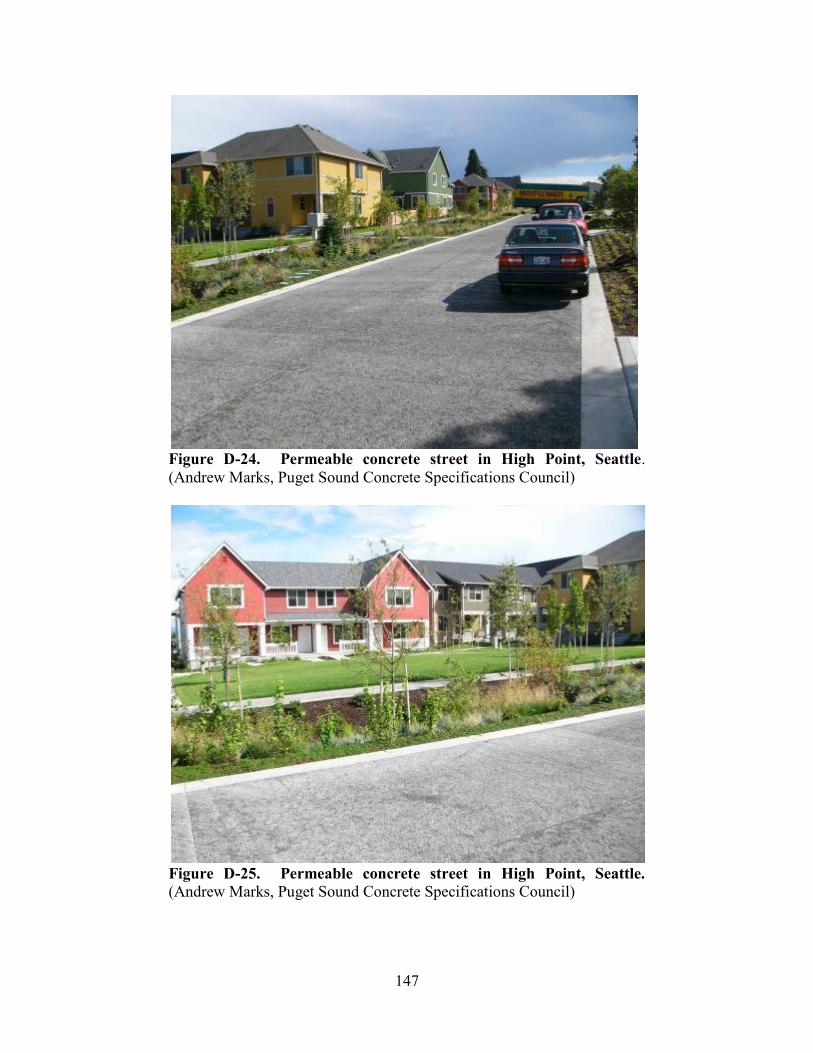
147
Figure D-24. Permeable concrete street in High Point, Seattle. (Andrew Marks, Puget Sound Concrete Specifications Council)
Figure D-25. Permeable concrete street in High Point, Seattle. (Andrew Marks, Puget Sound Concrete Specifications Council)

148
Sultan, WA - Residential Development
Stratford Place is a small housing development in Sultan, WA that features permeable concrete streets, driveways and sidewalks. The permeable concrete streets are 6 inches in thickness.
Figure D-26. Permeable concrete street and sidewalk, Stratford Place, Sultan, WA. (Andrew Marks, Puget Sound Concrete Specifications Council)
Figure D-27. Permeable concrete streets, driveways and sidewalks, Stratford Place, Sultan, WA. (Andrew Marks, Puget Sound Concrete Specifications Council)

149
Mukilteo, WA - City Hall
The parking lot at the new Mukilteo City Hall was built with 6 inches of permeable concrete in 2008.
Figure D-28. Permeable concrete at Mukilteo City Hall. (Andrew Marks, Puget Sound Concrete Specifications Council)
Figure D-29. Permeable concrete parking stalls at Mukilteo City Hall. (Andrew Marks, Puget Sound Concrete Specifications Council)
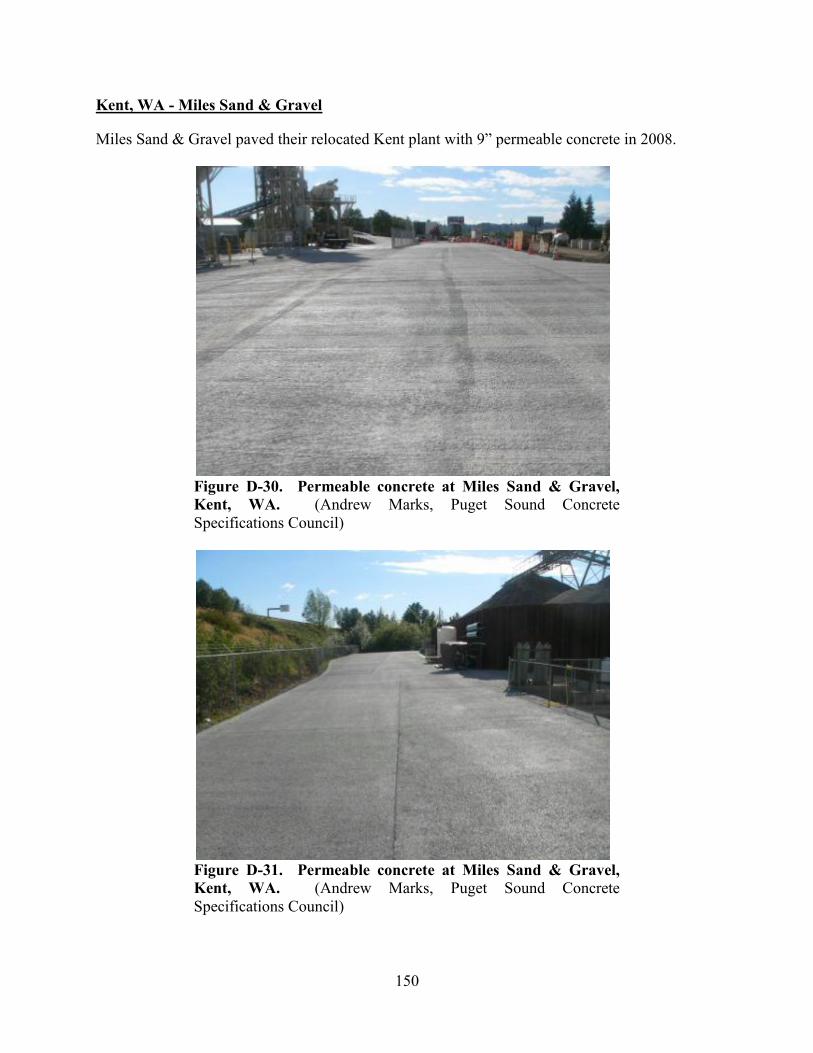
150
Kent, WA - Miles Sand & Gravel
Miles Sand & Gravel paved their relocated Kent plant with 9” permeable concrete in 2008.
Figure D-30. Permeable concrete at Miles Sand & Gravel, Kent, WA. (Andrew Marks, Puget Sound Concrete Specifications Council)
Figure D-31. Permeable concrete at Miles Sand & Gravel, Kent, WA. (Andrew Marks, Puget Sound Concrete Specifications Council)

151
WinCo Foods, Vancouver, WA
The WinCo Foods parking lot was paved with permeable asphalt parking stalls and conventional asphalt drive areas.
Figure D-32. Permeable concrete pavement parking stalls with conventional asphalt pavement drive areas at WinCo Foods in Vancouver, WA. (Northwest Cement Producers Group)
Figure D-33. Permeable concrete at WinCo Foods in Vancouver, WA. (Northwest Cement Producers Group)

152
City of Olympia, RW Johnson Boulevard Sidewalk and Bicycle Lane
A new sidewalk and bicycle lane, located between the asphalt roadway and sidewalk, were paved in 2006 with PercoCrete, a proprietary permeable concrete mix. The permeable concrete was placed 4 inches deep for the sidewalks and 7.5 inches deep for the bike path. The storage bed under the sidewalks is 6 inches deep and under the bike path 19 inches. About 3 percent of the permeable pavement on the project had to be replaced due to early failure. The failures were detected during construction using a pressure washer at 3000 psi water pressure with a flow rate of 1 gallon per minute and the nozzle held 3 inches above the surface of the pavement. Sections that could easily be degraded with the pressure washer or did not readily infiltrate the water were replaced. The failures were attributed to inconsistent batching of the PercoCrete. This conclusion is supported by variations in the appearance of the sidewalk from one section to the next.
Figure D-34. Different textures and appearances of the sidewalk. (Photo from April 2010)
Figure D-35. Cracking and spalling of the sidewalk. (Photo from April 2010)
Figure D-36. Moss growth on the sidewalk. (Photo from April 2010)
Figure D-37. Cracking along edge of sidewalk. (Photo from April 2010)
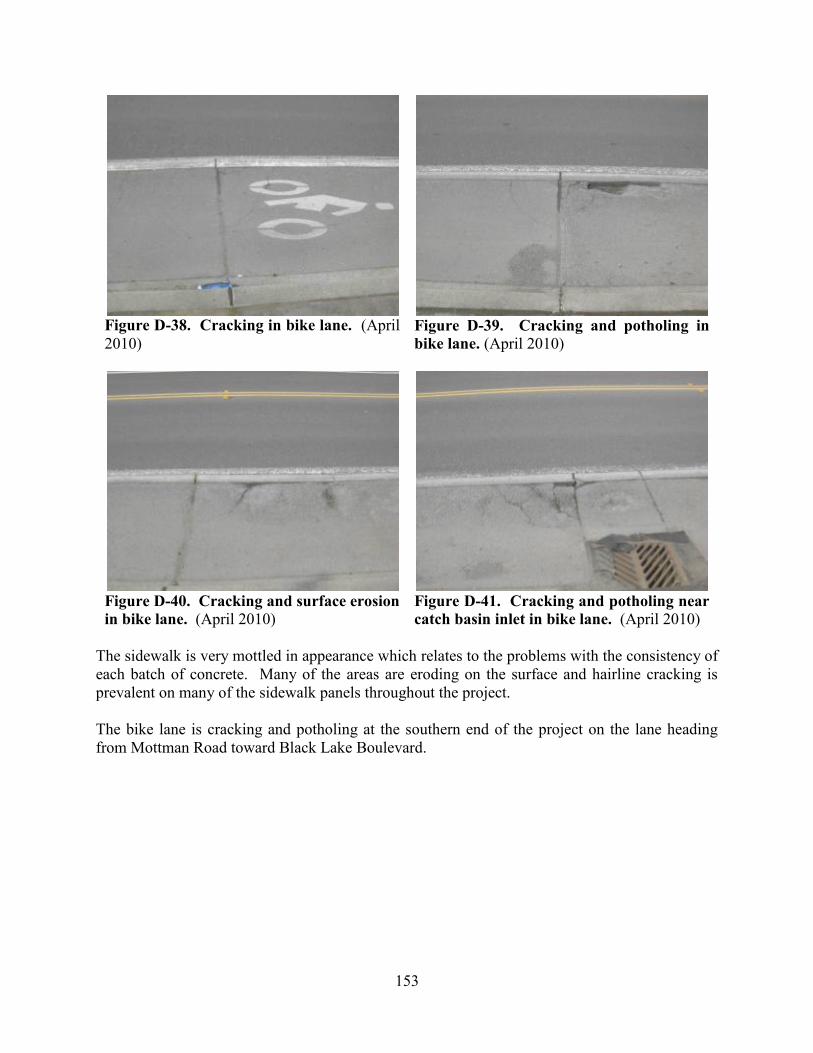
153
Figure D-38. Cracking in bike lane. (April 2010)
Figure D-39. Cracking and potholing in bike lane. (April 2010)
Figure D-40. Cracking and surface erosion in bike lane. (April 2010)
Figure D-41. Cracking and potholing near catch basin inlet in bike lane. (April 2010)
The sidewalk is very mottled in appearance which relates to the problems with the consistency of each batch of concrete. Many of the areas are eroding on the surface and hairline cracking is prevalent on many of the sidewalk panels throughout the project. The bike lane is cracking and potholing at the southern end of the project on the lane heading from Mottman Road toward Black Lake Boulevard.

154
King County, Military Road at S. 272nd Street Intersection Permeable Concrete Sidewalks
King County constructed 1,100 square yards of permeable concrete sidewalk and a rain garden at the intersection of Military Road and S. 272nd Street in 2007. Some minor cracking was noted as well as clogging of the pavement with fine sand.
Figure D-42. Permeable concrete sidewalk on Military Road. (April 2010)
Figure D-43. Accumulation of fine sand in joint possibly from winter deicing operations. (April 2010)

155
WSDOT, Anacortes Ferry Terminal Permeable Concrete Holding Lanes
A 150 foot section of holding lanes 9 and 10 were reconstructed with 8 inches of permeable concrete over a 6 inch thick storage bed of shoulder ballast. Geotextile fabric was used to separate the storage bed from the lightly compacted subgrade soils. The geotextile fabric was also lapped up on both sides and ends to prevent water from infiltrating into adjacent pavements. Project was completed in October 2009.
Figure D-44. Lanes 9 and 10 of Anacortes Ferry Terminal. (March 2010)
.
Figure D-45. Close-up of Lane 10 at Anacortes Ferry Terminal. (March 2010)
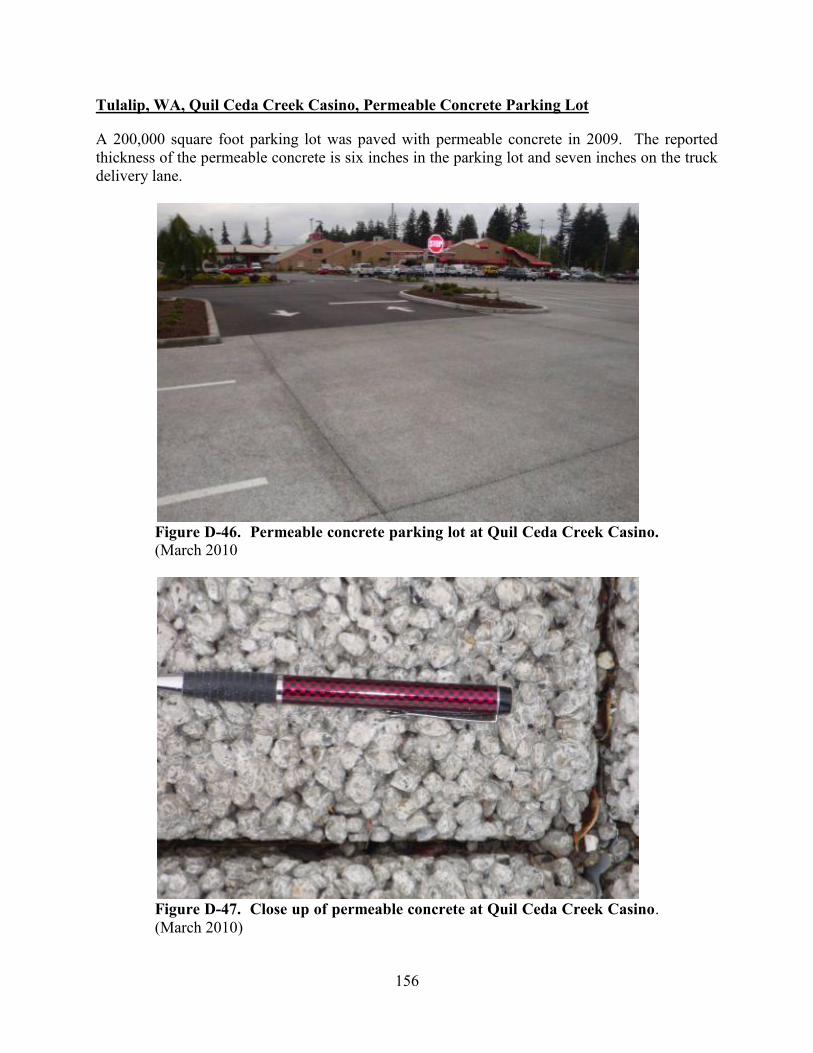
156
Tulalip, WA, Quil Ceda Creek Casino, Permeable Concrete Parking Lot
A 200,000 square foot parking lot was paved with permeable concrete in 2009. The reported thickness of the permeable concrete is six inches in the parking lot and seven inches on the truck delivery lane.
Figure D-46. Permeable concrete parking lot at Quil Ceda Creek Casino. (March 2010
Figure D-47. Close up of permeable concrete at Quil Ceda Creek Casino. (March 2010)

157
Issaquah, SR-900, Contract 7553, SE 78th Street to Newport Way, Permeable Concrete Sidewalk
A four inch deep by 10.5 foot wide permeable concrete sidewalk was constructed on SR 900 south of Issaquah in November of 2009 and early 2010. The labor intensive nature of permeable concrete is illustrated by the eight man crew placing the sidewalk.
Figure D-48. Roller screed leveling and compacting permeable concrete. (November 2009)
Figure D-49. Forming joint. (November 2009)

158
Figure D-50. Eight man crew placing permeable concrete sidewalk. (November 2009)
Figure D-51. Finished sidewalk. (November 2009)

159
Table D-2. Permeable pavement street installations in the Pacific Northwest. Permeable Pavement Location Application Quantity
(yd2) Construction
Year Contact
Concrete Stratford Place 716 Stratford Place Sultan, WA
Roadways, Driveways, Sidewalks
3,600 2006 Daniel Huffman, NRMCA (503) 292-7729
Concrete Fairhaven Old Fairhaven Parkway and 14th Street Bellingham, WA
Alley 2002 2020 Engr, Inc. (360) 671-2020
Concrete High Point Development 32 Avenue SW West Seattle, WA
Street, & Sidewalks 2005
Asphalt Pringle Creek Community 2110 Strong Rd. SE Salem, OR
Streets and Alleyways 27,000 2006
Asphalt City of Issaquah Rainier Boulevard Issaquah, WA
Street 2,300 2007
Kerry Ritland Senior Water Resources Engineer [email protected]
Asphalt North Gay Avenue Between Alberta and Webster Streets Portland, OR
Street 800 2005 Brett Kesterson Portland DOT [email protected]
Asphalt City of Olympia Decatur Street, 9th to 11th Olympia
Street 2,200 2008
Concrete North Gay Avenue Between Wygant and Humboldt Streets Portland, OR
Street 800 2005 Brett Kesterson Portland DOT [email protected]
Concrete Anacortes Ferry Terminal Truck Holding Lane 333 2009
Concrete Evolution Pav. & Res., Inc. Salem, OR
Private Driveway to
Plant 500 2003

160
Permeable Pavement Location Application Quantity
(yd2) Construction
Year Contact
Concrete Miles Sand & Gravel, Inc. Kent, WA
Private Driveway to
Plant 1,500 2008
Table D-3. Permeable pavement parking lot installations in the Pacific Northwest. Permeable Pavement Location Application Quantity
(yd2) Construction
Year Contact
Concrete Canyon Crossing Safeway 5608 176th Street East Puyallup, WA
Parking Lot and Truck
Delivery Lane 7,300
Bob Waage, Contractor SGA Construction (206) 533-2191
Concrete SeaTac Fire Station –HQ 3521 South 170th Street SeaTac, WA
Parking Lots 10 in. thick 4,000 Pat Patterson
(206)793-6644
Concrete
Brightwater Reclaim Water System Section 2 14120 NE 124th Street Redmond, WA
Parking Lot 122 Micheal Lugauer Scarsella Bros., Inc. (253) 261-9654
Concrete Quil Ceda Creek Casino 6410 33rd Place NE Marysville, WA
Parking Lot 22,222 Jim Redfield (360)716-5028
Concrete Safeway 1645 140th Ave NE Bellevue, WA
Parking Lot and Truck
Delivery Lane
Concrete
Washington Aggregates & Concrete Association 22223 7th Ave. South Des Moines, WA
Parking Lot (206) 878-1622
Concrete Snoqualmie Gourmet Ice Cream Maltby, WA
Driveways, Pathways,
Parking Lot 2005

161
Permeable Pavement Location Application Quantity
(yd2) Construction
Year Contact
Asphalt Port of Portland Terminal 6 Portland OR
Auto Storage Lot 173,000 2006
Asphalt Apex Karting New Market St SW Tumwater, WA
Parking Lot 2008
Asphalt Olympia High School Henderson & North St. Olympia, WA
Parking Lot 2008
Asphalt and
Concrete
WSU Puyallup Ext. Puyallup, WA Parking Lots 750 of
each type 2009
Table D-4. Permeable pavement sidewalk installations in the Pacific Northwest. Permeable Pavement Location Application Quantity
(yd2) Construction
Year Contact
Concrete SR 900 MP 20 to MP 21.6 Issaquah, WA
Sidewalk 5,000 2009
Concrete
City of Olympia North Street Between Henderson Blvd. & Cain Rd. Olympia, WA
Sidewalk 800 1999
Concrete
RW Johnson Blvd/21st Avenue Black Lake Blvd. to Tumwater City Limits Olympia, WA
Sidewalk & Bike Lane 4,614 2006
Concrete King County Military Rd & 272nd Street King County
Sidewalk 2007 Jim Sussex King Co. Senior Env. Engr. [email protected]

162
Permeable Pavement Location Application Quantity
(yd2) Construction
Year Contact
Concrete City of Poulsbo Caldart Avenue Poulsbo, WA
Sidewalk 1,200 2006
Andrzej Kasiniak Engineer akasiniak@cityof poulsbo.com
Concrete Boulevard/Log Cabin Rd. Roundabout Olympia, WA Sidewalk 2010
D.6 Permeable Pavement Installations at High Traffic Sites
The known installations of permeable pavement in the U.S. at sites subject to high volume or high speed, or heavy loads are shown in Table D-5. Many of these installations have been heralded as being “high” traffic sites that may be similar in traffic count and truck loads to typical Washington urban highways. Comparisons of average daily traffic and ESALs (truck traffic) for the permeable pavement installations with those from typical WSDOT highways through urban areas show the low amount of traffic and trucks on these installations. Table D-2. Information on installation of permeable pavements at “high” traffic sites versus typical Washington State urban highways.
Roadway Length (ft.)
No. of Lanes
Build Year
Studded Tires Use
Average Daily
Traffic
Equivalent Single Axle Loads
(yr)
Type of Pavement
Rt. 87 Chandler, AZ 3,500 6 1986 No 30,000 114,0001 Perm. Asphalt
Mall Road, South Portland, ME 1,725 6 2009 Yes 16,750 Perm. Asphalt
Decatur Street, Olympia, WA 260 2 2007 Yes 3,000 Perm. Asphalt
MnROAD Low Vol. Lp., Cell 86 500 2 2008 No 572 49,0003 Perm. Asphalt
MnROAD Low Vol. Lp., Cell 88 500 2 2008 No 57 49,000 Perm. Asphalt
MnROAD Low Vol. Lp., Cell 85 500 2 2008 No 57 49,000 Perm. Concrete

163
Roadway Length (ft.)
No. of Lanes
Build Year
Studded Tires Use
Average Daily
Traffic
Equivalent Single Axle Loads
(yr)
Type of Pavement
MnROAD Low Vol. Lp., Cell 89 500 2 2008 No 57 49,000 Perm. Concrete
MnROAD Low Vol. Lp., Cell 39 500 2 2008 No 57 49,000 Perm. Concrete
Evolution Pav. Res. Salem, OR 160 2 2003 No 80 29,000 Perm. Concrete
Miles Sand & Gravel, Kent, WA 600 2 2008 No 30 80,000 Perm. Concrete
I-5, Plum Street, Olympia, WA - 6 - Yes 65,000 2,000,0004 Conv. Asphalt
I-5, City Center, Tacoma, WA - 8 - Yes 115,000 2,500,000 Conv. Concrete
SR 510, Lacey - 4 - Yes 333,000 Conv. Asphalt
SR 101, Tumwater - 6 - Yes 1,200,000 Conv. Asphalt
SR 507, Centralia - 2 - Yes 67,000 Conv. Asphalt
SR 507, Yelm - 2 - Yes 467,000 Conv. Asphalt
SR 101, Shelton - 2 - Yes 320,000 Conv. Asphalt
SR 3, Bremerton - 4 - Yes 453,000 Conv. Asphalt
SR 99, SeaTac - 6 - Yes 180,000 Conv. Asphalt
SR 542, Bellingham - 2 - Yes 200,000 Conv. Asphalt
SR 20, Anacortes - 2 - Yes 500,000 Conv. Asphalt
SR 2, Spokane - 4 - Yes 267,000 Conv. Asphalt 1 ESALs calculated was determined from a 20-year design period estimate of 2,270,653 ESALs. 2 The traffic on the MnROAD Low-volume Loop is one loaded truck that makes 80 laps per day, 5 days per week. 3 The loaded truck is an 18 wheel, 5-axle tractor/trailer that weighs 36.3 tons which calculates to be 2.34 ESAL/pass*80 pass/day*5 days/week*52
wk/year = 48,700 or 49,000 ESAL/year 4 All ESALs data for Washington highways from 2009 version of Washington State Pavement Management System (WSPMS).

164
Background and performance data for each installation is listed below. Pavement distress of any type on the permeable pavement roadways is of concern given the minimal traffic and truck loadings.
Rt 87, Chandler, AZ
There is no history of success for permeable pavements subject to high traffic volumes and truck loadings normally experienced on our mainline roadways other than the installation in Chandler, AZ. According to the literature it performed adequately for at least five years with respect to permeability and pavement condition and was not overlaid for a period estimated to be 20 years (Arizona DOT did not publish performance data on the section beyond the five year evaluation). Rutting of the permeable pavement was twice that of the conventional pavement at the five year evaluation. Also note that this is a state that, although allowing the use of studded tires, does not experience their use in most parts of the state, especially this particular location near Phoenix (Hossain et al. 1992).
Mall Road, South Portland, ME
Project was built to reduce the impervious surface area in the Long Creek watershed using American Recovery and Reinvestment Act (ARRA) funding. The Maine DOT bills this as the “first application of a porous paving system on a high volume public road in the Northeast” (MaineDOT). The project is too new to have performance data.
Decatur Street, Olympia, WA
The permeable asphalt section on Decatur Street in Olympia is showing some raveling as evidenced by the accumulation of small aggregate particles on the shoulder and a very rough surface texture due to the missing aggregate. This section of Decatur Street has no outlet so it is essentially a dead end street; therefore, the traffic is very light (City of Olympia).
MnROAD, Low-volume Loop, Various Cells
The Minnesota Department of Transportation built MnROAD, a roadway test facility, in 1990. There are two test roads; a mainline section gathers information from actual I-94 traffic, and a low-volume loop provides data from a single truck that makes multiple passes each day. Five permeable pavement sections were installed on the low-volume loop in 2008. Three 500 foot test cells were constructed using permeable concrete pavement and two with permeable asphalt pavement. Two each of the asphalt and concrete cells were built with the normal crushed stone bed for water storage and the third concrete cells was a permeable concrete overlay of an existing concrete pavement (Johnson et al. 2009) The following are remarks from MnROAD personnel regarding the performance of the permeable pavement cells:
“The concrete sections have some slight raveling, mainly around the joints. Also, there are some longitudinal cracks in some panels, indicating load related distress. The asphalt has

165
some rutting that could either be the asphalt or the open-graded base underneath. There’s also some snowplow damage along with some raveling over the winter. Not perfect, but much better than I expected after two winters.” (Tim Clyne, personal communication 5/11/10)
Raveling is the loss of rock from the surface of the pavement. Raveling around a joint indicates an area of weakness in the bond between the cement paste and the aggregate. Longitudinal cracking is a defect related to the loading of the pavement. The pavement was not strong enough to carry the load and therefore cracked. This is a serious problem at such an early age in the life of this particular pavement. The distress in the asphalt permeable pavement is also of concern because the rutting and raveling noted have occurred in the absence of studded tires.
Evolution Paving and Resources, Salem, OR
The permeable concrete sections built at Evolution Paving and Resources in Salem, OR had variable performance with some of the thinner sections actually failing. A variety of thicknesses and mix designs were used on the project at Evolution in an attempt to find designs that would work under heavy truck loads. Therefore, it was not a surprise that the sections with 4 and 5 inch thickness of permeable concrete failed. The sections with good performance were those with thicknesses in the 7 to 10 inch range.
Miles Sand & Gravel, Kent, WA
The entire project at Miles Sand & Gravel in Kent, WA was built using 12 inches of permeable concrete. Distress in the form of increased surface wear and cracking was noted in the section of the driveway where the loaded trucks make a 180 degree turn.
D.7 Meetings with Department of Ecology, the County Road Administration
Board and the Transportation Improvement Board
Minutes of Meeting Number 1, April 13, 2010
Permeable Pavement Proviso
Meeting Minutes for Tuesday April 13, 2010
Day/Time: Tuesday April 13, 2010, 1:00 – 2:30 PM Location: State Material Laboratory Main Conference Room Attendees:
Keith Anderson, WSDOT Dick Gersib, WSDOT Larry Schaffner, WSDOT

166
Greg Armstrong, TIB Chuck Kinne, WSDOT Megan White, WSDOT
Tom Baker, WSDOT Mark Maurer, WSDOT Liv Haselbach, WSU Rhonda Brooks, WSDOT Jeff Monsen, CRAB Walt Olsen, CRAB Jeff Carpenter, WSDOT Mark Russell, WSDOT
Purpose of the meeting: Proviso Requirements:
Additionally, the Department of Transportation shall work with the Department of Ecology, the County Road Administration Board, and the Transportation Improvement Board to explore and explain the potential use of permeable asphalt and concrete pavement in state highway construction as an alternative method of stormwater mitigation and the potential effects on highway pavement replacement needs.
Presentation: Literature review and initial findings Discuss: Quieter pavement experience with Open-Graded Friction Course Open Forum: Next step for potential research project and other discussions
Discussions: The Proviso was introduced and a question was asked why a report was requested. Reply: The Transportation Committee had inquired about the potential for permeable pavement to solve multiple needs. The State Materials Lab completed a literature search on permeable pavement. Keith presented an overview of the findings of the literature search. Literature search discussion – the following summarizes issues discussed in regards to the literature search:
Jeff C. pointed out that the costs given for the Anacortes work may not be representative since this is unfamiliar work.
Larry mentioned that Olympia’s permeable sidewalk at Mottman had a moss problem similar to the problem on North Street. Also, the path and trails at Olympia Sports Complex in Lacey were failing from the asphalt binder liquefying and becoming a gooey mess.
A several year old permeable concrete installation on Military Road near 272nd was mentioned.
Tom gave a brief overview of the WSDOT’s experience with OGFC quieter pavement test sites. The noise reduction was less than 3 dBA (the minimum sound difference detectable by the human ear) after six months on average when compared to a dense-graded asphalt control section.

167
Tom offered the idea of controlling the initial source (vehicles dropping oil containing heavy metals) through regulations and inspections instead of passing the mitigation along to WSDOT the secondary non-contributor agency. An Oregon State University study found that pavement material is not contributing source of pollutants. Permeable pavement stormwater system built on sloping terrain will likely be constructed using terraces and check dams for proper infiltration across a level floor. Rolling small wheels or walking with high heels across its rough uneven surface may have a limiting effect on its use. Liv Haselbach provided information about a variety of permeable pavement uses from around the country:
Two reports were introduced, “Evaluation of Thickness Design for use with Pervious
Concrete” and “Investigation into the Performance of Pervious Concrete.” The reports used data gathered from two concrete plants: Evolution Paving in Oregon and Miles Sand and Gravel in Washington. Loaded concrete delivery trucks drove over permeable concrete section upon exiting the site. The ESAL load was considered equivalent to what would be seen on residential road after 20-yrs of use.
Most permeable asphalt overlays are done in the southern states to help reduce tire spray although Maine has had some cold climate success. South Carolina uses permeable pavement overlays to keep ice from forming on the roads surface to increase safety and traction. (Although subsequent melting allows for gradient flow to a low spot where it may re-freeze on the roadway’s surface.)
The study done in Texas by Barrett suggests that pollutants get trapped at the boundary between the permeable pavement and the underlying impervious layer. The study also suggested that reduced tire spray prevented the washing of pollutants from the vehicle engine compartment. (Tom questioned what happens to these metals when the pavement is milled for rehabilitation. Do these metals become airborne during the process, are the millings taken to a hazardous land fill, or are the millings reprocessed back into new HMA)?
A moratorium was placed on the use of permeable pavement in the Denver Colorado area a short time back. The lack of qualified permeable pavement contractors locally made it necessary to find qualified contractors outside the area. These contractors brought with them mixes designed for southern climates. These mixes failed in the localized climates. New approved mixes have been designed for the localized climate (contact Ken MacKenzie e-mail [email protected])
A permeable asphalt pavement project is slated for construction in the Yakima area this summer (contract Brian Cochrane e-mail [email protected])
A Vancouver, WA company was manufacturing permeable pavers. Permeable concrete mixes with compressive strengths upwards to 6,000 psi have been
designed. The permeable concrete infiltration rate far exceeds requirements. The trend is to accept a slightly reduced infiltration rate for a much higher strength. A

168
recent Iowa study suggested the addition of certain additives and sand improve strength.
Alaska was using permeable pavement beneath conventional pavement surface as an insulation barrier between the permafrost and pavement surface.
A slip form paver has been developed for permeable pavement. Some minimal additional training is needed for operators plowing permeable
pavement. Snow on the plowed surface lodges into the void spacing making the surface still appear white and unplowed.
South Carolina recently installed a permeable asphalt stormwater mitigation facility constructed with 6-inches of permeable HMA and 18-inches and of recharge rock at $5/sf or $45/SY.
South Carolina has constructed permeable pavement systems at beach locations successfully. A geotextile layer was placed directly beneath the permeable pavement to block sand and silt from entering the storage bed.
Removing moss growth using standard maintenance practices restores infiltration without any long term effects.
Evidence suggests that the pH of permeable concrete may aid the breakdown of heavy metals making permeable concrete better at this than permeable asphalt.
Tom asked TIB and CRAB about their thoughts on potential uses. TIB responded saying that most agencies cannot afford the cost of a failure making them unwilling to take a risk on something experimental. CRAB echoed the same sentiments. Jeff C asked what maintenance or methods is used to rehabilitate. Liv responded that a small area can be back filled with conventional pavement. A small impervious area will have only a limited affect to the overall system. If the permeable HMA surface is deteriorating or permanently plugged, it can be milled off and a new permeable HMA placed. Total replacement may be required if no other options are available. Where can it be used?
A consensus was it cannot be used on mainline A shoulder application may be possible A permeable concrete overlay
Jeff C asked if there is a ratio of lane to shoulder if a shoulder application is considered.
Standard I-5 shoulders are 8 to 12 ft wide Liv offered that receiving the sheet flow from a couple of lanes would be good trial
application Jeff C stated that placement should be 2 feet outside the edge stripe. Wandering traffic
will travel beyond the lane edge damaging the permeable pavement.
Minutes of Meeting Number 2, May 25, 2010
Permeable Pavement Proviso Meeting Minutes for Tuesday May 25, 2010

169
Day/Time: Tuesday May 25, 2010, 9:00 – 11:00 AM Location: Capital Professional Center. Lacey, WA Attendees:
Tom Baker, WSDOT Ruth McIntyre, WSDOT Jim Weston, WSDOT Dave Erickson, WSDOT Ed O'Brien, DOE Liv Haselbach, WSU Dick Gersib, WSDOT Mark Russell, WSDOT Chuck Kinne, WSDOT Larry Schaffner, WSDOT Foroozan Labib, DOE Jeff Uhlmeyer, WSDOT
Purpose of the meeting: Proviso Requirements:
Additionally, the Department of Transportation shall work with the Department of Ecology, the County Road Administration Board, and the Transportation Improvement Board to explore and explain the potential use of permeable asphalt and concrete pavement in state highway construction as an alternative method of stormwater mitigation and the potential effects on highway pavement replacement needs.
Mark’s presentation: Literature review, initial findings, and progress updates Tom’s discussion: Quieter pavement experience with Open-Graded Friction Course Open Forum Discussions: Tom gave a brief introduction on the Proviso and its directives regarding Pavement Management, Life-cycle Cost, and permeable pavement. The permeable pavement directive requested WSDOT’s to report on the possibility that permeable pavement could be used to resolve multiple needs. An announcement was made that 2009-2010 Budget Committee had moved the reports due date up two months to September and a draft of the report would be available in June. Mark presented the permeable pavement literature review, status update, overview of the functionality and limitations, and WSDOT’s experience. Tom gave a brief overview of the WSDOT’s OGFC experience with three quieter pavement test sites: I-5 Lynnwood, SR-520 Medina, and on SR 405 Bellevue. The noise reduction only lasted six months at each site before the noise level of the quieter pavement sections was acoustically equal (less than 3 dBA difference) to that of conventional pavement. OGFC on the two older sites, I-5 Lynnwood and SR-520 Medina are raveling and rutting. The I-5 Lynnwood site is scheduled for repaving this summer. Our conventional dense-graded HMA lasts about 15 years in Washington. Utah reported its OGFC lasted about 7 years. OGFC has been used successfully in the Southern states which don’t have studded tires in use.

170
Texas reported it had a capacity to trap metals. The question regarding what happen to the milled RAP from an OGFC containing trapped heavy metals is unanswered. Does it become hazardous waste or can it be recycled? Open Forum Discussions: Dick mentioned the outer half of outside shoulders and sag points may be a good places for permeable pavement use. The current BMP allows the runoff to sheet flow onto vegetated embankment. Recent maintenance changes now allows grasses to encroach near to the paved shoulder edge causing soil deposit to build up concentrating runoff and causing erosion to occur. Using permeable pavement along the shoulder to capture the runoff before it reaches the embankment provides an opportunity for placement. Ed mentioned sites where permeable pavement was used in shoulder applications in Portland and another where the shoulder received considerable starting and stopping truck use. City of Seattle permeable shoulders required more frequent cleanings. Liv commented:
North Carolina tried to clog the permeable pavement surface with soil. The infiltration rate reduced to the soil’s infiltration rate. Cleaning increases infiltration, but never restores it to its initial rate
An additional benefit of filter fabric, besides stopping migrating fines, is its lateral structural support
Runoff captured by permeable shoulders must be directed away from load carrying pavement’s structure
A New Hampshire study claims phenomenal benefit in lessening the amount of snow removal and deicing agents required
Minnesota study of a permeable concrete overlay was being done as at the MnROAD Test Track
Reduces heat island effects International committee may not recommend its use if lighting is an issue. It has poor
light reflectivity characteristics Ed commented:
Raveling had not been an issue at the Olympia Decatur Street project. Contact Craig with the City of Olympia for details
WSU was currently sampling the runoff for quality at its installation site in Puyallup Future usage by city, county, and state
Tom commented on OGFC type permeable pavement:
Limit to light loading, sidewalks, and other similar applications Raveling high and not many high volume facilities built Noise reduction benefit is small and short lived Some splash/spray benefits Standard BMP is sheet flow off shoulders onto a vegetated strip No indicated plans for use by CRAB and TIB

171
Material has 20 percent void space with low compressive strength suited best for parking lots and low ESAL residential streets
Ed discussed current DOE initiative and long range objectives (participants, statements, questions, and comments):
DOE is currently working with the Puget Sound Partnership advisory committee on an update of Phase 1 and 2 of the Puget Sound Basin Water Quality Manual. Part of the LID update will likely call for performance based guidelines that will likely necessitate permeable pavement, “Everyone will be using permeable pavement.”
Sheet flow runoff from conventional pavement can be captured at the shoulder edge and re-directed beneath roadway and infiltrated to fulfill the requirement.
Does WSDOT want to go about this on its own or work with DOE? DOE would like to work with WSDOT and be in agreement on where it can and cannot be used. Where do we draw the lines?
The report must provide reasoning as to why quantifiable amount of moisture cannot allowed beneath roadbed. If cost is part of the reasoning considers, the cost must be determined to be unreasonable.
Runoff detention ponds have not recharged enough groundwater to adequately maintain summer stream flow levels.
It is likely that the new LID requirements will set a hydrological flow standard. A toolbox of some possible solution will be given such as permeable pavement, rain garden (harvesting tanks from rooftop collection). (Ruth thought a performance standard was the better approach. It rewards ingenuity.)
Forest soils tend to retain moisture like a sponge. Stripping the forest topsoil away and exposing the underlying non-organic soils removes the moisture retaining pre-developed capacity.
Concerns about building storage into the subgrade need to be answered. Drawing the line as to where it can be used, parking lots, park and rides, and low ADT routes, and where it cannot be used needs to be established. A study of permeable concrete installed at Miles Sand and Gravel indicates it has potential in higher load applications.
(Tom state that raveling increased at the OGFC quiet pavement sites shortly after the December 2008 snowstorm.) If freeze-thaw is an issue, then it needs to be stated in the report.
(Larry, various claims are being made. WSDOT’s issues are loading, climate, and life-cycle cost.) The next WSDOT permit issued by DOE will include expansion and the maximizing of permeable pavement use. The permit will likely be challenged in court by environmental groups under the Clean Water Act. Why or why not it can be used needs to be fully document. (Larry, where it is feasible needs to be documented).
(Ruth, What about water quality?) Water quality issue has not been conclusively determined. Treatment credit will be based on the underling soil’s cation exchange capacity. The soil needs organic characteristics. If the soil does not have the correct characteristics it must be amended using a sand filter capable of infiltrating 2.4 in/hr. (Dave asked if a formula for the soils available.) Curtis Hinman, an Associate Professor with Washington State University Extension, is studying water quality issues and rain garden soils.

172
Dissolved metals entering the groundwater has been an issue. (Tom asked if similar regulation and inspection programs used to monitor vehicle’s air pollution be used to inspect oil droppings from vehicles.) Last session the legislator outlawed copper brake pads. There was no mention of a mandatory inspection program. Recommend the idea in the report. Using vehicle inspection as a means to control air pollution differs when it comes to using it controlling water pollution. Water quality issues are localized where air pollution are regionalized. Pollutants enter localized water sheds. The trade offs are different.
The report mentioned nothing from Europe and nothing on concrete lattice blocks. A statement saying the US EPA in 1999 does not recommend permeable pavements
needs to be backed-up in the report. The statement cannot stand by itself. (Jeff stated that OGFC has not performed well). The drain-down problem has been fixed.
Failures have to be managed and minimized. (Larry said there is a liability issue with raveling. We need to stay with gross generalities as to why permeable pavement was a success or failure.) There are some 20 year permeable pavement projects constructed by Cahill and others on the east coast.
Using cost to support why permeable pavement can or cannot be used is inadequate. The value of the loss to aquatic downstream natural resources and the health of the stream cannot be quantified. It has been determined that using this argument is illegal under the Clean Water Act. Arguments about cost need to be avoided. WSDOT has just a ribbon of highway having a small overall impact compared to the 2/3rds of the urban landscape covered by impervious surface. Many of the applications given in the report for permeable pavement use are agreeable. (Dave said that the approach of mandating a performance standard with a few mitigating tools is not reasonable). A performance standard is likely to be implemented by the Puget Sound Partnership and there is just not any other way to meet the standard without permeable pavement. (Larry said to identify LID site and sub-division. Determine the barriers for using permeable pavement. We need to participate in defining the finding DOE and WSU permeable pavement applications). (Tom state that residential developments are logistically, functionally, and potentially doable for LID development).
(Tom asked about redevelopment) There is no clear understanding for now. (Tom said that the Proviso mentions WSDOT is to partner with DOE. Are there things
DOE would like to contribute?) I need to consult with management first. The Puget Sound Basin Water Quality Manual jurisdiction is for all of Western
Washington. Nothing for the east side as of now, but something will be available later.
CRAB Position Statement
Use of Permeable Asphalt and Concrete Pavements on County Road Projects in Washington State Comments from Walter R. Olsen, PE, Deputy Director, County Road Administration Board With only a few permeable asphalt and concrete contractors and producers capable of producing quality material in Washington State, increasing the use of permeable concrete and asphalt

173
products by county road and public works departments is an intimidating task at best. Preliminary surveys indicate that a few Western Washington counties have already used permeable concrete and asphalt products on some of their current construction projects, principally in parking lots, driveways and pathways. While it is possible to increase the number of road construction projects using permeable concrete and asphalt, mostly in shoulder and gore area applications, attention must be given to insuring the success of projects by selecting the right technique for the right results on the right project. Project selection criteria must be established that assesses existing pavement conditions, climatic effects, construction and material defects, surface and subsurface problems, traffic volumes and characteristics, safety, contractor availability and favorable overall benefit-cost ratio. Over enthusiastic use of permeable concrete and asphalt products and methods merely for the sake of increasing the appearance of environmental responsibility could lead to some projects costing more than is beneficial and failing to perform as advertised. The design life and life-cycle costs, susceptibility to frost damage, potential soil/water/concrete chemical interactions, added maintenance and construction costs, and aggregate choking issues all need to be studied much more before county road departments will be assured that these products and methods are deserving of the investment of the scarce public resources. Traditional solutions applied for winter county road maintenance in many areas of the state would have to be suspended or severally modified in order to accommodate the use of asphalt and concrete permeable pavements. This may not deliver the level of service or safety that the public has come to expect. The resulting failures would reinforce eroding public opinion of the local government’s ability to deliver on the promise to invest the public’s tax dollars wisely. Limitations exist with all methods of asphalt and concrete permeability and only sound engineering judgment for safe, maintainable roadways, and experienced contractors will produce the results necessary to justify the cost and environmental opportunities of the processes. Finding ways to maximize those opportunities will also require an increased commitment from the asphalt and concrete producers to increase capacity to perform the projects available, on time and on budget. Without this commitment of resources from the private sector, many projects that could benefit from increased asphalt and concrete permeability will remain unable to comply. Increased capacity must also be better distributed geographically across the state so that more jurisdictions can take advantage of contractor availability with reduced mobilization. Experienced contractors will be in great demand and new contractors entering the field will need to provide consistent acceptable results in order to remain in competition for the increased number of projects. Since investment in the equipment and labor necessary to accomplish the work is sizable, established contractors with proven records of accomplishment and performance should be encouraged to expand into the field. As the cost of operation increases, some contractor’s profit margins may begin to erode and the possibilities for failures in contract completion within scope and budget parameters will increase. While the opportunity to maximize the use of permeable concrete and asphalt products is a laudable goal, there are challenges and pitfalls to be faced. Further research and development of

174
repeatable, improved performance on well documented, appropriate demonstration projects may, over time, lead to more cooperation and commitment by the State Legislature, Department of Transportation, the 39 counties of the state and the asphalt and concrete producers of Washington in the use of asphalt and concrete permeable pavements.
TIB Link to Project Selection Criteria http://www.tib.wa.gov/grants/forms/Forms.cfm
TIB gives credit for the use of permeable pavement in their selection critera found at the following web site. Permeable pavements are mentioned in the Sustaiinability section in three of the four forms listed under the Funding Applications heading. The Small City Preservation Program (SCPP) does not mention the use of permeable pavement.
D.8 References for Appendix D
American Concrete Institute (ACI) 2006 Pervious Concrete. Reported by ACI Committee 522. ACI 522R-06. Barrett, Michael E. 2006 Stormwater Quality Benefits of a Porous Asphalt Overlay. Center for Transportation Research, University of Texas at Austin, FHWA/TX-07/0-4605-2. July. Briggs, Joshua .F. 2006 Performance Assessment of Porous Asphalt for Stormwater Treatment. M.S Thesis. University of New Hampshire, December. Budhu, Deodat. 2007 Holey Success. Public Works Magazine 2007-04-01, April . Cahill, Thomas. 1994 Technical Note 21 – Urban Best Management Practices. Watershed Protection Techniques, Vol. 1, No. 2, Summer. Cahill, Thomas., Michael Adams, and Courtney Marm 2003 Asphalt the Right Choice for Porous Pavements. Hot Mix Asphalt Technology, September/October. Cahill, Thomas, Michael Adams, and Courtney Marm 2005 Stormwater Management with Porous Pavements. Government Engineering, March–April. Cavaliere, Frank. 2007 Smokey Point Concrete. Concrete InFOCUS, Vol.5 No. 4, Winter. Chopra, Manoj, Marty Wanielista, Craig Ballock, and Josh Spence 2007 Construction and Maintenance Assessment of Pervious Concrete Pavements Final Report. Stormwater Management Academy, University of Central Florida. Florida Department of Transportation. Tallahasee FL. January. Chopra, Manoj, Marty Wanielista, and Ann Marie Mulligan. 2007 Compressive Strength of Pervious Concrete Pavements Final Report. Stormwater Management Academy. Stormwater Management Academy. University of Central Florida. Florida Department of Transportation. Tallahassee FL. June. Christopher, Barry R., and Verne C. McGuffey 1997 Pavement Subsurface Drainage Systems NHCRP Synthesis of Highway Practice 239. Transportation Research Board. National Reserch Council. National Academy Press Washington D.C.

175
City of Issaquah. Rainier Blvd Street Improvements http://www.ci.issaquah.wa.us/Page.asp?NavID=1568 (accessed October 21, 2009). City of Olympia. Decatur Street Selected for Stormwater Low Impact Development Project http://www.ci.olympia.wa.us/~/media/Files/PublicWorks/PDFs/WaterResources/Decatur%20Street%20Low%20Impact%20System%20Porous%20Pavement.ashx (accessed November 10, 2009). City of Portland. A New Approach to Stormwater Management http://www.portlandonline.com/BES/index.cfm?a=77074&c=45435 (accessed November 10, 2009). City of Seattle. High Point Project http://www.seattle.gov/util/About_SPU/Drainage_&_Sewer_System/GreenStormwaterInfrastructure/NaturalDrainageProjects/HighPointNaturalDrainageSystem/ (accessed November 10, 2009). Cooley, Allen L., Jr., Jimmy W. Brumfield, Rajib B. Mallick, Walaa S. Mogawer, Manfred Partl, Lily Poulikakos, and Gary Hicks 2009 Construction and Maintenance Practices for Permeable Friction Courses NCHRP REPORT 640. Transportation Research Board, Washington, D.C. Delatte, Norbert, Dan Miller, and Aleksandar Mrkajic 2007 Portland Cement Pervious Concrete Pavement: Field Performance Investigation on Parking Lot and Roadway Pavements Department of Civil & Environmental Engineering. Fenn College of Engineering. Cleveland State University, Cleveland, Ohio, December. Evolution Paving Resource. Evolution Paving Case Study: Fred Meyer Vancouver, Washington. Http://www.evolutionpaving.com/CaseStudies/CaseStudy-FredMeyer.pdf (accessed November 10, 2009). Ferguson, Bruce C. 2005 Porous Pavements Integrative Studies in Water Management and Land Development. CRC Press. 2005. Fields, Richard, Hugh Masters and Melvin Singer 1982 An Overview of Porous Pavement Research American Water Resources Association. Volume 18 No. 2. pp. 265-270. April 1982. Hansen, Kent 2008 Porous Asphalt Pavements for Stormwater Management: Design, Construction and Maintenance Guide Information Series 131. National Asphalt Pavement Association. November 2008. Harrington-Hughes, Kathryn 2000 Primer-Environmental Impacts of Construction and Repair Materials on Surface and Ground Waters NCHRP Report 443. Transportation Research Board. National Research Council. National Academy Press. Washington D.C. 2000. Hossain, Mustaque, Larry A. Scofield, and W.R. Meier Jr. 1992 Transportation Research Records 1354. Developments in Flexible Pavement Design. Transportation Research Board, National Research Council. National Academy Press. Washington D.C. pp. 45-54. 1992. Houle, Kristopher M. 2008 Winter Performance Assessment of Permeable Pavements: A Comparative Study of Porous Asphalt, Pervious Concrete and Conventional Asphalt in a Northern Climate M.S Thesis. University of New Hampshire. September 2008.

176
Huang, Yang H. 2004 Pavement Analysis and Design. Pearson Prentice Hall. Upper Saddle River, NJ 2004. Hunt, William F., and Kelly A. Collins 2008 Permeable Pavement: Research Update and Design Implications. Urban Waterways. North Carolina State University, North Carolina Cooperative Extension Service. July 2008. http://www.bae.ncsu.edu/stormwater/PublicationFiles/PermPave2008.pdf (accessed December 2, 2009). Jackson, Newton 2003 Porous Asphalt Pavement Information Series 131. National Asphalt Pavement Association (NAPA), October 2003. Johnson, Ann, Timothy R. Clyne, and Benjamin J. Worel 2009 2008 MnROAD Phase II Construction Report Minnesota Department of Transportation. Office of Materials and Road Research. Maplewood, MN. June 2009. Joung, Youngmin and Zachary C. Grasley 2008 Evaluation and Optimization of Durable Pervious Concrete for Use in Urban Areas Texas Transportation Institute, Texas A&M University System, College Station, TX. February, 2008. Kevern, J.T., V.R. Schaefer and K. Wang 2009 Predicting Performance of Pervious Concrete Using Fresh Unit Weight ConcreteInfocus. November/December 2009. Maine Department of Transportation. MaineDOT to Use Innovative Paving System to Protect Long Creek Watershed http://restorelongcreek.org/docs/projects/MaineMallRdProject-web.pdf (accessed July 8, 2010). McCain, George N. 2010 An Investigation Into Porous Concrete Pavements for Northern Communities M.S. Thesis. University of Vermont. January 2010. Newman, Alan P., Stephen J. Coupe, Tim Puehmeier, J.A. Morgan, Janey Henderson, and Christopher J. Pratt 2004 Microbial Ecology of Oil Degrading Porous Pavement Structures Urban Drainage 2002 -- Global Solutions for Urban Drainage: Proceedings of the 9th International Conference on Drainage, September 8-13, 2002, Portland, Oregon, USA: American Society of Civil Engineers, 2004, 12 p. Northwest Cement Producers Group. WINCO Foods Vancouver, WA used two-thousand cubic yards of pervious concrete parking in its first phase of development. Street Talk Northwest Cement Producers Group. April, 2008. http://www.northwestcement.org/pdf/winco10-2007.pdf (accessed November 10, 2009). Nuth, Mathieu and Lyesse Laloui 2008 Unified Stress Framework for Modelling Unsaturated Soil Behavior Road Materials and Pavement Design – Water in Pavements. pp. 767-781. August 2008 Pratt, C.J., 1997 Design Guidelines for Porous/Permeable Pavements Proceedings: Sustaining Water Resources in the 21st Century Malmo, Sweden. pp. 196-211. September, 1997. Rogers, W. Matthew and Mike Faha 2007 Port of Portland Terminal 6 Porous Pavement Project: Sustainable Design In A Light Industrial Environment Land and Water Magazine. Vol. 51 No. 1. http://www.landandwater.com/features/vol51no1/vol51no1_2.html (accessed November 10, 2009).

177
St. John, Matthias S. and Richard R. Horner 1997 Effects of Road Shoulder Treatment on Highway Runoff Washington State Transportation Center. Washington State Department of Transportation. Report Number WA-RD 429.1 July 1997. Schaefer, Vernon R., Keijin Wang, Muhannad T. Suleiman, and John T. Kevern 2006 Mix Design Development for Pervious Concrete In Cold Weather Climates Center for Transportation Research and Education. Iowa State University. Ames, IA. Report 2006-01 February 2006. Stormwater Manager’s Resource Center (SMRC 2010a) . Stormwater Management Fact Sheet: Porous Pavement http://www.stormwatercenter.net/ (accessed on May 31, 2010). Stormwater Manager’s Resource Center (SMRC 2010b). Pollution Prevention Fact Sheet: Bridge and Roadway Maintenance http://www.stormwatercenter.net/ (accessed on May 31, 2010). Swisher, David 2002 Chemical and Hydraulic Performance of a Porous Pavement Parking Lot with Infiltration to Ground Water M.S. Thesis. Pennsylvania State University. Department of Civil and Environmental Engineering. December, 2002. Teggelaar, J.W., and R. D. Lisi 2009 Porous Asphalt Proven Successful in Cold Region: WBUUC Porous Parking Lot Cold Regions Engineering 2009: Cold Regions Impacts on Research, Design, and Construction, Proceedings of the 14th Conference on Cold Regions Engineering. Duluth, MN. September 2009. Tennis, Paul D., Michael L. Leming, and David J. Akers 2004 Pervious Concrete Pavements Portland Cement Association (PCA)/National Ready Mixed Concrete Association(NRMCA). PCA Serial No. 2828. 2004. TERRA (Transportation Engineering and Road Research Alliance) 2008 Pervious Concrete Minnesota Department of Transportation Office of Materials and Road Research November 2008 www.TerraRoadAlliance.org United States Environmental Protection Agency (EPA). 1999 Preliminary Data Summary of Urban Stormwater Best Management Practices. EPA-821-R-99-012. Office of Science and Technology Engineering and Analysis Division. Washington, D.C. August, 1999. http://www.epa.gov/guide/stormwater/ (accessed on November 18, 2009). United States Environmental Protection Agency (EPA) 1999 Stormwater Technology Fact Sheet Porous Pavement EPA 832-F-99-023. Office of Water. Washington D.C. September, 1999. Wanielista, Marty and Manoj Chopra 2007 Performance Assessment of a Pervious Concrete Pavement Used as a Shoulder for an Interstate Rest Area Parking Lot Final Report. Stormwater Management Academy, University of Central Florida Orlando, FL. June 2007. Washington State Department of Transportation (WSDOT). 2010. Standard Specifications for Road, Bridge, and Municipal Construction January 2010. http://www.wsdot.wa.gov/Publications/Munuals/M41-10.htm Washington State Department of Ecology (WA ECY). 2005 Stormwater Management in Western Washington, Volume III, Hydrologic Analysis and Flow Control Design/BMPs Publication No. 05-10-31, Department of Ecology, Olympia, WA, February 2005. http://www.ecy.wa.gov/pubs/0510031.pdf Yoder, E. J. Principles of Pavement Design 1959 John Wiley & Sons, Inc. Fourth Edition, August, 1965.