pavement preservation integration with pavement management€¦ · · 2009-11-30pavement...
TRANSCRIPT
Pavement PreservationIntegration with Pavement
Management
Edgardo D. BlockConnecticut Department of
Transportation
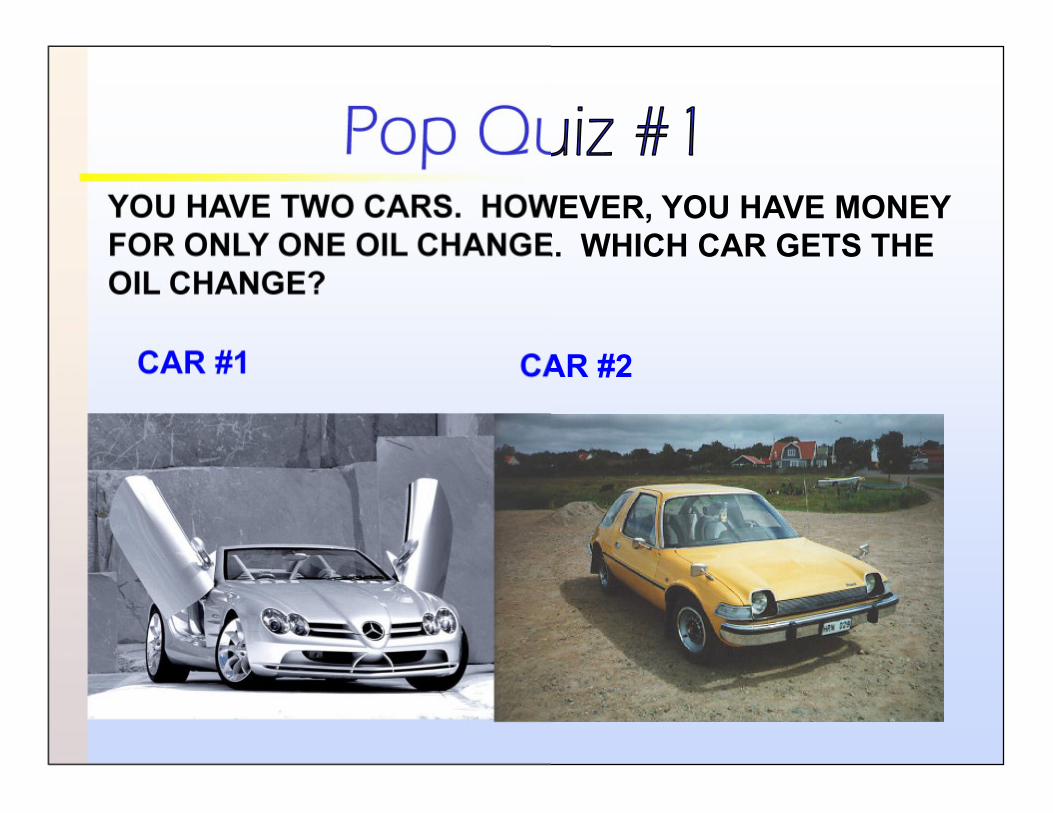
Pop Quiz #1YOU HAVE TWO CARS. HOWEVER, YOU HAVE MONEYFOR ONLY ONE OIL CHANGE. WHICH CAR GETS THEOIL CHANGE?
CAR #1 CAR #2
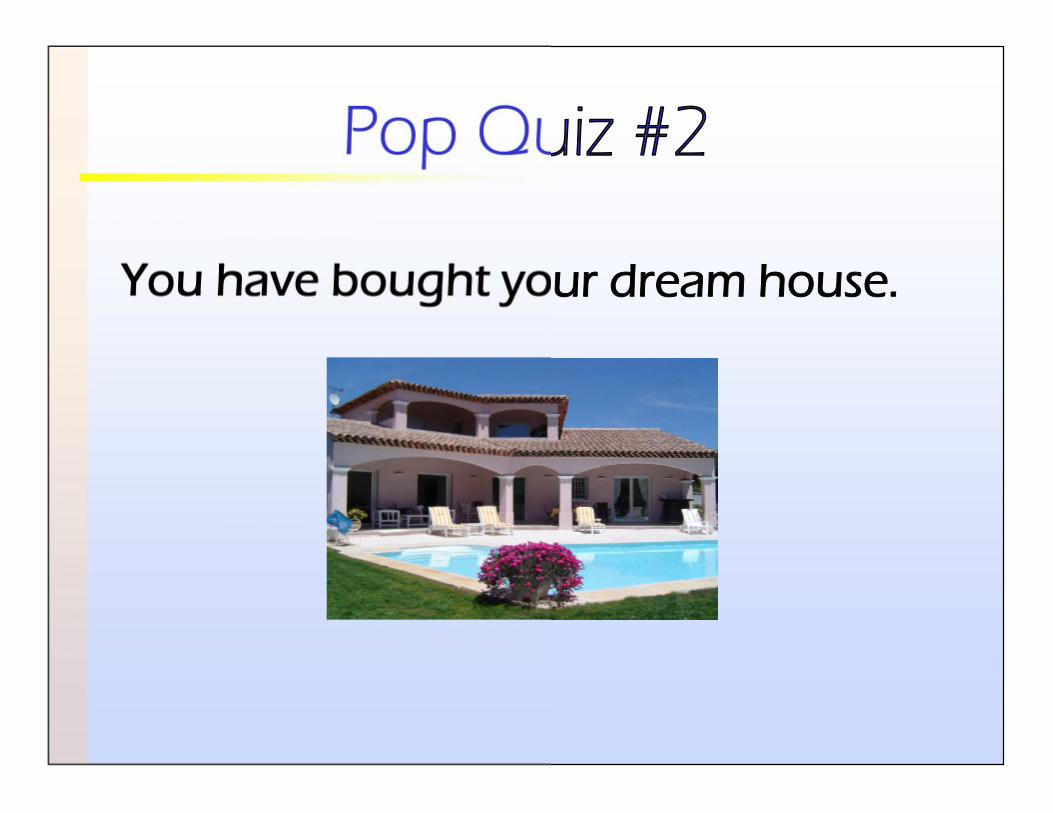
Pop Quiz #2
You have bought your dream house.
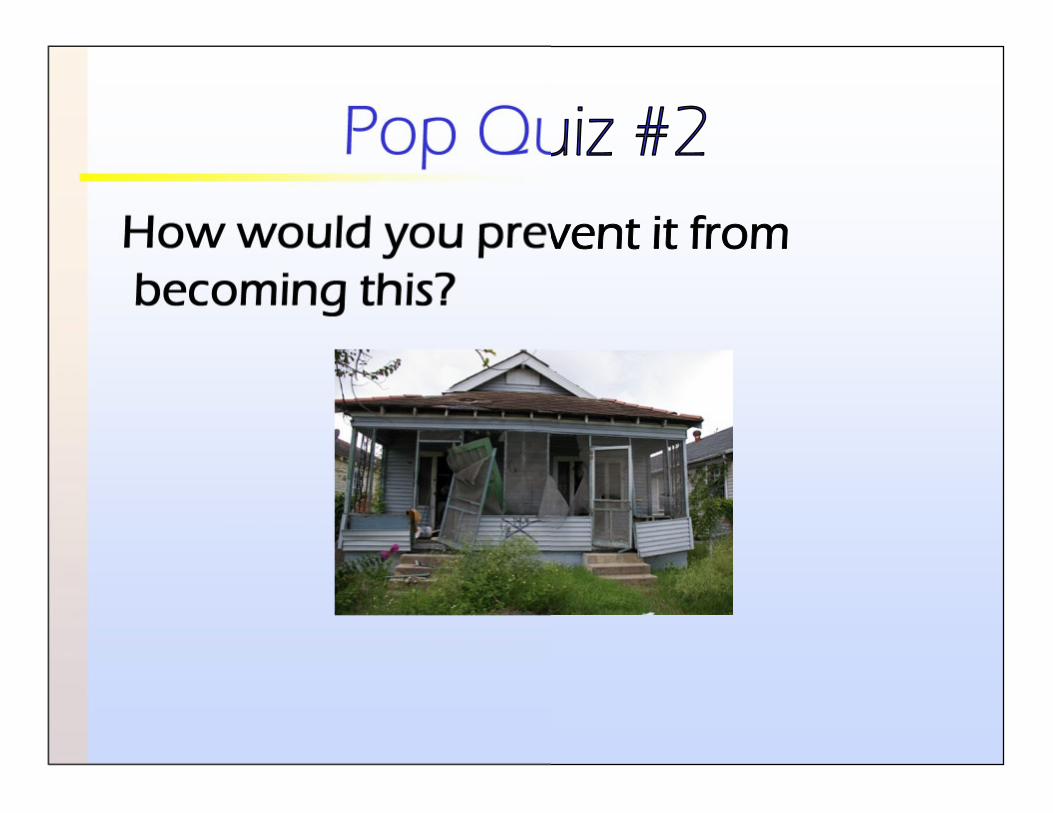
Pop Quiz #2How would you prevent it frombecoming this?
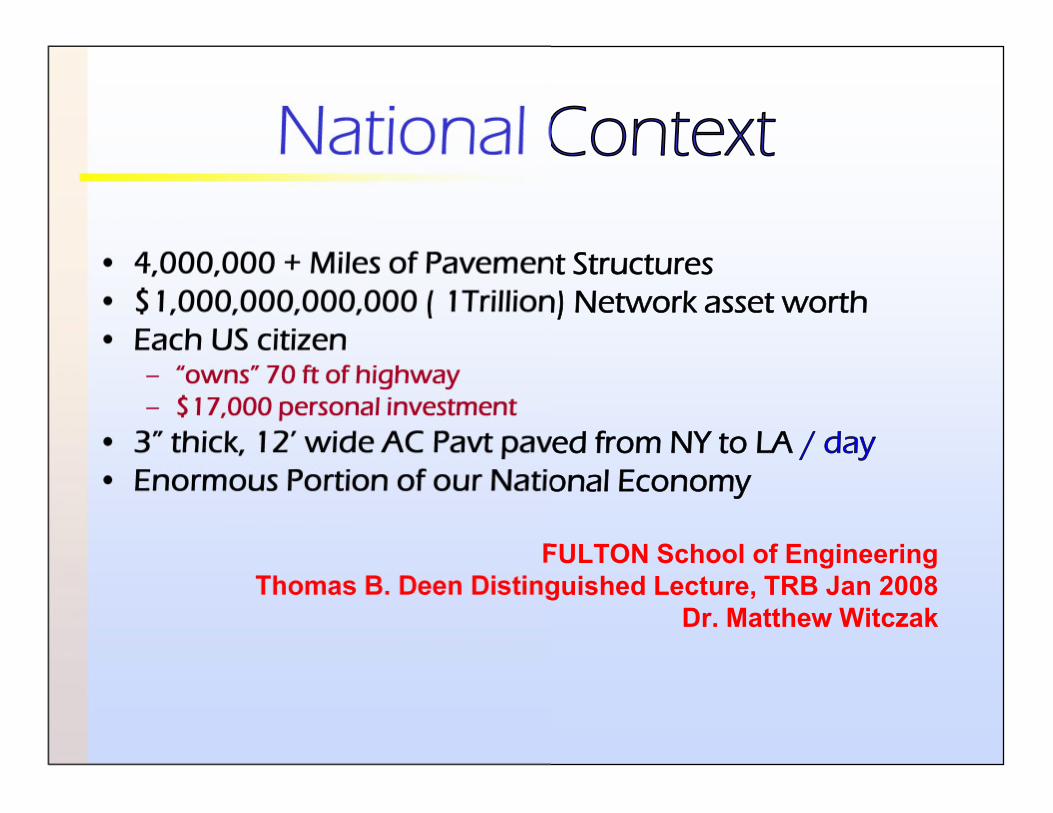
National Context
• 4,000,000 + Miles of Pavement Structures• $1,000,000,000,000 ( 1Trillion) Network asset worth• Each US citizen
– “owns” 70 ft of highway– $17,000 personal investment
• 3” thick, 12’ wide AC Pavt paved from NY to LA / day• Enormous Portion of our National Economy
FULTON School of EngineeringThomas B. Deen Distinguished Lecture, TRB Jan 2008
Dr. Matthew Witczak
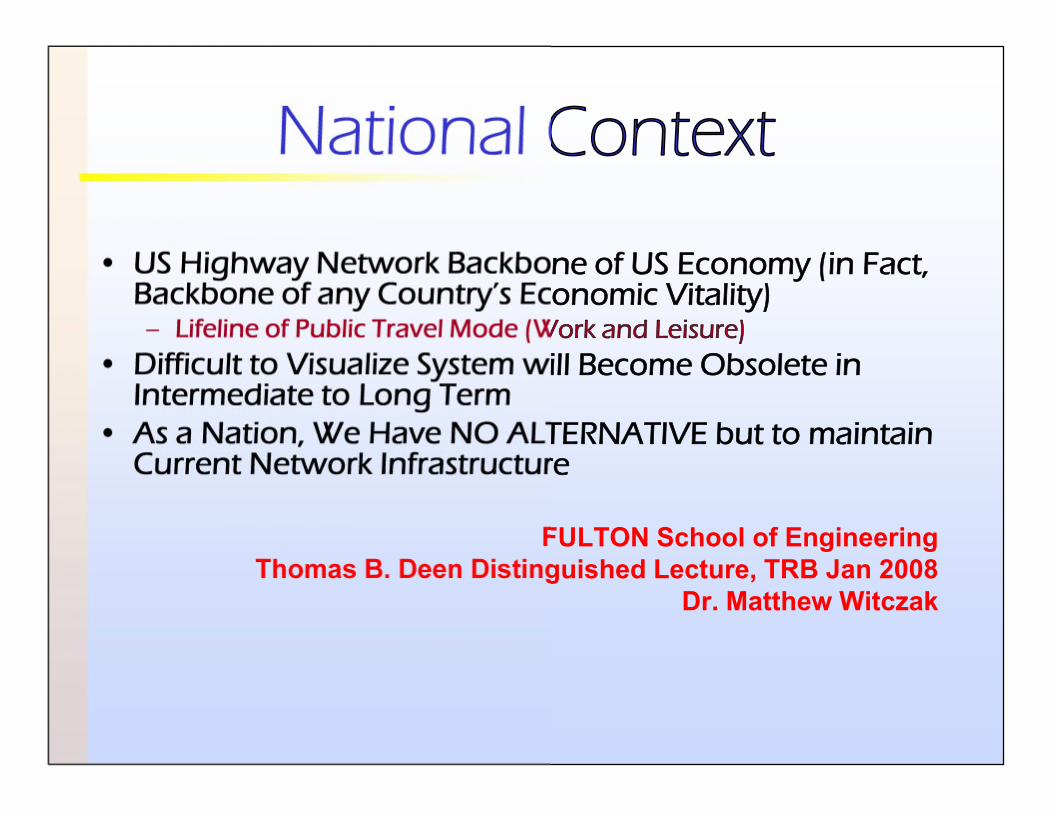
National Context
• US Highway Network Backbone of US Economy (in Fact,Backbone of any Country’s Economic Vitality)– Lifeline of Public Travel Mode (Work and Leisure)
• Difficult to Visualize System will Become Obsolete inIntermediate to Long Term
• As a Nation, We Have NO ALTERNATIVE but to maintainCurrent Network Infrastructure
FULTON School of EngineeringThomas B. Deen Distinguished Lecture, TRB Jan 2008
Dr. Matthew Witczak
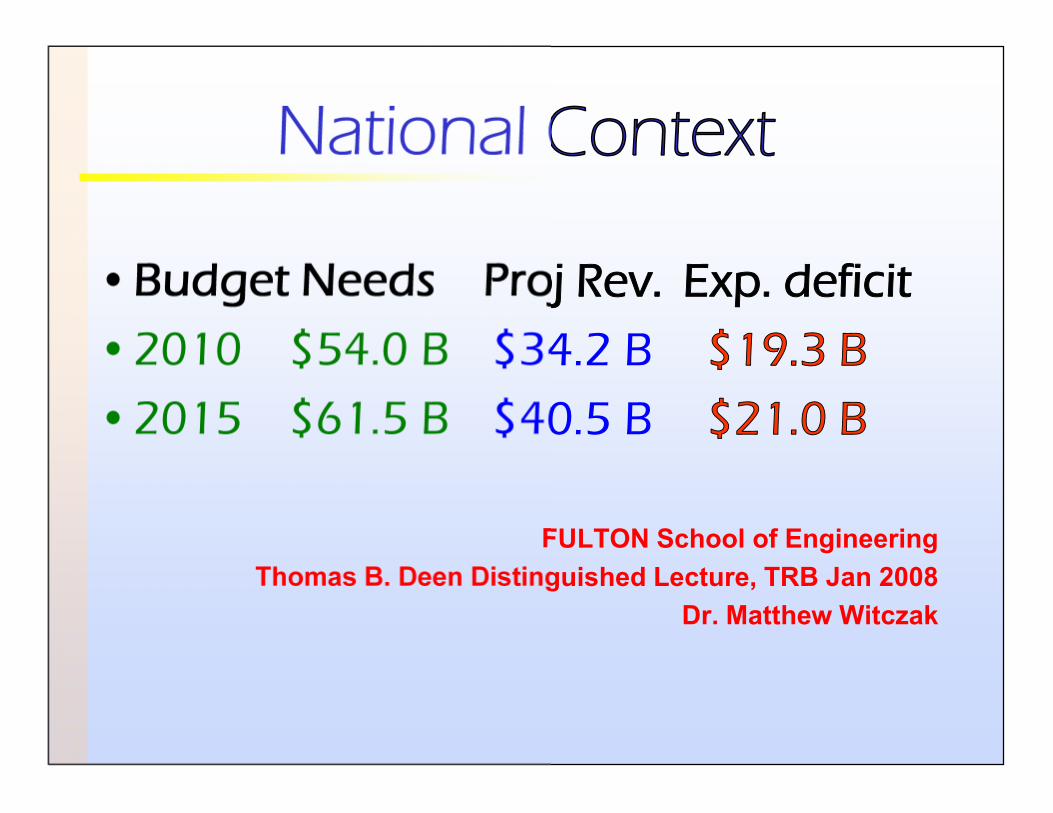
National Context
•Budget Needs Proj Rev. Exp. deficit
•2010 $54.0 B $34.2 B $19.3 B
•2015 $61.5 B $40.5 B $21.0 B
FULTON School of EngineeringThomas B. Deen Distinguished Lecture, TRB Jan 2008
Dr. Matthew Witczak
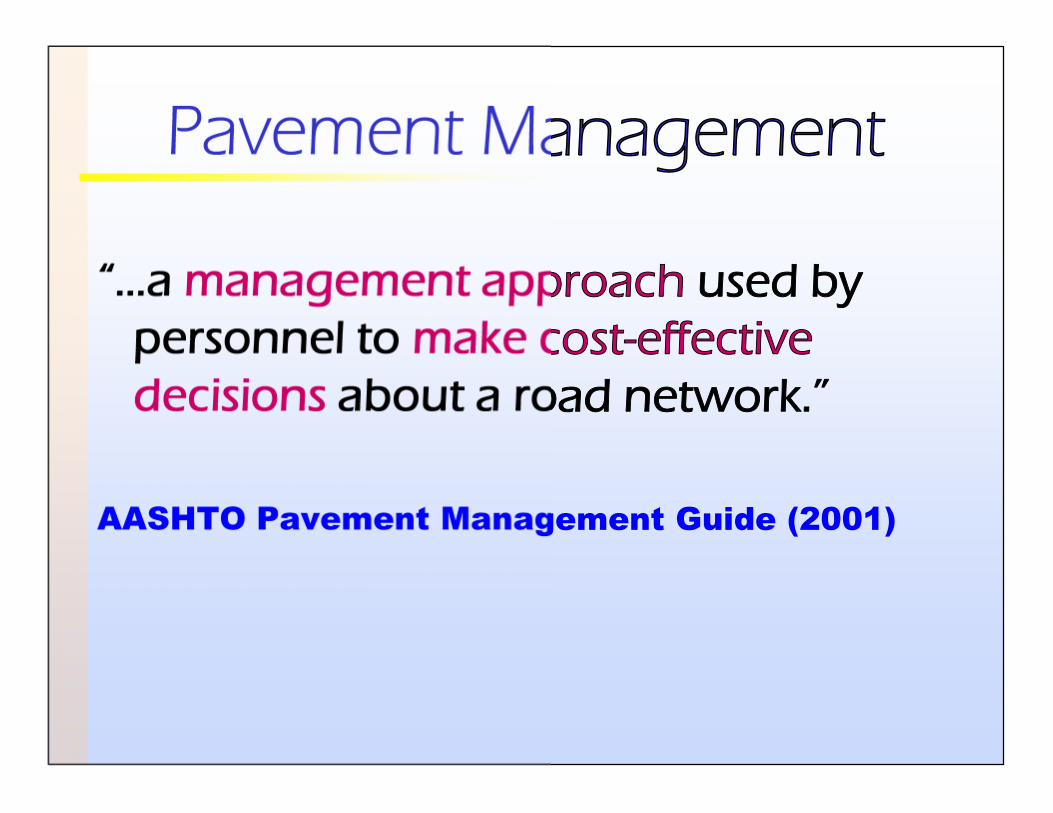
Pavement Management
“…a management approach used bypersonnel to make cost-effectivedecisions about a road network.”
AASHTO Pavement Management Guide (2001)
Pavement Management System
“…a set of tools or methods that assistdecision-makers in finding optimumstrategies for providing, evaluating,and maintaining pavements in aserviceable condition over a period oftime.”
AASHTO Guide for Design of PavementStructures (1993)
Decision Criteria
•Highest Benefit for Lowest LifecycleCost
•Condition Constraints set by Agency•Budget Constraints on Agency• In reality, not one highway segment
but many– 3800 centerline miles in Connecticut
•How do we do this?
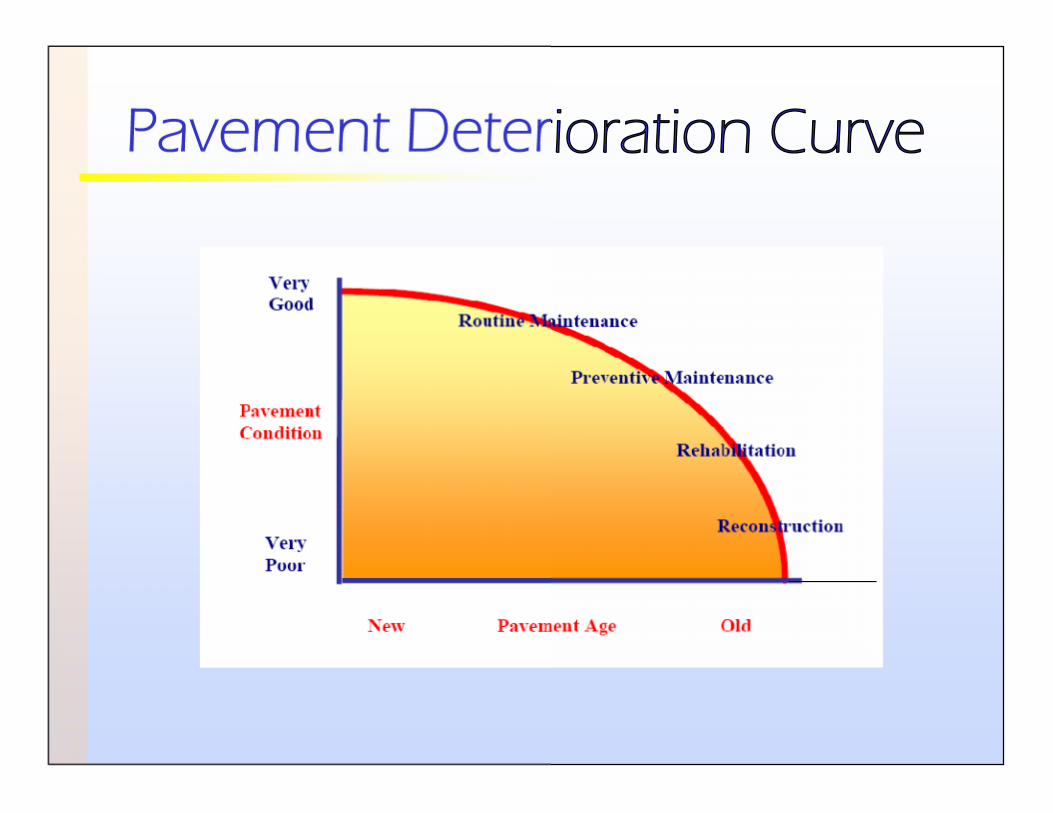
Pavement Deterioration Curve
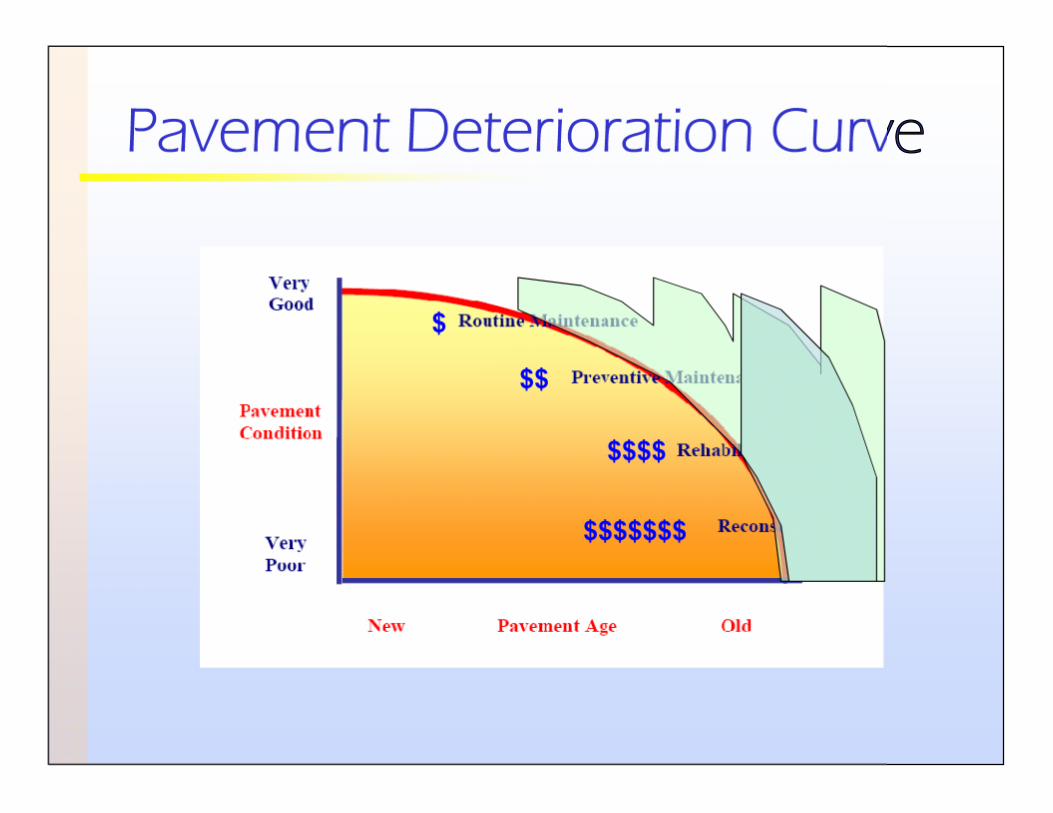
Pavement Deterioration Curve
$
$$
$$$$
$$$$$$$
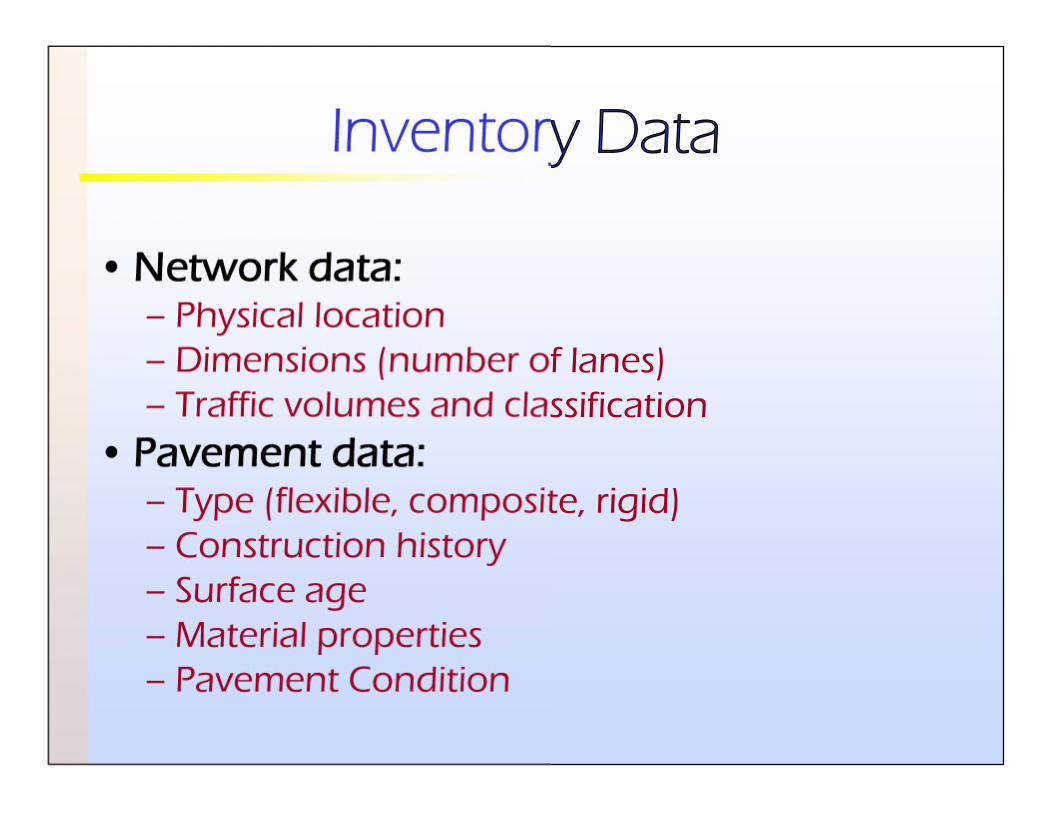
Inventory Data
• Network data:– Physical location– Dimensions (number of lanes)– Traffic volumes and classification
• Pavement data:– Type (flexible, composite, rigid)– Construction history– Surface age– Material properties– Pavement Condition
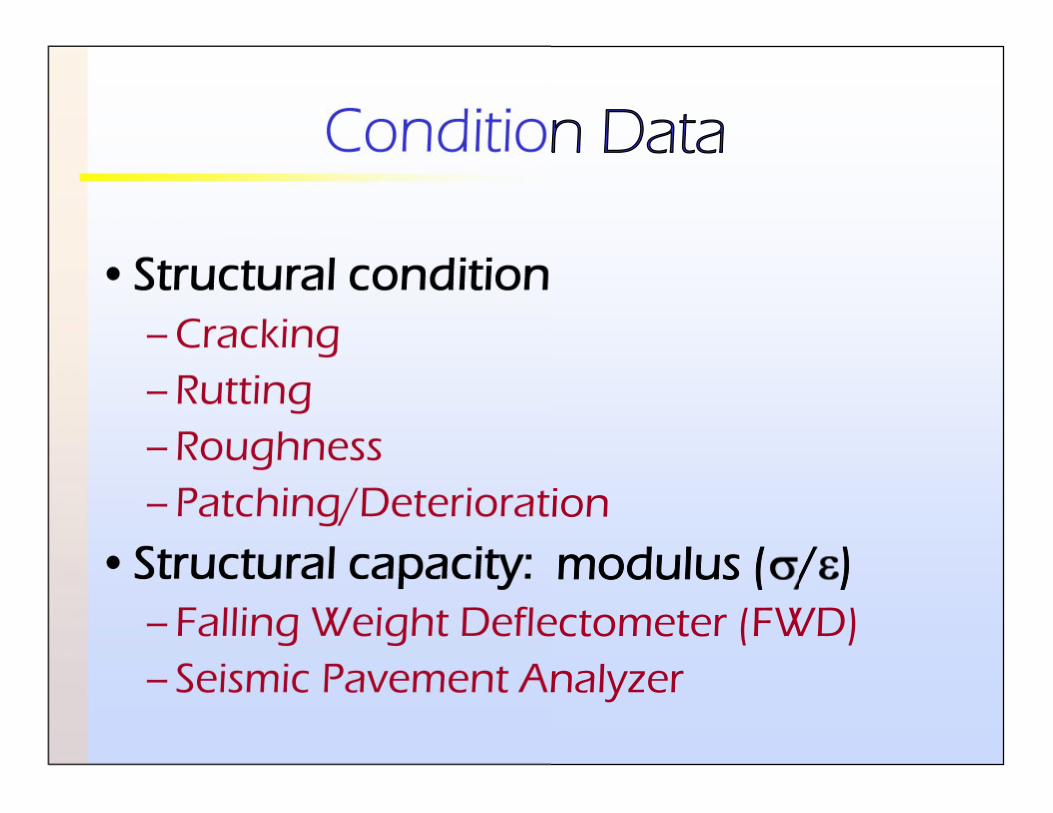
Condition Data
•Structural condition– Cracking– Rutting– Roughness– Patching/Deterioration
•Structural capacity: modulus ( / )– Falling Weight Deflectometer (FWD)– Seismic Pavement Analyzer
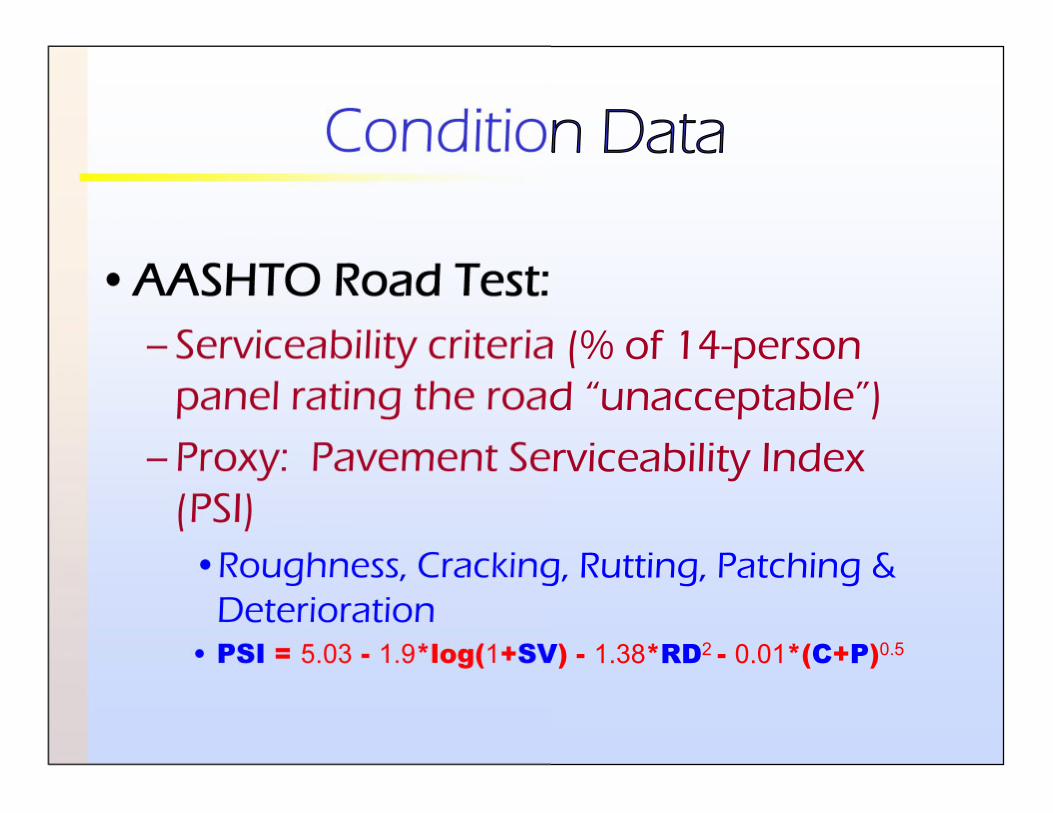
Condition Data
•AASHTO Road Test:– Serviceability criteria (% of 14-person
panel rating the road “unacceptable”)
– Proxy: Pavement Serviceability Index(PSI)•Roughness, Cracking, Rutting, Patching &
Deterioration• PSI = 5.03 - 1.9*log(1+SV) - 1.38*RD2 - 0.01*(C+P)0.5
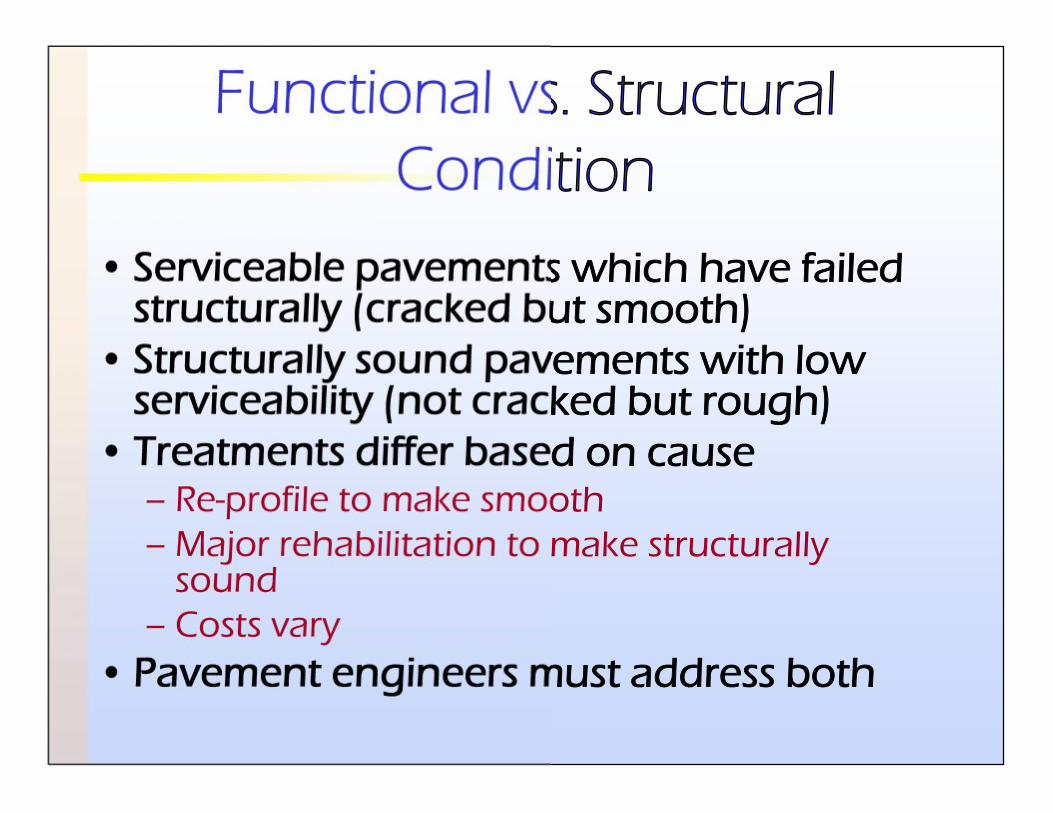
Functional vs. StructuralCondition
• Serviceable pavements which have failedstructurally (cracked but smooth)
• Structurally sound pavements with lowserviceability (not cracked but rough)
• Treatments differ based on cause– Re-profile to make smooth– Major rehabilitation to make structurally
sound– Costs vary
• Pavement engineers must address both
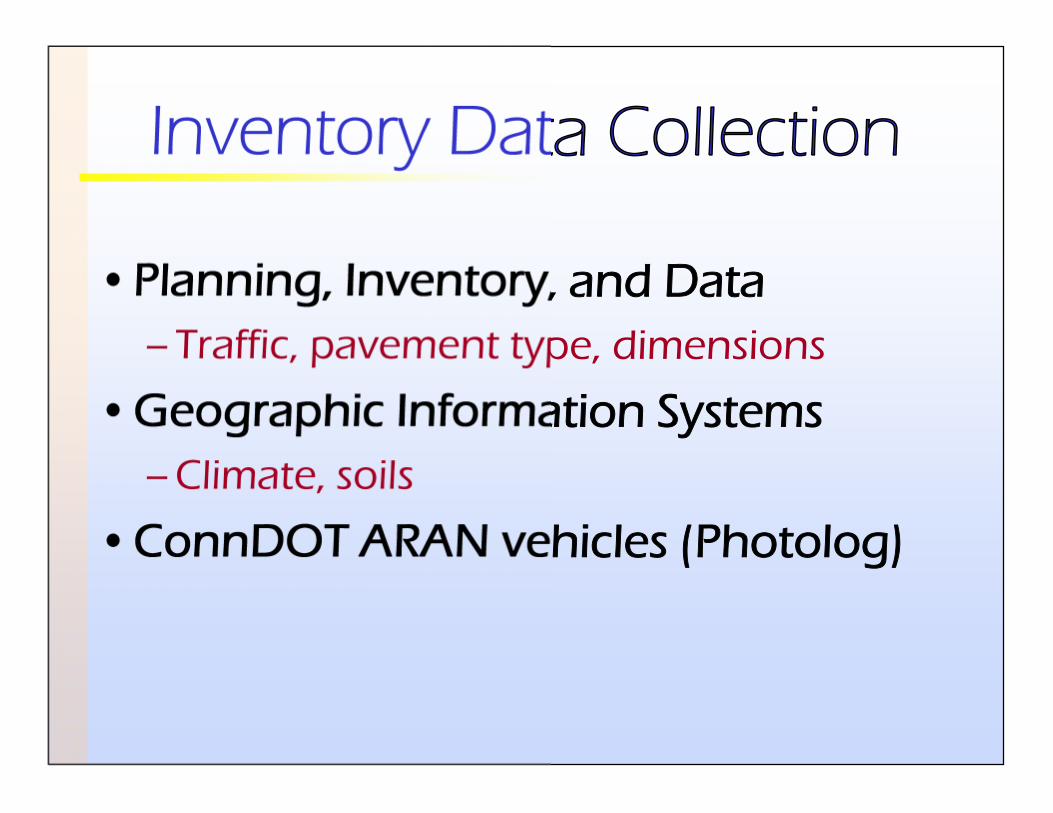
Inventory Data Collection
•Planning, Inventory, and Data– Traffic, pavement type, dimensions
•Geographic Information Systems– Climate, soils
•ConnDOT ARAN vehicles (Photolog)
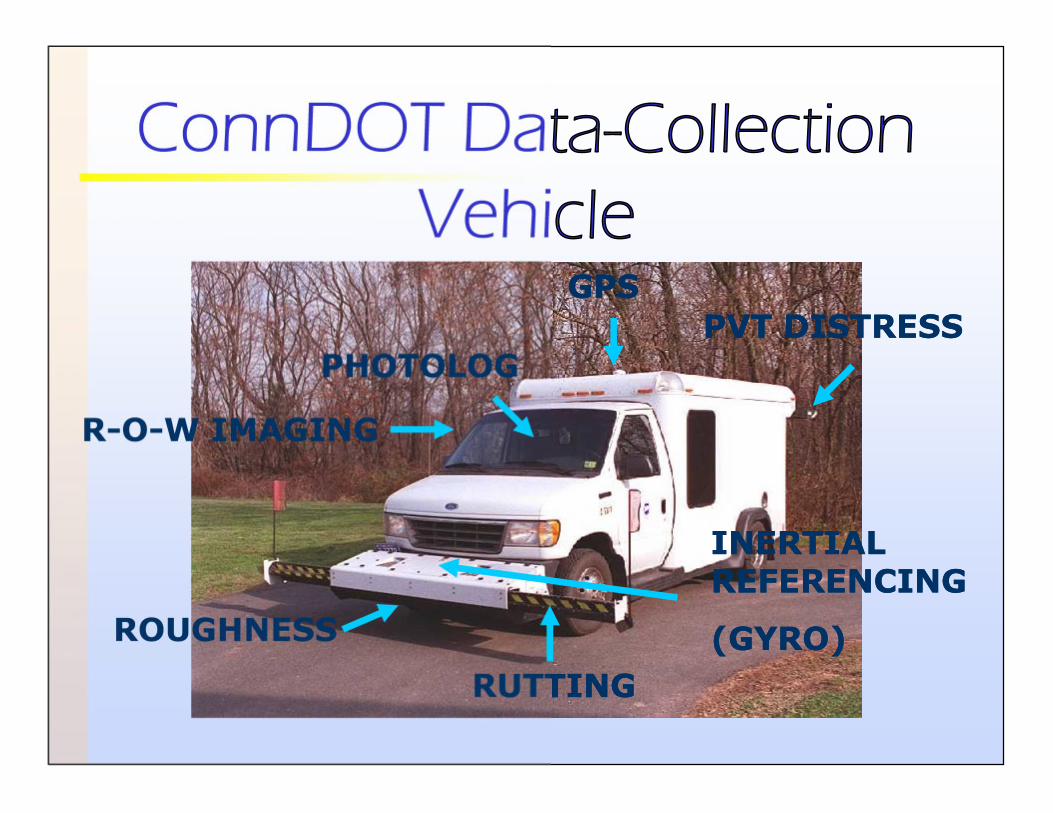
ConnDOT Data-CollectionVehicle
GPSGPS
PHOTOLOGPHOTOLOG
RR--OO--W IMAGINGW IMAGING
PVT DISTRESSPVT DISTRESS
ROUGHNESSROUGHNESS
RUTTINGRUTTING
INERTIALINERTIALREFERENCINGREFERENCING
(GYRO)(GYRO)
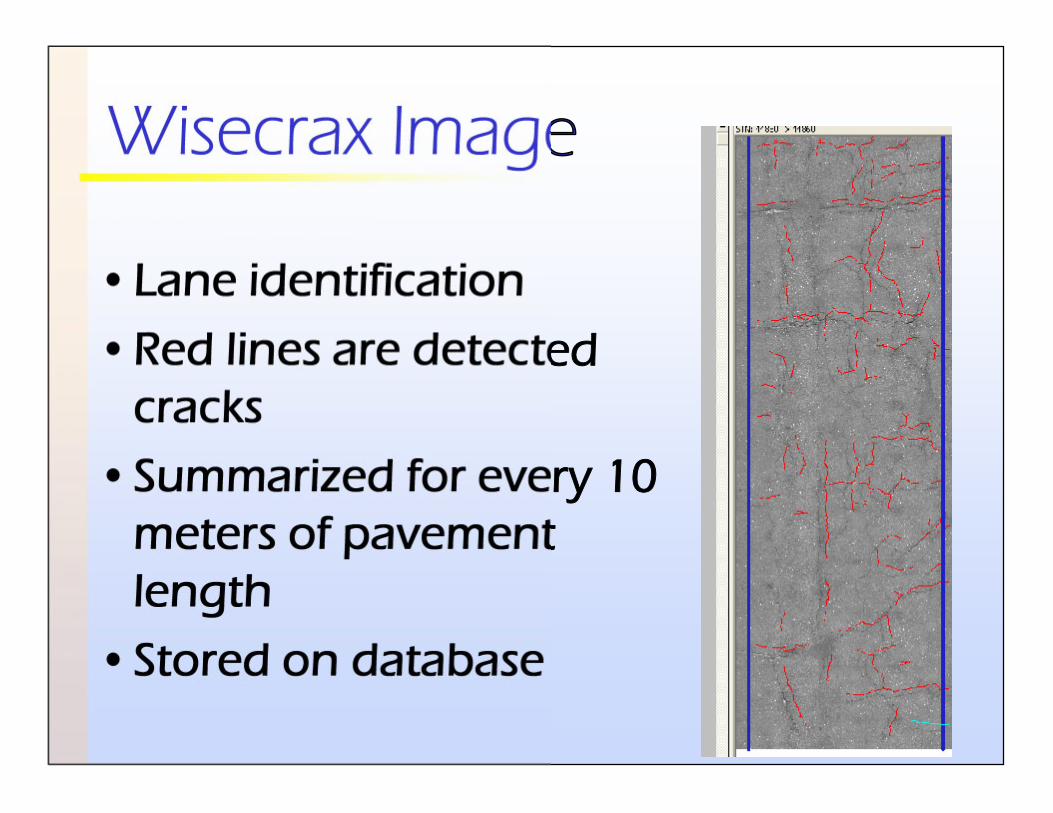
Wisecrax Image
•Lane identification
•Red lines are detectedcracks
•Summarized for every 10meters of pavementlength
•Stored on database
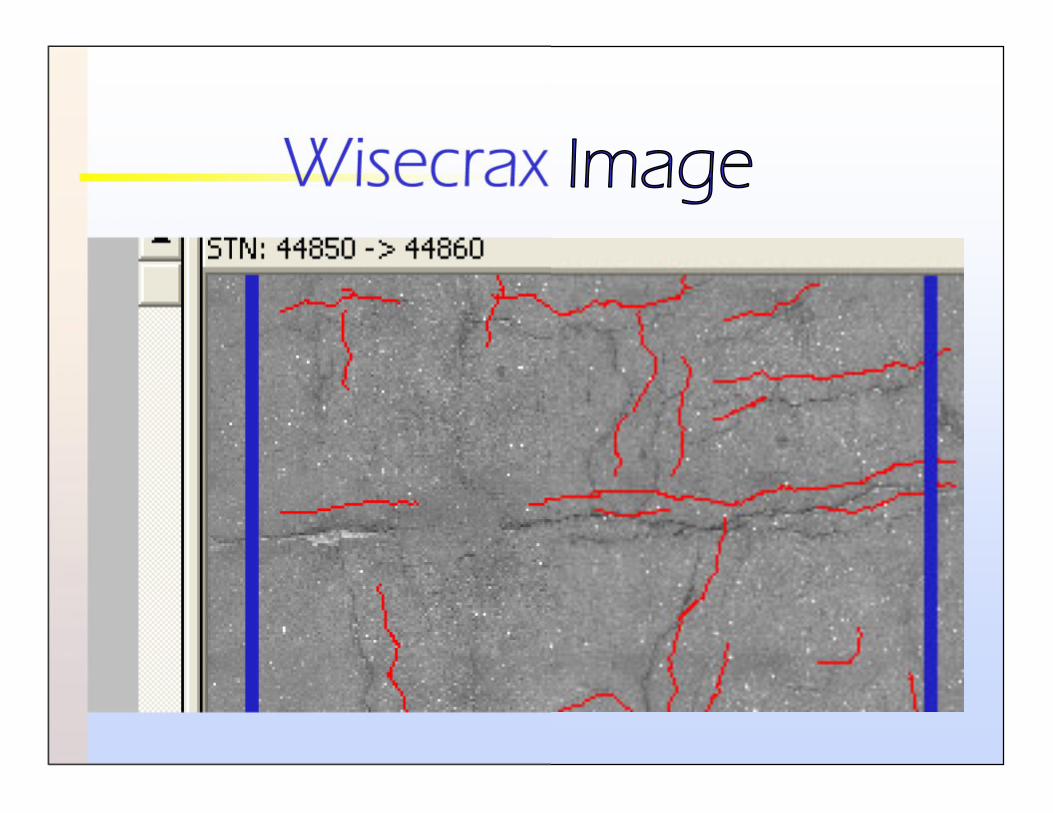
Wisecrax Image
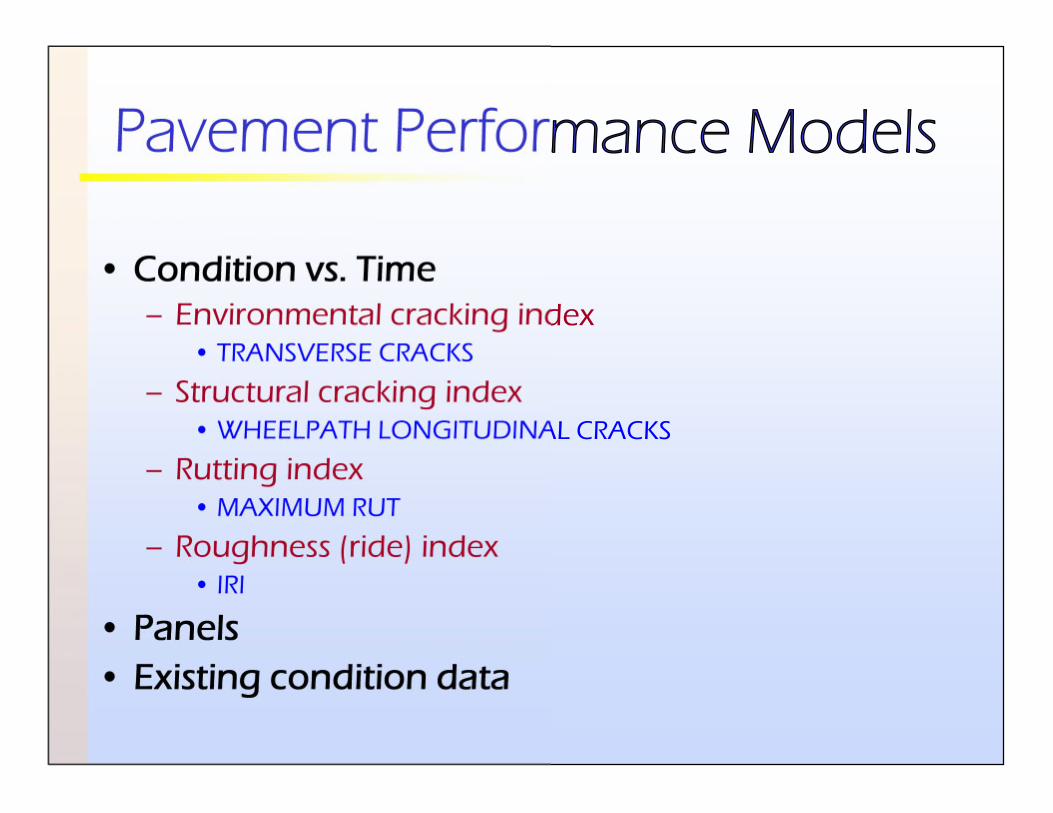
Pavement Performance Models
• Condition vs. Time– Environmental cracking index
• TRANSVERSE CRACKS
– Structural cracking index• WHEELPATH LONGITUDINAL CRACKS
– Rutting index• MAXIMUM RUT
– Roughness (ride) index• IRI
• Panels• Existing condition data
Pavement Performance
•Pavement performance is modeledbased on pavement families– “Flexible pavements with high traffic in a
coastal zone and clayey soils in a poorlydrained area”
•Condition versus time
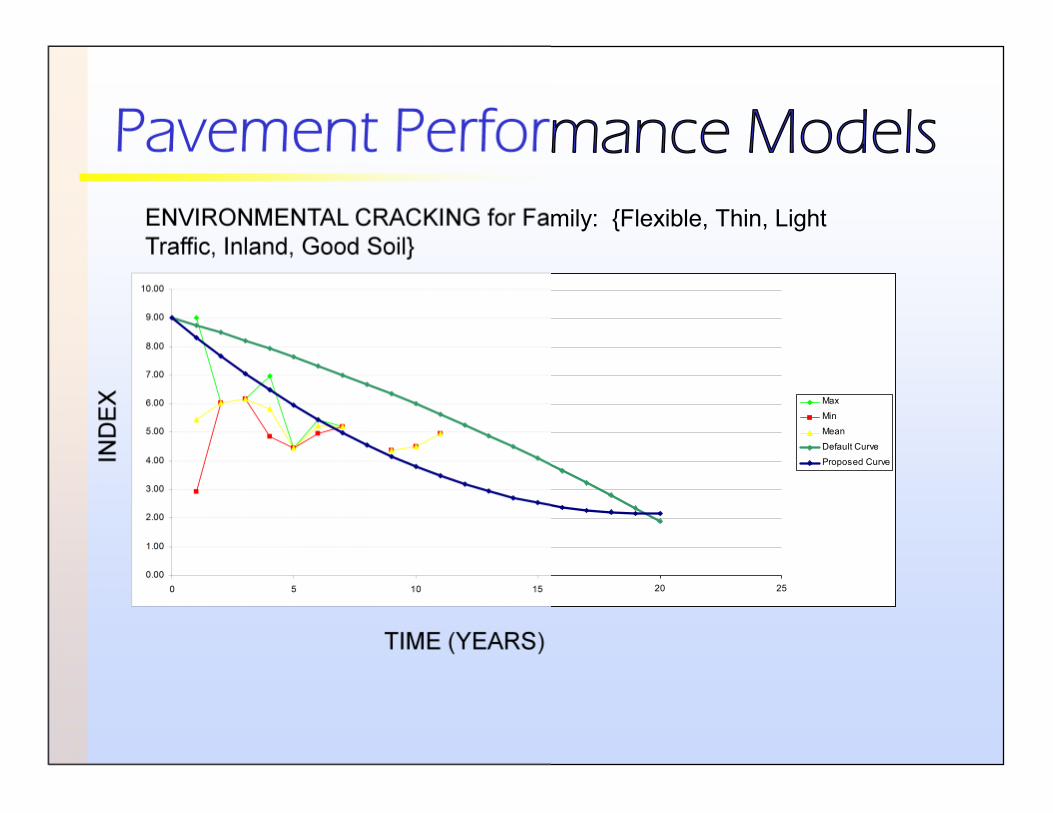
Pavement Performance Models
0.00
1.00
2.00
3.00
4.00
5.00
6.00
7.00
8.00
9.00
10.00
0 5 10 15 20 25
Max
Min
Mean
Default Curve
Proposed Curve
TIME (YEARS)
IND
EX
ENVIRONMENTAL CRACKING for Family: {Flexible, Thin, LightTraffic, Inland, Good Soil}
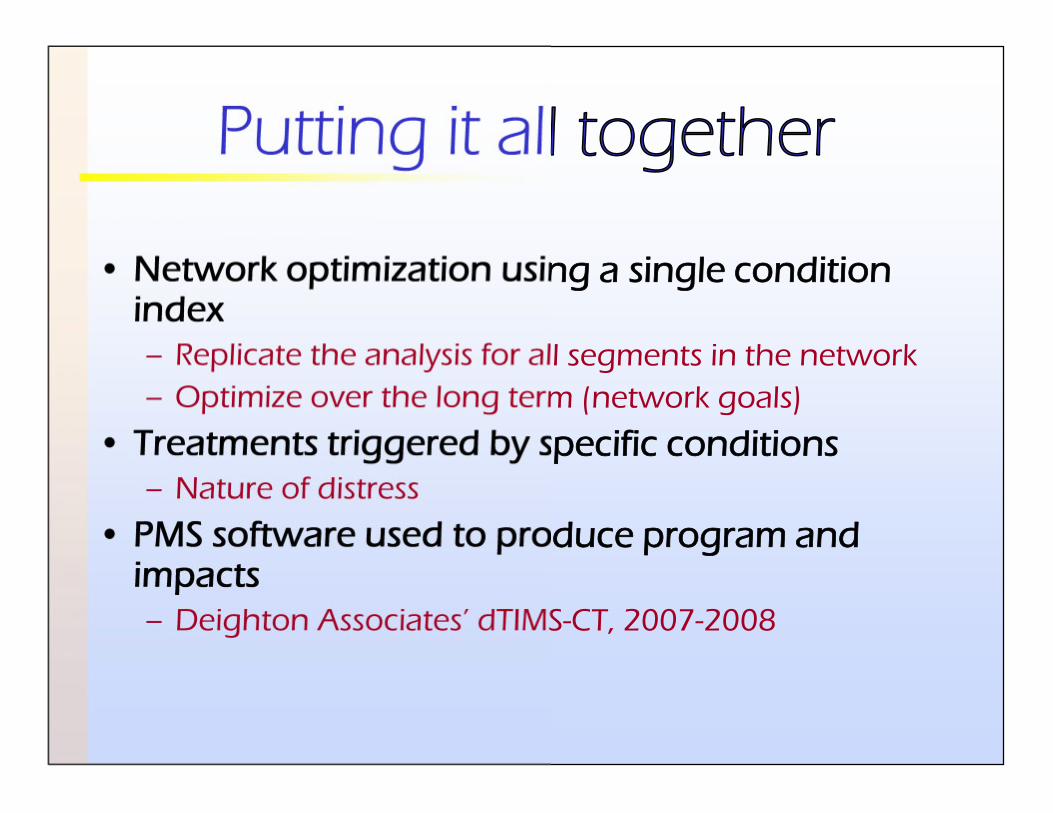
Putting it all together
• Network optimization using a single conditionindex– Replicate the analysis for all segments in the network– Optimize over the long term (network goals)
• Treatments triggered by specific conditions– Nature of distress
• PMS software used to produce program andimpacts– Deighton Associates’ dTIMS-CT, 2007-2008
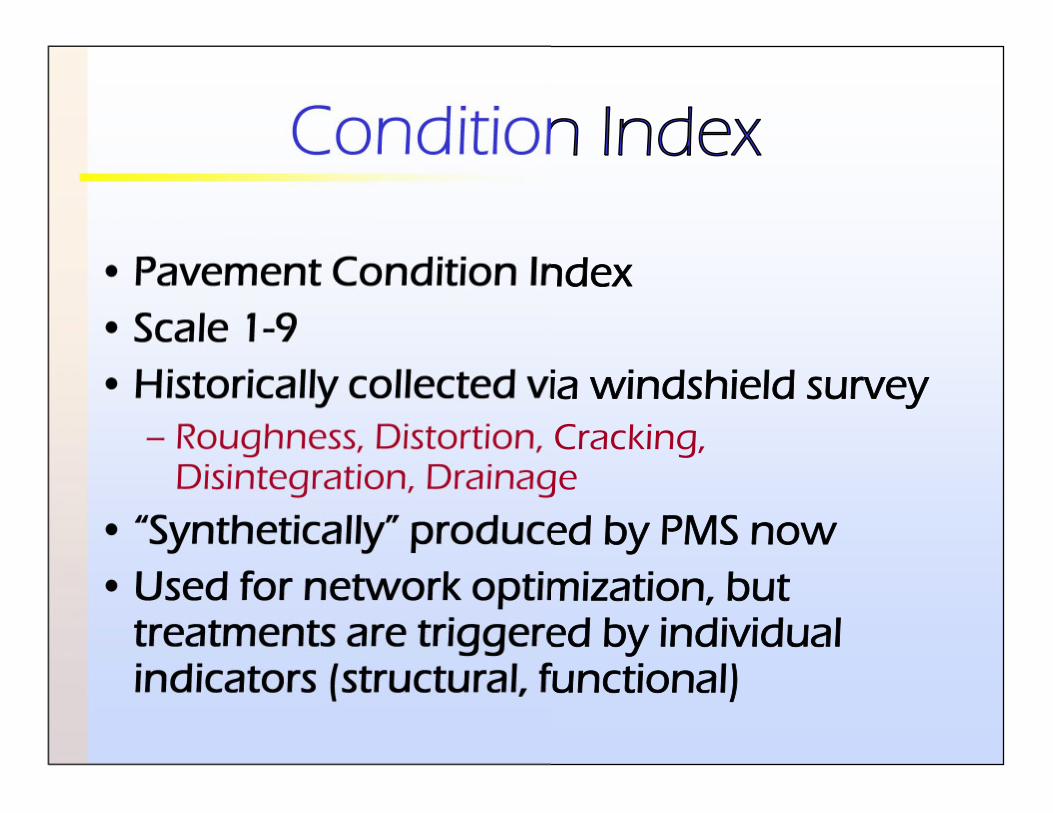
Condition Index
• Pavement Condition Index• Scale 1-9• Historically collected via windshield survey
– Roughness, Distortion, Cracking,Disintegration, Drainage
• “Synthetically” produced by PMS now• Used for network optimization, but
treatments are triggered by individualindicators (structural, functional)
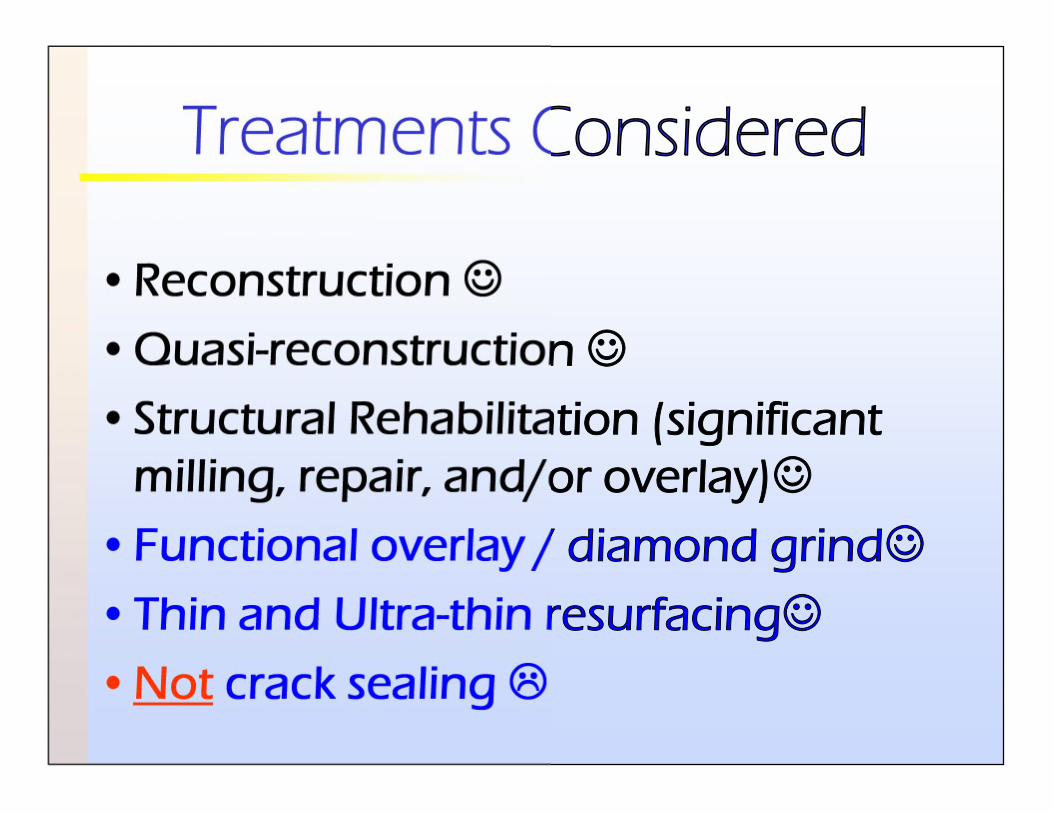
Treatments Considered
•Reconstruction
•Quasi-reconstruction
•Structural Rehabilitation (significantmilling, repair, and/or overlay)
•Functional overlay / diamond grind
•Thin and Ultra-thin resurfacing
•Not crack sealing
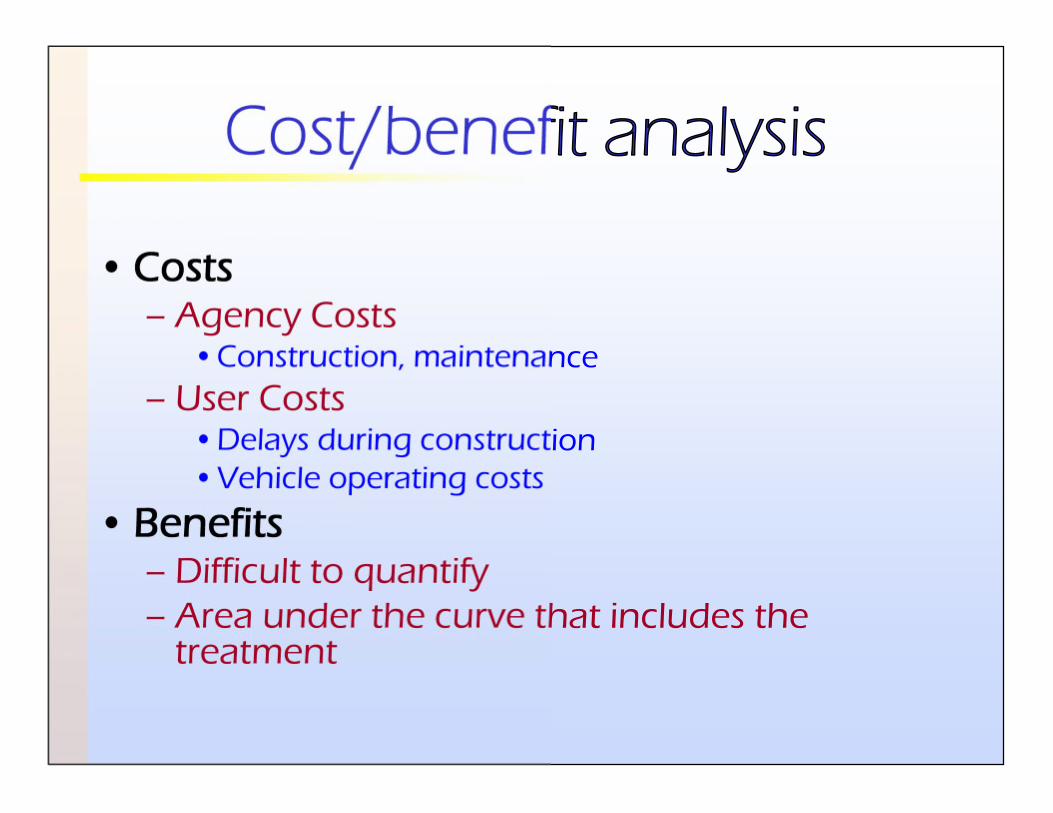
Cost/benefit analysis
• Costs– Agency Costs
•Construction, maintenance– User Costs
•Delays during construction•Vehicle operating costs
• Benefits– Difficult to quantify– Area under the curve that includes the
treatment
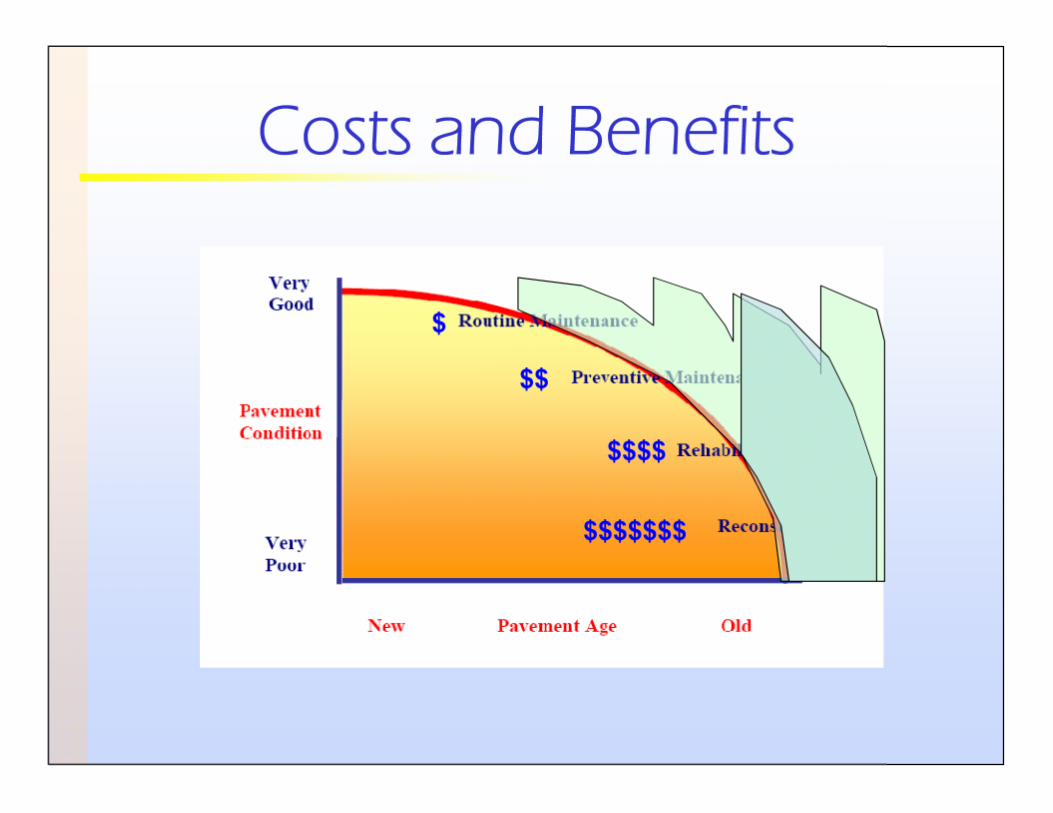
Costs and Benefits
$
$$
$$$$
$$$$$$$
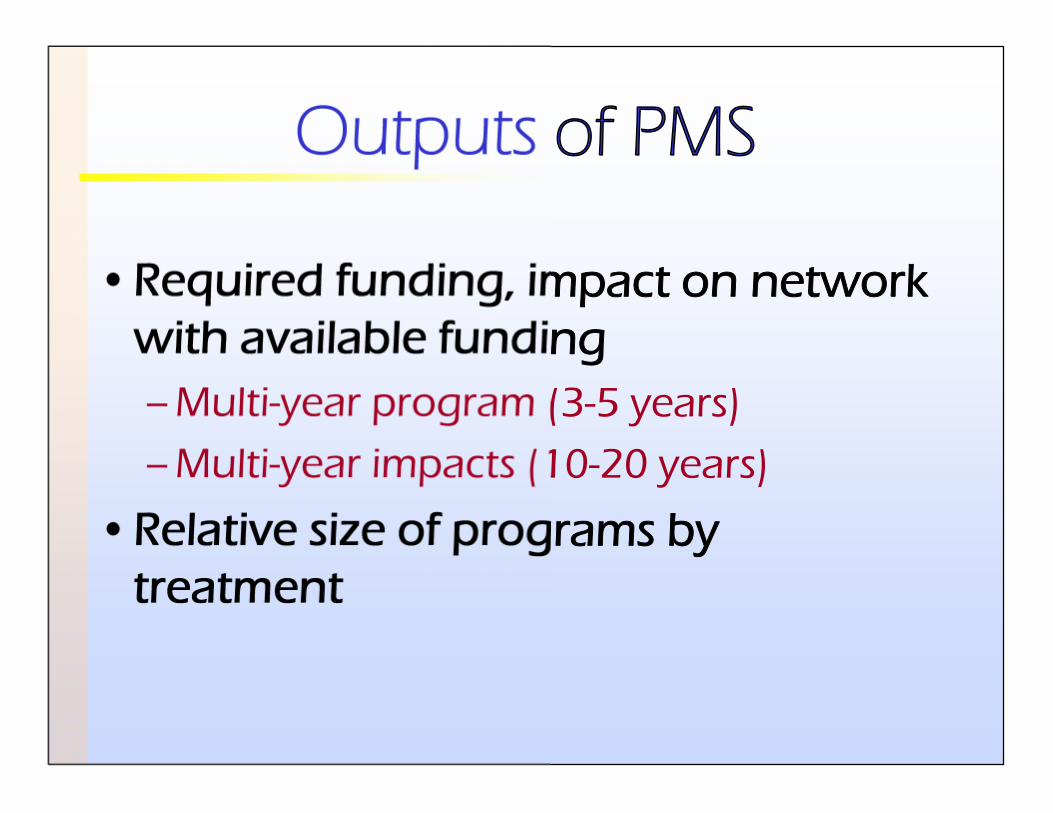
Outputs of PMS
•Required funding, impact on networkwith available funding– Multi-year program (3-5 years)
– Multi-year impacts (10-20 years)
•Relative size of programs bytreatment
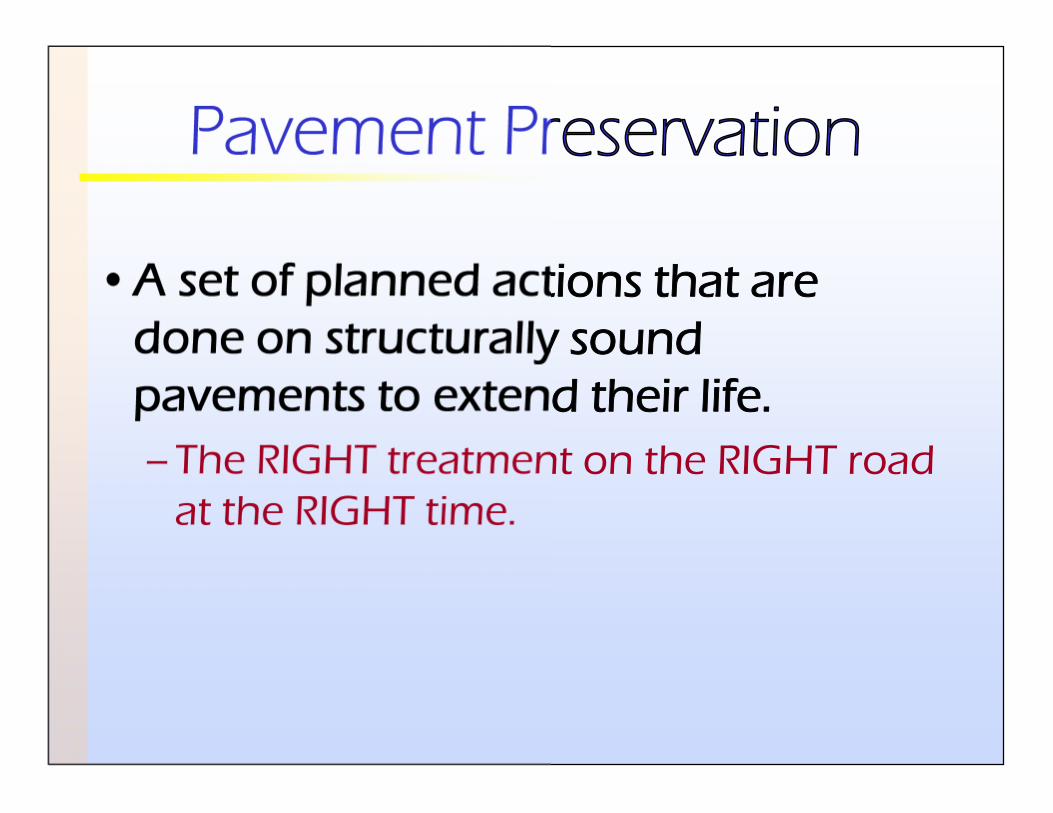
Pavement Preservation
•A set of planned actions that aredone on structurally soundpavements to extend their life.– The RIGHT treatment on the RIGHT road
at the RIGHT time.
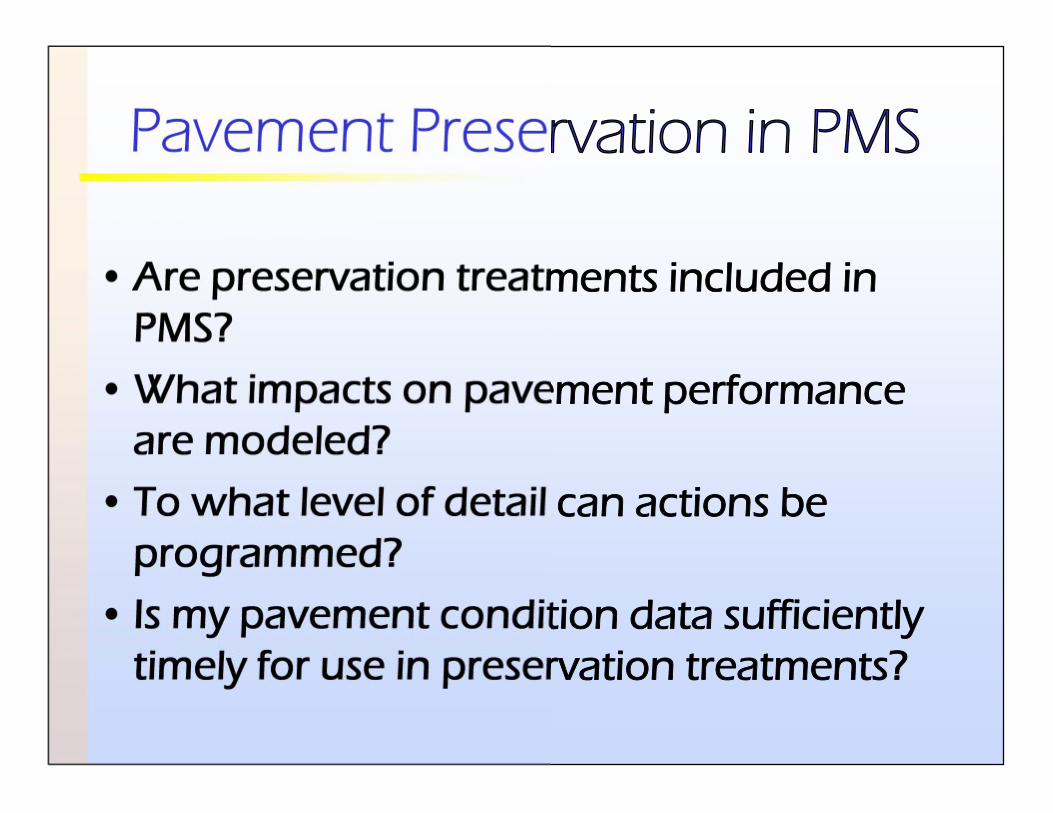
Pavement Preservation in PMS
• Are preservation treatments included inPMS?
• What impacts on pavement performanceare modeled?
• To what level of detail can actions beprogrammed?
• Is my pavement condition data sufficientlytimely for use in preservation treatments?
Pavement Preservation in PMS
•Are preservation treatments includedin PMS?– YES, except for crack seal
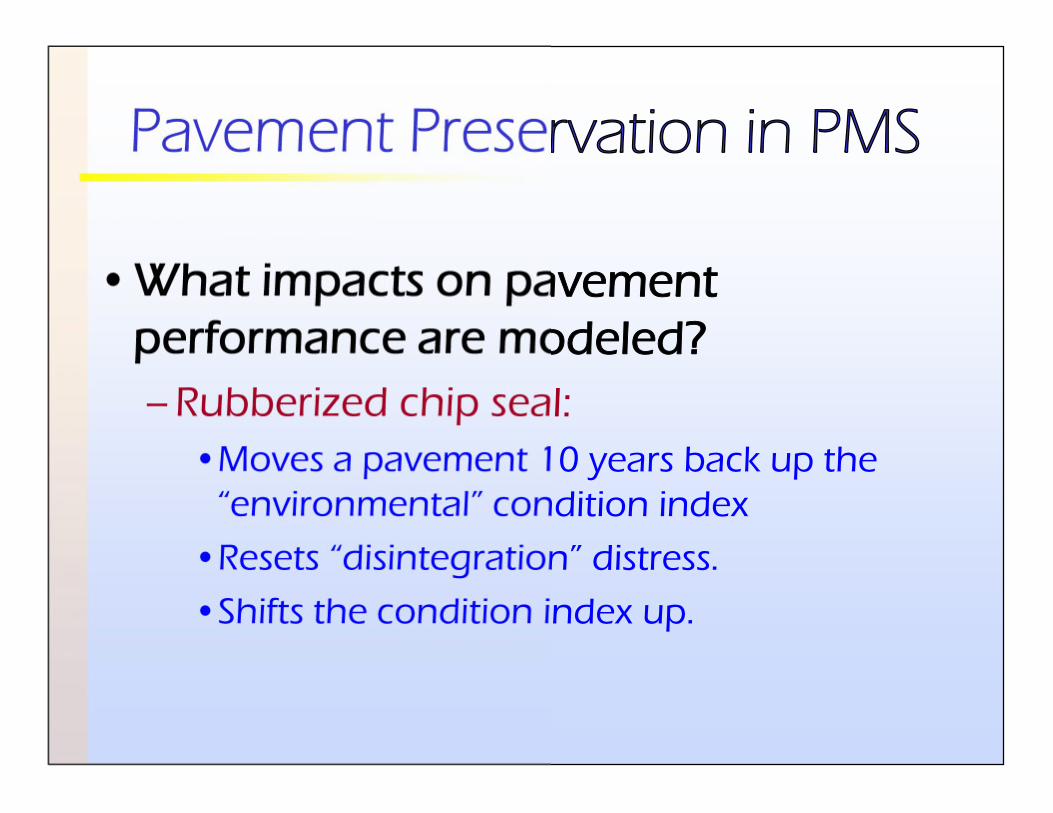
Pavement Preservation in PMS
•What impacts on pavementperformance are modeled?– Rubberized chip seal:
•Moves a pavement 10 years back up the“environmental” condition index
•Resets “disintegration” distress.
•Shifts the condition index up.
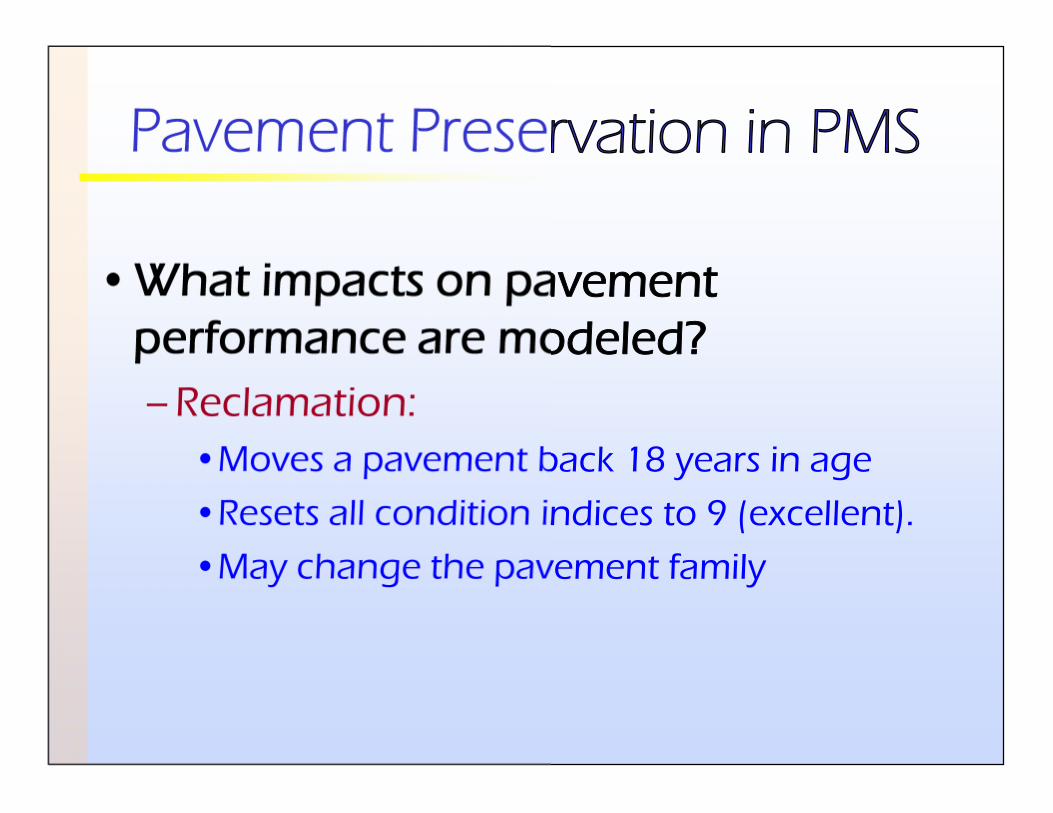
Pavement Preservation in PMS
•What impacts on pavementperformance are modeled?– Reclamation:
•Moves a pavement back 18 years in age
•Resets all condition indices to 9 (excellent).
•May change the pavement family
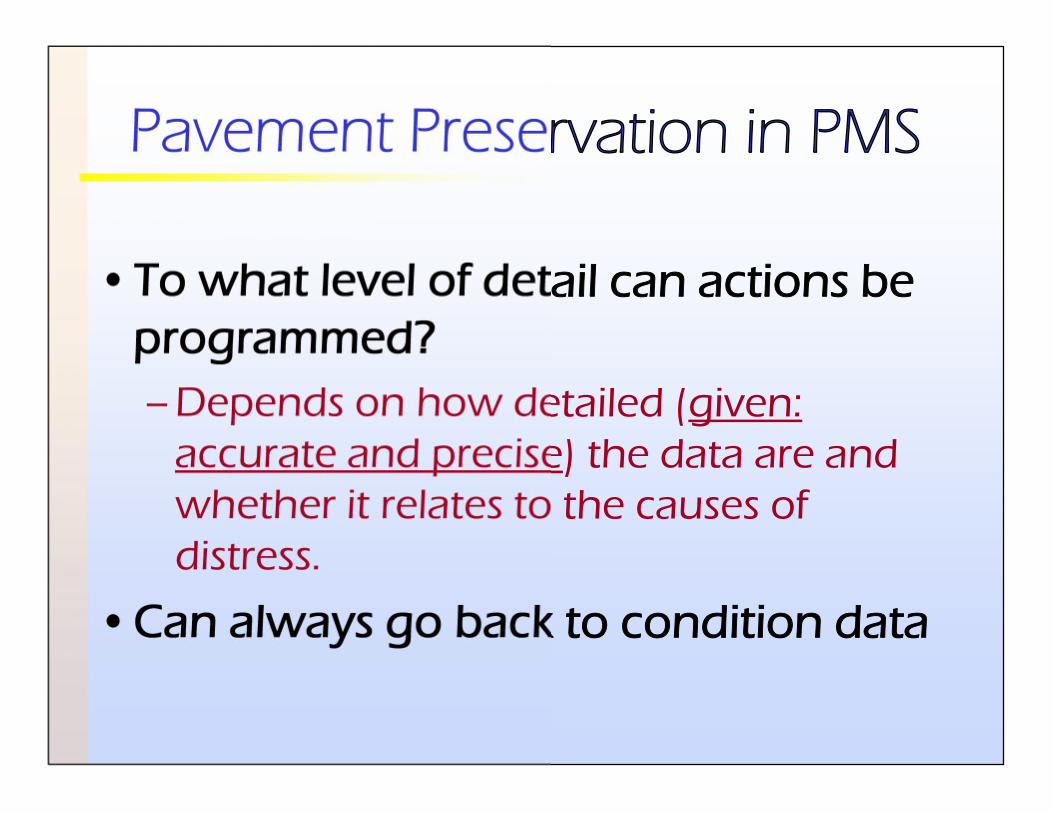
Pavement Preservation in PMS
•To what level of detail can actions beprogrammed?– Depends on how detailed (given:
accurate and precise) the data are andwhether it relates to the causes ofdistress.
•Can always go back to condition data
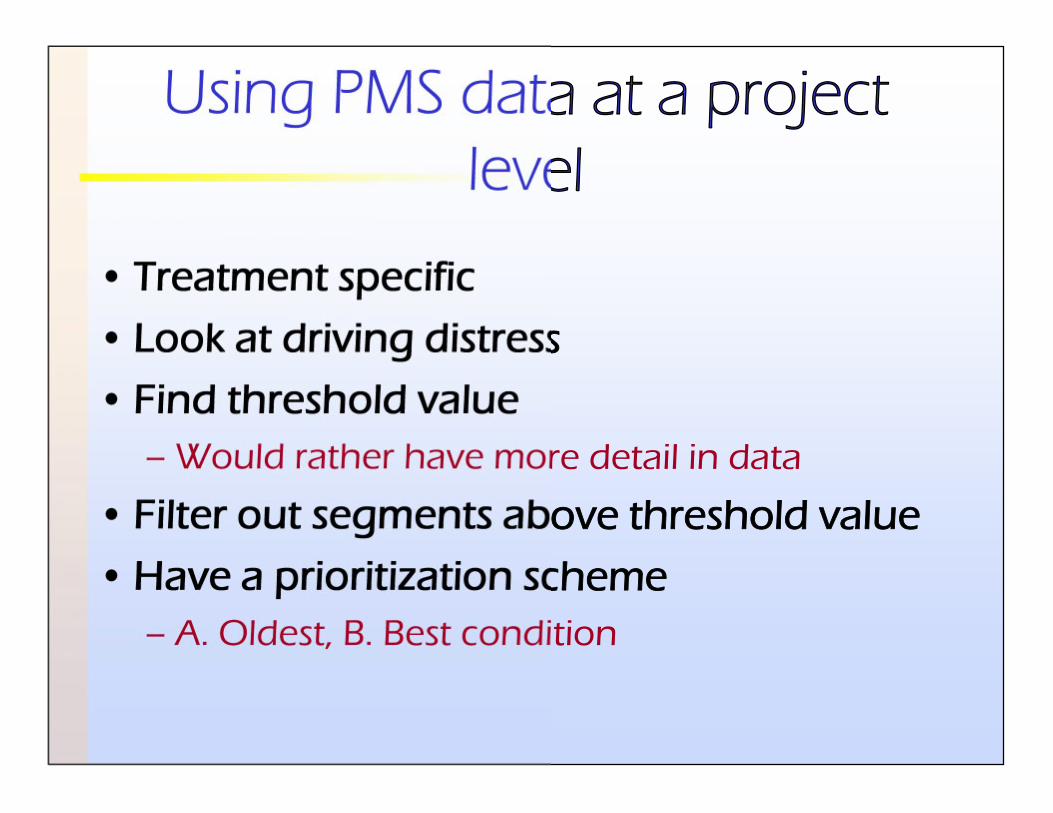
Using PMS data at a projectlevel
• Treatment specific
• Look at driving distress
• Find threshold value– Would rather have more detail in data
• Filter out segments above threshold value
• Have a prioritization scheme– A. Oldest, B. Best condition
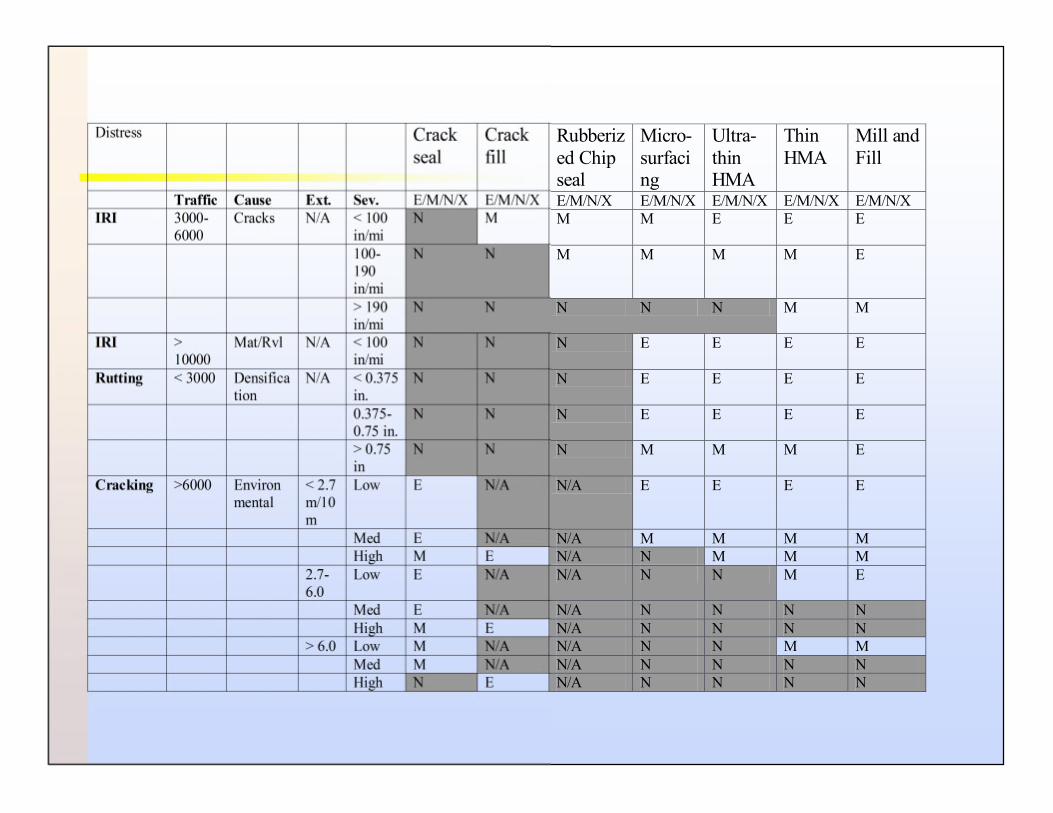
Distress Crackseal
Crackfill
Rubberized Chipseal
Micro-surfacing
Ultra-thinHMA
ThinHMA
Mill andFill
Traffic Cause Ext. Sev. E/M/N/X E/M/N/X E/M/N/X E/M/N/X E/M/N/X E/M/N/X E/M/N/XIRI 3000-
6000Cracks N/A < 100
in/miN M M M E E E
100-190in/mi
N N M M M M E
> 190in/mi
N N N N N M M
IRI >10000
Mat/Rvl N/A < 100in/mi
N N N E E E E
Rutting < 3000 Densification
N/A < 0.375in.
N N N E E E E
0.375-0.75 in.
N N N E E E E
> 0.75in
N N N M M M E
Cracking >6000 Environmental
< 2.7m/10m
Low E N/A N/A E E E E
Med E N/A N/A M M M MHigh M E N/A N M M M
2.7-6.0
Low E N/A N/A N N M E
Med E N/A N/A N N N NHigh M E N/A N N N N
> 6.0 Low M N/A N/A N N M MMed M N/A N/A N N N NHigh N E N/A N N N N
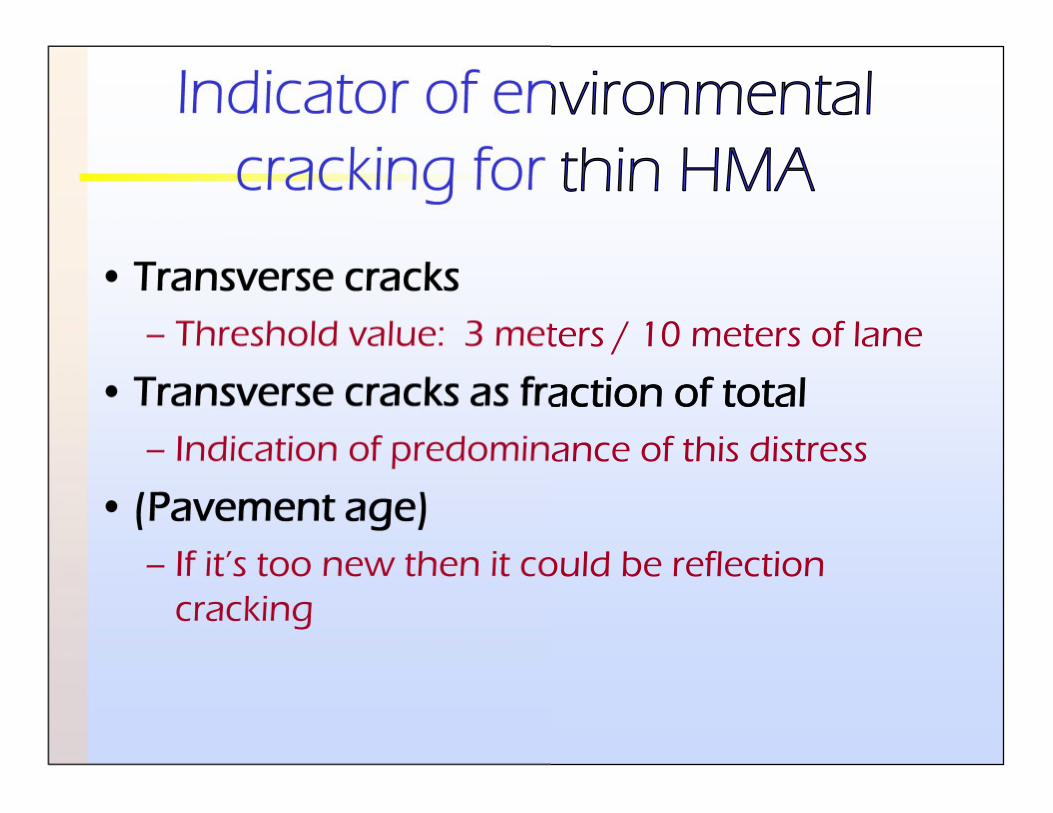
Indicator of environmentalcracking for thin HMA
• Transverse cracks– Threshold value: 3 meters / 10 meters of lane
• Transverse cracks as fraction of total– Indication of predominance of this distress
• (Pavement age)– If it’s too new then it could be reflection
cracking
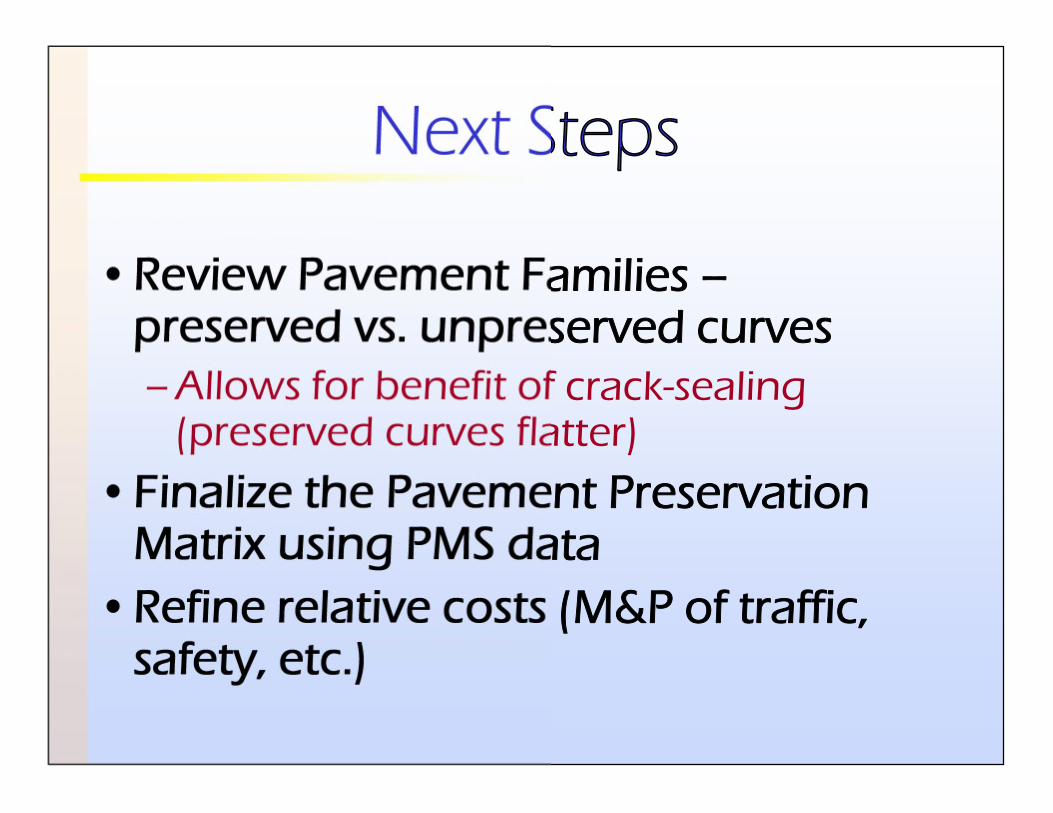
Next Steps
•Review Pavement Families –preserved vs. unpreserved curves– Allows for benefit of crack-sealing
(preserved curves flatter)
•Finalize the Pavement PreservationMatrix using PMS data
•Refine relative costs (M&P of traffic,safety, etc.)
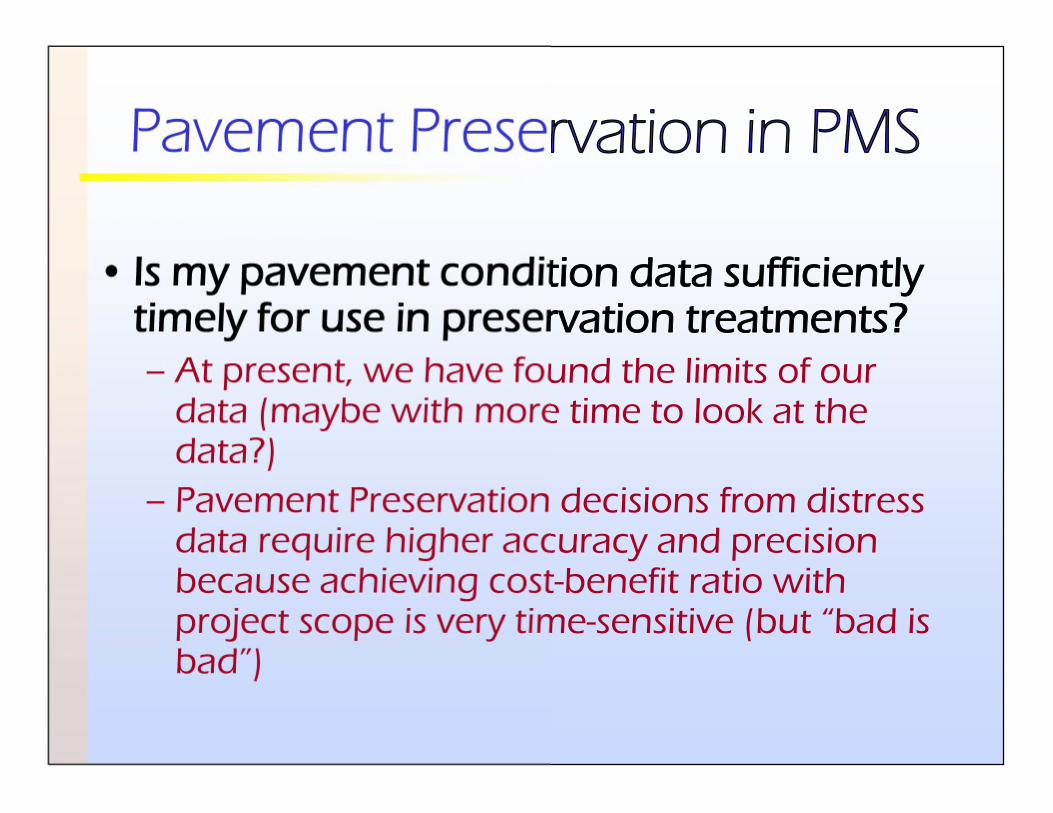
Pavement Preservation in PMS
• Is my pavement condition data sufficientlytimely for use in preservation treatments?– At present, we have found the limits of our
data (maybe with more time to look at thedata?)
– Pavement Preservation decisions from distressdata require higher accuracy and precisionbecause achieving cost-benefit ratio withproject scope is very time-sensitive (but “bad isbad”)
Thank you for your attention!
Questions?