pavement management · aashto pavement management guide (2001) •a pavement management system is a...
TRANSCRIPT
Pavement Management
Wiley Cunagin, PE, PhD and Kyle Kroodsma
2019
What is Pavement Management?
• It is a management approach used by personnel to make cost-effective decisions about a road network.
AASHTO Pavement Management Guide (2001)
• A Pavement Management System is a set of tools or methods that assist decision-makers in finding optimum strategies for providing, evaluating, and maintaining pavements in a serviceable condition over a period of time.
AASHTO Guide for Design of Pavement Structures (1993)
What is Pavement Management?Plain Language Version
The Right pavement in the Right place at the Right time.
• When
• Which roadways
• What treatment
• How much money
• System-wide planning
To make these decisions, we must first know the “why”
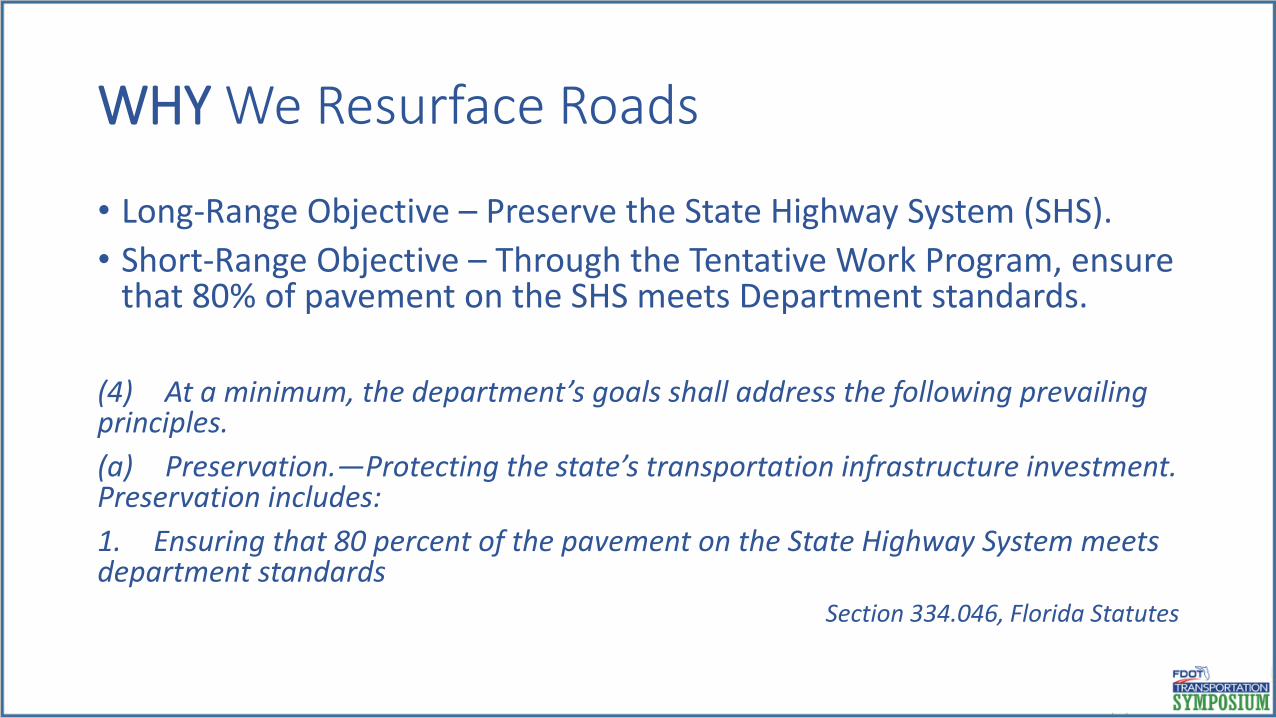
WHY We Resurface Roads
• Long-Range Objective – Preserve the State Highway System (SHS).
• Short-Range Objective – Through the Tentative Work Program, ensure that 80% of pavement on the SHS meets Department standards.
(4) At a minimum, the department’s goals shall address the following prevailing principles.
(a) Preservation.—Protecting the state’s transportation infrastructure investment. Preservation includes:
1. Ensuring that 80 percent of the pavement on the State Highway System meets department standards
Section 334.046, Florida Statutes
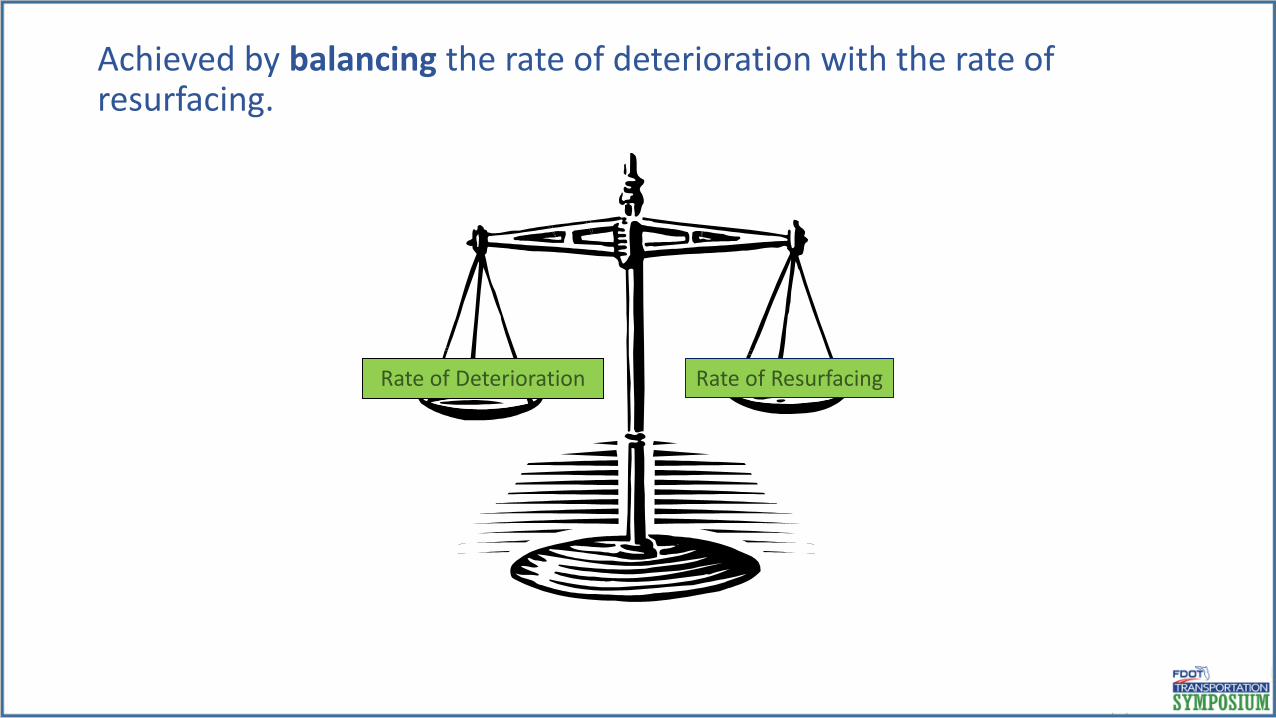
Achieved by balancing the rate of deterioration with the rate of resurfacing.
Rate of Deterioration Rate of Resurfacing

Projects are chosen in accordance with the following criteria:
• Safety – Wheelpath Rutting, Friction
• Preservation of the system – Cracking, Delamination, Potholes, Spalling, Raveling, Patching, Depressions
• Ride – Rippling, Faulting, Utilities, Public Complaints
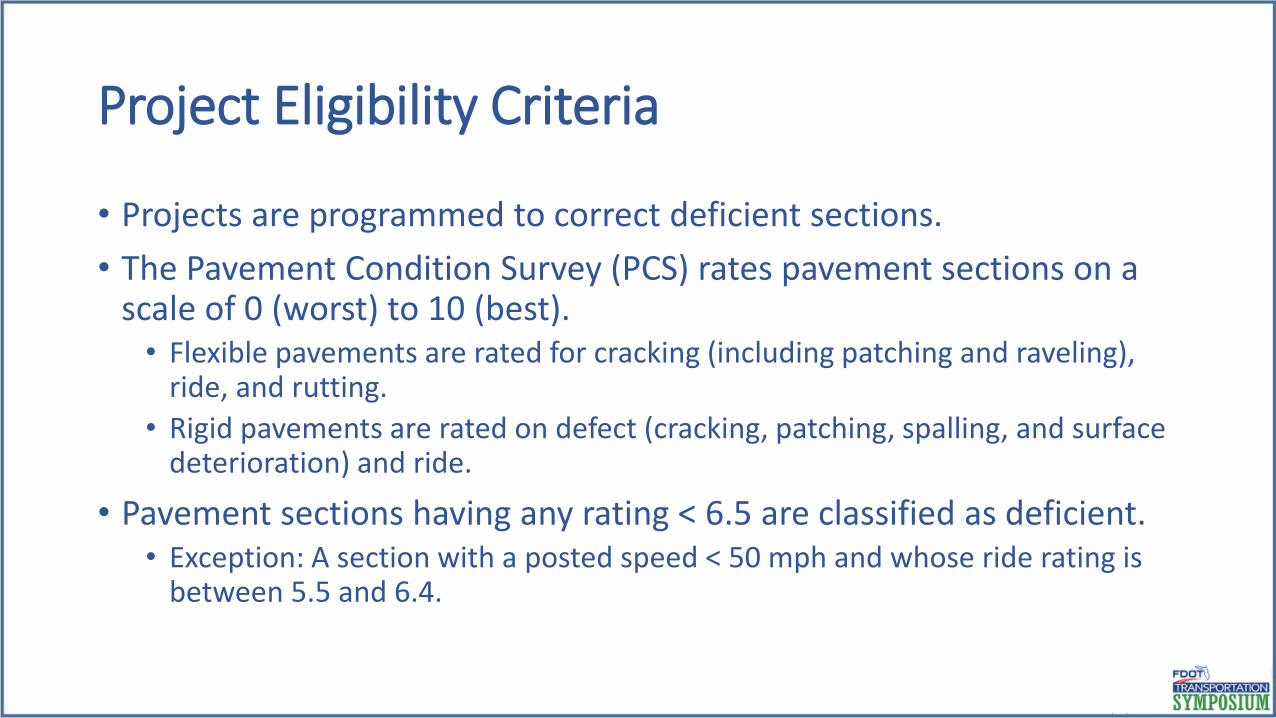
Project Eligibility Criteria
• Projects are programmed to correct deficient sections.
• The Pavement Condition Survey (PCS) rates pavement sections on a scale of 0 (worst) to 10 (best).• Flexible pavements are rated for cracking (including patching and raveling),
ride, and rutting.
• Rigid pavements are rated on defect (cracking, patching, spalling, and surface deterioration) and ride.
• Pavement sections having any rating < 6.5 are classified as deficient.• Exception: A section with a posted speed < 50 mph and whose ride rating is
between 5.5 and 6.4.
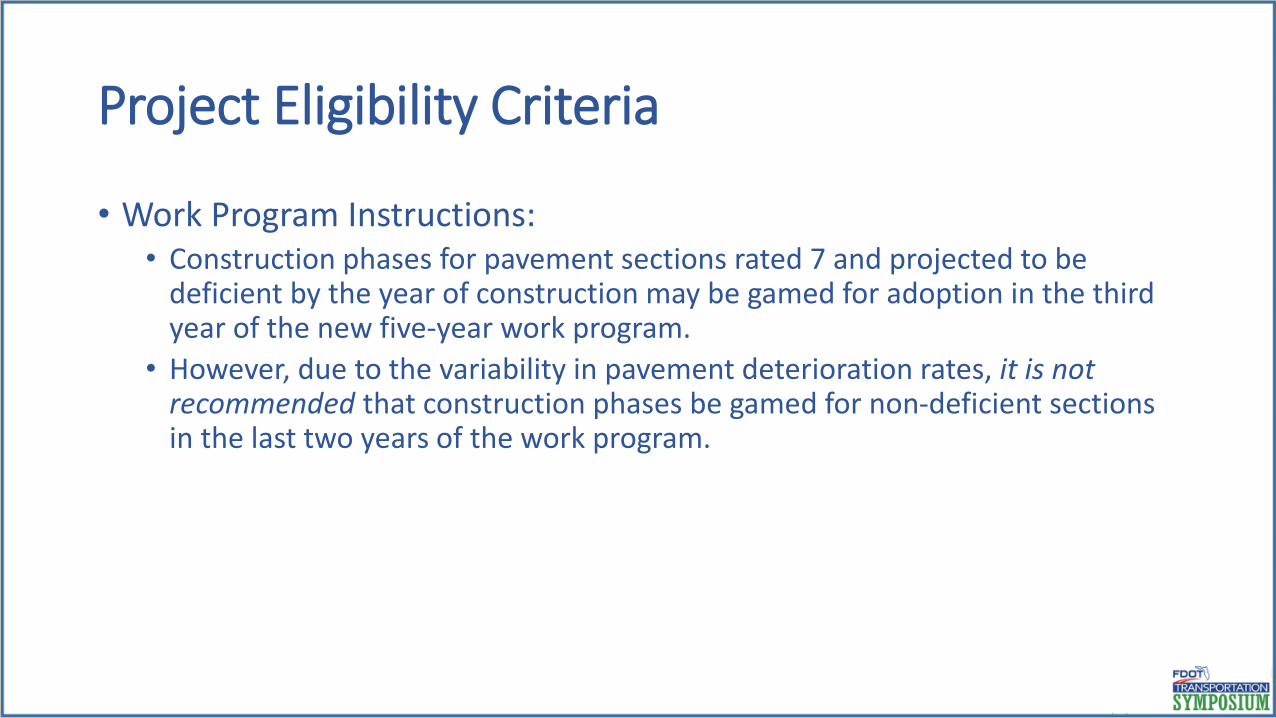
Project Eligibility Criteria
• Work Program Instructions:• Construction phases for pavement sections rated 7 and projected to be
deficient by the year of construction may be gamed for adoption in the third year of the new five-year work program.
• However, due to the variability in pavement deterioration rates, it is not recommended that construction phases be gamed for non-deficient sections in the last two years of the work program.
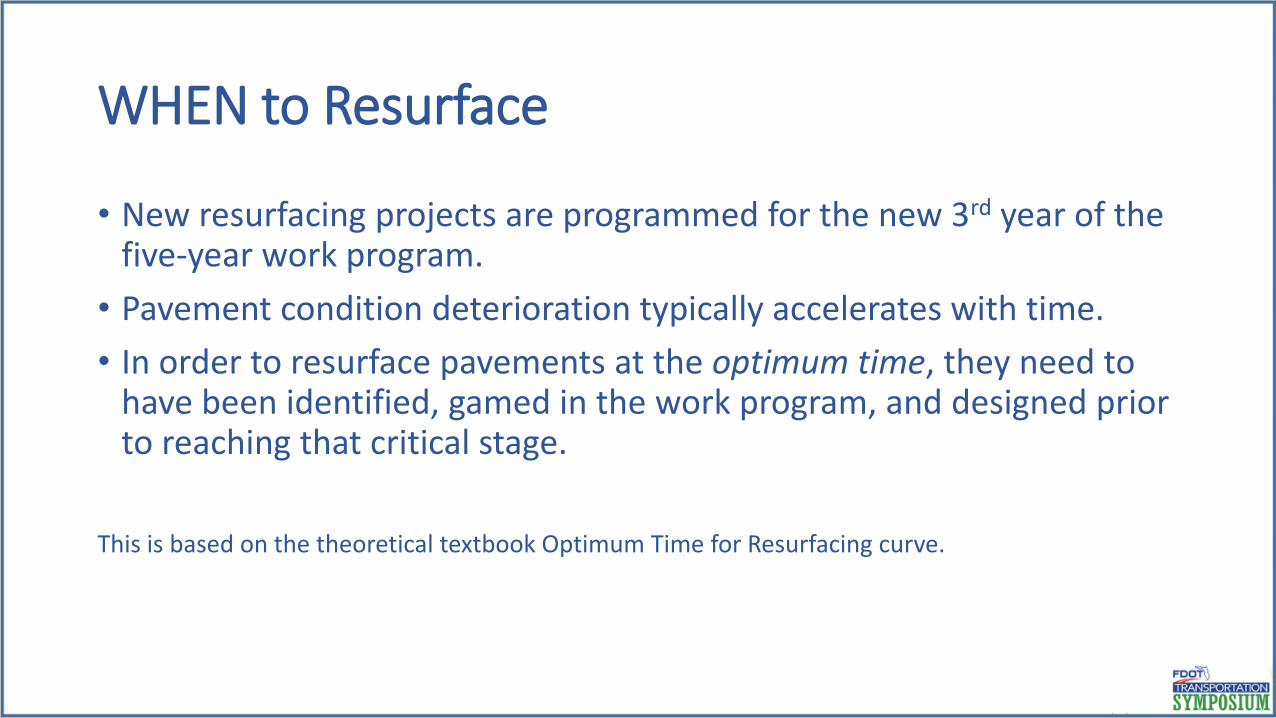
WHEN to Resurface
• New resurfacing projects are programmed for the new 3rd year of the five-year work program.
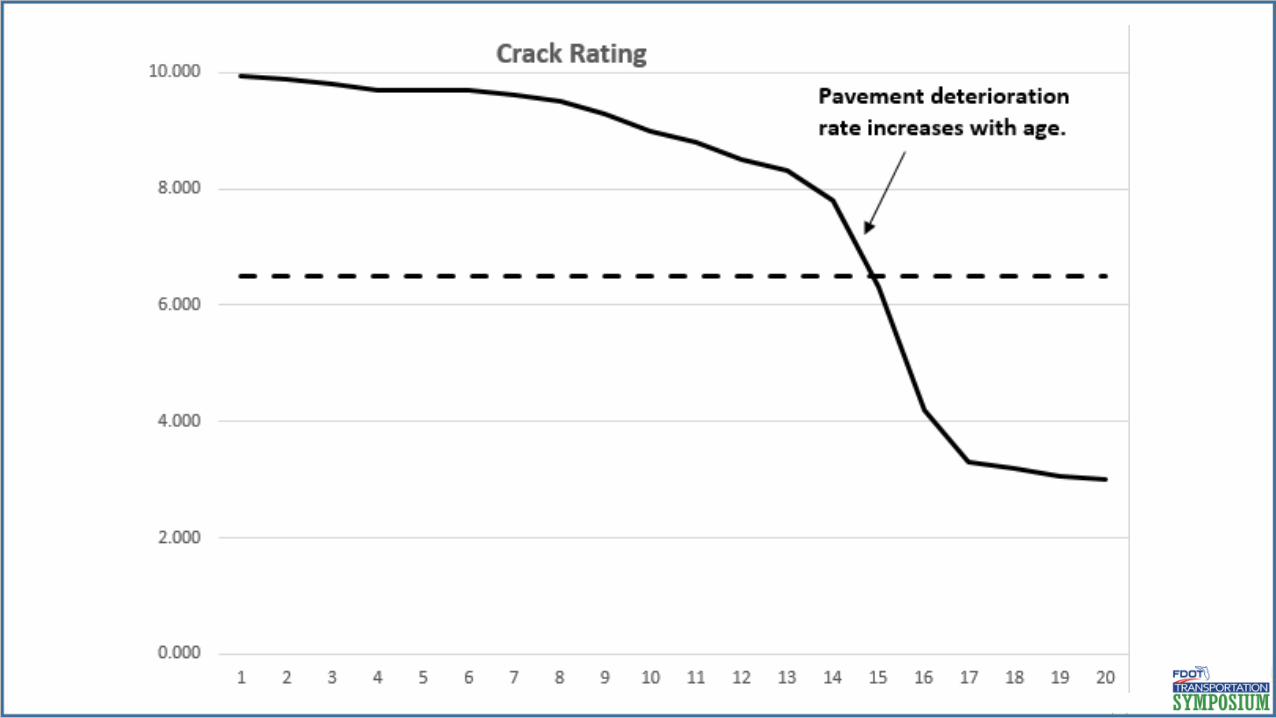
• Pavement condition deterioration typically accelerates with time.
• In order to resurface pavements at the optimum time, they need to have been identified, gamed in the work program, and designed prior to reaching that critical stage.
This is based on the theoretical textbook Optimum Time for Resurfacing curve.
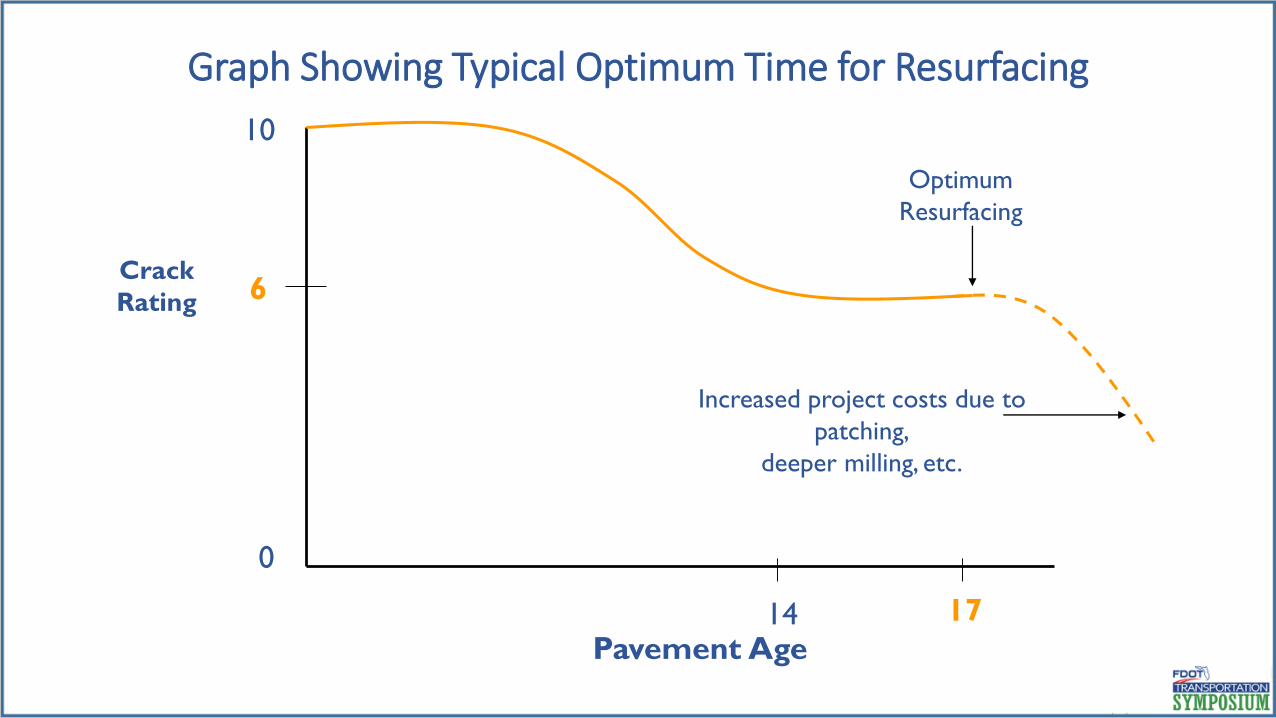
Graph Showing Typical Optimum Time for Resurfacing
0
10
6
1714
Crack
Rating
Pavement Age
Optimum
Resurfacing
Increased project costs due to
patching,
deeper milling, etc.
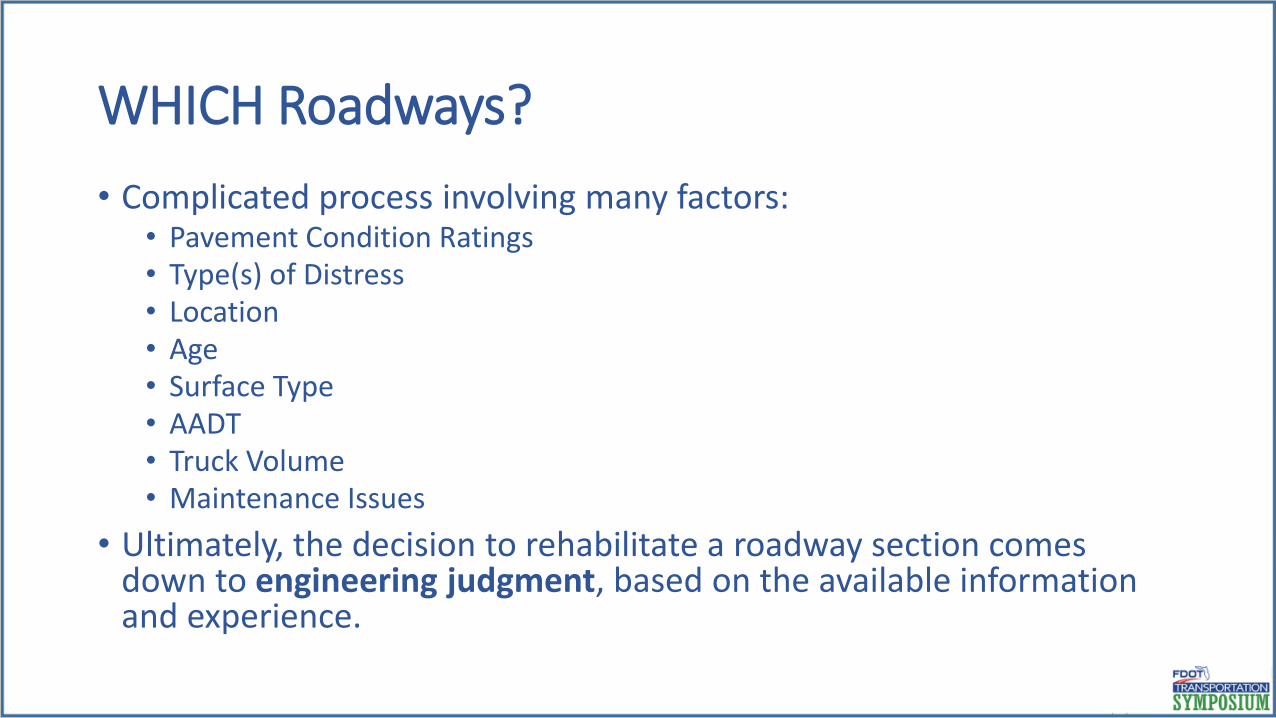
WHICH Roadways?
• Complicated process involving many factors:• Pavement Condition Ratings• Type(s) of Distress• Location• Age• Surface Type• AADT• Truck Volume• Maintenance Issues
• Ultimately, the decision to rehabilitate a roadway section comes down to engineering judgment, based on the available information and experience.
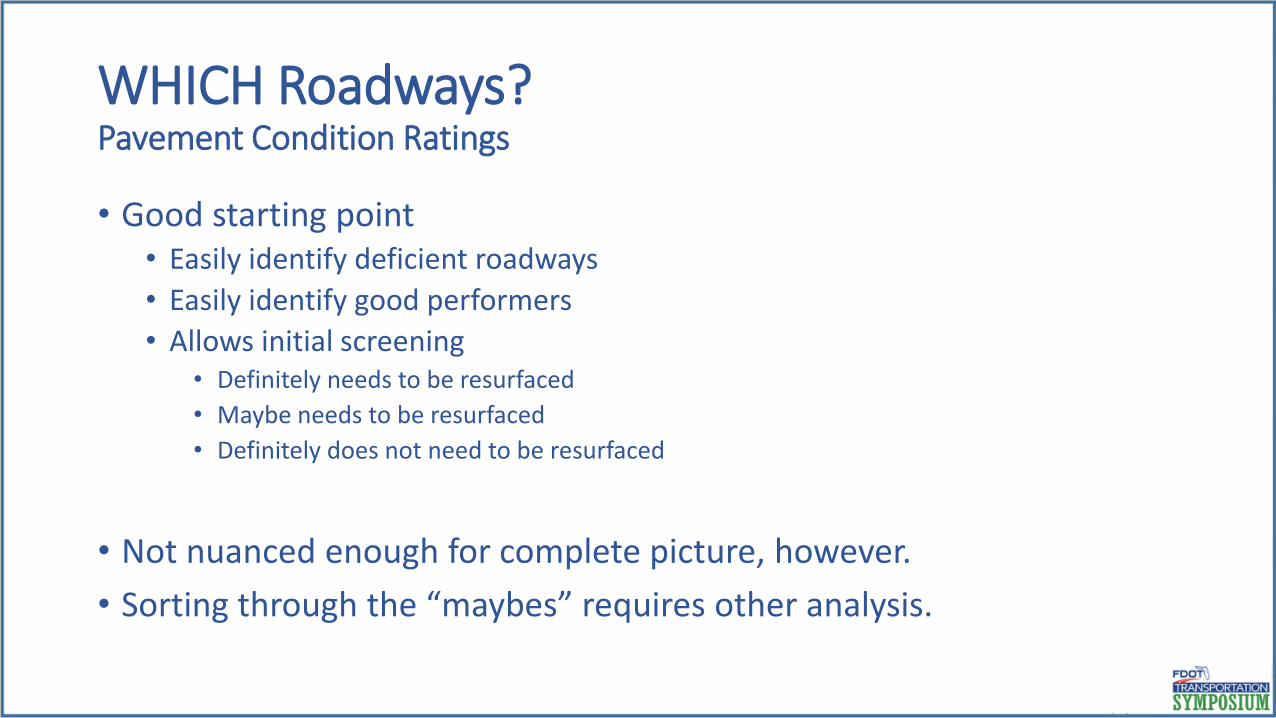
WHICH Roadways?Pavement Condition Ratings
• Good starting point• Easily identify deficient roadways
• Easily identify good performers
• Allows initial screening• Definitely needs to be resurfaced
• Maybe needs to be resurfaced
• Definitely does not need to be resurfaced
• Not nuanced enough for complete picture, however.
• Sorting through the “maybes” requires other analysis.
WHICH Roadways?Type(s) of Distress
• Cracking
• Most common distress (≈90% of 2019 deficient lane mileage shows a deficient crack rating)
• Allows infiltration of water into pavement structure
• Left untreated, can lead to reconstruction
• Ride Quality
• Forms public opinion despite much lower occurrence than cracking (≈11% of 2019 deficient lane mileage)
• Poor ride leads to higher user costs in the form of vehicle maintenance
• Wheelpath Rutting
• Most critical concern but least prevalent distress (≈2.5% of 2019 deficient lane mileage)
• Safety issue at higher speeds

WHICH Roadways?Other Factors
• Location• South Florida pavements generally deteriorate at a slower rate than those in
North Florida.• Surface proximity of limerock
• Soil variability
• Construction methods
• Presence of muck or other unsuitable embankment material.
WHICH Roadways?Other Factors
• Age• Average non-deficient life for FDOT pavements is ≈ 13.6 years.
• Average age at resurfacing is ≈ 16.1 years.
• Older pavements are more likely to experience a sudden, dramatic decrease in functionality than new pavements.
• Surface Type• Dense-graded average age is ≈ 14.3 years (Survival age ≈ 18.9 years).
• Open-graded average age is ≈ 12.7 years (Survival age ≈ 13.5 years).• More susceptible to raveling
• More likely to have rim marks from large trucks
WHICH Roadways?Other Factors
• AADT• Increases the costs and benefits of resurfacing.
• Delays associated with resurfacing (lane closures).
• Higher construction cost with higher AADT.
• Benefits of resurfacing reach a larger number of people.
• Truck Volume• Trucks contribute about 95% of all damage done to roadways.
• Higher truck volume tends to increase the rate of pavement deterioration.
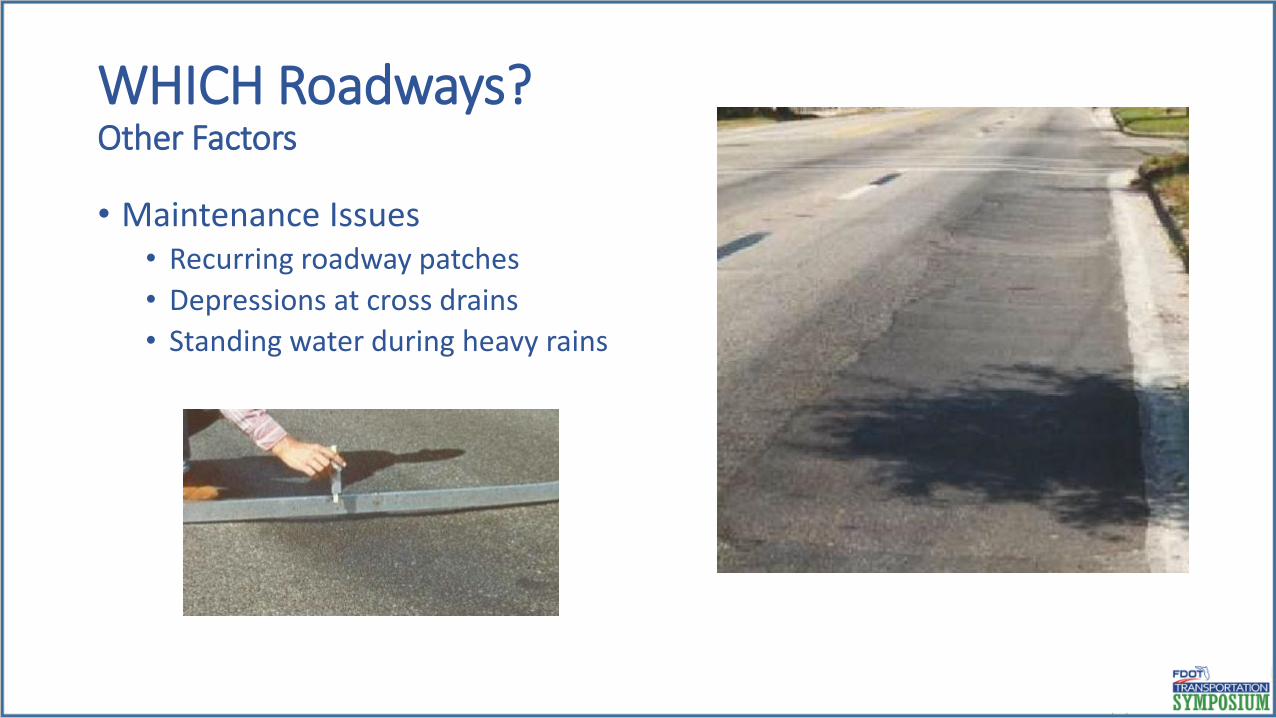
WHICH Roadways?Other Factors
• Maintenance Issues• Recurring roadway patches
• Depressions at cross drains
• Standing water during heavy rains
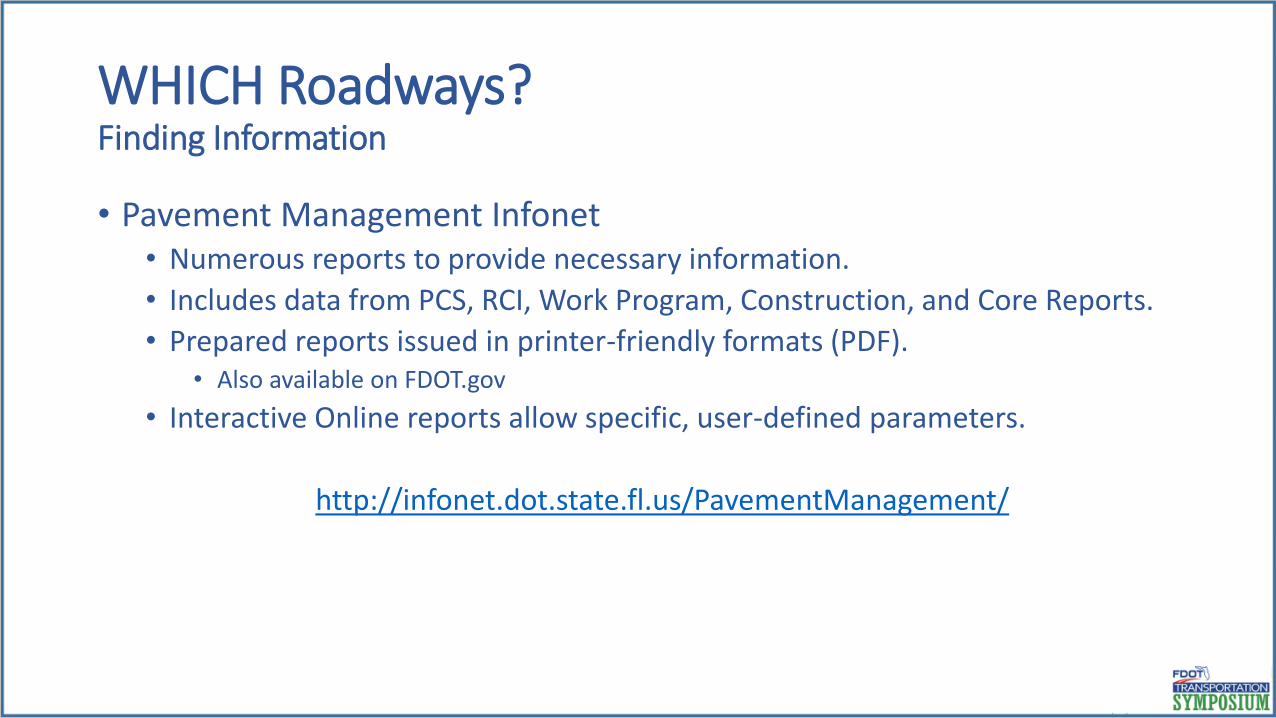
WHICH Roadways?Finding Information
• Pavement Management Infonet• Numerous reports to provide necessary information.
• Includes data from PCS, RCI, Work Program, Construction, and Core Reports.
• Prepared reports issued in printer-friendly formats (PDF).• Also available on FDOT.gov
• Interactive Online reports allow specific, user-defined parameters.
http://infonet.dot.state.fl.us/PavementManagement/
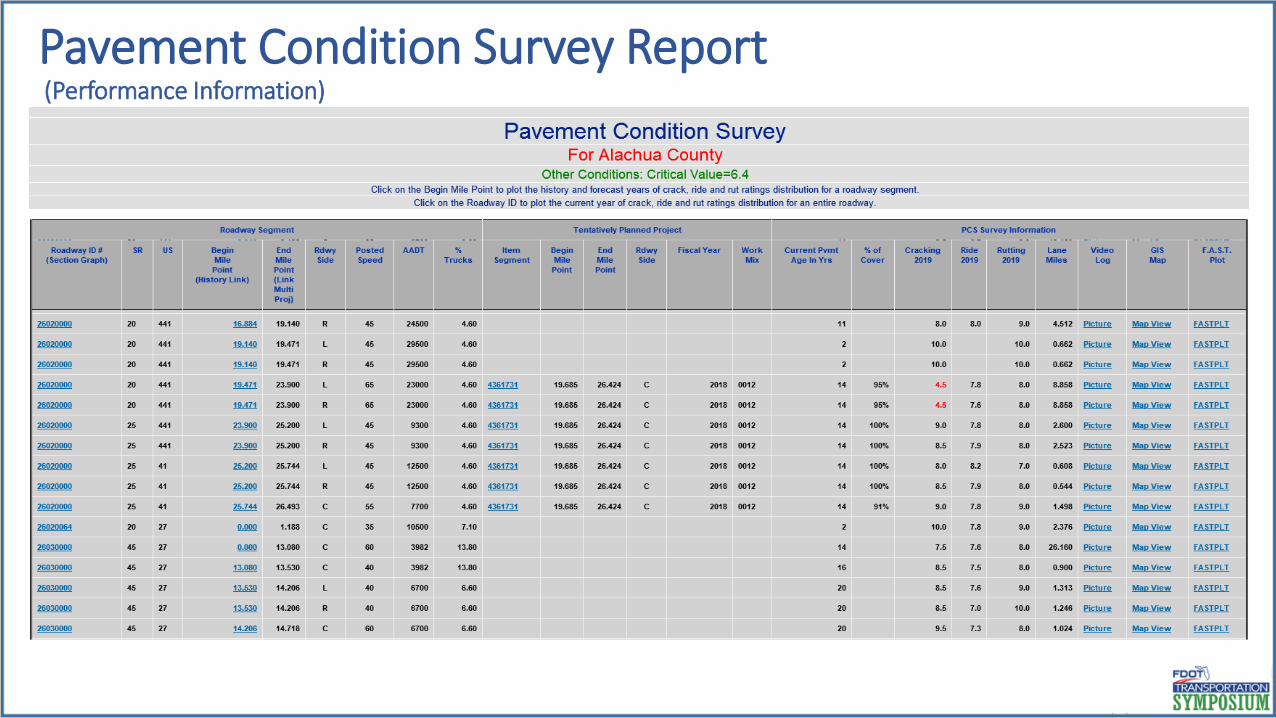
Pavement Condition Survey Report(Performance Information)
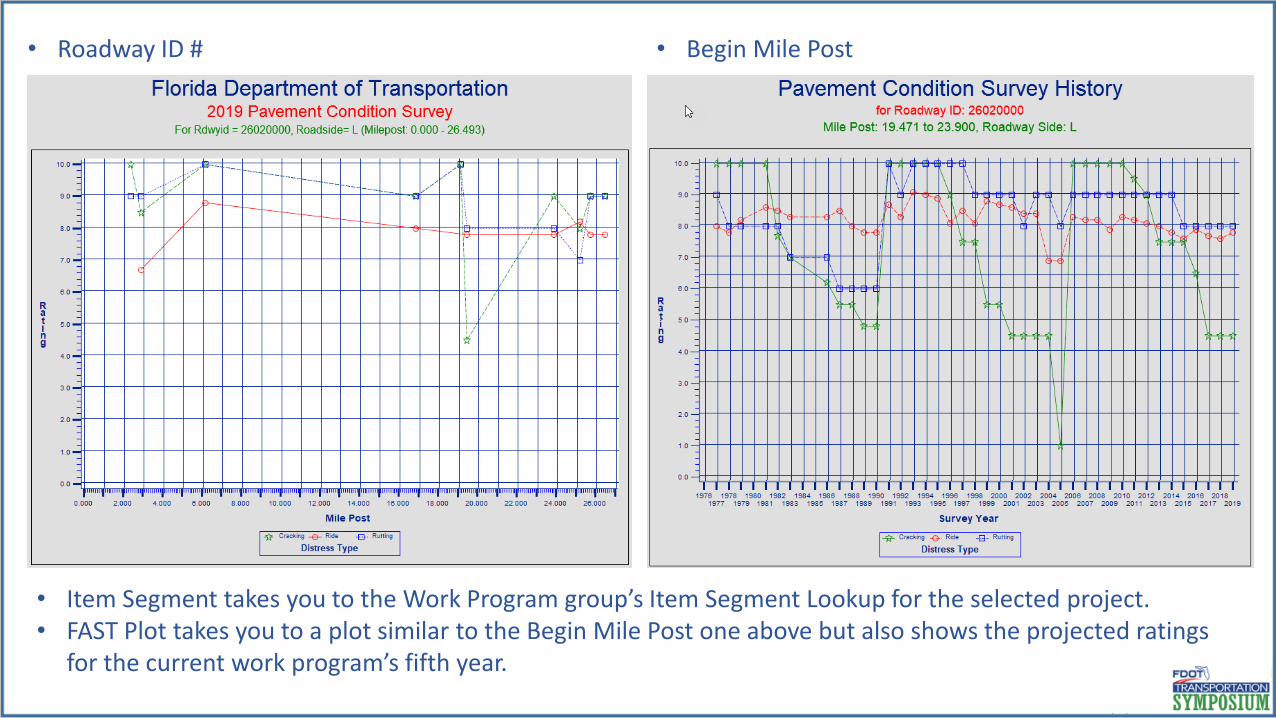
• Roadway ID # • Begin Mile Post
• Item Segment takes you to the Work Program group’s Item Segment Lookup for the selected project.• FAST Plot takes you to a plot similar to the Begin Mile Post one above but also shows the projected ratings
for the current work program’s fifth year.
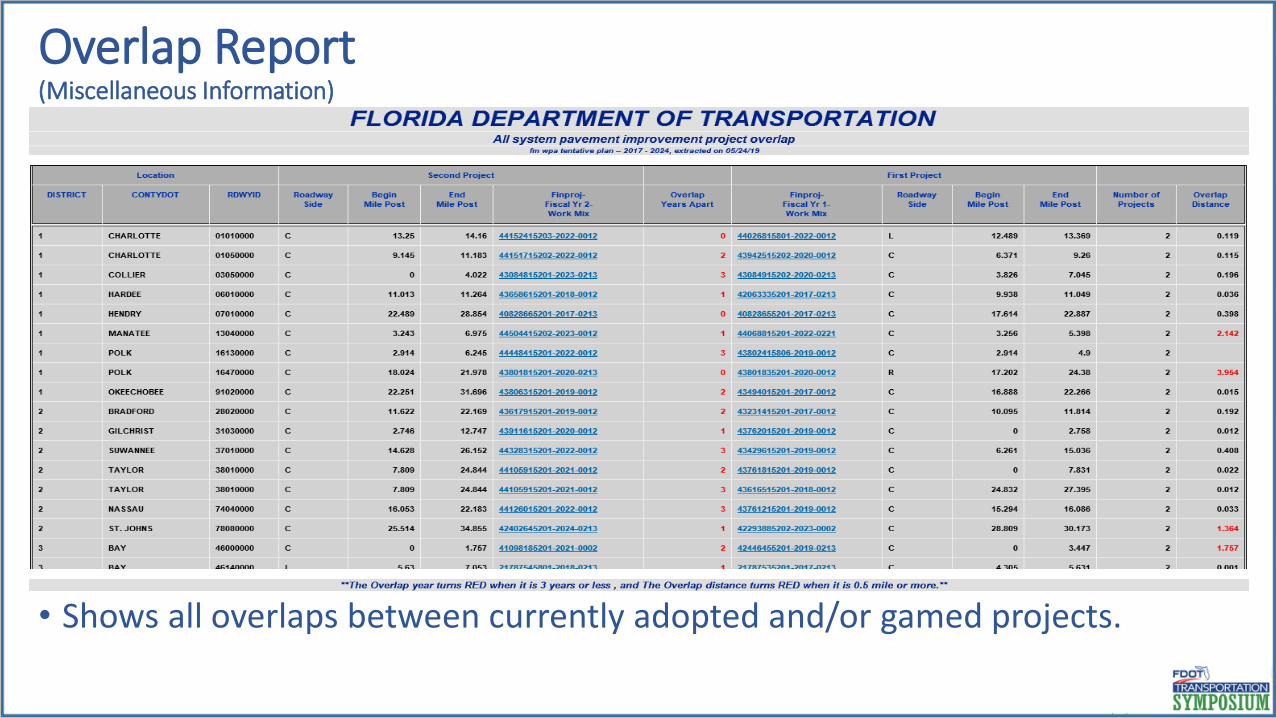
Overlap Report(Miscellaneous Information)
• Shows all overlaps between currently adopted and/or gamed projects.
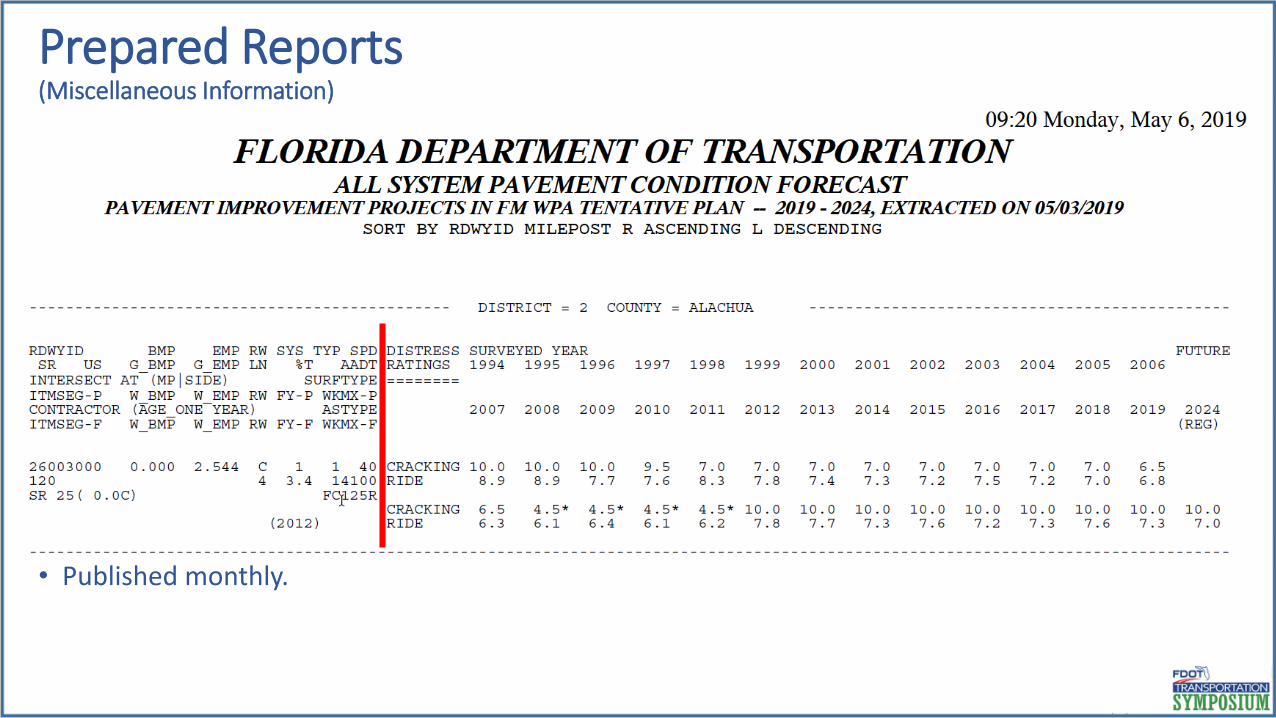
Prepared Reports(Miscellaneous Information)
• Published monthly.
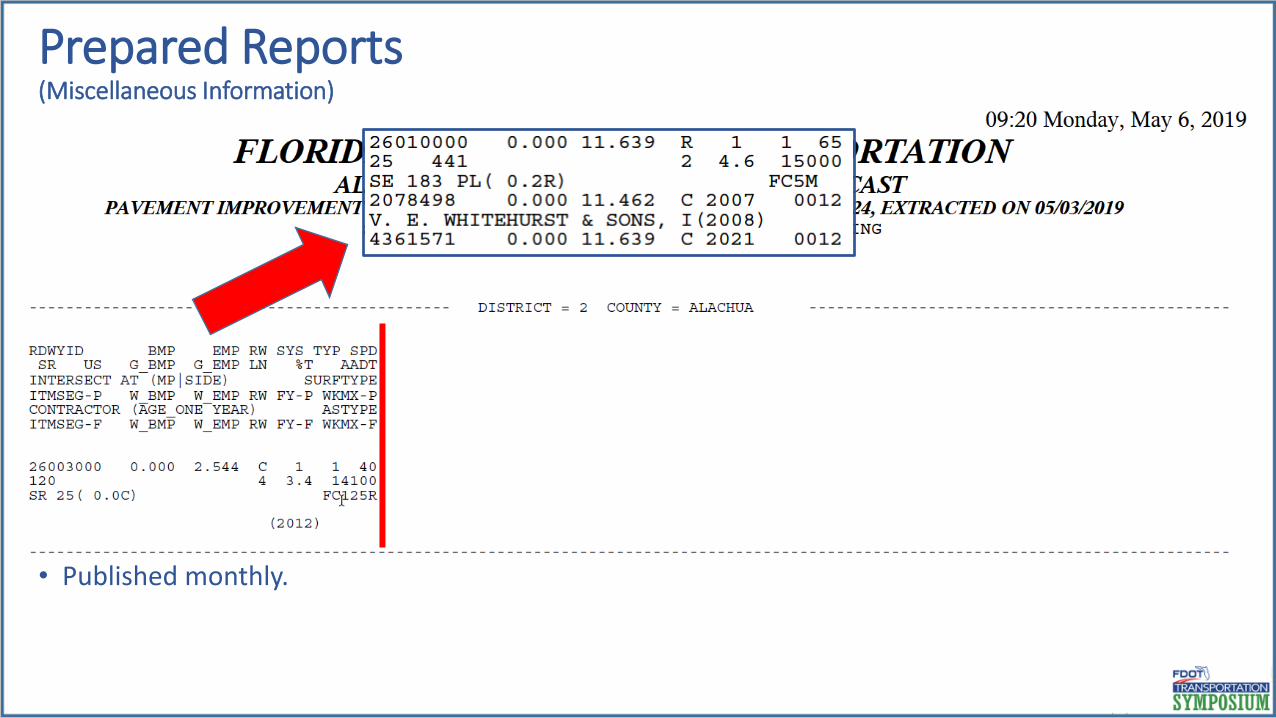
Prepared Reports(Miscellaneous Information)
• Published monthly.
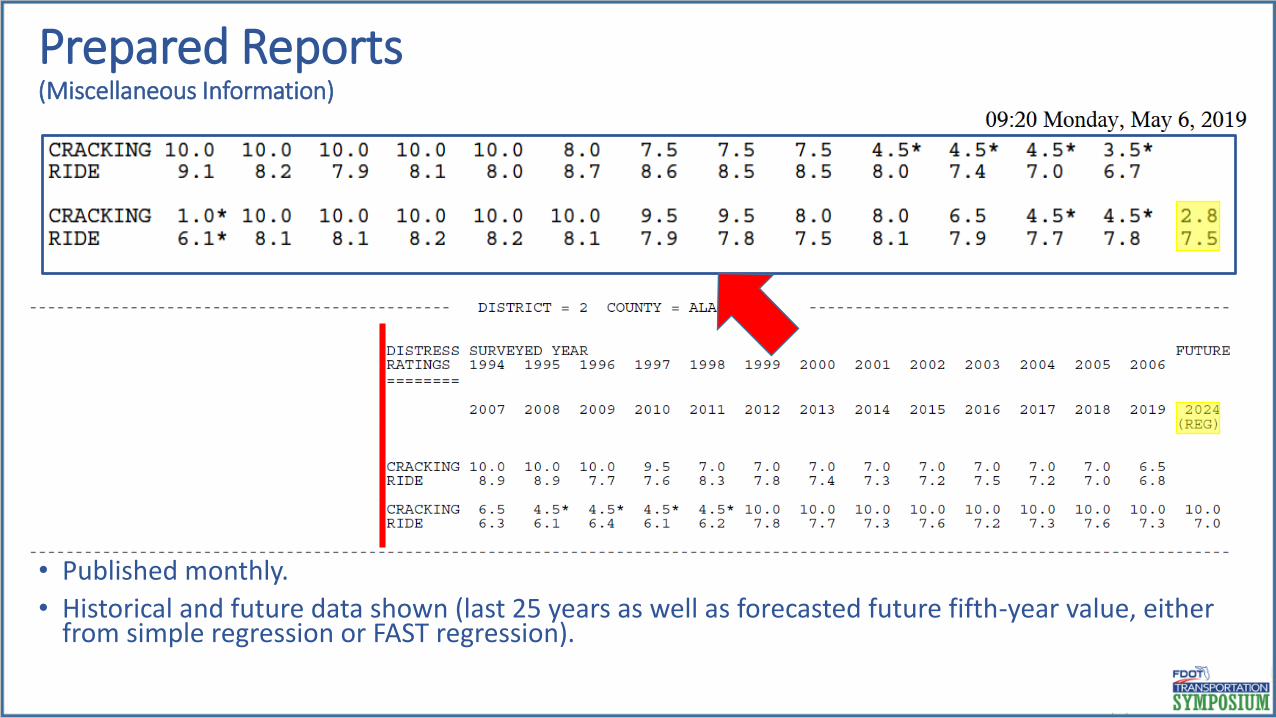
Prepared Reports(Miscellaneous Information)
• Published monthly.
• Historical and future data shown (last 25 years as well as forecasted future fifth-year value, either from simple regression or FAST regression).
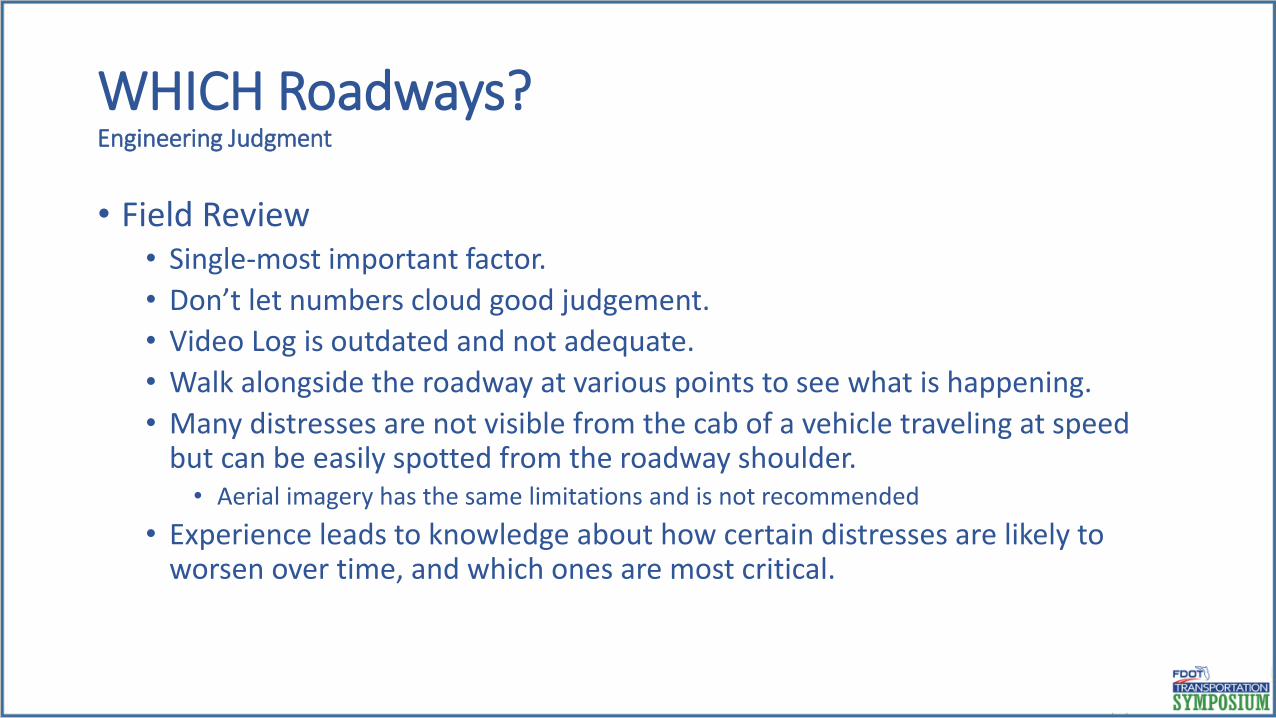
WHICH Roadways?Engineering Judgment
• Field Review• Single-most important factor.
• Don’t let numbers cloud good judgement.
• Video Log is outdated and not adequate.
• Walk alongside the roadway at various points to see what is happening.
• Many distresses are not visible from the cab of a vehicle traveling at speed but can be easily spotted from the roadway shoulder.• Aerial imagery has the same limitations and is not recommended
• Experience leads to knowledge about how certain distresses are likely to worsen over time, and which ones are most critical.
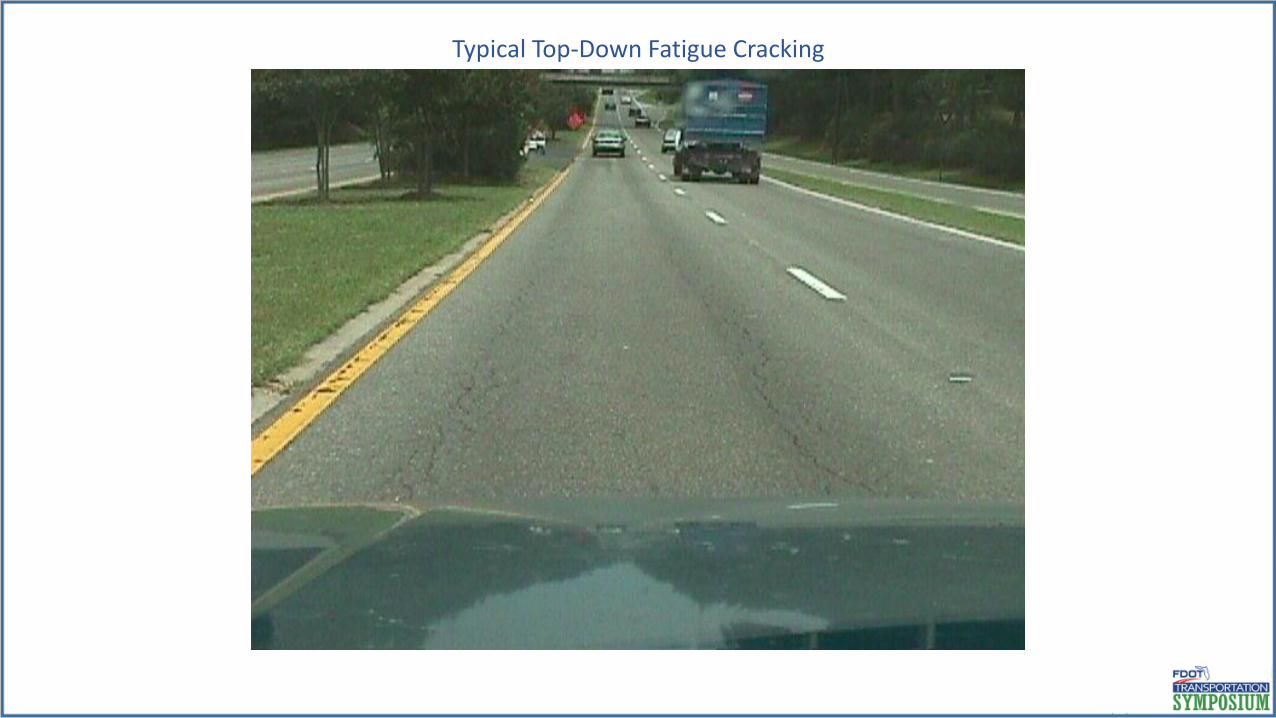
Typical Top-Down Fatigue Cracking
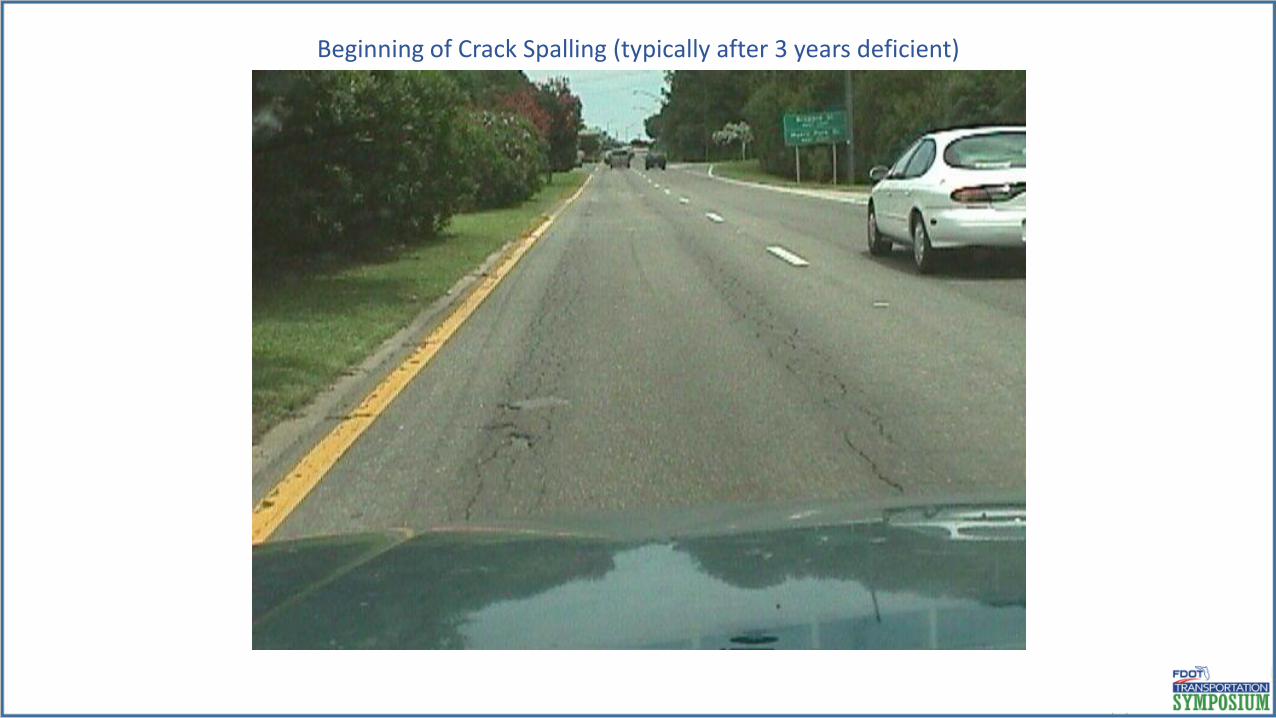
Beginning of Crack Spalling (typically after 3 years deficient)
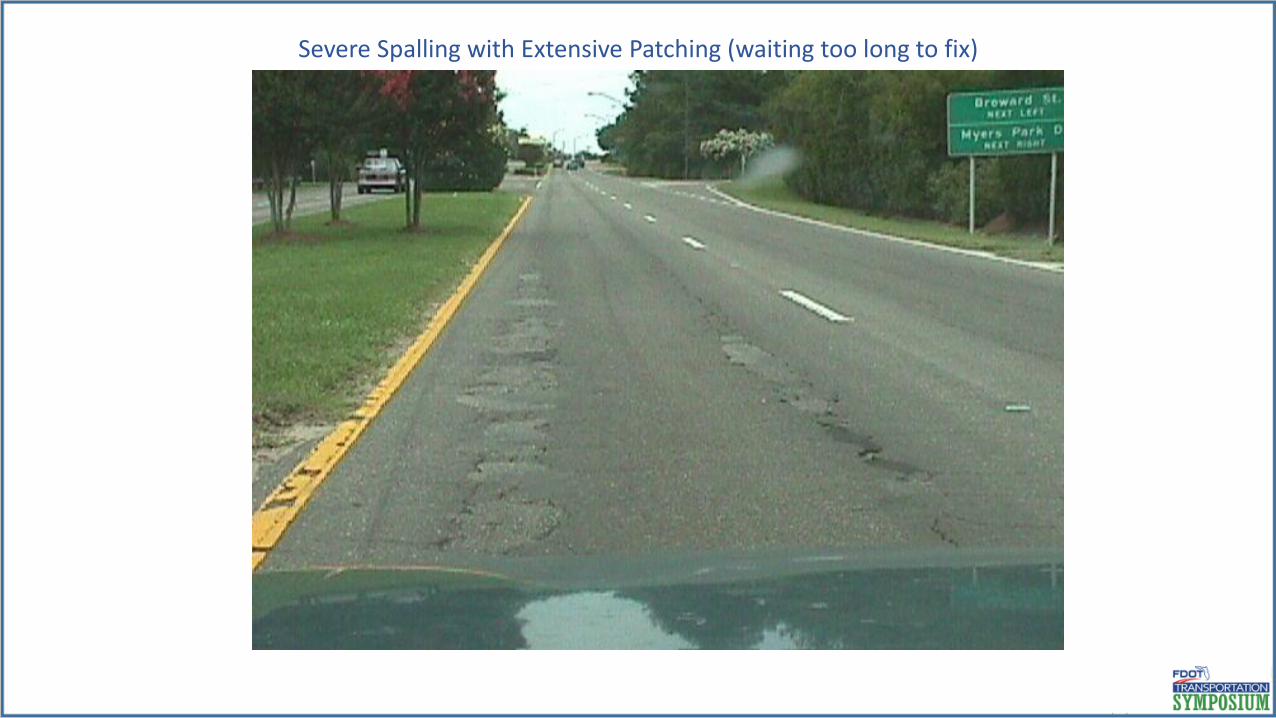
Severe Spalling with Extensive Patching (waiting too long to fix)
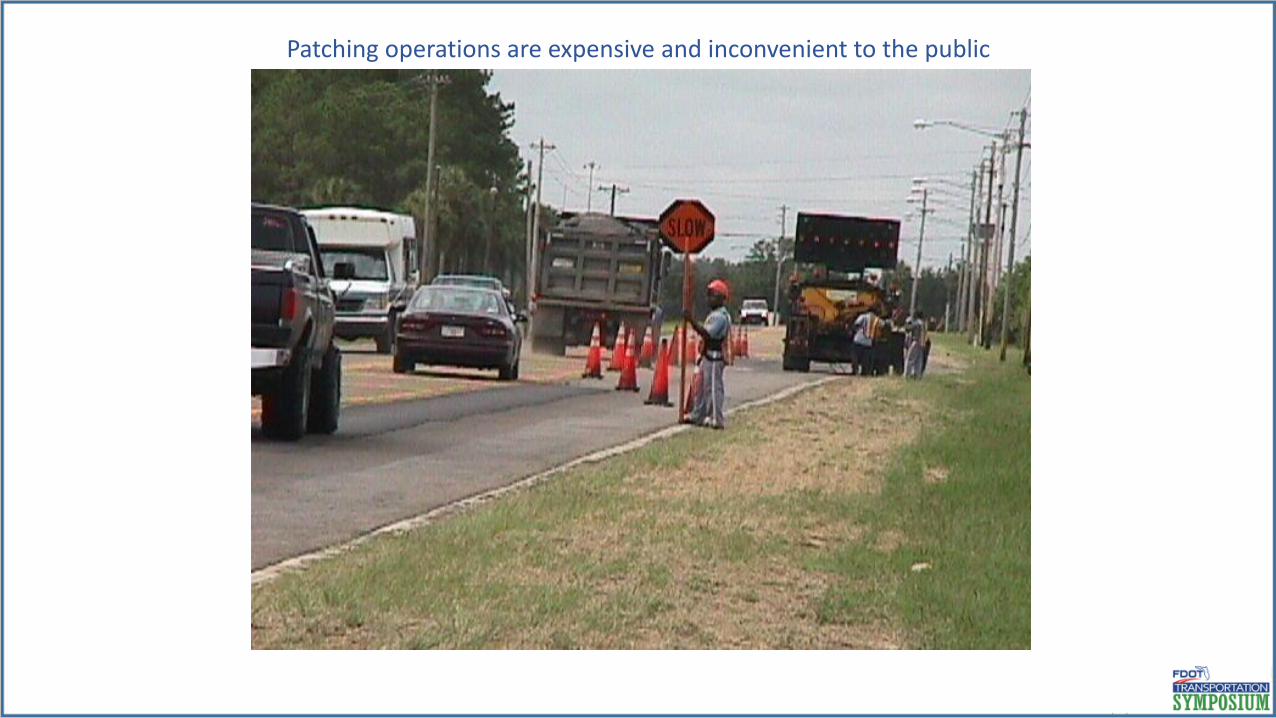
Patching operations are expensive and inconvenient to the public
WHAT Treatment?
• Overlaps with Pavement Design.
• Depends on the distress:• Thin mill and overlay is typically used to treat surface distresses
• Deeper mill and overlay may be needed to address deeper cracking or unstable pavement layers that are causing rutting
• Reconstruction used in areas where the causes of pavement distress are deep within the pavement structure, including base and subgrade layers
WHAT Treatment?
• Alternative Treatments:• Often applicable to a very specific set of conditions.• FDOT has and continues to study a variety of different treatments.
• Hot-in-Place recycling• Bonded friction course• Microsurfacing• Crack sealing• Crack relief layers
• Can generally be constructed cheaper than conventional methods.• Generally have a limited life-cycle compared to standard mill & replace
rehabilitation, although some treatments may provide a longer life but have other drawbacks.
HOW MUCH MONEY?FAST – Florida’s Analysis System for Targets
• Statewide Resurfacing $$ = Cost of keeping SHS at 80% non-deficient.
• Prior to 2009, approximately 5.3% of statewide lane miles, distributed based on current deficiencies.• Fairly consistent target year-to-year.
• 2008 Resurfacing Task Team • More detailed forecasts allow for analysis of many different funding scenarios
• Between FY2010 and FY2022, approximately 10,000 lane miles were or are planned to be taken out of the work program for a reduction of approximately $3 billion.
• Lane miles now distributed based on expected deficiencies in new fifth year.
FAST
What does FAST provide?
• The ability to calculate future resurfacing allocations based on forecasted conditions.
• Impact analysis for different funding scenarios and policy decisions.
• Prioritized list of candidate resurfacing projects (available upon request)• Annual QA process includes comparison of each District’s Resurfacing Monitor
programmed list to the FAST-selected candidate project list, but Districts maintain the freedom to choose what projects to program and when.
• Improved section-level condition forecasts of the SHS.
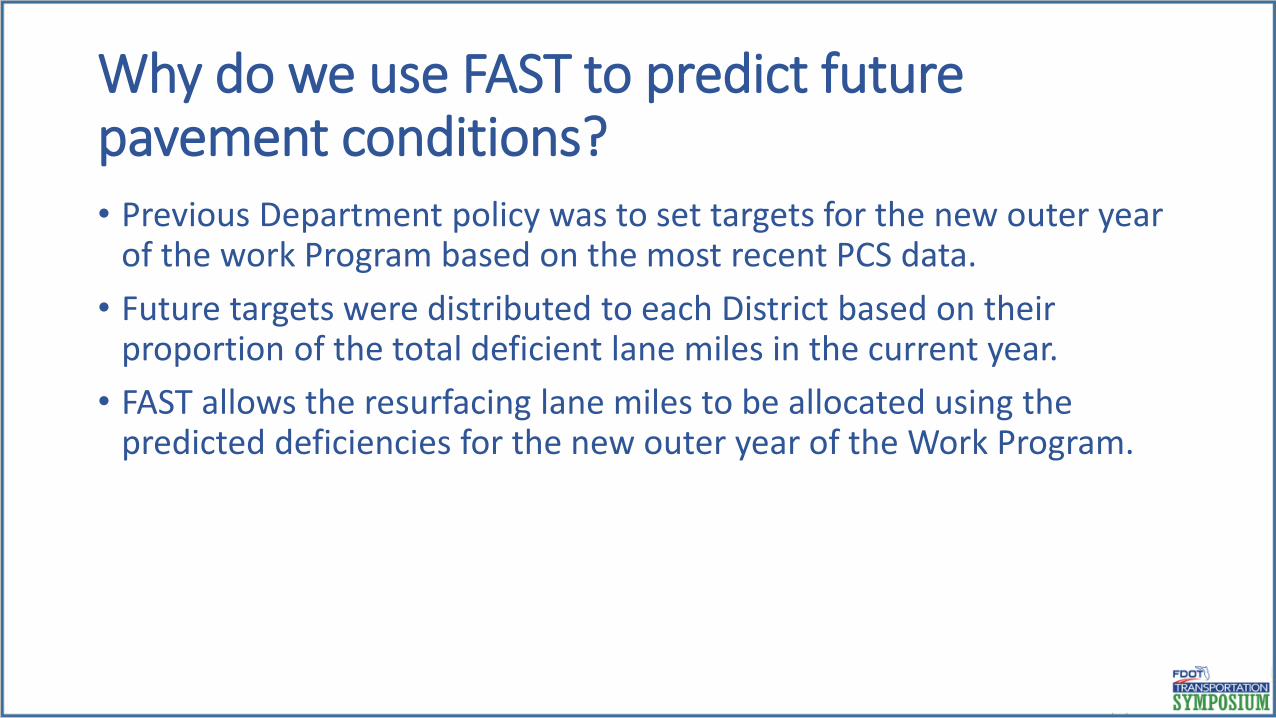
Why do we use FAST to predict future pavement conditions?• Previous Department policy was to set targets for the new outer year
of the work Program based on the most recent PCS data.
• Future targets were distributed to each District based on their proportion of the total deficient lane miles in the current year.
• FAST allows the resurfacing lane miles to be allocated using the predicted deficiencies for the new outer year of the Work Program.
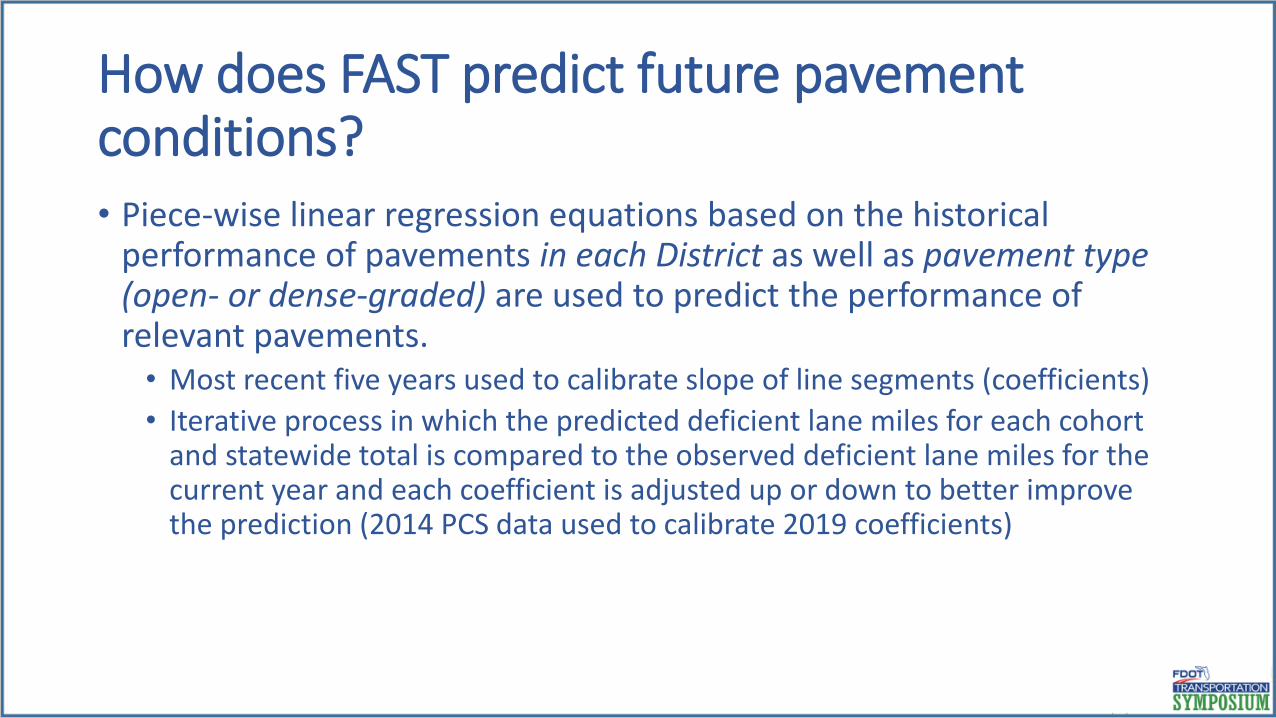
How does FAST predict future pavement conditions?• Piece-wise linear regression equations based on the historical
performance of pavements in each District as well as pavement type (open- or dense-graded) are used to predict the performance of relevant pavements.• Most recent five years used to calibrate slope of line segments (coefficients)
• Iterative process in which the predicted deficient lane miles for each cohort and statewide total is compared to the observed deficient lane miles for the current year and each coefficient is adjusted up or down to better improve the prediction (2014 PCS data used to calibrate 2019 coefficients)
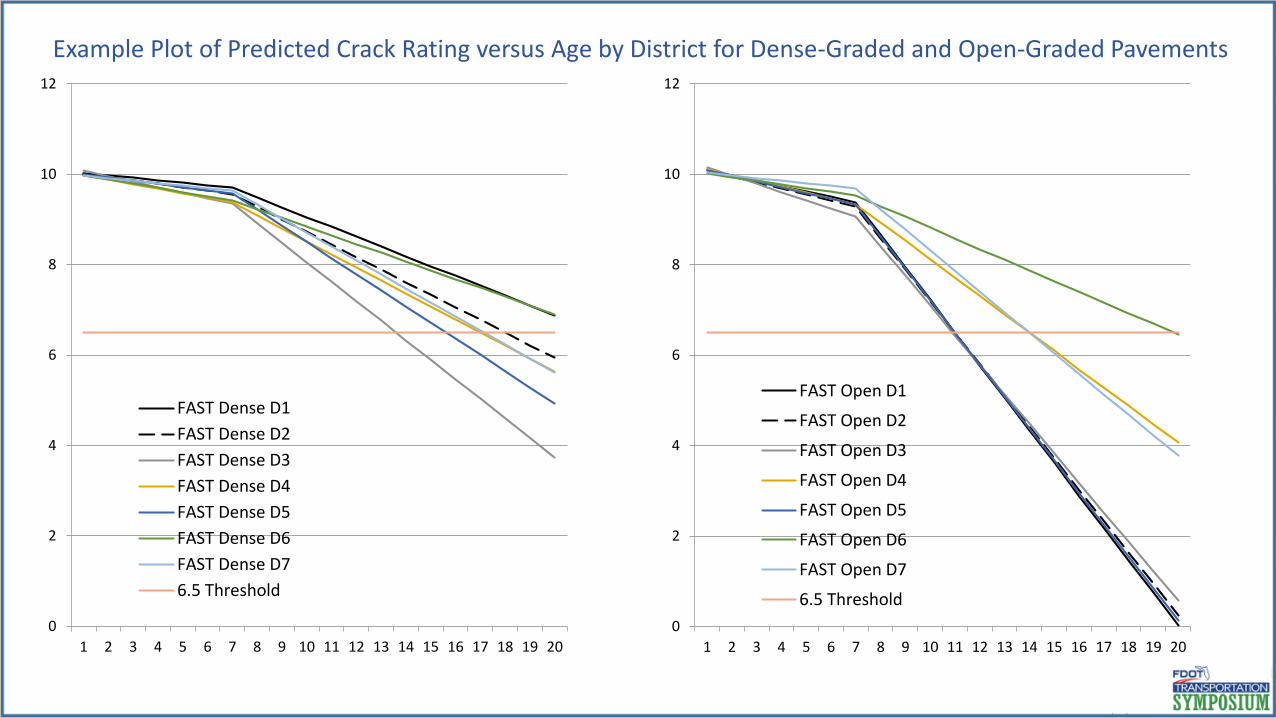
Example Plot of Predicted Crack Rating versus Age by District for Dense-Graded and Open-Graded Pavements
0
2
4
6
8
10
12
1 2 3 4 5 6 7 8 9 10 11 12 13 14 15 16 17 18 19 20
FAST Dense D1
FAST Dense D2
FAST Dense D3
FAST Dense D4
FAST Dense D5
FAST Dense D6
FAST Dense D7
6.5 Threshold
0
2
4
6
8
10
12
1 2 3 4 5 6 7 8 9 10 11 12 13 14 15 16 17 18 19 20
FAST Open D1
FAST Open D2
FAST Open D3
FAST Open D4
FAST Open D5
FAST Open D6
FAST Open D7
6.5 Threshold
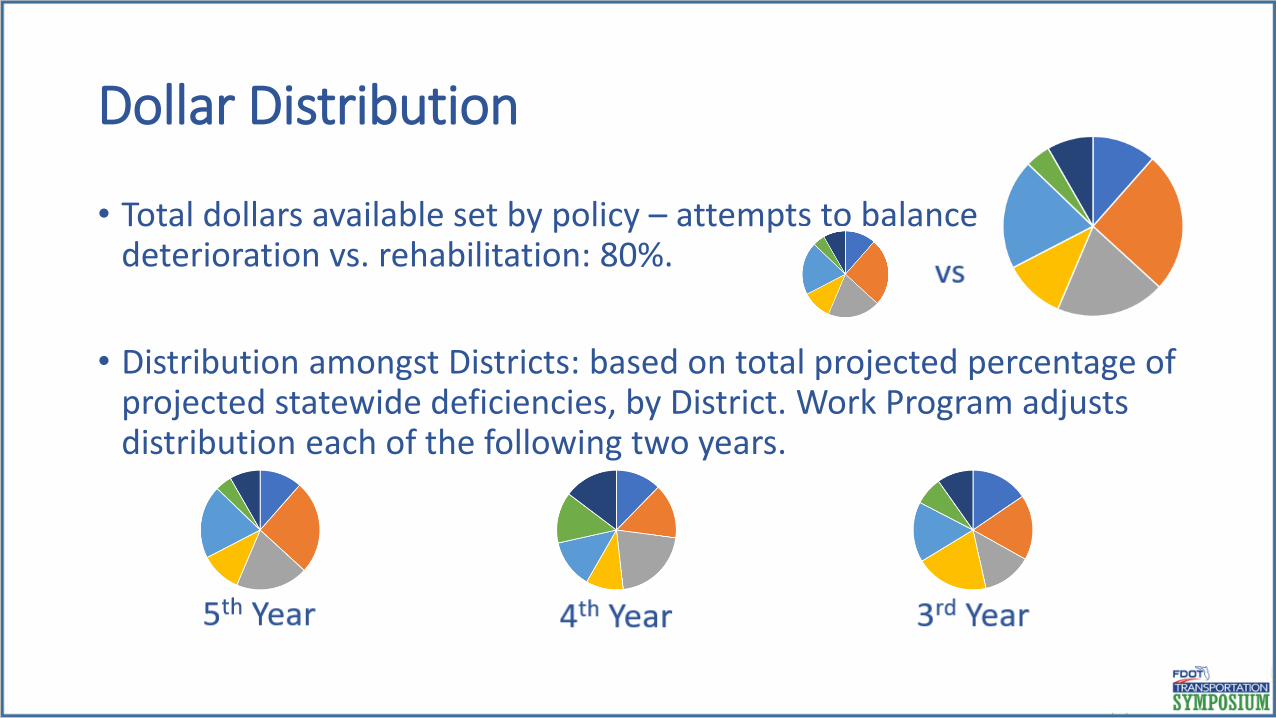
Dollar Distribution
• Total dollars available set by policy – attempts to balance deterioration vs. rehabilitation: 80%.
• Distribution amongst Districts: based on total projected percentage of projected statewide deficiencies, by District. Work Program adjusts distribution each of the following two years.
FAST Limitations
• Accurate on a system-wide level.
• Section-level projections are less accurate.• Better than pre-FAST section-level projections
• Use historical performance data of other similar roadways
• Not accurate enough to rely solely upon for project programming purposes
STATEWIDE SYSTEM PLANNINGProject Development
• Pavement management deals with primarily system-level planning
• System-level planning needs to be applied at the project level
• Scope Development
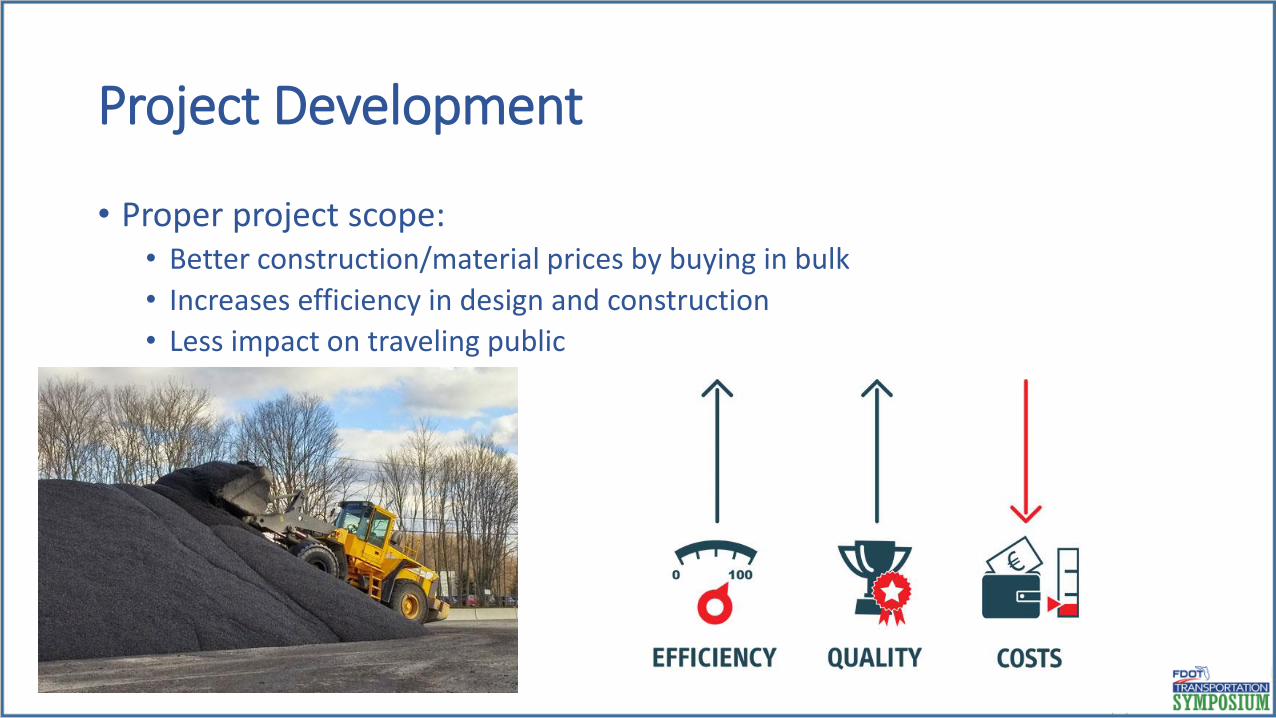
Project Development
• Proper project scope:• Better construction/material prices by buying in bulk
• Increases efficiency in design and construction
• Less impact on traveling public
Project Development / Scoping
• Begin and End Project Limits• Best practice is to match the limits of a previously constructed project• Field review to ensure proposed limits make sense• Coordinate with other ongoing projects• Coordinate with other agencies
• Exceptions• OK to except perfectly good pavement sections out of a resurfacing project• Keep in mind that any exception areas will have to last until the next
resurfacing of the entire roadway• Will require maintenance activity or stand-alone project if exception area
doesn’t last until next resurfacing
Project Development / Scoping
• Which Lanes?• Almost always resurface both all lanes of a non-divided roadway and all travel
lanes in a given direction on divided roadways.• Preferable to resurface both directions on divided roadways if constructed at the same
time and/or are within 1 to 1.5 points of each other in rating. Significant savings in MOT dollars and interruptions to the traveling public.
• Ramps, accel/decel lanes, parking lanes, turn lanes – usually.
• Paved shoulders, median crossovers – often, but adhering to practical design.
Project Development
• Ancillary features• Rest areas• Frontage roads• Cross streets / side streets• Inspection / Weigh stations• Overpass / Underpass roadways
Keep in mind that only through lanes are rated and therefore credit towards your resurfacing target is not given for ancillary features (except frontage roads), ramps, accel/decel lanes, turn lanes, and parking lanes.
Pavement Management Summary
• Good pavement management practices allow us to make good decisions about future resurfacing needs.
• Resurfacing roads that need to be resurfaced while maximizing useable life.
• Decreased cost through increased efficiency.
• Positive public perception.
Contacts
Internal: http://infonet.dot.state.fl.us/PavementManagement/
External: https://www.fdot.gov/roadway/PM/PM.shtm
Wiley Cunagin, PE, PhD
850-414-4354
Kyle Kroodsma
850-414-4372