pavement condition index
TRANSCRIPT
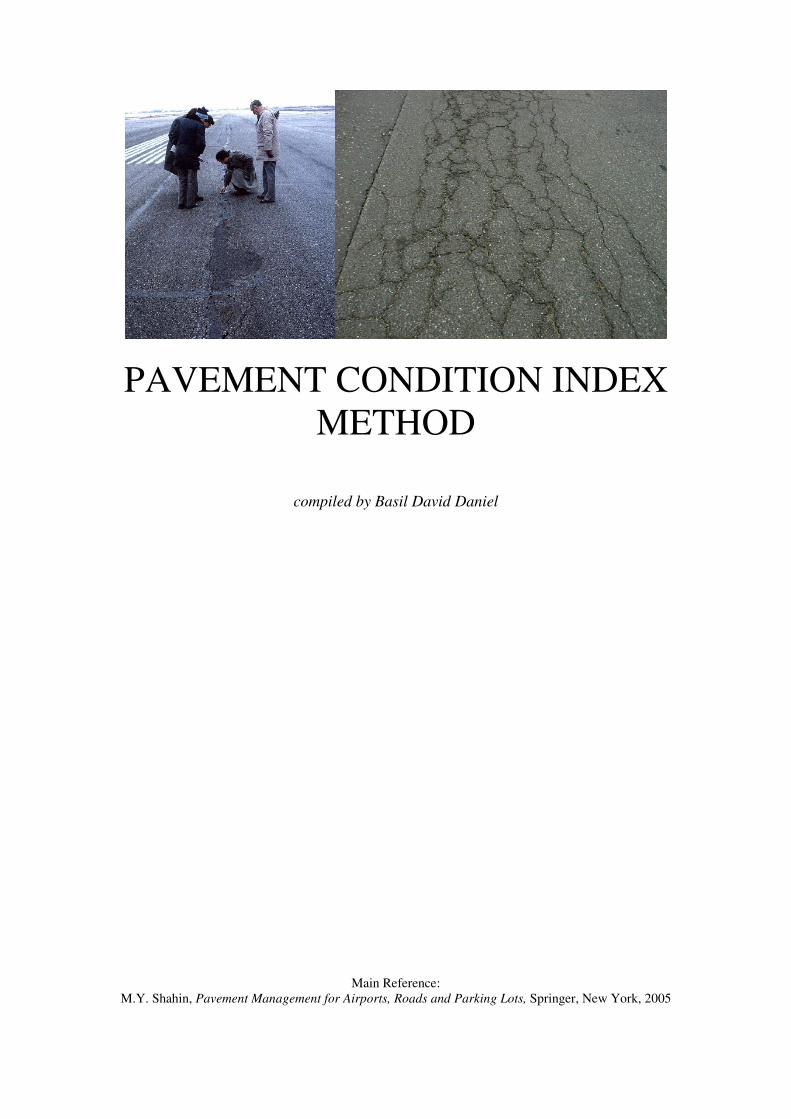
PAVEMENT CONDITION INDEX
METHOD
compiled by Basil David Daniel
Main Reference:
M.Y. Shahin, Pavement Management for Airports, Roads and Parking Lots, Springer, New York, 2005
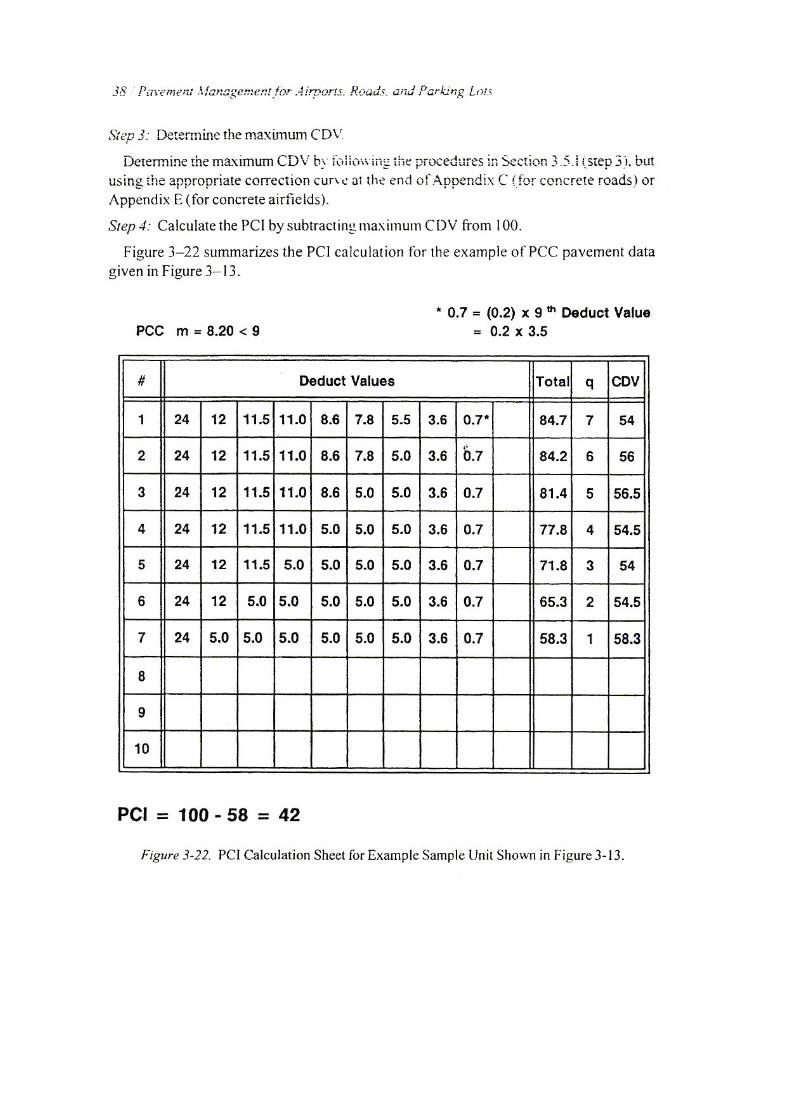
Pavement Condition Index (PCI) Method
Background
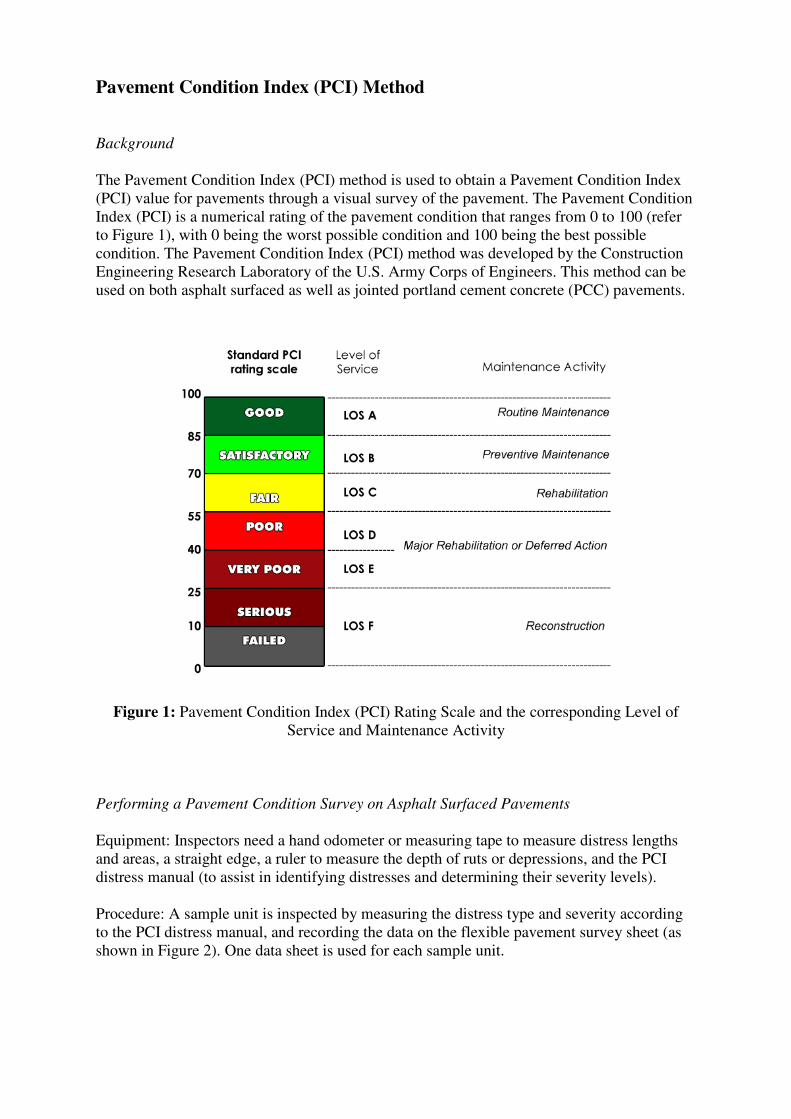
The Pavement Condition Index (PCI) method is used to obtain a Pavement Condition Index
(PCI) value for pavements through a visual survey of the pavement. The Pavement Condition
Index (PCI) is a numerical rating of the pavement condition that ranges from 0 to 100 (refer
to Figure 1), with 0 being the worst possible condition and 100 being the best possible
condition. The Pavement Condition Index (PCI) method was developed by the Construction
Engineering Research Laboratory of the U.S. Army Corps of Engineers. This method can be
used on both asphalt surfaced as well as jointed portland cement concrete (PCC) pavements.
Figure 1: Pavement Condition Index (PCI) Rating Scale and the corresponding Level of
Service and Maintenance Activity
Performing a Pavement Condition Survey on Asphalt Surfaced Pavements
Equipment: Inspectors need a hand odometer or measuring tape to measure distress lengths
and areas, a straight edge, a ruler to measure the depth of ruts or depressions, and the PCI
distress manual (to assist in identifying distresses and determining their severity levels).
Procedure: A sample unit is inspected by measuring the distress type and severity according
to the PCI distress manual, and recording the data on the flexible pavement survey sheet (as
shown in Figure 2). One data sheet is used for each sample unit.
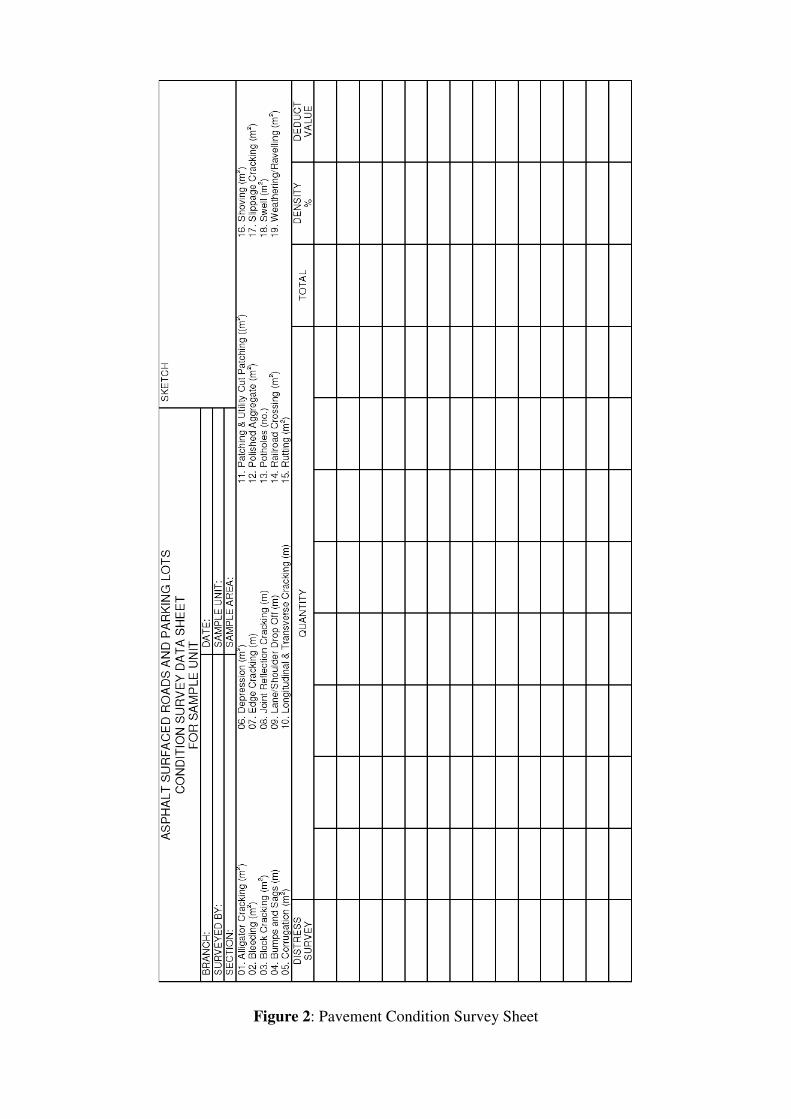
Figure 2: Pavement Condition Survey Sheet
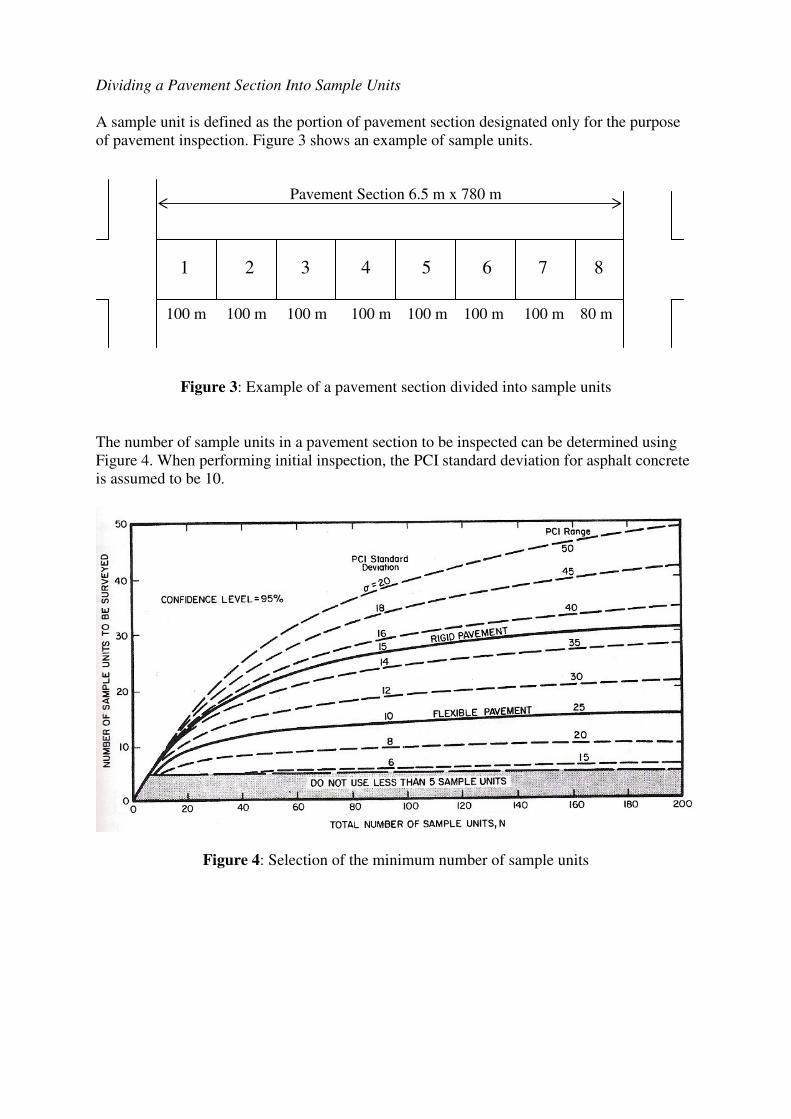
Dividing a Pavement Section Into Sample Units
A sample unit is defined as the portion of pavement section designated only for the purpose
of pavement inspection. Figure 3 shows an example of sample units.
Figure 3: Example of a pavement section divided into sample units
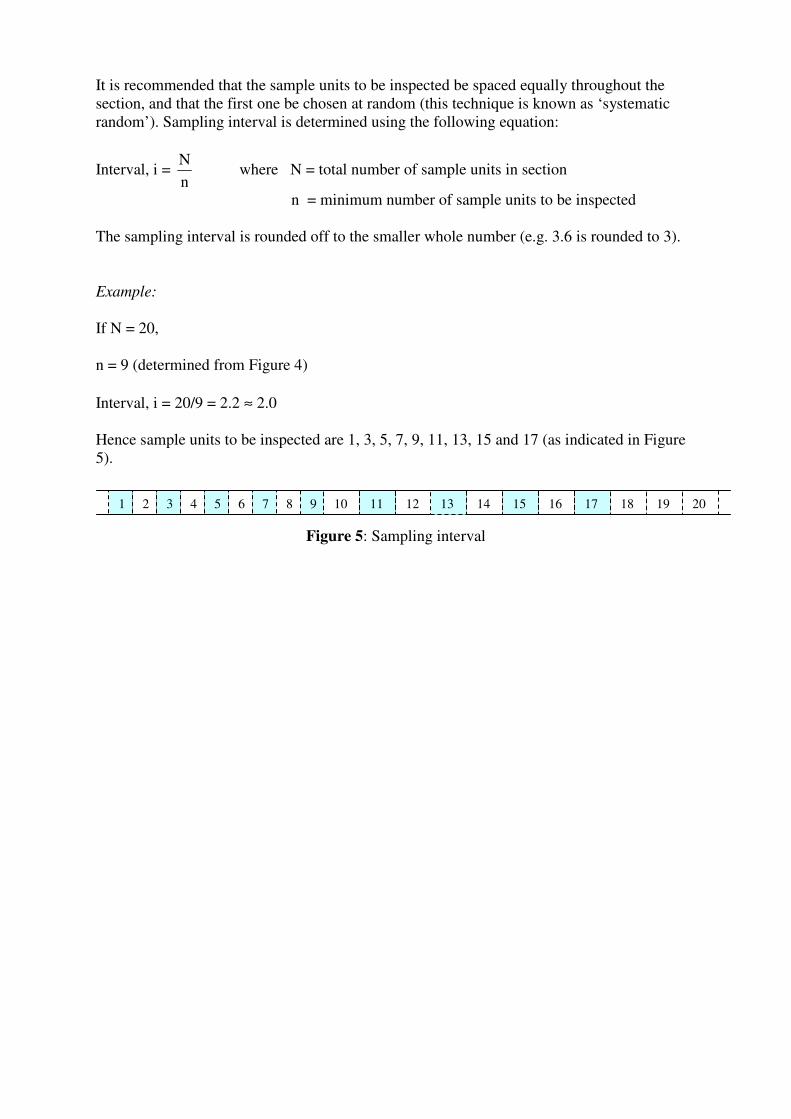
The number of sample units in a pavement section to be inspected can be determined using
Figure 4. When performing initial inspection, the PCI standard deviation for asphalt concrete
is assumed to be 10.
Figure 4: Selection of the minimum number of sample units
Pavement Section 6.5 m x 780 m
100 m 100 m 100 m 100 m 100 m 100 m 100 m 80 m
1 2 3 4 5 6 7 8
14 15 17 18 19 20
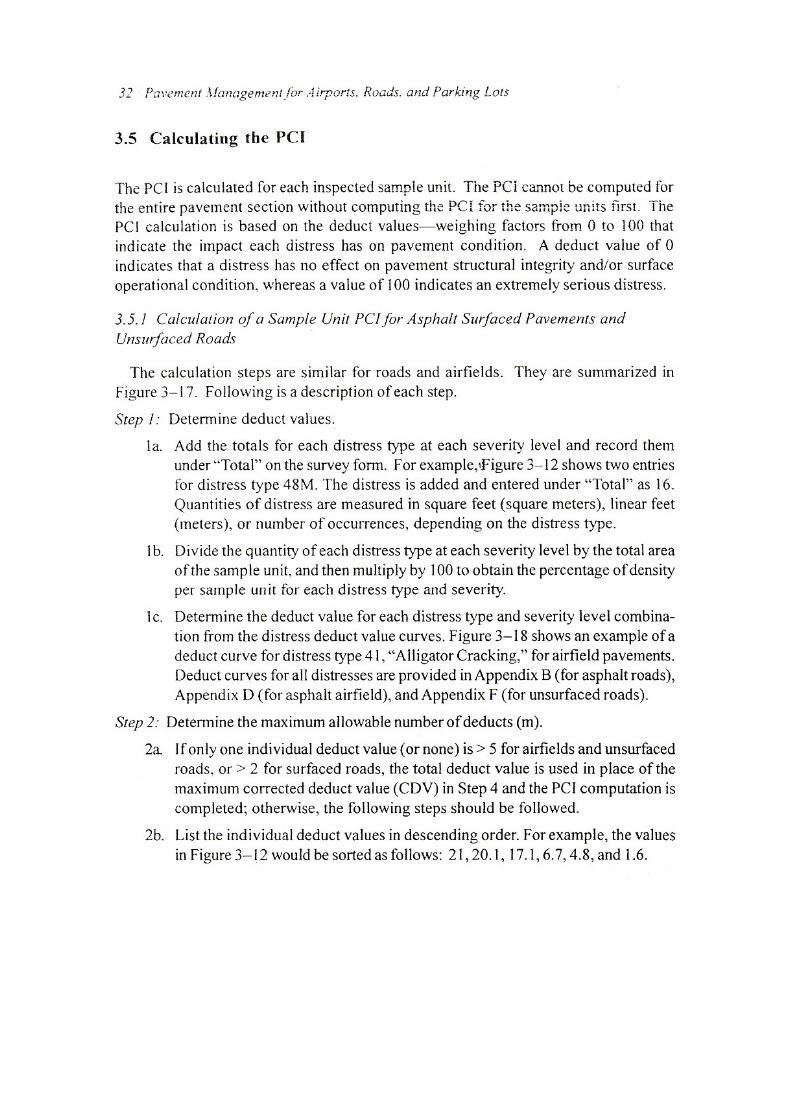
It is recommended that the sample units to be inspected be spaced equally throughout the
section, and that the first one be chosen at random (this technique is known as ‘systematic
random’). Sampling interval is determined using the following equation:
Interval, i = n
N where N = total number of sample units in section
n = minimum number of sample units to be inspected
The sampling interval is rounded off to the smaller whole number (e.g. 3.6 is rounded to 3).
Example:
If N = 20,
n = 9 (determined from Figure 4)
Interval, i = 20/9 = 2.2 ≈ 2.0
Hence sample units to be inspected are 1, 3, 5, 7, 9, 11, 13, 15 and 17 (as indicated in Figure
5).
Figure 5: Sampling interval
1 2 3 4 5 6 7 8 9 10 11 12 13 16
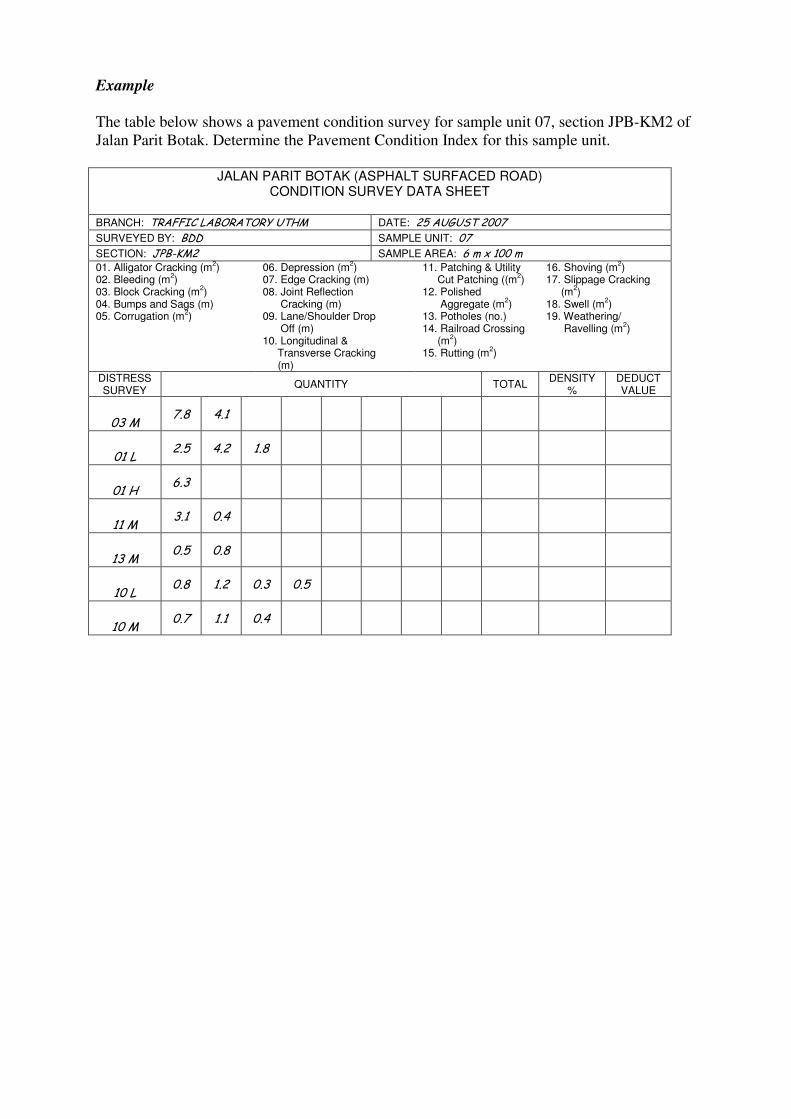
Example
The table below shows a pavement condition survey for sample unit 07, section JPB-KM2 of
Jalan Parit Botak. Determine the Pavement Condition Index for this sample unit.
JALAN PARIT BOTAK (ASPHALT SURFACED ROAD)
CONDITION SURVEY DATA SHEET
BRANCH: TRAFFIC LABORATORY UTHM DATE: 25 AUGUST 2007
SURVEYED BY: BDD SAMPLE UNIT: 07
SECTION: JPB-KM2 SAMPLE AREA: 6 m x 100 m
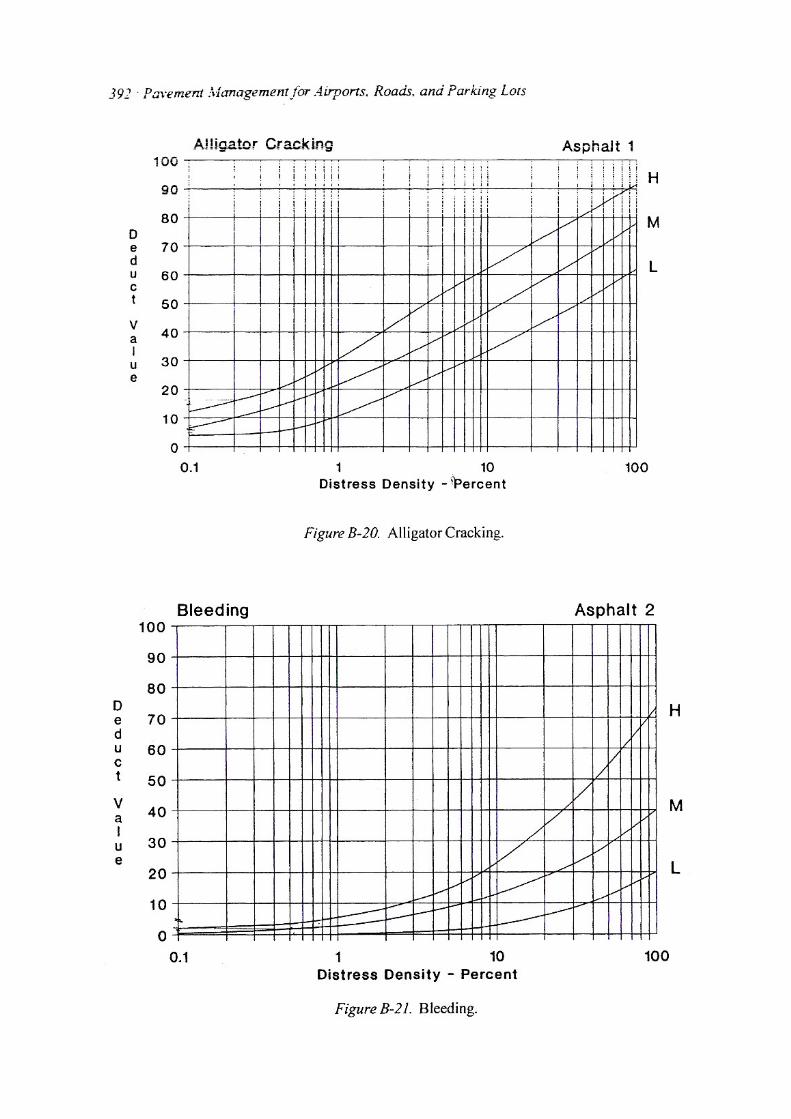
01. Alligator Cracking (m2)
02. Bleeding (m2)
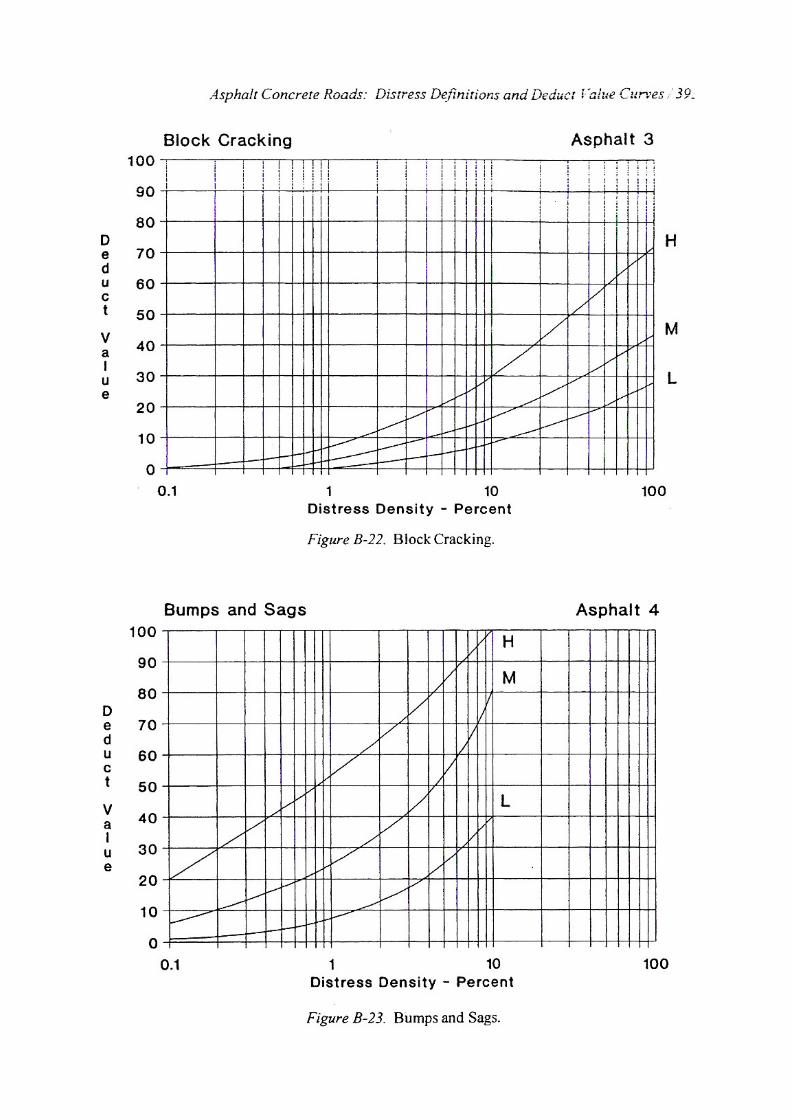
03. Block Cracking (m2)
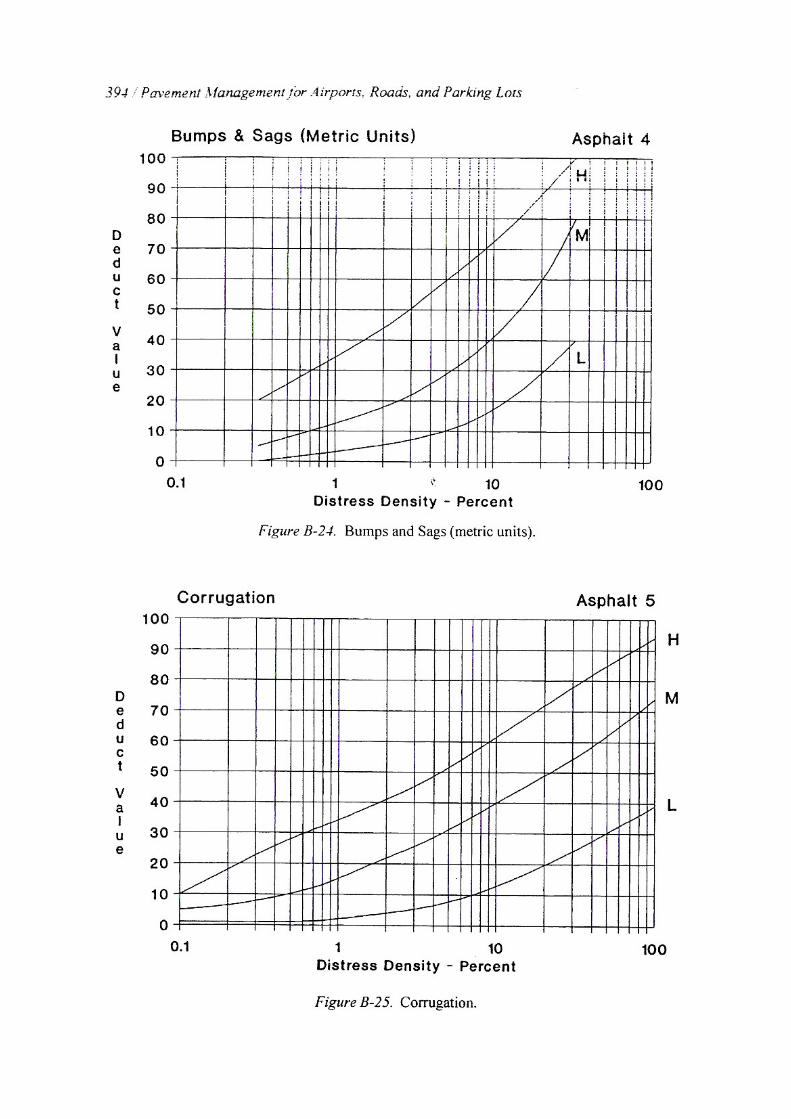
04. Bumps and Sags (m) 05. Corrugation (m
2)
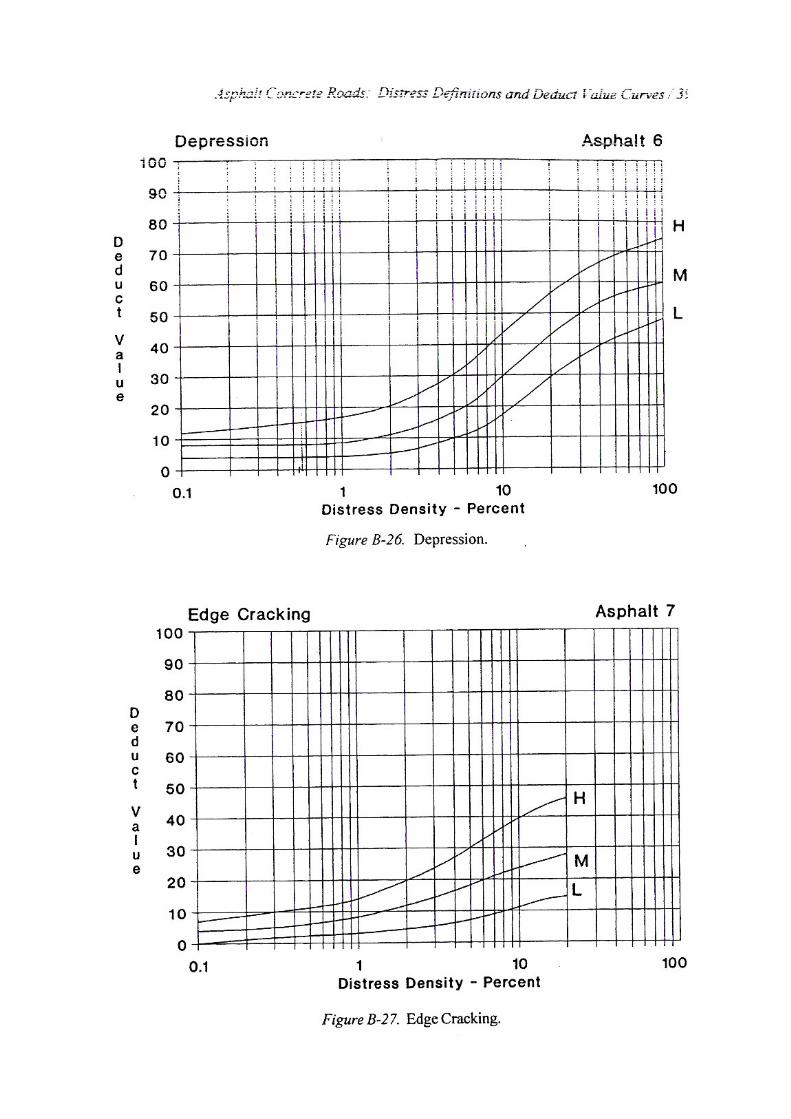
06. Depression (m2)
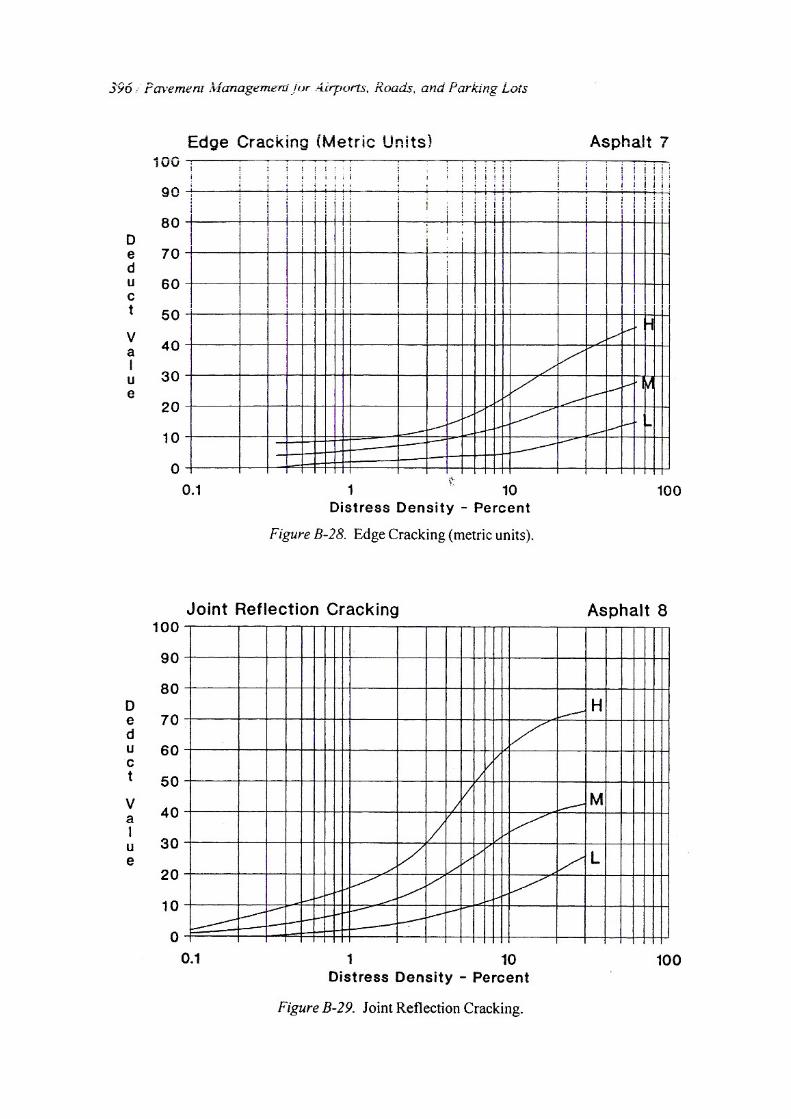
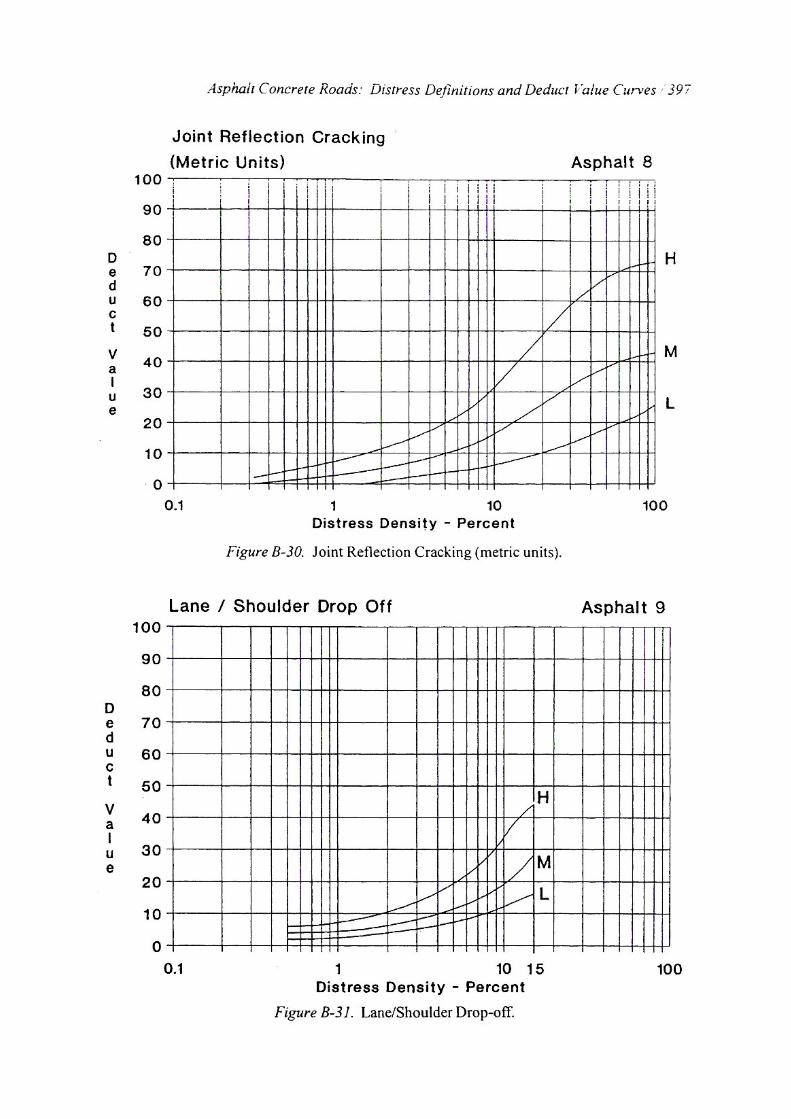
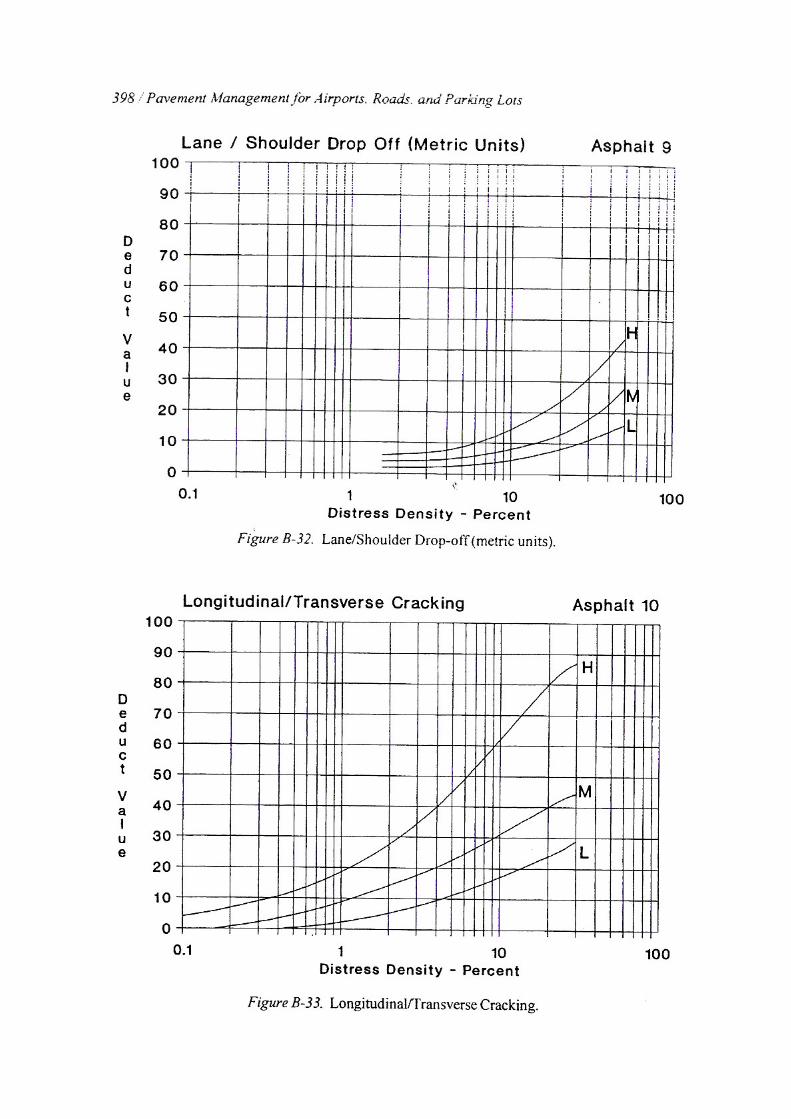
07. Edge Cracking (m) 08. Joint Reflection Cracking (m) 09. Lane/Shoulder Drop Off (m) 10. Longitudinal & Transverse Cracking (m)
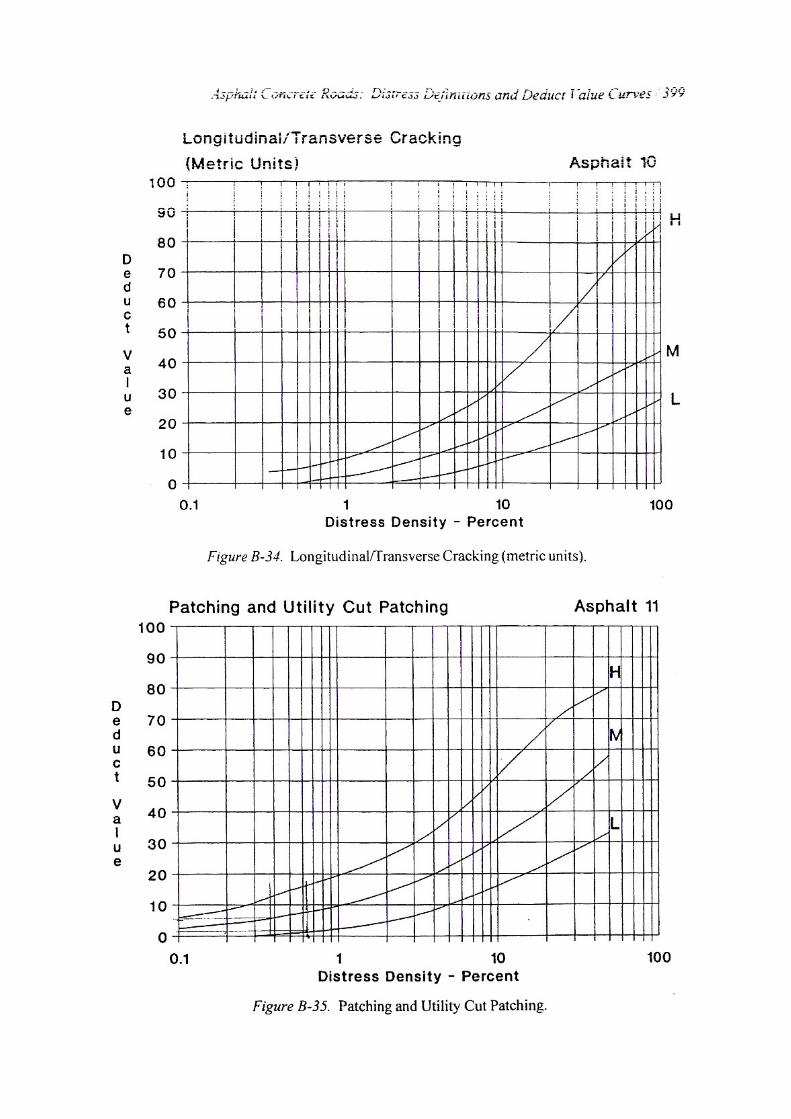
11. Patching & Utility Cut Patching ((m
2)
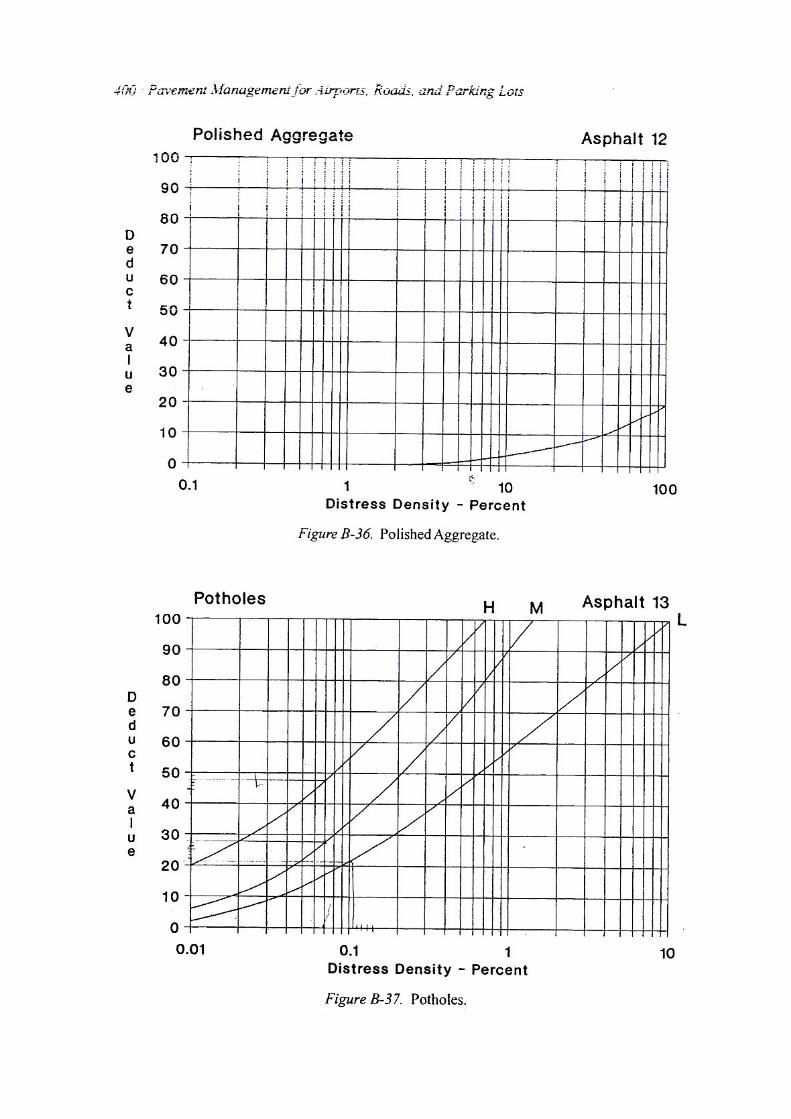
12. Polished Aggregate (m
2)
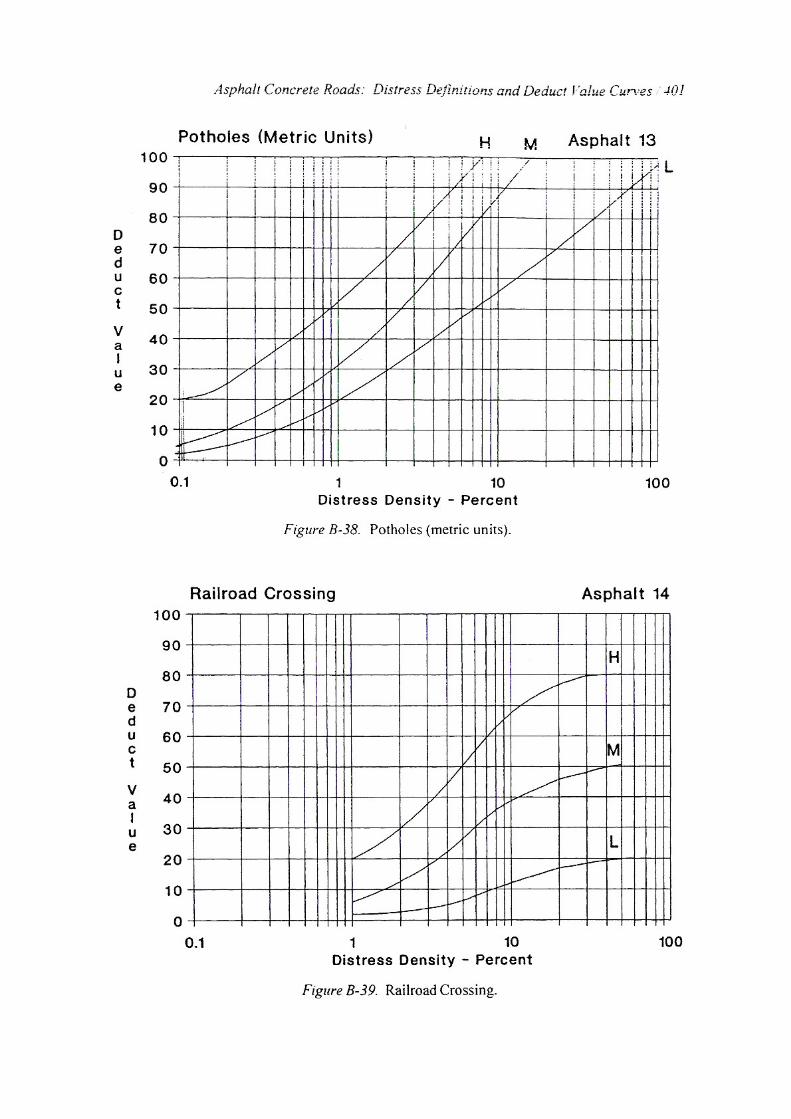
13. Potholes (no.) 14. Railroad Crossing (m
2)
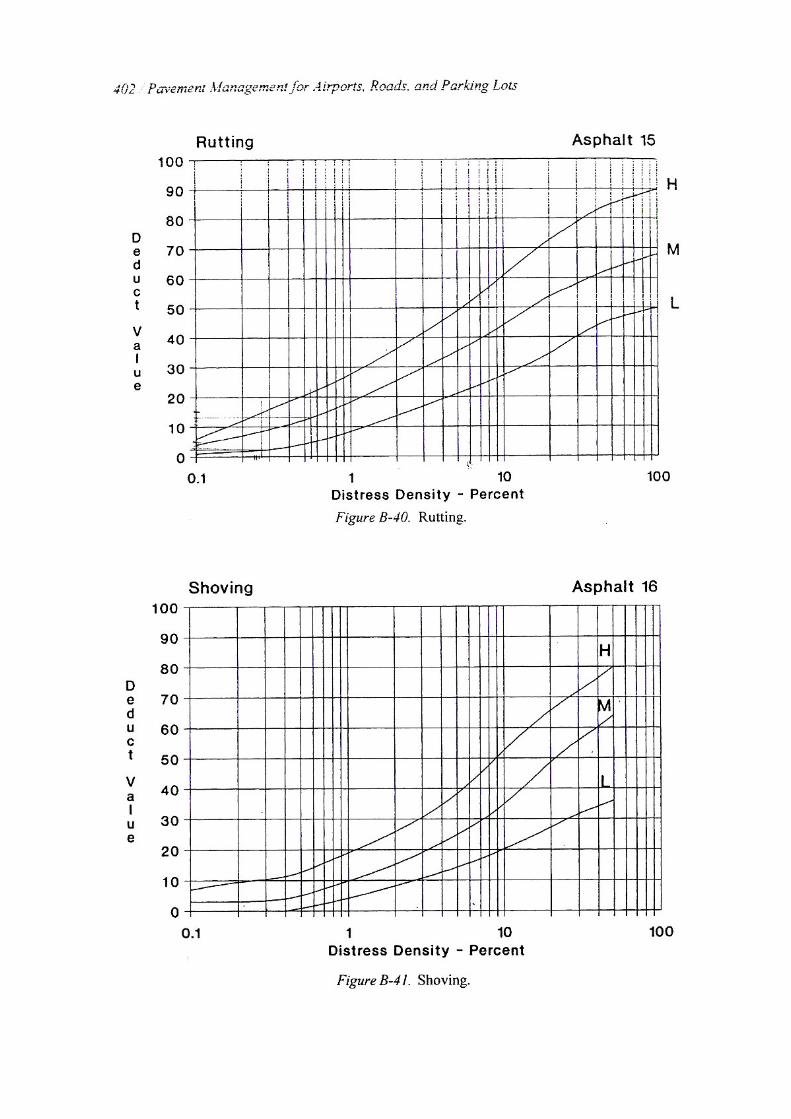
15. Rutting (m2)
16. Shoving (m2)
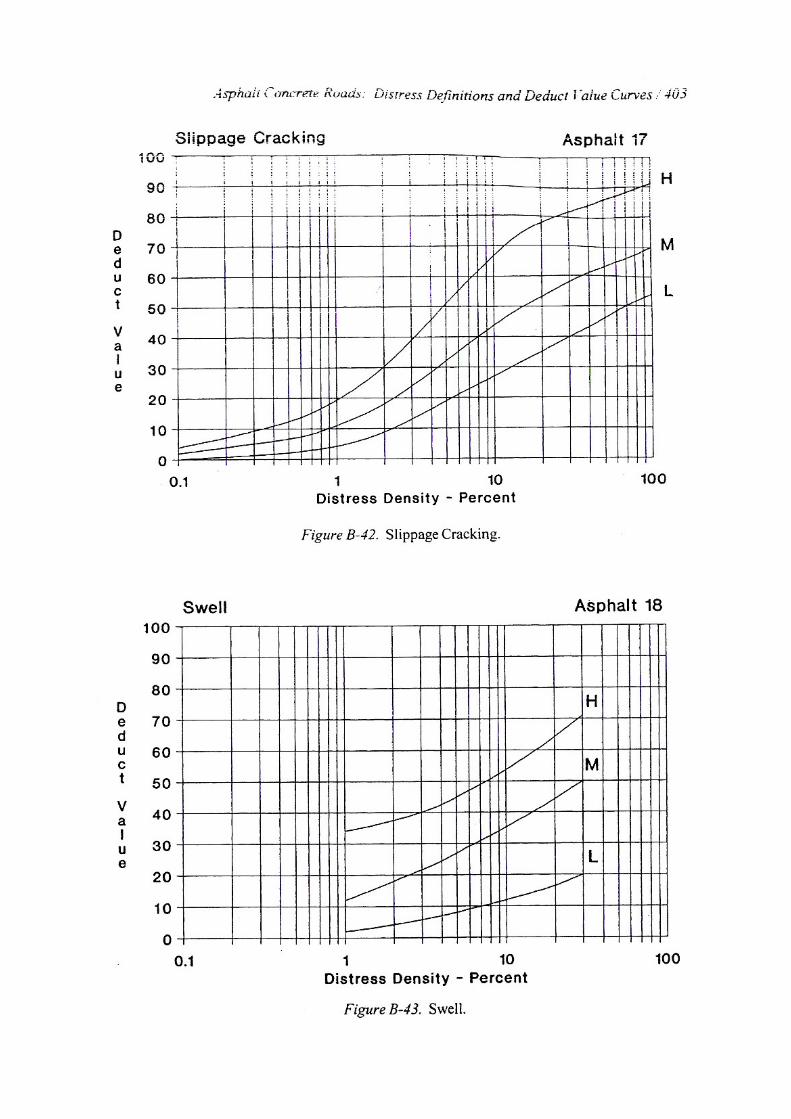
17. Slippage Cracking (m
2)
18. Swell (m2)
19. Weathering/ Ravelling (m
2)
DISTRESS SURVEY
QUANTITY TOTAL DENSITY
% DEDUCT VALUE
03 M 7.8 4.1
01 L 2.5 4.2 1.8
01 H 6.3
11 M 3.1 0.4
13 M 0.5 0.8
10 L 0.8 1.2 0.3 0.5
10 M 0.7 1.1 0.4
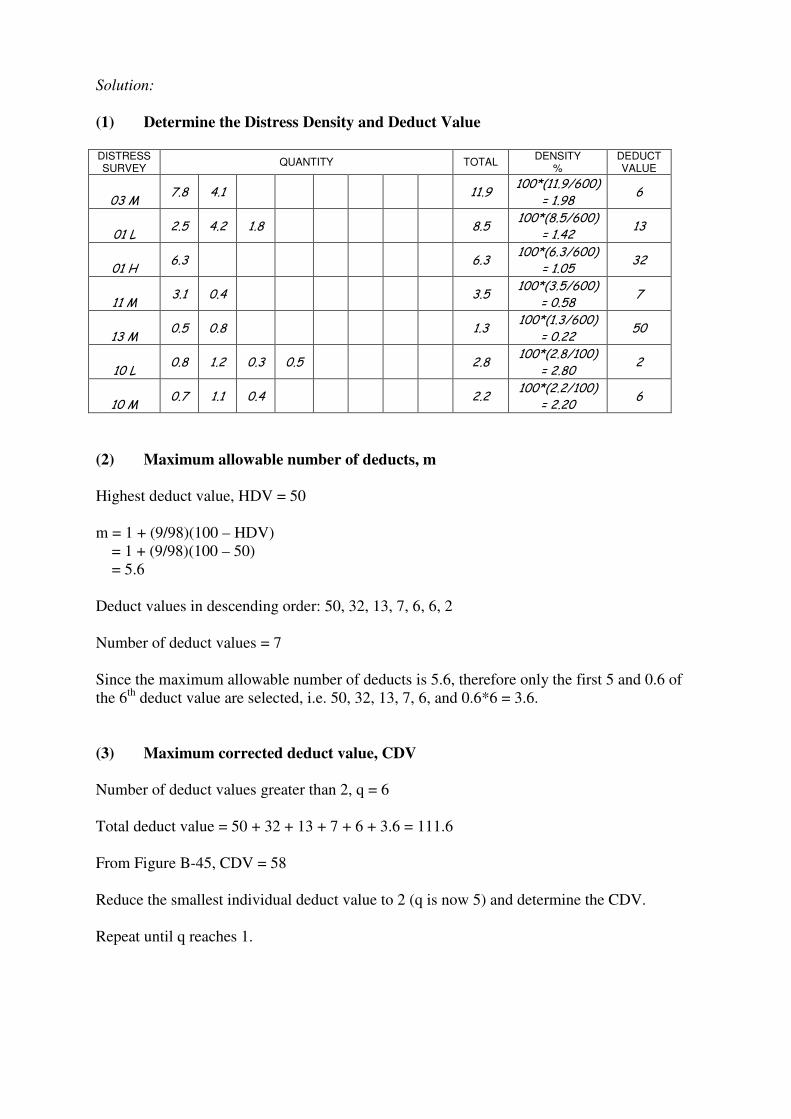
Solution:
(1) Determine the Distress Density and Deduct Value
DISTRESS SURVEY
QUANTITY TOTAL DENSITY
% DEDUCT VALUE
03 M 7.8 4.1 11.9
100*(11.9/600)
= 1.98 6
01 L 2.5 4.2 1.8 8.5
100*(8.5/600)
= 1.42 13
01 H 6.3 6.3
100*(6.3/600)
= 1.05 32
11 M 3.1 0.4 3.5
100*(3.5/600)
= 0.58 7
13 M 0.5 0.8 1.3
100*(1.3/600)
= 0.22 50
10 L 0.8 1.2 0.3 0.5 2.8
100*(2.8/100)
= 2.80 2
10 M 0.7 1.1 0.4 2.2
100*(2.2/100)
= 2.20 6
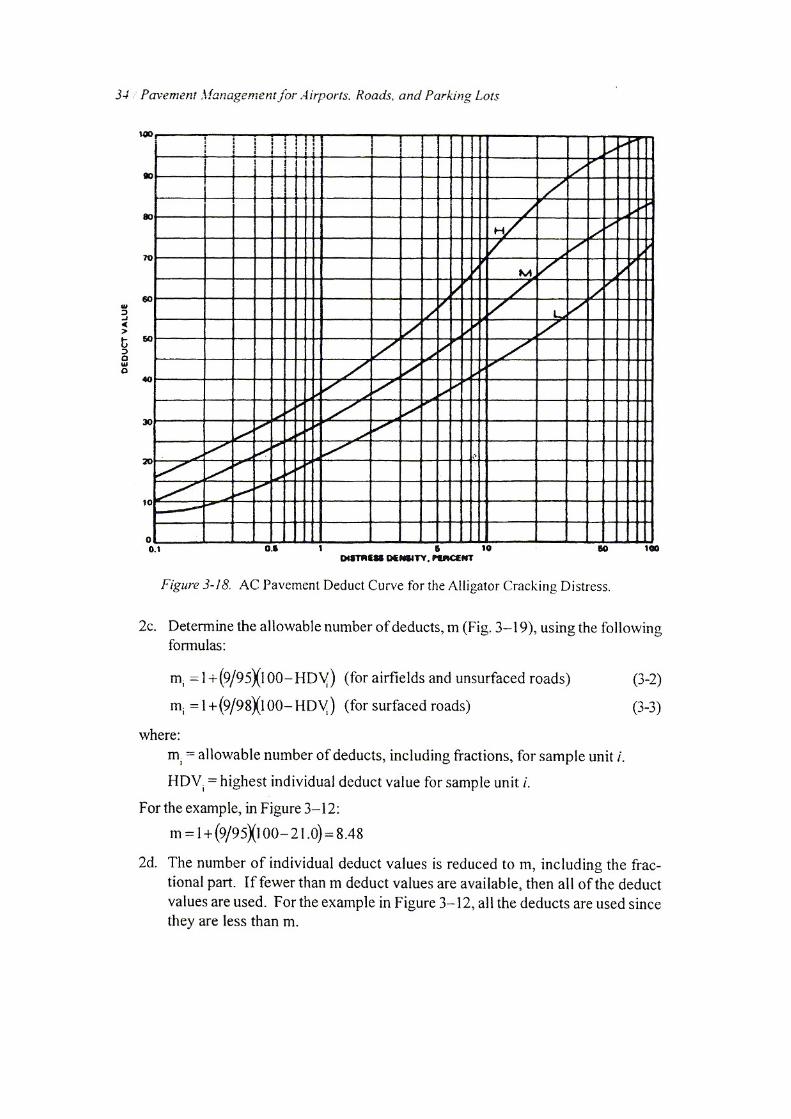
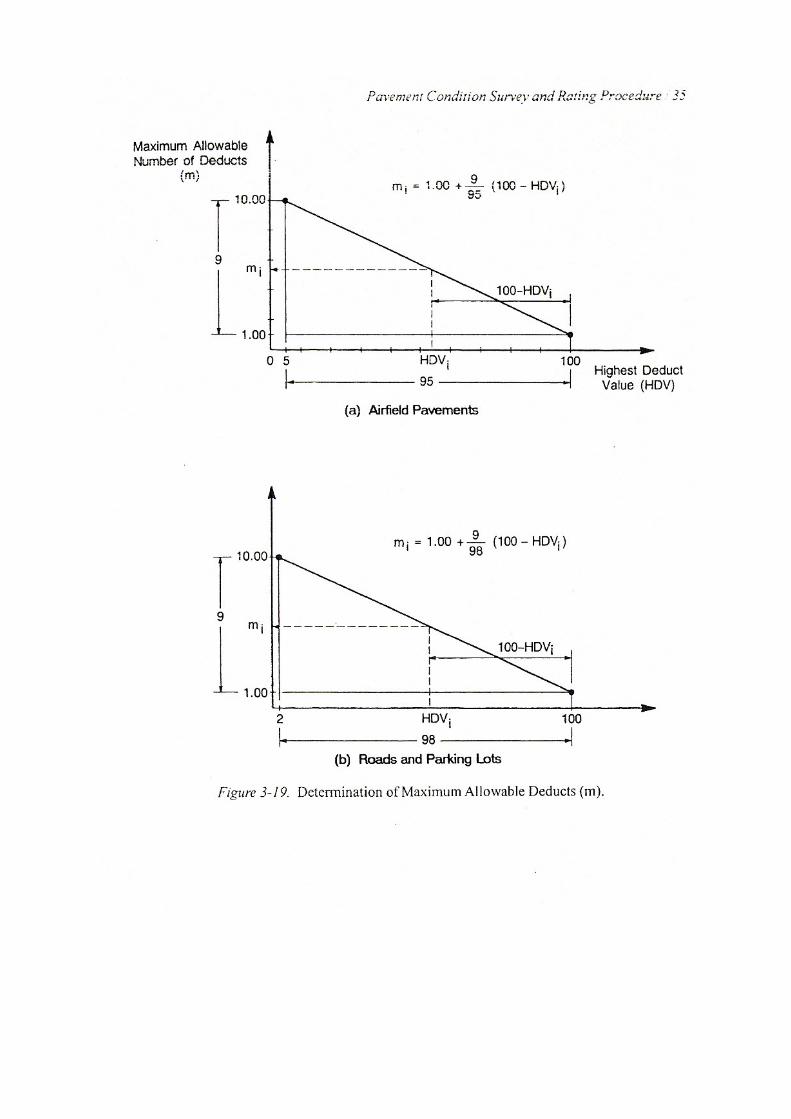
(2) Maximum allowable number of deducts, m
Highest deduct value, HDV = 50
m = 1 + (9/98)(100 – HDV)
= 1 + (9/98)(100 – 50)
= 5.6
Deduct values in descending order: 50, 32, 13, 7, 6, 6, 2
Number of deduct values = 7
Since the maximum allowable number of deducts is 5.6, therefore only the first 5 and 0.6 of
the 6th
deduct value are selected, i.e. 50, 32, 13, 7, 6, and 0.6*6 = 3.6.
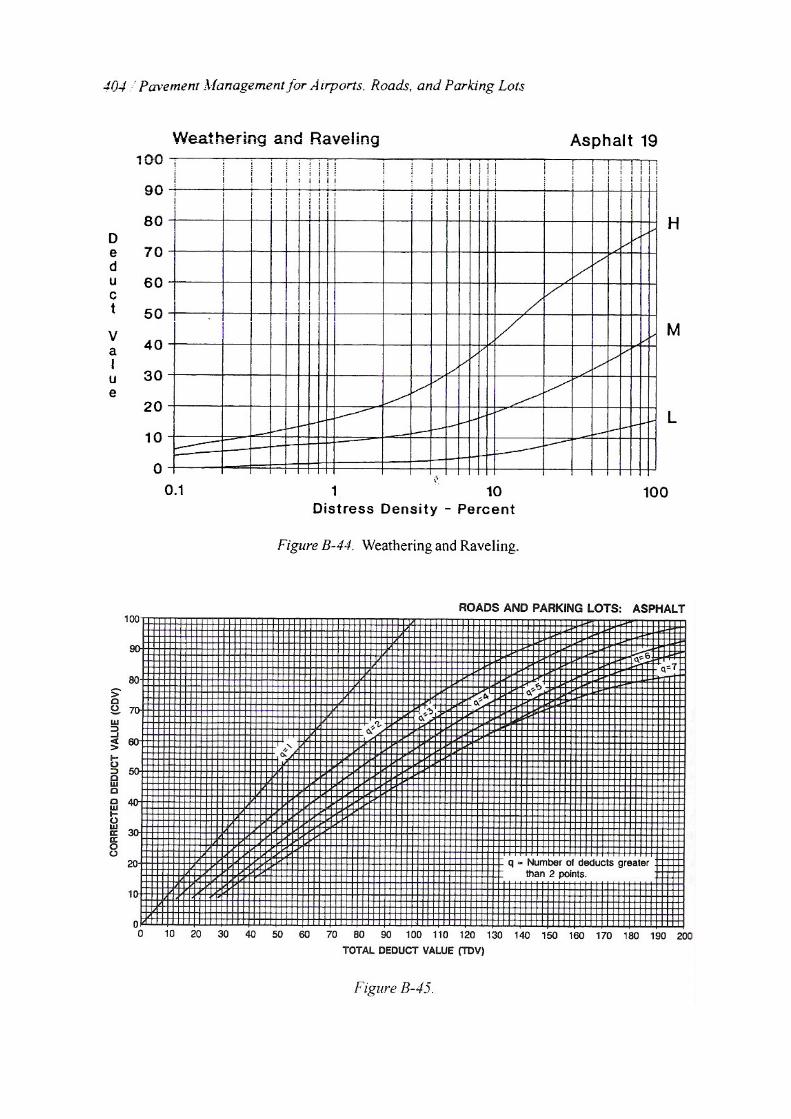
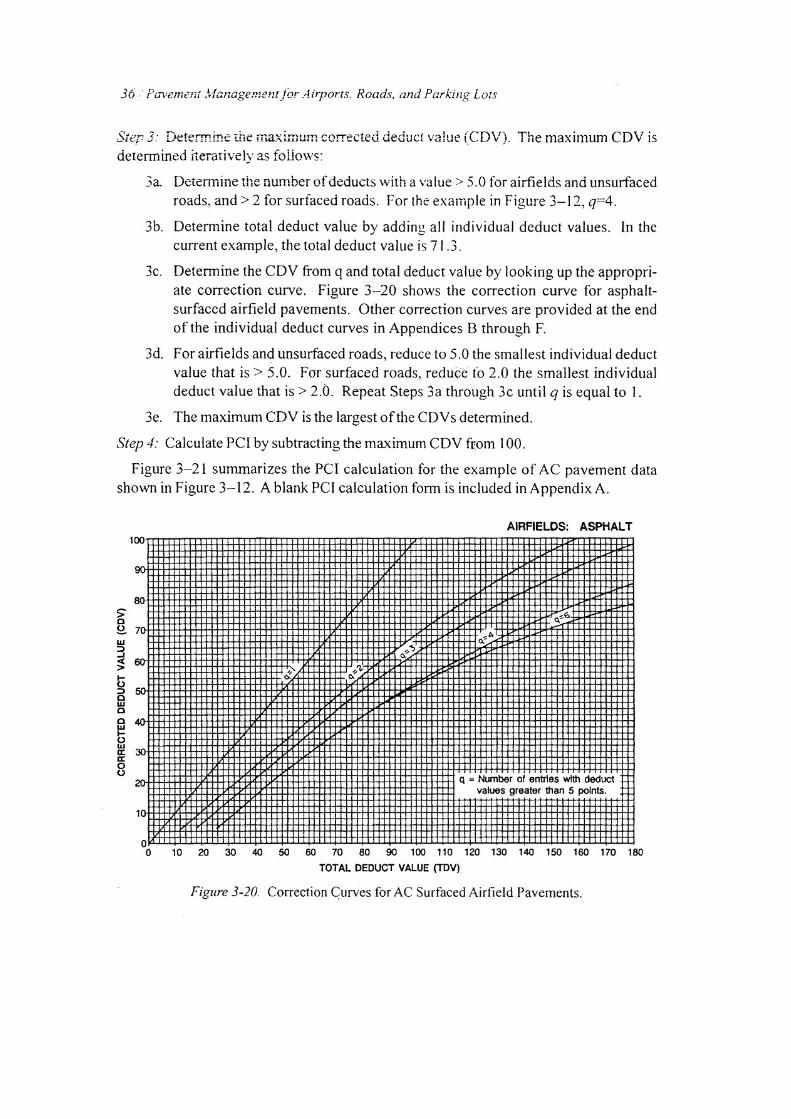
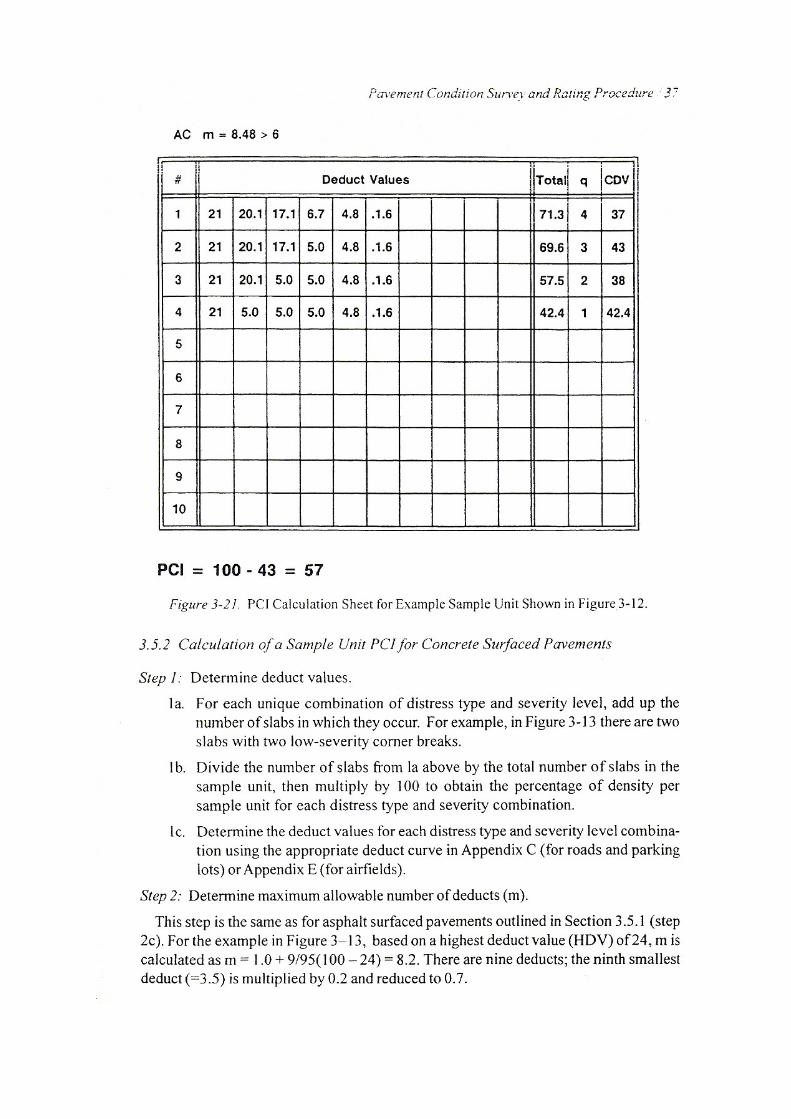
(3) Maximum corrected deduct value, CDV
Number of deduct values greater than 2, q = 6
Total deduct value = 50 + 32 + 13 + 7 + 6 + 3.6 = 111.6
From Figure B-45, CDV = 58
Reduce the smallest individual deduct value to 2 (q is now 5) and determine the CDV.
Repeat until q reaches 1.
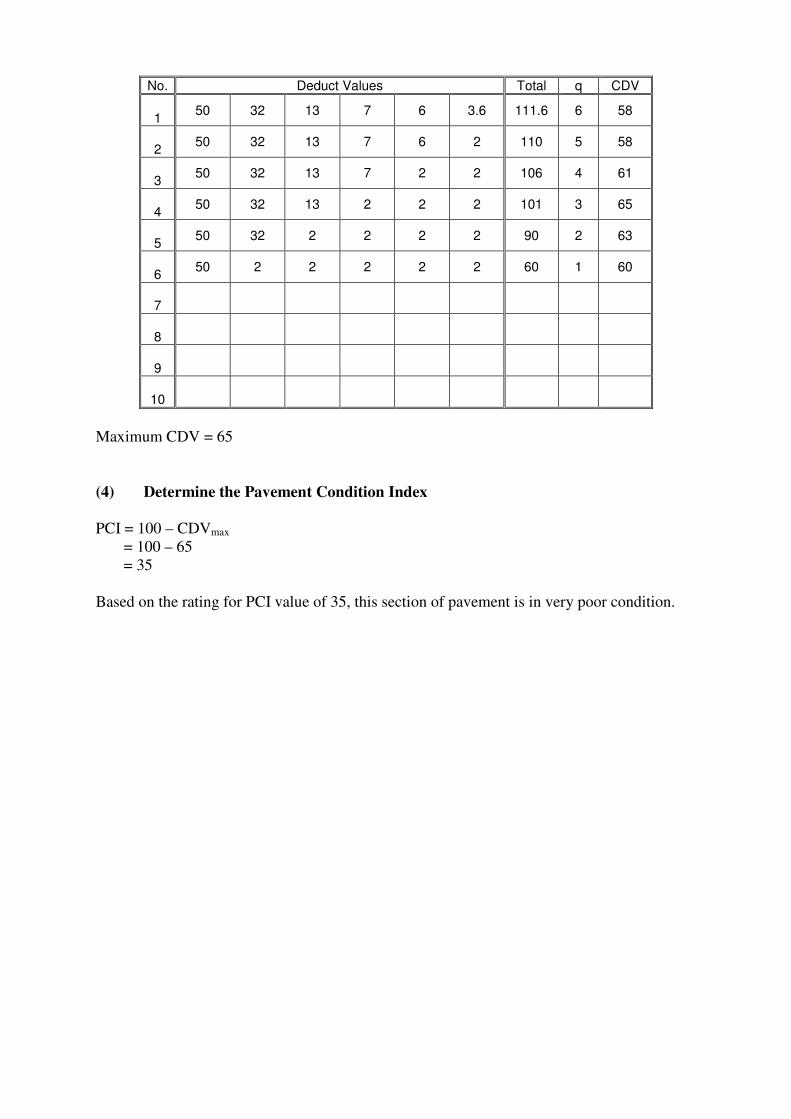
No. Deduct Values Total q CDV
1
50 32 13 7 6 3.6 111.6 6 58
2
50 32 13 7 6 2 110 5 58
3
50 32 13 7 2 2 106 4 61
4
50 32 13 2 2 2 101 3 65
5
50 32 2 2 2 2 90 2 63
6
50 2 2 2 2 2 60 1 60
7
8
9
10
Maximum CDV = 65
(4) Determine the Pavement Condition Index
PCI = 100 – CDVmax
= 100 – 65
= 35
Based on the rating for PCI value of 35, this section of pavement is in very poor condition.

APPENDIX
Asphalt Concrete Roads: Deduct Value and
Corrected Deduct Value Curves