patents, competition, and innovation – evidence from...
TRANSCRIPT
Working Paper No. 506
Patents, Competition, and Innovation – Evidence from Compulsory Licensing During WWI
by
Petra Moser Joerg Baten
Nicola Bianchi
September 2014
Stanford University John A. and Cynthia Fry Gunn Building
366 Galvez Street | Stanford, CA | 94305-6015
Electronic copy available at: http://ssrn.com/abstract=2417532
PATENTS, COMPETITION, AND INNOVATION -
EVIDENCE FROM COMPULSORY LICENSING DURING WWI*
JOERG BATEN, TÜBINGEN, CES-IFO, AND CEPR†
NICOLA BIANCHI, STANFORD‡
PETRA MOSER, STANFORD AND NBER§
SEPTEMBER 24, 2014
This paper examines whether the US decision during World War I to violate enemy-owned patents - through compulsory licensing - discouraged invention. Estimates from a new data set of German patents indicate a 28 percent increase in invention. Controls for patent quality suggest that only a small share of the increase was due to lower quality, strategic patents. Firm-level data suggest that compulsory licensing facilitated competitive entry into fields with licensing. Firms whose patents had been licensed began to patent more in research fields with licensing. The increase in patenting was strongest for fields with low levels of pre-existing competition. Keywords: Patents, innovation, competition, compulsory licensing, economic history. JEL codes: O3, O34, O38, N3.
* We wish to thank Ken Arrow, Tim Bresnahan, Dora Costa, Mark Duggan, Richard Epstein, Bob Hall, Walker Hanlon, Helen Kim, Wolfgang Keller, Steve Maurer and seminar participants at the All-UC Group in Economic History, Queens, HBS, the Hoover Institute, and UCLA for helpful comments and conversations. We are particularly grateful to Jochen Streb and Carsten Burhop for sharing copies of archival data, which allowed us to digitize the patent data. We also thank Petra Baten, Marianne Hock, Sarah Hueller, Katharina Koberski, Fred Panier, Minh Phan, Christopher Sung, and Mark Walsh for invaluable research assistance. Moser gratefully acknowledges financial support from the National Science Foundation through NSF Grant SES0921859, CAREER Grant 1151180, and CASBS. Bianchi thanks the Stanford Institute for Policy Research for financial support through the George P. Shultz Fellowship. † Joerg Baten, Department of Economics, 36 D-72074 Tübingen, Germany, [email protected]. ‡ Nicola Bianchi, Department of Economics, Stanford University, 579 Serra Mall Stanford CA 94305, [email protected]. § Corresponding author: Petra Moser, Department of Economics, Stanford University, 579 Serra Mall Stanford CA 94305, [email protected], 650-723-9303.
Electronic copy available at: http://ssrn.com/abstract=2417532
1
Whether policies that strengthen intellectual property rights encourage or discourage
innovation is a subject of intense debate. Basic models of intellectual property indicate
that policies, which weaken intellectual property, will discourage innovation by reducing
the ability of inventors to recoup costly investments in R&D (Scotchmer 2004, pp. 35-
36).1 Economic models of competition and innovation, however, predict that increasing
competition can encourage innovation (Arrow 1962a; Aghion et al. 2001, 2005),2 and
policies that limit the strength of patents, such as compulsory licensing, can increase
competition by allowing a new set of firms to produce a patented technology.
Compulsory licensing is an intellectual property policy that allows government
agencies to issue licenses for patented technology without the consent of patent owners.
Although compulsory licensing is a clear violation of intellectual property, Article 31 of
the Trade-Related Aspects of Intellectual Property Rights Agreement (TRIPS) permits it
in emergencies of public safety and health. In recent years India, Brazil, and Thailand
have invoked such emergencies to improve access to drugs to combat HIV and other life-
threatening diseases. Critics, however, caution that “pharmaceutical companies face the
risk of receiving only a drastically reduced royalty for the use of their intellectual
property, imperiling in turn their ability to develop profitably new treatments and
molecules.”3
This paper exploits the US decision in 1918 to make all patents by war enemies
available for compulsory licensing to investigate the potential effects of this policy on
innovation. Intended to “destroy Germany’s great industrial army on American soil,” the
US Trading-with-the-Enemy Act (TWEA) allowed US agencies to appropriate all
German-owned property in the United States, including all German-owned patents.4
1 An increasing amount of empirical evidence suggests that the benefits of stronger intellectual property rights can be moderate. Sakakibara and Branstetter (2001) find that an expansion in the scope of patents led to a modest increase in R&D and patenting in Japan. Nineteenth-century exhibition data, as an alternative measure (non-patent) measure of innovation, indicate that the existence of an effective patent system may influence the direction if not the level of technical change (Moser 2005). An analysis of scientific advances surrounding the human genome shows that even short-term intellectual property rights can discourage innovation (Williams 2013). 2 See Gilbert (2006) for a survey of the “seemingly endless variations in the theoretical relationship between competition and expenditures on research and developments or the outputs of research and development” (R&D), as well as earlier waves of empirical research on competition and innovation. 3 thepharmaletter, March 21, 2014. 4Alien Property Custodian 1919, p. 14. The TWEA was enacted on October 7, 1917 as 40 Stat. 411, codified at 12 U.S.C. § 95a et seq.
2
From 1919 to 1926 the US Chemical Foundation granted 693 non-exclusive compulsory
licenses of German-owned US patents “upon equal terms and a royalty basis, to any bona
fide American individual or corporation” (Haynes 1945, p. 260). Previous research on
the effects of this Act has revealed a substantial increase in innovation in the United
States, as the country that benefitted from access to German-owned patents (Moser and
Voena 2012). The welfare effects of compulsory licensing, however, critically depend on
its effects on inventors whose patents are violated.
This paper examines a new data set of German patents for chemical inventions to
investigate the effects of compulsory licensing on German inventors. Our analysis
focuses on chemicals and pharmaceuticals because these technologies are important
targets for compulsory licensing today. Moreover, patents are considered an effective
mechanism to protect intellectual property in chemicals and pharmaceuticals, which
suggests that patent data are a useful proxy for innovation. Our data cover all 79,591
granted patents for German patents across 212 subclasses in the classification system of
the German Patent Office (GPO) with application years between 1900 and 1930. To
match research fields that were affected by compulsory licensing in the United States
with research fields in Germany, we create a new concordance that matches subclasses in
the United States patent system (USPTO) with subclasses in the German patent system.
A total of 1,246 US patents by German firms became subject to compulsory licensing
under the WWI TWEA; these patents cover 101 of 212 GPO subclasses. To investigate
changes in invention at the level of individual firms, we also match patents with German
firms. 4,814 firms applied for at least one chemical patent in Germany between 1900 and
1930; 50 of these 4,814 firms owned at least one US patent that was licensed.
Baseline specifications compare changes in patents per subclass and application
year after 1918 in subclasses with and without licensed patents. This difference-in-
differences approach allows us to examine the effects of compulsory licensing,
controlling for unobservable factors, such as reparations and punitive tariffs, which may
have influenced invention. Control variables for German patents by US and other foreign
inventors proxy for other factors that may have caused patenting to vary across
technologies and over time.
3
This analysis reveals an increase in German patents after 1918 for subclasses in
which German patents were licensed to US firms. On average, German inventors applied
for 2.97 additional patents per year after 1918 in subclasses with licensing. Compared
with an average of 10.77 patents per year until 1918 for subclasses with licensing, this
implies a 28 percent increase in patenting for subclasses with licensing.
An empirical challenge for our estimation approach is that US firms may have
been more likely to license German-owned US patents in fields in which the demand
increased after 1918. Then, the observed increase in patenting may reflect selection into
research fields with licensing rather than an effect of compulsory licensing. Our data on
licensing, however, indicates that US firms were more likely to request licenses in war-
related research fields, such as dyestuffs and explosives, and these fields faced severe
problems of excess capacity after 1919 (Haber 1971, p. 251). Then OLS estimates may
underestimate the true effects of licensing. To investigate selection, we estimate intent-
to-treat and instrumental variable regressions with subclasses with confiscated patents as
an instrument for subclasses with licensing. These estimates confirm that OLS estimates
are downward biased.
Intuitively, compulsory licensing may lead to an increase in patenting by
encouraging inventors to apply for a new set of patents on the same inventions or by
encouraging them to invest in R&D. Analyses with renewal data as a control for patent
quality (Schankerman and Pakes 1986) suggest that some of the observed increase in
patenting may have been strategic; they do however also indicate that the observed
increase in patenting cannot be explained by low-quality, strategic patents. Baseline
estimates with renewed patents as an indicator for high-quality patents indicates a 17
percent increase in patenting.
To investigate the potential mechanisms by which compulsory licensing may have
encouraged innovation, we perform a firm-level analysis of changes in patenting. This
analysis reveals a significant increase in patenting after 1918 for German firms whose
patents had been licensed. Baseline estimates indicate that firms whose patents had been
licensed applied for 0.42 additional patents per subclass and year in subclasses with
licensing compared with other German firms. Relative to an average of 0.46 patents per
4
subclass and year until 1918 for firms with licensed patents, this implies a 91 percent
increase.
Firm-level analyses also indicate a substantial increase in the number of firms that
were active patentees in research fields with licensing, which suggests that compulsory
licensing increased the threat of entry. A comparison of changes in patenting for
subclasses with low and high levels of pre-existing competition indicates that the increase
in innovation was strongest for fields with low pre-existing levels of competition. These
results suggest that compulsory licensing can promote innovation by increasing
competition in research fields that are relatively more concentrated.
I. THEORETICAL PREDICTIONS
This section discusses the theoretical predictions that motivate the empirical
analysis in this paper. These predictions are derived primarily from theoretical models of
the effects of competition on innovation. By allowing a new set of firms to produce a
patented invention, compulsory licensing increases entry (or the threat of entry), which
increases competition. Whether or not competition encourages innovation is theoretically
ambiguous.
A. More Competition Can Discourage Innovation
Theories that predict a negative link between competition and innovation can be
traced back to Schumpeter (1934 and 1942), who argues that large firms and a relatively
concentrated market structure can promote innovation by improving the ability of
innovators to capture the returns from R&D. Goettler and Gordon (2011) confirm these
predictions with estimates of a dynamic oligopoly model for the durable goods
microprocessor industry; their estimates imply that the rate of innovation in product
quality would be 4.2 percent higher if IBM was a monopolist.
In the context of intellectual property, Schumpeter’s hypothesis implies that
patents can encourage innovation by granting temporary monopoly rights to inventors,
which enable them to recover costly investments in R&D (Scotchmer 2004, pp. 36-39).
This suggests that compulsory licensing can discourage innovation by weakening the
5
effectiveness of intellectual property and by reducing inventors’ ability to recover
investments in R&D.
B. More Competition Can Encourage Innovation
There are, however, many circumstances for which economic theory predicts a
positive link between competition and innovation. Arrow (1962a), for example, shows
that, if patents create exclusive monopoly rights to inventions, incentives to innovate are
smaller for a monopolist who faces no (actual or potential) competition, compared with a
competitive firm. For the monopolist, the stream of rents from an innovation replaces an
existing stream of rents. For a competitive firm, there are no existing streams of rents, so
that incentives to innovate are higher for the competitive firm than for the monopolist.5
Consistent with these predictions, Acs and Audretsch (1988) have documented a
positive correlation between industries with lower levels of concentration and innovation,
using data on 8,074 US manufacturing innovations listed in 1982 trade journals. Nickell
(1996) presents evidence 670 UK manufacturing firms between 1972 and 1986, which
suggests that competition (measured by the number of competitors or by lower levels of
rents) is associated with significantly higher rates of total factor productivity growth.
Blundell et al.’s (1999) analysis of 340 manufacturing firms listed on the London Stock
Exchange between 1972 and 1982 indicates that industries with lower levels of
concentration produced more "technologically significant and commercially important"
innovations.
An extension of models of cumulative invention (Scotchmer 1991) to compulsory
licensing also suggests that compulsory licensing can encourage innovation. By reducing
the strength of intellectual property rights of an early generation of inventors, compulsory
licensing can increase the expected returns from follow-on (cumulative) innovation.
Compulsory licensing may also encourage innovation by creating new opportunities for
learning-by-doing (Arrow 1962b), as a new set of firms is allowed to produce a patented
invention. Consistent with this hypothesis, Moser and Voena (2012, pp. 421-23) 5 A patent race model, in which the firm that invests most in R&D wins the race with certainty, implies that a monopolist can have stronger incentives to invest in R&D because the monopolist is motivated to preempt competitive entry (Gilbert and Newberry 1982). Reinganum (1983), however, shows that Arrow’s “replacement effect” prevails if the innovation is drastic and invention follows a (uncertain) discovery process that is exponentially distributed.
6
document a differential increase in US patents by the US chemical firm DuPont for fields
in which DuPont licensed German patents under the TWEA.
C. Differential Effects at Low and High Levels of Competition
Aghion et al. (2001 and 2005) reconcile predictions about the effects of
competition on innovation to predict an inverted U-shaped relationship between
competition and innovation.6 At low levels of competition, a shift towards competition
can encourage innovation by encouraging incumbents to invest in R&D to “escape”
competition. At high pre-existing levels of competition an additional increase in (“neck-
and-neck”) competition discourages innovation by further reducing post-innovation rents.
These predictions are confirmed in a data set of UK patents issued to 311 firms between
1973 and 1994. Patenting increases in response to shifts towards competition at low
levels of competition, but declines when pre-existing levels of competition are high
(Aghion et al. 2005).
In the context of intellectual property rights, predictions of an inverted U imply
that compulsory licensing can promote innovation in concentrated industries, and
discourage innovation in industries that are already fairly competitive.
II. DATA
To investigate whether compulsory licensing encouraged or discouraged
invention, we have constructed a new data set on 79,591 German patents for chemical
processes and products.7 Our data start with patent applications in 1900, the first year in
which the GPO systematically assigned all patents to technology fields (GPO
subclasses).8 We collect patent applications until 1930; all of these applications had been
issued by 1932, the last year before the Nazi government introduced discriminatory labor
6 Schmidt (1997) predicts an inverted U by incorporating bankruptcy: Competition increases the risk of bankruptcy, which encourages managers to innovate to preserve their jobs, but also reduces returns from cost-saving innovations by reducing demand for each firm. At high levels of competition, the latter effect dominates so that investments in R&D peak at an intermediate level of competition. 7 An 1891 reform of the German patent system had introduced product patents for chemicals; until then Germany had only granted patents for chemical processes (Haber 1971, p. 218). 8 Until 1900, patents were assigned to 89 numerical (main) classes; in 1900 the German Patent Office expanded this classification to create 513 alphanumeric subclasses.
7
laws and began to dismiss Jewish scientists.9 Our data expand on aggregate-level data on
German patents (for example, Richter and Streb 2011) by including the identity of all
inventors, their countries of residence, firm-level identifiers, and information on renewal
payments for all patents. The data cover 212 GPO subclasses, including 101 subclasses
in which at least one German-owned patent was licensed under the TWEA.10
A. Confiscated and Licensed US Patents
US authorities confiscated a total of 4,706 German-owned US patents under the
TWEA; 1,246 of these patents were licensed to US firms. On December 12, 1918, US
authorities auctioned off 551 US patents by the German Bayer AG to the US Sterling
Company (Alien Property Custodian 1919, p. 440-53). Sterling sold Bayer’s dye
business to Grasselli Chemical and used Bayer’s dye patents to produce pharmaceuticals
through its division, Winthrop Chemical.11 Beginning in 1919, the US Chemical
Foundation licensed another 695 German-owned US patents to US firms. These licenses
were issued “with low royalty payments, to facilitate broad-based access to German-
owned patents ” (Haynes 1945, p. 260). Licenses through the Chemical Foundation were
non-exclusive; the average German-owned US patent was licensed to 2.5 firms, but the
median patent was licensed to a single firm.12 The exact timing of the licenses is
unknown; Steen (2001), however, observes that most licenses were issued between 1919
and 1922.
Among 1,246 licensed patents listed in Haynes (1945) and the report of the Alien
Property Custodian (1919), 1,017 patents include the name of the German firm who
9 The April 7, 1933 Law for the Restoration of Public Service dismissed all professors with a Jewish grandparent from public service. Analyses of US patents indicate that German-Jewish émigrés created substantial benefits for US invention (Moser, Voena, and Waldinger, forthcoming). 10 Based on the classification of patents in the Systematische Übersicht der vom 1. Januar bis 31. Dezember 1912 in die Patentrolle eingetragenen Patente (1912). 11 Alien Property Custodian 1919, p. 439 and Appendix 6 schedule 2; Hounshell and Smith 1988, p. 92. Critics of the auction argued that the Custodian had destroyed the German dye cartel merely “to build an American dye trust,” and demanded the creation of an independent organization to distribute patents more broadly (Haynes 1945); this criticism led to the creation of the Chemical Foundation. 12 Haynes reports the identity of the US licensees for 587 of 695 patents licensed by the US Chemical Foundation. Two patents by Krupp’s metallurgist Benno Strauss (1873-1844) for stainless steel (1,316,817, “Articles which require high resistance against corrosion” and 1,339,378 “Objects having great strength and great resistance against the action of acids”) were each licensed to 91 US firms. Both patents are in the USPTO subclass class 420/34 and German patent class 40b “alloys.” Patent data (below) indicate that German patents for alloys nearly tripled after 1918 (from 4.95 patents per year to 16.92).
8
owned the licensed patent. Another 229 licensed patents list the US Chemical
Foundation as an assignee. The remaining 208 patents belong to individual inventors.
Fifty-three are patents by co-inventors of a German firm. For example, Dr. Richard Herz
from Frankfurt is listed as an inventor for US patents 956348, 960919, and 966092 of the
German firm Cassella, and we assign one remaining US patent by Dr. Herz (US patent
1243171) to the same firm.
B. German Patents 1900 and 1930
To examine changes in invention, we collected information on all patents issued
in Germany between 1900 and 1932 across 212 subclasses of chemical inventions. To
digitize these data, we first trained a group of typists to read German Fraktur with 99
percent accuracy, at less than one misspelled letter per page. They then collected the
complete records of patent issues for chemicals from the Annual Reports of the German
Patent Office (Kaiserliches Patentamt, 1900-1932). We then checked all entries to
correct typographical errors in the description of inventions, inventors’ names and cities.
By this process we were able to collect information on 79,591 German patents issued for
chemical processes and products between 1900 and 1932. These patents have application
years between 1900 and 1930.
C. Matching Technologies Across the US and German Patent System
To identify research fields in which German inventors were affected by
compulsory licensing, we created a new concordance between subclasses in the US and
German system. First, we used an existing USPTO concordance to match all 7,699
USPTO subclasses classes with 7,010 subclasses in the International Patent Classification
(IPC).13 We then match IPC subclasses with all 513 subclasses in German patent system,
using a corresponding classification by the German Patent Office (Appendix Table A1
and Figure A1). The USPTO, however, cautions that its USPTO-IPC concordance
“should be treated merely as suggestive of classification places in the two systems that
13 USPTO Office of Classification Support, Reference Tools Project. Available at http://www.uspto.gov/web/patents/classification/international/ipc/ipc8/ipc_concordance/ipcsel.htm.

9
may be similar,” and warns that not all US and German subclasses can be matched with
an IPC subclass.
To improve on the USPTO-IPC-GPO concordance, we exploit a reporting
requirement as a result of the 1883 Paris Convention to identify US and German patents
that were granted for the same invention. The Paris Convention’s Right of Priority
allows inventors to apply for patents in other member countries within 12 months of the
original application.14 Germany ratified the Paris Convention in 1903, allowing inventors
to apply for patents in Germany within 12 months of an application for the same
invention in the United States. We exploit this rule to augment the USPTO-IPC-GPO
concordance with information on subclasses that cover the same invention in the US and
German system. Specifically, we search for references to US patent applications among
the 71,770 German patents with application years after 1903.15 This search yields 1,343
pairs of German and US patents for the same invention, which we use to identify
subclasses that cover the same invention in the US and in the German patent systems.
With this additional information, we are able to match 3,533 licensed US patents with
167 subclasses in the GPO’s classification system (Appendix Table A1).16
Among 212 GPO subclasses, 167 subclasses include at least one confiscated
patents. Among these subclasses, 101 subclasses include at least one licensed patent. The
average subclass includes 8.59 licensed and 19.51 confiscated patents (Appendix Table
A2). The average GPO subclasses with at least one licensed patent includes 18 licensed
and 57.56 confiscated patents (with a standard deviation of 53.65 and 64.33,
respectively). Four subclasses include more than 100 licensed patents: 22a azo dyes (436
licensed patents), 12o hydrocarbons (242), 12i metalloids (146), 12q aminophenol (110),
and 12k ammonia (108).
14 International Convention for the Protection of Industrial Property 1883, Articles 4A and 4B. TRIPS requires all WTO members to comply with Article 4 of the Paris Convention. 15 We first performed an automated search to match German with US patents (http://patft.uspto.gov/, accessed October 2012), using the title of the invention, the name of the inventor, and the application date. We hand-checked a random 10 percent sample of 46 patents; in this sample, 45 patents can be uniquely matched. 23 of 1,343 German patents with US application dates are for chemicals; 505 are by US nationals, 69 are by Germans, and 49 by nationals from 8 other countries. 16 Using both information on primary and secondary (cross-references) subclasses of licensed German-owned US patents. Each US patent is assigned to one single primary subclass and may be assigned to one or more additional cross-reference subclasses, which patent examiners use to identify related technology fields. See Lampe and Moser (2014) for a detailed discussion.
10
D. Inventors’ Countries of Residence
To separate patents by German and foreign inventors, we extract text strings with
information on inventors’ city of origin from each patent and use city data to assign
inventors to countries of origin. Among a total of 79,591 German patents, 58,691 are by
German inventors; 20,900 patents by foreign inventors, include 4,133 patents by
inventors from the United States, 3,162 from Great Britain, 3,041 from France, 2,984
from Switzerland, and 1,458 from Austria.17
We use data on German patents by US inventors to test whether US inventors
began to patent more in subclasses with licensing. OLS estimates in Moser and Voena
(2012) imply a 20 percent increase in US patenting by domestic US firms in subclasses,
in which at least one German-owned patent was licensed (Moser and Voena 2012, pp.
404-5). Our data on German patents confirm that US inventors began to patent
substantially more in subclasses with licensing after 1918 (Figure 2). Between 1900 and
1918, US firms applied for 0.67 German patents per subclass and year in subclasses with
licensing, compared with 0.56 patents in other subclasses of chemical inventions. After
1918, US firms applied for 0.91 additional German patents per year in subclasses with
licensing compared with 0.37 German patents in other subclasses.
E. Renewed Patents to Proxy High-Value Patents
Griliches (1990, p. 1669) observed that patents “differ greatly in ‘quality,’ in the
magnitude of inventive output associated with them.” To measure such variation,
Schankerman and Pakes (1986) propose to use inventors’ decisions to pay substantial
renewal fees as a measure for the private value of a patent. Harhoff et al. (1999)
document a positive correlation between inventors’ reported valuation of patents and the
number of years for which inventors renewed their patents. Lanjouw et al. (1998),
17 A small number of Austrian-owned US patents, 32 patents, were subject to compulsory licensing under the TWEA. To estimate the effects of compulsory licensing as conservatively as possible, we exclude these patents from the treatment variable, and assign German patents by Austrian inventors to the control variable patents by other foreign inventors.
11
however, caution that researchers cannot observe the true valuation of patents that are
renewed for the full term, if renewal fees are low.18
In Germany, renewal fees were high, and renewals became more and more costly
as the patent aged (Appendix Figure A2), so that renewal decisions were economically
meaningful. In the first two years, renewal fees were 50ℳ per year; this is equivalent to
$243 in 2012 using purchasing power (as the most conservative conversion) and $1,340
using income value (which yields the largest estimate, Williamson 2014).19 After the
second year, renewal fees increased by 50ℳ each year, reaching 700ℳ in the 15th year,
which was the end of the statutory term. Patents that were renewed for 5 years or more
required inventors to pay a minimum of 550ℳ"in renewal fees, between $2,670 and
$14,700 in 2012. By comparison, US renewal fees were only $1,600 in 2012 and 2014,
due 3.5 years after the issue date.20
To construct renewal data, we followed all 79,591 GPO patents for chemicals
through renewal records in the Annual Reports of the German Patent Office between
1901 and 1942. Half of all patents - 39,682 (49.86 percent) - were renewed for 5 years or
more; we use these patents as a proxy for high-value patents.21 More generally, 14,605
patents were not renewed in the first year (18.35 percent), 18,319 (23.02 percent) were
renewed for 10 years or more, and 6,089 (7.65 percent) were renewed for the full 15-year
term (Appendix Figure A3).
F. Matching Patents with Firms
18 Patent citations, as an alternative measure of patent quality, are not available for German patents because references to prior art were not recorded on the patent document. Trajtenberg (1990) shows that counts of citation are correlated with the social value of patented invention proxied by the estimated social surplus of 456 improvements in CT scanners. Moser, Ohmstedt and Rhode (2014) find that patents are also correlated with objective measures for the size of patented inventions, which they collect from field trial data for genetically-modified hybrid corn. 19 In 1915, 50ℳ were equal to $10.31 (Bidwell, 1970). 20 http://www.uspto.gov/web/offices/ac/qs/ope/fee010114.htm; accessed March 2, 2014. 21 Another benefit of using the median value of five years as a cut-off is that our quality measure is unlikely to be affected by a September 19, 1914 decision of Germany’s Federal Council (Bundesrat) to suspend renewal fees; this suspension lasted nine months. In 1918, the German Patent Office announced that patentees, who wanted to keep their patents had to pay fees for the last four years (Blatt 1918, p. 98). As a result, any patent that was renewed for five years or more has been subject to the full fees. In the main analysis we address the issue of this suspension, and other war-related disruptions through robustness checks that exclude the war years (1914-1919) from the sample.
12
To investigate firm-level changes in patenting, we match patents by German
inventors with the names of German firms; this process matches 30,499 GPO patents
with application years between 1900 and 1930 to 4,814 unique firms. To construct these
data, we search the inventor field for all 75,591 German patents for 358 German words to
denote firms, such as Firma, Gesellschaft, Gesellschaft mit beschraenkter Haftung or
Aktiengesellschaft, as well abbreviations (GmbH and Akt.Ges) and alternative spellings
(G.m.b.H. or Actiengesellschaft). For 30,499 patents that list a firm as an inventor, we
combine alternative spellings of the firm’s name to create 4,814 unique firm-level
identifiers. For example, we connect different abbreviations for Aktien Gesellschaft für
Anilin Fabrikation and Akt. Ges. für Anilin Fabrikation, to create the unique firm-level
identifier agfa. In another example, we combine alternative spellings of Griesheim
Elektron and Griesheim Electron into griesheim-elektron. A total of 28,192 GPO patents
cannot be linked to a firm; most of these patents belong to individuals, such as Dr. N.
Sulzberger, Berlin who patented a new “process for preparing azo-dyestuff” (Patent No.
193,451).
Fifty of 4,814 German firms who were active patentees in chemistry owned at
least one US patent that was licensed under the TWEA. The Bayer AG owned 551 US
patents that were licensed, the German Badische Anilin und Soda Fabrik (BASF) 308,
Meister Lucius 104, Griesheim-Elektron 57, AGFA 38, Cassella 22, and Berlin-
Anhaltische Maschinenbau A.G. (BAMAG) 17. Another 43 firms saw between 1 and 12
of their US patents licensed under the TWEA. 12,531 patents by these 50 German firms
cover 123 subclasses in the German patent system, and 17,968 patents by 4,764 firms
without licensed patents cover 202 subclasses.22
G. Firm Size
Data on firm size, which we draw from a registry of publicly traded joint stock
companies (Handbuch der Deutschen Aktiengesellschaften 1911 and 1912) indicate that
firms with licensed patents were large compared with other German firms. A total of
4,814 firms applied for at least one chemical patent in Germany between 1900 and 1930;
22 Another 28,192 patents by individual inventors cover 208 subclasses. Although individual inventors were less likely to patent in the United States than German firms, some individual inventors may have been affected by compulsory licensing. Analyses at the firm level exclude these data.
13
175 of them (3.6 percent) are listed in the registries of Aktiengesellschaften (AGs).
Thirty of 50 firms with licensed patents were AGs, compared with 145 of 4,764 other
firms (Appendix Table A3). On average, 30 AGs with licensed patents had a nominal
capital stock of $108,343, compared with $40,755 for 145 other AGs in our sample (from
Handbuch 1911 and 1912, in year 2012 dollars).23 Data on employees are available for
13 AGs with licensed patents and 50 other AGs. On average, AGs with licensed patents
had 6,197 employees in 1911 and 1912 (with a median of 1,060, and a standard error of
4,867), compared with 2,466 employees for other 50 German AGs (with a median of 881,
and a standard error of 963).
In terms of firm age, firms with and without licensed patents are roughly
comparable: The average AG with licensed patents had been incorporated as a joint-stock
company in 1893 (with a standard error of 2.6 years). By comparison, the average AG
without licensed patents had been incorporated as a joint-stock company in 1892 (with a
standard error of 1.3 years).
We also construct an indicator variable for six firms that formed a cartel-like
“community of interest” in the Interessengemeinschaft (IG) Farben on December 25,
1924: AGFA, Bayer, BASF, Hoechst, Griesheim-Elektron, and Chemische Fabrik
(vorm. Weiler Ter Meer). The creation of IG Farben left the internal structure of these
firms intact, but reduced competition among the participating firms. Haber (1971, pp.
290-91) explains “In the latter half of the 1920s, the German chemical industry employed
nearly 0.3 million people, and on this reckoning IG Farben accounted for over a third.”24
Theses changes may in turn have led to unobservable changes in the organization of
production that influenced patenting.25 After 1924, most patents by the six member firms
23 Firms with and without licensed US patents report comparable valuations of patents on their balance sheets. Haber (1971, p. 254), however, warns “…when we look at the finance of chemical companies just before and just after the war, we have a woefully small sample, the information is inadequate and the conclusions must necessarily be tentative.” Fourteen of 30 firms with licensed patents reported patents among the assets on their balance sheets; four (13.3 percent) of them listed a positive value; eight (26.7 percent) reported a symbolic 1 Mark for devalued patented assets. By comparison, 63 of 145 firms without licensed patents reported patents among their assets; 19 (13.1 percent) of them listed a positive value, 43 (29.7 percent) listed a symbolic value of 1 Mark. 24 Also see Aftalion (2001, p. 138): “The new giant had a workforce of 67,000 people including 1,000 chemists, and accounted for one third of Germany's chemical industry sales” 25 For example, Haber (1971, p. 285-86) reports that, after the creation of IG Farben, “the Leverkusen works of Bayer increased their make of dyes by over a quarter, …Hoechst was assigned responsibility for all chemicals from acetylene, and in this connexion (sic) took over the Griesheim patents and technique for
14
were assigned directly to IG Farben. As an approximation, we assign patents by IG
Farben to the original six firms according to the pre-existing distribution of patents
between 1910 and 1914 across firms and technology fields (Appendix Table A7). This
approach allows us to include IG Farben’s in the firm-level analysis but it assumes that
the distribution of patenting remained stable after the 1924. As an alternative approach,
robustness checks exclude patents with application years after 1924.
III. RESULTS
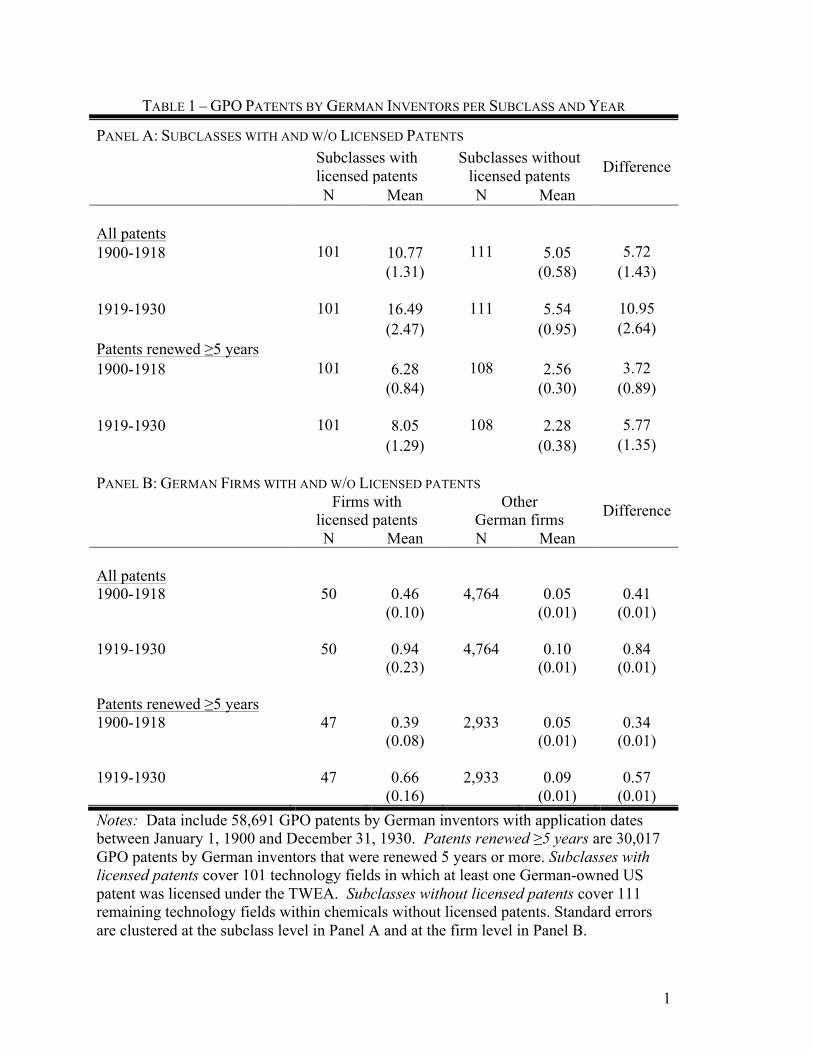
Comparisons of means indicate that German inventors began to patent more in
subclasses with licensing after German patents had been licensed to US firms. In 101
subclasses with licensing, counts of German patents by German inventors increased by
53 percent from 10.77 per application year until 1918 to 16.49 afterwards (Table 1, Panel
A). By comparison, in 111 subclasses without licensing, patents increased by less than
10 percent from 5.05 per year until 1918 to 5.54 afterwards.
Although subclasses with licensing produced more patents per year, changes in
patenting followed a comparable trend in subclasses with and without licensing until
1918 (Figure 1, Panel A). After 1919, German inventors began to produce more patents
in subclasses with licensing, while patents in subclasses without licensing stayed
relatively flat. To investigate these changes more systematically, we estimate:
(1) patentsct = β0 + β1 • subclass with licensed patentsc • postt + β2 • patents by US inventorsct + β3 • patents by other foreignct + δt + θc +εct
where the dependent variable patentsct measures the number of German patents in
subclass c and application year t between 1900 and 1930. The variable subclass with
licensed patents equals 1 for subclasses in which at least one German-owned patent was
licensed under the US TWEA. The variable postt indicates years after 1918. Under the
assumption that – in the absence of compulsory licensing under the US TWEA - changes
in patenting in subclasses with licensing would have been comparable to changes in
patenting in subclasses without licensing, the coefficient β1 measures the effect of
compulsory licensing on German invention. polyvinyl acetate manufacture… Bayer became the concern’s principal manufacturer of the azo-group of dyes…Badische became the specialist in high –pressure synthesis in all its aspects.”
15
Three variables control for idiosyncratic variation in research activity and
patenting (“hotness”) across research fields and over time. The variable patents by US
inventorsct and patents by other foreign inventorsct count patents in Germany by US and
other foreign inventors, respectively, in subclass c and year t. Subclass fixed effects θc
control for variation in patenting across research fields that is constant over time. Year
fixed effects δt control for variation in patenting over time that affects all research fields.
Standard errors are clustered at the level of subclasses.
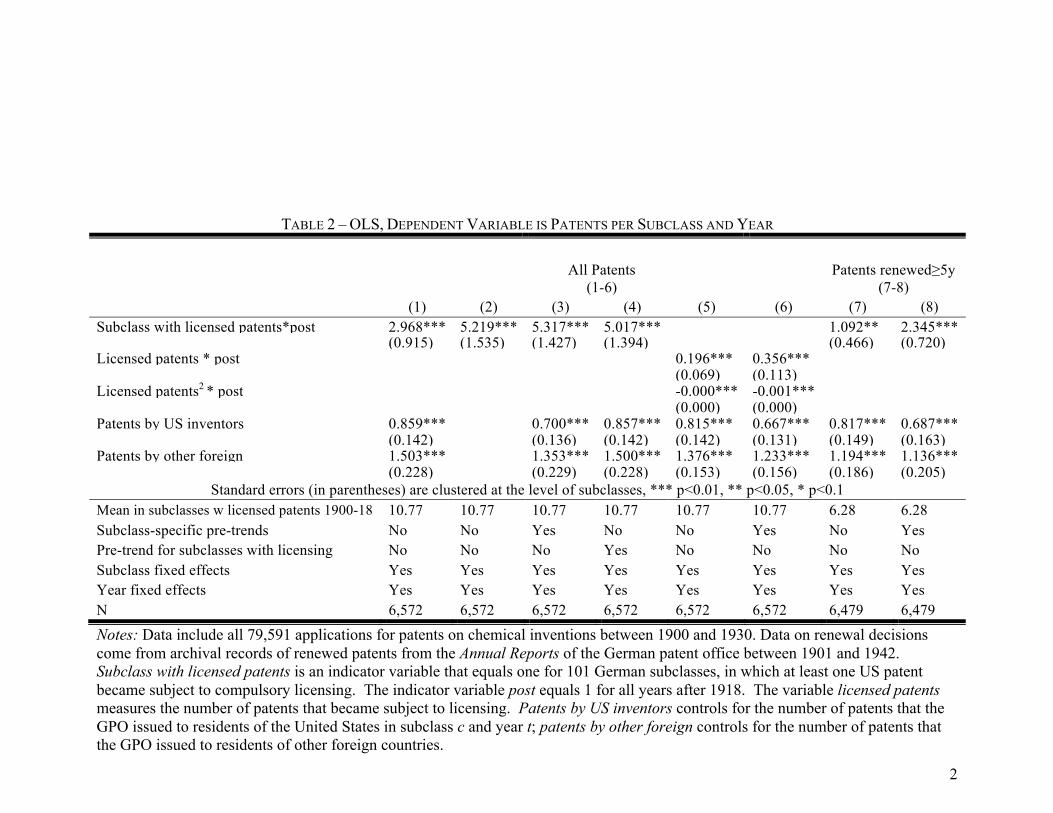
OLS estimates indicate that German inventors applied for 2.97 additional patents
per year after 1918 in subclasses with licensing (Table 2, column 1, p-value 0.001).
Compared with an average of 10.77 patents per year until 1918 for subclasses with
licensing, this implies a 28 percent increase. Excluding controls for GPO patents by
foreign inventors increases the coefficient to 5.22 additional patents (Table 2, column 2,
p-value 0.001).
Comparisons across subclasses with small and large numbers of licensed patents
indicate a differential increase in patenting for subclasses with 10 or more licensed
patents (Figure 1, Panel B). Until 1918, changes in patenting were similar in subclasses
with small and large numbers of licensed patents. After 1918, patenting accelerated
disproportionately in subclasses with 10 or more licensed patents. In 1928, inventors
applied for an average of 38.4 patents per year in subclasses with 10 or more licenses,
compared with 17.41 in subclasses with 3 to 10 licenses, 11.92 in subclasses with 2
licenses and 6.17 patents in subclasses with fewer than 2 licenses. Specifications with a
count variable for the number of licensed patentsc indicate that – for each additional
patent that was licensed in subclass c - German inventors applied for 0.20 additional
patents per year after 1918 (Table 2, column 5, p-value 0.005). This implies a 33.5
percent increase for the average subclass with at least one licensed patent, which includes
18.04 licensed patents.
A. Controlling for Differential Pre-Trends
We also estimate the effect of compulsory licensing, allowing for subclass-
specific linear pre-trends in patenting
(2) patentsct = β0 + β1 • subclass with licensed patentsc • postt
16
+ β2 • patents by US inventorsct + β3 • patents by other foreignct + Σc ϕc • subclassc • preTWEAt • t + δt + θc +εct
where subclassc is a vector that distinguishes the 212 GPO subclasses of chemical
inventions, the indicator variable preTWEAt equals 1 for years before 1919, and the
variable t denotes a linear time trend. Estimates with subclass-specific pre-trends
indicate that German inventors applied for 5.32 additional patents per year after 1918 in
subclasses with licensing (Table 2, column 3, p-value <0.001), which implies a 49
percent increase.26
Alternative specifications control for a separate linear pre-trend in patenting for
subclasses with licensing:
(3) patentsct = β0 + β1 • subclass with licensed patentsc • postt + β2 • patents by US inventorsct + β3 • patents by other foreignct + β4 • subclass with licensed patentsc • preTWEAt • t + δt + θc + εfct
These regressions indicate an increase by 5.02 additional patents per year after 1918
(Table 2, column 4, p-value <0.001), larger than the baseline estimate of 2.97.
B. Excluding the War Years
We also estimate the baseline model (in equation 1) excluding the war years
(1915-1918), when patenting may have been influenced by changes in the demand for
war-related chemicals, such as explosives and dyes. Estimates that exclude data for the
war years are slightly larger than the baseline estimate of 2.97 additional patents (Table 2,
column 1). OLS estimates indicate that German inventors applied for 3.22 additional
patents in subclasses with compulsory licensing per year after 1918 (Appendix Table A4,
column 1, p-value 0.001). Excluding controls for GPO patents by foreign inventors
increases the size of this estimate to 5.36 (Appendix Table A4, column 2, p-value 0.001).
Intensity specifications indicate that - for each additional licensed patentc - German
inventors applied for 0.19 additional patents per year after 1918 (Appendix Table A4,
26 We also estimate β1 separately for each year with 1918 to 1921 as the omitted category. Estimates of annual effects yield no evidence of differential pre-trends. Until 1917, effects are negative and statistically significant only for 4 of 18 years. After 1918 effects are positive and statistically significant for 5 of 12 years. Estimates increase after 1923, with 3.58 additional patents in 1924 and 3.68 in 1925, implying a 33 and 34 percent increase, respectively (with p-values of 0.006 and 0.013).
17
column 5, p-value 0.007), implying a 32 percent increase for the average subclass with at
least one licensed patent.
C. Intent-to-Treat and Instrumental Variable Regressions
As a response to Germany’s military aggression, the confiscation of all German-
owned US property and the timing of the TWEA were exogenous to changes in patenting
after 1918. The research fields in which US firms chose to license confiscated US
patents, however, may not have been exogenous. For example, US firms may have been
more likely to license German-owned patents in research fields in which post-war
demand for innovation was high. Then, OLS overestimates the increase in innovation.
Conversely, OLS underestimates the effects of compulsory licensing if US firms were
more likely to license German-owned patents for war-related chemicals, such as dyes or
explosives, for which demand declined after 1919. For example, Haber (1971, p. 251)
explains: “Without demand for war-related chemicals, the worst problem that German
dye producers…faced turned out to be excess capacity.” Consistent with the idea of
negative selection, the subclass with the largest number of licensed patents was 22a for
azo dyes, with 436 licensed patents (Appendix Table A5). Patents by German inventors
for azo dyes declined from 28.79 per year until 1918 to 24.17 afterwards.
To investigate these issues, we estimate intent-to-treat (ITT) regressions with
subclasses with confiscated patents - in which German-owned patents were available for
licensing - as a treatment variable instead of licensed patents:
(4) patentsct =�0 + �1 • subclass with confiscated patentsc • postt + β2 • patents by US inventorsct + �3 • patents by other foreignct
+ �t + �c +�ct
where subclass with confiscated patentsc is equal to 1, if subclass c includes at least 1
German-owned patent that was confiscated under the TWEA. Among 212 subclasses of
chemical inventions, 167 subclasses include at least 1 confiscated patent; 101 of these
167 subclasses with confiscated patents include at least 1 licensed patent (60 percent).
ITT estimates imply that German inventors applied for 2.36 additional patents per year
after 1918 in subclasses with confiscated patents (Table 3, column 1, p-value 0.004).
18
Compared with an average of 10.77 patents per subclass and year until 1918, this implies
a 22 percent increase.
Consistent with historical evidence of negative selection (e.g., Haber 1971, p. 251),
ITT estimates suggest that OLS may underestimate the effects of compulsory licensing.
At 2.36 (Table 3, column 1), ITT estimates are 33 percent larger than 1.78, the product of
the OLS estimate of 2.97 (Table 2, column 1) and 0.60, the probability that at least one
patent in a subclass with at least 1 confiscated patent was licensed to a US firm.27
IV regressions that use subclasses with confiscated patentsc as an instrument for
subclasses with licensed patentsc confirm that OLS is downward biased. First stage
regressions indicate that subclasses with confiscated patents are 58 percent more likely to
be a subclass with licensed patents (Table 3, column 4, p-value < 0.001). IV estimates
indicate that German inventors applied for 4.05 additional patents per year after 1918 in
subclasses with licensing (Table 3, column 6, p-value < 0.001), compared with 2.97
additional patents implied by OLS (Table 2, column 1). The local average treatment
effect of 4.05 in the IV regressions estimates the effect of making German-owned US
patents available to US firms for technologies that German inventors chose to patent in
the United States between 1900 and 1918. These technologies are more likely to be
relevant for the US market, and due to the costs of patenting abroad they are more likely
to be owned by larger German firms.28
IV. MECHANISMS
In this section we explore alternative channels by which compulsory licensing
may have encouraged patenting and innovation. First, we use renewal data to examine
whether German inventors responded to the loss of their US patents by reinforcing their
German patents through a patent thicket of lower quality, or strategic patents (Shapiro
2001, Hall and Ziedonis 2001).29 This test suggests an increase in lower quality patents,
which is, however, not large enough to account for the observed increase. Then, we 27 ITT estimates with patents that were renewed for at least 5 years imply a 19 percent increase in patenting in GPO subclasses with confiscated patents (Appendix Table A6, column 1). 28 See the description of the firm characteristics in the data section and Appendix Table A.3. 29 Shapiro (2001, p. 120) vividly defines a “patent thicket” as a “dense web of overlapping intellectual property rights that a company must hack its way through in order to actually commercialize new technology.” Hall and Ziedonis (2001) study of 95 US semiconductor firms between 1979 and 1995 shows that firms build portfolios of strategic patents to use against each other in case of litigation.
19
examine firm-level data on changes in patenting to explore the potential effects of
compulsory licensing on entry and on incumbents whose patents had been licensed.
A. Strategic Patenting
Estimates with patents that had been renewed for a minimum of five years
indicate that the observed increase in patenting is robust to controlling for patent quality,
even though a small part of the observed increase may have been due to lower quality
strategic patents. Similar to raw patents, counts of renewed patents per year follow a
similar trend for subclasses with and without licensing until 1918 (Appendix Figure A4,
Panel A). After 1918, renewed patents increased in subclasses with licensing but stayed
flat in other subclasses. In 1927, German inventors applied for 9.63 renewed patents in
subclasses with licensing, more than three times compared with 2.29 renewed patents in
other subclasses. In subclasses with licensing, counts of renewed patents increased by 28
percent from 6.28 per year until 1918 to 8.05 afterwards (Table 1, Panel A). By
comparison, in subclasses without licensing, renewed patents declined by 12 percent
from 2.56 per year until 1918 to 2.28 afterwards.
Estimating the baseline specification (equation 1) with renewed patents as an
outcome variable indicates that German inventors applied for 1.09 additional renewed
patents per year after 1918 in subclasses with licensing (Table 2, column 7, p-value 0.02).
Compared with an average of 6.28 renewed patents per subclass and year until 1918, this
implies a 17 percent increase. Estimates with subclass-specific pre-trends indicate that
German inventors applied for 2.35 additional renewed patents (Table 2, column 8, p-
value 0.001), implying a 37 percent increase. Regressions with a separate trend in
patenting for subclasses with licensing indicate that German inventors applied for 2.26
additional renewed patents per subclass and year, implying a 36 percent increase (not
reported). Intensity regressions indicate that – for each additional licensed patentc in
subclass c - German inventors applied for 0.08 additional renewed patents per year after
1918; this implies a 23 percent increase for the average subclass with at least one licensed
patent (not reported).
B. Entry into Fields with Licensing
20
US patent data indicate that German inventors faced increased competition from
US inventors, who became significantly more productive in subclasses with licensing
(Moser and Voena 2012). German patent data confirm the significant differential
increase in US invention in research fields with licensing (Data Section II.D, Figure 2).
This increased presence of US inventors created a threat of competition, which may have
encouraged incumbent patentees to innovate more.
In this section, we examine whether firms whose patents had been licensed also
faced increased competition from German inventors in research fields with licensing.
Firm-level data reveal a large increase after 1918 in the number of German firms that
were active in research fields with licensing. Until 1918, an average of 2.29 firms
without licensed patents produced patents in subclasses with licensing; after 1918 this
number increased by 70 percent to 3.90 firms (Table 5). By comparison, the average
number of firms without licensed patents that produced patents in subclasses without
licensed patents increased only by 23 percent, from 1.22 to 1.50. After 1918, entrants
without previous patents in subclasses with licensing account for 5,065 of 12,852
German-owned (39 percent) in subclasses with licensing.
The Deutsche Gold- und Silber-Scheide-Anstalt (Degussa) is an example of a
German firm that entered research fields with licensing after 1918. Until 1918, Degussa
had applied for a total of 58 patents across 10 subclasses of chemical inventions,
including 54 patents in 8 subclasses with licensing. After 1918, Degussa applied for a
total of 147 patents, including 83 patents in the same 8 subclasses with licensing, 24 in
subclasses without licensing, and 50 patents in 12 subclasses with licensing, in which
Degussa had not patented until 1918.
The example of Degussa suggests that some of the increase in patenting in fields with
licensing may have been driven by a shift in the direction of invention, as firms that had
been active in other fields switched into fields with licensing after 1918.
To investigate whether the observed increase in patenting in subclasses with
licensing was driven by firms that switched into subclasses with licensing from other
fields of chemical research, we measure the share of patents in subclasses with licensing
by firms with previous patents in other subclasses of chemicals (switchers) and firms
without previous patents (entrants into chemical research). These comparisons reveal
21
that the increase in patenting by entrants in subclasses with licensing was driven
primarily by entrants without previous patents for chemicals. Entrants without previous
patents in any field of chemical research account for 2,898 of 5,065 patents (57 percent)
by firms without previous patents with licensing.30
C. Firm-level Changes in Patenting
To investigate the mechanism by which compulsory licensing may encourage
invention, we examine changes in patenting after 1918 for German firms that were
differentially affected by compulsory licensing under the US TWEA. Summary statistics
indicate that German firms with licensed patents began to patent more in research fields
in which their US patents had been licensed (Table 1, Panel B).
Baseline regressions compare changes in patents per subclass and year after 1918
for German firms whose patents had become subject to compulsory licensing with
changes for other German firms. Triple differences regressions estimate:
(5) patentsfct = γ0 + γ1 • subclass w licensed patentsc • firm w licensed patentf • postt + γ2 • subclass w licensed patentsc • postt + γ3 • firm w licensed patentf • postt + γ4 • subclass w licensed patentsc • firm w licensed patentf + γ5 • patents by US inventorsct + γ6 • patents by other foreignct + γ7 • patents by individualsct + δt + θc + λ f + εfct
where the outcome variable patentsfct counts patents by firm f in subclass c and
application year t. The variable firm w licensed patentf equals 1 if at least one of firm f’s
patents was licensed. The variable patents by individualsct counts patents in subclass c
and year t by individual German inventors; all other control variables are as defined
above. The triple difference coefficient γ1 measures the effect of compulsory licensing on
firms whose patents were licensed, compared with other German firms. It is unbiased if -
in the absence of compulsory licensing - changes in patenting in subclass c after 1918
would have been comparable for German firms with and without licensed patents.
This analysis indicates that firms, whose patents had been licensed, applied for
0.42 additional patents per year after 1918 in subclasses with licensing (Table 4, column
1, p-value 0.002). Compared with a mean of 0.46 patents per subclass and year until
30 Patents per year by firms without pre-1919 patents in other fields of chemical research increased from 1.45 in 1919 to 2.96 in 1924 and 2.91 in 1929 (Appendix Figure A5). By comparison, the average number of patents by entrants with pre-1919 patents declined from 1.28 in 1919 to 1.85 in 1924 and 1.82 in 1929.
22
1918 for firms with licensed patents, this implies a 91 percent increase in patenting.
These results are robust to including subclass-specific pre-trends (Table 4, column 2).
Robustness checks exclude patents with application years after 1924, the last year
before the creation of the cartel-like IG Farben. These tests take into account that the
formation of IG Farben may have affected the structure of competition within the
German chemical industry. Estimates with the restricted sample of patent applications
until 1924 confirms that firms whose patents had been licensed increased their patenting
activity after 1918. Baseline estimates indicate that firms whose patents had been
licensed applied for 0.16 additional patents after 1918 in fields with licensing (Table 4,
column 3, p-value 0.002). Compared with an average of 0.46 patents per subclass and
year until 1918 for firms with licensed patents, this implies a 35 percent increase.
Regressions with subclass-specific pre-trends indicate a slightly larger increase of 0.17
additional patents per year after 1918 (Table 4, column 4, p-value 0.002), which implies a
37 percent increase. Excluding data after 1924 may, however, lead us to under-estimate
firms’ response to compulsory licensing, if effects of compulsory licensing occur with
some delay. For US inventors, the strongest increase in patenting occurred six years after
the first licenses were issued, which is consistent with a prolonged period of learning
(Moser and Voena 2012, p. 409). For example, Du Pont’s early runs of indigo blue
turned out green (Hounshell and Smith 1988, p.90). If similar delays affected German
firms, regressions that drop years after 1924 underestimate the effects of compulsory
licensing.
Regressions with renewal data imply a smaller, albeit substantial increase.
German firms applied for 0.29 additional renewed patents after 1918 in subclasses in
which their patents had been licensed (Table 4, column 5, p-value < 0.001). Relative to
an average of 0.39 renewed patents per subclass and year until 1918 for firms with
licensed patents, this implies a 74 percent increase. Estimates with subclass-specific pre-
trends indicate that German firms applied for 0.30 additional renewed patents in
subclasses with licensing (Table 4, column 6, p-value < 0.001), which implies a 77
percent increase. Regressions with a separate trend for firms with licensing indicate that
German firms applied for 0.29 additional renewed patents per year in subclasses with
licensing; this implies a 74 percent increase (not reported).
23
D. Differential Effects Across Low and High Levels of Competition
To test predictions about the competitive effects of compulsory licensing, we
compare the effects of compulsory licensing across research fields with high and low
levels of competition. We measure variation in competition through the Herfindahl-
Hirshman index (HHI) of patents per technology field and year:
HHIct = ( !!"#!! )!! !!"
!!! !!"
where pict is firm i’s share of total patents in subclass c and year t, and Fct measures the
number of patent-active firms in subclass c and year t. Comparisons of patent counts for
3,265 subclass-year pairs show that most subclasses are relatively competitive: Two-
thirds of all subclass-year pairs have an HHI of 0.1 or less (Figure 3). Similar to plots of
patent counts across UK industries in Aghion et al. (2005), the data are also broadly
consistent with an inverted U-shaped relationship between competition and innovation.31
To compare the effect of compulsory licensing across subclasses with low and
high levels of pre-existing competition, we re-estimate the baseline specification
(equation 2) with an additional interaction term between the difference-in-differences
estimator and a set of indicator variables for deciles of the HHI for years until 1918:
(6) patentsct = α + Σd βd • subclass w licensed patentsc • pre-1919 HHI deciled • postt + Σd γd • pre-1919 HHI deciled • postt + ζ1 • subclass w licensed patentsc • postt + ζ2 • patents by US inventorsct + ζ3 • patents by other foreignct + δt + θc + Σc ϕc • subclassc • preTWEAt • t + εct
where the 5th and 6th decile of the HHI, which include the median subclasses, are the
omitted categories. Estimates increase from 8.22 fewer patents for the 10th decile
(Appendix Figure A6, p-value of 0.26) to 14.74 additional patents for the 7th decile (p-
value of 0.11). Estimates are close to zero for the 4th to the 1st decile of the HHI. These
estimates suggest that the observed increase in patenting was driven by technologies in
31 Figure 3 is most similar to Figure 1 in Aghion et al. 2005, which plots patents per industry and year against (1-) the Lerner index as a measure for the intensity of competition. Estimates with the HHI and the concentration ratio (C4, not reported) are also consistent with Levin, Cohen, and Mowery’s (1985) findings that competition and innovation are positively correlated up to the 5th and 6th decile of the C4 in FTC line of business data. Levin et al. (1985) find that this correlation disappears with controls for variation across industries in the effectiveness of mechanisms to appropriate the returns from R&D. The current study investigates differences in competition within chemicals, an industry, in which patents were an effective mechanism to appropriate returns from R&D (Moser 2012).
24
which patenting was relatively concentrated before 1919. By comparison, the effects of
compulsory licensing appear to have been much weaker for technologies in which
invention had already been competitive prior to compulsory licensing.
V. CONCLUSIONS
This paper has used a new data set of 79,591 chemical patents in Germany
between 1900 and 1930 to examine the effects of compulsory licensing under the WWI
Trading with the Enemy Act on German invention. Under the TWEA, all German-
owned US patents became subject to compulsory licensing in 1919. We find that
compulsory licensing encouraged, rather than discouraged invention in Germany.
German inventors produced 28 percent more patents after 1918 in research fields with
licensing. Intent-to-treat regressions and instrumental variable regressions, which use
subclasses with confiscations as an instrument for subclasses with licensing, suggest that
OLS estimates underestimate the effect of compulsory licensing on German patents.
An analysis of high-quality patents indicates a slightly smaller increase in
patenting. This suggests that some of the observed increase in patenting may have been
due to an increase in lower quality strategic patents. Estimates, however, remain large
and statistically significant, and imply a 17 percent increase in high-quality patents.
Firm-level analyses of patent data reveal a significant increase in the number of
research-active firms in research fields with licensing. Nearly 40 percent of all patents
after 1918 in fields with licensing were by firms without pre-1918 patents in these fields.
Among entrants into fields with licensing, firms without previous patents in any other
fields of chemicals produced more patents in fields with licensing after 1918 compared
with firms that had been active in other fields of chemical research before 1918. We also
find that German firms whose patents had been licensed produced more patents after
1918 in fields in which their patents had been licensed. Taken together, these results
indicate that compulsory licensing can promote innovation by encouraging competitors to
enter fields with licensing, which increases the threat of competition for incumbent
inventors and motivates them to invest more in R&D.
In the early 20th century and today, industries that are most affected by
compulsory licensing tend to be relatively concentrated. In 2013, for example, therapies
25
by Gilead, Johnson & Johnson, and Brystol Myers dominated the market for HIV drugs.
Gilead’s Truvada and related drugs accounted for $9 billion in sales, Brystol-Myers
Sustiva generated $3.6 billion, and Ruveda which combines Gilead’s drug Viread and
Emtriva, recorded $3.1 billion in sales, while other drugs sold substantially less
(Campbell 2014). Our findings suggest that compulsory licensing can encourage
innovation in these industries. In fact, we find that compulsory licensing was particularly
effective at promoting invention in fields that were ex ante more concentrated, and less
effective in fields that were competitive already.
It is, however, important to note that the benefits of compulsory licensing depend
on the credibility with which national governments can commit to invoke it exclusively
in cases of emergencies. Triggered by Germany’s military aggression, the 1919 Trading-
with-the-Enemy Act was at the time perceived as a one-shot event. We find that
incumbent inventors responded by investing heavily in R&D to escape competition with
new entrants. Similar to other types of public policies, such as flood control measures,
monetary policy, and capital taxation (Kydland and Prescott 1977, Fischer 1980),
compulsory licensing is however subject to dynamic inconsistency, and firms may invest
less in R&D if they expect repeated episodes of compulsory licensing.32 We conclude
that compulsory licensing can promote innovation - if governments can credibly commit
to using it only in exceptional cases of emergencies.
REFERENCES
Acs, Zoltan, and David Audretsch. 1988. “Innovation in Large and Small Firms: an Empirical Analysis.” American Economic Review 78 (4): 678-90. Aftalion, Fred. 2001. A History of the International Chemical Industry. Translated by Otto Benfey. Philadelpia: University of Pennsylvania Press. Aghion, Philippe, Christopher Harris, Peter Howitt, and John Vickers. 2001. “Competition, Imitation and Growth with Step-by-step Innovation.” Review of 32 In fact, Kydland and Prescott (1977, p. 477) cite patent policy as an example for dynamic inconsistency: “Given that resources have been allocated to inventive activity which resulted in a new product or process, the efficient policy is not to permit patent protection. For this example, few would consider this optimal-control theory solution as being reasonable. Rather, the question would be posed in terms of the optimal patent life (see, e.g., Nordhaus 1969), which takes into consideration both the incentive for inventive activity provided by patent protection and the loss in consumer surplus that results when someone realizes monopoly rents. In other words, economic theory is used to predict the effects of alternative policy rules, and one with good operating characteristics is selected.” Our paper builds on such analysis to allow for the potential of positive incentive effects from licensing as a mechanism to encourage competition.
26
Economic Studies 68: 467-92. Aghion, Philippe, Nick Bloom, Richard Blundell, Rachel Griffith, and Peter Howitt. 2005. “Competition and Innovation: An Inverted-U Relationship.” Quarterly Journal of Economics 120 (2): 701-28. Alien Property Custodian. 1919. A Detailed Report by the Alien Property Custodian of All Proceedings Had by Him under the Trading with the Enemy Act during the Calendar year 1918 and to the Close of Business on February 15, 1919.Washington, DC: Government Printing Office. Arrow, Kenneth. 1962a. “Economic Welfare and the Allocation of Resources for invention.” in Richard Nelson (ed.), The Rate and Direction of Inventive Activity. Economic and Social Factors. Cambridge, MA: National Bureau of Economic Research. Arrow, Kenneth. 1962b. “The Economic Implications of Learning by Doing.” Review of Economic Studies 29(3): 155-173. Bidwell, Robin L. 1970. Currency Conversion Tables: A Hundred Years of Change, London: Rex Collings. 22-24. Blundell, Richard, Rachel Griffith, and John Van Reenen. 1999. “Market Share, Market Value and Innovation in a Panel of British Manufacturing Firms,” Review of Economic Studies 66: 529–54. Campbell, Todd. 2014. “Can Gilead Dominate the HIV Drug Market Again in 2014?” The Motley Fool, March 12, 2014. Deutsches Patentamt. 1914, 1915, and 1918. Blatt fuer das Patent-, Muster- und Zeichenwesen, volumes 20, 21, and 24; Heymann: Berlin. Fischer, Stanley. 1980. Rational Expectations and Economic Policy. Chicago: University of Chicago Press. Gilbert, Richard and David Newbery. 1982. "Preemptive Patenting and the Persistence of Monopoly." American Economic Review 72(2): 514-526. Gilbert, Richard. 2006. “Looking for Mr. Schumpeter: Where are we in the Competition-Innovation Debate?” Chapter 6 in Adam B. Jaffe, Josh Lerner, and Scott Stern, editors. Innovation Policy and the Economy, volume 6, 159-215. Goettler, Ronald L. and Brett R. Gordon. 2011. "Does AMD Spur Intel to Innovate More?" Journal of Political Economy vol. 119(6), pp. 1141-1200. Griliches, Zvi. 1990. "Patent Statistics as Economic Indicators: A Survey." Journal of Economic Literature 28 (4): 1661-1707. Haber, Ludwig F. 1971. The Chemical Industry, 1900-1930, International Growth and Technological Change. Oxford: Clarendon Press. Hall, Bronwyn H. and Rosemarie Ham Ziedonis. 2001. “The Patent Paradox Revisited: An Empirical Study of Patenting in the U.S. Semiconductor Industry, 1979-1995.” The RAND Journal of Economics 32 (1): 101-128. Handbuch der Deutschen Aktiengesellschaften. Issue 1911/12, vol. I - II, Berlin: Hoppenstedt. Harhoff, Dietmar, Francis Narin, Frederic M. Scherer, and Katrin Vopel. 1999. “Citation Frequency and the Value of Patented Inventions.” Review of Economics and Statistics 81 (3): 511–15. Haynes, Williams. 1945. American Chemical Industry – The World War I period 1912–1922. New York: D. Van Nostrand Company.
27
Hounshell, David A., and John Kenly Smith, Jr. 1988. Science and Corporate Strategy: Du Pont R&D, 1902–1980. Cambridge, UK: Cambridge University Press. Kydland, Finn. E., and Edward C. Prescott. 1977. “Rules Rather than Discretion: The Inconsistency of Optimal Plans.” The Journal of Political Economy 85 (3): 473-92. Lampe, Ryan and Moser, Petra. “Patent Pools, Competition, and Innovation – Evidence from 20 U.S. Industries under the New Deal” http://ssrn.com/abstract=1967246. Lanjouw, Jean O., Ariel Pakes, and Jonathan Putnam. 1998. “How to Count Patents and Value Intellectual Property: The Uses of Patent Renewal and Application Data.” The Journal of Industrial Economics 46 (4): 405–32. Levin, Richard C., Wesley M. Cohen, and David C. Mowery. 1985. “R&D Appropriability, Opportunity, and Market Structure: New Evidence on Some Schumpeterian Hypotheses.” American Economic Review 75(2): pp. 20-4. Moser, Petra. 2005. “How do Patent Laws Influence Innovation? Evidence from Nineteenth-Century World’s Fairs.” American Economic Review 95 (4): 1214- 1236. Moser, Petra. 2012. “Innovation without Patents.” Journal of Law and Economics, 2012, Vol. 55. No. 1, pp. 43-74. Moser, Petra, and Alessandra Voena. 2012. "Compulsory Licensing: Evidence from the Trading with the Enemy Act." American Economic Review 102 (1): 396- 427. Moser, Petra, Alessandra Voena, and Fabian Waldinger. forthcoming. “German- Jewish Émigrés and US Invention.” American Economic Review. Moser, Petra and Joerg Ohmstedt, and Paul Rhode. 2014. “Patent Citations and the Size of the Inventive Step. Evidence from Hybrid Corn.” http://ssrn.com/abstract=1888191 Nickell, Steven. 1996. “Competition and Corporate Performance.” Journal of Political Economy 104: 724–46. Nordhaus, William D. Invention Growth and Welfare: A Theoretical Treatment of
Technical Change. Cambridge. Mass: MIT Press, 1969 Reichspatentamt. 1901-1933. Verzeichnis der im Vorjahre Erteilten Patente. Reichspatentamt. 1912. Systematische Übersicht der vom 1. Januar bis 31. Dezember 1912 in die Patentrolle eingetragenen Patente. Reinganum, Jennifer. 1983. “Uncertain Innovation and the Persistence of Monopoly.”American Economic Review 73: 61–6. Richter, Ralf, and Jochen Streb. 2011. "Catching-Up and Falling Behind: Knowledge Spillover from American to German Machine Toolmakers." The Journal of Economic History 71(04): 1006-1031. Sakakibara, Mariko and Lee Branstetter. “Do Stronger Patents Induce More Innovation? Evidence from the 1988 Japanese Patent Law Reform.” Rand Journal of Economics 32 (1): 77-100. Schankerman, Mark, and Ariel Pakes. 1986. “Estimates of the Value of Patent Rights in European Countries During the post-1950 Period.” The Economic Journal 96 (384): 1052-1076.
28
Schmidt, Klaus M. 1997. “Managerial Incentives and Product Market Competition.” The Review of Economic Studies 64(2): 191-213. Schumpeter, Joseph A. 1934. The Theory of Economic Development. Cambridge, MA: Harvard University Press. Schumpeter, Joseph A. 1942. Capitalism, Socialism, and Democracy. New York: Harper and Brothers. Scotchmer, Suzanne. 1991. "Standing on the Shoulders of Giants: Cumulative Research and the Patent Law." Journal of Economic Perspectives 5(1): 29-41. Scotchmer, Suzanne. 2004. Innovation and Incentives. Cambridge, MA: MIT Press. Shapiro, Carl. 2001. "Navigating the Patent Thicket: Cross Licenses, Patent Pools, and Standard-Setting." Chapter 4 in Adam B. Jaffe, Josh Lerner, and Scott Stern, editors. Innovation Policy and the Economy , volume 1, Cambridge: MIT Press. 119–150. Steen, Kathryn. 2001. “Patents, Patriotism, and ‘Skilled in the Art’ USA v. The Chemical Foundation, Inc., 1923–1926.” Isis 92(1): 91–122. Trajtenberg, Manuel. 1990. “A Penny for Your Quotes: Patent Citations and the Value of Innovations.” RAND Journal of Economics 21 (1): 172–187. Williamson, Samuel H. 2014. “Seven Ways to Compute the Relative Value of a US Dollar Amount, 1790 to Present.” www.measuringworth.com/uscompare.
1
TABLE 1 – GPO PATENTS BY GERMAN INVENTORS PER SUBCLASS AND YEAR
PANEL A: SUBCLASSES WITH AND W/O LICENSED PATENTS
Subclasses with licensed patents
Subclasses without licensed patents Difference
N Mean N Mean All patents 1900-1918 101 10.77 111 5.05 5.72
(1.31)
(0.58)
(1.43)
1919-1930 101 16.49 111 5.54 10.95
(2.47) (0.95) (2.64) Patents renewed ≥5 years 1900-1918 101 6.28 108 2.56 3.72
(0.84)
(0.30)
(0.89)
1919-1930 101 8.05 108 2.28 5.77
(1.29) (0.38) (1.35) PANEL B: GERMAN FIRMS WITH AND W/O LICENSED PATENTS
Firms with licensed patents
Other German firms Difference
N Mean N Mean All patents 1900-1918 50 0.46 4,764 0.05 0.41
(0.10)
(0.01)
(0.01)
1919-1930 50 0.94 4,764 0.10 0.84 (0.23) (0.01) (0.01) Patents renewed ≥5 years 1900-1918 47 0.39 2,933 0.05 0.34
(0.08)
(0.01)
(0.01)
1919-1930 47 0.66 2,933 0.09 0.57 (0.16) (0.01) (0.01) Notes: Data include 58,691 GPO patents by German inventors with application dates between January 1, 1900 and December 31, 1930. Patents renewed ≥5 years are 30,017 GPO patents by German inventors that were renewed 5 years or more. Subclasses with licensed patents cover 101 technology fields in which at least one German-owned US patent was licensed under the TWEA. Subclasses without licensed patents cover 111 remaining technology fields within chemicals without licensed patents. Standard errors are clustered at the subclass level in Panel A and at the firm level in Panel B.
2
TABLE 2 – OLS, DEPENDENT VARIABLE IS PATENTS PER SUBCLASS AND YEAR
All Patents (1-6)
Patents renewed≥5y (7-8)
(1) (2) (3) (4) (5) (6) (7) (8) Subclass with licensed patents*post 2.968*** 5.219*** 5.317*** 5.017*** 1.092** 2.345*** (0.915) (1.535) (1.427) (1.394) (0.466) (0.720) Licensed patents * post
0.196*** 0.356***
(0.069) (0.113)
Licensed patents2 * post
-0.000*** -0.001***
(0.000) (0.000) Patents by US inventors 0.859***
0.700*** 0.857*** 0.815*** 0.667*** 0.817*** 0.687***
(0.142)
(0.136) (0.142) (0.142) (0.131) (0.149) (0.163) Patents by other foreign 1.503***
1.353*** 1.500*** 1.376*** 1.233*** 1.194*** 1.136***
(0.228)
(0.229) (0.228) (0.153) (0.156) (0.186) (0.205) Standard errors (in parentheses) are clustered at the level of subclasses, *** p<0.01, ** p<0.05, * p<0.1
Mean in subclasses w licensed patents 1900-18 10.77 10.77 10.77 10.77 10.77 10.77 6.28 6.28 Subclass-specific pre-trends No No Yes No No Yes No Yes Pre-trend for subclasses with licensing No No No Yes No No No No Subclass fixed effects Yes Yes Yes Yes Yes Yes Yes Yes Year fixed effects Yes Yes Yes Yes Yes Yes Yes Yes N 6,572 6,572 6,572 6,572 6,572 6,572 6,479 6,479
Notes: Data include all 79,591 applications for patents on chemical inventions between 1900 and 1930. Data on renewal decisions come from archival records of renewed patents from the Annual Reports of the German patent office between 1901 and 1942. Subclass with licensed patents is an indicator variable that equals one for 101 German subclasses, in which at least one US patent became subject to compulsory licensing. The indicator variable post equals 1 for all years after 1918. The variable licensed patents measures the number of patents that became subject to licensing. Patents by US inventors controls for the number of patents that the GPO issued to residents of the United States in subclass c and year t; patents by other foreign controls for the number of patents that the GPO issued to residents of other foreign countries.
2
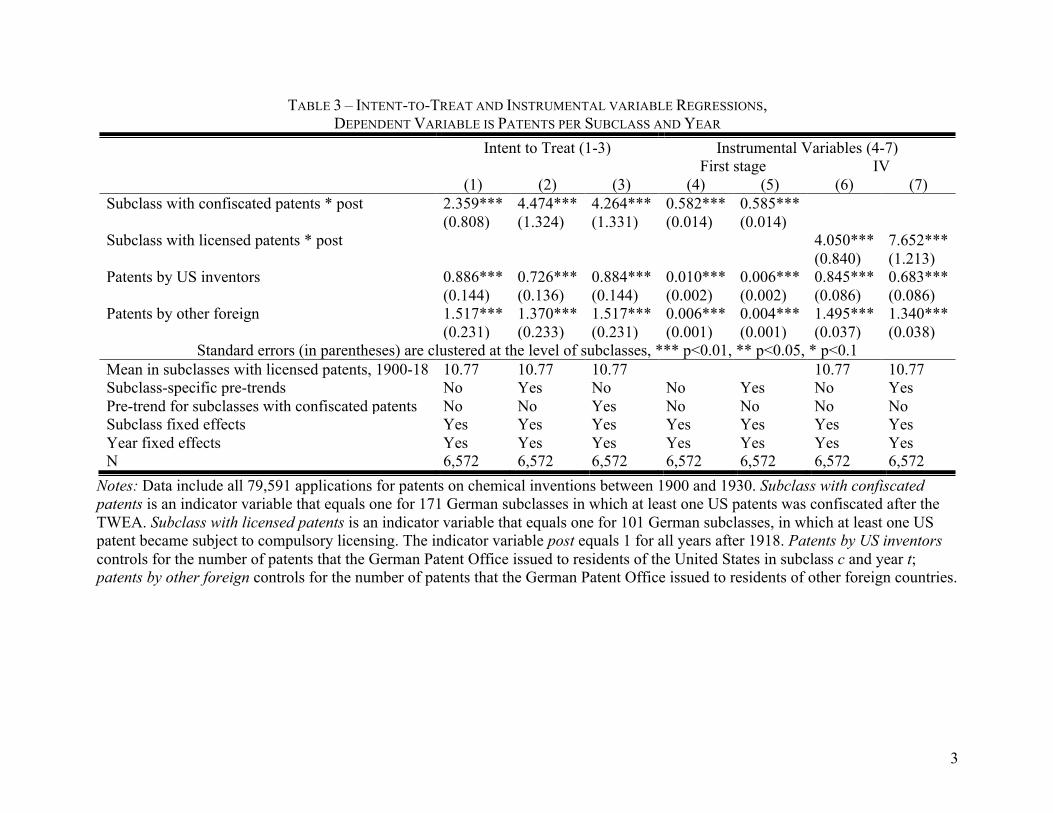
3
TABLE 3 – INTENT-TO-TREAT AND INSTRUMENTAL VARIABLE REGRESSIONS, DEPENDENT VARIABLE IS PATENTS PER SUBCLASS AND YEAR
Intent to Treat (1-3) Instrumental Variables (4-7) First stage IV
(1) (2) (3) (4) (5) (6) (7) Subclass with confiscated patents * post 2.359*** 4.474*** 4.264*** 0.582*** 0.585***
(0.808) (1.324) (1.331) (0.014) (0.014) Subclass with licensed patents * post 4.050*** 7.652***
(0.840) (1.213) Patents by US inventors 0.886*** 0.726*** 0.884*** 0.010*** 0.006*** 0.845*** 0.683***
(0.144) (0.136) (0.144) (0.002) (0.002) (0.086) (0.086) Patents by other foreign 1.517*** 1.370*** 1.517*** 0.006*** 0.004*** 1.495*** 1.340***
(0.231) (0.233) (0.231) (0.001) (0.001) (0.037) (0.038) Standard errors (in parentheses) are clustered at the level of subclasses, *** p<0.01, ** p<0.05, * p<0.1
Mean in subclasses with licensed patents, 1900-18 10.77 10.77 10.77 10.77 10.77 Subclass-specific pre-trends No Yes No No Yes No Yes Pre-trend for subclasses with confiscated patents No No Yes No No No No Subclass fixed effects Yes Yes Yes Yes Yes Yes Yes Year fixed effects Yes Yes Yes Yes Yes Yes Yes N 6,572 6,572 6,572 6,572 6,572 6,572 6,572
Notes: Data include all 79,591 applications for patents on chemical inventions between 1900 and 1930. Subclass with confiscated patents is an indicator variable that equals one for 171 German subclasses in which at least one US patents was confiscated after the TWEA. Subclass with licensed patents is an indicator variable that equals one for 101 German subclasses, in which at least one US patent became subject to compulsory licensing. The indicator variable post equals 1 for all years after 1918. Patents by US inventors controls for the number of patents that the German Patent Office issued to residents of the United States in subclass c and year t; patents by other foreign controls for the number of patents that the German Patent Office issued to residents of other foreign countries.
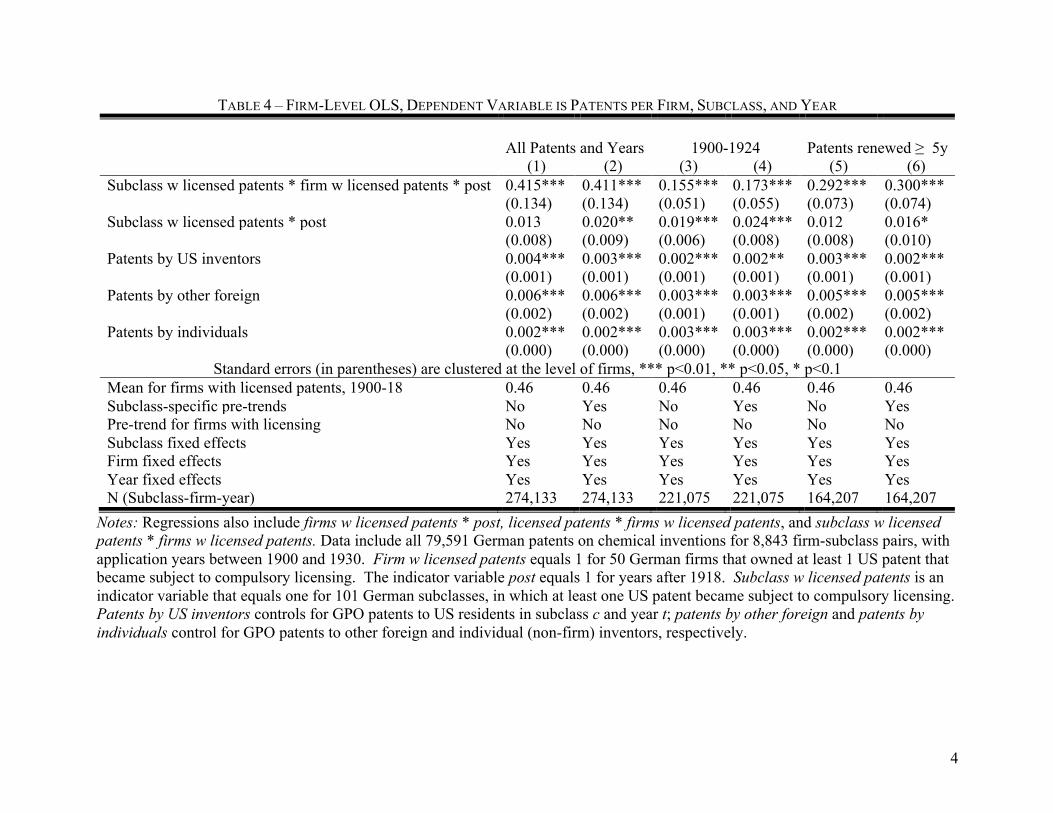
4
TABLE 4 – FIRM-LEVEL OLS, DEPENDENT VARIABLE IS PATENTS PER FIRM, SUBCLASS, AND YEAR
All Patents and Years 1900-1924 Patents renewed ≥�5y
(1) (2) (3) (4) (5) (6) Subclass w licensed patents * firm w licensed patents * post 0.415*** 0.411*** 0.155*** 0.173*** 0.292*** 0.300*** (0.134) (0.134) (0.051) (0.055) (0.073) (0.074) Subclass w licensed patents * post 0.013 0.020** 0.019*** 0.024*** 0.012 0.016* (0.008) (0.009) (0.006) (0.008) (0.008) (0.010) Patents by US inventors 0.004*** 0.003*** 0.002*** 0.002** 0.003*** 0.002***
(0.001) (0.001) (0.001) (0.001) (0.001) (0.001) Patents by other foreign 0.006*** 0.006*** 0.003*** 0.003*** 0.005*** 0.005***
(0.002) (0.002) (0.001) (0.001) (0.002) (0.002) Patents by individuals 0.002*** 0.002*** 0.003*** 0.003*** 0.002*** 0.002*** (0.000) (0.000) (0.000) (0.000) (0.000) (0.000)
Standard errors (in parentheses) are clustered at the level of firms, *** p<0.01, ** p<0.05, * p<0.1 Mean for firms with licensed patents, 1900-18 0.46 0.46 0.46 0.46 0.46 0.46 Subclass-specific pre-trends No Yes No Yes No Yes Pre-trend for firms with licensing No No No No No No Subclass fixed effects Yes Yes Yes Yes Yes Yes Firm fixed effects Yes Yes Yes Yes Yes Yes Year fixed effects Yes Yes Yes Yes Yes Yes N (Subclass-firm-year) 274,133 274,133 221,075 221,075 164,207 164,207
Notes: Regressions also include firms w licensed patents * post, licensed patents * firms w licensed patents, and subclass w licensed patents * firms w licensed patents. Data include all 79,591 German patents on chemical inventions for 8,843 firm-subclass pairs, with application years between 1900 and 1930. Firm w licensed patents equals 1 for 50 German firms that owned at least 1 US patent that became subject to compulsory licensing. The indicator variable post equals 1 for years after 1918. Subclass w licensed patents is an indicator variable that equals one for 101 German subclasses, in which at least one US patent became subject to compulsory licensing. Patents by US inventors controls for GPO patents to US residents in subclass c and year t; patents by other foreign and patents by individuals control for GPO patents to other foreign and individual (non-firm) inventors, respectively.
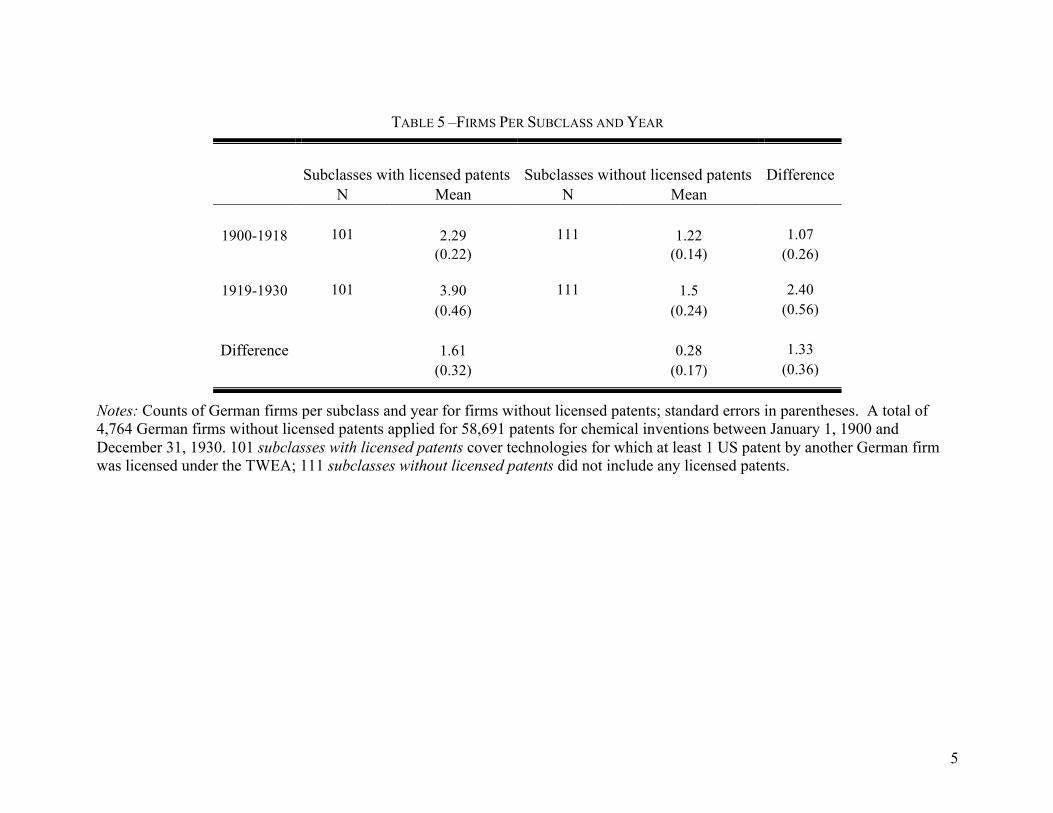
5
TABLE 5 –FIRMS PER SUBCLASS AND YEAR
Subclasses with licensed patents Subclasses without licensed patents Difference N Mean N Mean
1900-1918 101 2.29 111 1.22 1.07
(0.22)
(0.14)
(0.26)
1919-1930 101 3.90 111 1.5 2.40
(0.46) (0.24) (0.56)
Difference 1.61 0.28 1.33
(0.32) (0.17) (0.36)
Notes: Counts of German firms per subclass and year for firms without licensed patents; standard errors in parentheses. A total of 4,764 German firms without licensed patents applied for 58,691 patents for chemical inventions between January 1, 1900 and December 31, 1930. 101 subclasses with licensed patents cover technologies for which at least 1 US patent by another German firm was licensed under the TWEA; 111 subclasses without licensed patents did not include any licensed patents.
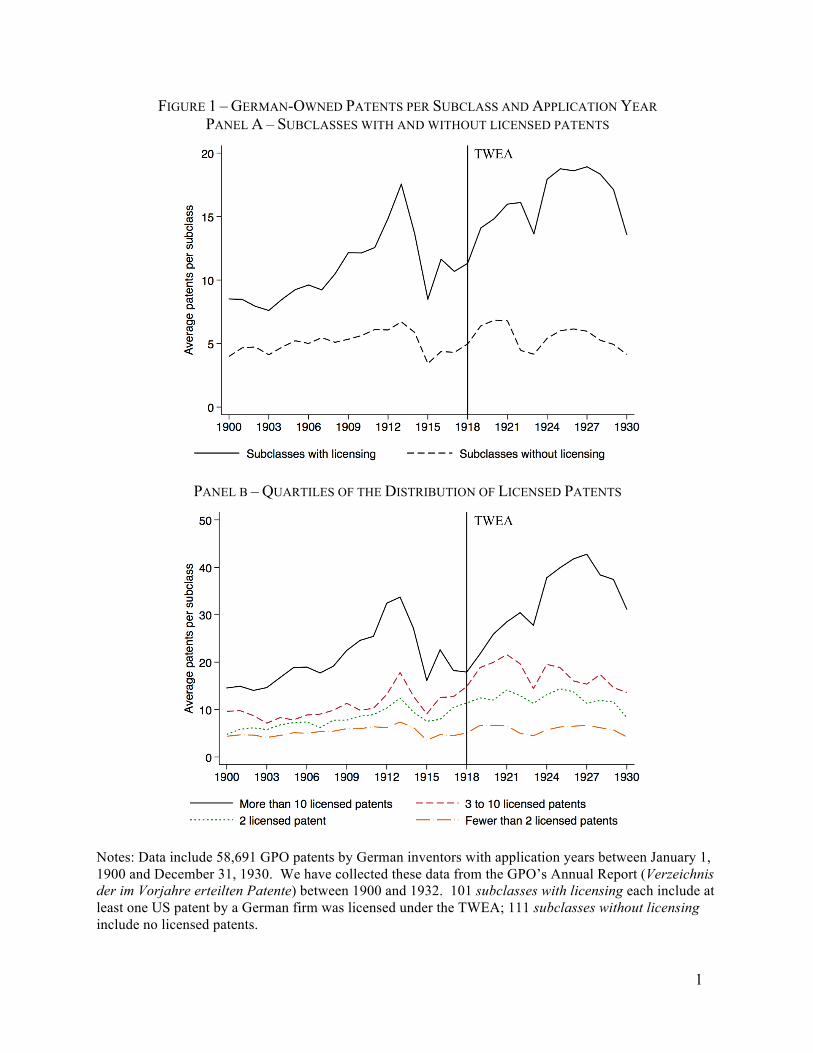
1
FIGURE 1 – GERMAN-OWNED PATENTS PER SUBCLASS AND APPLICATION YEAR PANEL A – SUBCLASSES WITH AND WITHOUT LICENSED PATENTS
PANEL B – QUARTILES OF THE DISTRIBUTION OF LICENSED PATENTS
Notes: Data include 58,691 GPO patents by German inventors with application years between January 1, 1900 and December 31, 1930. We have collected these data from the GPO’s Annual Report (Verzeichnis der im Vorjahre erteilten Patente) between 1900 and 1932. 101 subclasses with licensing each include at least one US patent by a German firm was licensed under the TWEA; 111 subclasses without licensing include no licensed patents.
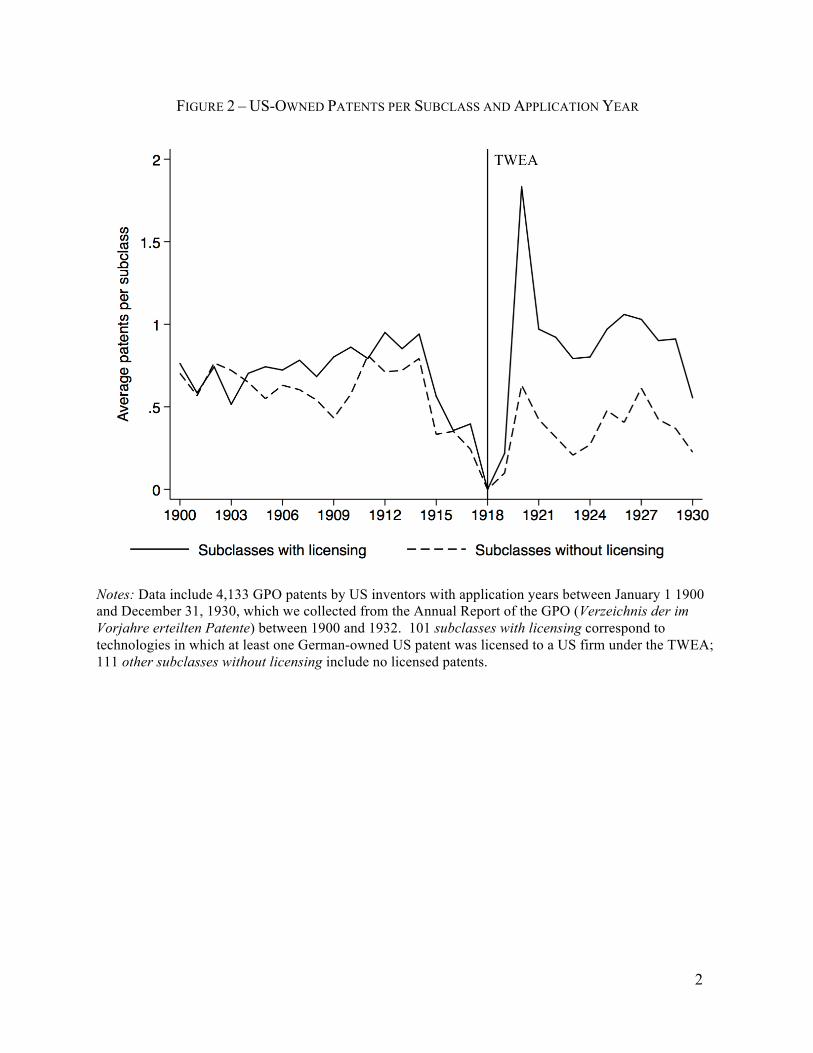
2
FIGURE 2 – US-OWNED PATENTS PER SUBCLASS AND APPLICATION YEAR
Notes: Data include 4,133 GPO patents by US inventors with application years between January 1 1900 and December 31, 1930, which we collected from the Annual Report of the GPO (Verzeichnis der im Vorjahre erteilten Patente) between 1900 and 1932. 101 subclasses with licensing correspond to technologies in which at least one German-owned US patent was licensed to a US firm under the TWEA; 111 other subclasses without licensing include no licensed patents.
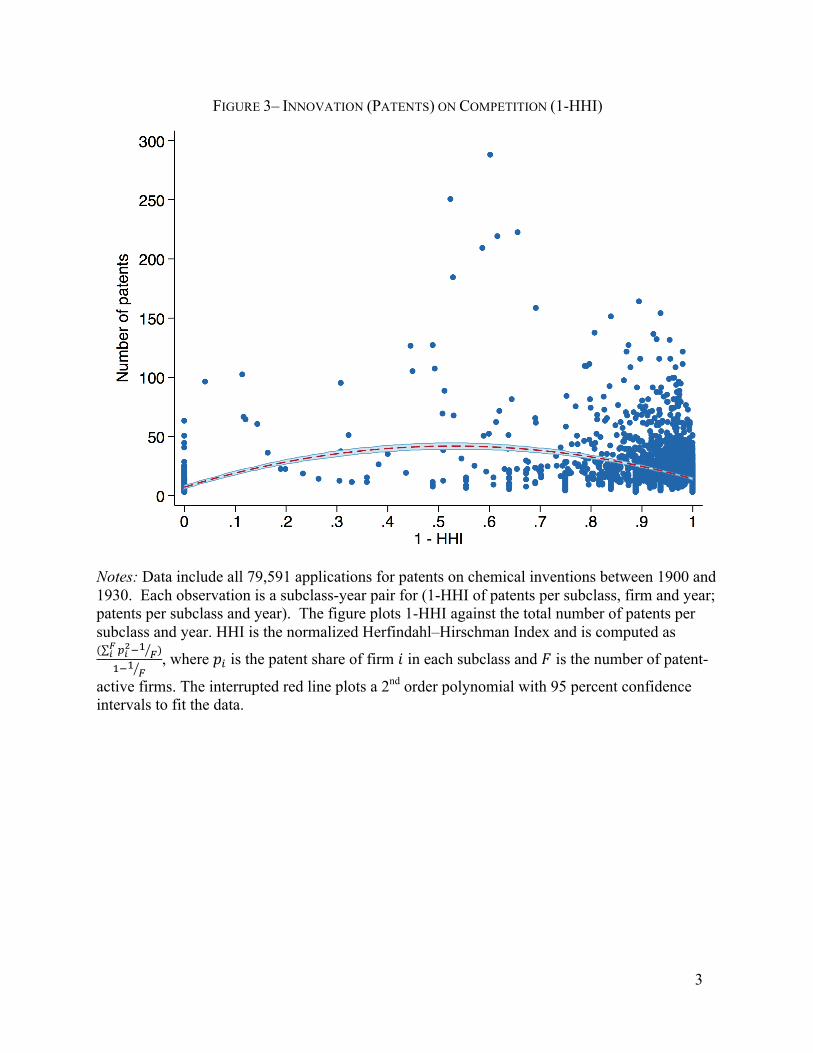
3
FIGURE 3– INNOVATION (PATENTS) ON COMPETITION (1-HHI)
Notes: Data include all 79,591 applications for patents on chemical inventions between 1900 and 1930. Each observation is a subclass-year pair for (1-HHI of patents per subclass, firm and year; patents per subclass and year). The figure plots 1-HHI against the total number of patents per subclass and year. HHI is the normalized Herfindahl–Hirschman Index and is computed as ( !!!!
! !! !)!!! !
, where !! is the patent share of firm ! in each subclass and ! is the number of patent-
active firms. The interrupted red line plots a 2nd order polynomial with 95 percent confidence intervals to fit the data.
ONLINE APPENDIX NOT FOR PUBLICATION
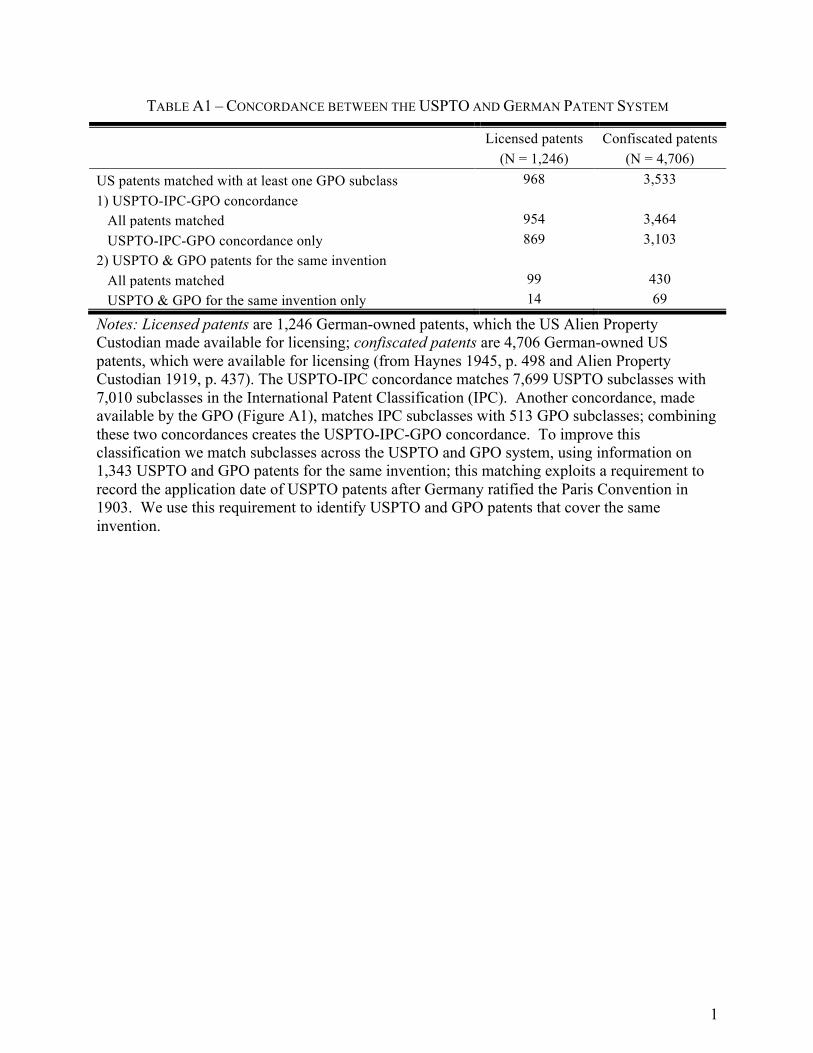
TABLE A1 – CONCORDANCE BETWEEN THE USPTO AND GERMAN PATENT SYSTEM
Licensed patents Confiscated patents
(N = 1,246) (N = 4,706) US patents matched with at least one GPO subclass 968 3,533 1) USPTO-IPC-GPO concordance All patents matched 954 3,464 USPTO-IPC-GPO concordance only 869 3,103 2) USPTO & GPO patents for the same invention All patents matched 99 430 USPTO & GPO for the same invention only 14 69
Notes: Licensed patents are 1,246 German-owned patents, which the US Alien Property Custodian made available for licensing; confiscated patents are 4,706 German-owned US patents, which were available for licensing (from Haynes 1945, p. 498 and Alien Property Custodian 1919, p. 437). The USPTO-IPC concordance matches 7,699 USPTO subclasses with 7,010 subclasses in the International Patent Classification (IPC). Another concordance, made available by the GPO (Figure A1), matches IPC subclasses with 513 GPO subclasses; combining these two concordances creates the USPTO-IPC-GPO concordance. To improve this classification we match subclasses across the USPTO and GPO system, using information on 1,343 USPTO and GPO patents for the same invention; this matching exploits a requirement to record the application date of USPTO patents after Germany ratified the Paris Convention in 1903. We use this requirement to identify USPTO and GPO patents that cover the same invention.
1
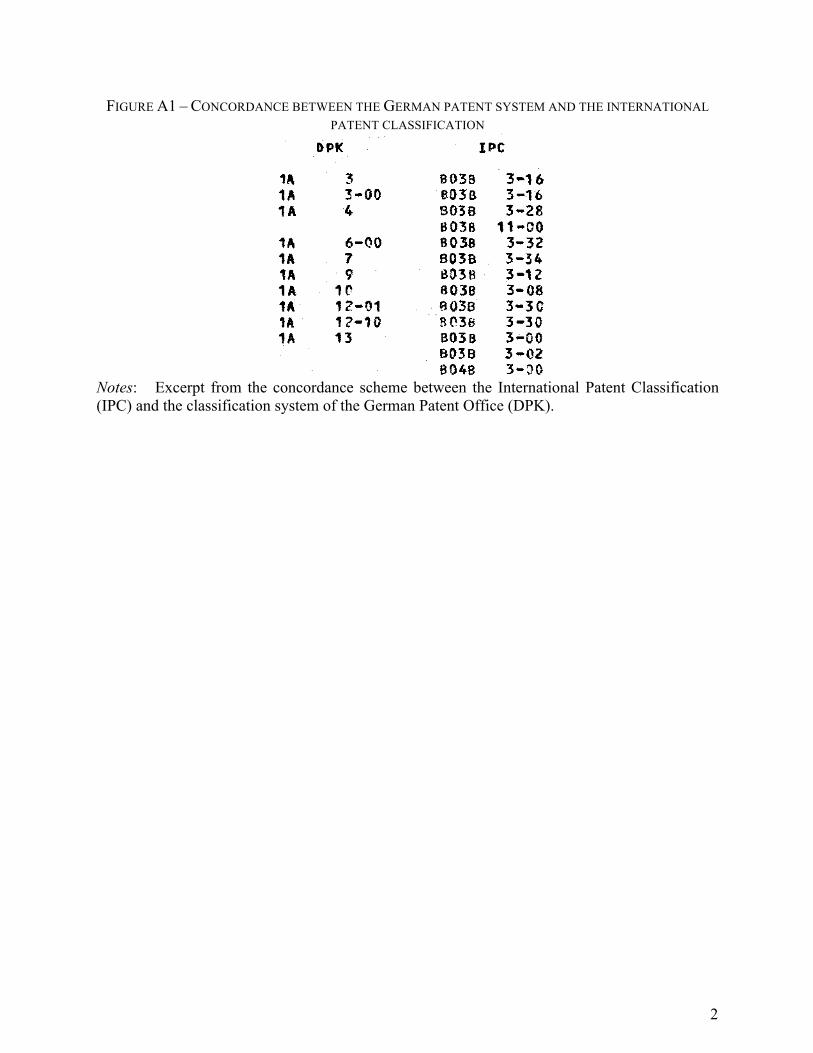
FIGURE A1 – CONCORDANCE BETWEEN THE GERMAN PATENT SYSTEM AND THE INTERNATIONAL PATENT CLASSIFICATION
Notes: Excerpt from the concordance scheme between the International Patent Classification (IPC) and the classification system of the German Patent Office (DPK).
DPK IPC
1A 1A 1A
1A 1A 1A 1A 1A 1A 1A
1A 1A 1A 1A
1A
1A
1A
1A
1A 1A 1A 1A
1A 1A 1A
1A 1A 1A 1A 1A 1A 1A 1A 1A 1A
1A
1A 1B 1B
1B, 1B
3 3 - 0 0 4
6 - 0 0 7 9
10 1 2 - 0 1 1 2 - 1 0 13
1 3 - 0 0 15 1 5 - 0 0 1 6 - 0 1
1 6 - 1 0
17
18
19
1 9 - 0 0 2 0 - 0 1 2 0 - 1 0
. 2 8 - 0 1
2 8 - 2 0 30 31
32 3 2 - 0 0 33 34 35 3 5 - 0 0 36 37 38 40
40 -CO.
41 1 1 - 0 0
? 3
B03B B03S S03B 803B 803B B03B B03B 803B B038 B03B B03B B03B B04B B03B
' B01D B010 B01D B01D eoiü B01D BDI D B01-D B01D B01D B01D B01D B01D S01D 601 D BÜ1D 8 07B B 078 B07B' B07B B07B 807B B07C B07C B47C B07C 807C B03B B03B 802C B02C BC5H BÖ3B B03B 803B B03B 803B BÖ3B R03B B03B 8C3C B03C B03C C21B 803 C t*C3C
3 - 1 6 3 - 1 6 3 - 2 8
1 1 - 0 0 3 - 3 2 3 - 3 4 3 - 1 2 3 - 0 8 3 - 3 C 3 - 3 0 3 - 0 0 3 - 0 2 3 - 0 0 3 - 0 0
2 1 - 0 0 2 1 - 0 0 1 7 - 0 8 2 1 - 0 0 2 1 - 0 1 2 1 - 0 2 2 1 - 0 0 3 5 - 0 0 4 3 - 0 0 2 5 - 0 4 3 3 - 3 2 2 1 - 2 6 2 5 - 1 2 2 1 - 0 0 4 7 - 0 0 2 1 - 0 0
1 -04 1 - 1 6 4-1/0 7 - 3 1
1 3 - 0 0 1 3 - 0 4
5 - 0 0 7 - 0 0 5-no
1 3 - 0 0 13-OC
1 - 0 2 1 - 0 4
1 9 - 0 0 1 9 - 0 0
1 -00 9 - 0 0 7-ao 3 - 0 0 9 - 0 4 9 - 0 6 «?-04 9 - 0 6 3-OC 1-00 1 -y / l 1-C2 1 -00 1 - i ' ) A
1 -26
2
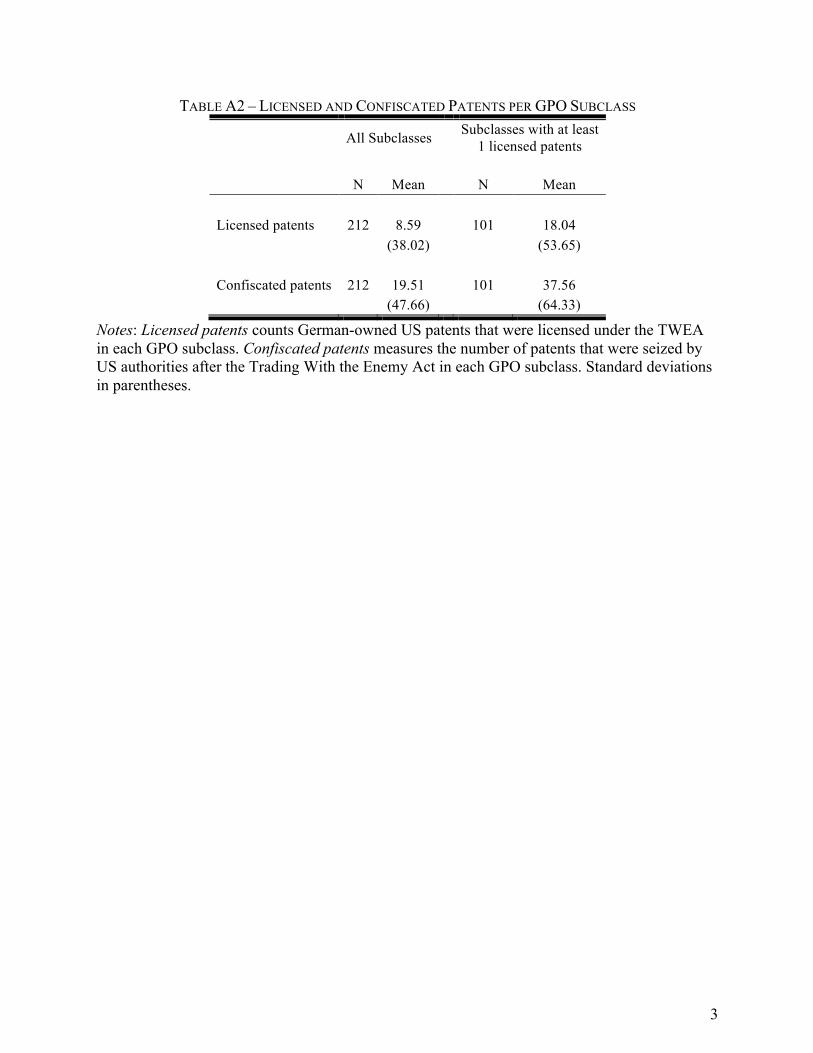
TABLE A2 – LICENSED AND CONFISCATED PATENTS PER GPO SUBCLASS
All Subclasses Subclasses with at least 1 licensed patents
N Mean N Mean
Licensed patents 212 8.59 101 18.04 (38.02) (53.65) Confiscated patents 212 19.51 101 37.56 (47.66) (64.33)
Notes: Licensed patents counts German-owned US patents that were licensed under the TWEA in each GPO subclass. Confiscated patents measures the number of patents that were seized by US authorities after the Trading With the Enemy Act in each GPO subclass. Standard deviations in parentheses.
3
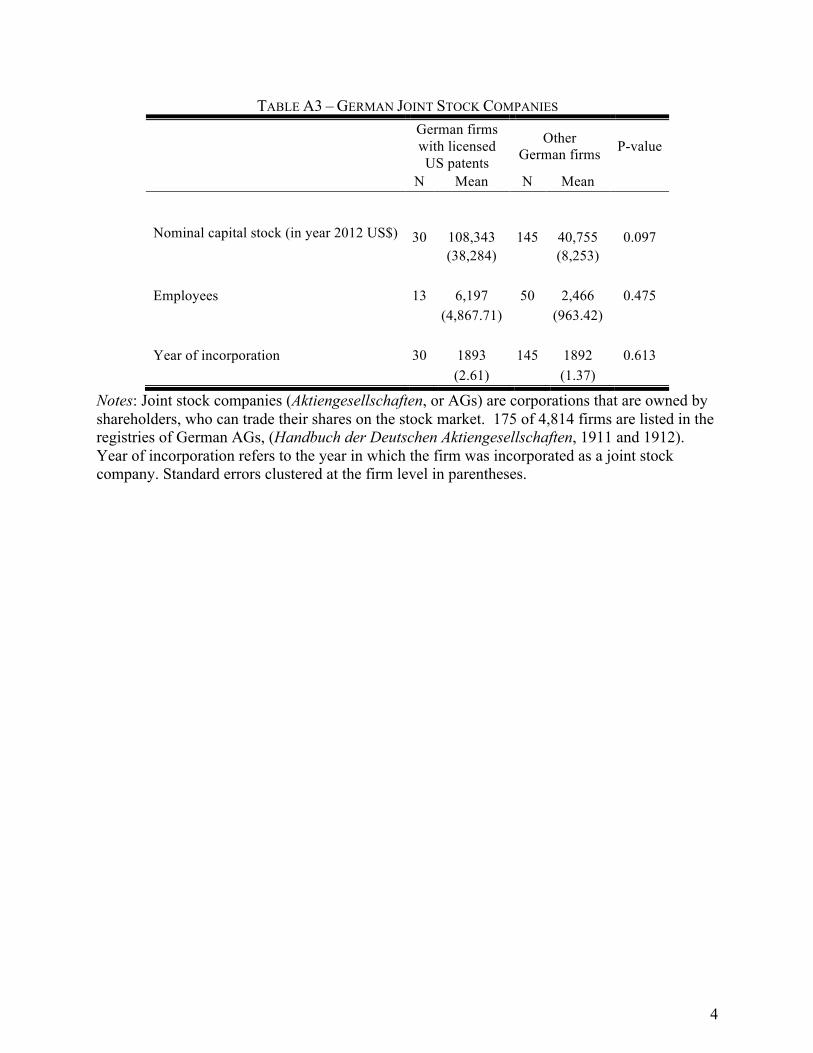
TABLE A3 – GERMAN JOINT STOCK COMPANIES
German firms with licensed US patents
Other German firms P-value
N Mean N Mean
Nominal capital stock (in year 2012 US$)
30
108,343
145
40,755
0.097 (38,284) (8,253) Employees 13 6,197 50 2,466 0.475 (4,867.71) (963.42) Year of incorporation 30 1893 145 1892 0.613 (2.61) (1.37)
Notes: Joint stock companies (Aktiengesellschaften, or AGs) are corporations that are owned by shareholders, who can trade their shares on the stock market. 175 of 4,814 firms are listed in the registries of German AGs, (Handbuch der Deutschen Aktiengesellschaften, 1911 and 1912). Year of incorporation refers to the year in which the firm was incorporated as a joint stock company. Standard errors clustered at the firm level in parentheses.
4
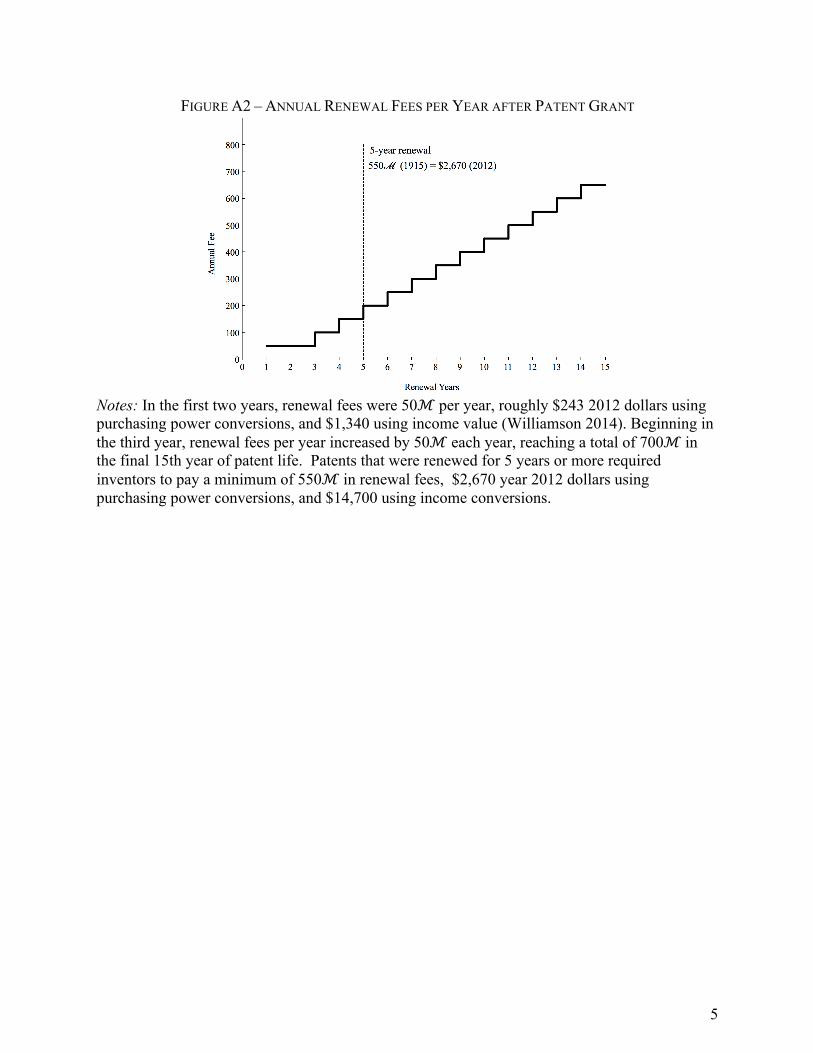
FIGURE A2 – ANNUAL RENEWAL FEES PER YEAR AFTER PATENT GRANT
Notes: In the first two years, renewal fees were 50ℳ per year, roughly $243 2012 dollars using purchasing power conversions, and $1,340 using income value (Williamson 2014). Beginning in the third year, renewal fees per year increased by 50ℳ each year, reaching a total of 700ℳ in the final 15th year of patent life. Patents that were renewed for 5 years or more required inventors to pay a minimum of 550ℳ in renewal fees, $2,670 year 2012 dollars using purchasing power conversions, and $14,700 using income conversions.
5
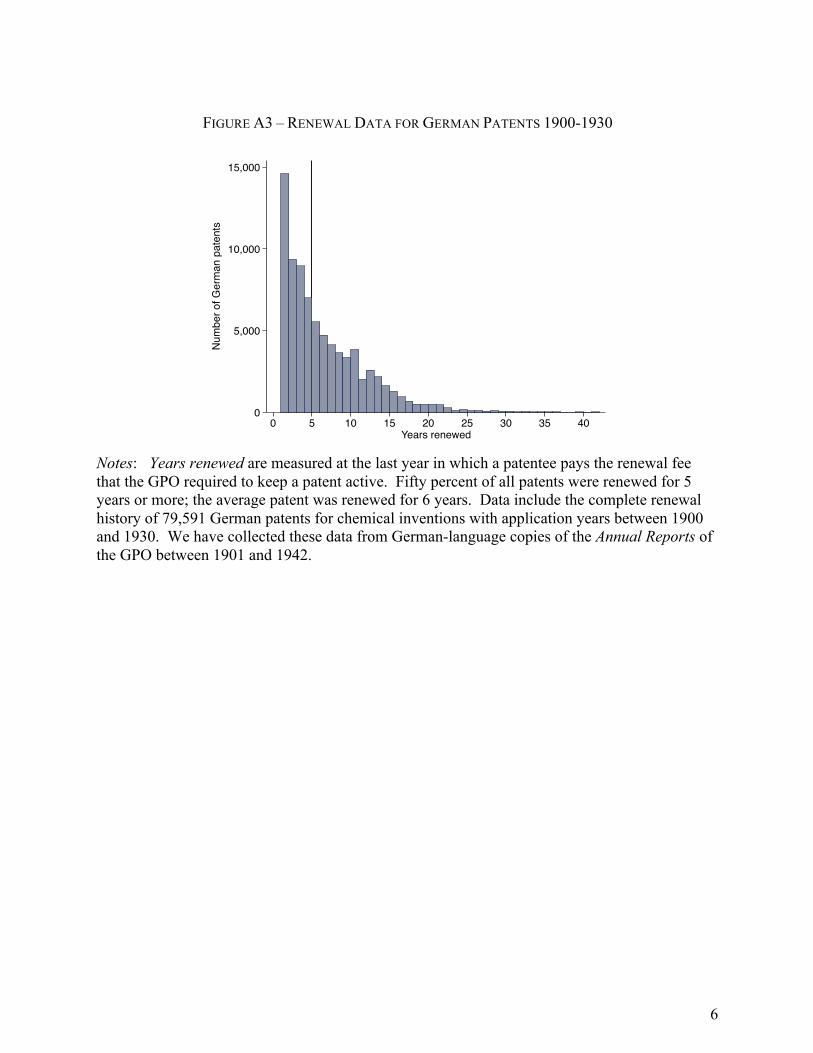
FIGURE A3 – RENEWAL DATA FOR GERMAN PATENTS 1900-1930
Notes: Years renewed are measured at the last year in which a patentee pays the renewal fee that the GPO required to keep a patent active. Fifty percent of all patents were renewed for 5 years or more; the average patent was renewed for 6 years. Data include the complete renewal history of 79,591 German patents for chemical inventions with application years between 1900 and 1930. We have collected these data from German-language copies of the Annual Reports of the GPO between 1901 and 1942.
0
5,000
10,000
15,000
Num
ber o
f Ger
man
pat
ents
0 5 10 15 20 25 30 35 40Years renewed
6
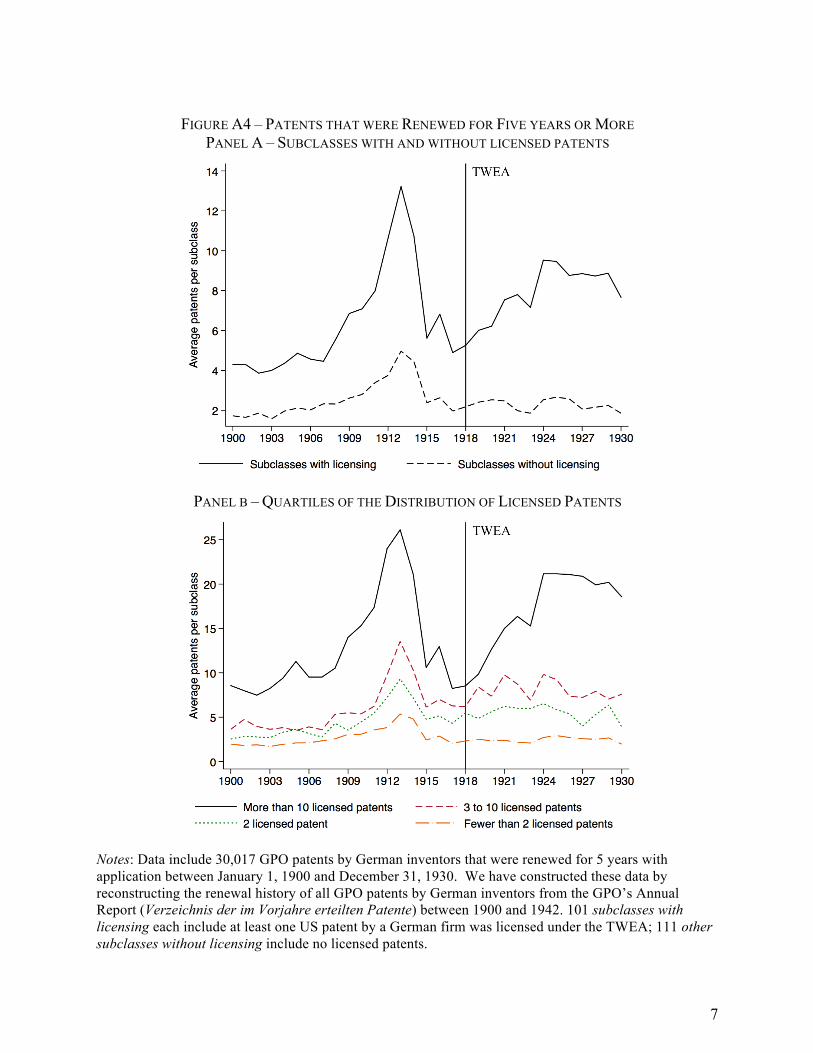
FIGURE A4 – PATENTS THAT WERE RENEWED FOR FIVE YEARS OR MORE
PANEL A – SUBCLASSES WITH AND WITHOUT LICENSED PATENTS
PANEL B – QUARTILES OF THE DISTRIBUTION OF LICENSED PATENTS
Notes: Data include 30,017 GPO patents by German inventors that were renewed for 5 years with application between January 1, 1900 and December 31, 1930. We have constructed these data by reconstructing the renewal history of all GPO patents by German inventors from the GPO’s Annual Report (Verzeichnis der im Vorjahre erteilten Patente) between 1900 and 1942. 101 subclasses with licensing each include at least one US patent by a German firm was licensed under the TWEA; 111 other subclasses without licensing include no licensed patents.
7
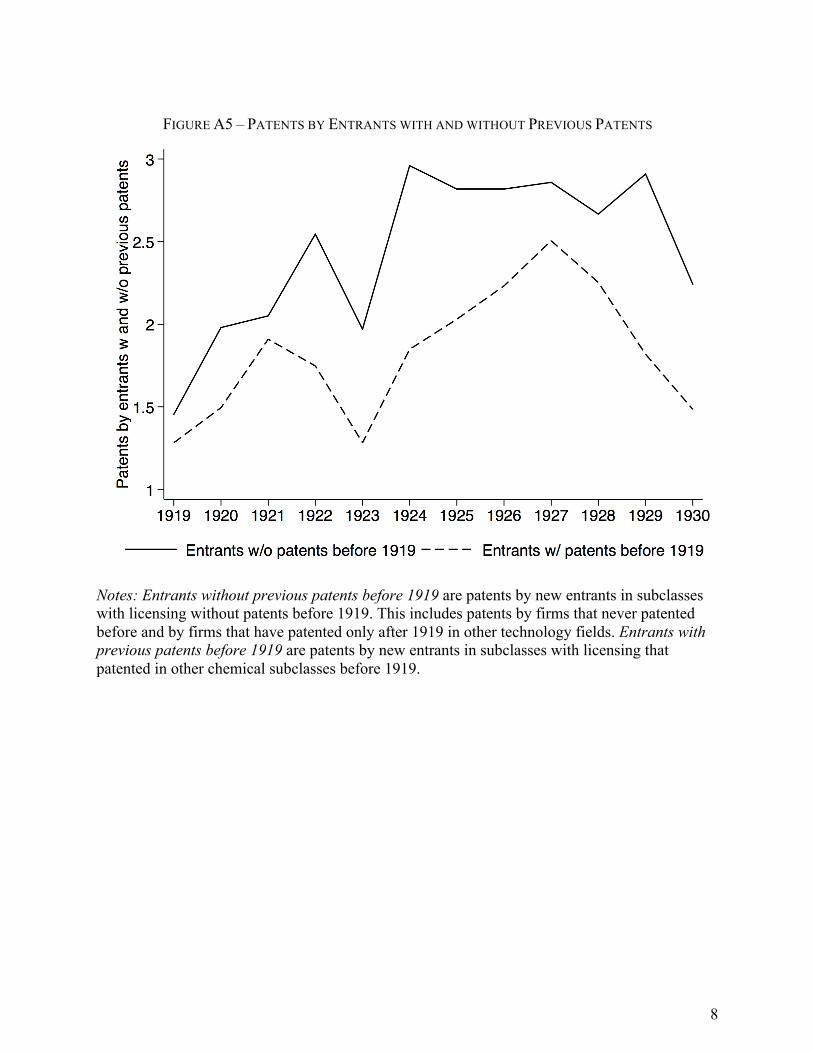
FIGURE A5 – PATENTS BY ENTRANTS WITH AND WITHOUT PREVIOUS PATENTS
Notes: Entrants without previous patents before 1919 are patents by new entrants in subclasses with licensing without patents before 1919. This includes patents by firms that never patented before and by firms that have patented only after 1919 in other technology fields. Entrants with previous patents before 1919 are patents by new entrants in subclasses with licensing that patented in other chemical subclasses before 1919.
8
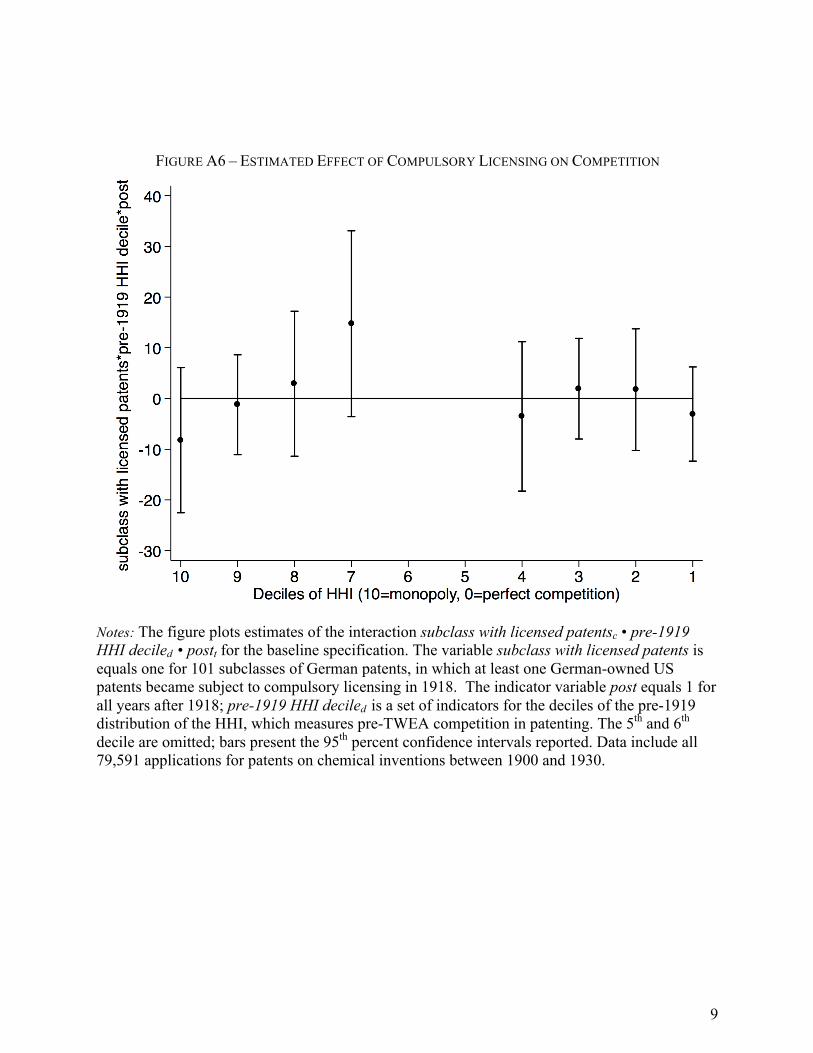
FIGURE A6 – ESTIMATED EFFECT OF COMPULSORY LICENSING ON COMPETITION
Notes: The figure plots estimates of the interaction subclass with licensed patentsc • pre-1919 HHI deciled • postt for the baseline specification. The variable subclass with licensed patents is equals one for 101 subclasses of German patents, in which at least one German-owned US patents became subject to compulsory licensing in 1918. The indicator variable post equals 1 for all years after 1918; pre-1919 HHI deciled is a set of indicators for the deciles of the pre-1919 distribution of the HHI, which measures pre-TWEA competition in patenting. The 5th and 6th decile are omitted; bars present the 95th percent confidence intervals reported. Data include all 79,591 applications for patents on chemical inventions between 1900 and 1930.
9
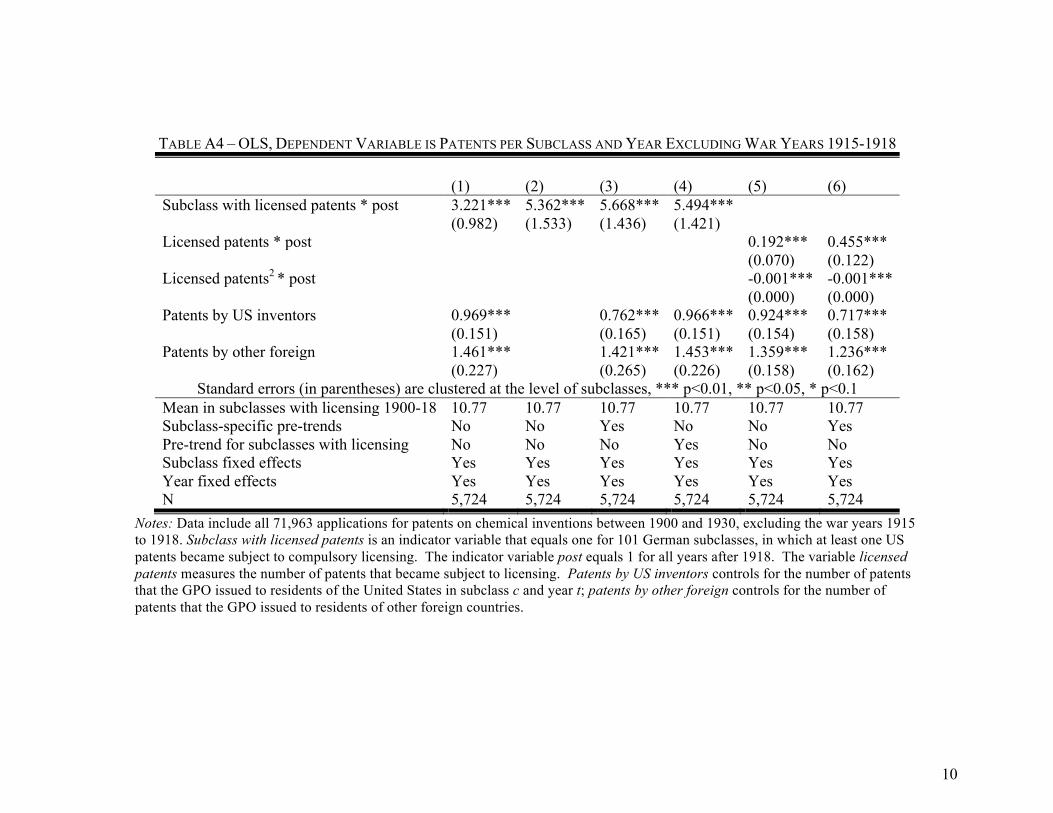
TABLE A4 – OLS, DEPENDENT VARIABLE IS PATENTS PER SUBCLASS AND YEAR EXCLUDING WAR YEARS 1915-1918
(1) (2) (3) (4) (5) (6) Subclass with licensed patents * post 3.221*** 5.362*** 5.668*** 5.494*** (0.982) (1.533) (1.436) (1.421) Licensed patents * post
0.192*** 0.455***
(0.070) (0.122)
Licensed patents2 * post
-0.001*** -0.001***
(0.000) (0.000)
Patents by US inventors 0.969***
0.762*** 0.966*** 0.924*** 0.717***
(0.151)
(0.165) (0.151) (0.154) (0.158) Patents by other foreign 1.461***
1.421*** 1.453*** 1.359*** 1.236***
(0.227)
(0.265) (0.226) (0.158) (0.162) Standard errors (in parentheses) are clustered at the level of subclasses, *** p<0.01, ** p<0.05, * p<0.1
Mean in subclasses with licensing 1900-18 10.77 10.77 10.77 10.77 10.77 10.77 Subclass-specific pre-trends No No Yes No No Yes Pre-trend for subclasses with licensing No No No Yes No No Subclass fixed effects Yes Yes Yes Yes Yes Yes Year fixed effects Yes Yes Yes Yes Yes Yes N 5,724 5,724 5,724 5,724 5,724 5,724
Notes: Data include all 71,963 applications for patents on chemical inventions between 1900 and 1930, excluding the war years 1915 to 1918. Subclass with licensed patents is an indicator variable that equals one for 101 German subclasses, in which at least one US patents became subject to compulsory licensing. The indicator variable post equals 1 for all years after 1918. The variable licensed patents measures the number of patents that became subject to licensing. Patents by US inventors controls for the number of patents that the GPO issued to residents of the United States in subclass c and year t; patents by other foreign controls for the number of patents that the GPO issued to residents of other foreign countries.
10
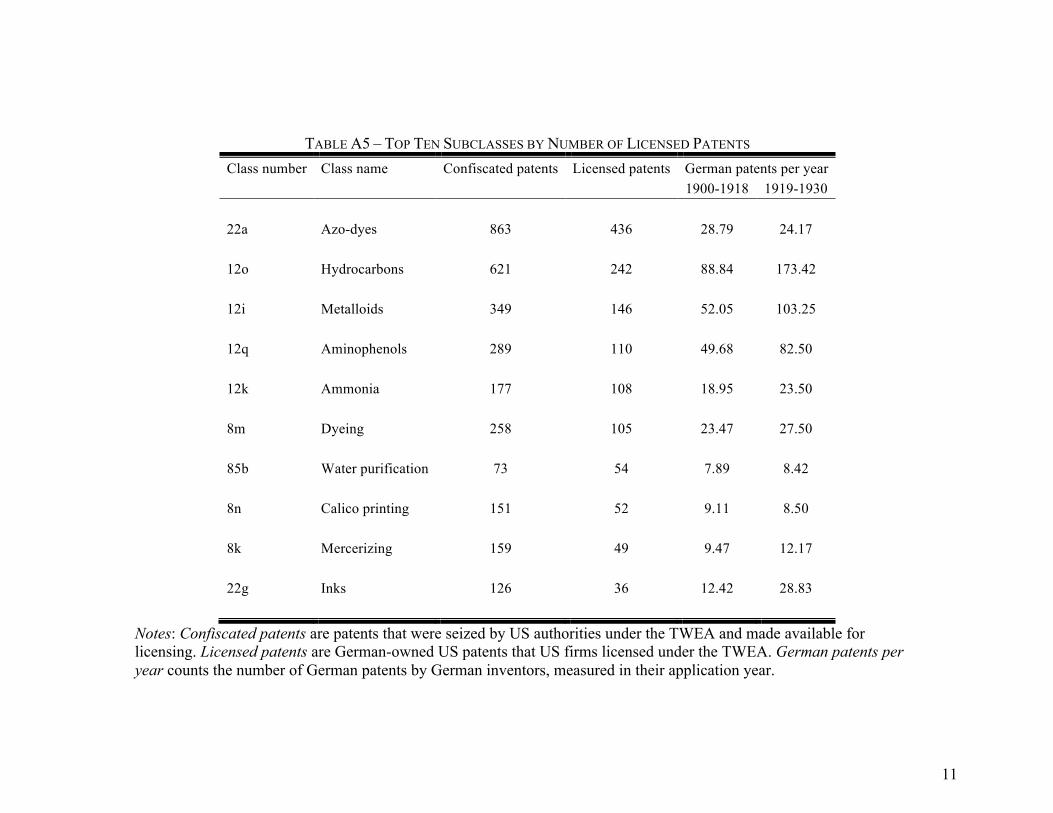
TABLE A5 – TOP TEN SUBCLASSES BY NUMBER OF LICENSED PATENTS Class number Class name Confiscated patents Licensed patents German patents per year 1900-1918 1919-1930 22a Azo-dyes 863 436 28.79 24.17 12o Hydrocarbons 621 242 88.84 173.42 12i Metalloids 349 146 52.05 103.25
12q Aminophenols 289 110 49.68 82.50 12k Ammonia 177 108 18.95 23.50 8m Dyeing 258 105 23.47 27.50 85b Water purification 73 54 7.89 8.42 8n Calico printing 151 52 9.11 8.50 8k Mercerizing 159 49 9.47 12.17 22g Inks 126 36 12.42 28.83
Notes: Confiscated patents are patents that were seized by US authorities under the TWEA and made available for licensing. Licensed patents are German-owned US patents that US firms licensed under the TWEA. German patents per year counts the number of German patents by German inventors, measured in their application year.
11
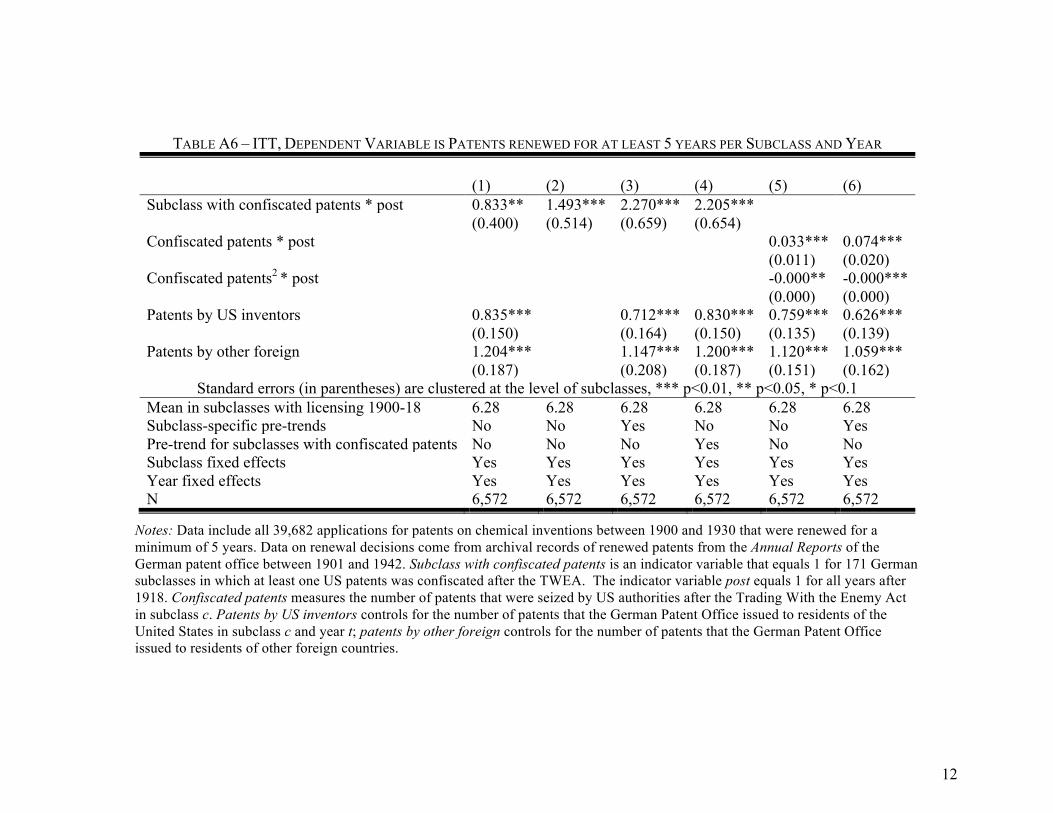
TABLE A6 – ITT, DEPENDENT VARIABLE IS PATENTS RENEWED FOR AT LEAST 5 YEARS PER SUBCLASS AND YEAR
(1) (2) (3) (4) (5) (6) Subclass with confiscated patents * post 0.833** 1.493*** 2.270*** 2.205***
(0.400) (0.514) (0.659) (0.654) Confiscated patents * post
0.033*** 0.074***
(0.011) (0.020)
Confiscated patents2 * post
-0.000** -0.000***
(0.000) (0.000)
Patents by US inventors 0.835***
0.712*** 0.830*** 0.759*** 0.626***
(0.150)
(0.164) (0.150) (0.135) (0.139) Patents by other foreign 1.204***
1.147*** 1.200*** 1.120*** 1.059***
(0.187)
(0.208) (0.187) (0.151) (0.162) Standard errors (in parentheses) are clustered at the level of subclasses, *** p<0.01, ** p<0.05, * p<0.1
Mean in subclasses with licensing 1900-18 6.28 6.28 6.28 6.28 6.28 6.28 Subclass-specific pre-trends No No Yes No No Yes Pre-trend for subclasses with confiscated patents No No No Yes No No Subclass fixed effects Yes Yes Yes Yes Yes Yes Year fixed effects Yes Yes Yes Yes Yes Yes N 6,572 6,572 6,572 6,572 6,572 6,572
Notes: Data include all 39,682 applications for patents on chemical inventions between 1900 and 1930 that were renewed for a minimum of 5 years. Data on renewal decisions come from archival records of renewed patents from the Annual Reports of the German patent office between 1901 and 1942. Subclass with confiscated patents is an indicator variable that equals 1 for 171 German subclasses in which at least one US patents was confiscated after the TWEA. The indicator variable post equals 1 for all years after 1918. Confiscated patents measures the number of patents that were seized by US authorities after the Trading With the Enemy Act in subclass c. Patents by US inventors controls for the number of patents that the German Patent Office issued to residents of the United States in subclass c and year t; patents by other foreign controls for the number of patents that the German Patent Office issued to residents of other foreign countries.
12
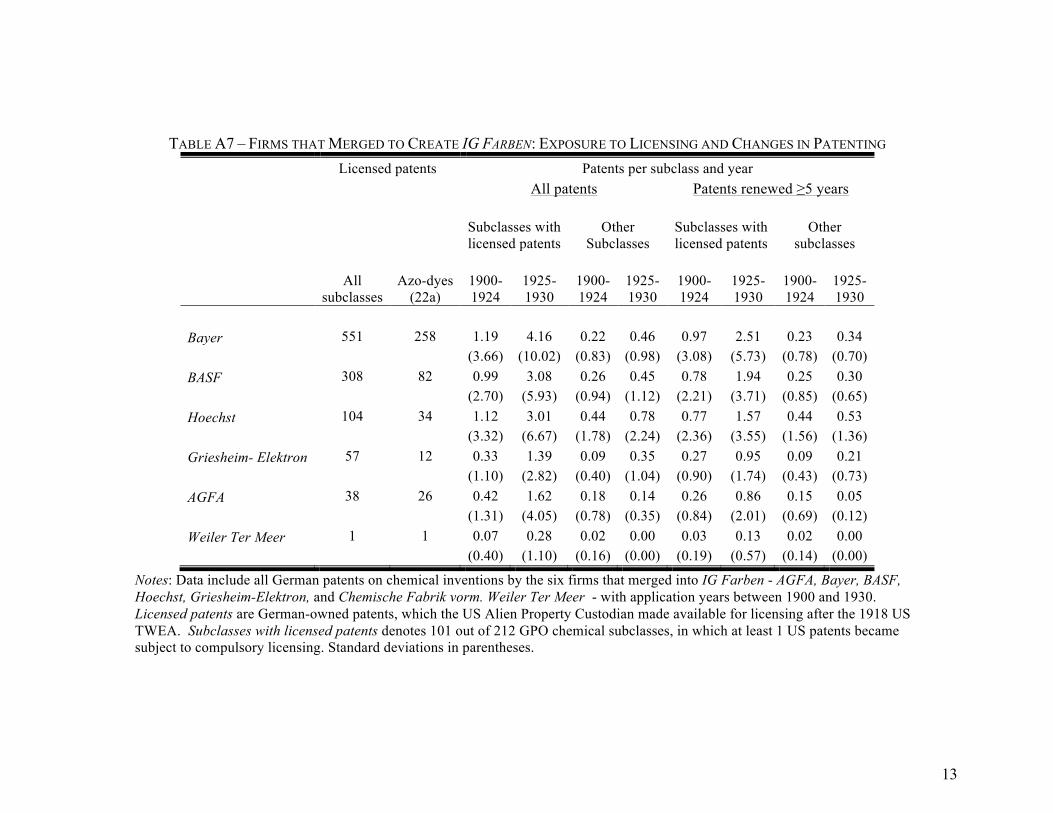
TABLE A7 – FIRMS THAT MERGED TO CREATE IG FARBEN: EXPOSURE TO LICENSING AND CHANGES IN PATENTING Licensed patents Patents per subclass and year All patents Patents renewed ≥5 years
Subclasses with licensed patents
Other Subclasses
Subclasses with licensed patents
Other subclasses
All subclasses
Azo-dyes (22a)
1900- 1924
1925- 1930
1900- 1924
1925- 1930
1900- 1924
1925- 1930
1900- 1924
1925- 1930
Bayer 551 258 1.19 4.16 0.22 0.46 0.97 2.51 0.23 0.34 (3.66) (10.02) (0.83) (0.98) (3.08) (5.73) (0.78) (0.70) BASF 308 82 0.99 3.08 0.26 0.45 0.78 1.94 0.25 0.30 (2.70) (5.93) (0.94) (1.12) (2.21) (3.71) (0.85) (0.65) Hoechst 104 34 1.12 3.01 0.44 0.78 0.77 1.57 0.44 0.53 (3.32) (6.67) (1.78) (2.24) (2.36) (3.55) (1.56) (1.36) Griesheim- Elektron 57 12 0.33 1.39 0.09 0.35 0.27 0.95 0.09 0.21 (1.10) (2.82) (0.40) (1.04) (0.90) (1.74) (0.43) (0.73) AGFA 38 26 0.42 1.62 0.18 0.14 0.26 0.86 0.15 0.05
(1.31) (4.05) (0.78) (0.35) (0.84) (2.01) (0.69) (0.12)
Weiler Ter Meer 1 1 0.07 0.28 0.02 0.00 0.03 0.13 0.02 0.00
(0.40) (1.10) (0.16) (0.00) (0.19) (0.57) (0.14) (0.00)
Notes: Data include all German patents on chemical inventions by the six firms that merged into IG Farben - AGFA, Bayer, BASF, Hoechst, Griesheim-Elektron, and Chemische Fabrik vorm. Weiler Ter Meer - with application years between 1900 and 1930. Licensed patents are German-owned patents, which the US Alien Property Custodian made available for licensing after the 1918 US TWEA. Subclasses with licensed patents denotes 101 out of 212 GPO chemical subclasses, in which at least 1 US patents became subject to compulsory licensing. Standard deviations in parentheses.
13

TABLE A8 – EXCLUDING DATA AFTER 1924, PATENTS RENEWED FOR AT LEAST 5 YEARS PER FIRM, SUBCLASS, AND YEAR
(1) (2) (3) (4) Subclass w licensed patents * firm w licensed patents * post 0.130** 0.125** 0.164 0.130** (0.052) (0.052) (0.000) (0.052) Subclass w licensed patents * post 0.014** 0.028*** 0.015 0.014** (0.006) (0.007) (0.000) (0.006) Patents by US inventors 0.002
0.001 0.002*
(0.001)
(0.000) (0.001) Patents by other foreign 0.003***
0.003 0.003***
(0.001)
(0.000) (0.001) Patents by individuals 0.003*** 0.003 0.003*** (0.000) (0.000) (0.000)
Standard errors (in parentheses) are clustered at the level of firms, *** p<0.01, ** p<0.05, * p<0.1 Mean for firms with licensed patents, 1900-18 0.46 0.46 0.46 0.46 Subclass-specific pre-trends No No Yes No Pre-trend for firms with licensing No No No Yes Subclass fixed effects Yes Yes Yes Yes Firm fixed effects Yes Yes Yes Yes Year fixed effects Yes Yes Yes Yes N (Subclass-firm-year) 132,425 132,425 132,425 132,425
Notes: Regressions also include firms w licensed patents * post, licensed patents * firms w licensed patents, and subclass w licensed patents * firms w licensed patents. Data include GPO patents for chemicals with application years between 1900 and 1924 that were renewed for a minimum of 5 years. Data on renewal decisions come from the Annual Reports of the GPO between 1901 and 1942. Firm w licensed patents equals 1 for 50 German firms that owned at least 1 US patents that became subject to compulsory licensing. The indicator variable post equals 1 for years after 1918. Subclass w licensed patents is an indicator variable that equals 1 for 101 German subclasses, in which at least 1 US patents became subject to compulsory licensing. Patents by US inventors controls for GPO patents to US residents in subclass c and year t; patents by other foreign and patents by individual inventors control for GPO patents to other foreign and individual (non-firm) inventors, respectively.
14