patents and cumulative innovation causal evidence from the courts
DESCRIPTION
Cumulative innovation is central to economic growth. Do patent rights facilitate or impede follow-on innovation? We study the causal effect of removing patent rights by court invalidation on subsequent research related to the focal patent, as measured by later citations. We exploit random allocation of judges at the U.S. Court of Appeals for the Federal Circuit to control for endogeneity of patent invalidation. Patent invalidation leads to a 50 percent increase in citations to the focal patent, on average, but the impact is heterogeneous and depends on characteristics of the bargaining environment. Patent rights block downstream innovation in computers, electronics and medical instruments, but not in drugs, chemicals or mechanical technologies. Moreover, the effect is entirely driven by invalidation of patents owned by large patentees that triggers more follow-on innovation by small firms.TRANSCRIPT
Working Paper Series
No. 15005
Patents and Cumulative Innovation Causal Evidence from the Courts
Alberto Galasso University of Toronto and National Bureau of Economic Research
Mark Schankerman
London School of Economics and Political Science
September 14, 2014
Hoover Institution Working Group on Intellectual Property, Innovation, and Prosperity
Stanford University
www.hooverip2.org
PATENTS AND CUMULATIVE INNOVATION: CAUSAL
EVIDENCE FROM THE COURTS ∗
Alberto Galasso†and Mark Schankerman‡
September 14, 2014
Abstract
Cumulative innovation is central to economic growth. Do patent rights facilitate orimpede follow-on innovation? We study the causal effect of removing patent rights bycourt invalidation on subsequent research related to the focal patent, as measured by latercitations. We exploit random allocation of judges at the U.S. Court of Appeals for theFederal Circuit to control for endogeneity of patent invalidation. Patent invalidation leadsto a 50 percent increase in citations to the focal patent, on average, but the impact isheterogeneous and depends on characteristics of the bargaining environment. Patent rightsblock downstream innovation in computers, electronics and medical instruments, but notin drugs, chemicals or mechanical technologies. Moreover, the effect is entirely driven byinvalidation of patents owned by large patentees that triggers more follow-on innovation bysmall firms.
1 Introduction
Cumulative research is a dominant feature of modern innovation. New genetically modified
crops, computers, memory chips, medical instruments and many other modern innovations
are typically enhancements of prior generations of related technologies. Of course, cumulative
innovation is not new. Economic historians have emphasized the role of path dependence in
∗We are grateful to the Editors and four anonymous referees for very detailed and constructive suggestions.We also benefitted from comments by Alfonso Gambardella, John Golden, Dietmar Harhoff, Emeric Henry,Nicola Lacetera, Bhaven Sampat, David Schwartz, Carlos Serrano, Scott Stern, John Turner and Heidi Williams.Finally we thank seminar participants at the NBER 2013 Summer Institute, the 2014 EARIE Conference, BenGurion University, Hebrew University of Jerusalem, Northwestern University, Tel Aviv University, UC Berkeley,University of Toronto, University of Texas at Austin, Tilburg University, Hitotsubashi University, University ofWaterloo, University of Bologna and Mines ParisTech. Deepa Agarwal, Faryal Ahmed, William Matcham andJessica Zurawicki provided excellent research assistance. We are grateful for financial support from the Centre forEconomic Policy at the London School of Economics and the Social Sciences and Humanities Research Councilof Canada.
†Corresponding author. University of Toronto, Institute for Management and Innovation, Mississauga Road,Mississauga, ON, Canada, CEPR and NBER. Email: [email protected]
‡London School of Economics and Political Science, Department of Economics, Houghton Street, LondonWC2A 2AE UK and CEPR.
1
the development of technology, documenting how past successes and failures serve as ‘focusing
devices’ that guide the direction of later technological inquiry (Rosenberg [1976]).1 However,
the increasing importance of basic science in shaping the direction of technological development
has intensified this process.
Cumulative innovation, and the knowledge spillovers that underpin it, lie at the heart
of the recent macroeconomic theory literature on innovation and growth. Leading examples of
these endogenous growth models include Grossman and Helpman (1991), Aghion and Howitt
(1992) and Acemoglu and Akcigit (2012). At the same time, there is an extensive empirical
literature showing that R&D creates knowledge spillovers, which increase both productivity
growth and subsequent innovation.2 This consensus on the centrality of knowledge spillovers
to innovation, and innovation to growth, is the primary justification for government R&D-
support policies.
In this paper we study how patent rights affect the process of cumulative innovation.
The patent system is one of the main instruments governments use to increase R&D incentives,
while at the same time promoting follow-on innovation.3 However, there is growing concern
among academic scholars and policy makers that patent rights are themselves becoming an
impediment, rather than an incentive, to innovation. The increasing proliferation of patents,
and the fragmentation of ownership among firms, are believed to raise transaction costs, con-
strain the freedom of action to conduct R&D, and expose firms to ex-post holdup through
patent litigation (Heller and Eisenberg [1998]; Bessen and Maskin [2009]). In the extreme case
where bargaining failure in patent licensing occurs, follow-on innovation can be blocked en-
tirely. These issues are particularly acute in ‘complex technology’ industries where innovation
is highly cumulative and requires the input of a large number of patented components held by
1This cumulative feature is reinforced by the constraints imposed by the prevailing stock of scientific knowledgeon the feasible avenues for technology development (Mokyr [2002]). This is not say that science dictates onlyone path for the development of technology at any point in time. Recent theoretical work emphasizes the roleof diverse research approaches in technological development (Acemoglu [2012]).
2 In a recent paper, Bloom, Schankerman and Van Reenen (2013) show that R&D also creates negative(pecuniary) externalities through product market rivalry which can lead to over-investment in R&D. But theirempirical results confirm that positive externalities dominate, with social returns to R&D exceeding privatereturns, at least on average.
3Specifically, the disclosure provision in patent law (35 U.S.C. Section 112) requires the patent applicant todescribe the invention in order to promote information diffusion and ‘enable’ development of follow-on improve-ments of the original invention.
2
diverse firms. These dangers have been prominently voiced in public debates on patent policy
in the United States (Federal Trade Commission [2011]) and recent decisions by the Supreme
Court (e.g., eBay Inc. v. MercExchange, L.L.C., 547 U.S. 338, 2006).
Economic research on the impact of patent rights on cumulative innovation has been
primarily theoretical. The main conclusion from these studies is that anything can happen —
patent rights may impede, have no effect, or even facilitate subsequent technological develop-
ment. It depends critically on assumptions about the bargaining environment and contracting
efficiency between different generations of innovators. In an early contribution, Kitch (1977)
argues that patents enable an upstream inventor to coordinate investment in follow-on innova-
tion more efficiently and to mitigate rent dissipation from downstream patent races that would
otherwise ensue. This ‘prospecting theory’ suggests that patent rights facilitate cumulative
innovation. In contrast, Green and Scotchmer (1995) show that upstream patent rights will
not impede value-enhancing, follow-on innovation as long as bargaining between the parties is
efficient. This work is important because it focuses our attention on bargaining failure as the
source of any blocking effect patent rights might create. Finally, a number of papers have shown
how patent rights can block innovation when bargaining failure occurs. This can arise from
asymmetric information (Bessen and Maskin [2009]), or coordination failures when downstream
innovators need to license multiple upstream patents (Galasso and Schankerman [2010]).
This diversity of theoretical models highlights the need for empirical research. It is
important not only to establish whether patent rights block subsequent innovation, but also to
identify how this effect depends on the characteristics of the bargaining environment and the
transacting parties. These issues are central to an understanding on how patent rights affect
the dynamics of the ‘industrial organization’ of innovation.
There are two empirical challenges in studying the effect of patents on cumulative inno-
vation. First, cumulativeness is difficult to measure directly. In this paper we primarily follow
the large empirical literature that uses citations by later patents as a way to trace knowl-
edge spillovers (for a survey, see Griliches [1992]). While not perfect, this is the only feasible
approach if one wants to study the impact of patent rights across diverse technology fields
as we do in this paper. Nonetheless, we also show that our results are robust to alternative
measures of cumulative innovation in the technology fields of drugs and medical instruments,
where data on new product developments are publicly available due to government regulation
3
that requires public registration. The second problem in identifying the causal effect of patent
rights on later innovation is the endogeneity of patent protection. For example, technologies
with greater commercial potential are both more likely to be protected by patents and to be
an attractive target for follow-on innovation.
Given the importance of the issue, there is surprisingly little econometric evidence on the
link between patent rights and cumulative innovation. In two influential papers, Murray and
Stern (2007) and Williams (2013) provide the first causal evidence that intellectual property
rights block later research in the biomedical field. Murray and Stern exploit patent-paper
pairs to study how citations to scientific papers are affected when a patent is granted on the
associated invention. Williams studies the impact of intellectual property on genes sequenced
by the private firm Celera on subsequent human genome research and product development.
Interestingly, both papers find roughly similar magnitudes — property rights appear to cause
about a 20-40 percent reduction in follow-on research. These important studies focus on very
specific (albeit significant) innovations in human genome and biomedical research. It is hard
to know whether their conclusions generalize to other industries, and whether the effect varies
across different types of patentees and later innovators. Understanding how the blocking effect
of patents varies across technology fields and patent owners is essential for thinking about how
best to design the strength and scope of patent protection.
In this paper we adopt a novel identification strategy to estimate the causal effect of
patent protection on cumulative innovation. We use the patent invalidity decisions of the
U.S. Court of Appeal for the Federal Circuit, which was established in 1982 and has exclusive
jurisdiction in appellate cases involving patents. It is a fortunate institutional fact that judges
are assigned to patent cases through a computer program that randomly generates three-judge
panels, with decisions governed by majority rule. We exploit this random allocation of judges,
together with variation in their propensity to invalidate patents, to construct an instrumental
variable which addresses the potential endogeneity of invalidity decisions. Because patents
constitute prior art, later applicants are still required to cite patents when relevant even if they
have been invalidated and thus put into the public domain. This allows us to examine how
invalidation of a patent affects the rate of subsequent citations to that patent.
Patents that reach the Federal Circuit are a selective sample of highly valuable patents.
To cite one example, in August 2006 the Federal Circuit invalidated one of Pfizer’s key patents
4
required for the production of the cholesterol-lowering drug Lipitor, the largest-selling drug in
the world. Our reliance on privately valuable patents to estimate the effect of patent rights
on cumulative innovation is similar to Azoulay, Graff Zivin and Wang (2007) who rely on
the death of superstar scientists to estimate the magnitude of knowledge spillovers. It is
reasonable to start by analyzing high value patents rather than a random sample of patents,
not least because we know that the distribution of patent values is highly skewed (Schankerman
and Pakes [1986]) and policy should be most concerned about the potential blocking of later
innovation that builds on these valuable patents, where the potential welfare costs are likely to
be larger.
There are three main empirical findings in the paper. First, we show that patent in-
validation leads to about a 50 percent increase in subsequent citations to the focal patent,
on average and that this finding is robust to a wide variety of alternative specifications and
controls. Moreover, we show that this impact begins only after two years following the court
decision, which is consistent with the entry of new downstream innovators, but is not consistent
with the alternative explanation that the increase in citations is simply driven by a publicity
effect from the court’s decision.
Second, we find that the impact of patent invalidation on subsequent innovation is highly
heterogeneous. For most patents, the marginal treatment effect of invalidation is not statisti-
cally different from zero. The positive impact of invalidation on citations is concentrated on
a small subset of patents which have unobservable characteristics that are associated with a
lower probability of invalidity (i.e., stronger patents). There is also large variation across broad
technology fields in the impact of patent invalidation and the effect is concentrated in fields
that are characterized by two features: complex technology and high fragmentation of patent
ownership. This finding is consistent with predictions of the theoretical models that emphasize
bargaining failure in licensing as the source of blockage. Patent invalidation has a significant
impact on cumulative innovation only in the fields of computers and communications, electron-
ics, and medical instruments (including biotechnology). We find no effect for drugs, chemicals,
or mechanical technologies. Moreover, for two of the technology fields we study — medical
instruments and drugs — we are able to construct alternative measures of cumulative innova-
tion that exploit data on publicly-disclosed new product developments. The results confirm
our findings using citations: patent invalidation has a significant effect on later innovation in
5
medical instruments but no effect in pharmaceuticals.
Lastly, we show that the effect of patent rights on later innovation depends critically on
the characteristics of the transacting parties. The impact is entirely driven by the invalidation of
patents owned by large firms, which increases the number of small innovators subsequently cit-
ing the focal patent. We find no statistically significant effect of patent rights on later citations
when the invalidated patents are owned by small or medium sized firms. This result suggests
that bargaining failure between upstream and downstream innovators is not widespread, but
is concentrated in cases involving large patentees and small downstream innovators.
Taken together, our findings indicate that patent rights block cumulative innovation only
in very specific environments and this suggests that government policies should be targeted at
facilitating more efficient licensing in those environments. However, we want to emphasize that
the ‘experiment’ in this paper involves the judicial removal of an existing patent right. In
Section 8 we discuss some of the conceptual differences between our setting and an alternative
thought experiment in which patent rights are not granted in the first place. We will argue
that these two regimes differ in term of the underlying incentives for the rate and direction of
innovation, and in the capability of patents to serve as an informational signal that facilitates
access to capital markets, especially for small firms.
The paper is organized as follows. In Section 2 we present a simple model that character-
izes conditions under which patents facilitate, block or have no effect on follow-on innovation.
The model highlights the key role of bargaining failure between upstream and downstream
innovators, and coordination failure among competing downstream innovators. Section 3 de-
scribes the data set. In Section 4 we develop the baseline econometric model for estimating
the causal effect of patent rights and present the empirical results. In Section 5 we extend
the analysis to allow for heterogenous marginal treatment effects, and empirically link them to
characteristics of the patent case. Section 6 shows how the effect of patent invalidation depends
on the characteristics of the patentee and later citing innovators. In addition, we decompose
the overall effect into an extensive margin (number of later citing firms) and an intensive mar-
gin (number of later citing patents per firm). Section 7 examines the robustness of our findings
to using measures of downstream innovation that do not depend on patent citations. Section
8 discusses the interpretation and implications of the empirical findings. We conclude with a
brief summary of findings. Details of data construction and extensive robustness analysis are
6
included in a set of (online) Appendices.
2 Analytical Framework
The granting of patent rights involves a basic trade-off between ex ante incentives and ex post
efficiency. The market power conferred by a patent increases innovation incentives, but also
reduces total surplus due to higher prices. This trade-off is well understood in the innovation
literature. However, patents can also create a dynamic cost by blocking valuable sequential
innovation, in cases where a second generation firm requires a license on the earlier technology
and the bargaining between the two parties fails. In this section we present a simple analytical
framework that characterizes conditions under which patents are likely to block, facilitate or
have no effect, on follow-on investment, and we use the framework to organize the different
theoretical models in the literature. The key feature in our framework is a trade-off between
bargaining failure due to asymmetric information, which impedes licensing when there is an
upstream patent, and coordination failure among downstream innovators which reduces their
incentives to invest in the absence of patent rights.
There is one upstream technology, and one potential downstream innovation. The value
of the downstream technology can be high or low, which we denote by λ ∈{λ, λ
}with λ < λ.
There are two identical potential downstream inventors. To develop the follow-on technology
an innovator needs to sustain a cost equal to S. We make the following assumptions:
Assumption 1: Downstream innovators know the value of the follow-on technology.
The owner of the upstream technology assigns probability Pr(λ = λ) = α that the downstream
technology has high value.
Assumption 2: λ/2− S < 0 for λ ∈{λ, λ
}.
As in Galasso and Schankerman (2010), Assumption 1 generates an asymmetric infor-
mation problem by restricting the knowledge of the upstream patentee on the value of the
downstream innovation. Assumption 2 creates a coordination problem by making it unprof-
itable for both downstream innovators to invest, as in Bolton and Farrell (1990). We contrast
the case in which the upstream technology is not patented and the case in which there is patent
protection. The crucial difference between the two cases is that without a patent on the up-
stream technology the follow-on innovators can freely decide whether to invest in downstream
7
innovation. In contrast, with patent protection on the upstream technology, a licensing deal is
required.
No patent on the upstream technology
In the absence of upstream protection, each of the follow-on innovators chooses independently
whether to invest or not. We assume that in the absence of investment an innovator obtains
a payoff equal to 0. If the innovator is the only one to develop the follow-on innovation, the
payoff of the innovator is λ − S > 0 with λ ∈{λ, λ
}. This payoff captures the idea that the
follow-on innovator is the patentee of the second generation technology and appropriates the
entire value. We assume that, if both innovators invest, each of them obtains the patent with
probability 1/2 so their expected payoffs will be λ/2− S < 0 with λ ∈{λ, λ
}.
There are two asymmetric pure strategies Nash equilibria in which one of the two follow-
on innovators invests and the other does not invest. The literature on economic coordination
suggests that these asymmetric pure-strategy equilibria are unconvincing in a symmetric setting
like ours. For example, Crawford and Haller (1990) formally show that it is inappropriate to
focus on asymmetric pure-strategy equilibria because it is not clear how players find one of
those equilibria. Therefore, we follow Bolton and Farrell (1990) and focus on the symmetric
mixed strategy equilibrium. Each innovator invests with probability p(λ) = 2(λ − S)/λ with
λ ∈{λ, λ
}. This implies that follow-on innovation takes place with probability 1− (1− p(λ))2
if the second generation technology has high value, and probability 1 − (1 − p(λ))2 if the
downstream technology has low value. Thus the expected level of follow-on innovation is
INOP = α
(1− (
2S − λ
λ)2)+ (1− α)
(1− (
2S − λ
λ)2). (1)
Patent on the upstream technology
If the upstream technology is protected by a patent, the patentee can potentially block down-
stream innovation. Patentability of the follow-on technology induces the owner of the base
technology to license it to only one of the two downstream innovators. We assume that the
patentee makes a take-it-or-leave it offer to the follow-on innovator.4 A licensing fee equal to
4Following the literature on decentralization, we assume that the patentee can only make one offer and thathe cannot implement more sophisticated mechanisms, as in Cremer and McLean (1985), to extract informationfrom the follow-on innovators.
8

λ − S will be accepted both when the value of the downstream innovation is high as well as
when the value is low. A fee equal to λ− S will be accepted only when the second generation
technology has high value. Notice that in expectation it is more profitable to offer λ − S if
α(λ− S) ≥ λ− S, i.e. when α ≥ α̂ ≡ (λ− S)/(λ− S).
This implies that, with patent protection on the upstream technology, the expected level
of downstream innovation occurs is
IP =
{1 if α ≤ α̂α if α > α̂
. (2)
Comparison of the two regimes
Proposition 1 compares the expected level of downstream innovation with and without patent
rights on the upstream technology.
Proposition 1 For λ large enough there exists α′ > α̂ such that INOP > IP if α̂ < α < α′
and IP > INOP if α > α′ or α < α̂.
Proof. The expected level of follow-on innovation without patent protection on the base
technology (1) increases linearly in α. For α = 1 we have that INOP = 1− (2S−λ
λ)2 < 1 = IP .
For α = 0 we have INOP = 1− (2S−λλ)2 < 1 = IP . Continuity of (1) implies that IP > INOP
for values of α close to zero and one. Now consider the innovation activity at α̂. At this value
INOP ≥ IP if
λ− S
λ− S
(1− (
2S − λ
λ)2)+ (1−
λ− S
λ− S)
(1− (
2S − λ
λ)2)>
λ− S
λ− S
that is satisfied for λ large enough (i.e. close enough to 2S). Finally, continuity of (1) and the
fact that INOP < IP when α = 1 implies that there exists a α′ at which IP = INOP .
The proposition shows that the impact of upstream patent rights on follow-on innovation
depends critically on the trade-off between coordination failure and bargaining breakdown.
Figure 1 illustrates the result. Intuitively, patent protection is not associated with low follow-
on innovation for values of α that are high or low. This is because, when α is close to zero
or one, uncertainty about the value of follow-on innovation is low and the patentee can offer a
profitable licensing fee that is accepted with high probability by the follow-on innovator. For
intermediate values of α, there is greater uncertainty about the value of the follow-on innovation
and the likelihood of bargaining failure is more severe.
9
FIGURE 1 HERE
In the absence of upstream patent rights, bargaining failure plays no role since the
downstream innovator does not need a license to use the upstream technology. However,
the absence of downstream coordination reduces the incentives for each follow-on innovator to
invest.5 When the technology is highly profitable (λ large), coordination failure is less costly
and follow-on innovation becomes more likely. This implies that the absence of upstream patent
rights can generate either a higher or lower level of downstream innovation than a regime with
upstream patent protection.
Relation with previous literature
Our model shows that the impact of upstream patent rights on follow-on innovation depends
on the relative strength of coordination and bargaining failure in licensing negotiations. We
can generate the different predictions of various models in the innovation literature by relaxing
one or both of the two key assumptions in our model.
If we drop Assumption 1, so both downstream and upstream innovators know the value
of the follow-on technology, there is no bargaining failure and our model predicts higher follow-
on innovation when there is an upstream patent. This prediction is in line with Kitch (1977),
who describes an environment in which, in the absence of an upstream patent, development of
technology improvements is impeded by coordination failure and free riding among downstream
innovators. A patent on the base technology allows the upstream firm to act as a gatekeeper
to coordinate downstream investments.
By dropping Assumption 2 and allowing λ/2− S > 0 for λ ∈{λ, λ
}, we turn off coor-
dination failure and our model implies that an upstream patent reduces follow-on innovation.
This prediction is consistent with models where ex ante licensing does not take place in the
presence of asymmetric information, as in Bessen and Maskin (2009). But licensing breakdown
can also arise for other reasons. Galasso (2012) shows that licensing breakdown may occur even
with symmetric information when parties have divergent expectations about the profitability
of the technology. The risk of hold up, high litigation costs and pro-patent remedy rules all
reduce the expected value of ex post licensing profits for the downstream innovator and thus
5 It also generates a positive probability of duplicative investment. Whether such duplication has a positiveor negative impact on overall welfare depends on the relationship between λ and consumer welfare.
10
dilute her incentives to develop the new technology. Bargaining failure can also arise when
patent ownership is fragmented and a downstream firm requires licenses from many different
patentees to conduct its research. In this case, uncoordinated bargaining among the parties
leads to ‘royalty stacking’ that reduces the licensee’s profit and, in extreme cases, can actu-
ally block downstream development (Heller and Eisenberg [1998]; Lemley and Shapiro [2007];
Galasso and Schankerman [2010]).
Finally, dropping both Assumptions 1 and 2, we obtain a framework similar to Green
and Scotchmer (1995) in which ex ante contracting guarantees that any joint surplus enhancing
downstream innovation is developed independently of the presence of a patent on the base tech-
nology. In their model the length and breadth of upstream patent rights affect the profitability
and thus the incentive to develop the upstream technology, but once it is developed, frictionless
bargaining ensures that efficient downstream investment takes place.6
3 Description of the Data
The empirical work is based on two data sets: the decisions of the Court of Appeal for the
Federal Circuit, and the U.S. Patent and Trademark Office (USPTO) patent dataset.
The Federal Circuit was established by the U.S. Congress on October 1, 1982 and has
exclusive jurisdiction over appeals in cases involving patents and claims against the federal gov-
ernment in a variety of subject matter. The Federal Circuit consists of twelve judges appointed
for life by the president. Judges are assigned to patent cases through a computer program that
randomly generates three-judge panels, subject to their availability and the requirement that
each judge deals with a representative cross section of the fields of law within the jurisdiction
of the court (Fed. Cir. R. 47.2). Decisions are taken by majority rule. We obtain the full
text of patent decisions by the Federal Circuit from the LexisNexis QuickLaw dataset. This
contains a detailed description of the litigated dispute, the final decision reached by the court,
and the jurisprudence used to reach the decision. Using keyword searches, we identify each case
involving issues of patent validity from the establishment of the court in 1982 until December
2008. For each case we record the following information: docket number, date of the decision,
patent identification number, name of the three judges involved, name of the plaintiff, name of
6Even though blockage does not occur in this framework, Koo and Wright (2010) show that patent rightscan induce the downstream innovator to delay development.
11
the defendant, and whether the patentee is the plaintiff or the defendant.7
Information about each patent in the sample is obtained from the USPTO patent data-
base. We also identified the patents citing the litigated patent from two sources: the USPTO
citations data for sample patents granted in the period 1975-2010, and Google Patents for
sample patents granted before 1975.
We use the number of citations by subsequent patents to the focal patent as a measure of
cumulative innovation. Patent applicants are required to disclose known prior art that might
affect the patentability of any claim (Code of Federal Regulations, Ch. 37, Section 1.36), and
any willful violation of this duty can lead to the USPTO rendering the patent unenforceable
due to ‘inequitable conduct’. Importantly for our purposes, the expiration or invalidation of a
patent has no impact on its prior art status (35 U.S. Code, Section 102), so the requirement
to cite it remains in place. Citations have been widely used in the economics of innovation
literature as a proxy for follow-on research and are the only practical measure of cumulative
innovation for studies such as ours that cover a wide range of technology fields. In Section
7 we further discuss the merits of citations as a measure of follow-on innovation and we also
show that our results are robust to alternative measures of cumulative innovation that we can
construct for two technology fields, drugs and medical instruments.
The main variables used in the empirical analysis are described below.
PostCites: citations received from patents of other assignees (owners) in a five year
window after the Federal Circuit decision. This is our primary measure of cumulative innova-
tion. Because of granting delays, we date the citing patents using their application year rather
than grant year.
PostTotalCites: citations received both from patents owned by the same patentee as
the focal patent and patents of other assignees in a five year window after the Federal Circuit
decision.
Invalidated: a dummy variable equal to one if the Federal Circuit invalidates at least
one claim of the patent. This is the main explanatory variable of interest, and represents the
removal of patent rights.8
7Under very special circustances judges or the litigating parties may petition to have the case decided “enbanc” by all the judges of the court. These very few cases are dropped from our sample.
8We experimented with an alternative definition of invalidation as whenever claim 1 of the patent (typically
12
PreCites: citations received from patents of other assignees applied for in the period
between the grant of the patent and the Federal Circuit decision
PreSelfCites: citations received from patents of the same patentee as the focal patent
applied for in the period between the grant of the patent and the Federal Circuit decision
Claims: total number of claims listed in the patent document
Technology field: dummy variables for the six technology classes in Hall, Jaffe and
Tratjenberg (2001) — chemicals, computers and communications, drugs and medical, electrical
and electronics, mechanicals, and others. We will also employ a narrower definition based on
the 36 two-digit subcategories.
Finally, we construct a set of dummy variables for the year when the Federal Circuit
decision is issued and for the age of the patent. The final dataset contains 1357 Federal Circuit
patent validity decisions, covering 1258 distinct patents.9 Table 1 provides some summary
statistics. The Federal Circuit invalidates in 39 percent of the cases. There is substantial
variation in the age distribution of litigated patents at the time of the Federal Circuit decision
(see Figure A1 in the Appendix). Note that lengthy lower court trials in some cases lead to
Federal Circuit decisions occurring after the patent has expired.
TABLE 1 HERE
Patents involved in Federal Circuit cases are a selected sample of highly valuable patents.
For example, in January 2005 the Federal Circuit invalidated the patent for the once-a-week
version of Merck’s Fosamax, the leading osteoporosis drug in the market at that time. This
can be seen in Table 2, which compares characteristics of the patents in the Federal Circuit to
patents litigated in lower courts but not appealed, as well as to the universe of patents granted
by the USPTO. Drugs and medical instruments patents are more heavily represented in the
litigated and Federal Circuit samples than in the overall sample. This is consistent with survey
evidence that patent rights are most important in that sector (Levin et. al. [1987]). We also
see that commonly used indicators of patent value — the number of claims, citations per claim,
and measures of patent generality and originality (as defined by Hall, Jaffe and Tratjenberg
representing the primary claim) is invalidated. About 40 percent of patents are invalidated on our baselinemeasure, and 33 percent using the alternative definition. The empirical results are very similar with bothmeasures.
9This is because there are multi-patent cases and some patents are litigated more than once. Our sample sizeand mean invalidation rate are similar to an earlier study using Federal Circuit cases (Henry and Turner [2006]).
13
[2001]) — are all higher for litigated than other patents, and even higher for cases appealed
to the Federal Circuit.10 Equality of the means is strongly rejected for all four variables (p-
values<0.01). The mean number of claims and citations per claim for patents litigated only at
lower courts are different from those appealed to the Federal Circuit (p-values <0.01).
TABLE 2 HERE
While self-selection of patents through the appeals process is certainly related to the
private value of patents, other factors may play a role. First, cases with greater legal complexity
are more likely to reach appeal because settlement by the parties is harder due to divergent
expectations about how the court would decide the legal issues. Second, patents with greater
technological scope for follow-on innovation are more likely to be involved in litigation in the
first place. For both reasons, invalidation of patents in our sample is more likely to be associated
with an increase in follow-on innovation than for the population of patents as a whole.
4 Estimating the Impact of Patent Rights
Baseline Specification and Identification Strategy
The final dataset is a cross section where the unit of observation is a Federal Circuit case
involving patent p.11 Our main empirical specification is
log(PostCitesp + 1) = β Invalidatedp + λ1log(PreCitesp + 1)
+λ2log(PreSelfCitesp + 1) + λ3log(Claimsp) +Agep + Y earp + Techp + εp (3)
The coefficient β captures the effect of invalidation on the subsequent (non-self) citations
received by a patent. When β < 0 invalidation reduces later citations, indicating that patent
rights have a positive impact on cumulative innovation. A finding of β = 0 would indicate that
patents do not block follow-on innovation. When β > 0 we would conclude that patents block
subsequent innovation.12
10Generality is defined as one minus the Herfindahl index of the citations received by a patent across differenttechnology classes. Originality is defined the same way, except that it refers to citations made.
11Even though we have some cases of the same patent litigated more than once, we use the subscript p todenote the patent case to emphazise that our sample is a cross section.
12While a variety of econometric models can be used to estimate the correlation between citations and theFederal Circuit invalidity decisions, the cross-sectional specification is preferable for two reasons. First, it allows
14
To control for heterogeneity in the value that the patent has for the patentee and follow
on inventors, we include the number of claims and the number of external and self citations
received prior to the Federal Circuit decision (PreCites and PreSelfCites, respectively) as
covariates in the regression. We also include age, decision year and technology field dummies
to control for additional heterogeneity that may be correlated with the court decision and
later citations. We report heteroskedasticity-robust standard errors. Because some patents are
litigated more than once and some cases involve multiple patents, we also confirm significance
using standard errors clustered at the patent or case level.
The major empirical challenge is that the decision by the Federal Circuit to invalidate a
patent is endogenous. For example, a positive shock to the value of the underlying technology
may increase citations to a patent and, at the same time, induce the patentee to invest heavily
in the case to avoid invalidation. This would generate a negative correlation between εp and
Invalidatedp in equation (3) and a downward bias to the OLS estimate of β. To address
potential endogeneity, we need an instrument that affects the likelihood of patent invalidation
but does not belong directly in the citations equation.
To construct such an instrument, we exploit the fact that judges in the Federal Circuit
are assigned to patent cases randomly by a computer program, subject to their availability
and the requirement that each judge deals with a representative cross section of legal fields
within the court’s jurisdiction (Fed. Cir. R. 47.2). The Federal Circuit patent cases in our
sample have involved a total of 51 distinct judges, including 22 non-appointed judges that
filled in the vacancies during the Senate nomination process. There is substantial variation
across judges in the propensity to vote for patent invalidity (which we refer to as judge ‘bias’),
ranging from a low of 24.4 percent to a high of 76.2 percent.13 This fact, together with the
randomization of judge panels, creates exogenous variation in patent invalidation. However,
it does not ensure randomization of decisions, which could still arise because of information
us to use our time invariant allocation of judge panels as an instrument for patent invalidity decisions. Second,this specification allows us to examine heterogeneity in the effect of patent invalidation by estimating the MarginalTreatment Effect. Our approach is similar to other studies where cross sectional instrumental variables are usedto examine heterogeneous causal effects (e.g., Carneiro, Heckman and Vytlacil [2010]).
13 In Appendix Table A1 we list the (appointed) Federal Circuit judges in our sample, the number of decisionsin which each judge was involved, and the percentage of cases in which each judge voted for patent invalidation.We use the term ‘bias’ to refer to variation across judges in their propensity to invalidate, but it can also reflectdifferences in their expertise and ability to process information in the different technology fields covered by thepatent cases.
15
that becomes available during the appellate process that could also be correlated with future
citations. The instrument we construct also takes this concern into account.
Our instrumental variable, the Judges Invalidity Propensity (JIP), is defined for each
case involving patent p as
JIPp = f1p f2
pf3
p + f1pf2
p (1− f3p ) + f1p (1− f2p )f3
p + (1− f1p )f2
pf3
p
where f1p , f2p , f
3p are the fractions of votes in favour of invalidity by each of the three judges
assigned to the case calculated for all decisions excluding the case involving patent p. In other
words, the decision for the focal patent does not enter into the computation of the instrument
for that decision. In a simple setting where each judge i votes in favor of invalidity with
probability f ip , JIP captures the probability of invalidation by the three judge panel (decision
by majority rule). In Appendix 1 we show that, under plausible assumptions on the dispersion
of private information, JIP provides a consistent estimate of the probability of invalidation in
a strategic voting model (based on Feddersen and Pesendorfer [1996]) where the thresholds of
reasonable doubt differ across judges.
There are two important features of JIP that make it a valid instrumental variable. First,
the random allocation of judges assures that judges with high propensity to invalidate are not
assigned to cases because of unobservable characteristics that are correlated with citations.
Second, any additional effect that case-specific unobservables may have on the decision to
invalidate patent p (e.g., information revealed during the litigation process) is removed by
dropping the decision on patent p from the construction of the instrument for patent p.14 15
There is substantial variation in the distribution of the JIP index (mean of 0.34, range from
0.16 to 0.58). About 11 percent of the variation in JIP reflects year effects, because ‘biased’
judges may be active only for a limited period of time.
Our identification strategy is similar to the one employed by Kling (2006), who uses ran-
14Settlement at the appellate level is quite infrequent. Aggregate figures available on the Federal Circuitwebsite show that in the period 1997-2007 about 80 percent of the filed cases were terminated with a paneldecision. A possible reason for the low settlement rate is that the identity of judges is revealed to the disputantsonly after all briefs have been filed, and most of legal costs have already been sunk.
15A natural alternative to JIP is to use judge fixed effects. There are two reasons why JIP is preferred.First, JIP takes into account that the invalidity decision is taken by a panel of judges, so the impact of eachjudge’s invalidity propensity depends on the other members of the panel. Second, in JIP the dependence onthe endogenous regressor for observation i is removed by dropping that observation in the construction of theinstrument (as in the Jackknife IV of Angrist et. al. [1999]).
16
dom assignment of judges to estimate the effects of incarceration on employment and earnings
of individuals, and Doyle (2007; 2008) who uses differences in the placement tendency of child
protection investigators to identify the effects of foster care on long term outcomes.16 The
main difference between the two approaches is that our JIP index is constructed at the (three
judge) panel level. The basic assumption behind our measure is that judges differ in their
propensity to invalidate patents. To check this, we construct a dataset with judge-vote as the
unit of observation and regress the Invalidated dummy against judge fixed effects and controls
for the number of claims, external and self-citations prior to the court decision, plus decision
year, technology class and patent age fixed effects. We strongly reject the hypothesis that the
fixed effects for the different judges are the same (p-value<0.01).17
Our main estimation approach, following Galasso, Schankerman and Serrano (2013),
instruments the invalidated dummy with the predicted probability of invalidation obtained
from the probit model P̂ = P (JIP,X). When the endogenous regressor is a dummy, this
estimator is asymptotically efficient in the class of estimators where instruments are a function
of JIP and other covariates (Wooldridge [2002]). Specifically, we estimate the following two-
stage model
Invalidatedp = αP̂p + θXp + up
log(PostCitesp + 1) = β ̂Invalidatedp + γXp + εp.
where the set of controls X is the same in both stages.
Judge Panels and Patent Invalidation
Table 3 examines the relationship between patent invalidation and the composition of judge
panels. We begin in column 1 by using judge fixed effects to capture variation in judge ‘bias’.
Regressing Invalidity on these dummies and other controls, we strongly reject equality of judge
16Other recent papers that exploit heterogeneity in the decision of judges and other experts for identificationinclude Li (2012), Dahl et. al. (2013), Di Tella and Schargrodsky (2013), Dobbie and Song (2013) and Maestaset. al. (2013).
17To provide additional evidence that the estimated variation is inconsistent with judges having identicalvoting propensities, we construct a counterfactual where judges vote according to the same random process(details are provided in Appendix 2). We use the simulated vote to estimate judge fixed effects and find thatthey are not statistically significant (p-value=0.66). We also compare the distribution of these fixed effects fromsimulated votes with the (statistically significant) fixed effects estimated using actual voting behavior. Thedifference between the two distributions is striking: the variance of the Federal Circuit fixed effects is muchlarger than the one we would observe if judges were voting following the same random process.
17
effects, confirming heterogeneity in the propensity to invalidate. The judge fixed effects explain
about 6.5 percent of the variation in Federal Circuit invalidity decisions.
As indicated earlier, however, using judge fixed effects in our context neglects the fact
that decisions are taken by three-judge panels. To take this into account, in columns 2 and
3 we report probit regression models of the invalidity dummy against the JIP index. The
estimated marginal effect in column 2 indicates that a one standard deviation increase in JIP
is associated with an increase of about 7 percentage points in the likelihood of invalidation.
The results are similar when we add a set of controls for patent characteristics (column 3) —
a one standard deviation change in JIP is associated with an increase of about 5 percentage
points in the probability of invalidation (the implied elasticity is 1.07). We also find that the
patents that are more heavily cited before the court decision are less likely to be invalidated.
Interestingly, there are no significant differences across technology fields in the likelihood of
invalidation (joint test has a p-value=0.17).18
Finally, in column 4 we present the result of an OLS regression with JIP as dependent
variable that supports the randomization of judges to cases. The number of claims of the
litigated patent, the pre-decision citations, the age of the patent and its technology class are all
uncorrelated with the propensity of the judges to invalidate patents. Only the year effects are
significantly correlated with JIP. The significance of the year effects arises mechanically because
some of the ‘biased’ judges are active only for a fraction of our sample period. For additional
evidence that judges are randomly assigned and JIP is orthogonal to patent characteristics
known prior to the decision, we examine the correlation between JIP and various subsets of
the patent characteristics in our sample. In all cases the correlations are close to zero and
statistically insignificant (see Appendix 2 for details).
TABLE 3 HERE
We perform a variety of tests to confirm robustness of these findings (results not re-
ported, for brevity). First, there is the concern that the invalidity decision may depend on
whether patents have been invalidated by lower courts. To address this issue, we controlled
for the lower court decision and find a positive correlation between the Federal Circuit and
18Results are robust to using an alternative measure of invalidation — the fraction of invalidated claims. Wefind a positive and statistically significant association between the degree of patent invalidation and the JIPindex.
18
district court decisions. However, introducing this additional covariate has essentially no effect
on the magnitude and statistical significance of the JIP coefficient. Second, invalidity decisions
may also depend on characteristics of technology sub-fields not captured by our six broad tech-
nology category dummies. We re-estimate the probit regression controlling for more detailed
technology field classifications using the 32 NBER technology sub-categories. The magnitude
of the estimated JIP coefficient remains similar (1.262, p-value <0.01). In addition, we re-run
the probit regression in column 3 separately for each of our six different technology fields.
The magnitude and the statistical significance of the coefficients are very similar to the pooled
data, indicating that the correlation between JIP and invalidity is comparable across tech-
nology classes. Finally, we obtained similar marginal effects using logit and linear probability
models, and confirmed statistical significance using standard errors clustered at the patent or
case level.
Patent Invalidation and Cumulative Innovation
Baseline Specification
In Table 4 we examine how patent invalidation affects the number of subsequent citations
to the focal patent. We begin in column 1 by presenting the OLS estimate of the baseline
specification relating external citations in a five year window after the court decision to the
invalidity dummy and additional controls. There is no significant correlation between patent
invalidation and future citations. This result is not causal, however. As we argued above, there
are reasons why we should expect unobservable factors to affect both the invalidity decision of
the Federal Circuit and subsequent citations. This intuition is confirmed by a Rivers-Vuong
test that provides strong evidence against the exogeneity of invalidation.19
In order to address this endogeneity, we start with a conventional panel regression ap-
proach which controls for fixed patent effects, age dummies and year (group) dummies. The
coefficient (standard error) on patent invalidity is -0.068 (0.022) which is very close to and
not statistically different from the cross sectional OLS coefficient. This indicates that the main
source of endogeneity is time-varying and cannot be dealt with by standard panel data methods.
In column 2 we move to an IV specification and instrument the Invalidated dummy
19Following Rivers and Vuong (1998), we regress Invalidated on JIP and the other controls in a linear proba-bility model. We construct the residuals (v̂) for this model and then regress subsequent citations on Invalidated,v̂ and the other controls. The coefficient on v̂ is negative and highly significant (p-value<0.01).
19
with JIP. The estimate shows a statistically significant, positive effect between citations and
invalidation by the Federal Circuit. The substantial difference between OLS and IV estimates
highlights the importance of controlling for the endogeneity of invalidation, and indicates a
strong negative correlation between Invalidated and the disturbance in the citation equation,
εp (inducing a large downward bias if we treat Federal Circuit invalidation as exogenous).
In column 3 we instrument Invalidated with the predicted probability of invalidation
obtained from the probit regression (rather than JIP itself) from column 3 of Table 3. This is
more efficient as the endogenous regressor here is binary (Wooldridge [2002]) and, as expected,
the F-statistic from the first stage regression increases from 17.4 to 94.8 when we replace
JIP with the predicted probability from the probit. The estimated coefficient implies that
patent invalidation causes an increase in external citations of about 50 percent in the five years
following the Federal Circuit decision.20 This increase in citations by other innovators does not
necessarily imply that total follow-on innovation intensified, as it depends on what happens to
the innovation by the owner of the invalidated patent. In column 4 we examine the relationship
between invalidation and the number of total citations (including both external and self cites)
received by the patent in the five years following the Federal Circuit decision. The estimated
coefficient is very similar to the one obtained for external citations, which indicates that the
increase in external citations is not compensated by a decline in self-citations.21
TABLE 4 HERE
These instrumental variable regressions provide strong, causal evidence that the loss of
patent rights increases subsequent citations to the patent. This evidence shows that, at least
on average, patents block cumulative innovation. However, in the following sections we will
show that this average effect is misleading because it hides the fact that the ‘blocking effect’ of
patent rights is highly heterogenous. Moreover, we will reveal how the impact of patents varies
with the characteristics of the patent, the patentee and the technology field.
20Because the specification relates log of cites to the dummy variable Invalidated, we compute the marginaleffect as e0.41 − 1 = 0.50.
21 In a companion research project, we are examining how patent invalidation affects self-citations as anindicator of how patent rights influence the direction of the firm’s research trajectory. Our findings indicate thatthe effect of patent invalidation depends critically on whether the patent is central or peripheral to the patentingstrategy of the firm.
20
Robustness and Extensions
We perform a variety of tests to confirm robustness of our main finding (details are provided
in Appendix 3). In this section we briefly summarize the main robustness checks and describe
two extensions of the empirical analysis.
First, up to now we have treated an invalidation judgment as the final verdict. However,
parties to the dispute have the right to appeal the decision of the Federal Circuit to the
Supreme Court (which retains discretion over whether to hear the case). To deal with this
issue we identified the patent invalidity cases appealed to the Supreme Court in our data set
(there are only 12 cases). We drop these cases and re-estimate the model using instrumental
variables. The point estimate of the coefficient on patent invalidation is very close to the
baseline coefficient.
Second, the citations information obtained from the USPTO ends in 2010 so the latest
years in the sample are subject to truncation. We run two robustness checks to assess whether
truncation is an issue in our study. First, we restrict the sample to patent decisions that take
place before 2003, where we have a complete 5-year time window of citations, and the results are
similar to the estimates using the whole sample. Second, we adjust for truncation exploiting
the citation lag distribution estimated in Hall, Jaffe and Trajtenberg (2001). They provide
an estimate of the distribution of citations received over the life of patents across different
technology classes that we use to inflate the citations received by patents for which we observe
only a fraction of the five year window. The estimates from this procedure are also very similar
to the baseline estimates.
Third, the baseline model incorporates fixed effects for six broad (one-digit) technology
fields. To account for unobserved heterogeneity that might be related to narrower technology
fields, we also estimate a specification that uses a more refined technology classification — 32
two-digit subcategories from the NBER. The point estimate of the coefficient on Invalidated
is nearly double the baseline estimate but also less precise, and we cannot reject the null
hypothesis that the two estimated coefficients are the same.
Fourth, to allow the age distribution of citations to vary across technology fields, we
extend the specification by including a full set of interactions between the technology field
and age dummies. The estimated coefficient on invalidation is nearly identical to the baseline
coefficient. We also re-estimate the baseline model adding dummy variables for patents that
21
received no cites before the Federal Circuit decision and for patents that receive no cites after
the decision. The results are robust, and we also get similar estimates if we drop these patents
from the sample entirely.
Finally, there is a concern that some Federal Circuit decisions may involve rulings that
limit the scope of patentable subject matter (e.g. software or business models) rather than sim-
ply assessing the validity of the focal patent. This type of invalidation could reduce subsequent
citations for the entire technology field, leading us to underestimate the true blocking effect of
patent rights (since we focus only on citations to the invalidated patent). To address this, we
identified the most important Federal Circuit decisions that relate to patentable subject matter
during our sample period. Dropping those decisions and re-estimating the model, we obtain
coefficients that are nearly identical to the baseline estimates.22
We turn next to two extensions that are of independent interest. In the first extension
we examine whether Federal Circuit invalidation has a smaller effect on older patents. In the
extreme case where invalidation occurs after the patent has expired (there are such cases), the
patent no longer has the power to block follow-on development so the invalidation decision
should have no effect. More generally, for patents near statutory expiration we would expect
to see less blocking effect, both because follow-on research is likely to have dissipated over
time for old technologies and because the five year window after the invalidation decision will
include years after expiration. We view these regressions as a kind of placebo test, providing
additional support for the hypothesis that the invalidation effect is not being driven by other
unobservable factors. Because of sample size, we cannot estimate the invalidation effect sepa-
rately for each patent age. As an alternative, we examine how the estimated effect changes as
we successively drop older patents. Column 1 of Table 5 shows that the effect of invalidation
is slightly larger when we drop the 44 observations where patents are litigated after expiration
(age 20). Columns 2 and 3 show that the effect continues to rise as we drop patents older
22 In Appendix 3 we check whether the invalidation effect differs across quartiles of the patent value distributionas measured by the pre-decision external citations. We find no evidence of such differences. We also show thatour results are robust when we introduce two different controls for the level of competition: (i) the portfolio sizeof the patent holder, which is likely to affect both product market and technology competition with other firmsand, (ii) a measure of the concentration of patenting among firms operating within a technology area. Finally,we explore whether the invalidation effect is driven by citations by U.S. patents owned by foreign entities. Wefind that the invalidation effect is significant only for citations by domestic follow-on innovators. This result isinteresting by itself because it is suggests that licensing frictions (removed by patent invalidation) must representonly a fraction of the total cost for foreign innovators to patent in U.S..
22
than 18 and 15, respectively. Compared to our baseline estimate, the effect of invalidation is
28 percentage points larger for patents that are invalidated during their first 15 years of life.
Finally, in column 4 we show that there is no effect of invalidation for patents whose Federal
Circuit decision takes place more than 15 years after the filing date.23
TABLE 5 HERE
In the second extension, we investigate the time path of the effect of invalidation on
subsequent citations. Figure 2 plots IV estimates of the effect of invalidation in each of the
ten years that follow invalidation, and the associated 90-percent confidence intervals. The
results show that there is no statistically significant effect in the first two years after Federal
Circuit invalidation. Moreover, the effects persist for seven years after the invalidation.24
This pattern suggests that the observed impact of invalidation is not simply due to a ‘media
effect’ from press coverage associated with the court decision, where we would expect a more
immediate increase in citations and probably more rapid dissipation over time, which is not
what we find. The estimated time path is more compatible with a story of entry of new
innovators, previously blocked, developing technology building on the focal patent. In Section
8 we provide additional evidence which rules out media publicity, and we conduct a detailed
analysis of where the blockage occurs, specifically, which technology fields and which types of
patentees and downstream innovators.
FIGURE 2 HERE
5 Heterogeneous Impacts of Patent Invalidation
Estimating the Marginal Treatment Effect
To this point we have assumed that the effect of patent invalidation on future citations is
constant across patents. However, as the theoretical discussion in Section 2 indicated, the
impact of patents on later innovation depends on the risk of bargaining failure between upstream
23We experimented with a variety of alternative specifications and obtain similar results. While there is clearevidence that citations decline with age, the impact of invalidation does not systematically vary with the age ofthe invalidated patent. The only robust finding is that the invalidation effects drops to zero as patents approachexpiration.
24These estimates are based on decisions in the 1982-2003 period, so that we have at least seven years of post-decision observations for every patent in the sample. If we include more recent years, or drop decisions after2001, we still find that the statistically significant effects are concentrated in the third to sixth year followinginvalidation.
23
and follow-on innovators, and coordination failure among competing downstream developers.
Thus we would expect the impact to vary with characteristics of the technology field, the
transacting parties and market structure. In this section we extend the econometric model to
explore this heterogeneity.
We begin by assuming that the effect of patent invalidation on future citations can be
decomposed into a common component β and a random component ψp: βp = β+ψp. We also
assume that the probability of invalidity can be described as
Invalidated(JIPp,Xp) =
{1 if P (JIPp,Xp) ≥ vp0 otherwise
where vp is a characteristic of the patent case that is unobservable to the econometrician and
which affects the invalidity decision. In general, we would expect this unobservable character-
istic to be correlated (positively or negatively) with ψp. For example, if the patent is of higher
quality (high vp), invalidation would be less likely and the patent would be more likely to be
cited after invalidation (high ψp). This example would imply that E(β + ψp|vp) is increasing
in vp.
Because vp is not observed, we cannot condition on it. Nonetheless, for a patent case
decided by a panel of judges that is just indifferent between invalidating and not invalidating,
it must be that P (JIPp, Xp) = vp. Exploiting this equality, we can identify the marginal
treatment effect as E(β + ψp|P (JIPp,Xp)), which corresponds to the (heterogenous) effect
of invalidation on future citations for patents that are invalidated because of the instrument.
Carneiro, Heckman, and Vytlacil (2010) provide a formal treatment, where they show that
E(β + ψp|P = vp) =∂E(log(PostCitesp + 1)|P )
∂P|P=vp
and establish identification of the marginal treatment effect (MTE).
In Figure 3 we present estimates of the MTE. The horizontal axis depicts the estimated
probability that the patent is invalidated. The vertical axis shows the effect of invalidation on
post decision citations for different values of this probability. The support for the estimated
probability goes from the 10th to the 90th percentile. The estimated marginal treatment effect is
increasing in the probability P . Patents with low values of P are those that, given observables,
are unlikely to be invalidated. The small and insignificant values for the MTE in this range
show that, if an increase in judge propensity to invalidate leads to invalidation of the patent,
24
the effect of invalidation on citations would be negligible. Conversely, patents with high P are
patents with high risk of invalidation based on observable characteristics. For these patents
the MTE is positive, indicating that citations increase after invalidation.25
FIGURE 3 HERE
The estimated MTE shows substantial heterogeneity in the effect of patent protection on
cumulative innovation. The finding of an increasing MTE also helps identify mechanisms that
drive the increase in citations that we observe after Federal Circuit invalidation. This is because
the MTE estimates the effect of invalidation for patent cases in which judges are indifferent
between a validity and an invalidity ruling. Thus, an increasing MTE indicates that the effect
of invalidation on citations is greater for patents which, despite having observable features that
make invalidation likely (high P (JIPp, Xp)), are characterized by unobservable factors that
make invalidation less likely (large vp). An example would be characteristics that affect the
strength of the patent (legal enforceability) and thus make invalidation less likely, and which are
observable to the patentee but unobservable to the licensees (and well as the econometrician).
This asymmetric information can lead to bargaining failure in licensing negotiations. In such
cases, Federal Circuit invalidation can facilitate access to the technology that was blocked by
the bargaining failure.
Explaining the Heterogeneity
We showed that the effect of patent invalidation on subsequent citations is concentrated among
a small subset of patents. We turn now to unbundling the heterogenous impact of patent rights
by relating it to observable characteristics of the technology field and contracting environment.
Previous empirical studies emphasize two features of the innovation environment that
affect bargaining between upstream and downstream firms, and thus the incentives to invest
in follow-on innovation. The first is the concentration of patent ownership in the technology
field. For example, Ziedonis (2004) argues that when patent ownership is not concentrated (i.e.
fragmented), downstream innovators need to engage in multiple negotiations, which exacerbates
the risks of bargaining failure and ex post hold-up. However, from a theoretical perspective the
25These findings are robust to using alternative estimation methods to compute the MTE, including a non-parametric approach and the semiparametric approach (with a third order polynomial) proposed by Carneiro,Heckman, and Vytlacil (2010).
25
relationship between fragmentation of patent ownership and the blocking effect of patent rights
is ambiguous. Existing models of contracting over patents indicate that the value obtained
from accessing an additional patent in a fragmented environment depends critically on the
degree to which patents are complements or substitutes (Lerner and Tirole [2004]; Galasso and
Schankerman [2010]).
The second feature is the ‘complexity’ of the technology field. In complex fields, new
products embody numerous patentable elements, as contrasted with ‘discrete’ technology areas
where products build only on few patents. When products typically incorporate many patented
inputs, and they are held by different owners, licensees need to engage in multiple negotiations
and the risk of bargaining failure is higher. Thus we expect the impact of patent rights on
cumulative innovation to be more pronounced in complex technology fields.
To test these hypotheses, we construct two variables. The first variable, Conc4, is a con-
centration measure equal to the patenting share of the four largest assignees in the technology
subcategory of the litigated patent during the five years preceding the Federal Circuit decision
(the mean and standard deviation of Conc4 are 0.067 and 0.053, respectively). The second
variable, Complex, is a dummy variable for patents in complex technology fields. Following
Levin et. al. (1987) and Cohen, Nelson and Walsh (2000), we classify electrical and elec-
tronics (NBER category 4), computers and communication (NBER category 2) and medical
instruments and biotechnology (NBER subcategories 32 and 33) as complex technology fields.
In columns 1 and 2 of Table 6 we show, in two split sample regressions, that the effect
of patent invalidation is small and statistically insignificant among patents in concentrated
technology areas (Conc4 ≥ median), whereas it is large and statistically significant among
patents in fragmented technology fields (Conc4 < median). Similarly, columns 3 and 4 show
that the effect of invalidation is more than twice as large in complex technology areas as
compared to the non-complex technology fields. Column 5 provides estimates using the full
sample and interacting Conc4 and Complex with the Invalidated dummy. These confirm
the findings from the split sample regressions. Evaluated at their respective sample means
of Conc4, our point estimate (standard error) for complex technology fields is 1.149 (0.29);
for non-complex fields it is not statistically different from zero, at 0.167 (0.23). For complex
fields the estimate implies that patent invalidation raises subsequent citations by 216 percent.
We also confirm that concentration substantially mitigates the effect of patent invalidation on
26
future citations: a one standard deviation increase in Conc4 reduces the effect of invalidation
by 0.37, which is 32 percent of the estimated impact for complex fields.26
TABLE 6 HERE
We can use the parameter estimates from column 5 to compute the implied effect of
patent invalidation on citations for each of the technology fields, based on the observed values
of Conc4 and Complex for each field. The results, presented in column 1 of Table 7, are
striking. There is essentially no effect of patent rights on cumulative innovation in any of the
three non-complex technology areas — pharmaceuticals, chemicals and mechanical. By contrast,
the effect is large and statistically significant in each of the complex fields — the coefficients
imply that invalidation raises citations by 320 percent in medical instruments/biotechnology,
203 percent in electronics and 178 percent in computers. For comparison, column 2 reports
estimates of split-sample regressions for each technology field. Though the smaller sample sizes
reduce precision, the regressions confirm strong impacts in medical instruments/biotechnology
and computers, but no statistically significant effect in electronics.
TABLE 7 HERE
However, one concern with our finding that patent rights do not block follow-on inno-
vation in drugs is that the litigation in that sector may be brought primarily by generic drug
firms whose business model is to produce off-patent drugs rather than to innovate by building
on previous drugs. In this case, finding that patent invalidation has no effect would simply
be due to an absence of interest by follow-on innovators, and could not be interpreted as evi-
dence that licensing negotiations are effective. In order to address this concern, we conducted
a full text search of the invalidity decisions involving pharmaceutical patents in our sample to
identify cases related to ‘Abbreviated New Drug Application’ (ANDA) by generic firms.27 We
26Column 5 also controls for the direct effect of Conc4 and includes additive technology dummies that absorbthe direct effect of Complex. These results are unchanged if we reclassify biotechnology patents (subcategory33) as a non-complex field, or if we replace the continuous concentration measure with a dummy variable forfields with Conc4 above the 50th or 75th percentile. We also use our parameter estimates (column 5, Table 6)to examine how variation over time within fields affects the impact of invalidation. To do this, we constructthe Conc4 measure for each technology subcategory in the years 1982-2002 and compute a weighted average foreach of the six broad technology fields, with weights equal to the fraction of patenting in the area. We find noevidence of significant changes in the impact of patent invalidation during our sample period.
27To do this, we identified references to at least one of the following terms: paragraph IV, Hatch-Waxman,Abbreviated New Drug Application, and ANDA. We find that about 25 percent (45 cases out of 167) of thedrug patent decisions in our sample mentioned at least one of these terms, and we generated a dummy variable
27
re-estimate the model allowing the invalidity coefficient to be different for ANDA and other
drug cases, but we find no statistically significant difference.
Overall, these findings indicate that the fragmentation of patent ownership and complex-
ity of technology fields are key empirical determinants of the relationship between patent rights
and cumulative innovation. Of course, other factors can also affect the impact of patent rights
on subsequent innovation. One is product market competition. Aghion, Howitt and Prantl
(2013) provide evidence that strong patent protection stimulates innovation only when prod-
uct market competition is fierce. A second factor is the degree to which ‘tacit cooperation’ can
be used by firms to mitigate potential bargaining failures and litigation that might otherwise
arise from dispersed ownership of patent rights (Lanjouw and Schankerman [2004]). Under-
standing where and how these differences operate is a valuable direction for future theoretical
and empirical research.
Our findings are relevant to the current policy debates on patent reform. The recent liter-
ature studies specific innovations in biotechnology and medical instruments and finds blocking
effects (Murray and Stern [2007]; Murray et. al. [2008] and Williams [2013]). Our estimates
confirm the presence of blocking in these fields, using a much broader set of innovations and
an entirely different identification strategy. But our results also show that the effect is very
different in other fields, and thus remedial policies to mitigate blocking need to target spe-
cific technology areas in order to preserve innovation incentives. At the same time, changes
in the contracting environment in which technology licensing takes place would reshape the
relationship between patent rights and cumulative innovation.
6 Intensive versus Extensive Margins
In the previous section we showed that the blocking effect of patents on later innovation depends
on how concentrated patent rights are — i.e., on the ‘industrial organization’ of innovation.
However, the influence can also run in the other direction. Patent rights can shape the industrial
structure of innovation by impeding the entry of new innovators or the expansion of existing
firms, and this potential blocking effect may be stronger for certain kinds of patentees or
downstream innovators. In this section we examine this issue and show that the blocking effect
to capture such ANDA litigation. This is a conservative measure (upper bound) because these terms may alsoappear outside ANDA cases.
28
of patents depends critically on the size of the patentee and the downstream innovators.
We measure the size of the citing innovators by constructing the portfolio size for each
assignee citing the patents involved in Federal Circuit litigation. The portfolio is defined as the
number of patents granted to an assignee in the five years before the Federal Circuit decision.
The mean portfolio size of citing firms is 359 patents but the distribution is very skewed — the
median firm has only 5 patents, and the 75th percentile has 102 patents. We assign firms to
one of three size categories: ‘small’ if its portfolio is below five, ‘medium’ if the portfolio is
between 6 and 101 patents, and ‘large’ if it greater than 102 patents. We study how patent
invalidation affects citations by subsequent innovators in each size group. In each regression
we also allow for the effect of invalidation to be different when the focal patent is held by a
large patentee, defined as one with a patent portfolio of more than 102 patents.28
In addition, for each size group, we investigate whether the blocking effect of patent rights
works through reducing the number of later innovators building on the focal patent or on the
intensity of their downstream innovation. This question is of interest because the effect of
patent rights on the industrial structure of innovation differs in the two cases. To examine this
issue, we decompose the total number of later citations into intensive and extensive margins.
We measure the extensive margin by the number of distinct patent owners (assignees) citing
the focal (litigated) patent in the five-year following the Federal Circuit decision. We measure
the intensive margin by the number of citations per assignee to the focal patent in the same
time window.
Table 8 presents the IV estimates of the patent invalidation effect on citations by different
size groups. Focusing first on the total number of external citations (columns 1-3), the estimates
reveal that the blocking effect of invalidation is concentrated exclusively on citations that
patents of large firms receive from small innovators. The magnitude of the implied blocking
effect is very large: invalidation of a large firm patent increases small firm citations by about 520
percent. This is consistent with our earlier estimate of 50 percent for the average blocking effect
in the overall sample, because roughly 50 percent of the citing entities are small firms in our
28 In classifying firms, we do not correct for changes in patent ownership because more than 65 percent ofour patents do not belong to the re-assignment dataset constructed by Serrano (2010). To address this issue,we manually match the assignee name of the litigated patent at the grant date with the names of the litigatedparties. For 134 patent cases we notice a discrepancy between the USPTO name and the names of the litigants.Replacing the patent portfolios of original patent assignee with the portfolios of the litigating party we obtainresults that are essentially identical to those reported below in Table 8.
29
data and about 20 percent of the patentees are large firms (i.e., 520× 0.5× 0.2 = 52 percent).
The coefficients for the other size groups are much smaller in magnitude and statistically
insignificant.
In columns 4-6, we study how patent invalidation affects the extensive margin. The
dependent variable in these regressions is the logarithm of one plus the number of distinct
assignees citing the litigated patent in the five years following the Federal Circuit decision.
Here too we find that the blocking effect of patents is concentrated exclusively among citations
by small firms to large firm patents. The estimated coefficient of 1.347 implies a 285 percent
increase in the number of distinct small assignees citing the patent when a patent of a large
firm is invalidated by the Federal Circuit. The effects for the other size groups again are small
and statistically insignificant. Finally, columns 7-9 examine the blocking effect at the intensive
margin, the number of citations per distinct patent owner. The only coefficient (marginally)
significant is again the one related to large patentees and small citing assignees. The effect
of invalidation is about 62 percent, but statistically significant only at the 10 percent level.
Overall, we cannot reject the hypothesis that the extensive margin effect for small citing firms
is equal to the total effect and that the intensive margin effect is zero. In Appendix 4 we present
a series of additional regressions varying the threshold for defining small and large firms. These
experiments show that the pattern emerging in Table 8 is extremely robust.
TABLE 8 HERE
These findings show that patent rights block later innovation in very specific ways, not
uniformly. The fact that we see no statistically significant blocking effect for most size categories
suggests that bargaining failure among upstream and downstream innovators is not widespread.
However, the results show that bargaining breakdown occurs when it involves large patentees
and small downstream innovators. This finding is consistent with Lanjouw and Schankerman
(2004), who show that small firms are less able to resolve disputes ‘cooperatively’ without
resorting to the courts. Small firms do not have patent portfolios that can be used as counter-
threats to resolve disputes or to strike cross-licensing agreements to preserve freedom to operate
in their innovation activities (Galasso [2012]).
Finally, we emphasize that our findings are not driven by the recent surge in litigation
activity by non-practicing entities (NPE, aka "trolls") blocking follow-on research of small
firms. This is because very few NPE patent cases reach the Federal Circuit court. The large
30
anecdotal evidence on trolls shows that the most common business strategy for NPE’s is to
threaten litigation and demand a settlement fee that alleged infringers prefer to pay rather than
face the cost and risk of litigation. To check this for our sample, we obtained a list of 50 leading
patent trolls from Fisher and Henkel (2012) and manually matched their names against the
litigants in our sample. We find that only 12 patent cases in our sample involve a troll. When
we drop these observations and re-estimate the model, we obtain estimates that are essentially
identical to those obtained in our full sample regressions.
7 Using Non-Patent Measures of Follow-on Innovation
To this point we have used the number of subsequent citations as our measure of follow-
on innovation, which is the conventional approach. We are aware of very few exceptions.
Williams (2013) studies the impact of patent rights on human genome research using both
citations in later scientific publications and direct measures of product development. Moser
and Rhode (2011) study the impact of the 1930 Plant Patent Act on plant innovation by
tracking registration of new rose varieties with the American Rose Society. Using product
level information is clearly desirable, but citations are the only practical measure for studies
that cover a wide range of technology fields, such as ours. From an economic perspective,
patent citations play two distinct roles: they indicate when a new invention builds on prior
patents (and thus may need to license the upstream patent), and they identify prior art that
circumscribes the property rights that can be claimed in the new patent. Citations can either
under- or overestimate the extent of follow-on innovation. They will underestimate it where
inventors develop improvements that are not patented (or patentable), but overestimate it when
the inventor did not actually built on the prior patent. In any event, there are serious hurdles to
using product-level data to measure innovation across a wide range of technology fields. First,
there are no comprehensive data sets of products in different industries, and second, there is
no way to identify whether a product specifically builds on a previous patent.
Fortunately, however, we are able to construct non-patent measures of follow-on innova-
tion for two of our technology fields — pharmaceuticals and medical instruments — thanks to
government regulation that requires registration of new product developments in these areas.
These cover both a ‘discrete’ technology field (drugs) in which we found no blocking effect us-
ing the citations measure, and a ‘complex’ one (medical instruments) where we found a strong
31
blocking effect. In this section we show below that these findings also hold up when we use
product-based measures.
Medical Instruments
The Food and Drug Administration (FDA) has primary authority to regulate medical
devices sold in U.S. These products are subject to a regulatory process that requires detailed
product information and evidence of safety from clinical trials. The FDA releases data on
approvals requested for medical instruments. To use these FDA approval requests as a measure
of follow-on innovation, we need to link them to the medical instrument patents in our sample.
To do this, we use two alternative approaches. First, we search the text of the abstract in
each of our litigated patents to identify a set of keywords related to the patented technology.
We then search for all FDA approval requests to identify those that contain these keywords.
In the second approach, we assign each our litigated patents to a set of product codes from
among the roughly 6,000 product codes in which the FDA classifies medical devices. We then
use all of the FDA approval requests listed in the corresponding product codes as our measure
of follow-on innovation. Appendix 5 provides details of the data construction and discussion of
the merits and limitations of each approach.
We re-estimate the baseline model using each of these measures of follow-on innovation.
Panel A in Table 9 summarizes the IV estimates of the patent invalidation effect for the medical
instrument patents. Column 1 presents the estimate using citations as the dependent variable,
which is statistically significant (p-value=0.053) and very similar to the one reported in column
2 of Table 7. The slight difference in magnitude and smaller sample size are due to our focus
on medical instrument patents, where we exclude biotechnology patents. Column 2 shows the
estimated effect where we measure follow-on innovation with the number of FDA approval
requests for which the product name contains at least one of the keywords from the litigated
patents. Again we find a positive and statistically significant (p-value = 0.06) invalidation
effect. The point estimate is smaller than (but not statistically different from) the one based
on citations. In column 3 we measure follow-on innovation by the number of applications for
the product codes in which the patent is classified. Here too the point estimate is broadly in
line with (and not statistically from) the one estimated with citations. In Appendix 5 we show
that these results are generally robust to how we define the keywords and product codes used
to map between the FDA-registered medical devices and our litigated patents.
32
Overall, this analysis confirms our conclusion that patent invalidation has a significant
impact on cumulative innovation in the complex technology field of medical instruments.
TABLE 9 HERE
Pharmaceuticals
We construct a measure of follow-on innovation by identifying the subsequent clinical
drug trials that are related to the active ingredient of the litigated drug patent. The use of
clinical trials as a measure of innovation is natural in the health sector and has been recently
exploited in economic research (e.g., Finkelstein [2004] for vaccine research; Budish, Roin and
Williams [2014] for cancer drug research). Our data source for clinical trials is the web-site
ClinicalTrials.gov, which is a registry and results database of publicly and privately supported
clinical studies of human participants. Because the site only reports clinical trials from 2000
onwards, we can construct this alternative measure only for patents litigated in the Federal
Circuit after 1997.
We use two approaches to match Federal Circuit drug patents with clinical trials. For
94 patent cases, we were able to identify the trade name of the drug protected by the patent
and the clinical trials related to the active ingredient of the specific drug. For the remaining
cases, we collected a set of keywords describing the new drug compound after careful reading
of the patent title and abstract. We match the drug patents to subsequent clinical trials based
on the appearance of these keywords. Appendix 5 provides additional details on the data
construction.
Panel B in Table 9 presents the estimates of the invalidation effect for our drug patents
using these measures of follow-on innovation. To facilitate comparison, column 1 reports the
results obtained in our split sample regression with citations as the dependent variable. In
column 2 we present the estimate using the number of trials as dependent variable, for the
subset of sample patents that we were able to match to a commercialized drug. The point
estimate is positive and very close to one obtained using the citations measure, but again it
is statistically insignificant, confirming that patent rights do not block cumulative innovation
in drugs. Column 3 shows that results are similar in the extended sample constructed with
keyword matching. In Appendix 5 we discuss robustness of these results. Across a variety
of sub-samples and specifications, we find no evidence of a statistically significant effect of
33
invalidation in pharmaceuticals.
Overall, this analysis with product-based measures of innovation confirms our earlier
conclusions from regressions based on patent citation data. The analysis also suggests that
non-patent measures are not necessarily superior to patent measures. Despite their limitations,
patent citations have the advantage of directly linking each litigated patent with follow on tech-
nologies exploiting information revealed by later patenting innovators (or patent examiners).
The non-patent measures require more subjective choices by the econometrician in making
these links. While we explored the robustness of our measures (e.g., collecting a variety of
keywords for each patent and linking it to products using different subsets of these keywords —
discussed in Appendix 5), there is no reason to expect the measurement error in this process
to be lower than the one from citations. Moreover, using patent citations to measure follow-on
innovation has the advantage of ensuring that we focus on technologies that pass the novelty
and non-obviousness requirements for patentability. Any non-patent measure may also include
subsequent products that do not pass this standard. Despite the fact that there is no single
dominant measure, the existence of multiple indicators can potentially provide a more infor-
mative composite index of the underlying phenomenon of interest (as shown by Lanjouw and
Schankerman [2004] in the context of measuring patent quality). This is a potentially fruitful
direction for future research.
8 Testing Alternative Interpretations
On average, patent invalidation causes a substantial increase in subsequent citations to the focal
patent. This result suggests that some licensing deals are not taking place in the presence of
patent protection. There are two main reasons why this might occur. First, it might be privately
optimal for a patent owner to restrict access if licensing reduces joint profits (e.g., because
it intensifies downstream competition). Second, information asymmetry and uncoordinated,
multilateral bargaining can lead to licensing failures even when such agreements would increase
joint profits (and consumer surplus). It is important to distinguish between these explanations
because they differ in terms of their implications for welfare and policy.
Our empirical findings suggest that bargaining failure is a significant part of the explana-
tion. Support for this claim is found in the estimated heterogeneous marginal treatment effects.
The impact of patent invalidation is concentrated on a small subset of patents, and these have
34
unobservable characteristics that are associated with a lower likelihood of being invalidated
(i.e., stronger patents). This suggests the presence of asymmetric information that would be
expected to induce bargaining failure in licensing. Moreover, our results help pin down where
the bargaining failure occurs. The effect is concentrated in fields characterized by two fea-
tures: complex technology and high fragmentation of patent ownership. We find no evidence of
blocking in non-complex fields such as chemicals, pharmaceuticals or mechanical technologies.
This reinforces the market failure interpretation, since earlier studies identify fragmentation
and complexity as key determinants of licensing breakdown (Cohen, Nelson and Walsh [2000];
and Ziedonis [2004]).29
We interpret our finding that patent invalidation increases later citations by other firms
as evidence that the focal patent was blocking innovation by those firms. However, there
are three possible reasons for believing that this interpretation of our results may lead us to
overestimate the degree to which patent rights effectively block follow-on innovation. Rather
than blocking, the post-invalidation increase in citations could reflect: 1) substitution by users
from other patents to the focal patent, 2) media publicity, or 3) strategic citation by downstream
innovators. In the remainder of this section we address each of these arguments.
Substitution among Patents
The post-invalidation increase in citations we estimate could be generated by substitution
by downstream innovators away from other patented technologies toward the invalidated patent
which is now cheaper to use. However, there are two reasons why we think this substitution
effect is unlikely to account for the entire increase in citations we estimated. First, our sample
comprises highly valuable patents for which litigants spent substantial resources in district
court and appellate litigation. It is implausible that such expensive litigation takes place if
parties can easily substitute the patented technology with an alternative one. Second, the
invalidation effect crucially depends on the characteristics of patentees and citers. We see no
statistically significant effect for most size categories, it being concentrated entirely between
29Our conclusion that patent rights only block in specific environments may be overly optimistic. An alterna-tive explanation for why we do not find blockage in other settings is that patentees are simply unable to enforcetheir rights effectively. In this case, the R&D incentives for upstream innovators would be diluted, makingwelfare implications of patent rights more ambiguous. We do not think that this interpretation is plausible fortwo reasons. First, our sample covers high value patents whose owners have expended substantial resourcesto reach the Federal Circuit court, and this does not fit well with an assumption that their patent rights areunenforceable. Second, the concentrated, non-complex technology fields (including drugs) are the contexts inwhich we would expect patents to be more easily enforced, but this is where we do not find any blocking effect.
35
large patentees and small downstream innovators. This finding is hard to explain with simple
technology substitution, since it is not obvious why an invalidated patent should be used as a
substitute technology by small innovators only if it is held by a large patentee.
Nonetheless, we explore this issue more constructively by examining whether patent
invalidation also leads to a decline in the number of citations to patents that are putative
substitutes for the Federal Circuit patent. To this end, we construct a sample of ‘related’
patents for each litigated patent in our sample. To do this, we use the Google Prior Art
software, which is a text based matching algorithm that identifies and ranks related patents.
Appendix 6 provides details of the data construction.
We run a series of IV regressions that relate the post-decision citations to the related
(substitute) patents, controlling for the endogeneity of invalidation with the same approach as
our baseline regression. Table 10 reports the results. In column 1, the sample is limited to the
substitute patents identified as the highest ranked Google match for each Federal Circuit patent
(when at least one was identified). Columns 2 and 3 focus, respectively, on the top two and
three highest ranked matches for the Federal Circuit patents. In each of these IV regressions,
the estimated coefficient on the patent invalidation dummy is negative, suggesting that there
is some role for the substitution interpretation. However, the point estimates are statistically
insignificant in two of the samples, and only marginally significant, at the 10 percent level,
in the sample using two related patents. Even in the latter case, the estimated coefficient is
too small to account for the impact of invalidation on citations to the focal patent that we
found. The point estimate implies that invalidation of the focal patent leads to a 15.5 percent
reduction in citations to related (substitute) patents, which can explain only one-fifth of the
estimated effect of Federal Circuit invalidation on the focal patent.30 This finding does not
necessarily imply that the level of technical substitution is small. It is possible that a decline
in citations due to technical substitutability could be compensated by an ‘innovation burst’ or
market expansion effect generated by the court decision which increases citations for both the
invalidated patent and related patents. Nonetheless, our objective is to estimate the total effect
of invalidation on related patents, not to isolate the technical substitution from the market
30Related patents receive only 48 percent as many citations as Federal Circuit patents (1.2 and 2.5 citationsper year, respectively). So a 15.5 percent decline in citations to each of two related patents translates to a 15percent (2 patents x 0.155 x 0.48) increase in citations to Federal Circuit patents, which is about 1/5 of the 70percent increase estimated in the sample of matched litigated patents.
36
expansion effect.
TABLE 10 HERE
Media Publicity from Court Decision
The increase in citation after patent invalidation could be driven, at least in part, by
publicity associated with the Federal Circuit decision. Our instrumental variable estimation
partially addresses this concern, since press coverage is unlikely to be disproportionately greater
for patents that have been (randomly) allocated to judges with high propensity to invalidate.
Nonetheless, to provide further evidence, we collected data on news coverage for the cases in
our sample. Our main source is the Dow Jones Factiva dataset, which collects press releases
in the major international news and business publications. We classify an article as relevant
press coverage if it contains at least one of the names of the litigating parties as well as
all the following words: ‘patent’, ‘litigation’, ‘court’ and ‘appeal’. We construct a measure,
MediaMentions, defined as the number of articles referring to the case in a one-year window
centered around the date of the Federal Circuit decision (i.e., six months before and after the
decision date). When we add MediaMentions to our baseline specification, and estimate using
our instrumental variable approach, we find that this new variable has no statistically significant
effect on citations, and more importantly, that our estimated coefficient on Invalidated is very
close to the baseline estimate (column 4 in Table 10). Moreover, in unreported regressions
we also examined whether the effect of invalidation is different for patents that receive greater
press coverage and we find no evidence of this interaction effect. These results strongly indicate
that the effect of patent invalidation which we estimate is not explained by media publicity.
Strategic Citation
Finally, the increase in citations caused by patent invalidation could reflect the propen-
sity of small patentees to ‘strategically withhold citations’ to patents of large firms in order to
stay below their radar screen, rather than a real blocking impact on the underlying innovation
by small firms. There are several reasons why we think that this strategic behavior is unlikely
to play a big role in our setting. First, previous studies show that large firms are more likely to
withhold citations strategically (Lampe [2012]), whereas we find that the effect of invalidation
is driven by a post-decision increase in citations by small firms. Second, our measure includes
citations both by the patent applicant and those added by the USPTO examiner. Thus an
37
increase in citations after invalidation would imply, not only strategic behavior by the appli-
cants, but also errors by examiners in overlooking relevant prior art. Our estimated impact
— a 520 percent increase in citations from small firms — would imply an unreasonably large
error rate by patent examiners, especially given that our sample contains well known patents.
Finally, the strategic citation interpretation is hard to reconcile with a lagged effect of patent
invalidation on later citations, which we documented in Section 4.
In view of the preceding discussion, we interpret our findings as evidence in support of
the conclusion that patent rights block follow-on innovation in a few specific technology fields.
However, we emphasize that our findings do not imply that removal of patent rights in these
areas would necessarily be beneficial. This is because invalidation of one patent in a regime
with patent rights is very different from a regime without patent rights. First, in the presence
of patent rights, research is conducted under the expectation of obtaining rents in the form of
product market monopoly profits and licensing royalties from follow-on innovators. These rents
would be expected to (largely) disappear in a regime without patents and this would reduce,
perhaps sharply, incentives to conduct such R&D. Moreover, theoretical models of cumulative
innovation show that such policies have ambiguous effects on overall innovation incentives. In
models with two generations, weaker patent protection shifts rents toward downstream firms,
increasing their incentives but reducing incentives for first generation research. The role of
patent rights is even more ambiguous in a fully dynamic setting, where each innovation is
both upstream and downstream at different stages of its life (Green and Scotchmer [1995];
Hopenhayn, Llobet and Mitchell [2006]). Second, economic research has documented that
patents play an important signalling role in capital markets, and in particular, enable small
firms to attract venture capital investors more effectively (e.g. Conti, Thursby and Thursby
[2013]). Third, we would expect the direction of technical change to be different in a regime
without patents. Innovators will have greater incentives to invest in research that can be
more easily protected through trade secrets and for which reverse engineering and copying is
more difficult. Moser (2005) provides some supporting evidence for this idea using data from
nineteenth century World Fairs. All these issues would need to be part of a broader welfare
assessment of patent rights, but this is beyond the scope of the paper.
38
9 Concluding Remarks
In this paper we estimate the causal effect of patent rights on cumulative innovation, using
patent invalidation decisions of the U.S. Federal Circuit Court of Appeals. The identification
strategy exploits variation in the propensity of judges to invalidate and the fact that the three-
judge panels are generated by a random computer algorithm. There are three key empirical
findings in the paper. First, invalidation leads to a 50 percent increase in subsequent citations to
the focal patent, on average. Second, the impact of patent invalidation is highly heterogeneous,
with large variation across patents and technology fields in ways that are consistent with the
blocking effect of patents arising from bargaining failure between upstream and downstream
innovators. Third, we find that this effect is concentrated in patents owned by large firms that
appear to block small innovators.
While a welfare assessment of patent rights is well beyond the scope of this paper, our
findings provide good reason to believe that a wholesale scaling back of patent rights may
not be the appropriate policy. Patent rights block cumulative innovation only in very specific
environments, and this suggests that government policies to address this problem should be
targeted. It is preferable to design policies and institutions that facilitate more efficient licensing
(such as the biomedical institutions studied by Furman and Stern [2011]), which is the key to
removing the blocking effect of patents and promoting cumulative innovation.
39
References
[1] Acemoglu, Daron, “Diversity and Technological Progress,” in Josh Lerner and Scott Stern,
eds., The Rate and Direction of Inventive Activity Revisited (2012 Chicago: University of
Chicago Press).
[2] Acemoglu, Daron and Ufuk Akcigit,“Intellectual Property Rights Policy, Competition and
Innovation,” Journal of the European Economic Association, 10 (2012), 1-42.
[3] Aghion, Philippe and Peter Howitt, “A Model of Growth through Creative Destruction,”
Econometrica, 60 (1992), 323-351.
[4] Aghion,Philippe, Peter Howitt and Susanne Prantl, “Patent Rights, Product Market Re-
forms, and Innovation,” NBER Working Paper 18854, 2013.
[5] Angrist, Joshua, Guido Imbens and Alan Krueger, “Jackknife instrumental variables esti-
mation,” Journal of Applied Econometrics, 14 (1999), 57-67.
[6] Azoulay, Pierre, Joshua Graff Zivin and Jialan Wang, "Superstar Extinction," Quarterly
Journal of Economics, 125 (2012), 549-589.
[7] Bessen, James and Eric Maskin, “Sequential innovation, patents, and imitation,” RAND
Journal of Economics, 40 (2009), 611-635.
[8] Bloom, Nick, Mark Schankerman, and John Van Reenen, “Identifying Technology
Spillovers and Product Market Rivalry,” Econometrica, 81 (2013), 1347—1393.
[9] Bolton, Patrick and Joseph Farrell, “Decentralization, duplication and delay,” Journal of
Political Economy, 98 (1990), 803-826.
[10] Budish, Eric, Benjamin Roin and Heidi Williams, “Do Fixed Patent Terms Distort Inno-
vation? Evidence from Cancer Clinical Trials,” NBER working paper 19430, 2014.
[11] Carneiro, Pedro, James Heckman and Edward Vytlacil, “Evaluating Marginal Policy
Changes and the Average Effect of Treatment for Individuals at the Margin,” Economet-
rica, 78 (2010), 377-394.
[12] Cohen, Wesley, Richard Nelson and John Walsh, “Protecting Their Intellectual Assets:
Appropriability Conditions and Why U.S. Manufacturing Firms Patent (or Not),” NBER
Working Paper 7552, 2000.
[13] Conti Annamaria, Jerry Thursby and Marie Thursby, “Patents as signals for startup fi-
nancing,” Journal of Industrial Economics, 22 (2013), 592-622.
[14] Crawford, Vincent, and Haller, Hans, “Learning How to Cooperate,” Econometrica, 58
(1990), 571-595.
[15] Cremer, Jacques and Richard McLean, “Optimal Selling Strategies under Uncertainty
for a Discriminating Monopolist When Demands Are Interdependent,” Econometrica, 53
(1985), 345-361.
[16] Dahl, Gordon, Andreas Kostol and Magne Mogstad, “Family Welfare Cultures”, NBER
working paper 1937, 2013.
40
[17] Di Tella, Rafael and Ernesto Schargrodsky, “Criminal Recidivism after Prison and Elec-
tronic Monitoring,” Journal of Political Economy, 121 (2013), 28-73.
[18] Dobbie Will and Jae Song, “Debt Relief and Debtor Outcomes: Measuring the Effects of
Consumer Bankruptcy Protection,” working paper 2013.
[19] Doyle, Joseph, “Child Protection and Child Outcomes: Measuring the Effects of Forster
Care,” American Economic Review, 97 (2007), 1583-1610.
[20] Doyle, Joseph, “Child Protection and Adult Crime: Using Investigator Assignment to
Estimate Causal Effects of Foster Care,” Journal of Political Economy, 116 (2008), 746-
770.
[21] Feddersen, Timothy and Wolfgang Pesendorfer, “The Swing Voter Curse,” American Eco-
nomic Review, 86 (1996), 408-424.
[22] Federal Trade Commission, The Evolving IP Marketplace: Aligning Patent Notice and
Remedies with Competition, (2011 Washington D.C.: Government Printing Office).
[23] Finkelstein, Amy, “Static and Dynamic Effects of Health Policy: Evidence from the Vac-
cine Industry,” Quarterly Journal of Economics, 119 (2004), 527-564.
[24] Fisher Timo and Joachim Henkel, “Patent trolls on markets for technology — An empirical
analysis of NPEs’ patent acquisitions,” Research Policy, 41 (2012), 1519—1533.
[25] Furman, Jeffrey and Scott Stern, “Climbing atop the Shoulders of Giants: The Impact of
Institutions on Cumulative Research,” American Economic Review, 101 (2011), 1933-1963.
[26] Galasso, Alberto, “Broad Cross-License Negotiations,” Journal of Economics and Man-
agement Strategy, 21 (2012), 873-911.
[27] Galasso, Alberto and Mark Schankerman, “Patent Thickets, Courts and the Market for
Innovation”, RAND Journal of Economics, 41 (2010), 472-503.
[28] Galasso, Alberto, Mark Schankerman and Carlos Serrano, “Trading and Enforcing Patent
Rights,” RAND Journal of Economics, 44 (2013), 275-312.
[29] Green, Jerry and Suzanne Scotchmer, “On the Division of Profit in Sequential Innovation,”
RAND Journal of Economics, 26 (1995), 20-33.
[30] Griliches, Zvi, "The Search for R&D Spillovers," Scandinavian Journal of Economics, 94
(1992), 29-47.
[31] Grossman, Gene and Elhanan Helpman, Innovation and Growth in the Global Economy
(1991 Cambridge: MIT Press).
[32] Hall, Bronwyn, Adam Jaffe and Manuel Tratjenberg, “The NBER Patent Citation Data
File: Lessons, Insights and Methodological Tools,” NBER Working Paper 8498, 2001.
[33] Heller, Mark and Rebecca Eisenberg, “Can Patents Deter Innovation? The Anticommons
in Biomedical Research,” Science, 280 (1998), 698-701.
41
[34] Henry Matthew and John Turner, “The Court of Appeals for the Federal Circuit’s Impact
on Patent Litigation,” Journal of Legal Studies, 35 (2006), 85-117.
[35] Hopenhayn, Hugo, Gerard Llobet and Matthew Mitchell, “Rewarding Sequential Innova-
tors: Prizes, Patents and Buyouts,” Journal of Political Economy, 114 (2006), 1041-1068.
[36] Kitch, Edmund, “The Nature and Function of the Patent System,” Journal of Law and
Economics, 20 (1977), 265-290.
[37] Kling, Jeffrey, “Incarceration Length, Employment and Earnings,” American Economic
Review, 96 (2006), 863-876.
[38] Koo, Bonwoo and Brian Wright, “Dynamic Effect of Patent Policy on Sequential Innova-
tion,” Journal of Economics and Management Strategy 19 (2010), 489-512.
[39] Lampe, Ryan, “Strategic Citation,” Review of Economics and Statistics, 94 (2012), 320-
333.
[40] Lanjouw, Jean and Mark Schankerman, “Characteristics of Patent Litigation: A Window
on Competition,” RAND Journal of Economics, 32 (2001), 129-151.
[41] Lanjouw, Jean and Mark Schankerman, “Protecting Intellectual Property Rights: Are
Small Firms Handicapped?” Journal of Law and Economics, 47 (2004), 45-74.
[42] Lanjouw, Jean and Mark Schankerman, “Patent Quality and Research Productivity: Mea-
suring Innovation with Multiple Indicators,” Economic Journal, 114 (2004), 441-465.
[43] Lemley, Mark and Carl Shapiro, “Patent Hold-Up and Royalty Stacking,” Texas Law
Review, 85 (2007), 1991-2049.
[44] Lerner, Josh and Jean Tirole, “Efficient Patent Pools,” American Economic Review, 94
(2004), 691-711.
[45] Levin, Richard, Alvin Kievorick, Richard Nelson and Sidney Winter, “Appropriating the
returns from industrial R&D,” Brookings Papers on Economic Activity, 3 (1987), 783-820.
[46] Li, Danielle, “Expertise vs. Bias in Evaluation: Evidence from the NIH,” working paper
Northwestern University, 2012.
[47] Maestas, Nicole, Kathleen Mullen, and Alexander Strand, “Does Disability Insurance Re-
ceipt Discourage Work? Using Examiner Assignment to Estimate Causal Effects of SSDI
Receipt,” American Economic Review, 103 (2013), 1797-1829.
[48] Mokyr, Joel, The Gifts of Athena: Historical Origins of the Knowledge Economy (2002
Princeton: Princeton University Press).
[49] Moser, Petra, “How Do Patent Laws Influence Innovation? Evidence from Nineteenth-
Century World’s Fairs”, American Economic Review, 95 (2005), 1214-1236.
[50] Moser, Petra and Paul Rhode, “Did plant patents create the American rose?,” NBER
working paper 16983, 2011.
42
[51] Murray, Fiona and Scott Stern, “Do formal intellectual property rights hinder the free
flow of scientific knowledge? An empirical test of the anti-commons hypothesis,” Journal
of Economic Behavior and Organization, 63 (2007), 648-687.
[52] Murray, Fiona, Philippe Aghion, Mathias Dewatrapont, Julian Kolev and Scott Stern,
“Of Mice and Academics: The Role of Openness in Science,” MIT Sloan Working Paper,
2008.
[53] Rivers, Douglas and Quang Vuong, “Limited Information Estimators and Exogeneity Tests
for Simultaneous Probit Model,” Journal of Econometrics, 39 (1998), 347-365.
[54] Rosenberg, Nathan, Perspectives on Technology (1976 Cambridge: Cambridge University
Press)
[55] Schankerman, Mark and Ariel Pakes, “Estimates of the Value of Patent Rights in European
Countries during the Post-1950 Period,” Economic Journal, 96 (1986), 1052-1076.
[56] Serrano, Carlos, “The Dynamics of the Transfer and Renewal of Patents,” RAND Journal
of Economics, 41 (2010), 686-708.
[57] Williams, Heidi, “Intellectual Property Rights and Innovation: Evidence from the Human
Genome,” Journal of Political Economy, 121 (2013), 1-27
[58] Wooldridge, Jeffrey, Econometric Analysis of Cross-Section and Panel Data (2002 Cam-
bridge: MIT Press)
[59] Ziedonis, Rosemarie, “Don’t Fence Me In: Fragmented Markets for Technology and the
Patent Acquisition Strategies of Firms,” Management Science, 50 (2004), 804-820.
43
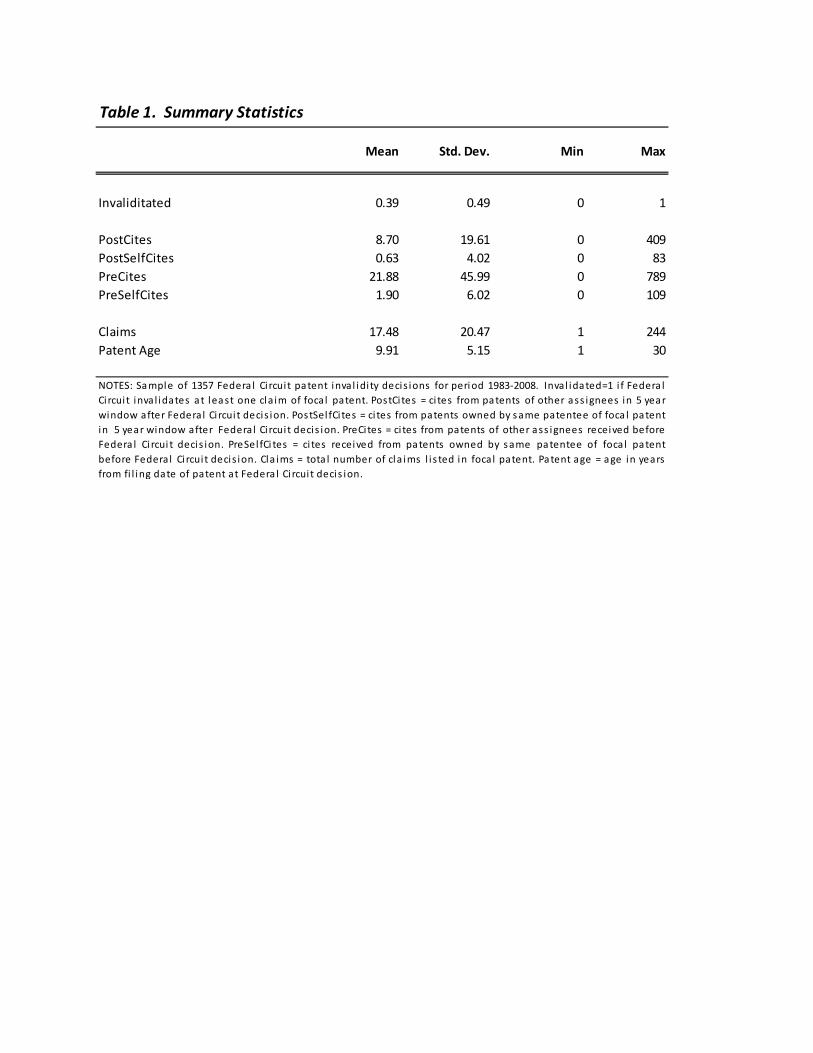
Mean Std. Dev. Min Max
Invaliditated 0.39 0.49 0 1
PostCites 8.70 19.61 0 409
PostSelfCites 0.63 4.02 0 83
PreCites 21.88 45.99 0 789
PreSelfCites 1.90 6.02 0 109
Claims 17.48 20.47 1 244
Patent Age 9.91 5.15 1 30
Table 1. Summary Statistics
NOTES: Sa mple of 1357 Federa l Ci rcui t pa tent inval i di ty decis ions for peri od 1983-2008. Inval ida ted=1 i f Federa l
Ci rcui t inval idates a t lea st one cla im of focal patent. PostCi tes = ci tes from pa tents of other a ss ignees in 5 yea r
window after Federal Ci rcui t decis ion. PostSel fCi tes = ci tes from patents owned by s ame patentee of foca l pa tent
in 5 year window after Federal Ci rcui t decis ion. PreCites = ci tes from patents of other a ss ignees received before
Federa l Ci rcui t decis ion. PreSel fCi tes = ci tes received from pa tents owned by s ame pa tentee of focal pa tent
before Federal Ci rcui t decis ion. Cla ims = tota l number of cla ims l i s ted in focal patent. Pa tent age = a ge in years
from fi l ing date of patent at Federa l Ci rcui t decis ion.
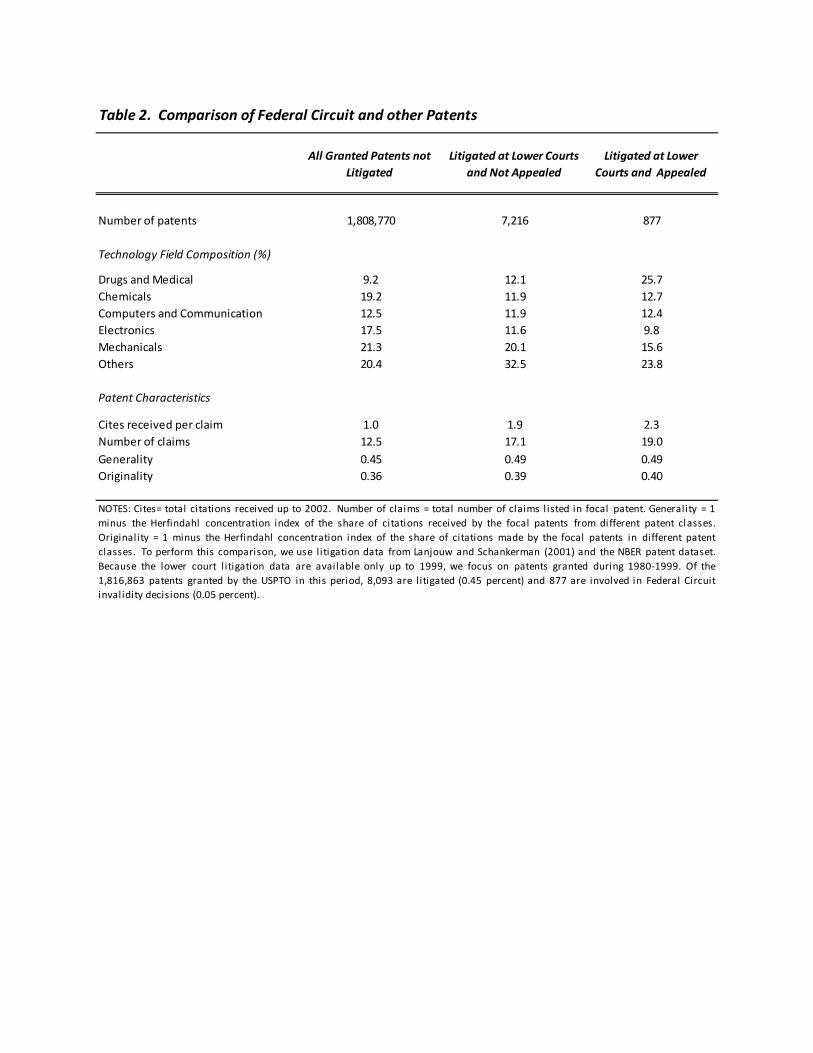
All Granted Patents not
Litigated
Litigated at Lower Courts
and Not Appealed
Litigated at Lower
Courts and Appealed
Number of patents 1,808,770 7,216 877
Technology Field Composition (%)
Drugs and Medical 9.2 12.1 25.7
Chemicals 19.2 11.9 12.7
Computers and Communication 12.5 11.9 12.4
Electronics 17.5 11.6 9.8
Mechanicals 21.3 20.1 15.6
Others 20.4 32.5 23.8
Patent Characteristics
Cites received per claim 1.0 1.9 2.3
Number of claims 12.5 17.1 19.0
Generality 0.45 0.49 0.49
Originality 0.36 0.39 0.40
Table 2. Comparison of Federal Circuit and other Patents
NOTES: Cites= total citations received up to 2002. Number of claims = total number of claims l isted in focal patent. Generality = 1
minus the Herfindahl concentration index of the share of citations received by the focal patents from different patent classes.
Originality = 1 minus the Herfindahl concentration index of the share of citations made by the focal patents in different patent
classes. To perform this comparison, we use litigation data from Lanjouw and Schankerman (2001) and the NBER patent dataset.
Because the lower court litigation data are available only up to 1999, we focus on patents granted during 1980-1999. Of the
1,816,863 patents granted by the USPTO in this period, 8,093 are litigated (0.45 percent) and 877 are involved in Federal Circuit
invalidity decisions (0.05 percent).
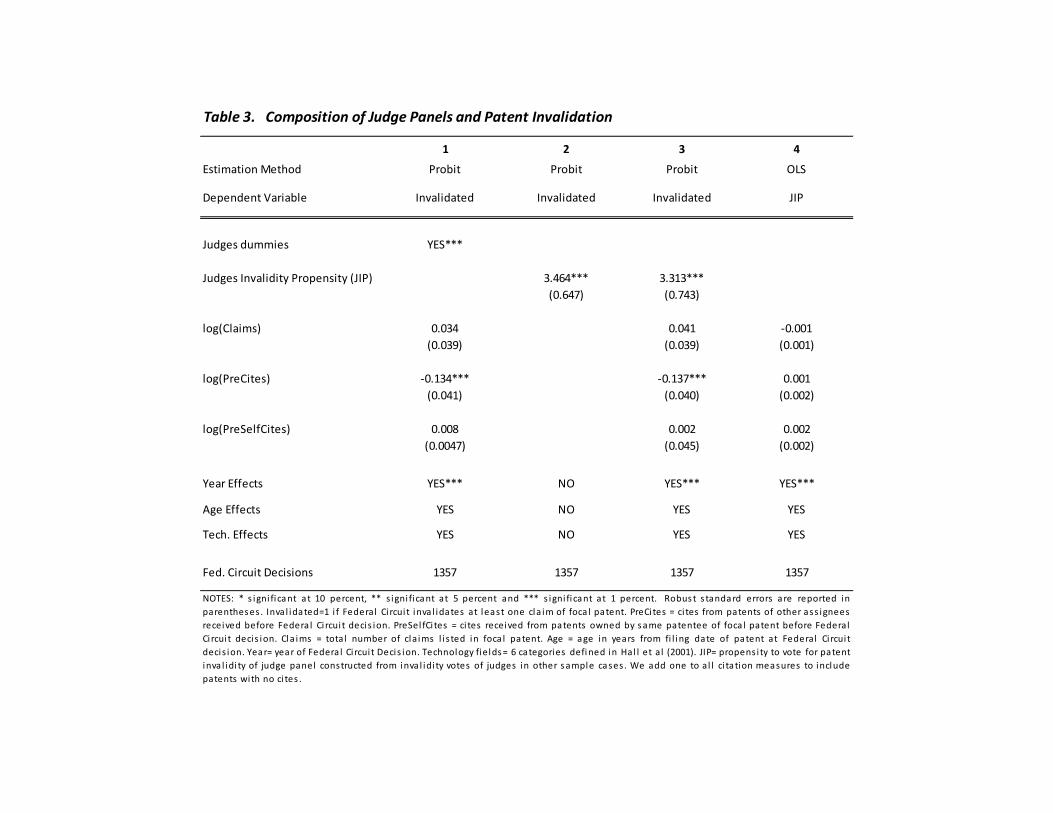
1 2 3 4
Estimation Method Probit Probit Probit OLS
Dependent Variable Invalidated Invalidated Invalidated JIP
Judges dummies YES***
Judges Invalidity Propensity (JIP) 3.464*** 3.313***
(0.647) (0.743)
log(Claims) 0.034 0.041 -0.001
(0.039) (0.039) (0.001)
log(PreCites) -0.134*** -0.137*** 0.001
(0.041) (0.040) (0.002)
log(PreSelfCites) 0.008 0.002 0.002
(0.0047) (0.045) (0.002)
Year Effects YES*** NO YES*** YES***
Age Effects YES NO YES YES
Tech. Effects YES NO YES YES
Fed. Circuit Decisions 1357 1357 1357 1357
Table 3. Composition of Judge Panels and Patent Invalidation
NOTES: * s igni ficant at 10 percent, ** s igni ficant at 5 percent and *** s igni ficant at 1 percent. Robus t s tandard errors are reported in
parenthes es. Inva l idated=1 i f Federal Ci rcui t inva l idates at least one cla im of foca l patent. PreCites = ci tes from patents of other ass ignees
received before Federa l Ci rcui t decis ion. PreSel fCi tes = ci tes received from patents owned by s ame patentee of foca l patent before Federal
Ci rcui t decis ion. Cla ims = total number of claims l i sted in foca l patent. Age = age in years from fi l ing date of patent at Federal Ci rcui t
decis ion. Year= year of Federa l Ci rcui t Decis ion. Technology fields = 6 categories defi ned in Hal l et al (2001). JIP= propensi ty to vote for patent
inva l idi ty of judge panel constructed from inva l idi ty votes of judges in other s ample cases. We add one to al l ci tation measures to include
patents with no ci tes .
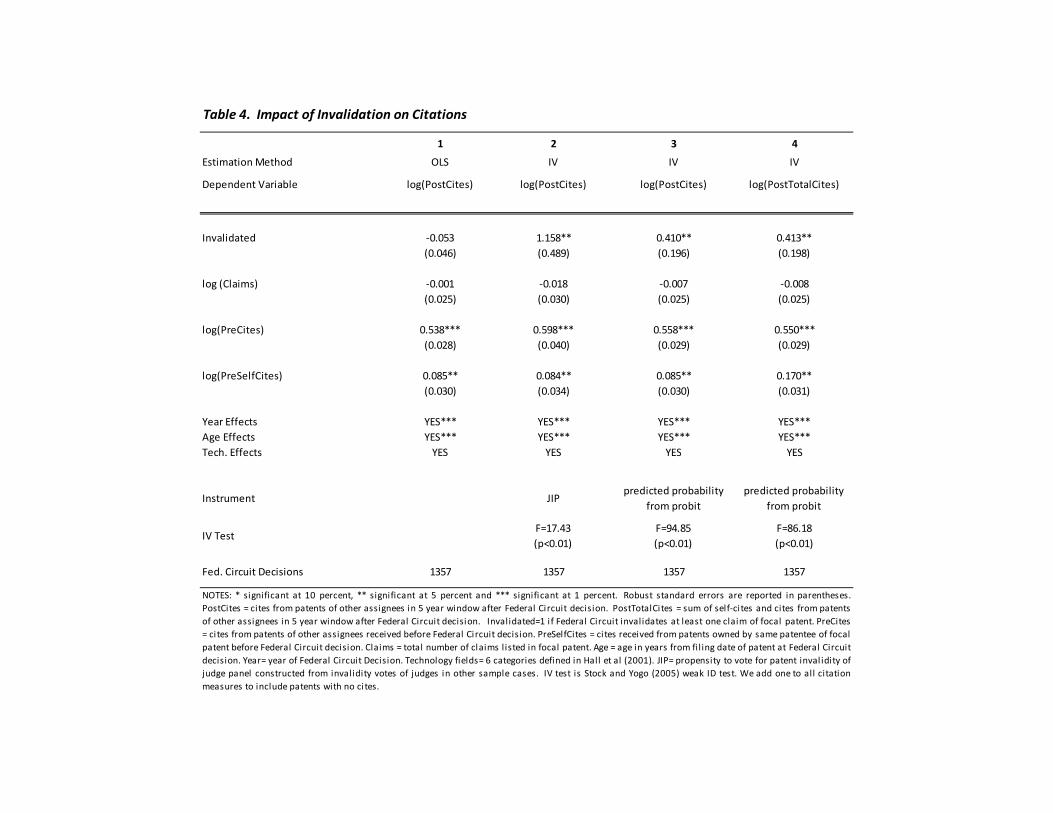
1 2 3 4
Estimation Method OLS IV IV IV
Dependent Variable log(PostCites) log(PostCites) log(PostCites) log(PostTotalCites)
Invalidated -0.053 1.158** 0.410** 0.413**
(0.046) (0.489) (0.196) (0.198)
log (Claims) -0.001 -0.018 -0.007 -0.008
(0.025) (0.030) (0.025) (0.025)
log(PreCites) 0.538*** 0.598*** 0.558*** 0.550***
(0.028) (0.040) (0.029) (0.029)
log(PreSelfCites) 0.085** 0.084** 0.085** 0.170**
(0.030) (0.034) (0.030) (0.031)
Year Effects YES*** YES*** YES*** YES***
Age Effects YES*** YES*** YES*** YES***
Tech. Effects YES YES YES YES
Instrument JIPpredicted probability
from probit
predicted probability
from probit
IV TestF=17.43
(p<0.01)
F=94.85
(p<0.01)
F=86.18
(p<0.01)
Fed. Circuit Decisions 1357 1357 1357 1357
Table 4. Impact of Invalidation on Citations
NOTES: * significant at 10 percent, ** significant at 5 percent and *** significant at 1 percent. Robust standard errors are reported in parentheses.
PostCites = cites from patents of other assignees in 5 year window after Federal Circuit decision. PostTotalCites = sum of self-cites and cites from patents
of other assignees in 5 year window after Federal Circuit decision. Invalidated=1 if Federal Circuit invalidates at least one claim of focal patent. PreCites
= cites from patents of other assignees received before Federal Circuit decision. PreSelfCites = cites received from patents owned by same patentee of focal
patent before Federal Circuit decision. Claims = total number of claims listed in focal patent. Age = age in years from fil ing date of patent at Federal Circuit
decision. Year= year of Federal Circuit Decision. Technology fields= 6 categories defined in Hall et al (2001). JIP= propensity to vote for patent inval idity of
judge panel constructed from invalidity votes of judges in other sample cases. IV test is Stock and Yogo (2005) weak ID test. We add one to all citation
measures to include patents with no cites.
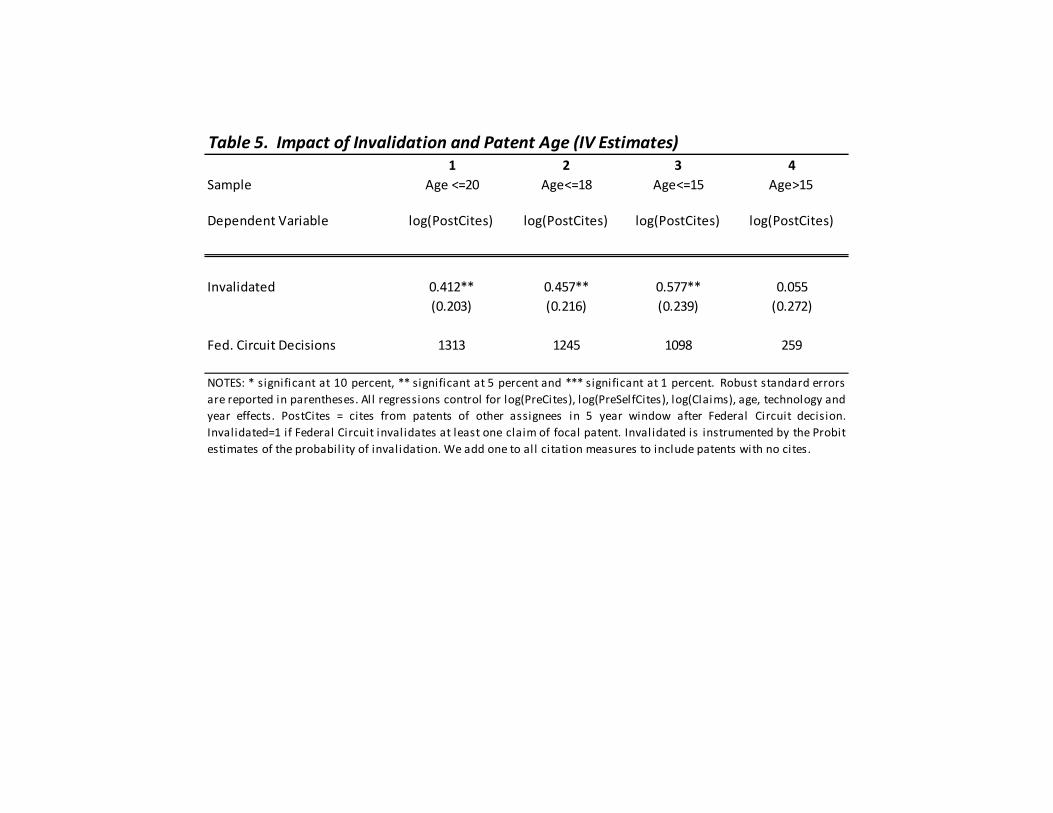
1 2 3 4
Sample Age <=20 Age<=18 Age<=15 Age>15
Dependent Variable log(PostCites) log(PostCites) log(PostCites) log(PostCites)
Invalidated 0.412** 0.457** 0.577** 0.055
(0.203) (0.216) (0.239) (0.272)
Fed. Circuit Decisions 1313 1245 1098 259
Table 5. Impact of Invalidation and Patent Age (IV Estimates)
NOTES: * significant at 10 percent, ** significant at 5 percent and *** significant at 1 percent. Robust standard errors
are reported in parentheses. All regressions control for log(PreCites), log(PreSelfCites), log(Claims), age, technology and
year effects. PostCites = cites from patents of other assignees in 5 year window after Federal Circuit decision.
Invalidated=1 if Federal Circuit inval idates at least one claim of focal patent. Inval idated is instrumented by the Probit
estimates of the probabil ity of invalidation. We add one to al l citation measures to include patents with no cites.
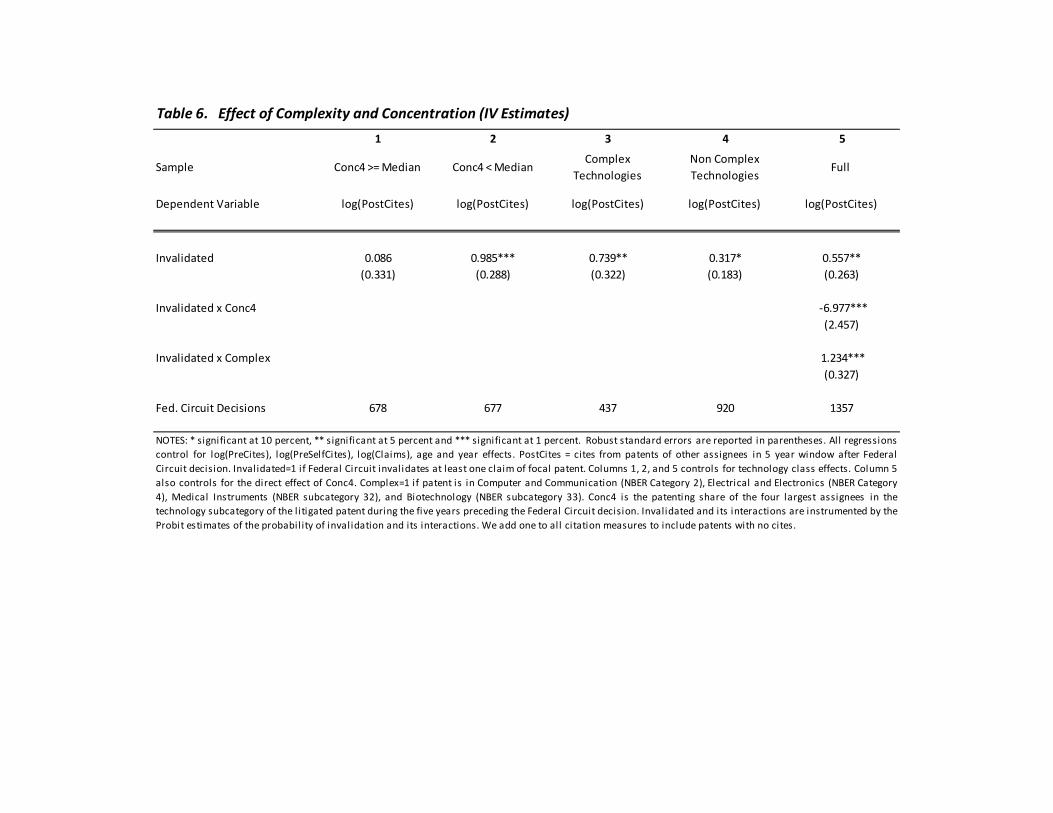
1 2 3 4 5
Sample Conc4 >= Median Conc4 < MedianComplex
Technologies
Non Complex
TechnologiesFull
Dependent Variable log(PostCites) log(PostCites) log(PostCites) log(PostCites) log(PostCites)
Invalidated 0.086 0.985*** 0.739** 0.317* 0.557**
(0.331) (0.288) (0.322) (0.183) (0.263)
Invalidated x Conc4 -6.977***
(2.457)
Invalidated x Complex 1.234***
(0.327)
Fed. Circuit Decisions 678 677 437 920 1357
NOTES: * significant at 10 percent, ** significant at 5 percent and *** significant at 1 percent. Robust standard errors are reported in parentheses. All regressions
control for log(PreCites), log(PreSelfCites), log(Claims), age and year effects. PostCites = cites from patents of other assignees in 5 year window after Federal
Circuit decision. Invalidated=1 if Federal Circuit invalidates at least one claim of focal patent. Columns 1, 2, and 5 controls for technology class effects. Column 5
also controls for the direct effect of Conc4. Complex=1 if patent is in Computer and Communication (NBER Category 2), Electrical and Electronics (NBER Category
4), Medical Instruments (NBER subcategory 32), and Biotechnology (NBER subcategory 33). Conc4 is the patenting share of the four largest assignees in the
technology subcategory of the l itigated patent during the five years preceding the Federal Circuit decision. Invalidated and its interactions are instrumented by the
Probit estimates of the probabil ity of invalidation and its interactions. We add one to all citation measures to include patents with no cites.
Table 6. Effect of Complexity and Concentration (IV Estimates)
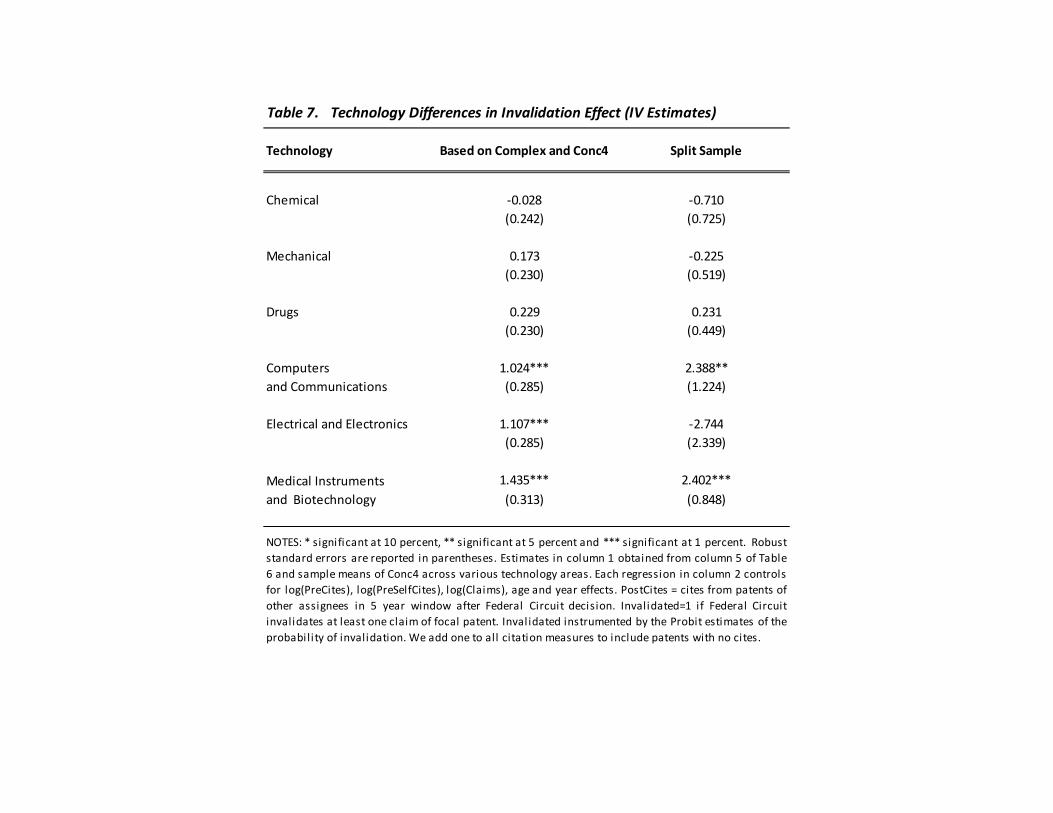
Table 7. Technology Differences in Invalidation Effect (IV Estimates)
Technology Based on Complex and Conc4 Split Sample
Chemical -0.028 -0.710
(0.242) (0.725)
Mechanical 0.173 -0.225
(0.230) (0.519)
Drugs 0.229 0.231
(0.230) (0.449)
Computers 1.024*** 2.388**
and Communications (0.285) (1.224)
Electrical and Electronics 1.107*** -2.744
(0.285) (2.339)
Medical Instruments 1.435*** 2.402***
and Biotechnology (0.313) (0.848)
NOTES: * significant at 10 percent, ** significant at 5 percent and *** significant at 1 percent. Robust
standard errors are reported in parentheses. Estimates in column 1 obtained from column 5 of Table
6 and sample means of Conc4 across various technology areas. Each regression in column 2 controls
for log(PreCites), log(PreSelfCites), log(Claims), age and year effects. PostCites = cites from patents of
other assignees in 5 year window after Federal Circuit decision. Invalidated=1 if Federal Circuit
invalidates at least one claim of focal patent. Inval idated instrumented by the Probit estimates of the
probability of invalidation. We add one to all citation measures to include patents with no cites.
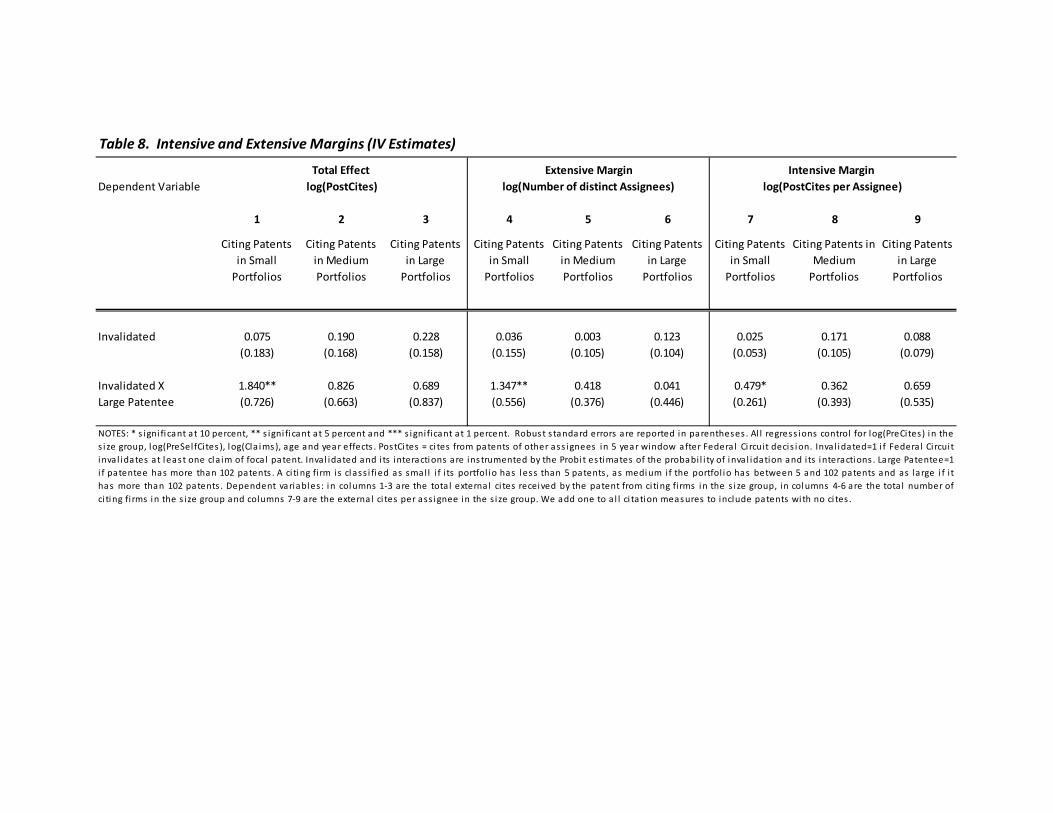
Dependent Variable
1 2 3 4 5 6 7 8 9
Citing Patents
in Small
Portfolios
Citing Patents
in Medium
Portfolios
Citing Patents
in Large
Portfolios
Citing Patents
in Small
Portfolios
Citing Patents
in Medium
Portfolios
Citing Patents
in Large
Portfolios
Citing Patents
in Small
Portfolios
Citing Patents in
Medium
Portfolios
Citing Patents
in Large
Portfolios
Invalidated 0.075 0.190 0.228 0.036 0.003 0.123 0.025 0.171 0.088
(0.183) (0.168) (0.158) (0.155) (0.105) (0.104) (0.053) (0.105) (0.079)
Invalidated X 1.840** 0.826 0.689 1.347** 0.418 0.041 0.479* 0.362 0.659
Large Patentee (0.726) (0.663) (0.837) (0.556) (0.376) (0.446) (0.261) (0.393) (0.535)
Table 8. Intensive and Extensive Margins (IV Estimates)
NOTES: * s igni fi cant at 10 percent, ** s igni fi cant at 5 percent and *** s ignificant at 1 percent. Robust s tandard errors are reported in parentheses . Al l regress ions control for log(PreCites) in the
s i ze group, log(PreSelfCites ), log(Cla ims), age and year effects . PostCi tes = ci tes from patents of other ass ignees in 5 year window after Federa l Ci rcuit decis ion. Inva l idated=1 i f Federa l Circuit
inva l idates at leas t one cla im of foca l patent. Inva l idated and i ts interactions are ins trumented by the Probi t es timates of the probabi l i ty of inva l idation and i ts interactions . Large Patentee=1
i f patentee has more than 102 patents . A ci ting firm is class i fied as smal l i f i ts portfol io has less than 5 patents , as medi um if the portfol io has between 5 and 102 patents and as large i f i t
has more than 102 patents . Dependent variables: in columns 1-3 are the tota l externa l ci tes received by the patent from ci ting firms in the s i ze group, in columns 4-6 are the tota l number of
ci ting fi rms in the s ize group and columns 7-9 are the externa l ci tes per ass ignee in the s i ze group. We add one to a l l ci tation measures to include patents wi th no ci tes .
Total Effect Extensive Margin Intensive Margin
log(PostCites) log(PostCites per Assignee)log(Number of distinct Assignees)
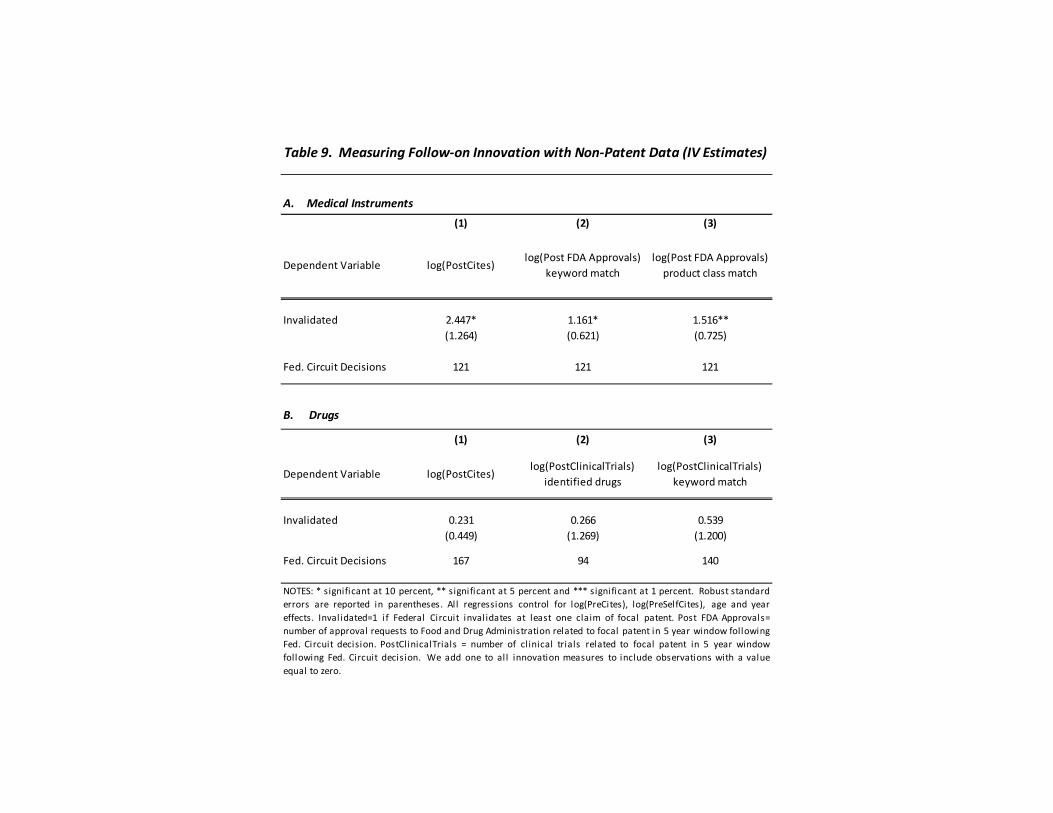
(1) (2) (3)
Dependent Variable log(PostCites)log(Post FDA Approvals)
keyword match
log(Post FDA Approvals)
product class match
Invalidated 2.447* 1.161* 1.516**
(1.264) (0.621) (0.725)
Fed. Circuit Decisions 121 121 121
(1) (2) (3)
Dependent Variable log(PostCites)log(PostClinicalTrials)
identified drugs
log(PostClinicalTrials)
keyword match
Invalidated 0.231 0.266 0.539
(0.449) (1.269) (1.200)
Fed. Circuit Decisions 167 94 140
NOTES: * significant at 10 percent, ** significant at 5 percent and *** significant at 1 percent. Robust standard
errors are reported in parentheses. All regressions control for log(PreCites), log(PreSelfCites), age and year
effects. Invalidated=1 if Federal Circuit invalidates at least one claim of focal patent. Post FDA Approvals=
number of approval requests to Food and Drug Administration related to focal patent in 5 year window following
Fed. Circuit decision. PostClinicalTrials = number of cl inical trials related to focal patent in 5 year window
following Fed. Circuit decision. We add one to all innovation measures to include observations with a value
equal to zero.
Table 9. Measuring Follow-on Innovation with Non-Patent Data (IV Estimates)
A. Medical Instruments
B. Drugs
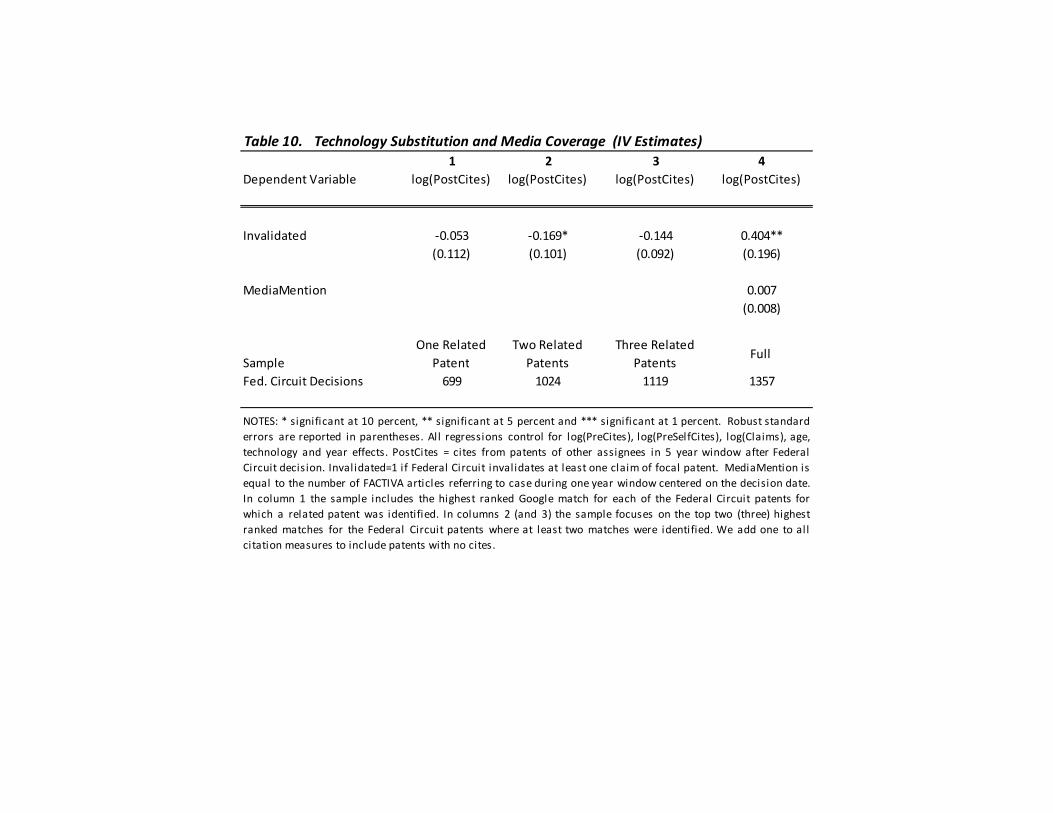
Table 10. Technology Substitution and Media Coverage (IV Estimates)
1 2 3 4
Dependent Variable log(PostCites) log(PostCites) log(PostCites) log(PostCites)
Invalidated -0.053 -0.169* -0.144 0.404**
(0.112) (0.101) (0.092) (0.196)
MediaMention 0.007
(0.008)
Sample
One Related
Patent
Two Related
Patents
Three Related
PatentsFull
Fed. Circuit Decisions 699 1024 1119 1357
NOTES: * significant at 10 percent, ** significant at 5 percent and *** significant at 1 percent. Robust standard
errors are reported in parentheses. All regressions control for log(PreCites), log(PreSelfCites), log(Claims), age,
technology and year effects. PostCites = cites from patents of other assignees in 5 year window after Federal
Circuit decision. Invalidated=1 if Federal Circuit invalidates at least one claim of focal patent. MediaMention is
equal to the number of FACTIVA articles referring to case during one year window centered on the decision date.
In column 1 the sample includes the highest ranked Google match for each of the Federal Circuit patents for
which a related patent was identified. In columns 2 (and 3) the sample focuses on the top two (three) highest
ranked matches for the Federal Circuit patents where at least two matches were identified. We add one to all
citation measures to include patents with no cites.
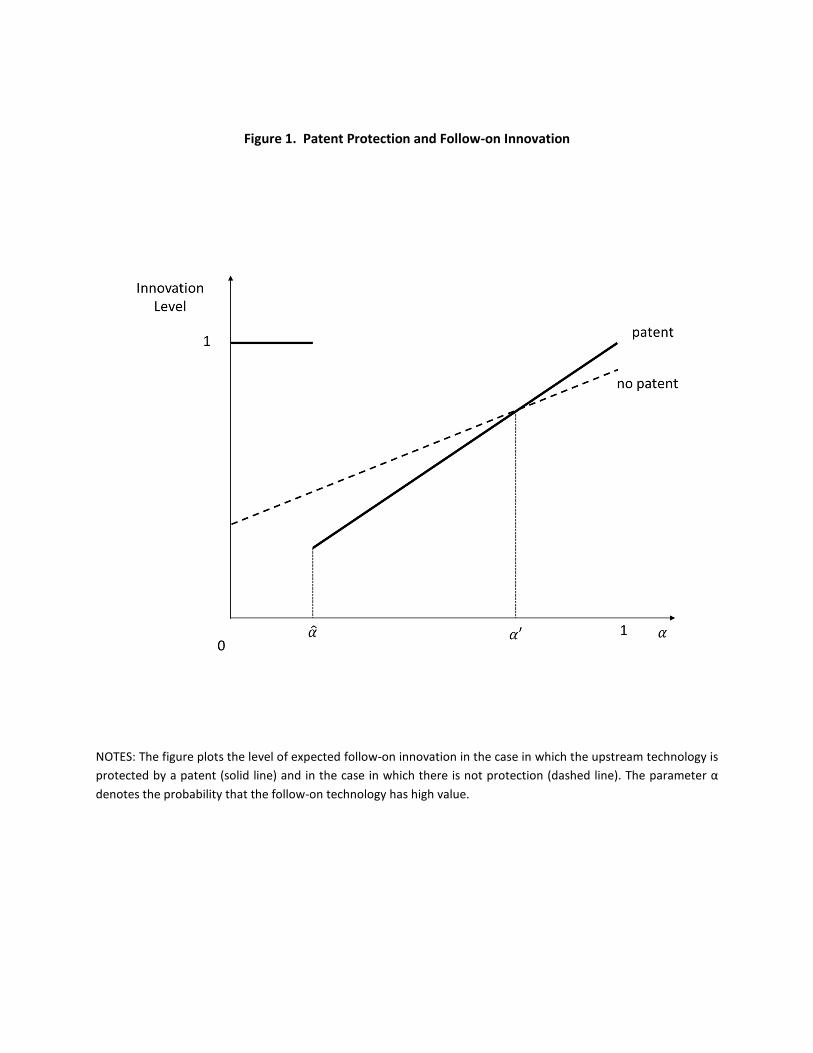
Figure 1. Patent Protection and Follow-on Innovation
NOTES: The figure plots the level of expected follow-on innovation in the case in which the upstream technology is
protected by a patent (solid line) and in the case in which there is not protection (dashed line). The parameter α
denotes the probability that the follow-on technology has high value.
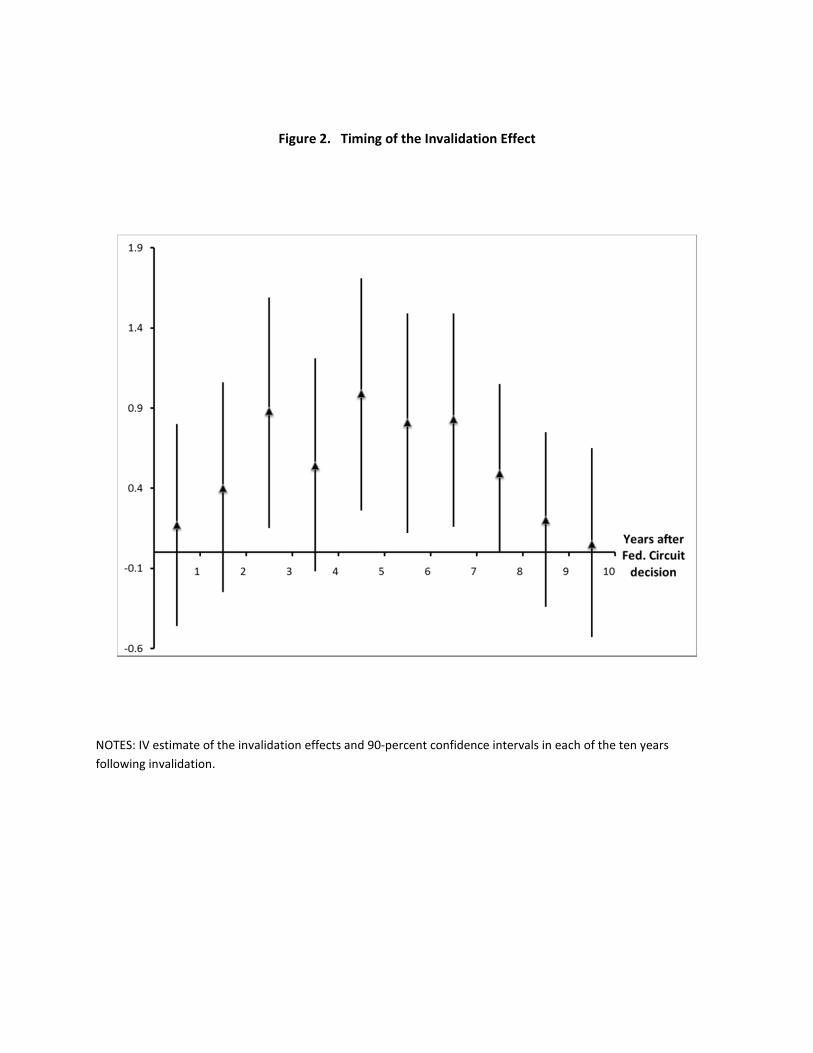
Figure 2. Timing of the Invalidation Effect
NOTES: IV estimate of the invalidation effects and 90-percent confidence intervals in each of the ten years
following invalidation.
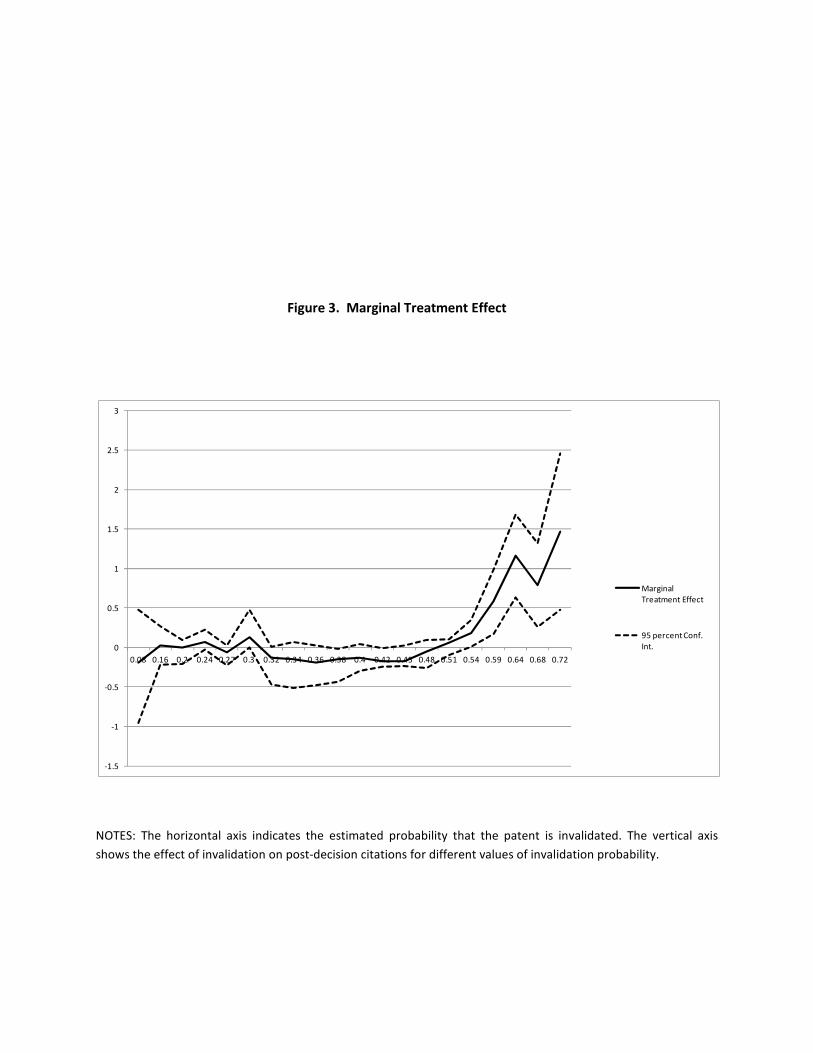
Figure 3. Marginal Treatment Effect
NOTES: The horizontal axis indicates the estimated probability that the patent is invalidated. The vertical axis
shows the effect of invalidation on post-decision citations for different values of invalidation probability.
-1.5
-1
-0.5
0
0.5
1
1.5
2
2.5
3
0.08 0.16 0.2 0.24 0.27 0.3 0.32 0.34 0.36 0.38 0.4 0.42 0.45 0.48 0.51 0.54 0.59 0.64 0.68 0.72
Marginal
Treatment Effect
95 percent Conf.
Int.
ONLINE APPENDIX
Patents and Cumulative Innovation:
Causal Evidence from the Courts
Alberto GalassoUniversity of Toronto and NBER
Mark SchankermanLondon School of Economics and CEPR
1 Microfounding the JIP Measure
We develop a simple model of strategic voting, closely following Feddersen and Pesendorfer
(1996). There are three judges i ∈ {1, 2, 3} who must decide whether a patent is valid (V ) or
not invalid (N). Judges are uncertain about the validity of the patent and each judge gets a
signal v or n that is correlated with the true state. Specifically we assume that
Pr(v|V ) = Pr(n|N) = pi.
The parameter pi ∈ [p, p] with .5 < p < p < 1 is the probability that a judge receives the
correct signal. The parameter pi can be interpreted as the ‘complexity’ of the case for judge i.
The assumption that the signals are private information is standard in the literature on voting.
Feddersen and Pesendorfer (1996) provide a number of reasons why the complete disclosure of
private information may not occur. For example, some judges may have technical knowledge
that is relevant for the case but difficult to communicate. Moreover, differences in preferences
for patent validity may reduce the incentives to reveal private information in deliberations.
The judges vote simultaneously either to validate or invalidate and the decision is taken
by majority voting. There are two outcomes: either the patent is invalidated (1) or not (0).
We assume that each judge maximizes her expected utility and that preferences are given by
u(1,N) = u(0, V ) = 0 and u(1, V ) = −qi and u(0, N) = −(1− qi). The parameter qi charac-
terizes the judge’s threshold of reasonable doubt. Let βi(n) denote the posterior probability
for judge i that the patent is invalid, conditional on obtaining an invalidity signal and being
pivotal, i.e that the other two judges, x and z, receive different signals from each other. Let
βi(v) denote the posterior probability for judge i that the patent is invalid, conditional on
obtaining a validity signal and being pivotal:
βi(n) =pi(1− px)pz
pi(1− px)pz + (1− pi)(1− px)pz= pi
βi(v) =(1− pi)(1− px)pz
pi(1− p)pz + (1− pi)(1− px)pz= 1− pi.
We assume that βi(v) < qi < βi(n) for each i. Feddersen and Pesendorfer (1996) show that
if this assumption is satisfied each judge in equilibrium will vote according to his signal (i.e.,
what they call ‘informative’ voting). More specifically, a pivotal judge receiving an invalidity
signal will vote for invalidity as long as her expected utility is higher from doing so:
βi(n)0− (1− βi(n))qi ≥ (1− βi(n))0− βi(n)(1− qi)
1
which is satisfied because we assumed qi < βi(n). She will also vote for validity if she receives
a validity signal because βi(v) < qi. Moreover, note that βi(v) = 1 − pi and βi(n) = pi , so
the condition for an informative equilibrium is always satisfied as long as 1− p < qi < p.
We assume that the complexity of a case, pi, is an i.i.d. draw from a distribution F (p)
with support [p, p] and that 1− p < qi < p. The ex ante probability that judge i will vote for
invalidity will be 1−F (qi) ≡ fi and the expected number of invalidity votes in the three judge
panel will be equal to
JIP = f1f2f3 + f1f2(1− f3) + f1(1− f2)f3 + (1− f1)f2f3.
Given the random allocation of judges to cases, the sample average of a judge’s validity votes
will be an unbiased estimator of her probability of voting for validity. Moreover, JIP is a
consistent estimator of the number of validity votes in the three judge panel (it is not unbiased,
as it is a nonlinear transformation of the f i’s).
2 Randomization and Heterogeneity of Judges: Robustness
As additional evidence on the randomization of judges to cases, Table A2 reports the correla-
tions between JIP and various subsets of patent characteristics. In each regression we include
a control for the year of the Federal Circuit decision. The table confirms that there is no
significant correlation between JIP and the patent variables used in our analysis. Moreover,
the point estimates of the coefficients are close to zero, indicating that the magnitude of the
correlation is very small. Columns (1) to (4) present separate regressions for claims, citations,
self-citations and age. In column (5) we present the correlation between the technology dum-
mies and JIP. We cannot reject the hypothesis that the coefficients on the technology field
dummies are jointly equal to zero (p-value=0.41). In column (6) we regress JIP on all these
patent characteristics. We cannot reject the hypothesis that the coefficients on all these vari-
ables (except year dummies) are jointly equal to zero (p-value =of 0.73). Column (7) shows
that we obtain similar results if we replace the linear control for age with a full set of age fixed
effects. In this regression we cannot reject that the coefficients on the age dummies are jointly
equal to zero (p-value=0.79) and the test that the coefficients on all patent characteristics
(except year dummies) are zero (p-value=0.82).
We also provide additional evidence on the heterogeneity of the propensity of judges
2
to invalidate. Specifically, we show that the estimated variation is inconsistent with a setup
in which judge decisions reflect identical voting propensities plus random error. To do this,
we construct a counterfactual where judges vote according to the same random process. We
generate a simulated judge vote that takes into account the effect of observable patent char-
acteristics on the probability of invalidation. To construct the simulated votes, we use the
following procedure. First, we regress the votes of each judge on observable characteristics of
the cases, without including judge fixed effects, and then construct the predicted probability
of an invalidity vote for each judge j for patent p, based on these characteristics, φjp, and the
regression residuals, ejp. Second, we add to the probability φjp a random draw ωjp from a nor-
mal distribution with mean and standard deviation equal to the mean and standard deviation
of the distribution of the regression residuals. Finally, the simulated invalidity vote for judge
j for patent p is set equal to one if the sum of the predicted invalidity and the random draw
(φjp+ ωjp) is above one. We obtain very similar results using different thresholds. We use the
simulated vote to estimate judge fixed effects and find that they are not statistically significant
(p-value=0.66). In Figure A2 we compare the distribution of these fixed effects from simulated
votes with the (statistically significant) fixed effects estimated using actual voting behavior.
The difference between the two distributions is striking: the variance of the Federal Circuit
fixed effects is much larger than the one we would observe if judges were voting on the basis of
identical propensities plus random error.
3 Effect of Patent Invalidation: Robustness
In this section we describe a series of robustness checks on our main finding of positive effect
of invalidation on follow-on innovation. Estimates for some of these regressions are reported in
Table A3.
First, in the text we treated an invalidation judgement as the final verdict. However,
parties to the dispute have the right to appeal the decision of the Federal Circuit to the Supreme
Court (which retains discretion over whether to hear the case). This means that invalidation
of a patent by the Federal Circuit retains some uncertainty, so that downstream innovators
whom the patent blocked might not respond until this uncertainty is removed. In our context,
this is equivalent to saying that our key variable, Invalidation, contains some measurement
error. In theory, any such error should be taken care of by our instrumental variable estimation.
3
Nonetheless, as a further check we identified that the patent invalidity cases appealed to the
Supreme Court in our data set. Only 23 Federal Circuit decisions were reviewed by the Supreme
Court in the period 1982-2008 (Golden, 2009). Only 12 of these cases are in our dataset (the
others involve issues other than patent validity).We drop these cases and re-estimate the model
(by IV). In column 1 of Table A3 we show that the estimated effect is very close to the baseline
coefficient of 0.410.
Second, the baseline model incorporates fixed effects for six broad (one-digit) technology
fields. We also estimate a specification which uses a more refined technology classification — 32
two-digit subcategories from the NBER. Column 2 of Table A3 shows that the point estimate
of the coefficient on Invalidation is nearly double the baseline estimate but less precise, 0.915
(standard error = 0.422), and we cannot reject the null hypothesis that the two estimated
coefficients are the same (p-value=0.11). In the paper we retain the one-digit technology field
dummies. We do this because the empirical analysis often involves using smaller subsamples
split along various dimensions. As a robustness check, we re-estimate all of those regressions
using the more detailed, two-digit technology field dummies and obtain qualitatively (and in
most cases, quantitatively) similar results, but the estimates are less precise.
Third, the citations information obtained from the USPTO ends in 2010, so the latest
years in the sample are subject to truncation. Moreover, citations are obtained from a dataset
of patent grants (but note that they are linked to litigated patents using the application date)
- this is always the case using the USPTO - and this may potentially amplify the truncation
concerns. We run a series of robustness checks to assess whether truncation is an issue in our
study. First, while our baseline specification controls for year effects and these mitigate the
truncation problem, there may be concern that the truncation problems differ by technology
field since citation patterns vary. To address this, in Table A3 we introduce interactions between
the year and technology category dummy variables to allow truncation effects to be different
across technology classes. Column 3 shows that the coefficient on invalidity is very similar to
the one estimated in the baseline. Column 4 restricts the sample to patent decisions that
take place before 2003, for which we have a complete 5-year time window of citations and
thus expect truncation to be less severe. Results are robust and the coefficient on invalidity is
slightly larger than, but not statistically different from, the one in our baseline regression. We
also estimate the invalidity effect focusing on patents litigated before 2000. This is equivalent
4
to dropping about half of the sample. Also in this case the result is robust and the coefficient
is equal to 0.361 (std. error = 0.158), which is very similar to our baseline estimate.
As a complementary approach to correct more directly for truncation, we adjusted ci-
tation totals for Federal Circuit decisions in which we observe only a portion of the five year
post-decision interval. To perform this correction, we exploit the “quasi-structural” citation
lag distribution estimated in Hall, Jaffe and Trajtenberg (2001). They provide an estimate of
the distribution of citations received over the life of patents across different technology classes.1
Their estimates allow us to inflate the citations received by patents for which we observe only a
fraction of the five year window, taking into account the propensity of patents in that technology
field to be cited at the specific age in which data are missing.
This correction generates a negligible increase in the sample average of the citations
received in the five years after invalidation (from 8.70 to 8.77). Nonetheless, for patents with
truncated post-decision windows, the average external cites received increase by 40 percent
(from 1.08 to 1.52), which highlights the impact of truncation. Nonetheless, in column 5, we
show that replacing our main citation measure with the truncation-adjusted measure does not
affect our baseline results. The estimated coefficient is 0.437, which is only slightly larger than
the one estimated in our baseline regression. As an additional test, we exploit the estimates
by Hall, Jaffe and Trajtenberg (2001) to inflate the citations received in the five year window
after invalidation in order to obtain a predicted 10-year post-decision citations total for each
patent. Not surprisingly, with this correction, the sample average of post-decision citations
increases substantially, from 8.70 to 14.76. Nonetheless, the estimated impact of invalidation
is robust — using this measure, the estimated coefficient is 0.460 (standard error =0.229). The
estimated effect based on the post-decision 10-year window is very similar to the one estimated
for the five year window when we adjust for truncation. This is consistent with our finding in
the paper on the timing of the effect — where we estimated that most of the effect takes place
in the third to sixth years following invalidation.
Fourth, one may be concerned that citations have a geographic component and the effect
of invalidation could be different for foreign and domestic patentees (remember that all our
1The estimates are made under the assumptions of (i) proportionality (the shape of the distribution isindependent of the total number of citations received), (ii) stationarity (the distribution does not depend on thecohort of the patent) and (iii) patents do not received citations after 35 years of age.
5
sample patents are in the U.S.). There are at least two reasons why the effect of invalidation
of a patent in the U.S. might affect foreign follow-on innovators less strongly. First, if licensing
barriers represent only a small fraction of the overall costs associated with entry into the U.S.
market, removal of patent protection may not have a major impact on the decisions of later
foreign innovators. Second, the patent in the U.S. confers protection only in the U.S., while the
decision to innovate depends on profits that can earned in the global market. Thus the impact
of invalidation of the U.S. patent will depend on the relative importance of the U.S. market to
the follow-on innovators and this may differ for domestic and foreign innovators.
To address this concern empirically, we exploit the USPTO assignee type codes informa-
tion and constructed new measures that distinguish between citations originating from domestic
(U.S.) innovators citations and foreign innovators and then examine whether the invalidation
effect is different for the two groups. On average, 27 percent of the citations received by the
patents in our sample before the Federal Circuit decision belong to foreign innovators. We re-
estimate our baseline regression using each of these two dependent variables and found that the
invalidation effect is exclusively driven by an increase in citations by domestic follow-on inno-
vators. Column 6 in Table A3 shows the estimated effect for subsequent citations by domestic
patentees. For citations by foreign owners, the estimated coefficient is an order of magnitude
smaller and not statistically significant. This result is consistent with the idea that it is costly
for foreign innovators to patent in U.S. and that licensing frictions represent only a fraction of
the total cost sustained (or possibly that the U.S. market is relatively less important for foreign
innovators).
Additional Unreported Tests
Finally, we conduct a set of additional robustness tests that are not reported in Table A3.
First, the baseline specification incorporates a full set of patent age fixed effects. However,
the age distribution of citations may vary across technology fields (for evidence, Jaffe and
Trajtenberg, 2002). To allow for this, we extend the specification by including a full set
of interactions between the technology field and age dummies. The estimated coefficient on
Invalidation is 0.401 (standard error = 0.192), which is nearly identical to the baseline estimate.
The second robustness check involves how to treat patents that receive no citations before
the Federal Court decision (4 percent of the sample) and those that receive no cites in the five
year widow after the decision (23 percent of the sample). In our baseline specification we ‘fix’
6
this problem by using log(PostCites+ 1), which is common practice but may introduce bias.
We re-estimate the baseline model adding dummy variables for patents that received no cites
before the Federal Circuit decision and for patents that receive no cites after the decision. The
results are robust — the point estimate on Invalidation is 0.449 (standard error = 0.167). We
get similar results if we drop these patents from the sample entirely. We get similar results if we
use the number of citations without logarithmic transformation as the dependent variable (once
suitably transformed for comparability). Finally, we also estimated a Poisson count model by
instrumental variables (using the predicted probability of invalidation P̂ as the instrument).
The point estimate is 0.638 (standard error = 0.321) which is larger than, but not statistically
different from, the baseline coefficient. In the analysis in the paper, we do not use the Poisson
model because the econometric techniques that we use to estimate the heterogenous marginal
treatment effect of patent invalidation have only been developed for linear models.
Third, there is a concern that some Federal Circuit decisions may involve rulings that
limit the scope of patentable subject matter rather than simply assessing the validity of the
focal patent. Such decisions could reduce subsequent citations for the entire technology field,
leading us to underestimate the true blocking effect of patent rights. To address this, we
identified the most important Federal Circuit decisions that relate to patentable subject matter
during our sample period (the main sources are Dolmeage, 2006 and Kappos et. al., 2008). We
obtained a list of 14 Federal Circuit decisions that are concentrated in the areas of software,
business methods and biotechnology, of which only three are in our sample. There are very few
cases in our sample because most of the key Federal Circuit decisions on patentable subject
matter do not involve granted patents but only patent applications. Moreover, because of their
importance, some of these cases are decided ‘en banc’ by the entire court and not by a panel
of three judges. We excluded such special cases from our sample. Dropping the three decisions
that were in our sample and re-estimating the model, we obtain coefficients that are nearly
identical to the baseline estimates.
Finally, we examine robustness of our results when controlling for competition in two
ways. First, the size of the patentee is likely to shape the levels of product market and tech-
nology competition with other firms. We control for the size of the patentee, measured as the
size of its patent portfolio (number of patents granted in the five years preceding the Federal
Circuit decision) and obtain an estimated invalidation effect that is very similar to the baseline.
7
Second, competitive pressure is also likely to depend on the concentration of firms operating
in a technology area. Controls for concentration with the share of the four largest patentees
(or the Herfindahl index of patent ownership) in the two-digit technology sub-category of the
litigated patent yields very similar results.
We also look at the difference in invalidation effect across different samples comprising
patents with different level of pre-invalidation citations. To conduct these exercises, we create
a new variable equal to the (logarithm) of pre-invalidation citations filtered by age effects,
year effects, technology effects, number of claims and pre-invalidation self-citations. We find
no evidence of a larger (or smaller) effect of invalidation for patents that receive more pre-
invalidation (normalized) citations.
4 Intensive and Extensive Margins: Robustness
We conduct extensive robustness checks on the regressions in Table 8. We report the estimates
for some of these regressions in Table A4. First, we vary the thresholds for defining ‘small’ firms
(≤ 1, 10 and 15 patents), and for defining ‘large’ firms (≥ 75, 110 and 150 patents). Second,
we re-estimate the effects of patent invalidation by splitting the samples between large and
non-large patentees. We also break down the category of non-large patentees into two groups,
small and medium sized firms. In all of these experiments, the pattern that emerges in Table 8
is extremely robust. In every case the effect of invalidation is concentrated on the subsequent
citations by small innovators to focal patents held by large firms, and it is predominantly an
extensive margin effect.
Because of sample size, we cannot allow the effect of invalidation to vary with technology
field in these regressions (we do allow for additive field effects, however). If citations from small
citers to large patentees are overrepresented in fragmented and complex technology fields, where
we found blockage was more likely, our finding that blocking effect of invalidation is limited
to the large patentee-small citing firm category could be simply a technology field composition
effect. To check this concern, we examined the percent of citations in each technology field
accounted for by citations by small to large patentees. The technology fields where invalidation
has a statistically significant blocking effect (medical instruments, electronics and computers)
are not those with the largest fraction of citations from small to large patentees — the mean
fraction of sample citations from small to large patentees is 7.4 percent in these fields, as
8
compared to 9.9 percent in the other fields. We conclude that our empirical finding is not due
to a technology field composition effect.
We also try to disaggregate the blocking effect of patents owned by large firms into the
effect on new entrants versus small existing firms. To identify new entrants, for each citation
received by a Federal Circuit patent, we identified those that are the very first citation for the
assignee. Specifically, we label a citation as an ‘entry citation’ if the patent application is the
one for which the assignee appears for the first time in the USPTO dataset. This procedure has
a number of limitations. First, the USPTO data report information on assignees in electronic
format only from 1976 and this truncation may lead us to overestimate entry. Second, a firm
may patent using multiple assignee numbers, and this can also lead us to overestimate entry.
Moreover, for about 12.5 percent of the citations we cannot identify an assignee from the
USPTO dataset. These patents are either owned by the original inventor at the grant date
or have been assigned to U.S. individuals by the grant date. Treating all of these citations as
‘entry’ citations is likely to overestimate entry, while treating them as not associated with entry
will lead to the opposite bias. When we treat all unassigned citations as entry citations and
re-estimate the model, we again find that invalidation of large firm patents causes entry of new
innovators, but has no effect on patent owned by small and medium-sized owners. The point
estimate is 0.880, which is broadly similar to our estimate of the extensive margin effect of
invalidation of patents held by large firms on small firms. However, when we treat unassigned
citations as non-entry citations we find no statistically significant effect of invalidation. Overall,
these findings provide some limited evidence for the hypothesis that Federal Circuit invalidation
induces entry of new innovators. But this conclusion does depend on how we treat ‘unmatched’
citations. To go further than this, one could need to have a more reliable measure of entry.2
2Future research may explore more in detail entrepreneurial entry focusing on a smaller sample of inval-idated patents and to identify follow-on individual innovators by manually matching their names to patents(the challenge arises because USPTO data report non-standardized innovator names). A possible approach toconduct this task is the Jaccard weighted distance matching (see Galasso, Schankerman and Serrano, 2013 forapplications of this method). But this is beyond the scope of the present paper.
9
5 Using Non-Patent Data to Measure Follow-on Innovation:
Data Construction and Robustness
5.1 Medical Instruments
Data Construction
Following the Medical Device Amendments Act passed by Congress in 1976, the U.S.
Food and Drug Administration (FDA) has primary authority to regulate medical devices sold
in U.S. These products are subject to a regulatory process that requires detailed product
information and evidence of safety from clinical trials. The FDA releases data on approval
requested for medical instruments. We construct a new measure of cumulative innovation by
linking FDA approval requests to the medical instrument patents in our sample.
Specifically, there are two types of medical instrument approval processes that can take
place at the FDA. The first and more common approval is the 510k premarketing submission
made to FDA to demonstrate that the device to be marketed is safe and effective. This
procedure is for ‘low risk’ and ‘moderate risk’ devices. The second, less common and more
stringent approval is the Premarket Approval (PMA) application for ‘high risk’ devices. The
FDA data indicate that, for the period 1981-2013, there were about 125,000 requests for 510k
approvals and 26,000 requests for PMA approval.
In our sample of patents litigated at the Federal Circuit, there are 121 cases involving
medical devices (NBER sub-categories 32 and 39). To link patents with FDA approval requests,
for each patent we identify a set of keywords related to the technology and search for FDA
approval requests that contain such keywords. We carefully read the abstract and title of
each litigated patent and collected one ‘primary’ keyword and up to two ‘secondary’ keywords
for each of the patents in our sample. Exploiting these keywords, we construct our first two
measures of cumulative innovation. The first one, Approvals_1, is equal to the number of FDA
approval requests (PMA and 510k) for which the product name contains the primary keyword.
The second one, Approvals_2, is equal to the number of FDA approval requests (PMA and
510k) for which the product name contains at least one of the keywords (primary or secondary)
of the patent. As in our baseline analysis, the dependent variables are constructed focusing on
a five year window following the Federal Circuit decision. The regressions control for the total
number of applications in the period between the grant of the patent and the Federal Circuit
decision, as well as for the other controls employed in our baseline regression.
10
The correlation between citations received in the five years after the decision and Ap-
provals_1 is 0.3; the correlation with Approvals_2 is 0.1. If we exclude potentially unmatched
patents (patents receiving citations before invalidation but that could not be matched to any
FDA approval requests), the correlation between cites and Approvals_1 increases to 0.4 and
the one between cites and Approvals_2 increases to 0.3.
As a second approach to exploit FDA approval data to measure cumulative innovation,
we assign each litigated patent to a set of product codes among the roughly 6,000 product
codes in which the FDA classifies medical devices. Also in this case we distinguish between a
‘primary’ product code and up to two ‘secondary’ codes. We construct two additional measures
of cumulative innovation counting the number of FDA approval requests (PMA and 510k) in
the same product code of the litigated patent. The first measure only counts applications in
the primary product code, whereas the second one includes primary and secondary product
codes. The correlation with the citations received before invalidation is roughly equal to 0.1
for both of these measures of cumulative innovation.
Both measures based on “primary” and “extended” sets of keywords and product classes
may be associated with two distinct types of measurement errors. Focusing on primary key-
words and product classes may lead to under-counting follow-on innovation, if applications
related to the patented technologies do not include the keyword or are in a different product
classes. However, enlarging the number of keywords or patents may lead to over-counting
follow-on innovation if we include products that are not related to the patented technology.
Results
Column 2 in Panel A of Table 9 in the paper shows the effect of invalidation using
Approvals_2 as dependent variable, the measure constructed exploiting an extended set of
keywords. The estimated effect using Approvals_1 as dependent variable, the measure based
only on the primary keyword is very similar — the point estimate is 1.116 (standard error
=0.617). Column 3 in the same panel uses the measure based on the applications in all the
product classes (primary and secondary) assigned to the patent. The estimated coefficient us-
ing as the dependent variable the number of applications in the primary product class assigned
to the patent is 0.378 (std. err. = 0.635). The sign of the coefficient suggests a positive effect
of invalidation on follow on innovation, but the estimate is not statistically significant. As
we discussed above, measures based on primary and extended sets are likely to be subject to
11
countervailing measurement errors. The differences in magnitude, and statistical insignificance
using the measure based on products in the primary class, suggest that this measure may sub-
stantially under-count the extent of cumulative innovation (and thus be subject to attenuation
bias).
5.2 Drugs
Data Construction
In our sample 167 patent cases involve drug patents (patents belonging to the NBER
category 3 but not in the sub-categories of Medical Instruments and Biotechnology). As an
alternative to citations, in this technology field we measure cumulative innovation by identifying
the subsequent clinical trials that are related to each Federal Circuit patent. To this end, we
match each patent to the trade name of a drug, recover information on the active ingredients
of the drug, and collect data on clinical trials that refer to the active ingredients.
Our data source for clinical trials is the website ClinicalTrials.gov, which is a registry
database of publicly and privately supported clinical studies of human participants. Clinical-
Trials.gov was created as a result of the Food and Drug Administration Modernization Act
of 1997 that required the U.S. Department of Health and Human Services to establish a reg-
istry of clinical trials information. The site was made available to the public in 2000 and only
reports clinical trials from 2000 onwards. Therefore, in order to have at least two years of
post-litigation clinical trials data for each patent, most of our analysis will focus on patents
litigated after 1997 (140 patent cases).
For each of the Federal Circuit drug patent in our sample, we identified the trade name
of the drug protected by the patent. Such information was obtained from a multiplicity of
sources: the text of the court decision, the FDA Orange Book (Approved Drug Products with
Therapeutic Equivalence Evaluations) and specialized web-sites (in particular, DrugPatent-
Watch.com). We were able to match a patent with a drug for 94 patent cases, about 68 percent
of our post-1997 sample. Cases in which the drug was not identified mostly involved patents
related to DNA recombination, gene expressions and methods for conducting clinical tests. For
the cases in which we were not able to match a patent with a specific drug, we collected up to
three keywords describing the technology, after careful reading of the patent title and abstract.
For all these matched drugs, we identify the active ingredients. Also in this case the
12
information was obtained from a multiplicity of sources: the text of the court decision, the
Orange Book and specialized web-sites (especially from DrugPatentWatch.com or the Merck
Index Online). Only 10 of the 94 patents have multiple active ingredients. Finally, for each
of the matched patents, we obtained information on the clinical trials related to the active
ingredient conducted in the five years following the Federal Circuit decision. The information
was obtained from a text search in ClinicalTrials.gov with the active ingredient as keyword. In
the case of multiple active ingredients, we search for each ingredient separately and measure
clinical trials as the sum of trials involving any of the ingredients.
The average number of clinical trials in the five years that follow invalidation is 134.41
(standard deviation = 125.76). The correlation between citations received in the five years
after the Federal Circuit decision and clinical trials is 0.15, and 0.18 in the subsample of drugs
with only one active ingredient.
Results
Column 2 in Panel A of Table 9 in the paper shows the invalidation effect using the
number of trials as the dependent variable. This column focuses only of the sample of matched
drugs, those for which we identified a trade name associated with the patent. Results are
consistent with those obtained using the patent citation measure. The coefficient is positive
but statistically insignificant and its magnitude is very similar.
In column 3 we enlarge the sample including unmatched patents. The number of clinical
trials for these patents is equal to the number of trials referring both to the primary and
secondary keywords of the patent. The coefficient remains insignificant and its magnitude is
slightly higher than the one in the previous columns. If we measure clinical trials for unmatched
drugs by counting the clinical trials, referring only to the primary keyword, the estimated
coefficient is 0.364 (standard error = 1.128) and also in this case the estimate is statistically
insignificant.
6 Substitute Patents: Data Construction
We define a U.S. patent as related to the litigated patent if it has been granted before the
decision date and it appears in the top ten related patent documents listed by Google. We
collect a maximum of five related patents for each patent litigated at the Federal Circuit. The
Google algorithm identified at least one related patent for 699 Federal Circuit decisions (about
13
52 percent of our sample). About 27 percent of these observations have only one matched
related patent, 20 percent have two related patents and 53 percent have three or more related
patents. For the Federal Circuit patents for which we were able to find at least one match,
we first confirm that the estimated causal effect of invalidation on citations is similar to the
one obtained in the full sample. Specifically, the IV coefficient is 0.541 (std. error = 0.257),
implying an increase in citations of approximately 70 percent.
We then re-estimated the baseline model but using as the dependent variable the citations
to the related patents. In doing this, we experiment with a variety of alternative samples (e.g.,
balanced samples with top four or five related patents, as well as unbalanced samples where
we keep all of the related patents identified by Google). All the regressions show a negative
relationship between the post-decision citations to related patents and the invalidation of the
focal patent, providing some support for the substitution hypothesis. Nonetheless, the estimates
tend to be small and often statistically insignificant, confirming that the substitution hypothesis
cannot explain much of the increase in citation caused by Federal Circuit invalidation.
14
References
[1] Dolmeage, Brianna (2006), “The evolution of patentable subject matter in the United
States,” Whittier Law Review, 27: 1023-1045
[2] Feddersen, Timothy and Wolfgang Pesendorfer (1996) “The Swing Voter Curse,” American
Economic Review, 86: 408-424
[3] Golden, John (2009), “The Supreme Court as "Prime Percolator": A Prescription for Ap-
pellate Review of Questions in Patent Law,” UCLA Law Review, 56: 657-724
[4] Hall, Bronwyn, Adam Jaffe and Manuel Tratjenberg (2001) “The NBER Patent Citation
Data File: Lessons, Insights and Methodological Tools,” NBER Working Paper 8498
[5] Kappos David, John Thomas and Randall Bluestone (2008), “A Technological contribu-
tion requirement for patentable subject matter: Supreme Court Precedent and Policy,”
Northwestern Journal of Technology and Intellectual Property, 6: 152-170
15
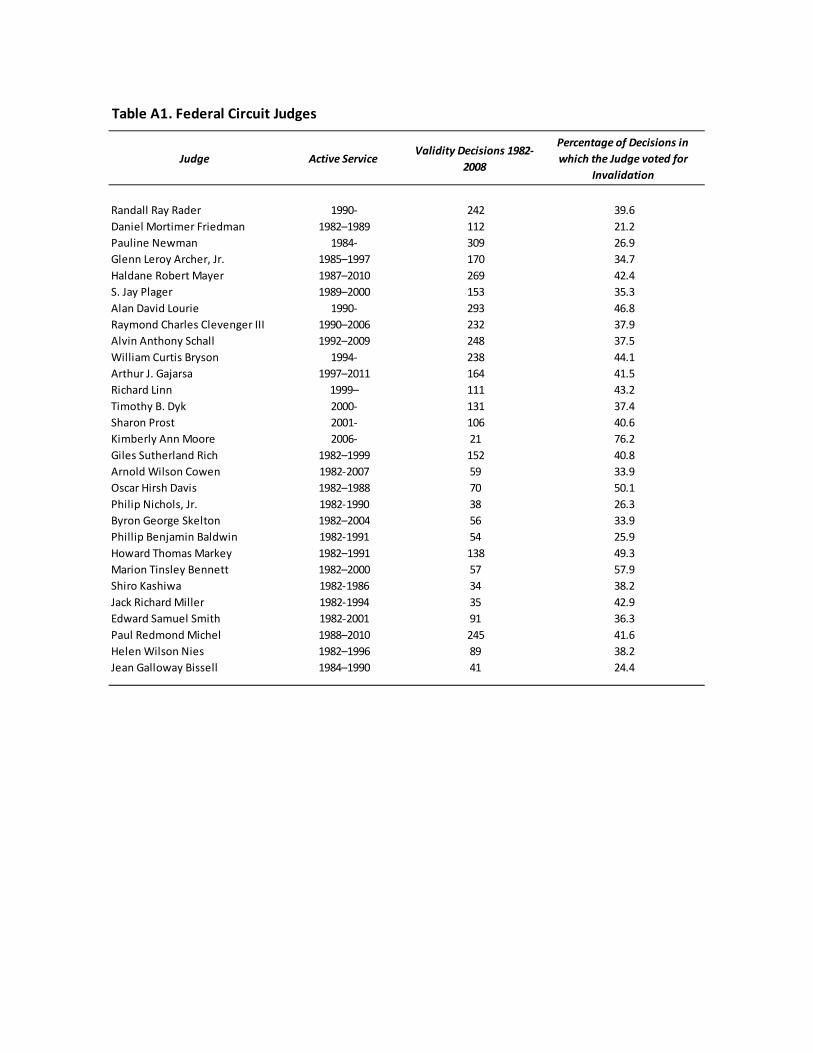
Judge Active ServiceValidity Decisions 1982-
2008
Percentage of Decisions in
which the Judge voted for
Invalidation
Randall Ray Rader 1990- 242 39.6
Daniel Mortimer Friedman 1982–1989 112 21.2
Pauline Newman 1984- 309 26.9
Glenn Leroy Archer, Jr. 1985–1997 170 34.7
Haldane Robert Mayer 1987–2010 269 42.4
S. Jay Plager 1989–2000 153 35.3
Alan David Lourie 1990- 293 46.8
Raymond Charles Clevenger III 1990–2006 232 37.9
Alvin Anthony Schall 1992–2009 248 37.5
William Curtis Bryson 1994- 238 44.1
Arthur J. Gajarsa 1997–2011 164 41.5
Richard Linn 1999– 111 43.2
Timothy B. Dyk 2000- 131 37.4
Sharon Prost 2001- 106 40.6
Kimberly Ann Moore 2006- 21 76.2
Giles Sutherland Rich 1982–1999 152 40.8
Arnold Wilson Cowen 1982-2007 59 33.9
Oscar Hirsh Davis 1982–1988 70 50.1
Philip Nichols, Jr. 1982-1990 38 26.3
Byron George Skelton 1982–2004 56 33.9
Phillip Benjamin Baldwin 1982-1991 54 25.9
Howard Thomas Markey 1982–1991 138 49.3
Marion Tinsley Bennett 1982–2000 57 57.9
Shiro Kashiwa 1982-1986 34 38.2
Jack Richard Miller 1982-1994 35 42.9
Edward Samuel Smith 1982-2001 91 36.3
Paul Redmond Michel 1988–2010 245 41.6
Helen Wilson Nies 1982–1996 89 38.2
Jean Galloway Bissell 1984–1990 41 24.4
Table A1. Federal Circuit Judges

TABLE A2. Exogeneity of Judge Panels (OLS Regressions)
1 2 3 4 5 6 7
Depentend Variable JIP JIP JIP JIP JIP JIP JIP
log(Claims) -0.001 -0.001 -0.001
(0.002) (0.002) (0.002)
log(PreCites) -0.001 0.001 0.001
(0.002) (0.002) (0.002)
log(PreSelfCites) -0.001 -0.001 -0.001
(0.002) (0.002) (0.002)
Age -0.001 -0.001
(0.001) (0.001)
Chemicals 0.003 0.003 0.003
(0.006) (0.006) (0.006)
Computers and Communication -0.007 -0.007 -0.008
(0.006) (0.006) (0.006)
Drugs and Medical 0.004 0.004 0.004
(0.005) (0.005) (0.005)
Electrical and Electronics 0.005 0.005 0.006
(0.006) (0.006) (0.006)
Mechanicals 0.007 0.007 0.007
(0.007) (0.007) (0.007)
Year Effects YES*** YES*** YES*** YES*** YES*** YES*** YES***
Age Effects NO NO NO NO NO NO YES
Fed. Circuit Decisions 1357 1357 1357 1357 1357 1357 1357
F-stat for all patent
characteristics (except year
dummies) being zero
F=1.00
p=0.41
F=0.67
p=0.73
F=0.77
p=0.82
NOTES: * s ignificant at 10 percent, ** s igni fi cant a t 5 percent and *** s ignifi cant at 1 percent. Robust s tandard errors
are reported in parentheses . Inval idated=1 if Federal Ci rcuit inva l idates at least one cla im of focal patent. PreCites =
ci tes from pa tents of other ass ignees received before Federal Circui t deci s ion. PreSelfCites = cites received from
patents owned by same patentee of foca l patent before Federa l Ci rcui t deci s ion. Cla ims = tota l number of cla ims
l i s ted in focal patent. Age = age in years from fi l ing date of patent at Federal Circui t decis ion. Year= year of Federal
Circuit Decis ion. JIP= propens i ty to vote for patent inval i di ty of judge panel constructed from inval idi ty votes of judges
in other sa mple cas es . We add one to a l l ci tation measures to include pa tents with zero ci tes .
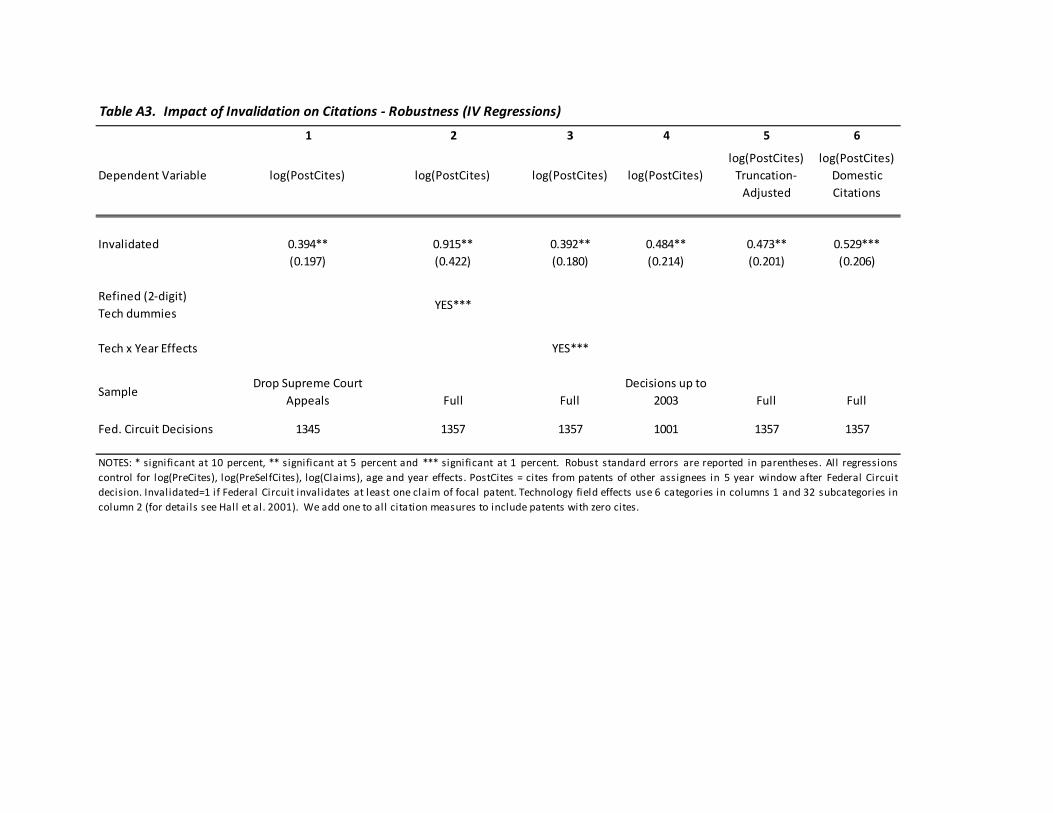
Table A3. Impact of Invalidation on Citations - Robustness (IV Regressions)
1 2 3 4 5 6
Dependent Variable log(PostCites) log(PostCites) log(PostCites) log(PostCites)
log(PostCites)
Truncation-
Adjusted
log(PostCites)
Domestic
Citations
Invalidated 0.394** 0.915** 0.392** 0.484** 0.473** 0.529***
(0.197) (0.422) (0.180) (0.214) (0.201) (0.206)
Refined (2-digit)
Tech dummiesYES***
Tech x Year Effects YES***
SampleDrop Supreme Court
Appeals Full Full
Decisions up to
2003 Full Full
Fed. Circuit Decisions 1345 1357 1357 1001 1357 1357
NOTES: * significant at 10 percent, ** significant at 5 percent and *** significant at 1 percent. Robust standard errors are reported in parentheses. All regressions
control for log(PreCites), log(PreSelfCites), log(Claims), age and year effects. PostCites = cites from patents of other assignees in 5 year window after Federal Circuit
decision. Invalidated=1 if Federal Circuit invalidates at least one claim of focal patent. Technology field effects use 6 categories in columns 1 and 32 subcategories in
column 2 (for details see Hall et al. 2001). We add one to all citation measures to include patents with zero cites.
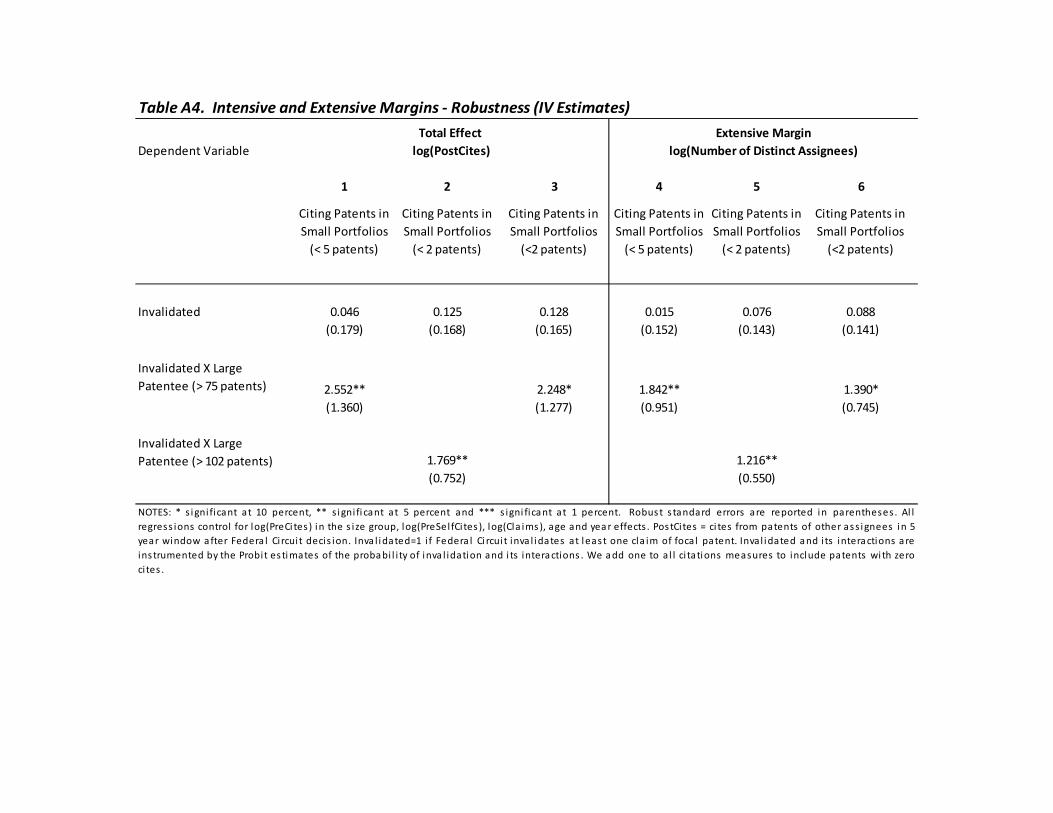
Dependent Variable
1 2 3 4 5 6
Citing Patents in
Small Portfolios
(< 5 patents)
Citing Patents in
Small Portfolios
(< 2 patents)
Citing Patents in
Small Portfolios
(<2 patents)
Citing Patents in
Small Portfolios
(< 5 patents)
Citing Patents in
Small Portfolios
(< 2 patents)
Citing Patents in
Small Portfolios
(<2 patents)
Invalidated 0.046 0.125 0.128 0.015 0.076 0.088
(0.179) (0.168) (0.165) (0.152) (0.143) (0.141)
Invalidated X Large
Patentee (> 75 patents) 2.552** 2.248* 1.842** 1.390*
(1.360) (1.277) (0.951) (0.745)
Invalidated X Large
Patentee (> 102 patents) 1.769** 1.216**
(0.752) (0.550)
Table A4. Intensive and Extensive Margins - Robustness (IV Estimates)
NOTES: * s igni ficant at 10 percent, ** s igni fi cant at 5 percent and *** s igni fica nt at 1 percent. Robus t s tandard errors are reported in parentheses. Al l
regress ions control for log(PreCi tes ) in the s ize group, log(PreSelfCites ), log(Cla ims ), age and yea r effects . Pos tCites = ci tes from patents of other as s ignees in 5
year window a fter Federa l Circuit decis ion. Inva l idated=1 if Federa l Ci rcui t inva l idates at leas t one cla im of focal patent. Inval idated a nd its intera ctions a re
ins trumented by the Probit es timates of the proba bi l i ty of inva l idation and i ts intera ctions . We a dd one to al l ci tations measures to include patents wi th zero
cites .
Total Effect Extensive Margin
log(PostCites) log(Number of Distinct Assignees)
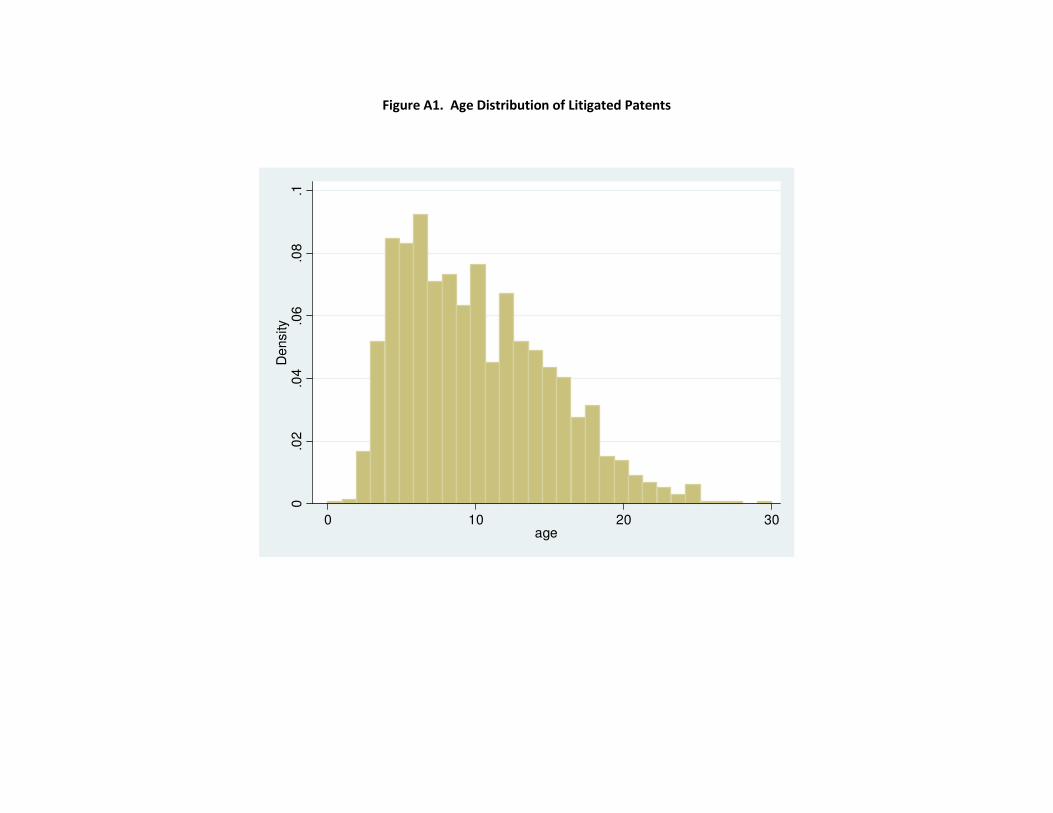
Figure A1. Age Distribution of Litigated Patents
0.0
2.0
4.0
6.0
8.1
De
nsity
0 10 20 30age
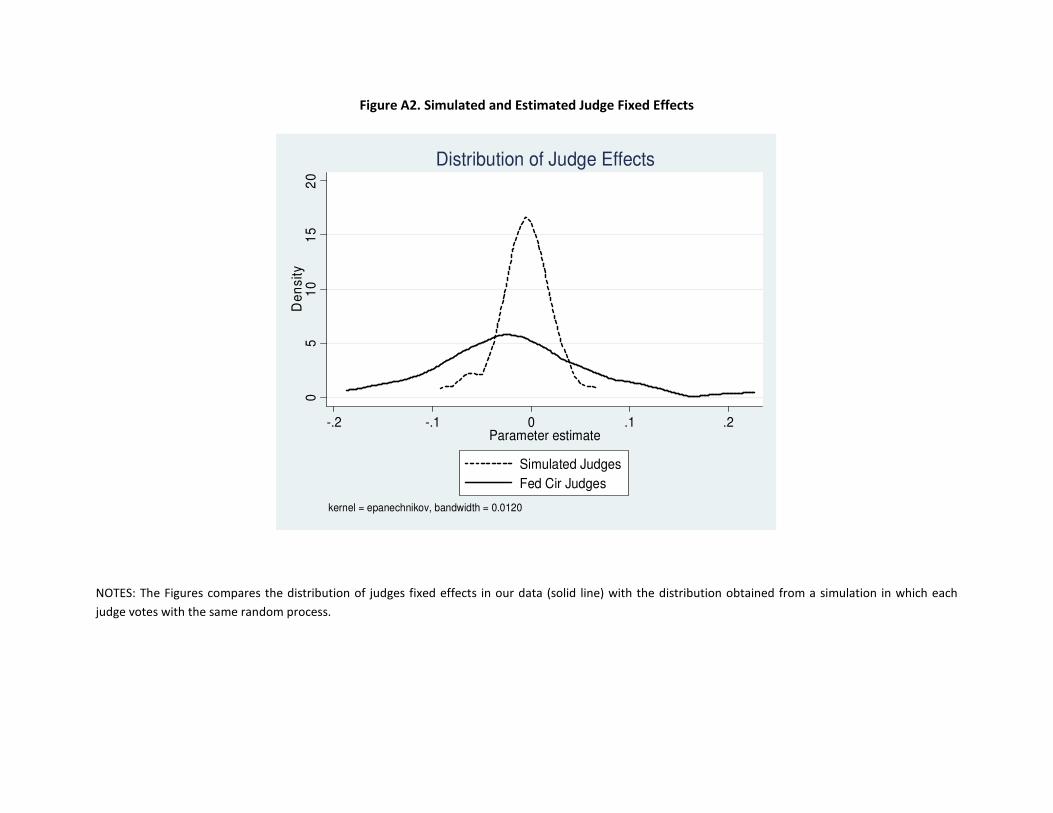
Figure A2. Simulated and Estimated Judge Fixed Effects
NOTES: The Figures compares the distribution of judges fixed effects in our data (solid line) with the distribution obtained from a simulation in which each
judge votes with the same random process.
05
10
15
20
De
nsity
-.2 -.1 0 .1 .2Parameter estimate
Simulated Judges
Fed Cir Judges
kernel = epanechnikov, bandwidth = 0.0120
Distribution of Judge Effects