patent trolls and technology di usionebusiness.mit.edu/research/papers/2011.12_tucker_patent trolls...
TRANSCRIPT
Electronic copy available at: http://ssrn.com/abstract=1976593
Patent Trolls and Technology Diffusion
Catherine Tucker∗
November 23, 2011
Abstract
Patent assertion entities, sometimes known as ‘patent trolls,’ do not manufacturegoods themselves but profit from licensing agreements that they often enforce via thethreat of litigation. This paper explores empirically how litigation by one such patenttroll affected the sales of medical imaging technology. It finds evidence that relativeto similar products, made by the same firm, but not covered by the patent, imagingsoftware sales declined by one-third. This was not due to a suppression in demand byhospitals but instead is linked to a lack of incremental product innovation during theperiod of litigation.
∗MIT Sloan School of Management, MIT, Cambridge, MA and NBER. I think Ajay Agrawal, PierreAzoulay, Kenneth Flamm, Tim Simcoe and Ezra Zuckerman for helpful discussions.
1
Electronic copy available at: http://ssrn.com/abstract=1976593
1 Introduction
A ‘patent-assertion entity’, sometimes less-politely known as a ‘patent troll,’ is a class of
patent owners who acquire patents from inventors but who do not intend to provide end
products or services themselves.1 Instead, they demand royalties as a price for authorizing
the work of others, and these demands are often reinforced by the threat of litigation. Their
role in the economy is disputed. There is a long tradition of market-makers in patents who
facilitate the commercialization of inventions. However, new evidence suggests that lawsuits
involving patent assertion entities do not lead to a simple transfer of stock market value.
Instead, the gains in stock market value enjoyed by the patent assertion entity are far smaller
than the loss of stock market value experienced by the defendant (Bessen et al., 2011). If
patent assertion entities are simply intermediaries, it is not clear why there is this destruction
of shareholder value.
To explore this, I examine how patent litigation affects technology sales in the empirical
setting of healthcare information technology. Digital medical picture archival and communi-
cations systems (PACS) allow hospitals to acquire, store, transfer and review large amounts
of data and images from diagnostic imaging devices such as ultrasounds and CAT scans.
This technology saves healthcare providers money by removing film and physical image stor-
age costs, and improves the quality of care by providing doctors and technicians with instant
access to medical images. Miller and Tucker (2011) document that such software can reduce
neo-natal mortality.
This setting has some attractive empirical properties for studying the effect of the actions
of patent-assertion entities on technology diffusion. First, there is comprehensive data on
sales of this technology to hospitals in the US. This contrasts with the opaque nature of
1I use the newer term ‘patent-assertion entity’ as recommended by the Federal Trade Commission inFTC (2011), rather than the older term ‘non-practicing entity,’ to exclude universities and similar researchinstitutions from the definition.
2
most sales figures for new technologies. Second, at the end of 2005, Acacia, a large assertion
entity with a reputation for litigating around its patent portfolio, acquired two patents that
had not been licensed before. Acacia then launched wide-scale litigation against multiple
companies who made PACS. Both the large-scale litigation and the unexpectedness of the
patent acquisition makes this case typical of lawsuits involving patent assertion entities.
The last feature of this setting which is helpful for identification is that the targets for
litigation were large healthcare IT firms that made otherwise similar products that either
fell within or outside the scope of the patent, depending on the need for image compression.
Generally, it is problematic to find a control group in patent litigation cases because other
firms that were not litigated against are by necessity different. However, an unusual feature
of the healthcare IT industry is that firms make and sell similar products in a similar way.
The only reason that some products were affected by litigation was the type of medical data
that they allowed a hospital to process, meaning that there is a potential control group
of similar software products which transmitted a different form of data. Further, external
research and technological classification by the Healthcare Information and Management
Systems Society identifies products that reflect a similar degree of IT sophistication and
therefore represent appropriate controls. This means I study the effect of patent litigation
on the sales of affected products relative to similar products made by the exact same firms.
My results suggest that there was a large reduction in sales of imaging software products
affected by patent litigation relative to other similar products that were produced by the
same firms. There was no such significant change in sales of imaging software for firms that
were not the target of litigation.
One potential explanation of my result is that this simply reflects a shift in demand
away from imaging software. However, there was an increase in solicitations for bids on new
contracts for both textual and imaging software by hospitals in this period, suggesting that
these results do not reflect suppression of demand.
3
I then present some evidence about why this chilling of innovation diffusion occurred.
Relative to firms that were not sued and products that were not covered by the scope
of the patent, there was no incremental product innovation in imaging IT by the affected
vendors during the period of litigation: No new variations of existing products or new models
were released. An explanation for this lack of innovation is that the vendors did not want
to run the risk of being found guilty of ‘wilful infringement’ in the patent suit and being
liable for treble damages. This last result emphasizes that even if patent assertion entities
do not prevail in the courtroom, their actions can have significantly negative consequences
for incremental innovation while litigation is ongoing. As Trajtenberg (1989) points out,
incremental innovation has large welfare consequences and aids the diffusion of technologies.
These results are important because of the growing debate about whether or not the
activities of patent assertion entities are neutral for innovation. Theoretical work has showed
that the actions of patent-assertion entities may dull incentives for firms contemplating new
innovations (Lemley and Shapiro, 2007), since the assertion of intellectual property rights by
firms empirically reduces the adoption of new innovations (Bessen and Meurer, 2008; Wen
et al., 2010). An opposing view is that patent assertion entities simply act as intermediaries
in the process of intellectual property rights assignment and therefore their actions are at
worst neutral (Wang, 2010). Those who argue in favor of the activities of patent assertion
entities suggest that their process of licensing, by increasing clarity, may spur innovation and
the diffusion of technology (McDonough, 2006).
This paper argues that the manner in which patent assertion entities enforce their prop-
erty rights - lengthy litigation proceedings - may itself harm technology diffusion. Litigation
by patents assertion entities may be more drawn out than other forms of patent litigation.
This is partially because there is asymmetry in the harm that uncertainty from litigation
poses to a firm that manufactures goods verses a firm that does not manufacture goods
(Reitzig et al., 2007). This is also partially because the business model of a patent assertion
4
entity is that given this asymmetry the defendant firms will ultimately settle and license
rather than continuing to pay the legal fees, and lengthy litigation is helpful to increase
pressure on firms to license. This paper shows that this form of lengthy litigation can have
real economic effects due to the lack of incremental innovation in the period when litigation
is ongoing.
2 Institutional Background and Data
2.1 Legal Background
A ‘patent-assertion entity’ is a patent owner that does not manufacture or use the patented
invention. Instead, their focus is on enforcing their right to exclude others from replicating
the innovation through the negotiation of licenses and litigation. Though controversial, these
actions reflect a perfectly legal practice given the strength of private ownership granted over
intellectual property within the US, which gives inventors the right to sell their patents to
other firms. Further, it would be problematic to limit such behavior on the ground that they
do not produce a physical product, because any such restraints would limit the patenting
activities of universities and potentially penalize undercapitalized inventors.
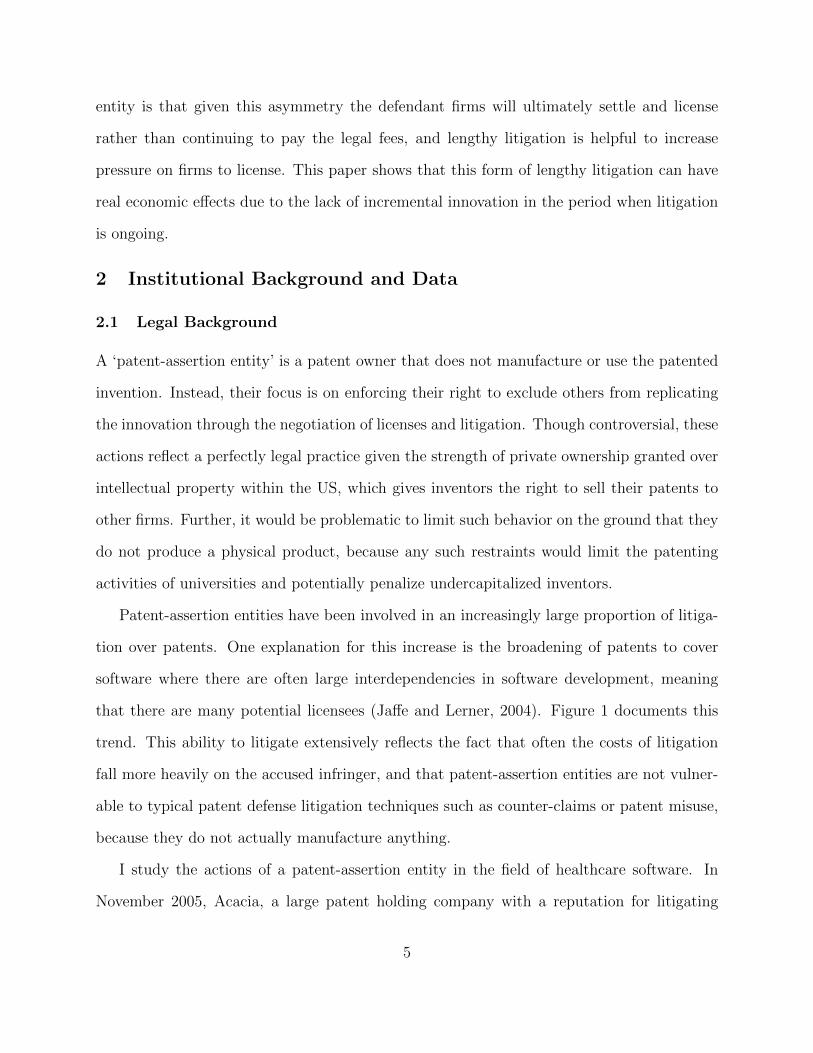
Patent-assertion entities have been involved in an increasingly large proportion of litiga-
tion over patents. One explanation for this increase is the broadening of patents to cover
software where there are often large interdependencies in software development, meaning
that there are many potential licensees (Jaffe and Lerner, 2004). Figure 1 documents this
trend. This ability to litigate extensively reflects the fact that often the costs of litigation
fall more heavily on the accused infringer, and that patent-assertion entities are not vulner-
able to typical patent defense litigation techniques such as counter-claims or patent misuse,
because they do not actually manufacture anything.
I study the actions of a patent-assertion entity in the field of healthcare software. In
November 2005, Acacia, a large patent holding company with a reputation for litigating
5
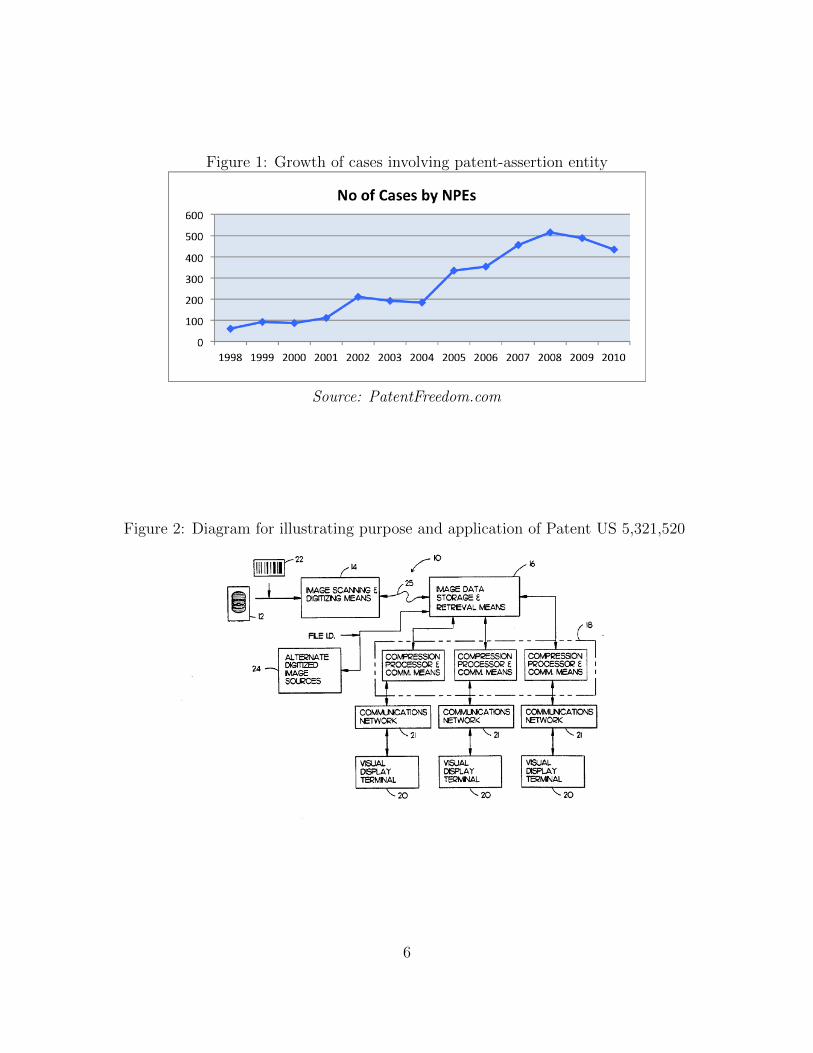
Figure 1: Growth of cases involving patent-assertion entity
Source: PatentFreedom.com
Figure 2: Diagram for illustrating purpose and application of Patent US 5,321,520
6
around its patent portfolio, announced the purchase of two patents. These were: United
States Patent No. 5,321,520, (June 14, 1994) for ‘Automated High Definition/Resolution Im-
age Storage, Retrieval and Transmission System’ and United States Patent 5,416,602 (May
16, 1995), for ‘Medical Image System with Progressive Resolution.’ Acacia is a publicly
traded company which does nothing but acquire and license patents. It has a history of ex-
tensive litigation over many different fields including adult-content filters, online-advertising
techniques, and smartphones. Acacia is the seventh largest patent-assertion entity in terms
of its patent holdings, holding 536 patents in 2011.2 Acacia officially defends its business
by saying that its actions promote innovation by helping small inventors and companies
outsource the difficult and costly business of licensing their patents.
These patents were originally filed by Jorge Inga, a surgeon specializing in the treat-
ment of herniated discs in Tampa, Florida, and Thomas V. Saliga, an engineer also from
Tampa, whose website biography states that he owns over 20 covering surveillance, aircraft,
and telecommunications systems. These two inventors fit precisely the description of the
‘small inventor’ whom Acacia says that they are particularly able to help by outsourcing
the licensing process. It appears, however, that neither inventor has retired on the basis of
the legal proceedings.3 Table 1 summarizes these patents and Figure 2 is a snapshot of the
technology that was included in both of the patent filings. A fuller description of both of
their claims are supplied in Tables A-2 and A-3 in the appendix.
Acacia’s patent acquisition was widely publicized, and both hospitals and vendors were
warned that litigation and enforcement were about to begin. To start litigation to defend its
patents, Acacia set up a subsidiary named ‘Hospital Systems Corporation.’ Their subsequent
press release made clear that they viewed these patents as covering technologies that
...enable multiple, remote users to simultaneously access image data from remote
2Patent Freedom, 20113Thomas V. Saliga is head of ‘Electronic Design Associates,’ a new product development company in
Tampa. Jorge Inga, who graduated with an MD 41 years ago, continues to practice in Tampa.
7
display terminals over common phone and data networks, such as the Internet.
PACS are commonly used by hospitals to acquire, store, archive and transmit
patient image data for remote access by their physicians, at their homes, offices
or within the hospital at the point of care.
The broad scope of the patent claimed by Acacia fits in with the findings of Fischer and
Henkel (2011), who find evidence that patent assertion entities’ patents receive relatively
higher numbers of citations on average.4
In September 2007, Hospital Systems Corporation, the newly-formed subsidiary of Aca-
cia, launched a lawsuit in the Eastern District of Texas against GE Healthcare, Fujifilm
Medical Systems, Siemens Medical Solutions, Philips Electronics and McKesson Corp (Case
No. 2:07-CV-00389-TJW).5 The main point of complaint was that ‘Each defendant man-
ufactures, provides, sells or distributes infringing Picture Archiving and Communication
Systems.’ The complaint sought an injunction against the infringing companies, treble mon-
etary damages, fees, costs and expenses. The Eastern District of Texas was chosen both
because it has a reputation of favoring plaintiffs, and because its judges have expertise in
patent suits; it is the venue of choice for litigation by patent-assertion entities. This evidence
of ‘forum shopping’ suggests that this particular plaintiff was an ‘excessive royalty extortion-
ist’ (Pohlmann and Opitz, 2010). The creation of a newly-formed subsidiary with a name
evocative of the industry, the choice of venue and the scope and scale of the firms targeted
in litigation resembles other lawsuits launched by Acacia in this period.
Table 2 summarizes the healthcare imaging companies that were sued and the dates
that they were included in the court case. It also includes details on the number of legal
representatives that they called upon to represent them, to give an idea of the scale of the
4Though this was questioned by Lerner (2006), who speculated that citations could be endogenous to thepublicity surrounding litigation.
5The one step that the ‘The American Invents Act of 2011’ took to curb the actions of patent assertionentities was to prevent the ‘joining’ of cases in this manner. This may potentially increase the costs of patentassertion entities when embarking on such litigation.
8
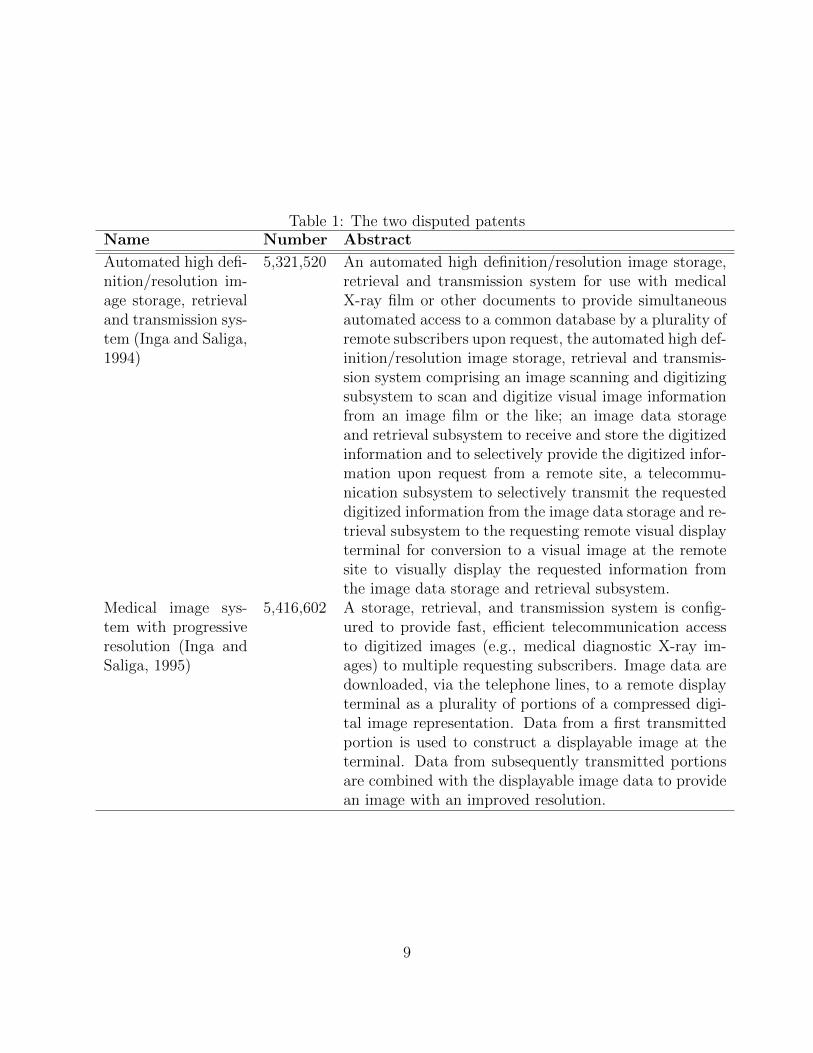
Table 1: The two disputed patentsName Number Abstract
Automated high defi-nition/resolution im-age storage, retrievaland transmission sys-tem (Inga and Saliga,1994)
5,321,520 An automated high definition/resolution image storage,retrieval and transmission system for use with medicalX-ray film or other documents to provide simultaneousautomated access to a common database by a plurality ofremote subscribers upon request, the automated high def-inition/resolution image storage, retrieval and transmis-sion system comprising an image scanning and digitizingsubsystem to scan and digitize visual image informationfrom an image film or the like; an image data storageand retrieval subsystem to receive and store the digitizedinformation and to selectively provide the digitized infor-mation upon request from a remote site, a telecommu-nication subsystem to selectively transmit the requesteddigitized information from the image data storage and re-trieval subsystem to the requesting remote visual displayterminal for conversion to a visual image at the remotesite to visually display the requested information fromthe image data storage and retrieval subsystem.
Medical image sys-tem with progressiveresolution (Inga andSaliga, 1995)
5,416,602 A storage, retrieval, and transmission system is config-ured to provide fast, efficient telecommunication accessto digitized images (e.g., medical diagnostic X-ray im-ages) to multiple requesting subscribers. Image data aredownloaded, via the telephone lines, to a remote displayterminal as a plurality of portions of a compressed digi-tal image representation. Data from a first transmittedportion is used to construct a displayable image at theterminal. Data from subsequently transmitted portionsare combined with the displayable image data to providean image with an improved resolution.
9
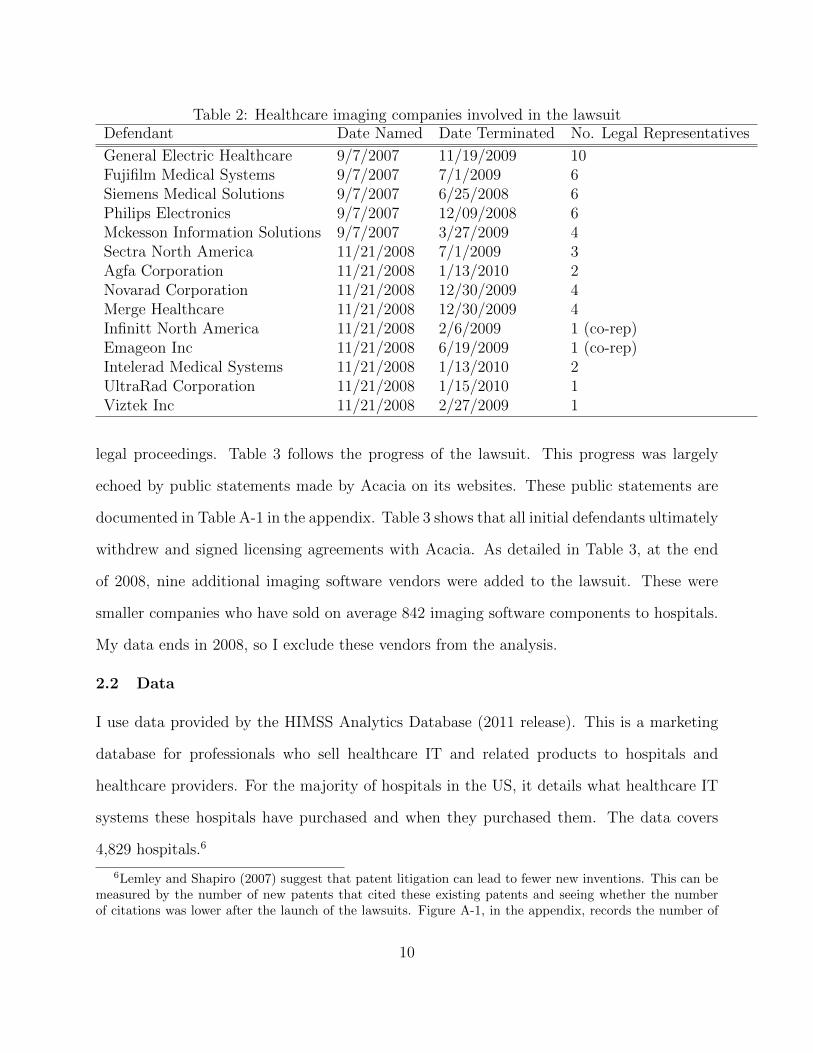
Table 2: Healthcare imaging companies involved in the lawsuitDefendant Date Named Date Terminated No. Legal Representatives
General Electric Healthcare 9/7/2007 11/19/2009 10Fujifilm Medical Systems 9/7/2007 7/1/2009 6Siemens Medical Solutions 9/7/2007 6/25/2008 6Philips Electronics 9/7/2007 12/09/2008 6Mckesson Information Solutions 9/7/2007 3/27/2009 4Sectra North America 11/21/2008 7/1/2009 3Agfa Corporation 11/21/2008 1/13/2010 2Novarad Corporation 11/21/2008 12/30/2009 4Merge Healthcare 11/21/2008 12/30/2009 4Infinitt North America 11/21/2008 2/6/2009 1 (co-rep)Emageon Inc 11/21/2008 6/19/2009 1 (co-rep)Intelerad Medical Systems 11/21/2008 1/13/2010 2UltraRad Corporation 11/21/2008 1/15/2010 1Viztek Inc 11/21/2008 2/27/2009 1
legal proceedings. Table 3 follows the progress of the lawsuit. This progress was largely
echoed by public statements made by Acacia on its websites. These public statements are
documented in Table A-1 in the appendix. Table 3 shows that all initial defendants ultimately
withdrew and signed licensing agreements with Acacia. As detailed in Table 3, at the end
of 2008, nine additional imaging software vendors were added to the lawsuit. These were
smaller companies who have sold on average 842 imaging software components to hospitals.
My data ends in 2008, so I exclude these vendors from the analysis.
2.2 Data
I use data provided by the HIMSS Analytics Database (2011 release). This is a marketing
database for professionals who sell healthcare IT and related products to hospitals and
healthcare providers. For the majority of hospitals in the US, it details what healthcare IT
systems these hospitals have purchased and when they purchased them. The data covers
4,829 hospitals.6
6Lemley and Shapiro (2007) suggest that patent litigation can lead to fewer new inventions. This can bemeasured by the number of new patents that cited these existing patents and seeing whether the numberof citations was lower after the launch of the lawsuits. Figure A-1, in the appendix, records the number of
10
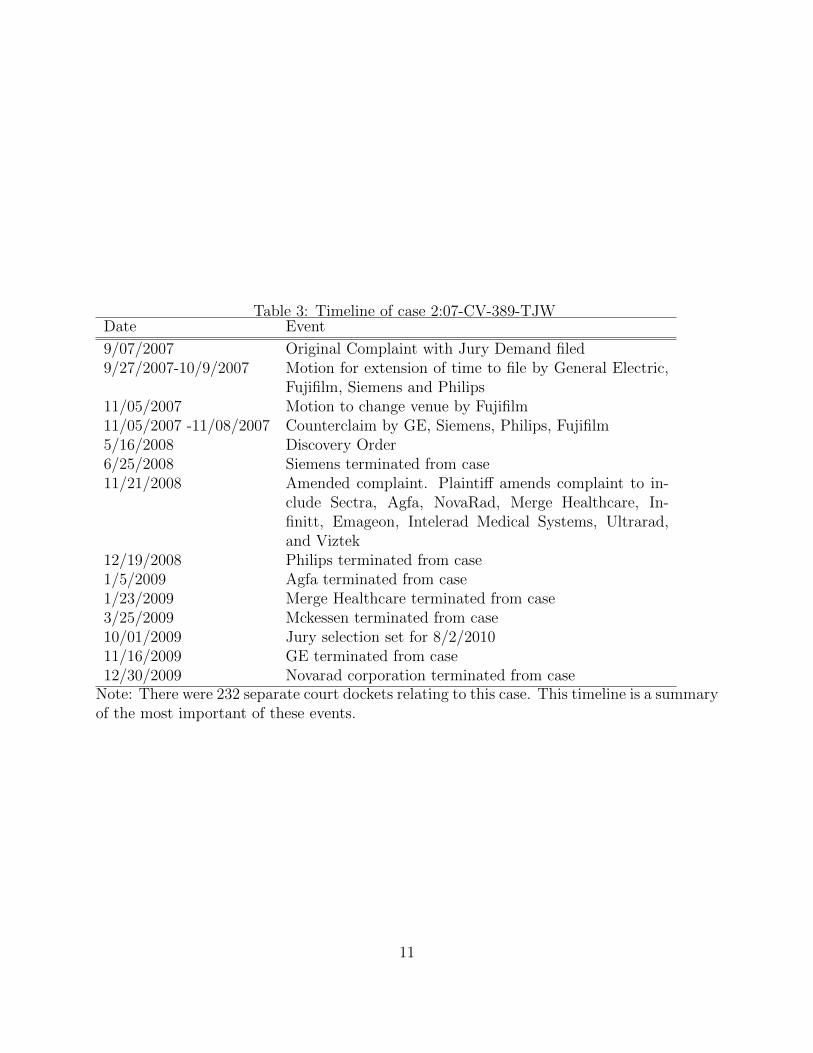
Table 3: Timeline of case 2:07-CV-389-TJWDate Event
9/07/2007 Original Complaint with Jury Demand filed9/27/2007-10/9/2007 Motion for extension of time to file by General Electric,
Fujifilm, Siemens and Philips11/05/2007 Motion to change venue by Fujifilm11/05/2007 -11/08/2007 Counterclaim by GE, Siemens, Philips, Fujifilm5/16/2008 Discovery Order6/25/2008 Siemens terminated from case11/21/2008 Amended complaint. Plaintiff amends complaint to in-
clude Sectra, Agfa, NovaRad, Merge Healthcare, In-finitt, Emageon, Intelerad Medical Systems, Ultrarad,and Viztek
12/19/2008 Philips terminated from case1/5/2009 Agfa terminated from case1/23/2009 Merge Healthcare terminated from case3/25/2009 Mckessen terminated from case10/01/2009 Jury selection set for 8/2/201011/16/2009 GE terminated from case12/30/2009 Novarad corporation terminated from case
Note: There were 232 separate court dockets relating to this case. This timeline is a summaryof the most important of these events.
11
For each class of healthcare IT application, the database categorizes whether or not the
hospital has contracted to purchase it, and if so from what vendor and in what year the
contract was signed. The fact that the primary data is on the ‘contract date’ has proved a
challenge for empirical studies focusing on the effects of installed healthcare IT, but for this
particular study it is ideal, since I am interested in the actual purchase of technology rather
than its implementation date.
As described by Jha et al. (2009), the healthcare IT system purchased by a hospital is
incredibly complex. It consists of different software components that facilitate the transition
from paper to electronic transmission for that particular form of patient data or health
provider action. It is the cross-variation in whether the patent applied to different types of
medical data that I exploit in this data.
The components that deal with remote access to imaging include Ultrasound, Mammog-
raphy, Magnetic Resonance Imaging (MRI), Radiography, Fluoroscopy, Computed Tomog-
raphy (CT), Computed Radiography (CR), Angiography, and Orthopedic images. The only
software I exclude from this category is the underlying radiology information system (RIS)
which is usually focused on patient tracking, scheduling and reporting because an RIS could
be used to host images as well as transfer textual data.
I then use applications that do not involve the transfer of medical images, only tex-
tual data, as controls.7 The applications in this category are software modules for ‘Physi-
cian Documentation’, ‘Clinical Data Repository’, ‘Clinical Decision Support’, ‘Order Entry’,
‘Computerized Practitioner Order Entry’, and ‘Physician Portal’. These components are not
covered by either of the disputed patents. As shown in Figure 2, the patents cover tech-
patent citations over time for each of these patents. It is clear that these two patents did not receive enoughcitations to make analysis precise. Further, the number of citations is small enough that it is difficult todisentangle the decrease in patent citations from the natural decrease in citations observed by Mehta et al.(2010).
7There were no patent licensing lawsuits in this period for this category of software application I couldfind in searchable court dockets. There wer separate licensing lawsuits concerning operating room schedulingsoftware but these are not part of the software applications in the analysis.
12
niques for the compression and distribution of patient image data across a communications
network, not the compression and transfer of textual patient data.
It is important to establish the extent to which these different IT components are ap-
propriate controls for each other. They are all inputs into patient care used by the same
facility designed to make patient care paperless, but of course there may be differences in
sophistication and therefore potential technology sales. Luckily, the non-profit Healthcare
Information and Management Systems Society (HIMSS) has devoted time and effort to de-
veloping a taxonomy of different levels of healthcare IT complexity and sophistication. This
is part of their effort to develop an Electronic Medical Records Adoption model to allow hos-
pitals to track their progress towards creating a paperless patient record environment. The
image-based technologies that I study satisfy the stage 3 criterion of ‘medical image access
from picture archive and communication systems (PACS).’ The textual-data technologies I
use as controls are also stage 3 technologies (‘Clinical documentation installed’ and ‘First
level of clinical decision support’ and ‘Error checking with order entry’). A clinical data
repository is a stage 2 technology when stand-alone and stage 3 when integrated, which is
why I include it. The results are robust to its inclusion or exclusion.
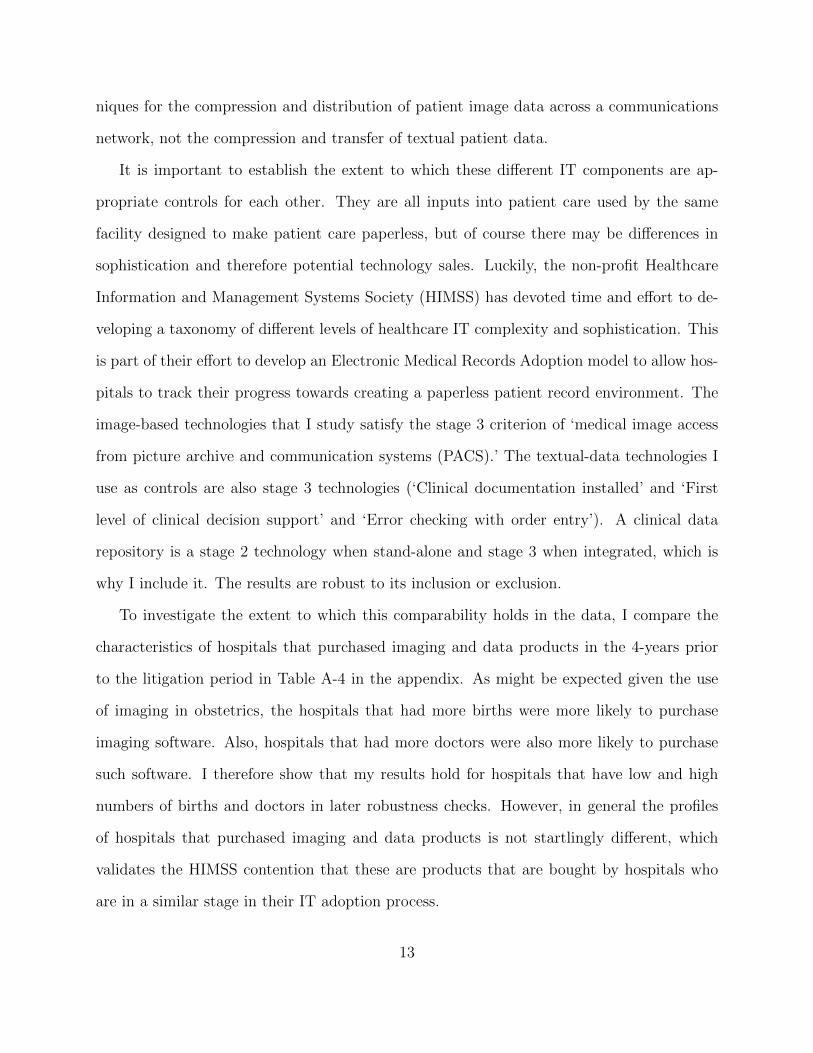
To investigate the extent to which this comparability holds in the data, I compare the
characteristics of hospitals that purchased imaging and data products in the 4-years prior
to the litigation period in Table A-4 in the appendix. As might be expected given the use
of imaging in obstetrics, the hospitals that had more births were more likely to purchase
imaging software. Also, hospitals that had more doctors were also more likely to purchase
such software. I therefore show that my results hold for hospitals that have low and high
numbers of births and doctors in later robustness checks. However, in general the profiles
of hospitals that purchased imaging and data products is not startlingly different, which
validates the HIMSS contention that these are products that are bought by hospitals who
are in a similar stage in their IT adoption process.
13
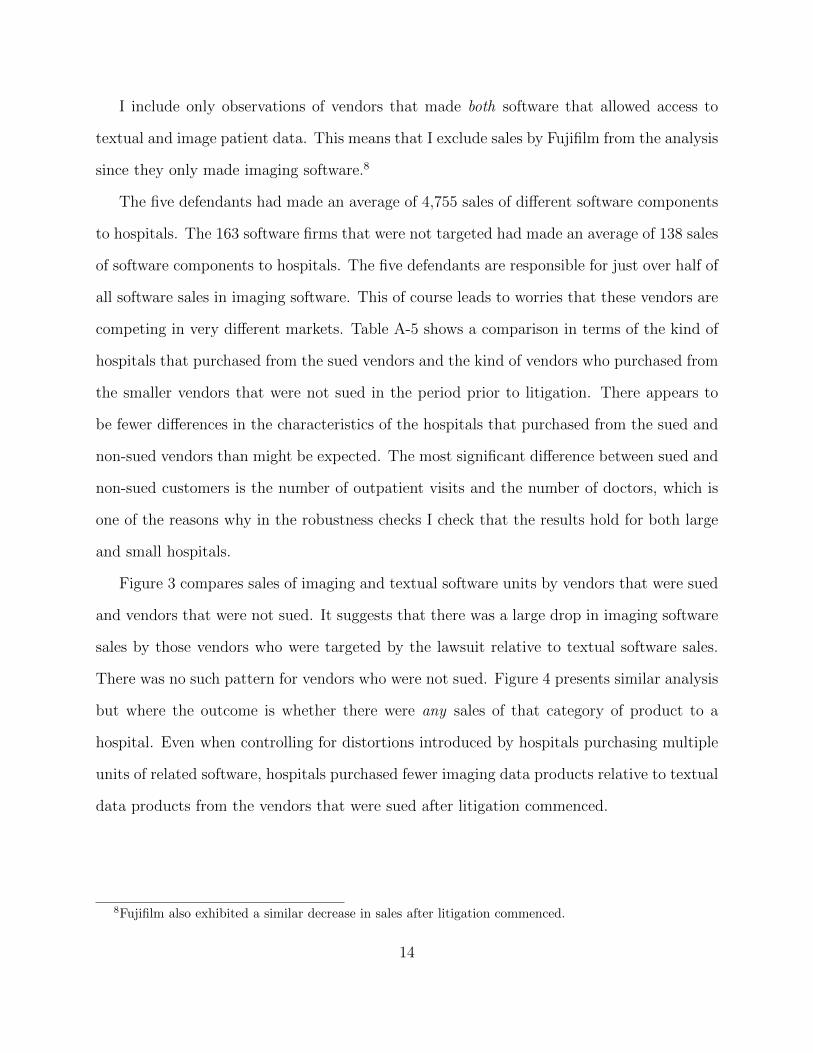
I include only observations of vendors that made both software that allowed access to
textual and image patient data. This means that I exclude sales by Fujifilm from the analysis
since they only made imaging software.8
The five defendants had made an average of 4,755 sales of different software components
to hospitals. The 163 software firms that were not targeted had made an average of 138 sales
of software components to hospitals. The five defendants are responsible for just over half of
all software sales in imaging software. This of course leads to worries that these vendors are
competing in very different markets. Table A-5 shows a comparison in terms of the kind of
hospitals that purchased from the sued vendors and the kind of vendors who purchased from
the smaller vendors that were not sued in the period prior to litigation. There appears to
be fewer differences in the characteristics of the hospitals that purchased from the sued and
non-sued vendors than might be expected. The most significant difference between sued and
non-sued customers is the number of outpatient visits and the number of doctors, which is
one of the reasons why in the robustness checks I check that the results hold for both large
and small hospitals.
Figure 3 compares sales of imaging and textual software units by vendors that were sued
and vendors that were not sued. It suggests that there was a large drop in imaging software
sales by those vendors who were targeted by the lawsuit relative to textual software sales.
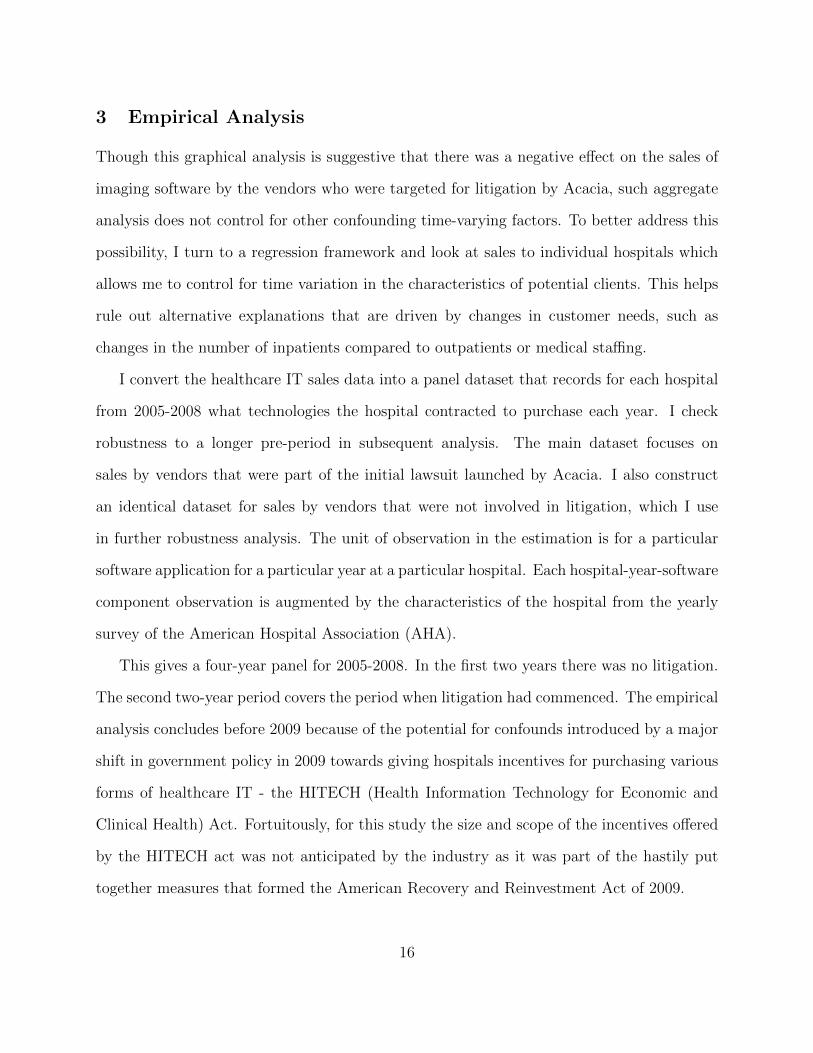
There was no such pattern for vendors who were not sued. Figure 4 presents similar analysis
but where the outcome is whether there were any sales of that category of product to a
hospital. Even when controlling for distortions introduced by hospitals purchasing multiple
units of related software, hospitals purchased fewer imaging data products relative to textual
data products from the vendors that were sued after litigation commenced.
8Fujifilm also exhibited a similar decrease in sales after litigation commenced.
14
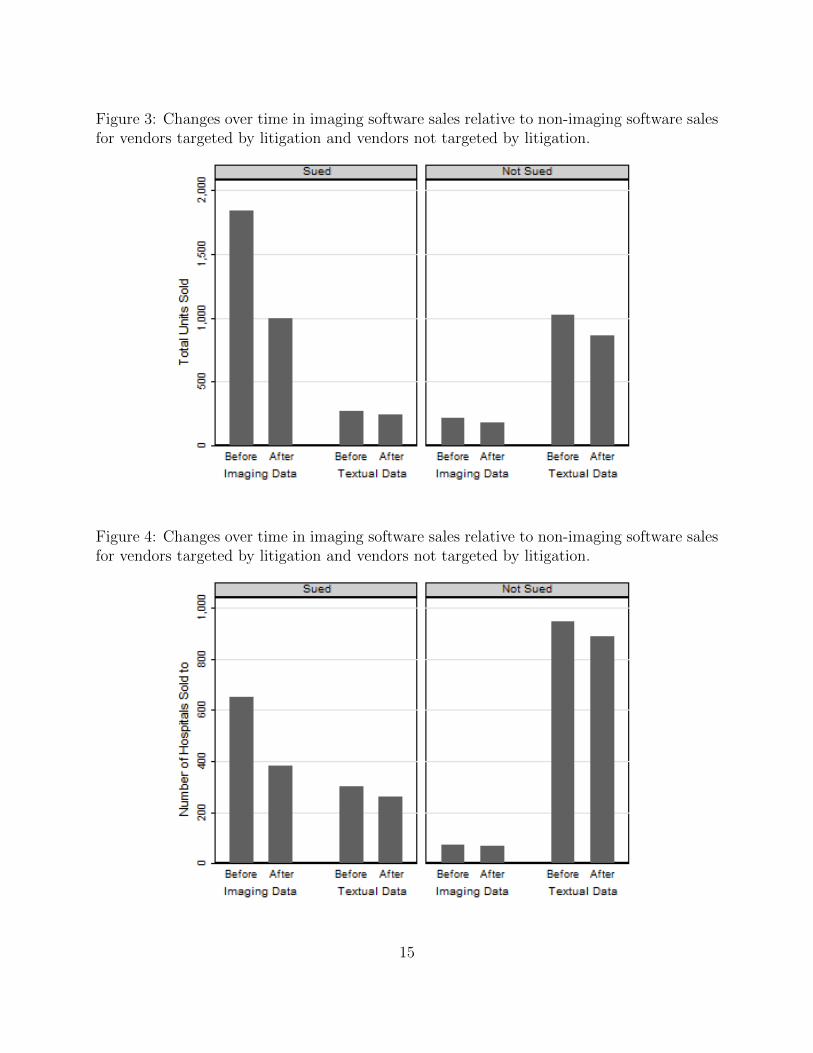
Figure 3: Changes over time in imaging software sales relative to non-imaging software salesfor vendors targeted by litigation and vendors not targeted by litigation.
Figure 4: Changes over time in imaging software sales relative to non-imaging software salesfor vendors targeted by litigation and vendors not targeted by litigation.
15
3 Empirical Analysis
Though this graphical analysis is suggestive that there was a negative effect on the sales of
imaging software by the vendors who were targeted for litigation by Acacia, such aggregate
analysis does not control for other confounding time-varying factors. To better address this
possibility, I turn to a regression framework and look at sales to individual hospitals which
allows me to control for time variation in the characteristics of potential clients. This helps
rule out alternative explanations that are driven by changes in customer needs, such as
changes in the number of inpatients compared to outpatients or medical staffing.
I convert the healthcare IT sales data into a panel dataset that records for each hospital
from 2005-2008 what technologies the hospital contracted to purchase each year. I check
robustness to a longer pre-period in subsequent analysis. The main dataset focuses on
sales by vendors that were part of the initial lawsuit launched by Acacia. I also construct
an identical dataset for sales by vendors that were not involved in litigation, which I use
in further robustness analysis. The unit of observation in the estimation is for a particular
software application for a particular year at a particular hospital. Each hospital-year-software
component observation is augmented by the characteristics of the hospital from the yearly
survey of the American Hospital Association (AHA).
This gives a four-year panel for 2005-2008. In the first two years there was no litigation.
The second two-year period covers the period when litigation had commenced. The empirical
analysis concludes before 2009 because of the potential for confounds introduced by a major
shift in government policy in 2009 towards giving hospitals incentives for purchasing various
forms of healthcare IT - the HITECH (Health Information Technology for Economic and
Clinical Health) Act. Fortuitously, for this study the size and scope of the incentives offered
by the HITECH act was not anticipated by the industry as it was part of the hastily put
together measures that formed the American Recovery and Reinvestment Act of 2009.
16
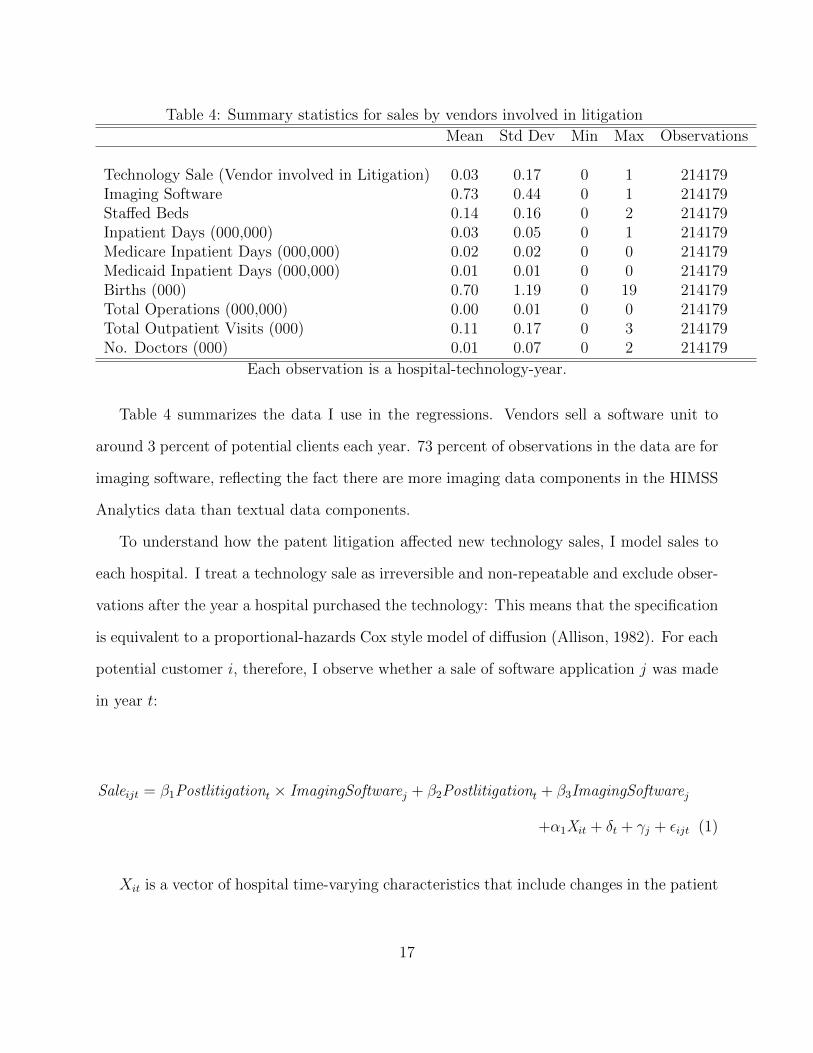
Table 4: Summary statistics for sales by vendors involved in litigation
Mean Std Dev Min Max Observations
Technology Sale (Vendor involved in Litigation) 0.03 0.17 0 1 214179Imaging Software 0.73 0.44 0 1 214179Staffed Beds 0.14 0.16 0 2 214179Inpatient Days (000,000) 0.03 0.05 0 1 214179Medicare Inpatient Days (000,000) 0.02 0.02 0 0 214179Medicaid Inpatient Days (000,000) 0.01 0.01 0 0 214179Births (000) 0.70 1.19 0 19 214179Total Operations (000,000) 0.00 0.01 0 0 214179Total Outpatient Visits (000) 0.11 0.17 0 3 214179No. Doctors (000) 0.01 0.07 0 2 214179
Each observation is a hospital-technology-year.
Table 4 summarizes the data I use in the regressions. Vendors sell a software unit to
around 3 percent of potential clients each year. 73 percent of observations in the data are for
imaging software, reflecting the fact there are more imaging data components in the HIMSS
Analytics data than textual data components.
To understand how the patent litigation affected new technology sales, I model sales to
each hospital. I treat a technology sale as irreversible and non-repeatable and exclude obser-
vations after the year a hospital purchased the technology: This means that the specification
is equivalent to a proportional-hazards Cox style model of diffusion (Allison, 1982). For each
potential customer i, therefore, I observe whether a sale of software application j was made
in year t:
Saleijt = β1Postlitigationt × ImagingSoftwarej + β2Postlitigationt + β3ImagingSoftwarej
+α1Xit + δt + γj + εijt (1)
Xit is a vector of hospital time-varying characteristics that include changes in the patient
17
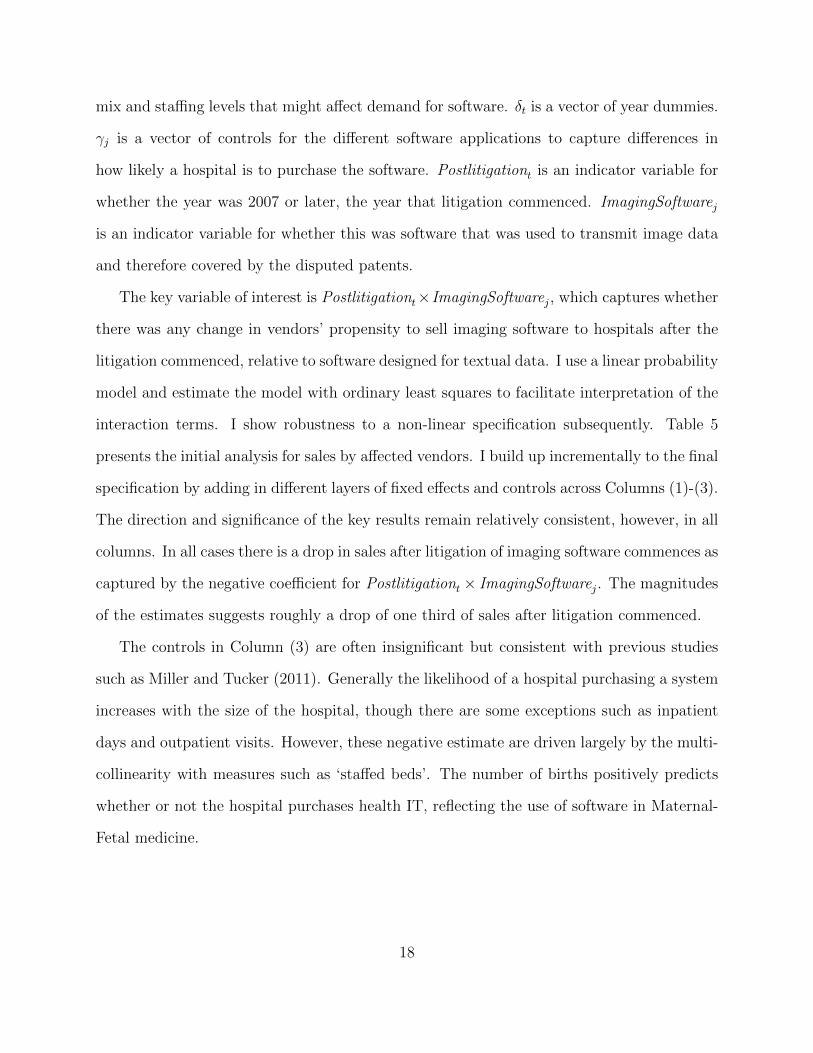
mix and staffing levels that might affect demand for software. δt is a vector of year dummies.
γj is a vector of controls for the different software applications to capture differences in
how likely a hospital is to purchase the software. Postlitigationt is an indicator variable for
whether the year was 2007 or later, the year that litigation commenced. ImagingSoftwarej
is an indicator variable for whether this was software that was used to transmit image data
and therefore covered by the disputed patents.
The key variable of interest is Postlitigationt×ImagingSoftwarej, which captures whether
there was any change in vendors’ propensity to sell imaging software to hospitals after the
litigation commenced, relative to software designed for textual data. I use a linear probability
model and estimate the model with ordinary least squares to facilitate interpretation of the
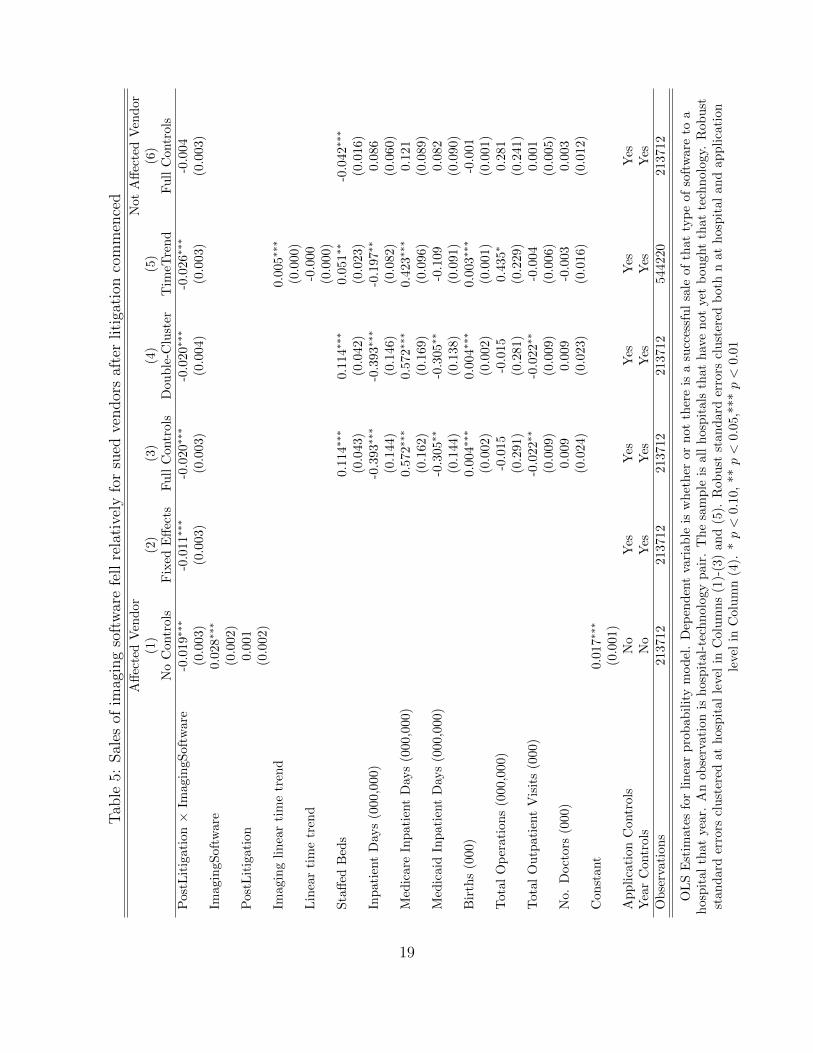
interaction terms. I show robustness to a non-linear specification subsequently. Table 5
presents the initial analysis for sales by affected vendors. I build up incrementally to the final
specification by adding in different layers of fixed effects and controls across Columns (1)-(3).
The direction and significance of the key results remain relatively consistent, however, in all
columns. In all cases there is a drop in sales after litigation of imaging software commences as
captured by the negative coefficient for Postlitigationt × ImagingSoftwarej. The magnitudes
of the estimates suggests roughly a drop of one third of sales after litigation commenced.
The controls in Column (3) are often insignificant but consistent with previous studies
such as Miller and Tucker (2011). Generally the likelihood of a hospital purchasing a system
increases with the size of the hospital, though there are some exceptions such as inpatient
days and outpatient visits. However, these negative estimate are driven largely by the multi-
collinearity with measures such as ‘staffed beds’. The number of births positively predicts
whether or not the hospital purchases health IT, reflecting the use of software in Maternal-
Fetal medicine.
18
Tab
le5:
Sal
esof
imag
ing
soft
war
efe
llre
lati
vely
for
sued
vendor
saf
ter
liti
gati
onco
mm
ence
dA
ffec
ted
Ven
dor
Not
Aff
ecte
dV
end
or
(1)
(2)
(3)
(4)
(5)
(6)
No
Contr
ols
Fix
edE
ffec
tsF
ull
Contr
ols
Dou
ble
-Clu
ster
Tim
eTre
nd
Fu
llC
ontr
ols
Pos
tLit
igat
ion×
Imag
ingS
oftw
are
-0.0
19∗
∗∗-0
.011∗
∗∗-0
.020∗∗
∗-0
.020∗
∗∗-0
.026∗
∗∗-0
.004
(0.0
03)
(0.0
03)
(0.0
03)
(0.0
04)
(0.0
03)
(0.0
03)
Imag
ingS
oftw
are
0.0
28∗∗
∗
(0.0
02)
Pos
tLit
igat
ion
0.0
01
(0.0
02)
Imag
ing
lin
ear
tim
etr
end
0.0
05∗∗
∗
(0.0
00)
Lin
ear
tim
etr
end
-0.0
00
(0.0
00)
Sta
ffed
Bed
s0.1
14∗∗
∗0.1
14∗∗
∗0.0
51∗∗
-0.0
42∗
∗∗
(0.0
43)
(0.0
42)
(0.0
23)
(0.0
16)
Inp
atie
nt
Day
s(0
00,0
00)
-0.3
93∗
∗∗-0
.393∗
∗∗-0
.197∗
∗0.0
86
(0.1
44)
(0.1
46)
(0.0
82)
(0.0
60)
Med
icar
eIn
pat
ient
Day
s(0
00,0
00)
0.5
72∗∗
∗0.5
72∗∗
∗0.4
23∗∗
∗0.1
21
(0.1
62)
(0.1
69)
(0.0
96)
(0.0
89)
Med
icai
dIn
pat
ient
Day
s(0
00,0
00)
-0.3
05∗∗
-0.3
05∗
∗-0
.109
0.0
82
(0.1
44)
(0.1
38)
(0.0
91)
(0.0
90)
Bir
ths
(000
)0.0
04∗∗
∗0.0
04∗∗
∗0.0
03∗∗
∗-0
.001
(0.0
02)
(0.0
02)
(0.0
01)
(0.0
01)
Tot
alO
per
atio
ns
(000
,000
)-0
.015
-0.0
15
0.4
35∗
0.2
81
(0.2
91)
(0.2
81)
(0.2
29)
(0.2
41)
Tot
alO
utp
atie
nt
Vis
its
(000
)-0
.022∗
∗-0
.022∗
∗-0
.004
0.0
01
(0.0
09)
(0.0
09)
(0.0
06)
(0.0
05)
No.
Doct
ors
(000
)0.0
09
0.0
09
-0.0
03
0.0
03
(0.0
24)
(0.0
23)
(0.0
16)
(0.0
12)
Con
stan
t0.0
17∗∗
∗
(0.0
01)
Ap
pli
cati
onC
ontr
ols
No
Yes
Yes
Yes
Yes
Yes
Yea
rC
ontr
ols
No
Yes
Yes
Yes
Yes
Yes
Ob
serv
atio
ns
213712
213712
213712
213712
544220
213712
OL
SE
stim
ates
for
lin
ear
pro
bab
ilit
ym
od
el.
Dep
end
ent
vari
ab
leis
wh
eth
eror
not
ther
eis
asu
cces
sfu
lsa
leof
that
typ
eof
soft
ware
toa
hos
pit
alth
atye
ar.
An
obse
rvat
ion
ish
osp
ital-
tech
nolo
gy
pair
.T
he
sam
ple
isall
hosp
itals
that
hav
en
ot
yet
bou
ght
that
tech
nolo
gy.
Rob
ust
stan
dar
der
rors
clu
ster
edat
hos
pit
alle
vel
inC
olu
mn
s(1
)-(3
)an
d(5
).R
ob
ust
stan
dard
erro
rscl
ust
ered
both
nat
hosp
ital
an
dap
pli
cati
on
leve
lin
Colu
mn
(4).
*p<
0.10,
**p<
0.05,*
**p<
0.01
19
Column (4) presents a specification where I ‘double-cluster’ the standard errors by both
application and hospital following the methodology proposed by Cameron et al. (2011). This
helps address concerns that the choice to make an observation a hospital-technology pair is
not biasing downwards significantly the size of the standard errors and consequently inflating
the level of significance. There appears to be a small increase in size of the standard error as
expected, but this has only a small effect on the significance of the result (t=6.27 vs t=5.15).
One concern is that the short time span of the data means that I fail to capture long-term
trends (such as declining sales of imaging software) in the healthcare IT software business
that might provide alternative explanations for my results. Column (5) reports the results
that include additional observations from 2000-2004. It also adds a linear time trend for both
data products and imaging software products in order. This time trend suggests instead that
software sales for imaging products were generally increasing year-on-year.
The results in Columns (1)-(5) of Table 5 could potentially simply reflect a downward
trend in sales of imaging software for external reasons, such as hospitals not purchasing
diagnostic imaging equipment in the wake of a downturn in the economy. To examine
whether this is the case, I then turned to look at the software vendors who were not sued by
Acacia. Table A-6 in the appendix reports summary statistics for this data. Column (6) of
Table 5 reports the identical empirical specification of Equation (1) for this group. There was
no significant downward trend in the sales of imaging software for these vendors, suggesting
that there was not a large global drop in imaging software sales. This is of course not an
entirely ‘clean’ control group. It is likely the vendors were aware of the ongoing litigation
and aware that they could potentially be targets. They also (as is clear in Figure 3) sold
fewer imaging software units relative to their data software unit sales initially which leads
to less precise estimates in general. However, one would expect that the effect of litigation
would be more pronounced for the group of vendors that were being sued - something I check
in the next section.
20
Tab
le6:
‘Diff
-in-D
iff-i
n-D
iff’:
Rob
ust
nes
sch
ecks
All
Big
Hosp
itals
Sm
all
Hosp
itals
Hig
hB
irth
sL
owB
irth
s(1
)(2
)(3
)(4
)(5
)(6
)O
LS
Pro
bit
OL
SP
ostL
itig
atio
n×
Imag
ingS
oftw
are×
Targ
eted
Ven
dor
-0.0
19∗
∗∗-0
.220∗∗
-0.0
16∗
∗-0
.020∗∗
∗-0
.024∗∗
∗-0
.012∗
∗
(0.0
05)
(0.0
90)
(0.0
07)
(0.0
06)
(0.0
08)
(0.0
06)
Pos
tLit
igat
ion×
Imag
ingS
oftw
are
-0.0
02
-0.0
70
-0.0
05
-0.0
00
-0.0
03
-0.0
02
(0.0
03)
(0.0
69)
(0.0
05)
(0.0
04)
(0.0
05)
(0.0
04)
Imag
ingS
oftw
are×
Tar
gete
dV
end
or0.0
88∗
∗∗1.5
06∗∗
∗0.0
95∗∗
∗0.0
81∗∗
∗0.0
99∗∗
∗0.0
75∗∗
∗
(0.0
03)
(0.0
59)
(0.0
05)
(0.0
04)
(0.0
05)
(0.0
04)
Pos
tLit
igat
ion×
Tar
gete
dV
end
or0.0
01
0.0
16
-0.0
04
0.0
05
-0.0
01
0.0
03
(0.0
04)
(0.0
52)
(0.0
06)
(0.0
05)
(0.0
06)
(0.0
05)
Tar
gete
dV
end
or-0
.048∗∗
∗-0
.628∗
∗∗-0
.050∗
∗∗-0
.046∗∗
∗-0
.043∗∗
∗-0
.053∗
∗∗
(0.0
03)
(0.0
36)
(0.0
04)
(0.0
03)
(0.0
04)
(0.0
03)
Sta
ffed
Bed
s0.0
36
0.6
72∗
∗0.0
17
0.0
55
0.0
06
0.0
70
(0.0
23)
(0.3
33)
(0.0
29)
(0.0
40)
(0.0
25)
(0.0
57)
Inp
atie
nt
Day
s(0
00,0
00)
-0.1
53∗
∗-3
.527∗
∗-0
.095
-0.1
72
0.0
27
-0.3
09∗
(0.0
75)
(1.4
36)
(0.0
96)
(0.1
29)
(0.0
94)
(0.1
74)
Med
icar
eIn
pat
ient
Day
s(0
00,0
00)
0.3
47∗∗
∗6.2
64∗∗
∗0.3
11∗∗
∗0.4
18∗∗
0.1
90
0.5
18∗∗
∗
(0.0
96)
(1.6
96)
(0.1
06)
(0.2
13)
(0.1
29)
(0.1
81)
Med
icai
dIn
pat
ient
Day
s(0
00,0
00)
-0.1
12
-0.9
64
-0.1
21
-0.1
75
-0.2
33∗∗
-0.0
38
(0.0
83)
(1.7
52)
(0.0
90)
(0.1
94)
(0.1
17)
(0.1
30)
Bir
ths
(000
)0.0
02∗∗
0.0
33∗∗
∗0.0
01
0.0
03∗
0.0
02∗
0.0
06
(0.0
01)
(0.0
12)
(0.0
01)
(0.0
01)
(0.0
01)
(0.0
10)
Tot
alO
per
atio
ns
(000
,000
)0.1
33
2.1
46
0.0
27
0.1
14
-0.2
92
0.5
21
(0.1
98)
(2.7
19)
(0.2
13)
(0.3
89)
(0.1
93)
(0.4
35)
Tot
alO
utp
atie
nt
Vis
its
(000
)-0
.010∗
-0.1
52∗
-0.0
14∗∗
0.0
01
-0.0
17∗
∗∗0.0
30
(0.0
05)
(0.0
92)
(0.0
06)
(0.0
14)
(0.0
06)
(0.0
20)
No.
Doct
ors
(000
)0.0
06
0.0
85
0.0
19
-0.1
50∗∗
0.0
16
-0.0
37
(0.0
16)
(0.1
83)
(0.0
18)
(0.0
61)
(0.0
19)
(0.0
26)
Ap
pli
cati
onC
ontr
ols
Yes
Yes
Yes
Yes
Yes
Yes
Yea
rC
ontr
ols
Yes
Yes
Yes
Yes
Yes
Yes
Ob
serv
atio
ns
427424
427424
198946
228478
213800
213624
Dep
end
ent
vari
able
isw
het
her
orn
ot
ther
eis
asu
cces
sfu
lsa
leof
that
typ
eof
soft
ware
toa
hosp
ital
that
yea
r.A
nob
serv
ati
on
ish
osp
ital
-tec
hn
olog
yp
air.
Th
esa
mp
leis
all
hosp
itals
that
hav
en
ot
yet
pu
rch
ase
dth
at
tech
nolo
gy.
Ord
inary
Lea
stS
qu
are
dE
stim
ate
sin
Col
um
ns
(1)
and
(3)-
(4).
Pro
bit
esti
mate
sin
Colu
mn
(2).
Rob
ust
stan
dard
erro
rscl
ust
ered
at
hosp
ital
leve
l.*p<
0.1
0,
**p<
0.0
5,*
**
p<
0.0
1
21
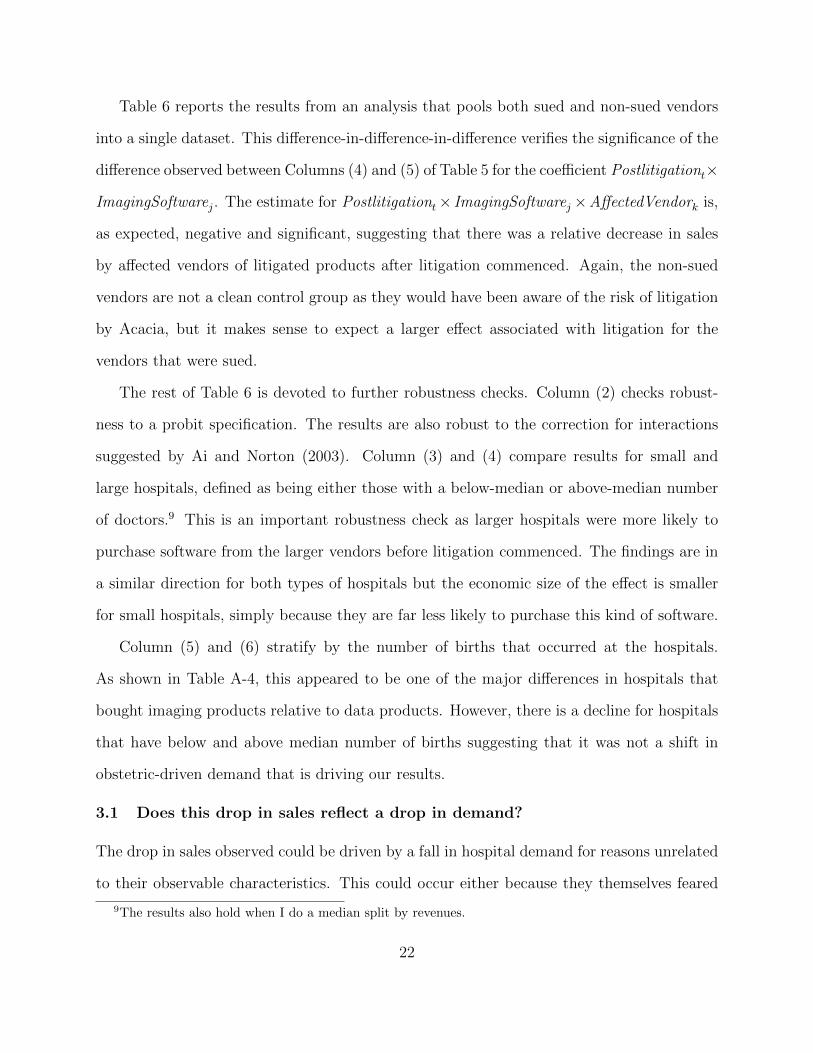
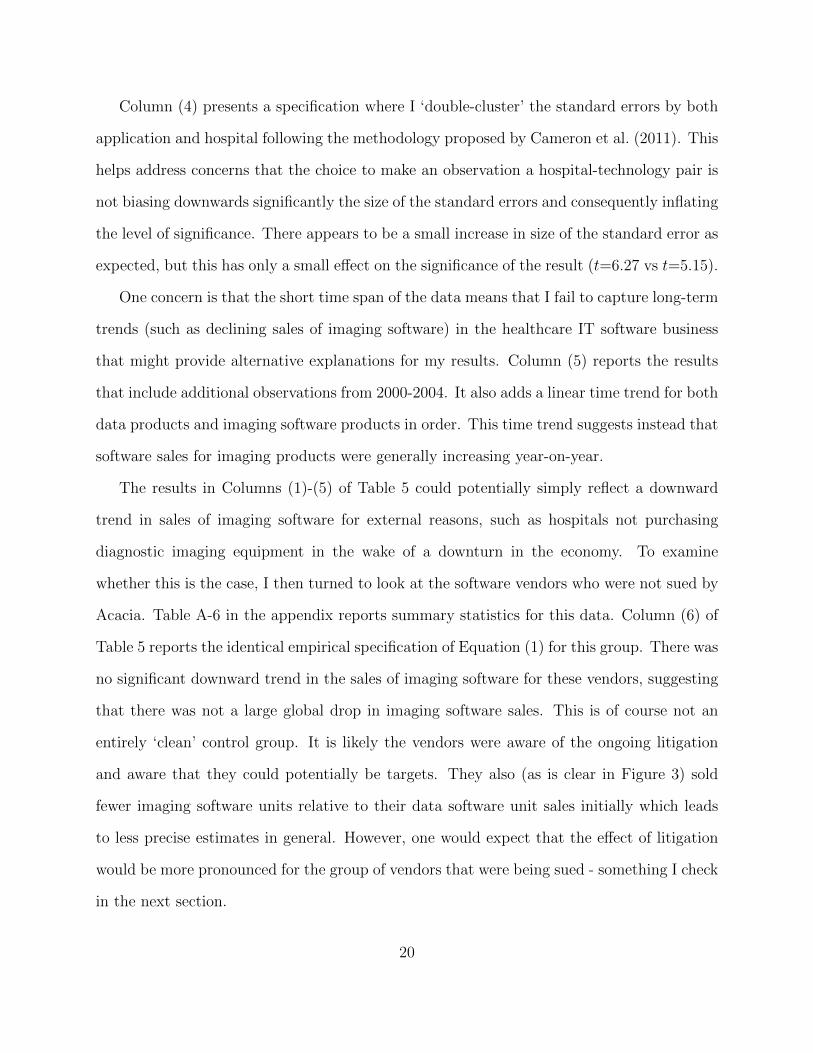
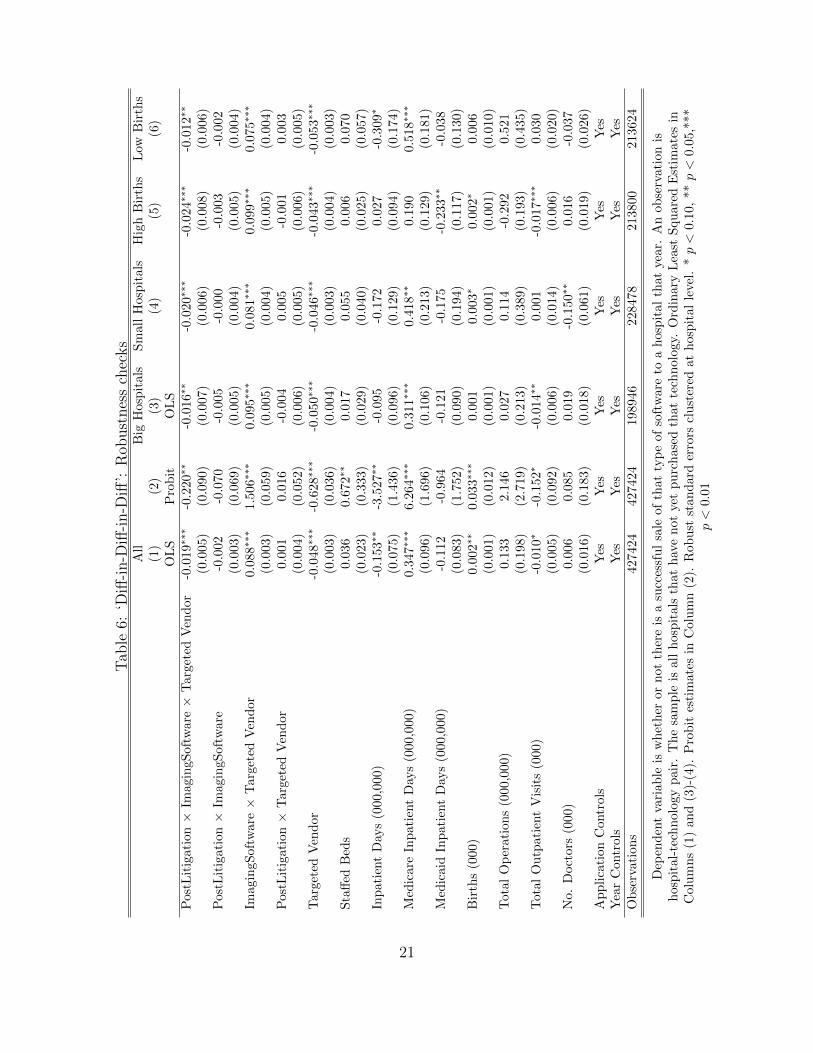
Table 6 reports the results from an analysis that pools both sued and non-sued vendors
into a single dataset. This difference-in-difference-in-difference verifies the significance of the
difference observed between Columns (4) and (5) of Table 5 for the coefficient Postlitigationt×
ImagingSoftwarej. The estimate for Postlitigationt× ImagingSoftwarej ×AffectedVendork is,
as expected, negative and significant, suggesting that there was a relative decrease in sales
by affected vendors of litigated products after litigation commenced. Again, the non-sued
vendors are not a clean control group as they would have been aware of the risk of litigation
by Acacia, but it makes sense to expect a larger effect associated with litigation for the
vendors that were sued.
The rest of Table 6 is devoted to further robustness checks. Column (2) checks robust-
ness to a probit specification. The results are also robust to the correction for interactions
suggested by Ai and Norton (2003). Column (3) and (4) compare results for small and
large hospitals, defined as being either those with a below-median or above-median number
of doctors.9 This is an important robustness check as larger hospitals were more likely to
purchase software from the larger vendors before litigation commenced. The findings are in
a similar direction for both types of hospitals but the economic size of the effect is smaller
for small hospitals, simply because they are far less likely to purchase this kind of software.
Column (5) and (6) stratify by the number of births that occurred at the hospitals.
As shown in Table A-4, this appeared to be one of the major differences in hospitals that
bought imaging products relative to data products. However, there is a decline for hospitals
that have below and above median number of births suggesting that it was not a shift in
obstetric-driven demand that is driving our results.
3.1 Does this drop in sales reflect a drop in demand?
The drop in sales observed could be driven by a fall in hospital demand for reasons unrelated
to their observable characteristics. This could occur either because they themselves feared
9The results also hold when I do a median split by revenues.
22
being sued by Acacia or because of other reasons such as general satiation in demand for
imaging software from the larger vendors.
There is anecdotal evidence that a hospital-driven explanation could be the case. Patent
lawyers warned hospitals that they themselves could be in danger after Acacia’s acquisition
of the patents. For example, Cahr and Kalina (2006) stated explicitly ‘Hospitals and other
providers should not assume that because they hold an important (and often not-for-profit)
place in the culture, that Acacia will hesitate to sue.’ They also went through the appropriate
protective actions that a hospital should take when approached by Acacia, of which one
component was retaining IP counsel.
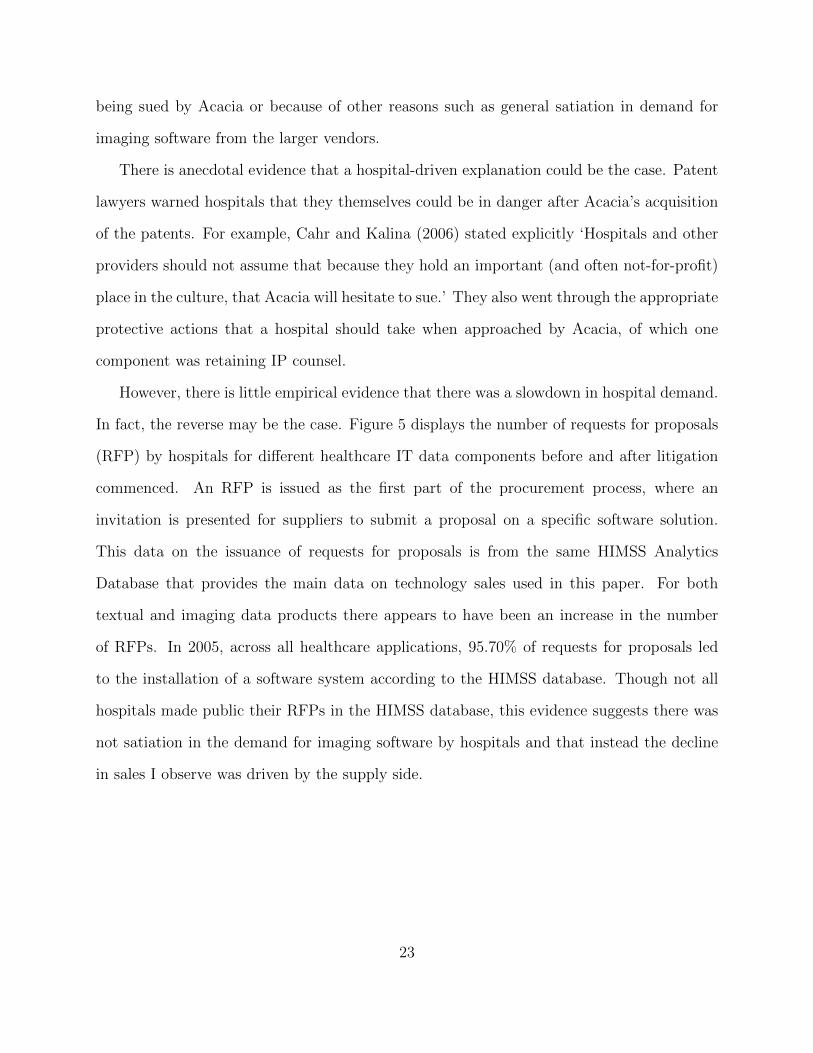
However, there is little empirical evidence that there was a slowdown in hospital demand.
In fact, the reverse may be the case. Figure 5 displays the number of requests for proposals
(RFP) by hospitals for different healthcare IT data components before and after litigation
commenced. An RFP is issued as the first part of the procurement process, where an
invitation is presented for suppliers to submit a proposal on a specific software solution.
This data on the issuance of requests for proposals is from the same HIMSS Analytics
Database that provides the main data on technology sales used in this paper. For both
textual and imaging data products there appears to have been an increase in the number
of RFPs. In 2005, across all healthcare applications, 95.70% of requests for proposals led
to the installation of a software system according to the HIMSS database. Though not all
hospitals made public their RFPs in the HIMSS database, this evidence suggests there was
not satiation in the demand for imaging software by hospitals and that instead the decline
in sales I observe was driven by the supply side.
23
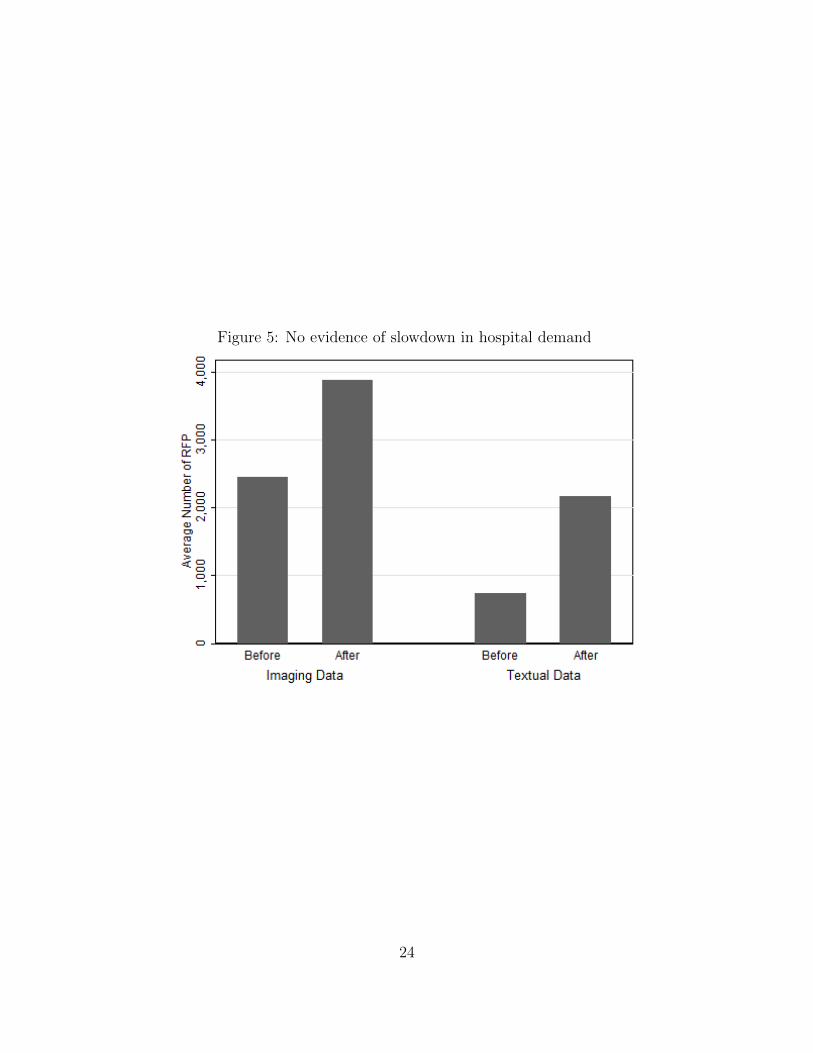
Figure 5: No evidence of slowdown in hospital demand
24
4 Mechanism
A possible explanation for this supply-side shift is that vendors themselves did less to sell
products. Figure 6 displays analysis which investigates whether this is the case. It plots
the number of new product releases before and after litigation for the vendors that were
sued relative to vendors that were not sued. This data is based on whether there is a new
version of the software for that vendor mentioned in product description field in the HIMSS
Analytics database. It is clear that there was a complete collapse in the number of new
incremental product releases and upgrades during the period of litigation.
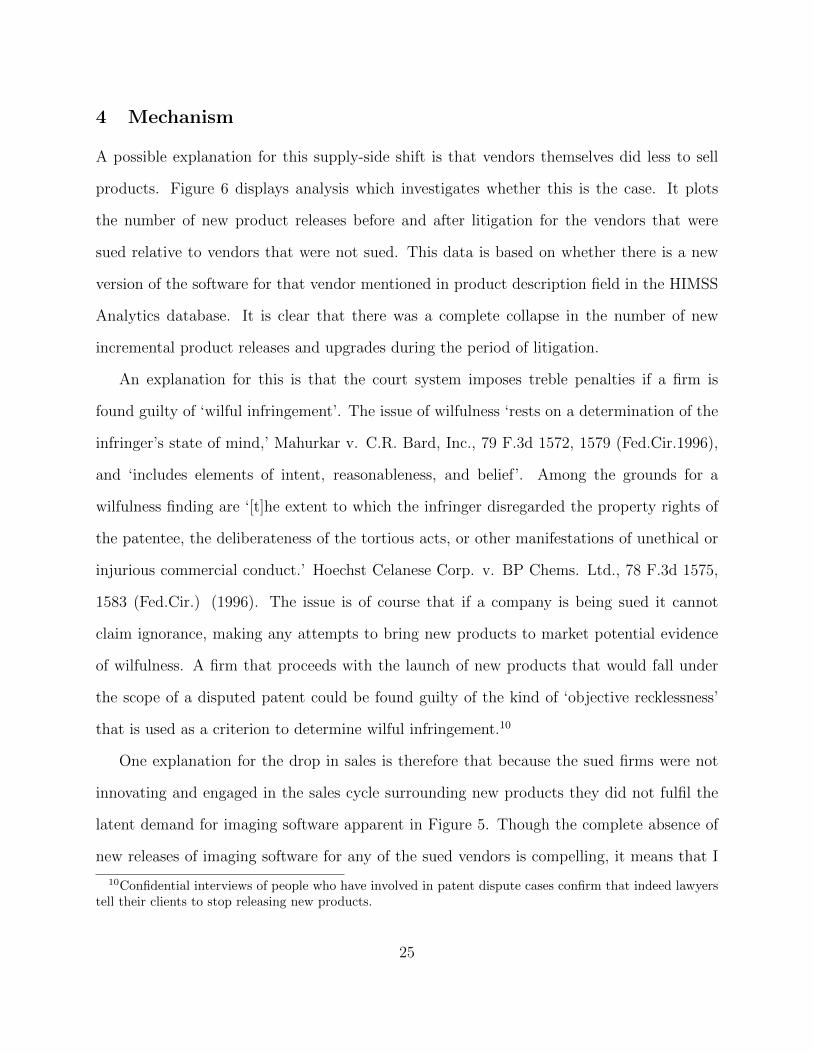
An explanation for this is that the court system imposes treble penalties if a firm is
found guilty of ‘wilful infringement’. The issue of wilfulness ‘rests on a determination of the
infringer’s state of mind,’ Mahurkar v. C.R. Bard, Inc., 79 F.3d 1572, 1579 (Fed.Cir.1996),
and ‘includes elements of intent, reasonableness, and belief’. Among the grounds for a
wilfulness finding are ‘[t]he extent to which the infringer disregarded the property rights of
the patentee, the deliberateness of the tortious acts, or other manifestations of unethical or
injurious commercial conduct.’ Hoechst Celanese Corp. v. BP Chems. Ltd., 78 F.3d 1575,
1583 (Fed.Cir.) (1996). The issue is of course that if a company is being sued it cannot
claim ignorance, making any attempts to bring new products to market potential evidence
of wilfulness. A firm that proceeds with the launch of new products that would fall under
the scope of a disputed patent could be found guilty of the kind of ‘objective recklessness’
that is used as a criterion to determine wilful infringement.10
One explanation for the drop in sales is therefore that because the sued firms were not
innovating and engaged in the sales cycle surrounding new products they did not fulfil the
latent demand for imaging software apparent in Figure 5. Though the complete absence of
new releases of imaging software for any of the sued vendors is compelling, it means that I
10Confidential interviews of people who have involved in patent dispute cases confirm that indeed lawyerstell their clients to stop releasing new products.
25
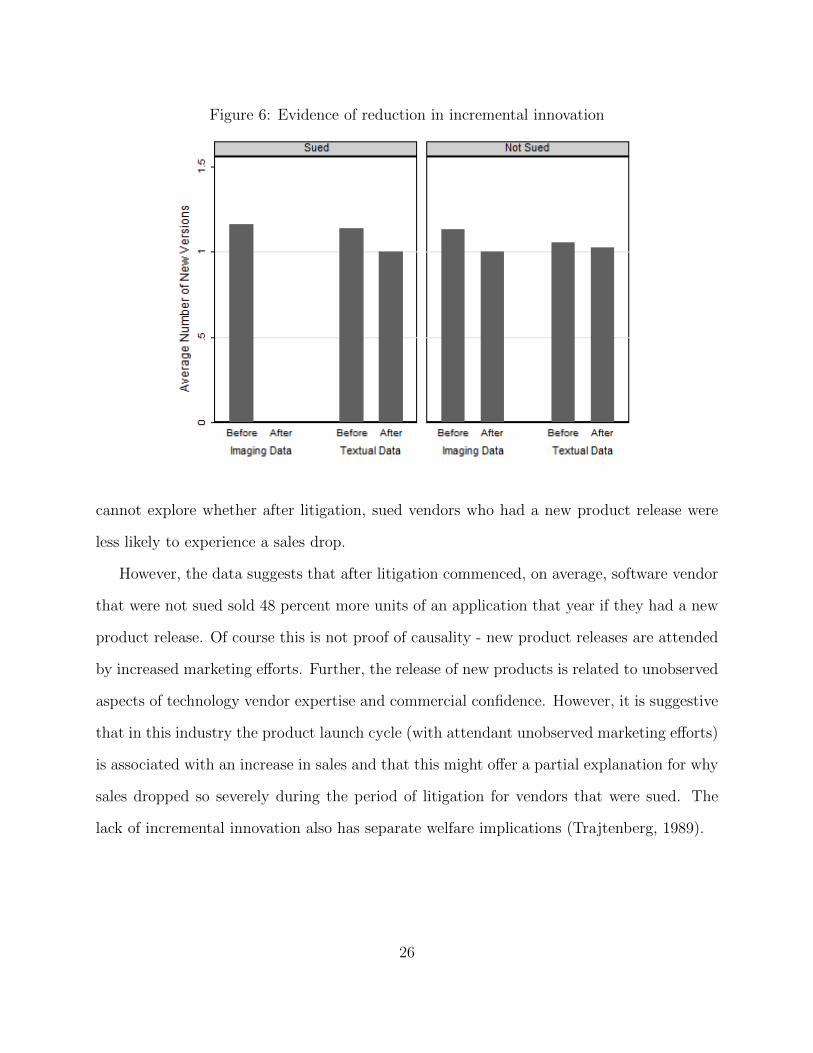
Figure 6: Evidence of reduction in incremental innovation
cannot explore whether after litigation, sued vendors who had a new product release were
less likely to experience a sales drop.
However, the data suggests that after litigation commenced, on average, software vendor
that were not sued sold 48 percent more units of an application that year if they had a new
product release. Of course this is not proof of causality - new product releases are attended
by increased marketing efforts. Further, the release of new products is related to unobserved
aspects of technology vendor expertise and commercial confidence. However, it is suggestive
that in this industry the product launch cycle (with attendant unobserved marketing efforts)
is associated with an increase in sales and that this might offer a partial explanation for why
sales dropped so severely during the period of litigation for vendors that were sued. The
lack of incremental innovation also has separate welfare implications (Trajtenberg, 1989).
26
5 Conclusion
Patents are intended to give patent-holders enforceable rights over their intellectual property
and to enable the sharing of information without the risk of appropriation. Protection is
given to small inventors to ensure they can profit from their invention even if they lack the
resources to manufacture it. This means that there is a role for patent intermediaries that
broker agreements with large firms who infringe on the patent of a small inventor. Patent-
assertion entities themselves emphasize their role as intermediaries and the efficiency benefits
this could bring. For example, Intellectual Ventures, after being accused of being a patent
troll by Blumberg (2011), responded on its website that ‘Our ultimate value proposition is
simple: we provide an efficient way for patent holders to get paid for the inventions they
own, and in turn, for technology companies to gain easy access to the invention rights they
need now or may need as they enter new markets.’ However, the actions of these patent
intermediaries or patent-assertion entities have been criticized, especially as part of their
role as intermediaries is to buttress their licensing demands by aggressive and drawn-out
litigation.
This paper explores empirically whether such litigation by patent-assertion entities ham-
pers the diffusion of innovations. It studies this in the field of healthcare information tech-
nology in light of recent litigation over medical imaging software patents. Empirical analysis
suggests that there was a large reduction in sales of imaging software products relative to
other similar products that were produced by the same sued firms but did not fall under
the scope of the disputed patent. There was no such significant change in sales of imaging
software for firms that were not the target of litigation. Further, there was an increase in
sales proposal requests for both textual and imaging software by hospitals in this period,
suggesting that these results do not reflect a suppression of demand.
Instead, it appears the drop in sales was linked to a drop in incremental product in-
27
novation. No new variations of existing products or new models of imaging software were
released by the affected vendors during the period of litigation. An explanation for this
lack of innovation is that the vendors did not want to run the risk of being found guilty of
‘wilful infringement’ in the patent suit and being liable for treble damages. Therefore, one
explanation of the slow-down in sales is that the product release and attendant sales cycle
was halted as a result of litigation. This emphasizes that even if patent assertion entities do
not prevail in the courtroom, their actions can have significantly negative consequences for
incremental innovation while litigation is ongoing.
It is of course an open question about the extent to which this chilling of technology
sales observed during the process of litigation is particular to technology cases that involve
patent assertion entities or would apply more generally to other patent litigation. There are,
however, reasons to think that such spillovers from litigation on technology sales may be more
acute in cases involving patent assertion entities. First, patent assertion entities have both
the flexibility to allow them to choose legal venues which makes litigation and the threat
of being found guilty of wilful infringement a credible risk. Second, the patent assertion
entity business model means that there are fewer costs to them of prolonging litigation since
they are not vulnerable to counter-claims or increased risk over a manufacturing process,
producing asymmetry in the negative effects of litigation.
28
References
Ai, C. and E. C. Norton (2003, July). Interaction terms in logit and probit models. Economics
Letters 80 (1), 123–129.
Allison, P. D. (1982). Sociological Methodology, Chapter Discrete-time methods for the
analysis of event histories, pp. 61–98. San Francisco: Jossey-Bass.
Bessen, J. E. and M. J. Meurer (2008). The Private Costs of Patent Litigation. Mimeo,
Boston University .
Bessen, J. E., M. J. Meurer, and J. L. Ford (2011). The Private and Social Costs of Patent
Trolls. Mimeo, Boston University .
Blumberg, A. (2011, July 22). When patents attack. The American Life, National Public
Radio.
Cahr, D. and I. Kalina (2006). Of PACS and trolls: How the patent wars may be coming to
a hospital near you. ABA Health Lawyer 19 (1).
Cameron, A. C., J. B. Gelbach, and D. L. Miller (2011, September). Robust inference with
multi-way clustering. Journal of Business and Economic Statistics 29 (2), 238–249.
Fischer, T. and J. Henkel (2011). Patent Trolls on Markets for Technology - An Empirical
Analysis of Trolls’ Patent Acquisitions. Mimeo, Technische Universitat Munchen.
FTC (2011, March). The evolving IP marketplace: Aligning patent notices and remedies
with competition. Federal Trade Commission.
Inga, J. and T. Saliga (1994, June). Automated high definition/resolution image storage,
retrieval and transmission system. (5321520).
29
Inga, J. and T. Saliga (1995, May). Medical image system with progressive resolution.
(5416602).
Jaffe, A. and J. Lerner (2004). Innovation and its discontents: how our broken patent system
is endangering innovation and progress, and what to do about it. Princeton University
Press.
Jha, A., C. DesRoches, E. Campbell, K. Donelan, S. Rao, T. Ferris, A. Shields, S. Rosen-
baum, and D. Blumenthal (2009). Use of electronic health records in US hospitals. The
New England Journal of Medicine 360 (16), 1628.
Lemley, M. A. and C. Shapiro (2007). Patent Holdup and Royalty Stacking. Texas Law
Review, Vol. 85 .
Lerner, J. (2006). Trolls on State Street? The litigation of financial patents, 1976-2005.
Mimeo, HBS .
McDonough, J. F. (2006). The Myth of the Patent Troll: An Alternative View of the
Function of Patent Dealers in an Idea Economy. Emory Law Journal, Vol. 56, p. 189 .
Mehta, A., M. Rysman, and T. Simcoe (2010). Identifying the age profile of patent citations:
new estimates of knowledge diffusion. Journal of Applied Econometrics 25 (7), 1179–1204.
Miller, A. and C. Tucker (2011). Can healthcare information technology save babies? Journal
of Political Economy (2), 289–324.
Pohlmann, T. and M. Opitz (2010, November). The patent troll business: An efficient model
to enforce IPR? MPRA Paper 27342, University Library of Munich, Germany.
Reitzig, M., J. Henkel, and C. Heath (2007, February). On sharks, trolls, and their patent
prey - Unrealistic damage awards and firms’ strategies of ‘being infringed’. Research
Policy 36 (1), 134–154.
30
Trajtenberg, M. (1989, April). The welfare analysis of product innovations, with an appli-
cation to computed tomography scanners. Journal of Political Economy 97 (2), 444–79.
Wang, A. W. (2010). Berkeley Technology Law Journal 25 (1), 159–200.
Wen, W., C. Forman, and S. Graham (2010). The impact of intellectual property enforcement
on open source software adoption. In ICIS 2010 Proceedings, Volume Paper 187.
31
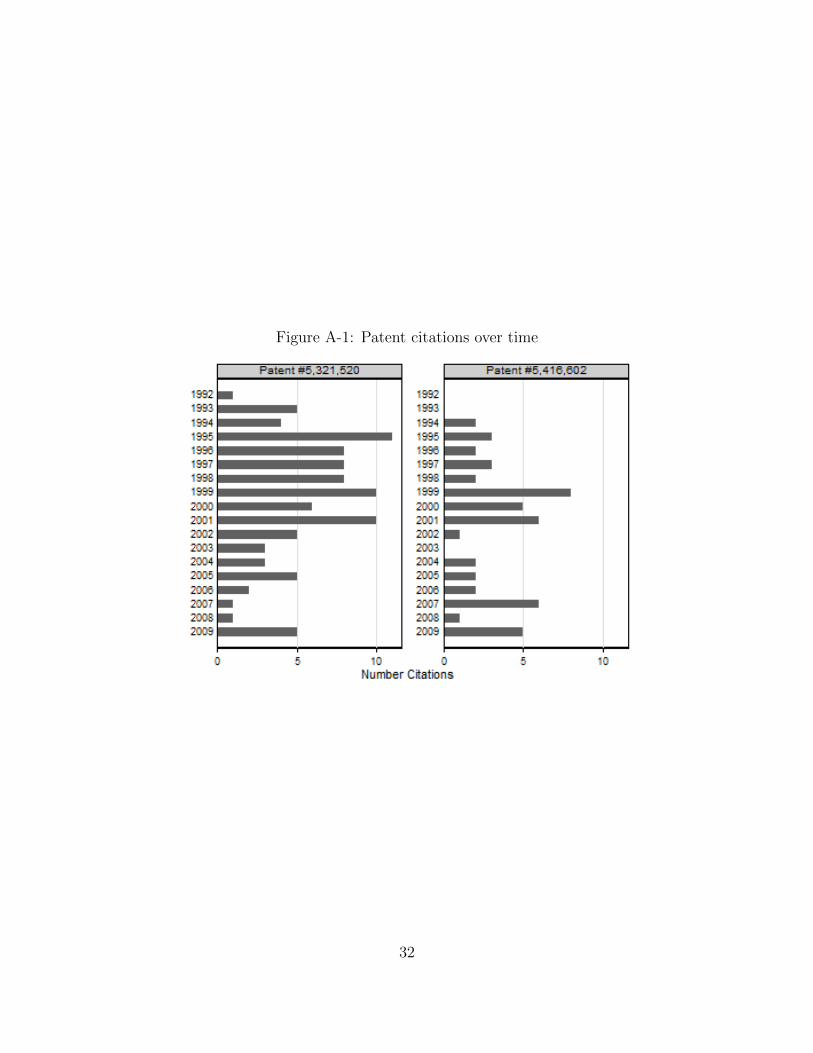
Figure A-1: Patent citations over time
32
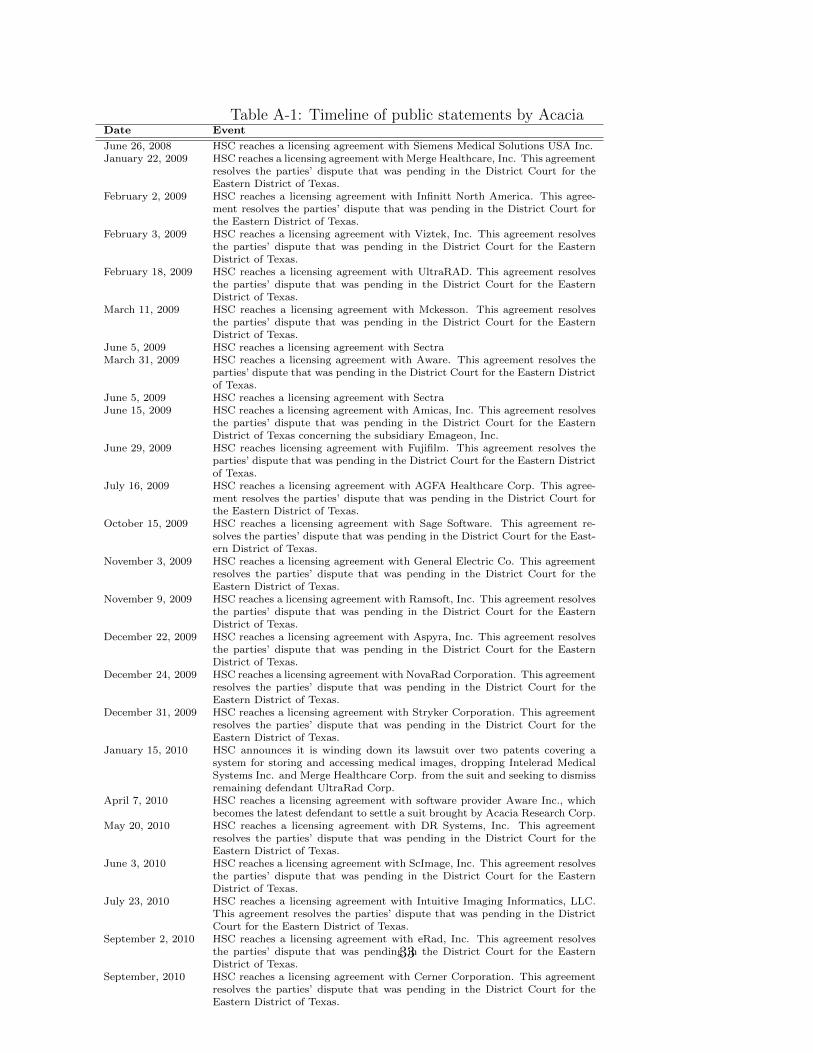
Table A-1: Timeline of public statements by AcaciaDate Event
June 26, 2008 HSC reaches a licensing agreement with Siemens Medical Solutions USA Inc.January 22, 2009 HSC reaches a licensing agreement with Merge Healthcare, Inc. This agreement
resolves the parties’ dispute that was pending in the District Court for theEastern District of Texas.
February 2, 2009 HSC reaches a licensing agreement with Infinitt North America. This agree-ment resolves the parties’ dispute that was pending in the District Court forthe Eastern District of Texas.
February 3, 2009 HSC reaches a licensing agreement with Viztek, Inc. This agreement resolvesthe parties’ dispute that was pending in the District Court for the EasternDistrict of Texas.
February 18, 2009 HSC reaches a licensing agreement with UltraRAD. This agreement resolvesthe parties’ dispute that was pending in the District Court for the EasternDistrict of Texas.
March 11, 2009 HSC reaches a licensing agreement with Mckesson. This agreement resolvesthe parties’ dispute that was pending in the District Court for the EasternDistrict of Texas.
June 5, 2009 HSC reaches a licensing agreement with SectraMarch 31, 2009 HSC reaches a licensing agreement with Aware. This agreement resolves the
parties’ dispute that was pending in the District Court for the Eastern Districtof Texas.
June 5, 2009 HSC reaches a licensing agreement with SectraJune 15, 2009 HSC reaches a licensing agreement with Amicas, Inc. This agreement resolves
the parties’ dispute that was pending in the District Court for the EasternDistrict of Texas concerning the subsidiary Emageon, Inc.
June 29, 2009 HSC reaches licensing agreement with Fujifilm. This agreement resolves theparties’ dispute that was pending in the District Court for the Eastern Districtof Texas.
July 16, 2009 HSC reaches a licensing agreement with AGFA Healthcare Corp. This agree-ment resolves the parties’ dispute that was pending in the District Court forthe Eastern District of Texas.
October 15, 2009 HSC reaches a licensing agreement with Sage Software. This agreement re-solves the parties’ dispute that was pending in the District Court for the East-ern District of Texas.
November 3, 2009 HSC reaches a licensing agreement with General Electric Co. This agreementresolves the parties’ dispute that was pending in the District Court for theEastern District of Texas.
November 9, 2009 HSC reaches a licensing agreement with Ramsoft, Inc. This agreement resolvesthe parties’ dispute that was pending in the District Court for the EasternDistrict of Texas.
December 22, 2009 HSC reaches a licensing agreement with Aspyra, Inc. This agreement resolvesthe parties’ dispute that was pending in the District Court for the EasternDistrict of Texas.
December 24, 2009 HSC reaches a licensing agreement with NovaRad Corporation. This agreementresolves the parties’ dispute that was pending in the District Court for theEastern District of Texas.
December 31, 2009 HSC reaches a licensing agreement with Stryker Corporation. This agreementresolves the parties’ dispute that was pending in the District Court for theEastern District of Texas.
January 15, 2010 HSC announces it is winding down its lawsuit over two patents covering asystem for storing and accessing medical images, dropping Intelerad MedicalSystems Inc. and Merge Healthcare Corp. from the suit and seeking to dismissremaining defendant UltraRad Corp.
April 7, 2010 HSC reaches a licensing agreement with software provider Aware Inc., whichbecomes the latest defendant to settle a suit brought by Acacia Research Corp.
May 20, 2010 HSC reaches a licensing agreement with DR Systems, Inc. This agreementresolves the parties’ dispute that was pending in the District Court for theEastern District of Texas.
June 3, 2010 HSC reaches a licensing agreement with ScImage, Inc. This agreement resolvesthe parties’ dispute that was pending in the District Court for the EasternDistrict of Texas.
July 23, 2010 HSC reaches a licensing agreement with Intuitive Imaging Informatics, LLC.This agreement resolves the parties’ dispute that was pending in the DistrictCourt for the Eastern District of Texas.
September 2, 2010 HSC reaches a licensing agreement with eRad, Inc. This agreement resolvesthe parties’ dispute that was pending in the District Court for the EasternDistrict of Texas.
September, 2010 HSC reaches a licensing agreement with Cerner Corporation. This agreementresolves the parties’ dispute that was pending in the District Court for theEastern District of Texas.
33
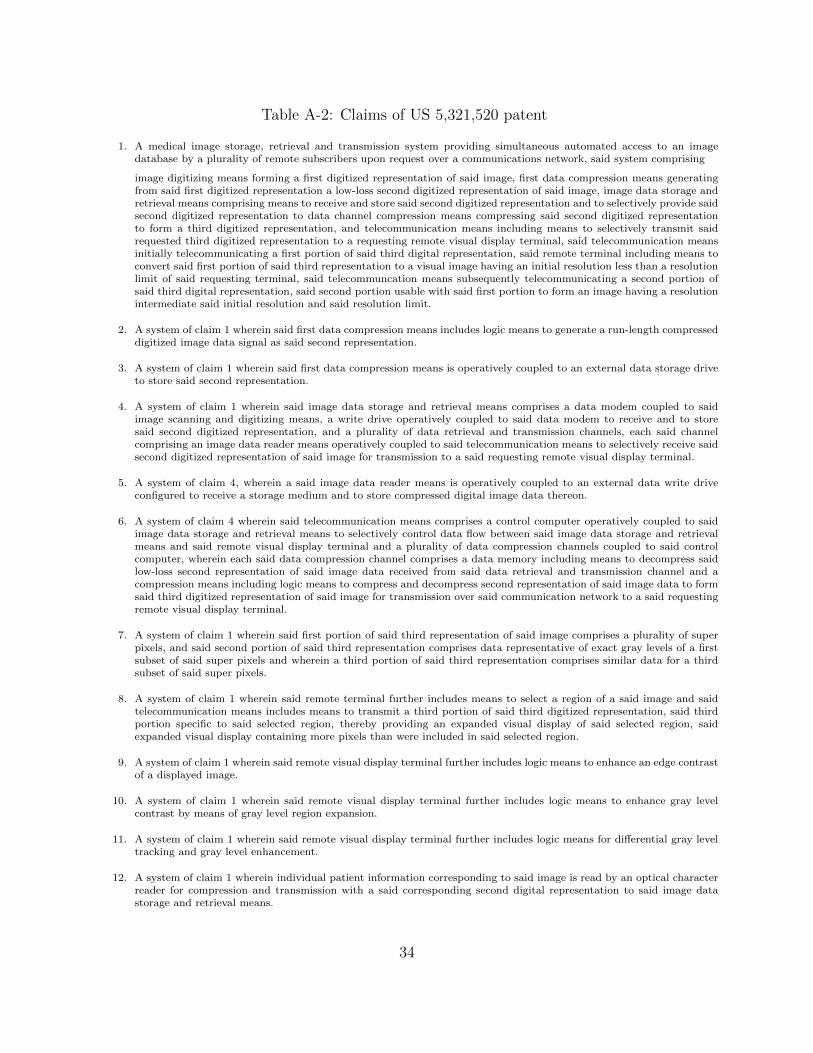
Table A-2: Claims of US 5,321,520 patent
1. A medical image storage, retrieval and transmission system providing simultaneous automated access to an imagedatabase by a plurality of remote subscribers upon request over a communications network, said system comprising
image digitizing means forming a first digitized representation of said image, first data compression means generatingfrom said first digitized representation a low-loss second digitized representation of said image, image data storage andretrieval means comprising means to receive and store said second digitized representation and to selectively provide saidsecond digitized representation to data channel compression means compressing said second digitized representationto form a third digitized representation, and telecommunication means including means to selectively transmit saidrequested third digitized representation to a requesting remote visual display terminal, said telecommunication meansinitially telecommunicating a first portion of said third digital representation, said remote terminal including means toconvert said first portion of said third representation to a visual image having an initial resolution less than a resolutionlimit of said requesting terminal, said telecommuncation means subsequently telecommunicating a second portion ofsaid third digital representation, said second portion usable with said first portion to form an image having a resolutionintermediate said initial resolution and said resolution limit.
2. A system of claim 1 wherein said first data compression means includes logic means to generate a run-length compresseddigitized image data signal as said second representation.
3. A system of claim 1 wherein said first data compression means is operatively coupled to an external data storage driveto store said second representation.
4. A system of claim 1 wherein said image data storage and retrieval means comprises a data modem coupled to saidimage scanning and digitizing means, a write drive operatively coupled to said data modem to receive and to storesaid second digitized representation, and a plurality of data retrieval and transmission channels, each said channelcomprising an image data reader means operatively coupled to said telecommunication means to selectively receive saidsecond digitized representation of said image for transmission to a said requesting remote visual display terminal.
5. A system of claim 4, wherein a said image data reader means is operatively coupled to an external data write driveconfigured to receive a storage medium and to store compressed digital image data thereon.
6. A system of claim 4 wherein said telecommunication means comprises a control computer operatively coupled to saidimage data storage and retrieval means to selectively control data flow between said image data storage and retrievalmeans and said remote visual display terminal and a plurality of data compression channels coupled to said controlcomputer, wherein each said data compression channel comprises a data memory including means to decompress saidlow-loss second representation of said image data received from said data retrieval and transmission channel and acompression means including logic means to compress and decompress second representation of said image data to formsaid third digitized representation of said image for transmission over said communication network to a said requestingremote visual display terminal.
7. A system of claim 1 wherein said first portion of said third representation of said image comprises a plurality of superpixels, and said second portion of said third representation comprises data representative of exact gray levels of a firstsubset of said super pixels and wherein a third portion of said third representation comprises similar data for a thirdsubset of said super pixels.
8. A system of claim 1 wherein said remote terminal further includes means to select a region of a said image and saidtelecommunication means includes means to transmit a third portion of said third digitized representation, said thirdportion specific to said selected region, thereby providing an expanded visual display of said selected region, saidexpanded visual display containing more pixels than were included in said selected region.
9. A system of claim 1 wherein said remote visual display terminal further includes logic means to enhance an edge contrastof a displayed image.
10. A system of claim 1 wherein said remote visual display terminal further includes logic means to enhance gray levelcontrast by means of gray level region expansion.
11. A system of claim 1 wherein said remote visual display terminal further includes logic means for differential gray leveltracking and gray level enhancement.
12. A system of claim 1 wherein individual patient information corresponding to said image is read by an optical characterreader for compression and transmission with a said corresponding second digital representation to said image datastorage and retrieval means.
34
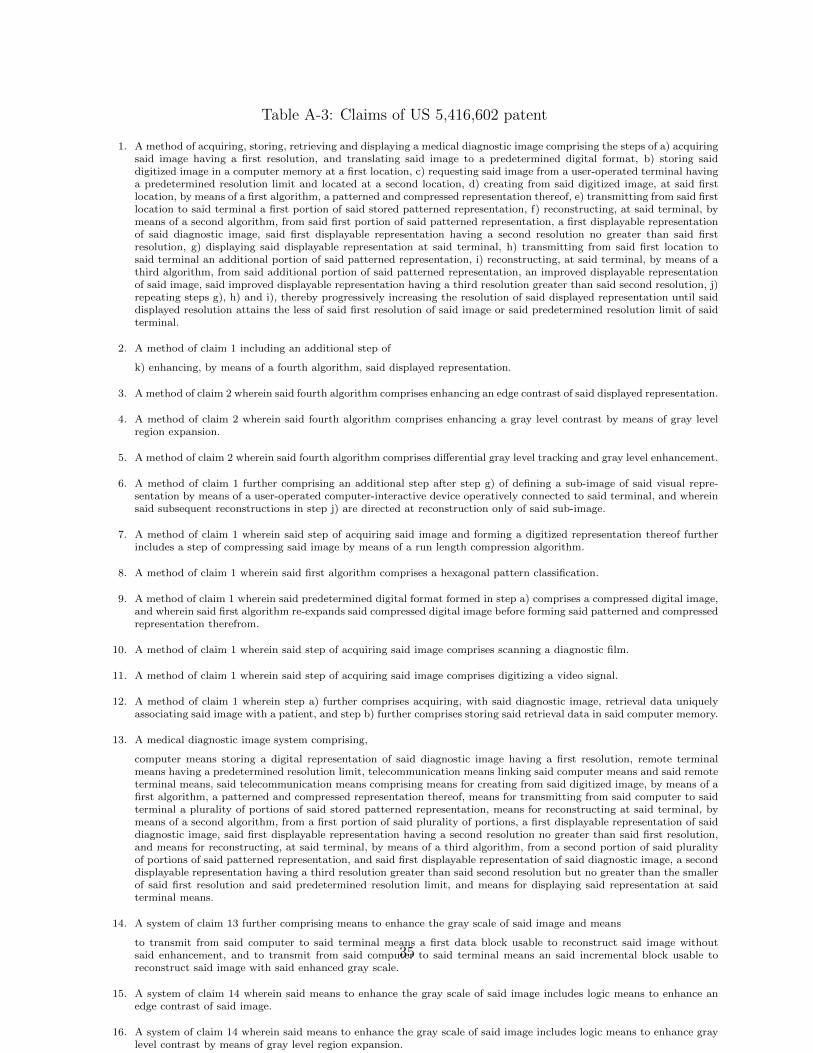
Table A-3: Claims of US 5,416,602 patent
1. A method of acquiring, storing, retrieving and displaying a medical diagnostic image comprising the steps of a) acquiringsaid image having a first resolution, and translating said image to a predetermined digital format, b) storing saiddigitized image in a computer memory at a first location, c) requesting said image from a user-operated terminal havinga predetermined resolution limit and located at a second location, d) creating from said digitized image, at said firstlocation, by means of a first algorithm, a patterned and compressed representation thereof, e) transmitting from said firstlocation to said terminal a first portion of said stored patterned representation, f) reconstructing, at said terminal, bymeans of a second algorithm, from said first portion of said patterned representation, a first displayable representationof said diagnostic image, said first displayable representation having a second resolution no greater than said firstresolution, g) displaying said displayable representation at said terminal, h) transmitting from said first location tosaid terminal an additional portion of said patterned representation, i) reconstructing, at said terminal, by means of athird algorithm, from said additional portion of said patterned representation, an improved displayable representationof said image, said improved displayable representation having a third resolution greater than said second resolution, j)repeating steps g), h) and i), thereby progressively increasing the resolution of said displayed representation until saiddisplayed resolution attains the less of said first resolution of said image or said predetermined resolution limit of saidterminal.
2. A method of claim 1 including an additional step of
k) enhancing, by means of a fourth algorithm, said displayed representation.
3. A method of claim 2 wherein said fourth algorithm comprises enhancing an edge contrast of said displayed representation.
4. A method of claim 2 wherein said fourth algorithm comprises enhancing a gray level contrast by means of gray levelregion expansion.
5. A method of claim 2 wherein said fourth algorithm comprises differential gray level tracking and gray level enhancement.
6. A method of claim 1 further comprising an additional step after step g) of defining a sub-image of said visual repre-sentation by means of a user-operated computer-interactive device operatively connected to said terminal, and whereinsaid subsequent reconstructions in step j) are directed at reconstruction only of said sub-image.
7. A method of claim 1 wherein said step of acquiring said image and forming a digitized representation thereof furtherincludes a step of compressing said image by means of a run length compression algorithm.
8. A method of claim 1 wherein said first algorithm comprises a hexagonal pattern classification.
9. A method of claim 1 wherein said predetermined digital format formed in step a) comprises a compressed digital image,and wherein said first algorithm re-expands said compressed digital image before forming said patterned and compressedrepresentation therefrom.
10. A method of claim 1 wherein said step of acquiring said image comprises scanning a diagnostic film.
11. A method of claim 1 wherein said step of acquiring said image comprises digitizing a video signal.
12. A method of claim 1 wherein step a) further comprises acquiring, with said diagnostic image, retrieval data uniquelyassociating said image with a patient, and step b) further comprises storing said retrieval data in said computer memory.
13. A medical diagnostic image system comprising,
computer means storing a digital representation of said diagnostic image having a first resolution, remote terminalmeans having a predetermined resolution limit, telecommunication means linking said computer means and said remoteterminal means, said telecommunication means comprising means for creating from said digitized image, by means of afirst algorithm, a patterned and compressed representation thereof, means for transmitting from said computer to saidterminal a plurality of portions of said stored patterned representation, means for reconstructing at said terminal, bymeans of a second algorithm, from a first portion of said plurality of portions, a first displayable representation of saiddiagnostic image, said first displayable representation having a second resolution no greater than said first resolution,and means for reconstructing, at said terminal, by means of a third algorithm, from a second portion of said pluralityof portions of said patterned representation, and said first displayable representation of said diagnostic image, a seconddisplayable representation having a third resolution greater than said second resolution but no greater than the smallerof said first resolution and said predetermined resolution limit, and means for displaying said representation at saidterminal means.
14. A system of claim 13 further comprising means to enhance the gray scale of said image and means
to transmit from said computer to said terminal means a first data block usable to reconstruct said image withoutsaid enhancement, and to transmit from said computer to said terminal means an said incremental block usable toreconstruct said image with said enhanced gray scale.
15. A system of claim 14 wherein said means to enhance the gray scale of said image includes logic means to enhance anedge contrast of said image.
16. A system of claim 14 wherein said means to enhance the gray scale of said image includes logic means to enhance graylevel contrast by means of gray level region expansion.
17. A system of claim 14 wherein said means to enhance the gray scale of said image includes logic means for differentialgray level tracking and gray level enhancement.
18. Apparatus of claim 13 further comprising a user-operated computer-interactive device operatively connected to saidterminal, said user-operated device defining a sub-image of said visual representation, and wherein said third algorithmreconstructs only said sub-image.
19. Apparatus of claim 13 wherein said first algorithm comprises a hexagonal pattern classification.
20. Apparatus of claim 13 wherein said digital representation comprises a compressed digital representation and saidfirst algorithm re-expands said compressed digital image before forming said patterned and compressed representationthereof.
21. Apparatus of claim 13 wherein said computer means further stores retrieval data uniquely associating said image witha patient.
35
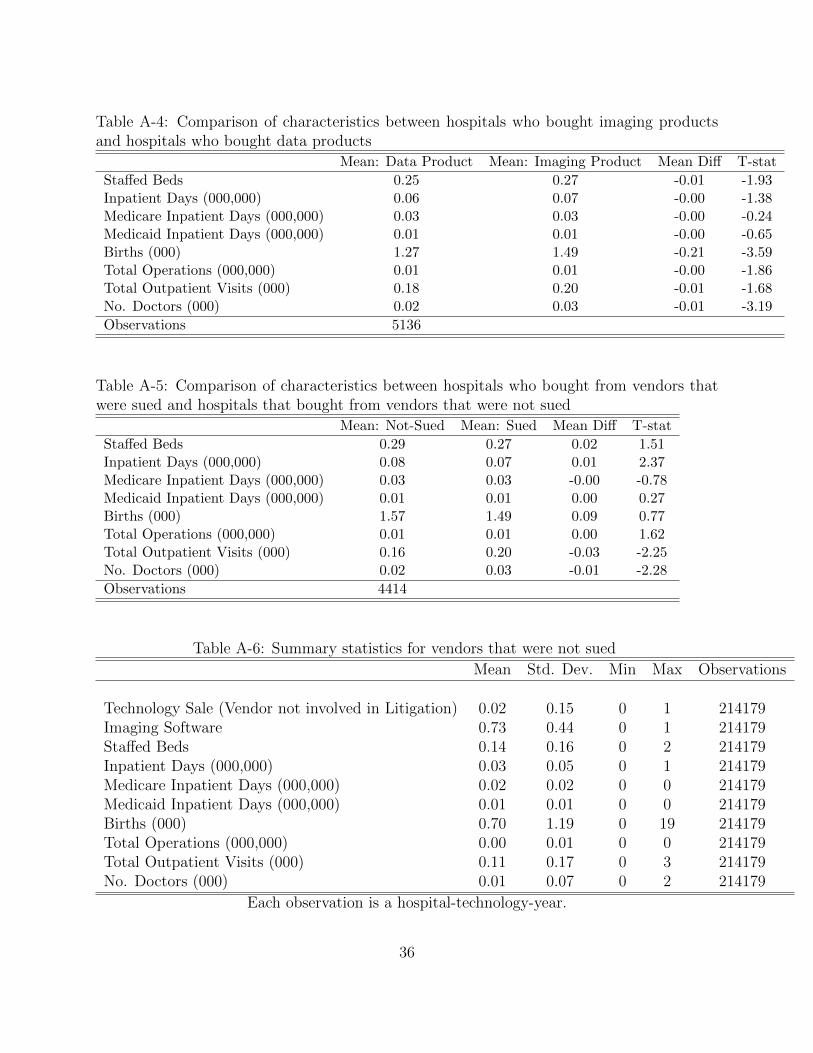
Table A-4: Comparison of characteristics between hospitals who bought imaging productsand hospitals who bought data products
Mean: Data Product Mean: Imaging Product Mean Diff T-stat
Staffed Beds 0.25 0.27 -0.01 -1.93Inpatient Days (000,000) 0.06 0.07 -0.00 -1.38Medicare Inpatient Days (000,000) 0.03 0.03 -0.00 -0.24Medicaid Inpatient Days (000,000) 0.01 0.01 -0.00 -0.65Births (000) 1.27 1.49 -0.21 -3.59Total Operations (000,000) 0.01 0.01 -0.00 -1.86Total Outpatient Visits (000) 0.18 0.20 -0.01 -1.68No. Doctors (000) 0.02 0.03 -0.01 -3.19
Observations 5136
Table A-5: Comparison of characteristics between hospitals who bought from vendors thatwere sued and hospitals that bought from vendors that were not sued
Mean: Not-Sued Mean: Sued Mean Diff T-stat
Staffed Beds 0.29 0.27 0.02 1.51Inpatient Days (000,000) 0.08 0.07 0.01 2.37Medicare Inpatient Days (000,000) 0.03 0.03 -0.00 -0.78Medicaid Inpatient Days (000,000) 0.01 0.01 0.00 0.27Births (000) 1.57 1.49 0.09 0.77Total Operations (000,000) 0.01 0.01 0.00 1.62Total Outpatient Visits (000) 0.16 0.20 -0.03 -2.25No. Doctors (000) 0.02 0.03 -0.01 -2.28
Observations 4414
Table A-6: Summary statistics for vendors that were not sued
Mean Std. Dev. Min Max Observations
Technology Sale (Vendor not involved in Litigation) 0.02 0.15 0 1 214179Imaging Software 0.73 0.44 0 1 214179Staffed Beds 0.14 0.16 0 2 214179Inpatient Days (000,000) 0.03 0.05 0 1 214179Medicare Inpatient Days (000,000) 0.02 0.02 0 0 214179Medicaid Inpatient Days (000,000) 0.01 0.01 0 0 214179Births (000) 0.70 1.19 0 19 214179Total Operations (000,000) 0.00 0.01 0 0 214179Total Outpatient Visits (000) 0.11 0.17 0 3 214179No. Doctors (000) 0.01 0.07 0 2 214179
Each observation is a hospital-technology-year.
36