passive, adsorbent-based sediment pore water...
TRANSCRIPT
© Copyright 2013 AMPLIFIED GEOCHEMICAL IMAGING, LLC www.agisurveys.net Slide 1
Passive, Adsorbent-Based Sediment Pore Water
Sampling
2013 NEMC
August 5, 2013 Jim Whetzel
Amplified Geochemical Imaging, LLC. (AGI)
Special thanks to Kathy West, URS Corporation
Ken Alepidis and Sean Caroll, Haley & Aldrich, Inc.
© Copyright 2013 AMPLIFIED GEOCHEMICAL IMAGING, LLC www.agisurveys.net Slide 2
• Common applications of passive sampling
• Sampler description and analysis
• Calculating concentrations
• Installation guidelines
• Case studies
– Canal sediment – direct insertion
– River sediment - test cell
• Conclusions
Overview
© Copyright 2013 AMPLIFIED GEOCHEMICAL IMAGING, LLC www.agisurveys.net Slide 3
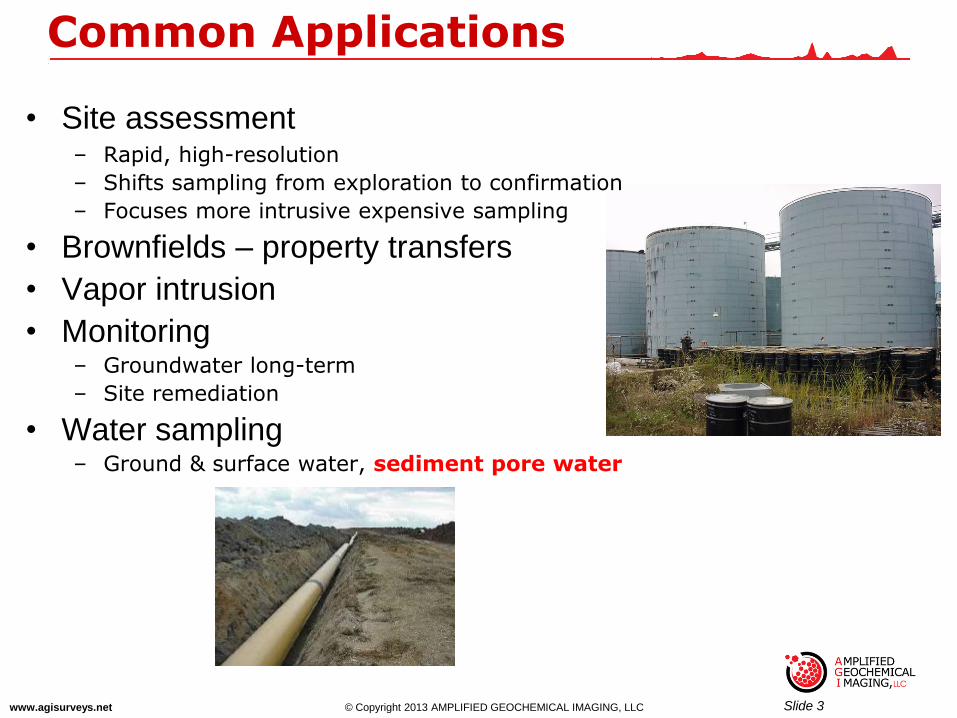
• Site assessment – Rapid, high-resolution
– Shifts sampling from exploration to confirmation
– Focuses more intrusive expensive sampling
• Brownfields – property transfers
• Vapor intrusion
• Monitoring – Groundwater long-term
– Site remediation
• Water sampling – Ground & surface water, sediment pore water
Common Applications

© Copyright 2013 AMPLIFIED GEOCHEMICAL IMAGING, LLC www.agisurveys.net Slide 4
• GORE-TEX® Membrane
– Inert, waterproof, vapor permeable
– Designed for vapor diffusion
• Hydrophobic, engineered sorbents
– VOCs, SVOCs, PAHs
• Sample integrity protected
• 4,000 surveys worldwide – Federal, state, international regulatory acceptance
AGI Universal Sampler (formerly GORE® Module and GORE-SORBER)
GORE-TEX® Membrane

© Copyright 2013 AMPLIFIED GEOCHEMICAL IMAGING, LLC www.agisurveys.net Slide 5
Vapor Transfer Rates
© Copyright 2013 AMPLIFIED GEOCHEMICAL IMAGING, LLC www.agisurveys.net Slide 6
Analysis
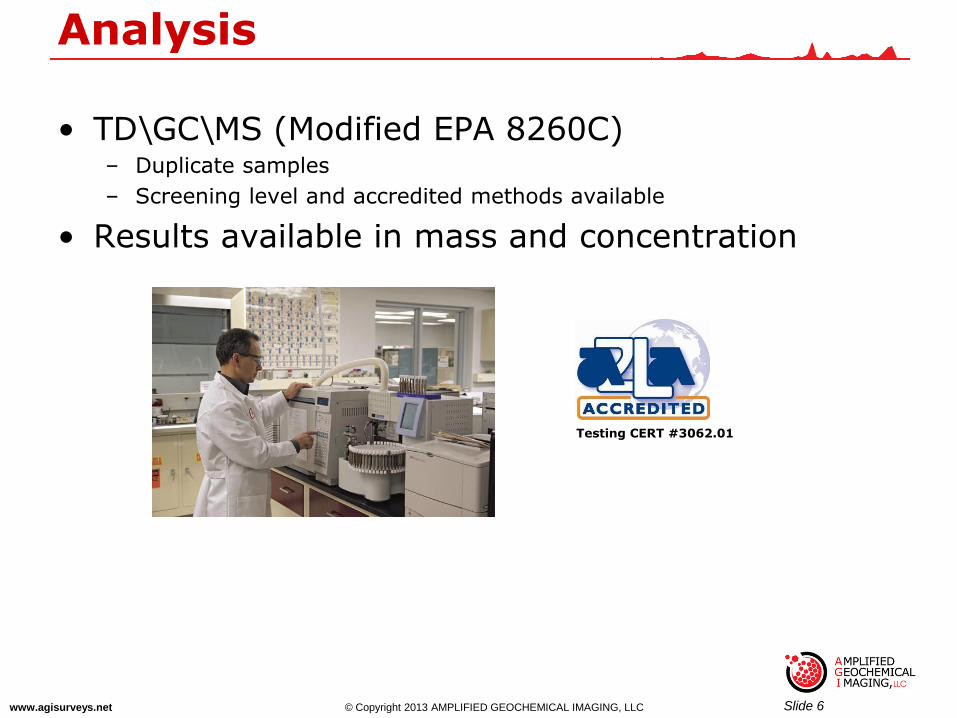
• TD\GC\MS (Modified EPA 8260C) – Duplicate samples
– Screening level and accredited methods available
• Results available in mass and concentration
Testing CERT #3062.01
© Copyright 2013 AMPLIFIED GEOCHEMICAL IMAGING, LLC www.agisurveys.net Slide 7
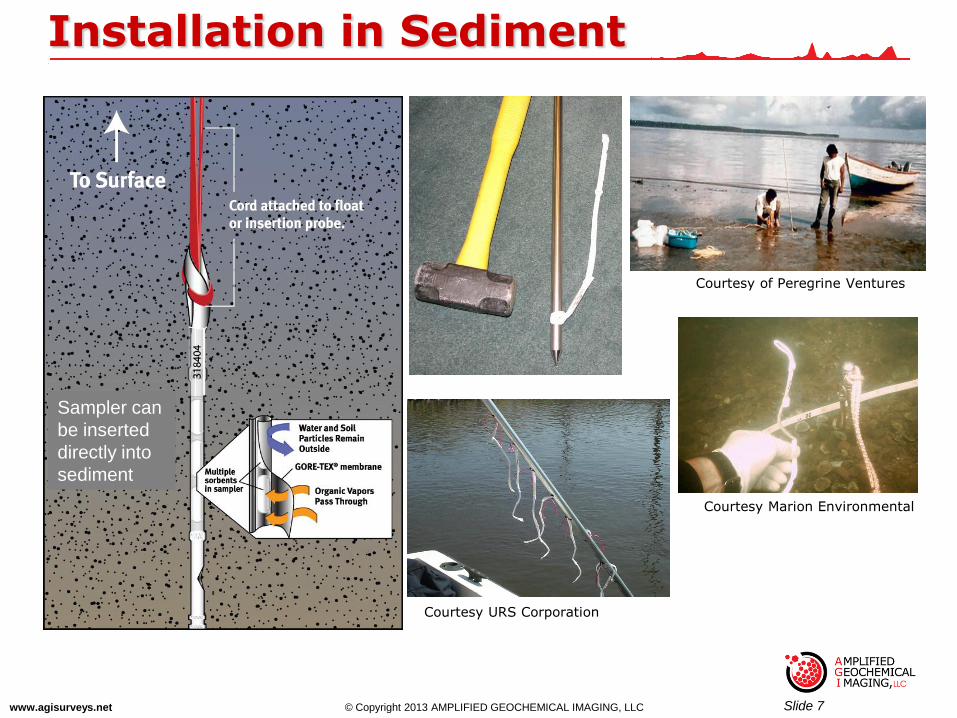
Installation in Sediment
Courtesy of Peregrine Ventures
Sampler can
be inserted
directly into
sediment
Courtesy Marion Environmental
Courtesy URS Corporation
© Copyright 2013 AMPLIFIED GEOCHEMICAL IMAGING, LLC www.agisurveys.net Slide 8
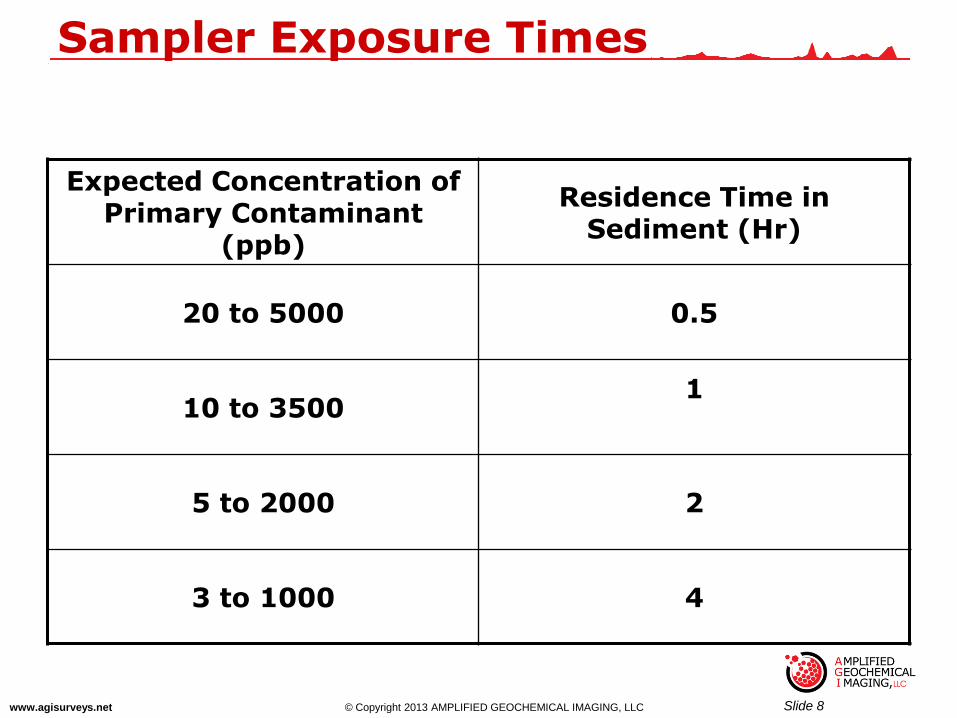
Sampler Exposure Times
Expected Concentration of Primary Contaminant
(ppb)
Residence Time in Sediment (Hr)
20 to 5000 0.5
10 to 3500 1
5 to 2000 2
3 to 1000 4
© Copyright 2013 AMPLIFIED GEOCHEMICAL IMAGING, LLC www.agisurveys.net Slide 9
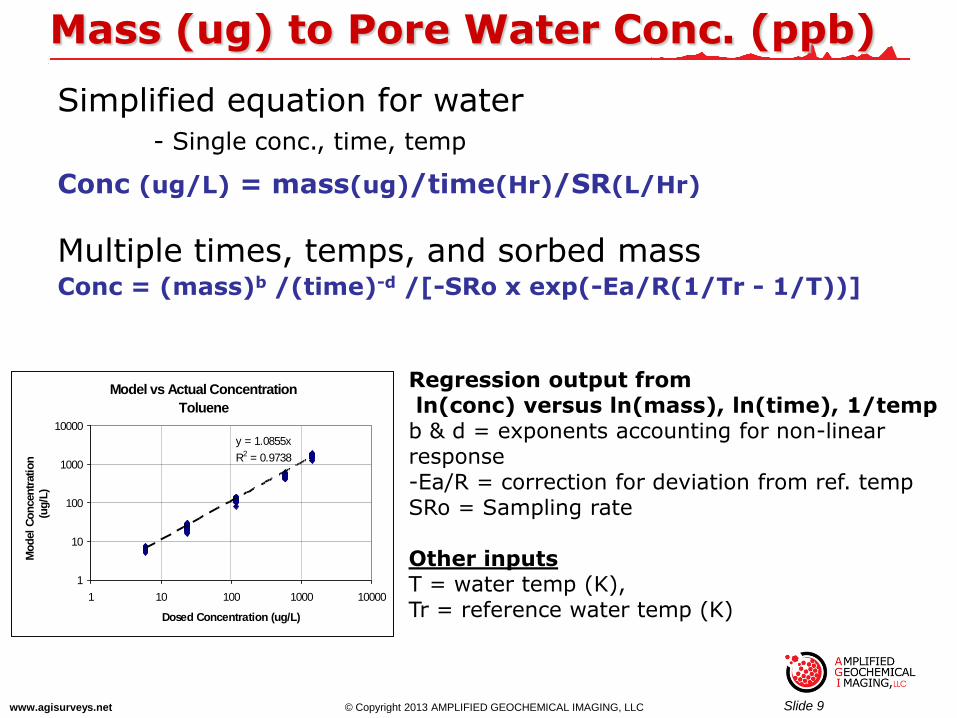
Mass (ug) to Pore Water Conc. (ppb)
Simplified equation for water - Single conc., time, temp
Conc (ug/L) = mass(ug)/time(Hr)/SR(L/Hr)
Model vs Actual Concentration
Toluene
y = 1.0855x
R2 = 0.9738
1
10
100
1000
10000
1 10 100 1000 10000
Dosed Concentration (ug/L)
Mo
del
Co
ncen
trati
on
(ug
/L)
Multiple times, temps, and sorbed mass Conc = (mass)b /(time)-d /[-SRo x exp(-Ea/R(1/Tr - 1/T))]
Regression output from ln(conc) versus ln(mass), ln(time), 1/temp b & d = exponents accounting for non-linear response -Ea/R = correction for deviation from ref. temp SRo = Sampling rate Other inputs T = water temp (K), Tr = reference water temp (K)
© Copyright 2013 AMPLIFIED GEOCHEMICAL IMAGING, LLC www.agisurveys.net Slide 10
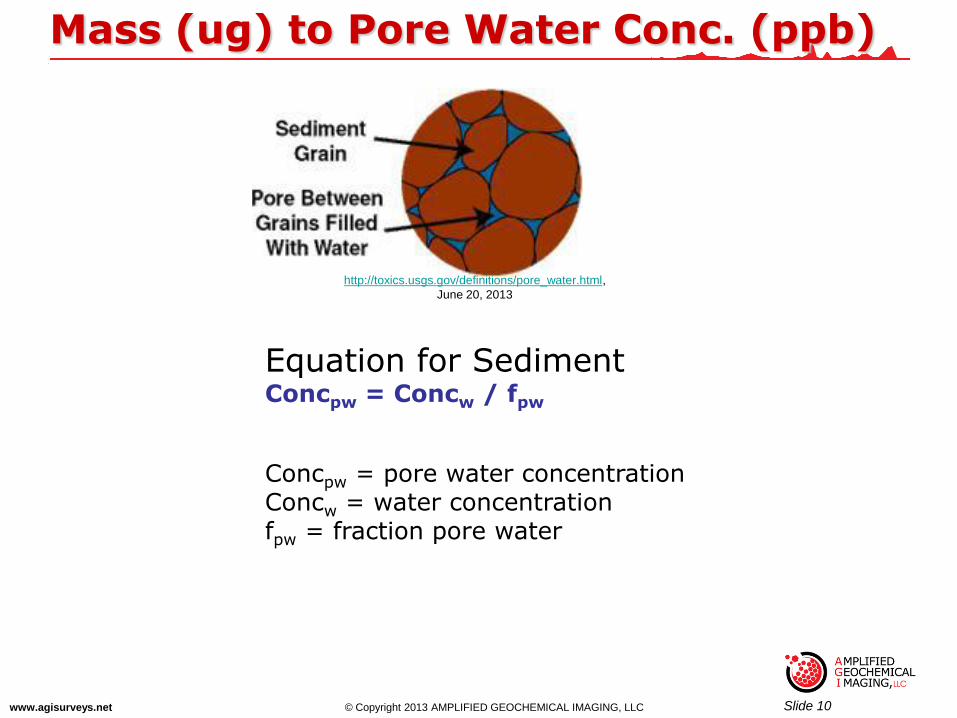
Mass (ug) to Pore Water Conc. (ppb)
http://toxics.usgs.gov/definitions/pore_water.html,
June 20, 2013
Equation for Sediment Concpw = Concw / fpw
Concpw = pore water concentration Concw = water concentration fpw = fraction pore water
© Copyright 2013 AMPLIFIED GEOCHEMICAL IMAGING, LLC www.agisurveys.net Slide 11
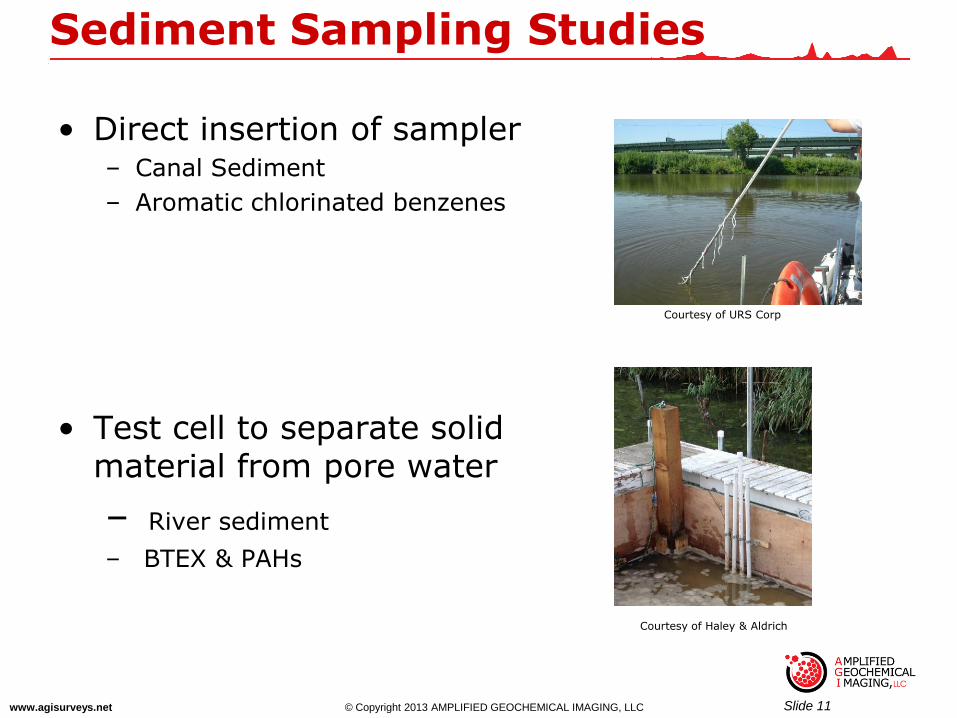
Sediment Sampling Studies
• Direct insertion of sampler – Canal Sediment
– Aromatic chlorinated benzenes
• Test cell to separate solid material from pore water
– River sediment
– BTEX & PAHs
Courtesy of Haley & Aldrich
Courtesy of URS Corp
© Copyright 2013 AMPLIFIED GEOCHEMICAL IMAGING, LLC www.agisurveys.net Slide 12
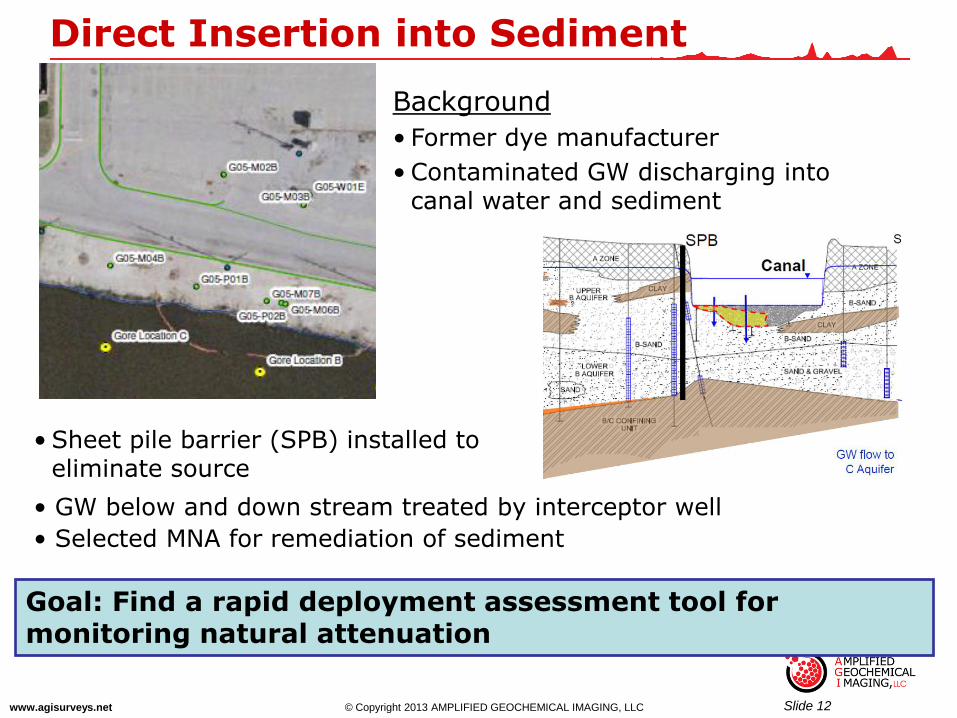
Direct Insertion into Sediment
Background
• Former dye manufacturer
• Contaminated GW discharging into canal water and sediment
Goal: Find a rapid deployment assessment tool for monitoring natural attenuation
• Sheet pile barrier (SPB) installed to eliminate source
• GW below and down stream treated by interceptor well
• Selected MNA for remediation of sediment

© Copyright 2013 AMPLIFIED GEOCHEMICAL IMAGING, LLC www.agisurveys.net Slide 13
• Focus on 2 sampling locations: B, C
- Field Duplicates BB, CC
• PPWS placed above sediment and
every 3 to 4 inches - Quick & Simple installation
- 5 to 60min exposure
• Comparison with Peepers
- Exposure over several days to weeks
- Sampling not done concurrently
Canal Sediment Sampling
PPWS = passive pore water sampler (AGI Sampler)
© Copyright 2013 AMPLIFIED GEOCHEMICAL IMAGING, LLC www.agisurveys.net Slide 14
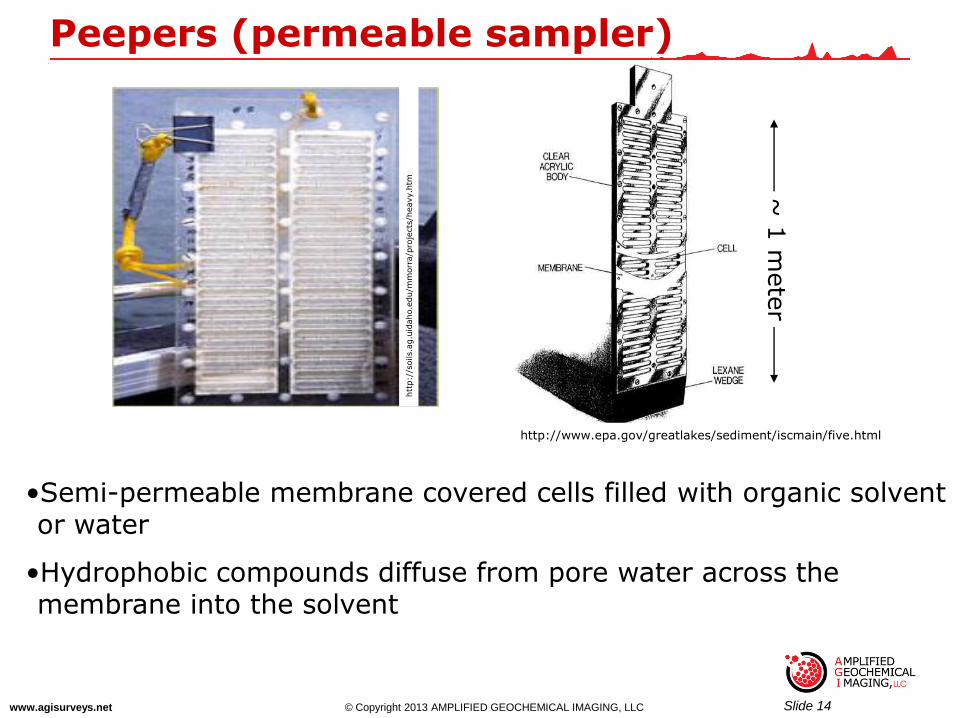
Peepers (permeable sampler)
htt
p:/
/soils.a
g.u
idaho.e
du/m
morr
a/p
roje
cts
/heavy.h
tm
•Semi-permeable membrane covered cells filled with organic solvent or water
•Hydrophobic compounds diffuse from pore water across the membrane into the solvent
http://www.epa.gov/greatlakes/sediment/iscmain/five.html
~ 1
mete
r
© Copyright 2013 AMPLIFIED GEOCHEMICAL IMAGING, LLC www.agisurveys.net Slide 15
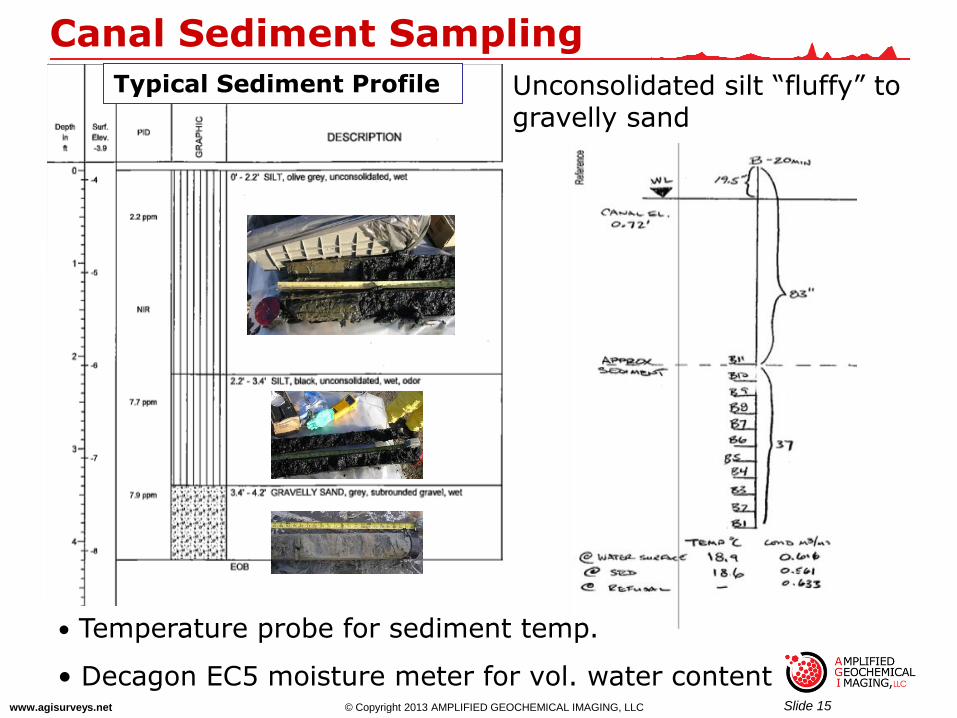
Unconsolidated silt “fluffy” to gravelly sand
• Temperature probe for sediment temp.
• Decagon EC5 moisture meter for vol. water content
Canal Sediment Sampling
Typical Sediment Profile
© Copyright 2013 AMPLIFIED GEOCHEMICAL IMAGING, LLC www.agisurveys.net Slide 16
Canal Sediment Sampling
0 2000 4000 6000 8000 10000 12000 14000
Pore Water Concentration, ug/L
-38
-34
-30
-26
-22
-18
-14
-10
-6
-2
2
De
pth
fro
m S
ed
ime
nt
Su
rfa
ce
, in
ch
es
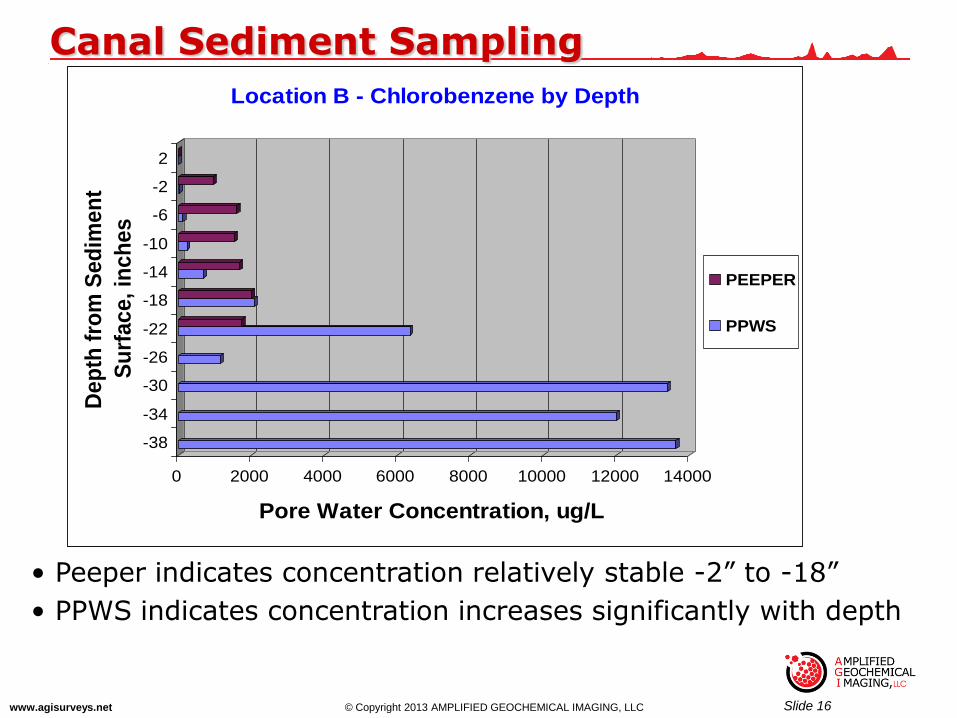
Location B - Chlorobenzene by Depth
PEEPER
PPWS
• Peeper indicates concentration relatively stable -2” to -18”
• PPWS indicates concentration increases significantly with depth
© Copyright 2013 AMPLIFIED GEOCHEMICAL IMAGING, LLC www.agisurveys.net Slide 17
Canal Sediment Sampling
0 2000 4000 6000 8000 10000 12000 14000
Pore Water Concentration, ug/L
2
-34
-26
-18
-10
-2
De
pth
fro
m S
ed
ime
nt
Su
rfa
ce
, in
ch
es
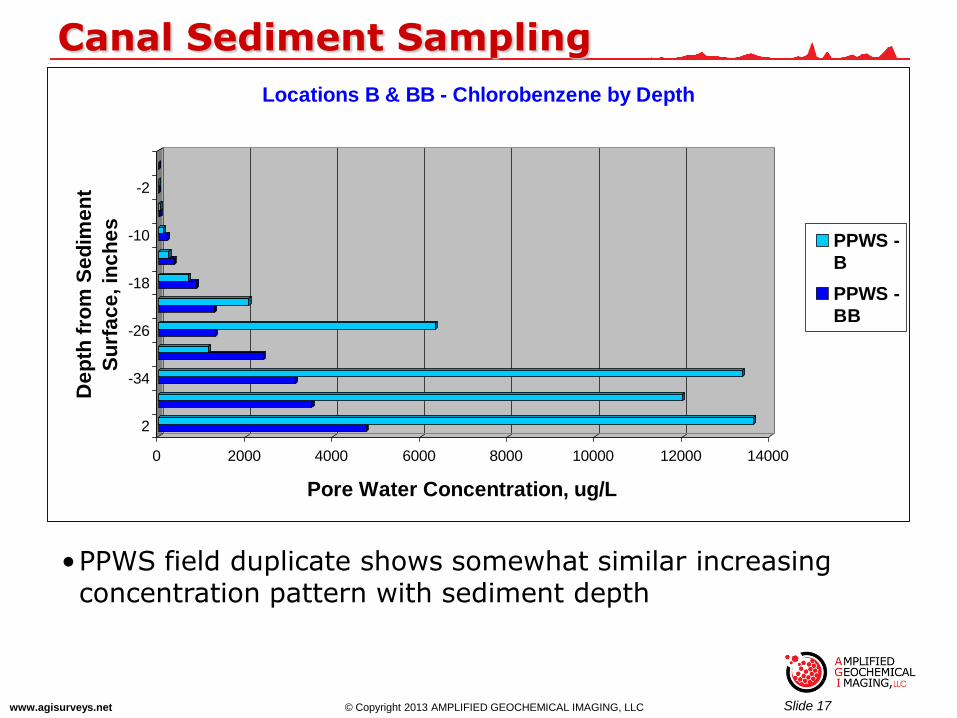
Locations B & BB - Chlorobenzene by Depth
PPWS -
B
PPWS -
BB
•PPWS field duplicate shows somewhat similar increasing concentration pattern with sediment depth
© Copyright 2013 AMPLIFIED GEOCHEMICAL IMAGING, LLC www.agisurveys.net Slide 18
Canal Sediment Sampling
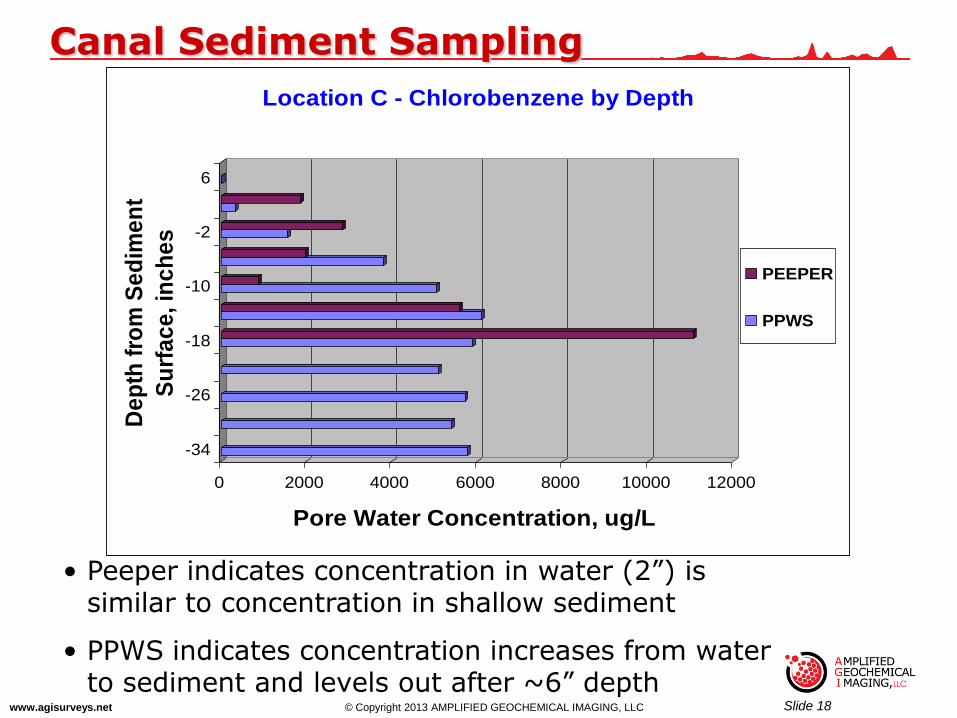
• Peeper indicates concentration in water (2”) is similar to concentration in shallow sediment
• PPWS indicates concentration increases from water to sediment and levels out after ~6” depth
0 2000 4000 6000 8000 10000 12000
Pore Water Concentration, ug/L
-34
-26
-18
-10
-2
6
De
pth
fro
m S
ed
ime
nt
Su
rfa
ce
, in
ch
es
Location C - Chlorobenzene by Depth
PEEPER
PPWS
© Copyright 2013 AMPLIFIED GEOCHEMICAL IMAGING, LLC www.agisurveys.net Slide 19
Canal Sediment Sampling
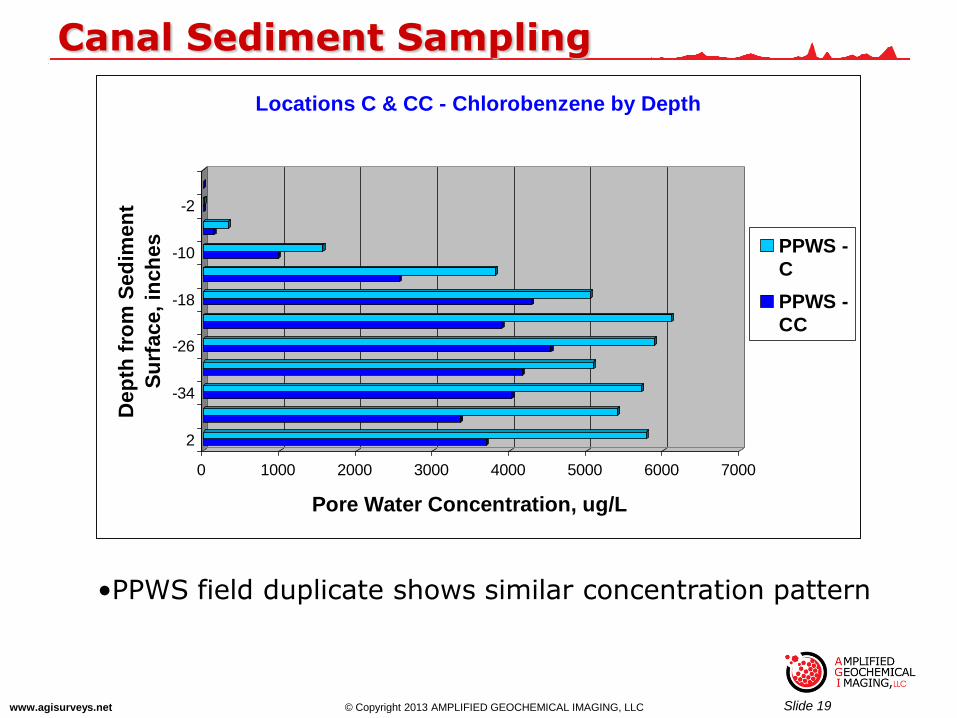
•PPWS field duplicate shows similar concentration pattern
0 1000 2000 3000 4000 5000 6000 7000
Pore Water Concentration, ug/L
2
-34
-26
-18
-10
-2
Dep
th f
rom
Sed
imen
t
Su
rface, in
ch
es
Locations C & CC - Chlorobenzene by Depth
PPWS -
C
PPWS -
CC
© Copyright 2013 AMPLIFIED GEOCHEMICAL IMAGING, LLC www.agisurveys.net Slide 20
Study Observations
• Quick and simple sampling
• Comparison to Peepers
– Lower overall cost
– Somewhat similar values at higher concentrations
– PPWS shows greater variation in pore water concentrations
• Sediment profile consistent between PPWS field dups
Canal Sediment Sampling
© Copyright 2013 AMPLIFIED GEOCHEMICAL IMAGING, LLC www.agisurveys.net Slide 21
Test Cell Sampling Background
• Former MGP site
• COCs detected in river sediments – VOCs and PAHs
• GW and soil remediation addressing source completed
• Sediment remediation planned
- Excavation and permeable cap placement
• Pilot scale reactive cap test cell constructed
• Problem: Micro-wells tend to clog due to matrix
Goals: 1. Design sampling system that won’t clog during testing/
monitoring
2. Sampling must be able to demonstrate efficacy of capping • results must be similar to Micro-well at target
concentrations
© Copyright 2013 AMPLIFIED GEOCHEMICAL IMAGING, LLC www.agisurveys.net Slide 22
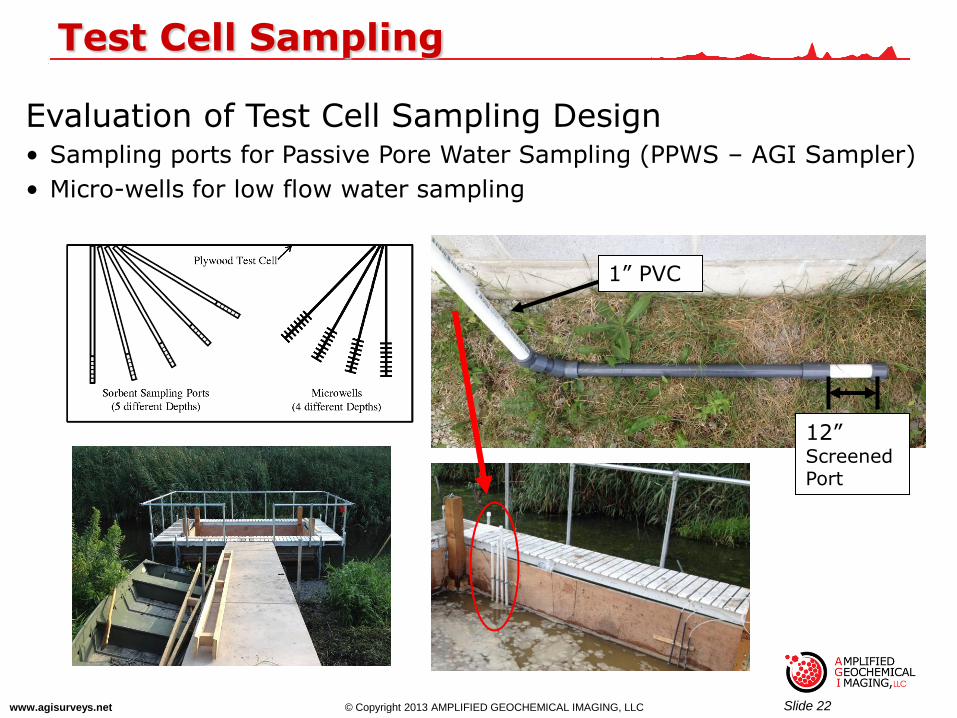
Test Cell Sampling
Evaluation of Test Cell Sampling Design • Sampling ports for Passive Pore Water Sampling (PPWS – AGI Sampler)
• Micro-wells for low flow water sampling
12” Screened Port
1” PVC
© Copyright 2013 AMPLIFIED GEOCHEMICAL IMAGING, LLC www.agisurveys.net Slide 23
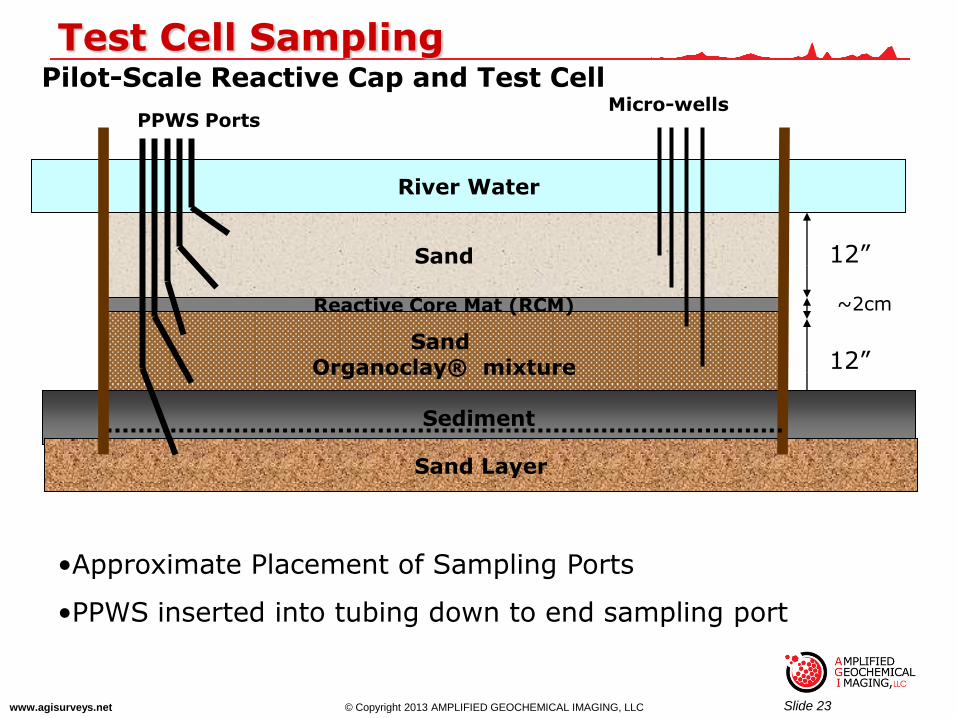
Test Cell Sampling
PPWS Ports
Pilot-Scale Reactive Cap and Test Cell Micro-wells
River Water
Sand Organoclay® mixture
Reactive Core Mat (RCM)
Sand 12”
~2cm
12”
Sediment
Sand Layer
•Approximate Placement of Sampling Ports
•PPWS inserted into tubing down to end sampling port
© Copyright 2013 AMPLIFIED GEOCHEMICAL IMAGING, LLC www.agisurveys.net Slide 24
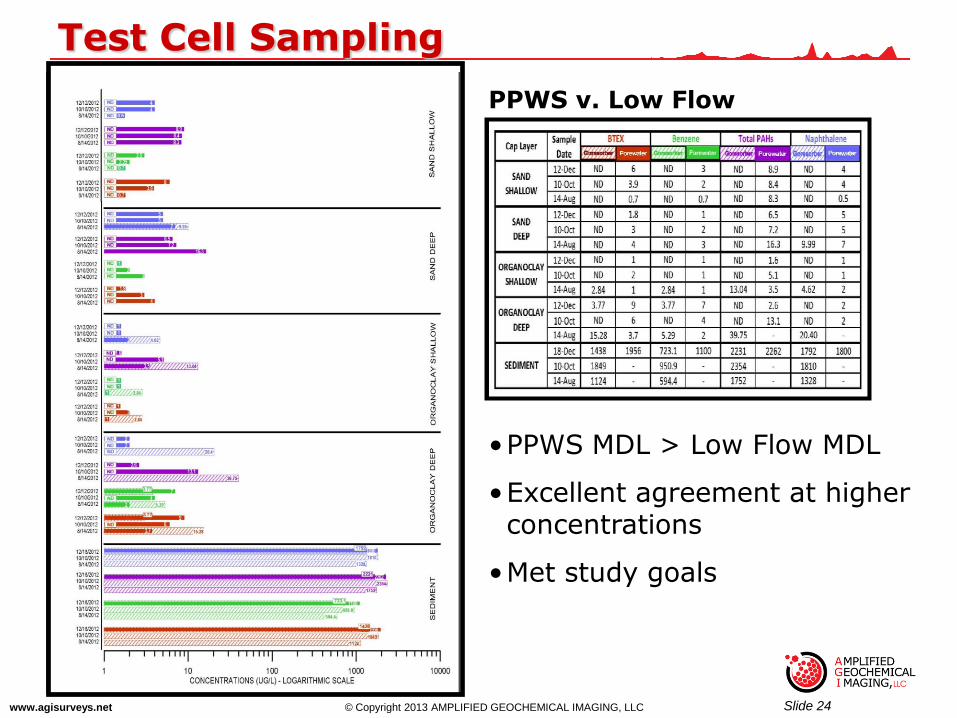
Test Cell Sampling
PPWS v. Low Flow
•PPWS MDL > Low Flow MDL
•Excellent agreement at higher concentrations
•Met study goals

© Copyright 2013 AMPLIFIED GEOCHEMICAL IMAGING, LLC www.agisurveys.net Slide 25
Test Cell Sampling
Test Conclusion:
•Passive Pore Water Sampling Design capable of being used to sample pore water in test cell
•PPWS able to show differences in test cell zones
•Analytical results compare well at target
concentrations
-Comparison suitable for project DQOs
-Lower concentrations differ due to differences in MDLs
-PPWS Analysis MDL> Water method MDL
© Copyright 2013 AMPLIFIED GEOCHEMICAL IMAGING, LLC www.agisurveys.net Slide 26
• Flexible applications
• Acceptable agreement with Peepers and Micro-well data
• Quick, simple, accurate, and cost effective solution
• Passive Pore Water Sampling attractive alternative to other sediment pore-water techniques
Conclusions