partners environmental consulting, inc.epa.ohio.gov/portals/30/sabr/docs/a_training/innovative...
TRANSCRIPT

Innovative Remediation
Technique(s) at VAP Site(s)
Partners Environmental Consulting, Inc.

INTRODUCTION
Partners Environmental Consulting, Inc.
Combined Remedial Approach to CVOC Impacted Soil and Groundwater
6551 Grant Avenue
(aka Former Sunar Hauserman)
John T. Garvey, CP-118, PG, CPG
October 7, 2013
Partners Environmental Consulting, Inc.
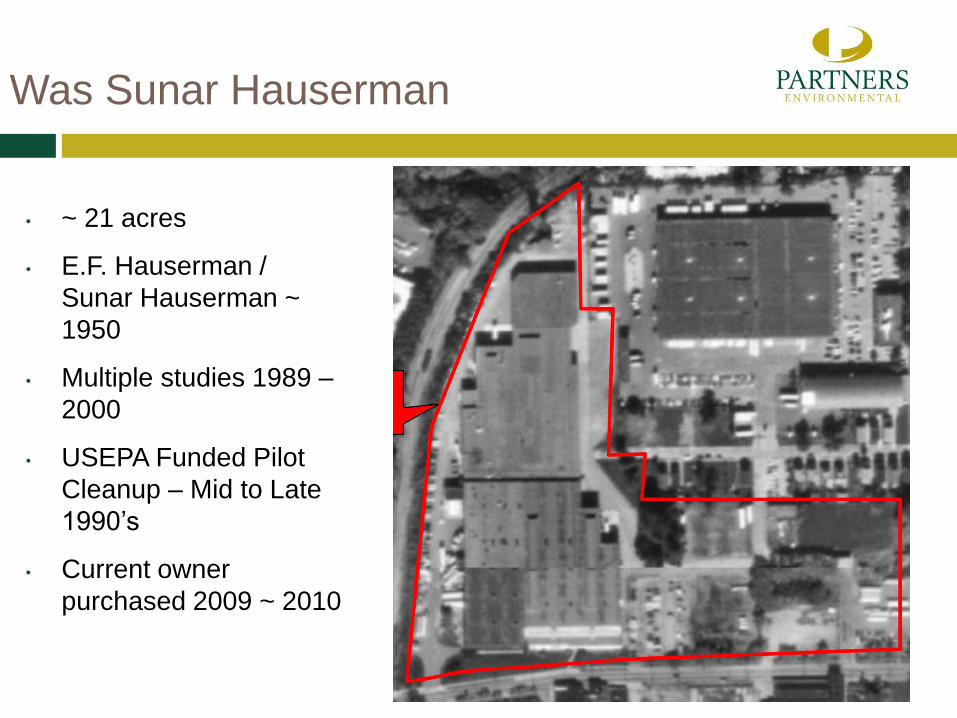
Was Sunar Hauserman
• ~ 21 acres
• E.F. Hauserman /
Sunar Hauserman ~
1950
• Multiple studies 1989 –
2000
• USEPA Funded Pilot
Cleanup – Mid to Late
1990’s
• Current owner
purchased 2009 ~ 2010
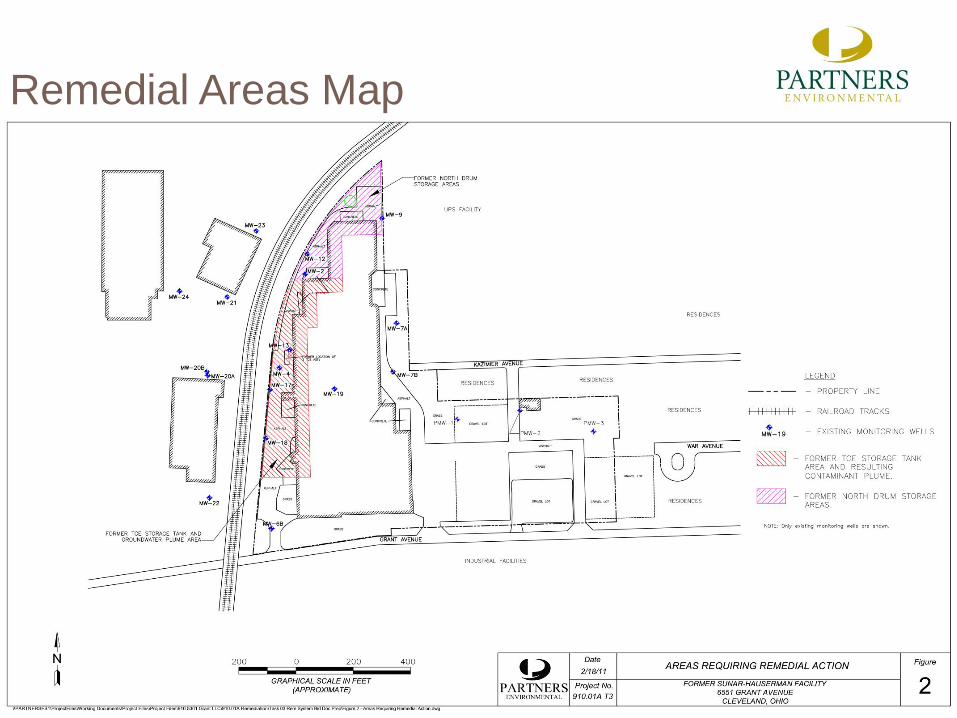
Remedial Areas Map
GROUNDWATER & ENVIRONMENTAL SERVICES,INC.
Reductive Remediation: Primer and Case Study
Kevin Michael Lienau, PE
Steve Betts
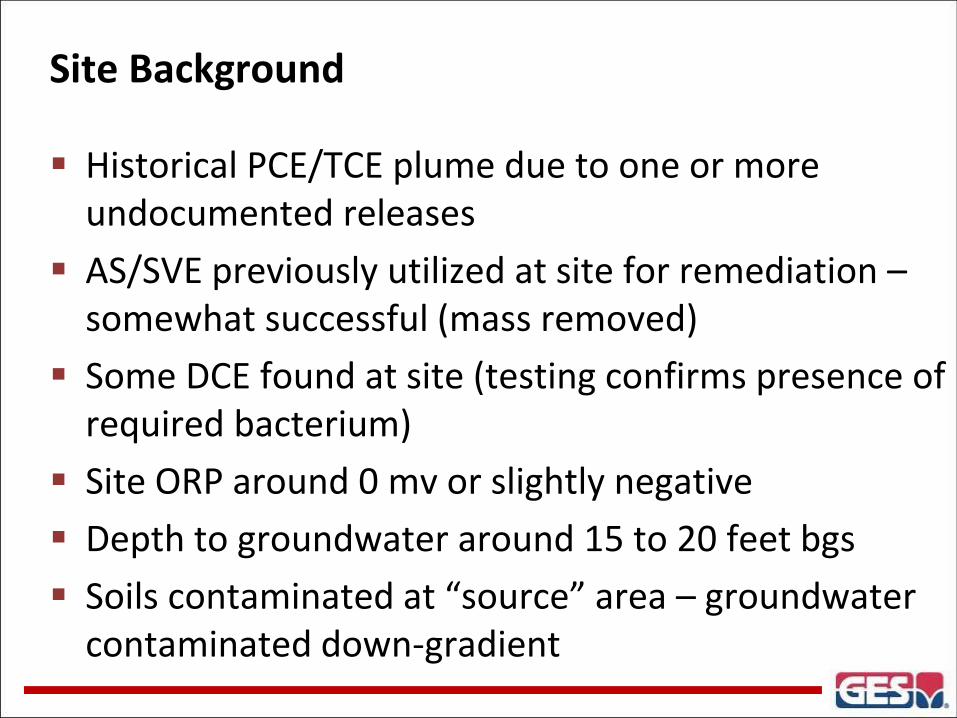
Site Background
Historical PCE/TCE plume due to one or more undocumented releases
AS/SVE previously utilized at site for remediation – somewhat successful (mass removed)
Some DCE found at site (testing confirms presence of required bacterium)
Site ORP around 0 mv or slightly negative
Depth to groundwater around 15 to 20 feet bgs
Soils contaminated at “source” area – groundwater contaminated down-gradient
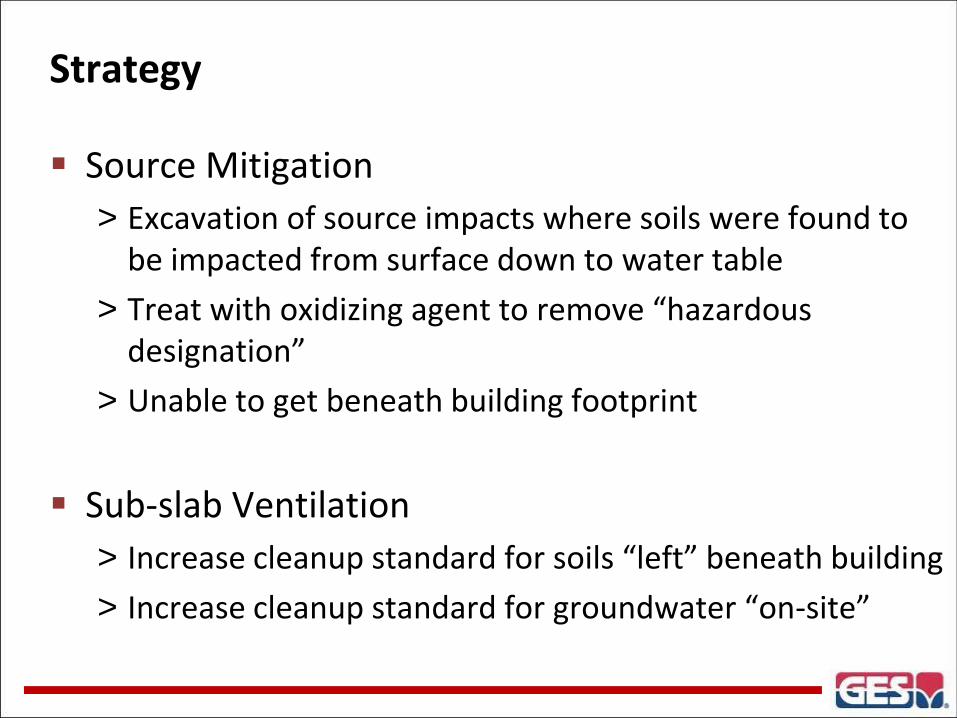
Strategy
Source Mitigation
> Excavation of source impacts where soils were found to be impacted from surface down to water table
> Treat with oxidizing agent to remove “hazardous designation”
> Unable to get beneath building footprint
Sub-slab Ventilation
> Increase cleanup standard for soils “left” beneath building
> Increase cleanup standard for groundwater “on-site”
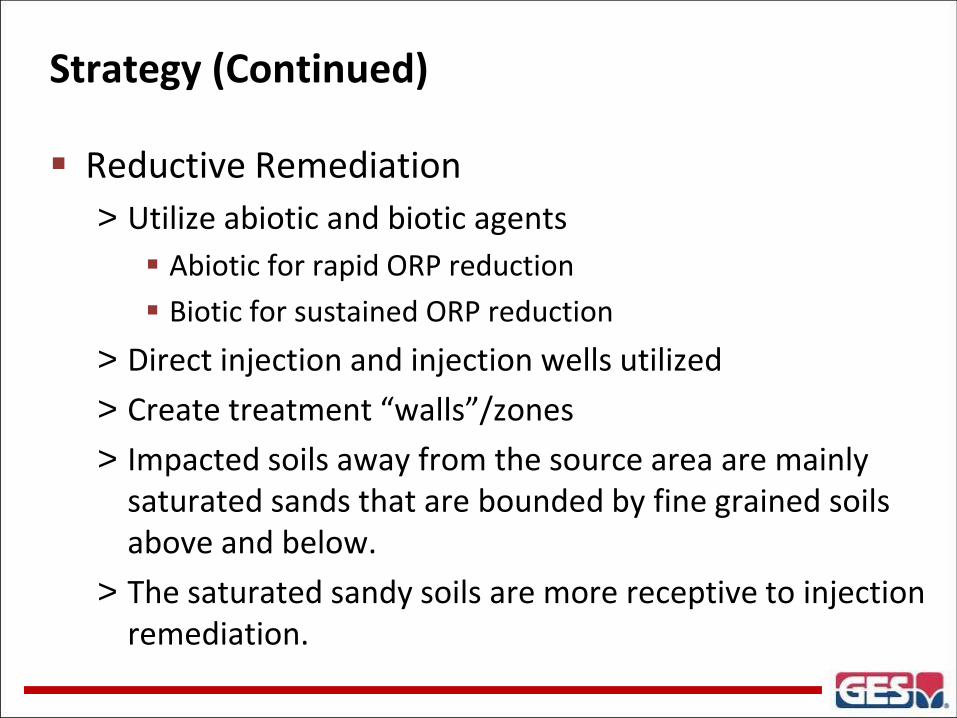
Strategy (Continued)
Reductive Remediation
> Utilize abiotic and biotic agents
Abiotic for rapid ORP reduction
Biotic for sustained ORP reduction
> Direct injection and injection wells utilized
> Create treatment “walls”/zones
> Impacted soils away from the source area are mainly saturated sands that are bounded by fine grained soils above and below.
> The saturated sandy soils are more receptive to injection remediation.
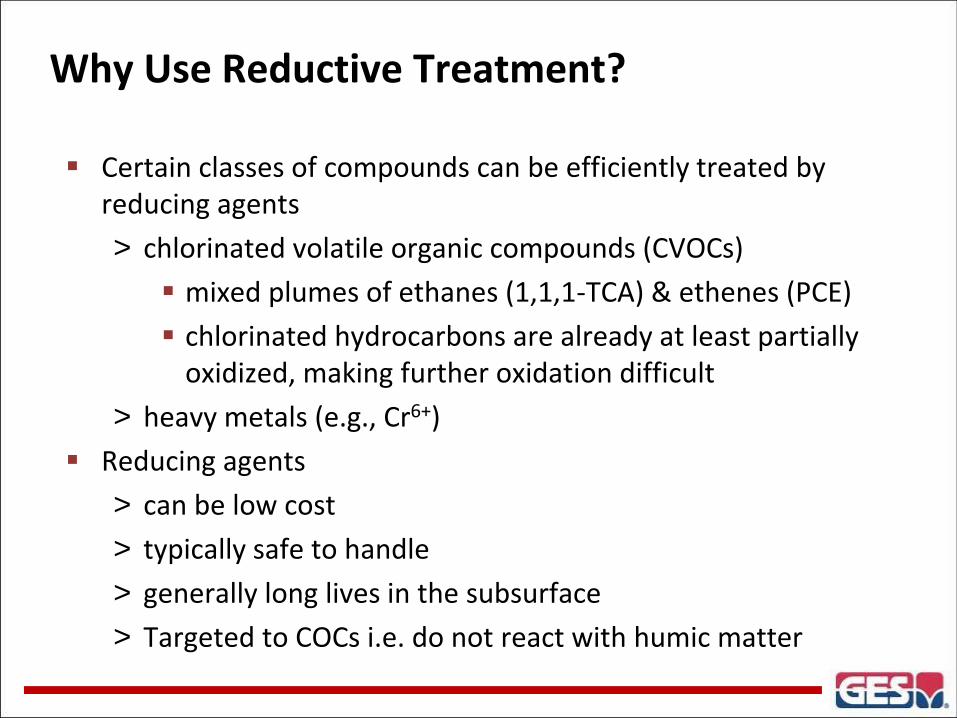
Why Use Reductive Treatment?
Certain classes of compounds can be efficiently treated by reducing agents
> chlorinated volatile organic compounds (CVOCs)
mixed plumes of ethanes (1,1,1-TCA) & ethenes (PCE)
chlorinated hydrocarbons are already at least partially oxidized, making further oxidation difficult
> heavy metals (e.g., Cr6+)
Reducing agents
> can be low cost
> typically safe to handle
> generally long lives in the subsurface
> Targeted to COCs i.e. do not react with humic matter
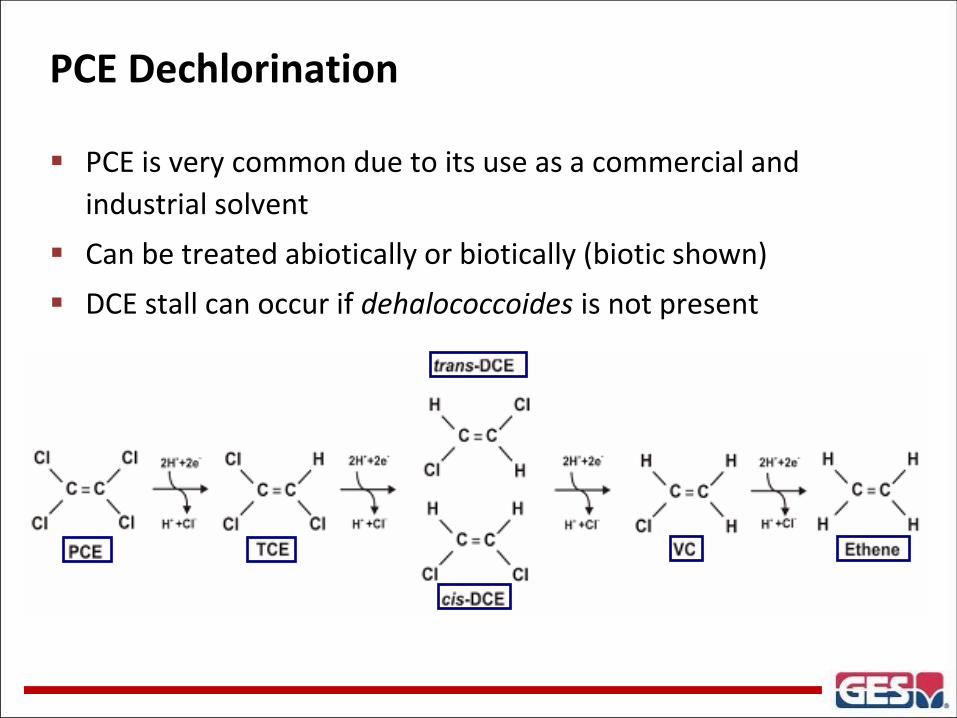
PCE Dechlorination
PCE is very common due to its use as a commercial and
industrial solvent
Can be treated abiotically or biotically (biotic shown)
DCE stall can occur if dehalococcoides is not present
Abiotic Reduction
Occurs by chemical reaction
Intermediaries may not be as well defined and stable as biotic
Typically reduces ORP faster than microbes
Can be used in conjunction with organic reducing agents
Ideal ORP < -400 mV
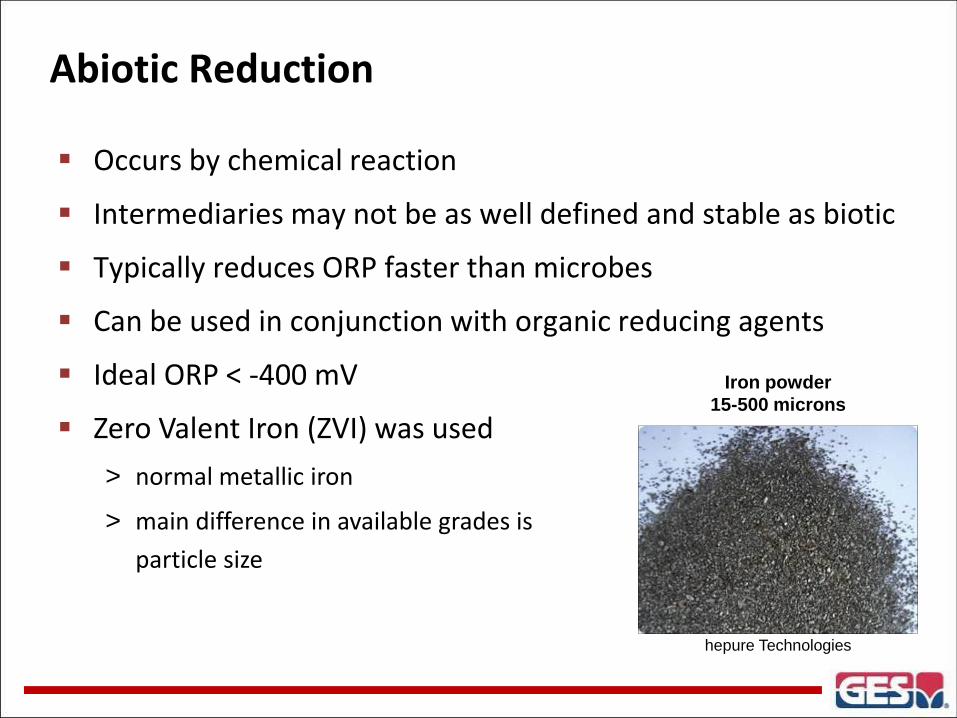
Zero Valent Iron (ZVI) was used
> normal metallic iron
> main difference in available grades is
particle size
Iron powder
15-500 microns
hepure Technologies
Biotic Reduction
Occurs at highly-reducing conditions
Aerobic and anaerobic bacteria present at most sites
Aerobes initially use reducing agent (food) and oxygen and quickly lower the ORP
Anaerobes continue to lower the ORP to -400 mv or lower using sulfate, nitrate, iron as electron acceptors
Dehalococcoides needed in some cases
If designer dehalogenating bacteria are introduced, ORP must already be low (bioaugmentation)
Nutrients and pH often require adjustment
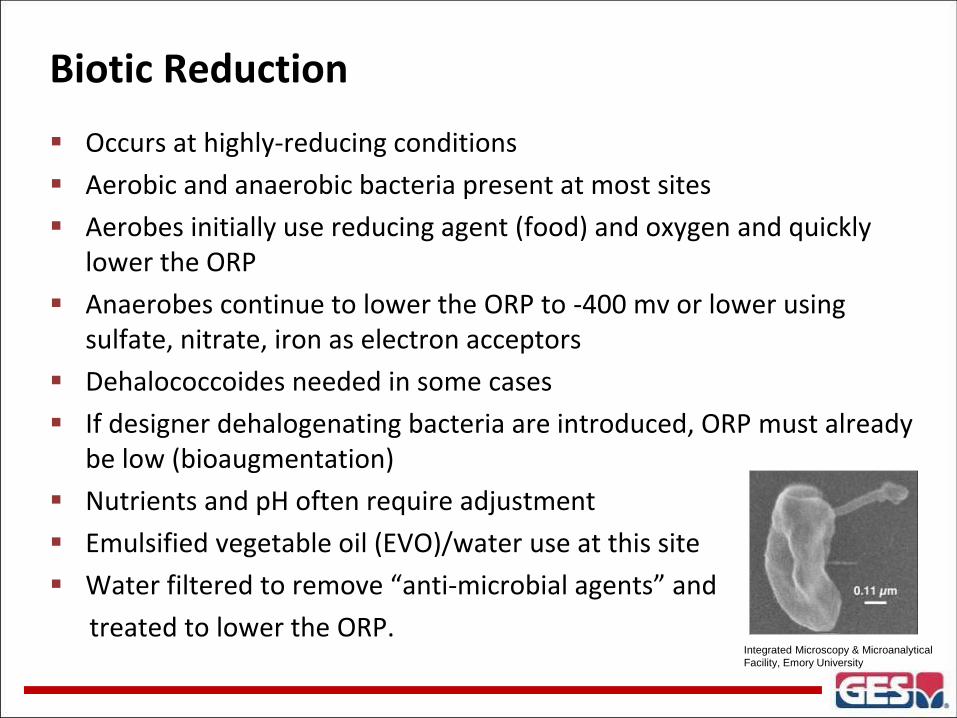
Emulsified vegetable oil (EVO)/water use at this site
Water filtered to remove “anti-microbial agents” and
treated to lower the ORP. Integrated Microscopy & Microanalytical
Facility, Emory University
Reducing Agent Application at Site
Injection Activities
> Injection permits obtained
> 14 injection wells and 94 direct push points
> Different EVO / ZVI / Water mixtures injected locations across site
> Injected over 10 day period (first injection)
> Subsequent 3 day injection (second injection)
> Subsequent 2 day injection (third injection)
> Subsequent 3 day injection (fourth injection)
> Total of 681 gallons of ZVI and 5,750 gallons of EVO injected
Supplemental Activities
> ORP and chemical concentrations monitored post-injections
> Quarterly groundwater monitoring
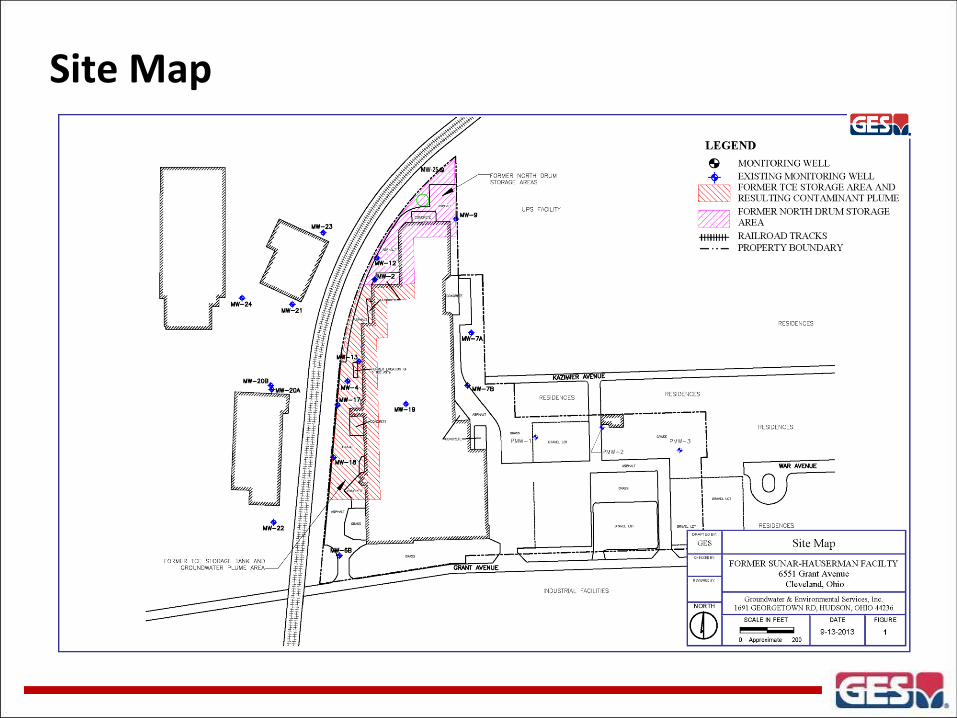
Site Map
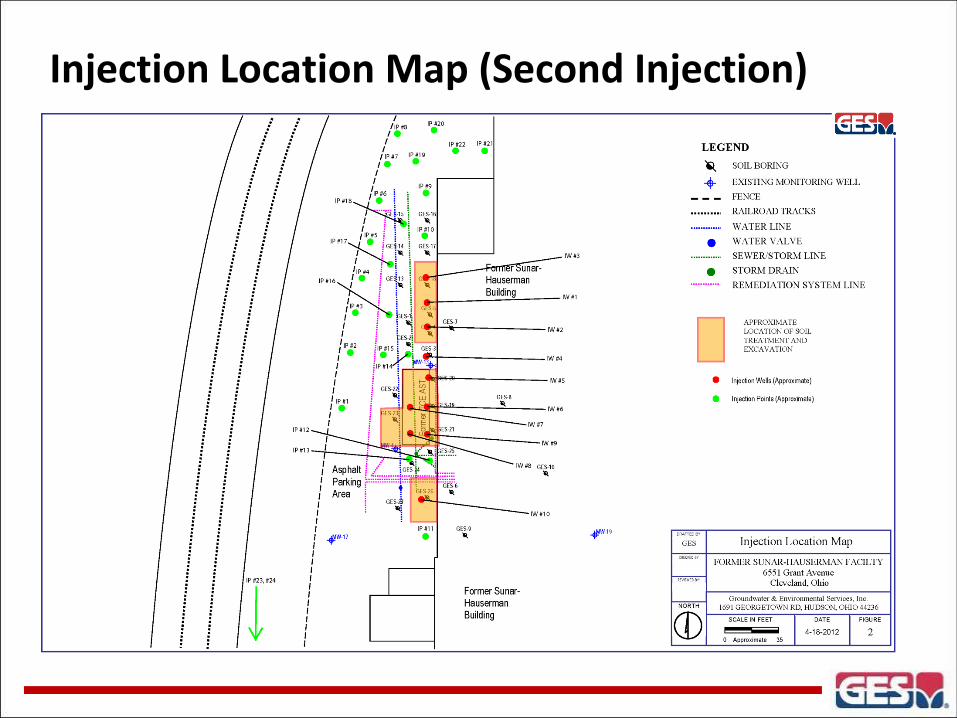
Injection Location Map (Second Injection)
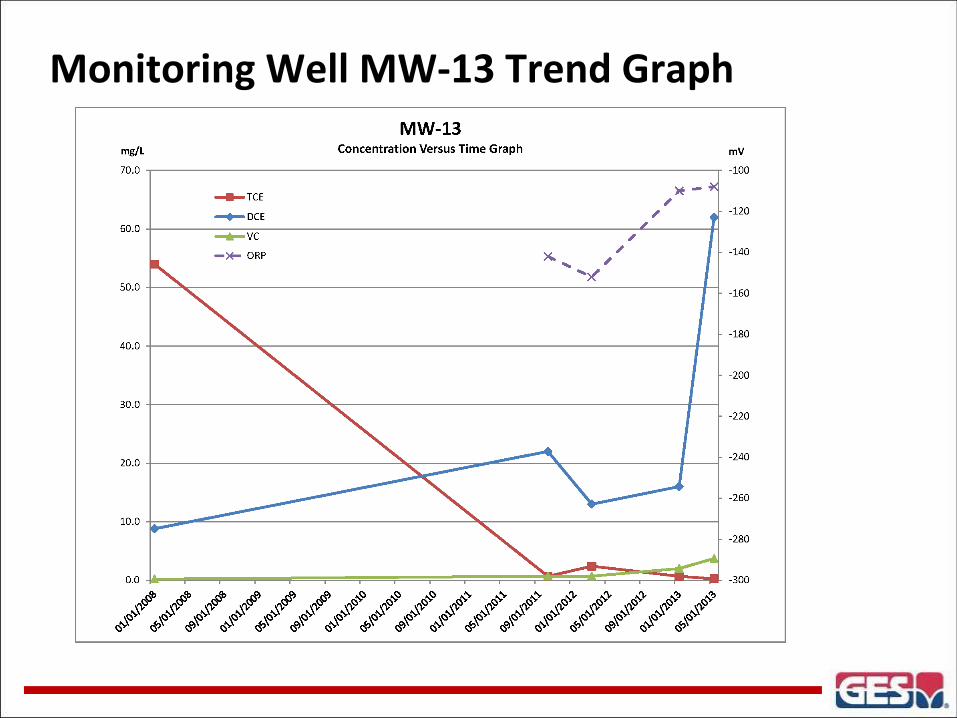
Monitoring Well MW-13 Trend Graph
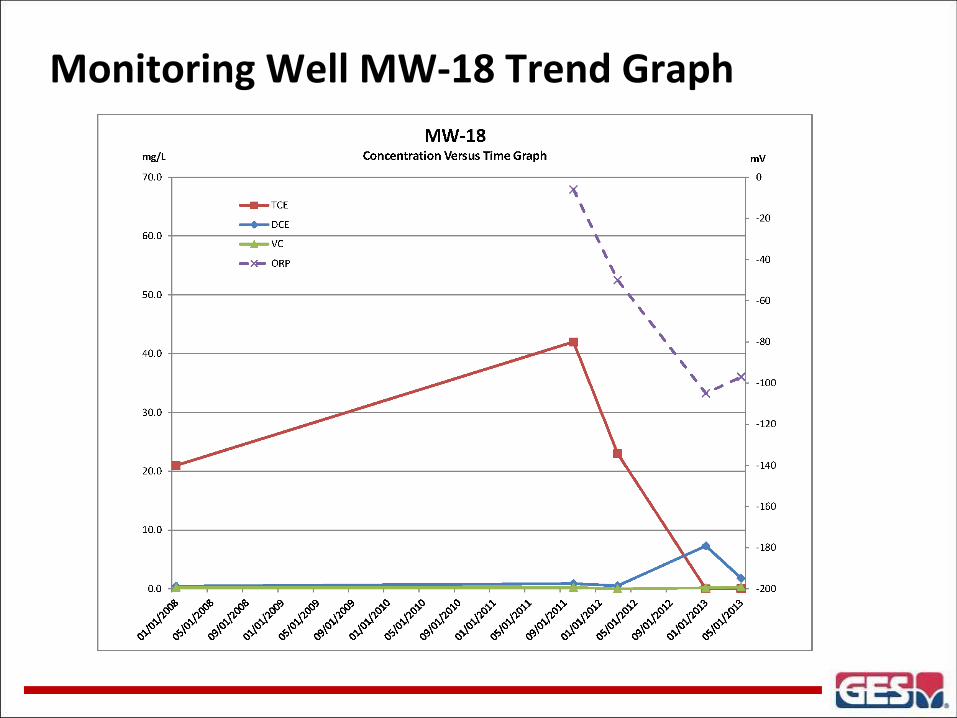
Monitoring Well MW-18 Trend Graph
“Insert” then choose “Picture” – select your picture.
Right click your picture and “Send to back”.
The world’s leading sustainability consultancy
Innovative Remediation Techniques at VAP Sites – October 7, 2013
The world’s leading sustainability consultancy
“Insert” then choose “Picture” – select your picture.
Right click your picture and “Send to back”.
The world’s leading sustainability consultancy
Innovative Remediation Techniques at VAP Sites – October 7, 2013
The world’s leading sustainability consultancy
The world’s leading sustainability consultancy
Contents
What’s this layout for?
Formatting for contents slide –
this slide has slightly different
spacing between lines to
emphasise topics
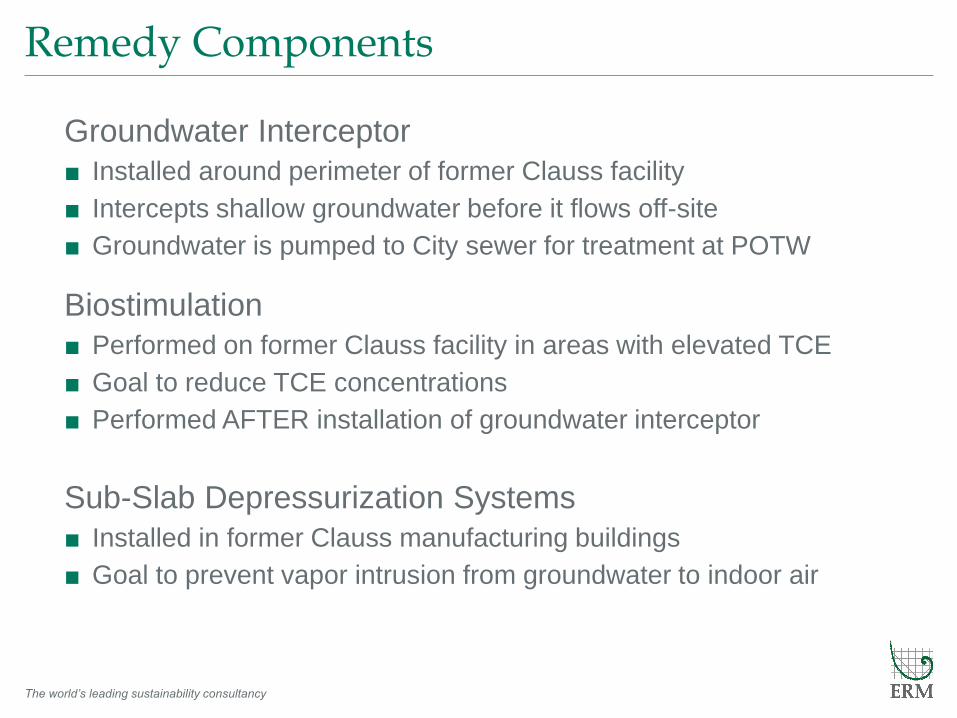
Remedy Components
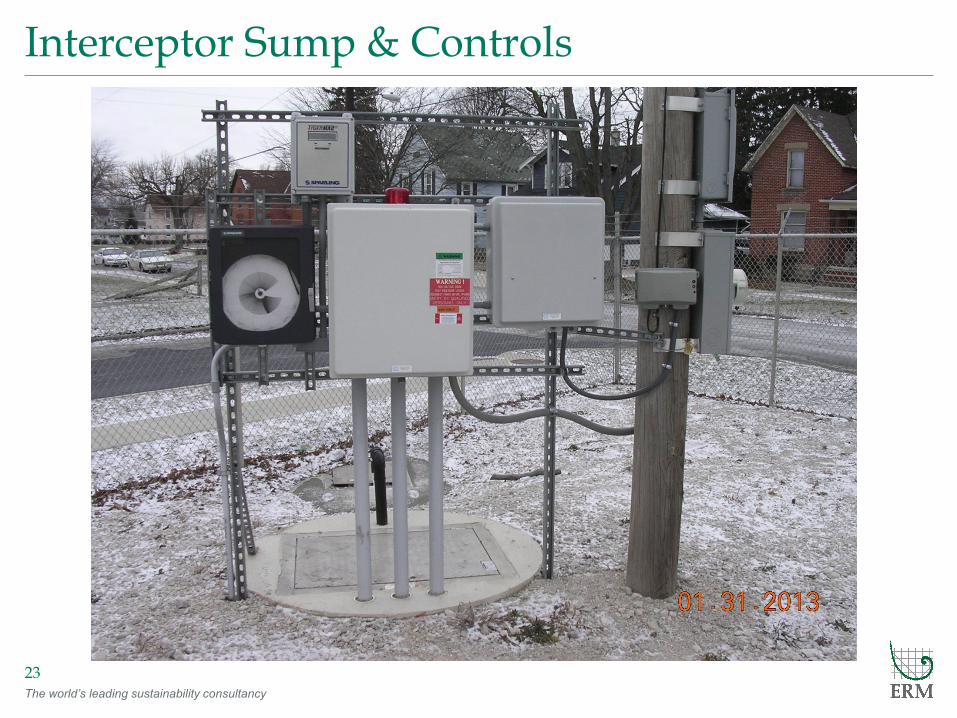
Groundwater Interceptor
■ Installed around perimeter of former Clauss facility
■ Intercepts shallow groundwater before it flows off-site
■ Groundwater is pumped to City sewer for treatment at POTW
Biostimulation
■ Performed on former Clauss facility in areas with elevated TCE
■ Goal to reduce TCE concentrations
■ Performed AFTER installation of groundwater interceptor
Sub-Slab Depressurization Systems
■ Installed in former Clauss manufacturing buildings
■ Goal to prevent vapor intrusion from groundwater to indoor air
The world’s leading sustainability consultancy
Contents
What’s this layout for?
Formatting for contents slide –
this slide has slightly different
spacing between lines to
emphasise topics
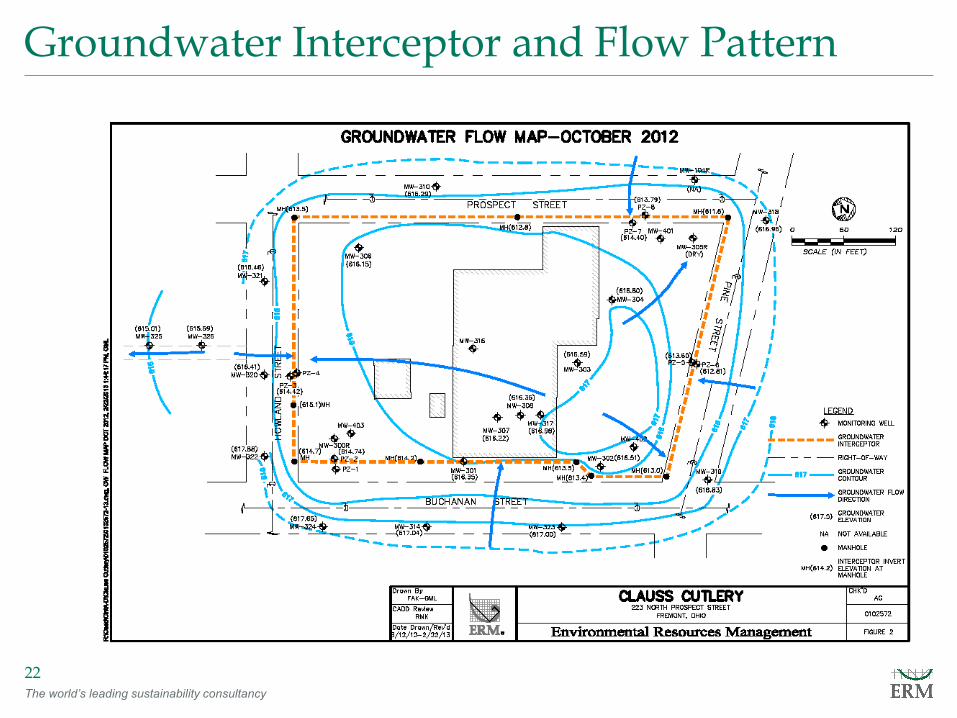
Groundwater Interceptor and Flow Pattern
22
The world’s leading sustainability consultancy
Contents
What’s this layout for?
Formatting for contents slide –
this slide has slightly different
spacing between lines to
emphasise topics
Interceptor Sump & Controls
23
The world’s leading sustainability consultancy
Contents
What’s this layout for?
Formatting for contents slide –
this slide has slightly different
spacing between lines to
emphasise topics
Biostimulation Overview
24
• Prepared workplan for pilot test/obtained Class V
remediation well authorization/conducted pilot test
• Prepared workplan for biostimulation/Class V remediation
well authorization/surveyed well locations/obtained
• Prepared bid specs/City bid the biostimulation work
• Contractor installed injection wells/obtained materials and
equipment/injected dilute soybean oil in each well
• Submitted biostimulation injection report to Ohio EPA after
completion of all injection work
• Closed the injection wells in accordance with the OAC
The world’s leading sustainability consultancy
Contents
What’s this layout for?
Formatting for contents slide –
this slide has slightly different
spacing between lines to
emphasise topics
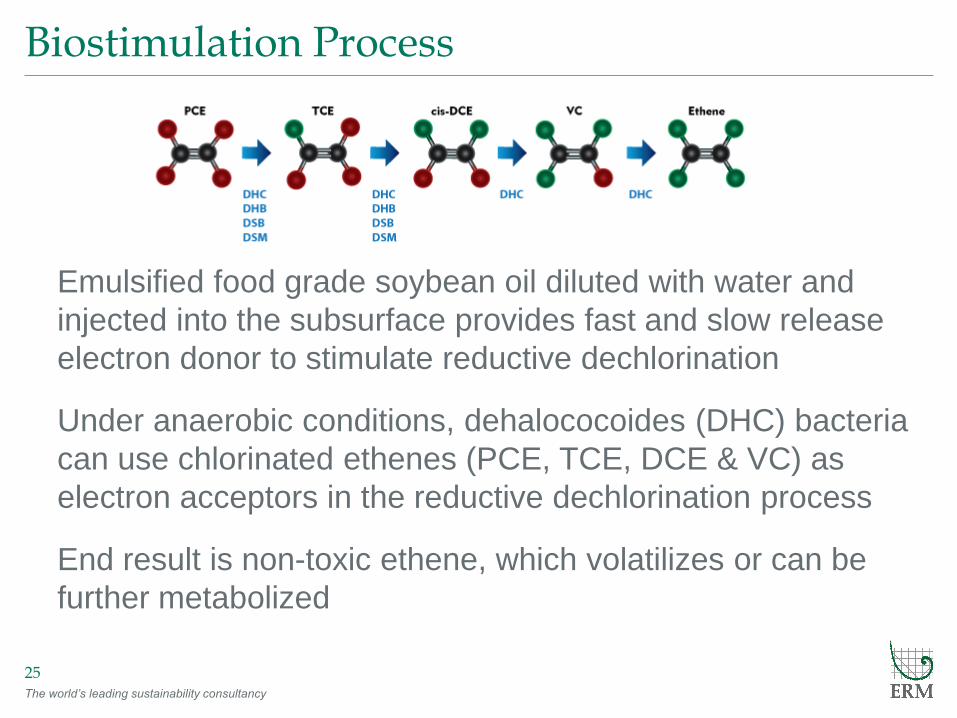
Biostimulation Process
25
Emulsified food grade soybean oil diluted with water and
injected into the subsurface provides fast and slow release
electron donor to stimulate reductive dechlorination
Under anaerobic conditions, dehalococoides (DHC) bacteria
can use chlorinated ethenes (PCE, TCE, DCE & VC) as
electron acceptors in the reductive dechlorination process
End result is non-toxic ethene, which volatilizes or can be
further metabolized
The world’s leading sustainability consultancy
Contents
What’s this layout for?
Formatting for contents slide –
this slide has slightly different
spacing between lines to
emphasise topics
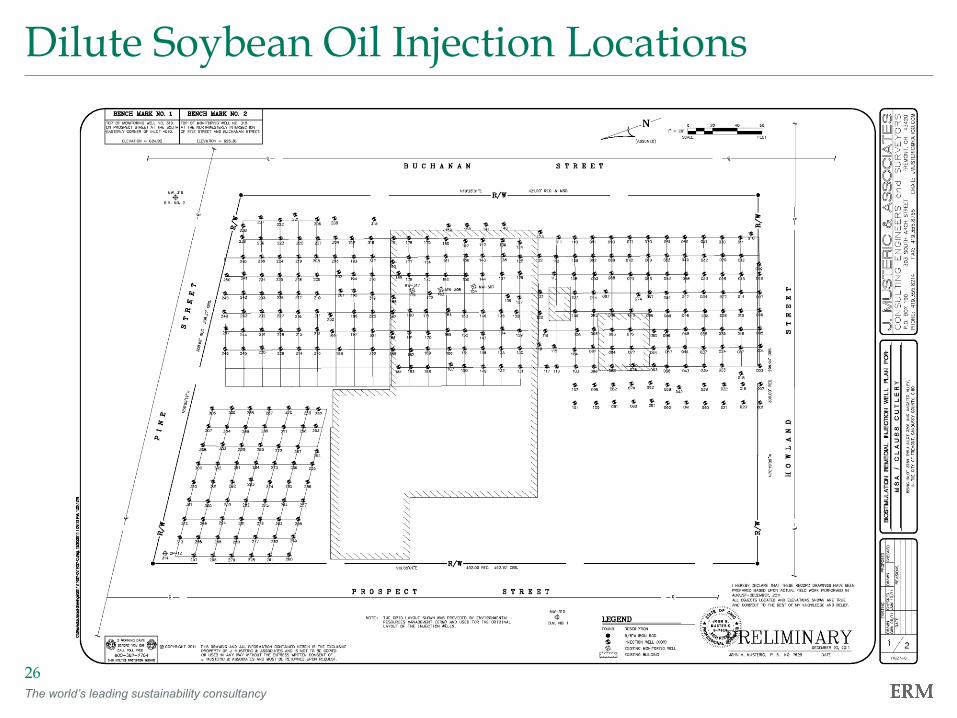
Dilute Soybean Oil Injection Locations
26
The world’s leading sustainability consultancy
Graphics
What’s this layout for?
Plain slide without a text box –
used for inserting graphics e.g.
pies, bars or images
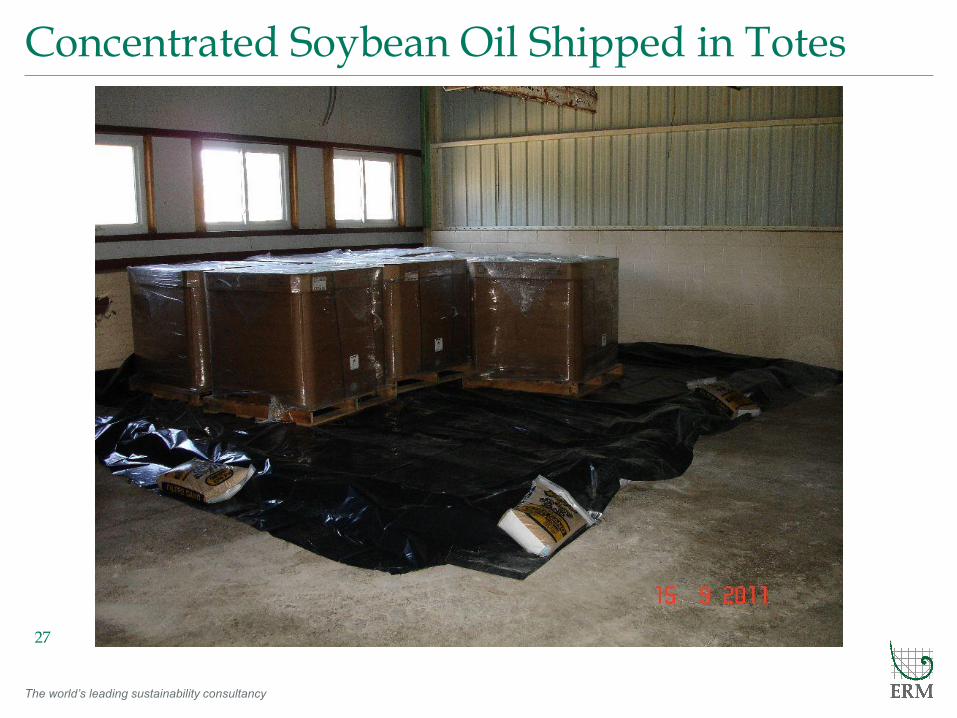
Concentrated Soybean Oil Shipped in Totes
27
The world’s leading sustainability consultancy
Graphics
What’s this layout for?
Plain slide without a text box –
used for inserting graphics e.g.
pies, bars or images
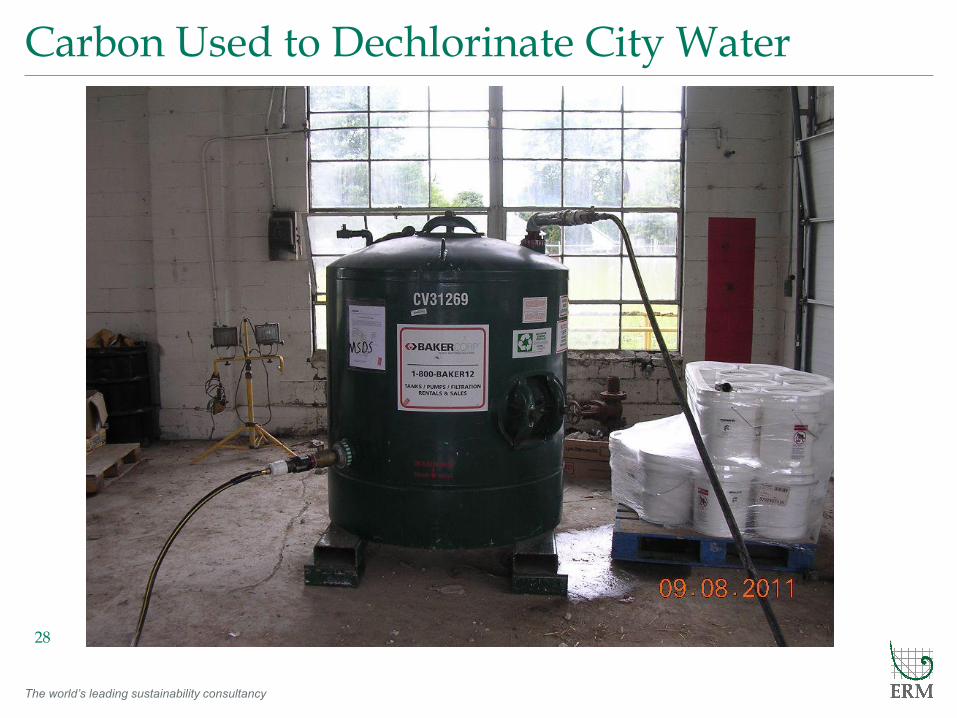
Carbon Used to Dechlorinate City Water
28
The world’s leading sustainability consultancy
Graphics
What’s this layout for?
Plain slide without a text box –
used for inserting graphics e.g.
pies, bars or images
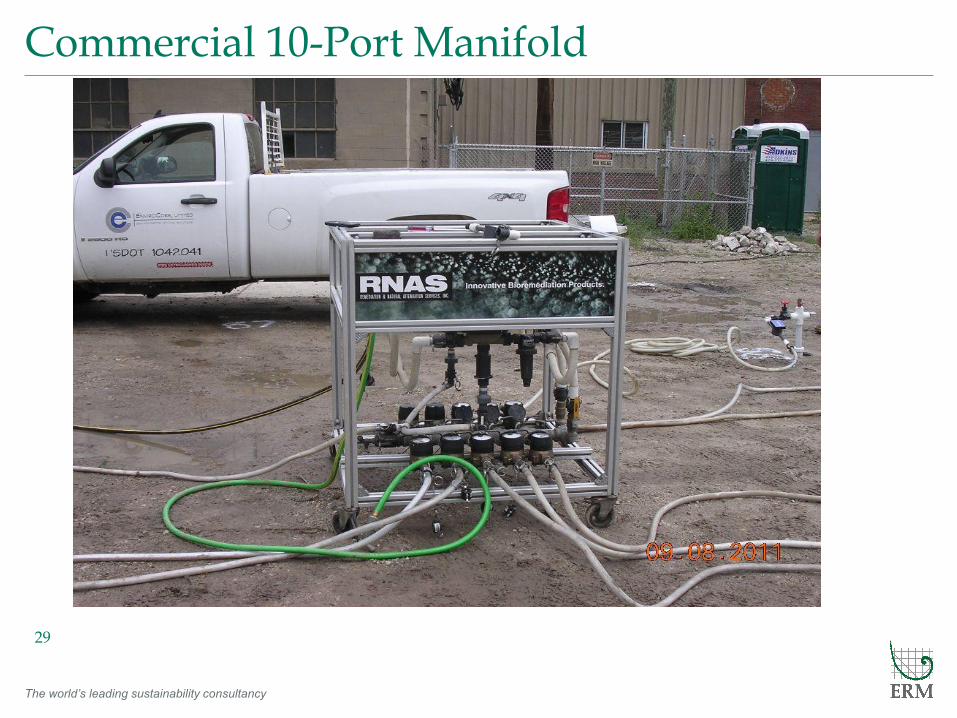
Commercial 10-Port Manifold
29
The world’s leading sustainability consultancy
Graphics
What’s this layout for?
Plain slide without a text box –
used for inserting graphics e.g.
pies, bars or images
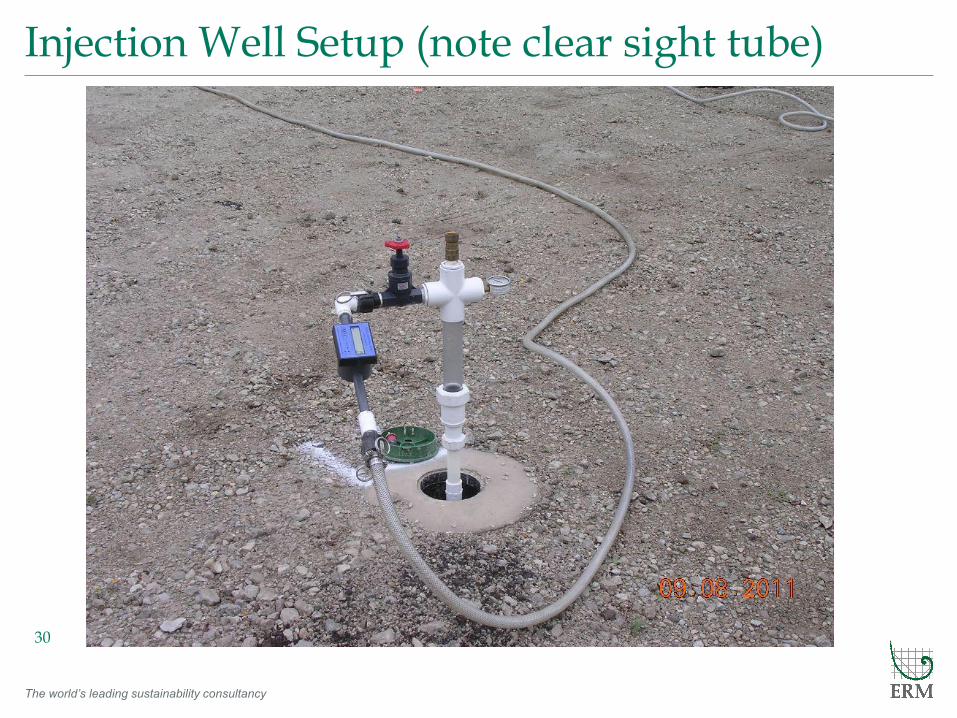
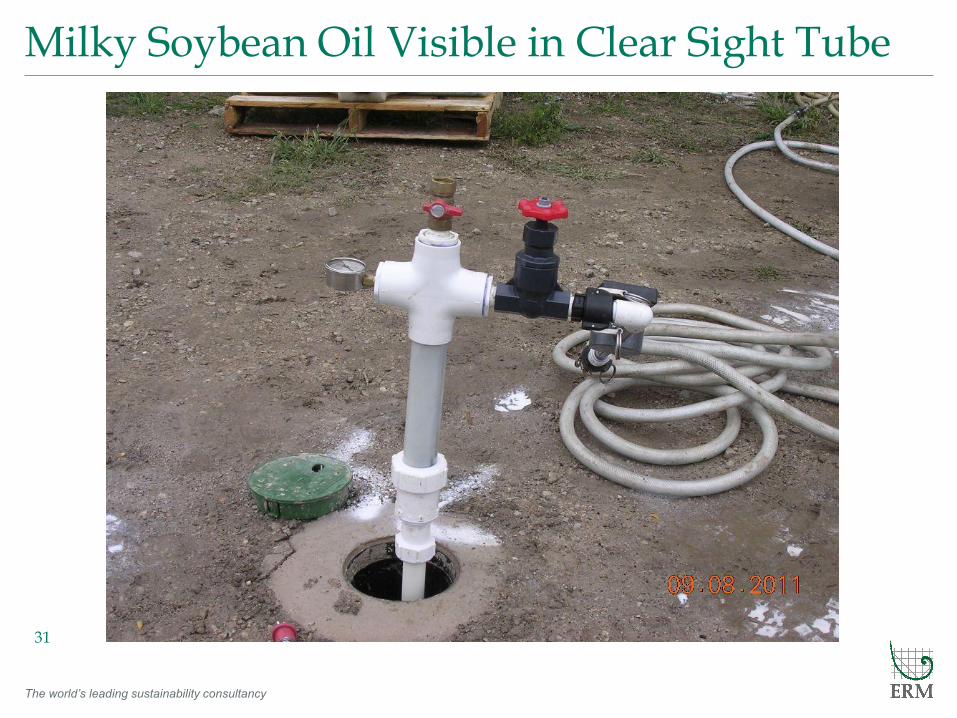
Injection Well Setup (note clear sight tube)
30
The world’s leading sustainability consultancy
Graphics
What’s this layout for?
Plain slide without a text box –
used for inserting graphics e.g.
pies, bars or images
Milky Soybean Oil Visible in Clear Sight Tube
31
The world’s leading sustainability consultancy
Graphics
What’s this layout for?
Plain slide without a text box –
used for inserting graphics e.g.
pies, bars or images
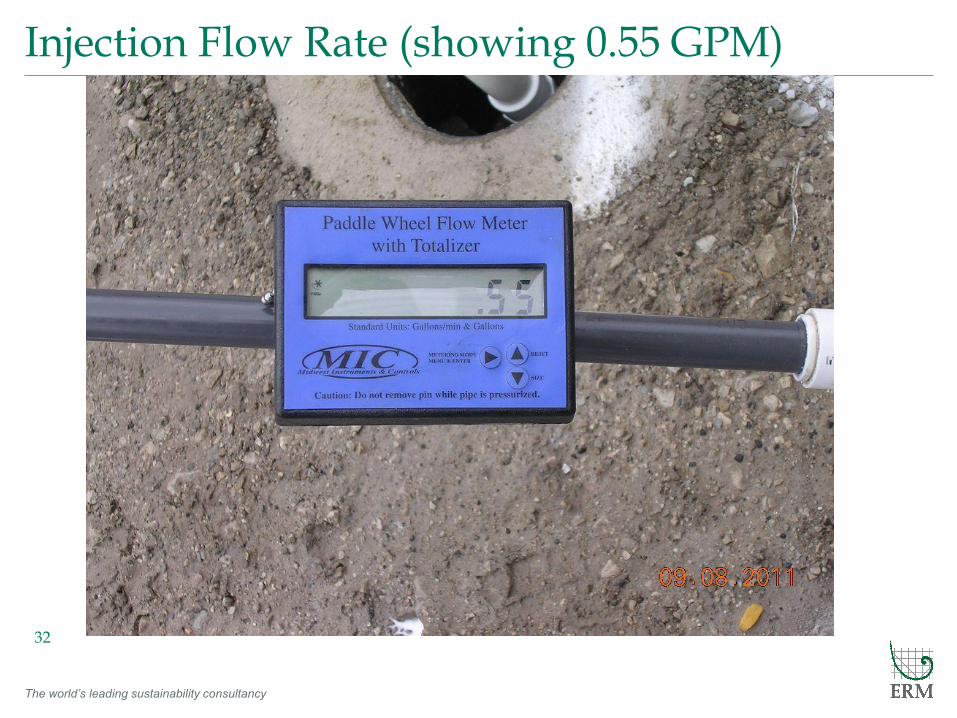
Injection Flow Rate (showing 0.55 GPM)
32
The world’s leading sustainability consultancy
Graphics
What’s this layout for?
Plain slide without a text box –
used for inserting graphics e.g.
pies, bars or images
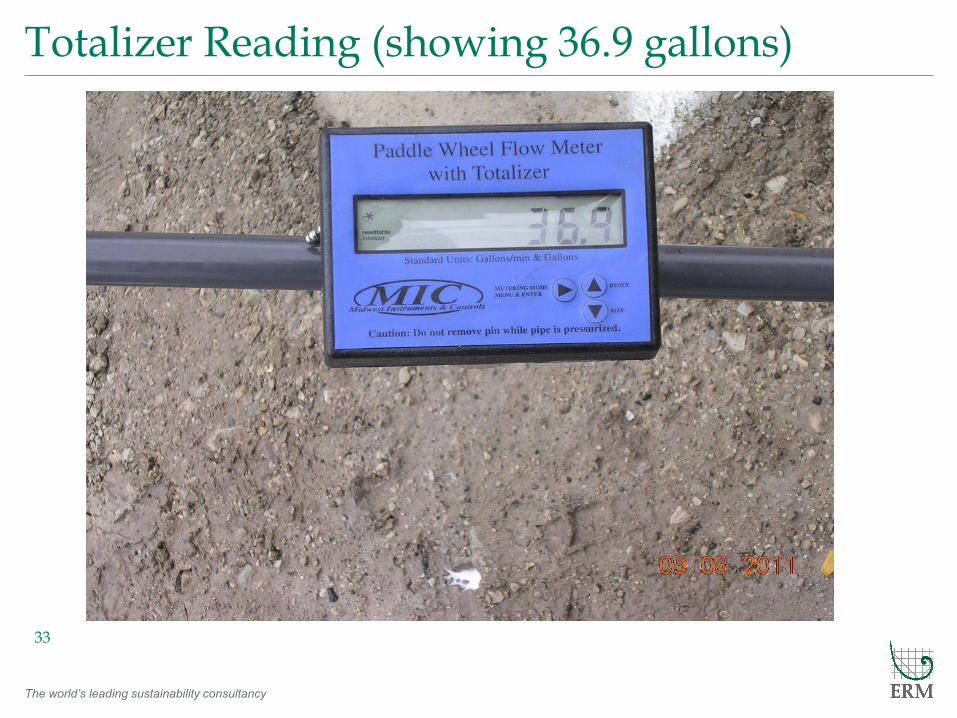
Totalizer Reading (showing 36.9 gallons)
33
The world’s leading sustainability consultancy
Blank left_body text right
What’s this layout for?
Blank on left and bullets on right.
Can be used to insert a
chart/diagram on the left and
bullet points on the right.
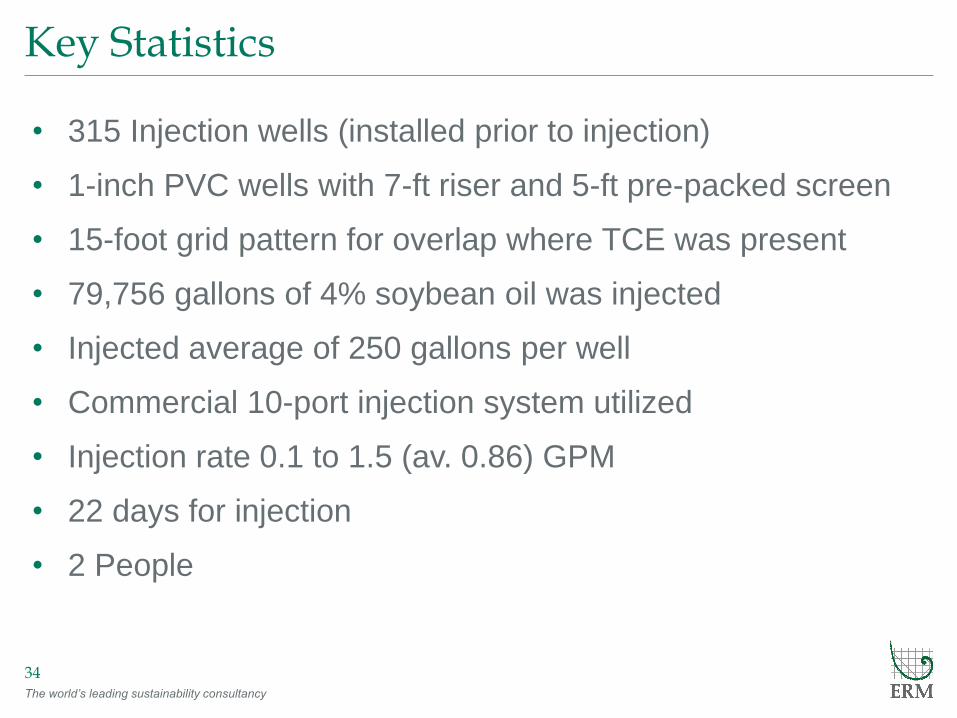
Key Statistics
34
• 315 Injection wells (installed prior to injection)
• 1-inch PVC wells with 7-ft riser and 5-ft pre-packed screen
• 15-foot grid pattern for overlap where TCE was present
• 79,756 gallons of 4% soybean oil was injected
• Injected average of 250 gallons per well
• Commercial 10-port injection system utilized
• Injection rate 0.1 to 1.5 (av. 0.86) GPM
• 22 days for injection
• 2 People
The world’s leading sustainability consultancy
Contents
What’s this layout for?
Formatting for contents slide –
this slide has slightly different
spacing between lines to
emphasise topics
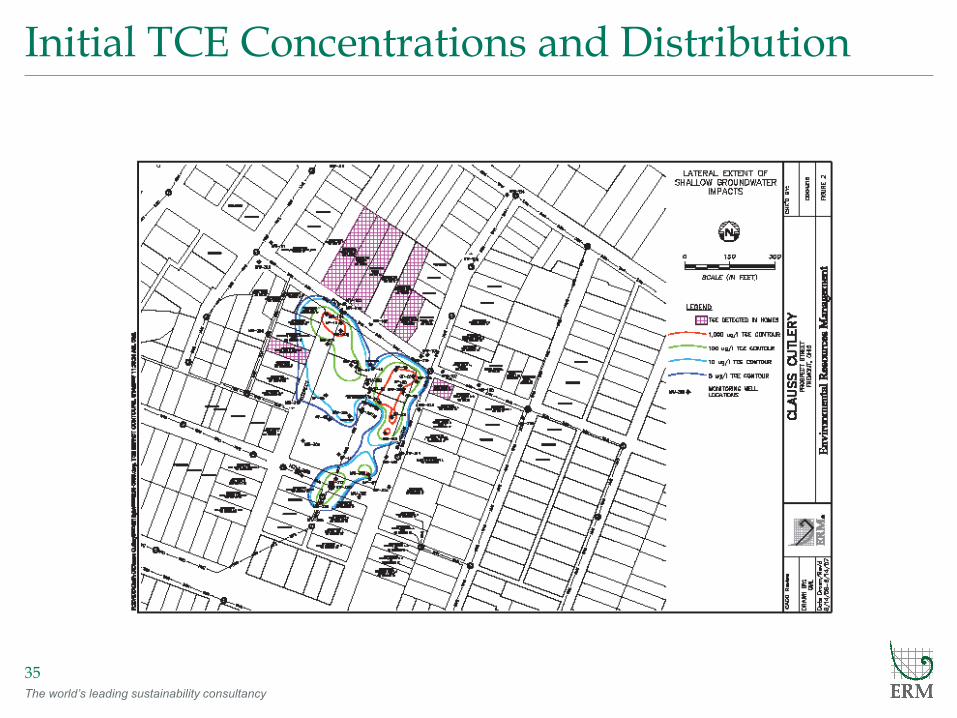
Initial TCE Concentrations and Distribution
35
The world’s leading sustainability consultancy
Blank left_body text right
What’s this layout for?
Blank on left and bullets on right.
Can be used to insert a
chart/diagram on the left and
bullet points on the right.
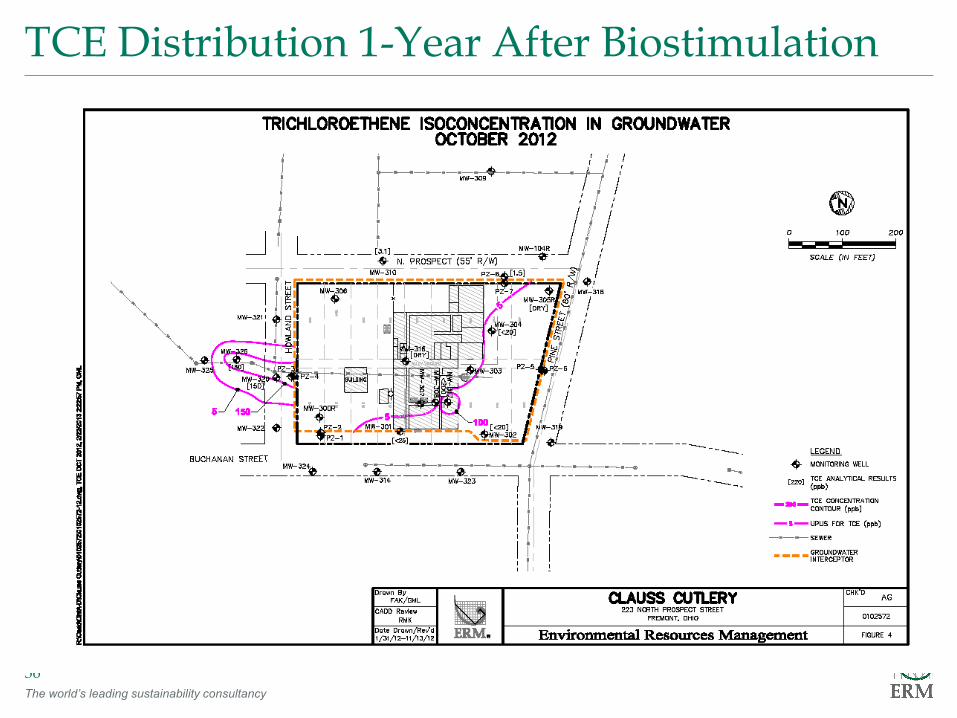
TCE Distribution 1-Year After Biostimulation
36
The world’s leading sustainability consultancy
Blank left_body text right
What’s this layout for?
Blank on left and bullets on right.
Can be used to insert a
chart/diagram on the left and
bullet points on the right.
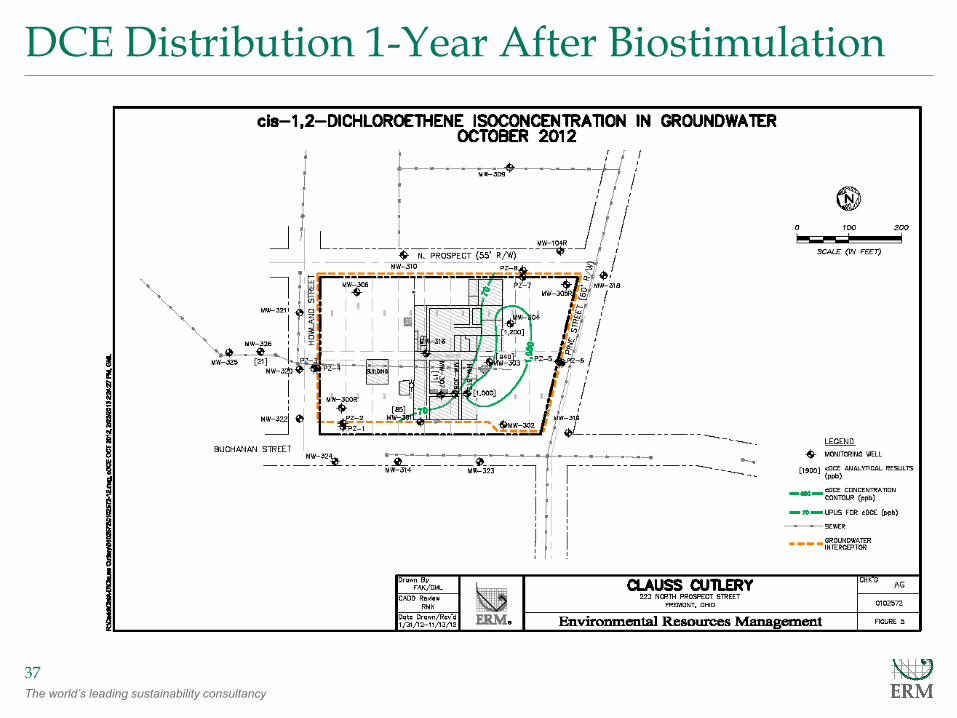
DCE Distribution 1-Year After Biostimulation
37
The world’s leading sustainability consultancy
Blank left_body text right
What’s this layout for?
Blank on left and bullets on right.
Can be used to insert a
chart/diagram on the left and
bullet points on the right.
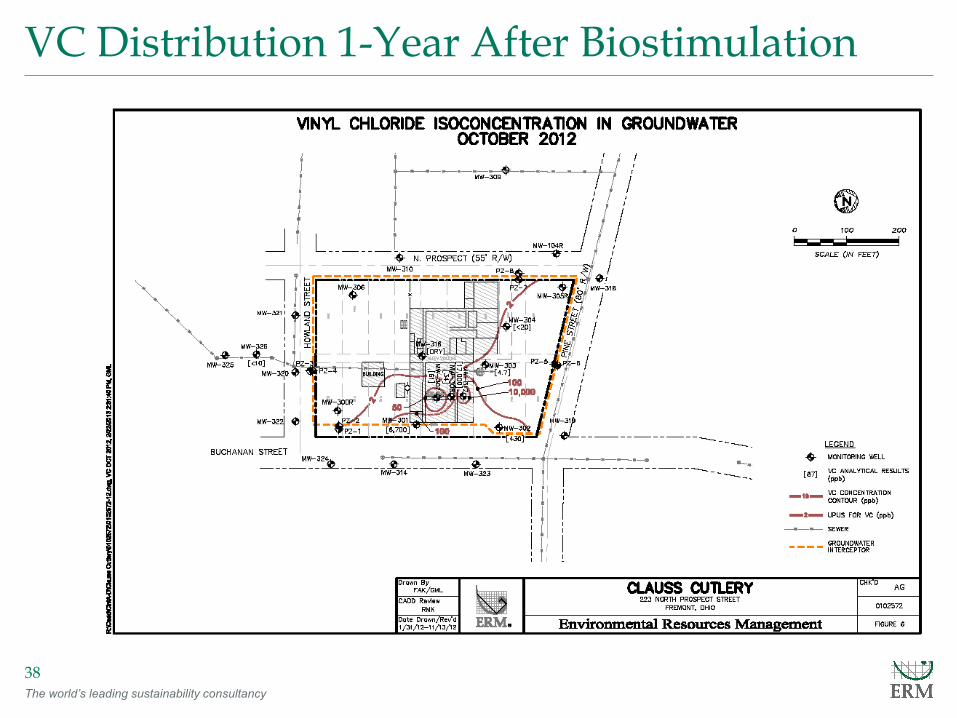
VC Distribution 1-Year After Biostimulation
38
The world’s leading sustainability consultancy
Blank left_body text right
What’s this layout for?
Blank on left and bullets on right.
Can be used to insert a
chart/diagram on the left and
bullet points on the right.
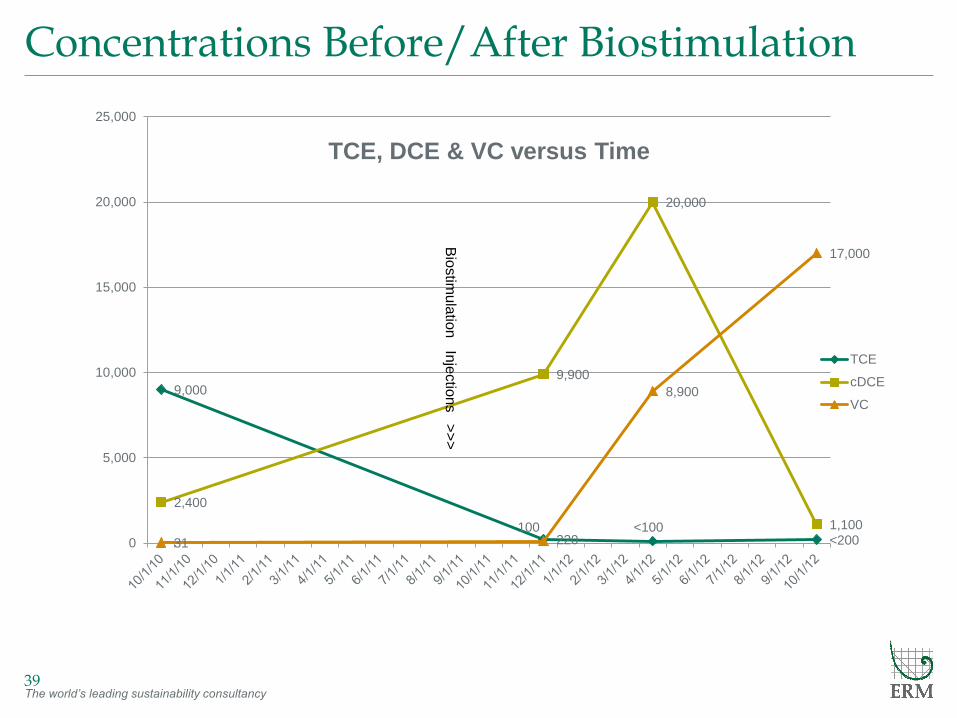
Concentrations Before/After Biostimulation
39
9,000
220 <100
<200
2,400
9,900
20,000
1,100
31
100
8,900
17,000
0
5,000
10,000
15,000
20,000
25,000
TCE, DCE & VC versus Time
TCE
cDCE
VC
Bio
stim
ula
tion
Inje
ctio
ns >
>>
The world’s leading sustainability consultancy
Body text
What’s this layout for?
This slide forms the base of
the majority of slides – a text
box with bullets are included
ready for you to type into.
Success Factors
40
• Existing Site Conditions
• Contaminant types/concentrations
• Dehalococoides Bacteria Required
• Only known group of bacteria capable of complete dechlorination of
PCE and/or TCE to ethene
• Presence even in low numbers indicates potential for complete
reductive dechlorination (PCE>TCE>cDCE>VC>Ethene)
• Ability to Inject Sufficient Innoculant
• Hydraulic conductivity adequate (sand, fine sand, silty-sand)
• Low flow rate to prevent short circuiting up probe or well casing
• Sufficient Time for Complete Reductive Dechlorination
The world’s leading sustainability consultancy
Body text
What’s this layout for?
This slide forms the base of
the majority of slides – a text
box with bullets are included
ready for you to type into.
Potential Problems
41
• Vinyl chloride concentrations temporarily increase due to
reductive dechlorination of cDCE
• Second injection may be needed in some areas
• Contaminant concentrations are constantly changing
during reductive dechlorination
• Vinyl chloride is more toxic than TCE (lower cleanup goal)
• Onsite vapor intrusion hazard
• Potential offsite migration/impacts
• Project deadline may not allow for complete reductive
dechlorination before NFA letter is submitted
VAP Implications of Innovative Technology
Fremont, Ohio
Dan B. Brown, CP-127, CPG
October 7, 2013
Partners Environmental Consulting, Inc.
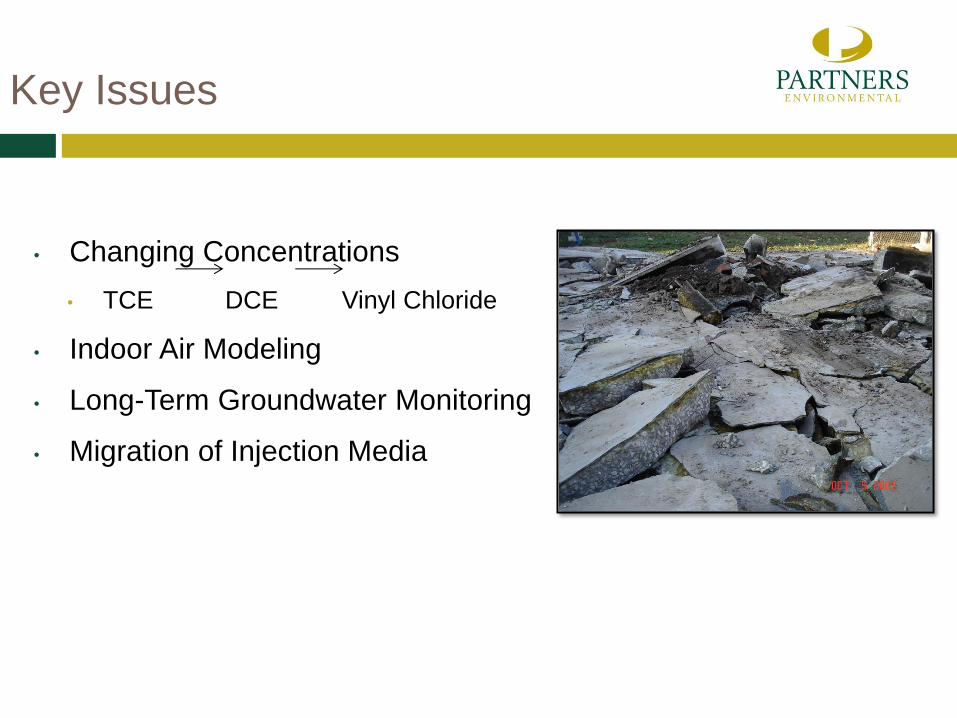
Key Issues
• Changing Concentrations
• TCE DCE Vinyl Chloride
• Indoor Air Modeling
• Long-Term Groundwater Monitoring
• Migration of Injection Media
Changing Concentrations
• As concentrations changed, applicable standards and
contribution to risk changed.
• Did not have a static condition and there was no reliable way to
predict future concentrations, from a modeling standpoint
• Without Engineering Controls, significant monitoring would have
been necessary or highly complex modeling and risk
assessments required
Indoor Air
• COCs varied as degredation occurred
• Resulted in constantly changing input parameters to model
• Addressed On-Site with Sub-Slab Depressurization System
(SSDS) so that monitoring could be limited and building could
be occupied
• Presumptive Remedy
• Provided process for turning off SSDS in Operation and
Maintenance (O&M) Plan
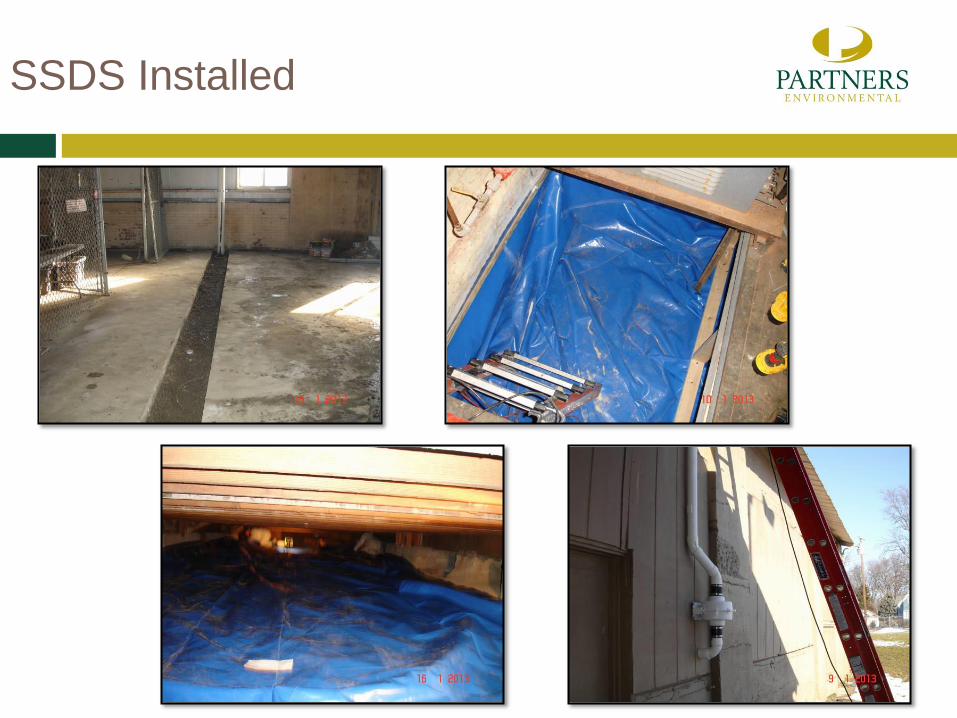
SSDS Installed
Long-Term Groundwater Monitoring
• Wanted to limit monitoring, but concentrations were changing
• Primary driver was groundwater migration to residential
properties, potentially causing groundwater to indoor air
pathway failures
• Utilized engineering control of trench recovery system
• Established process for ceasing pumping in O&M Plan
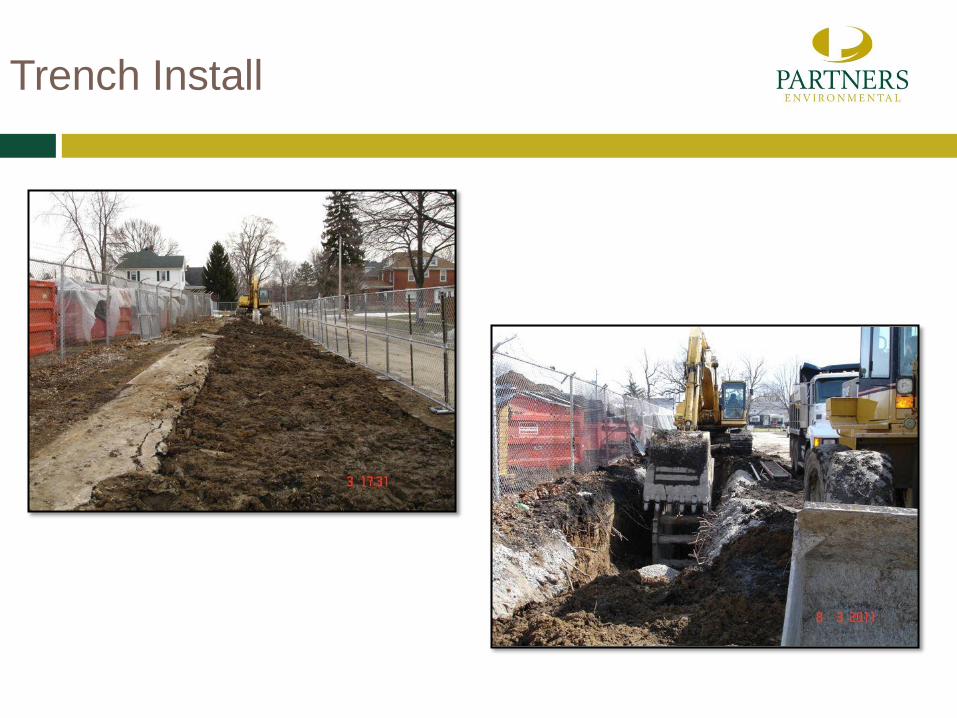
Trench Install
Migration of Injection Media
• Wanted to control media due to color/odor concerns
• Nearby residences
• Only injected inside trench recovery system
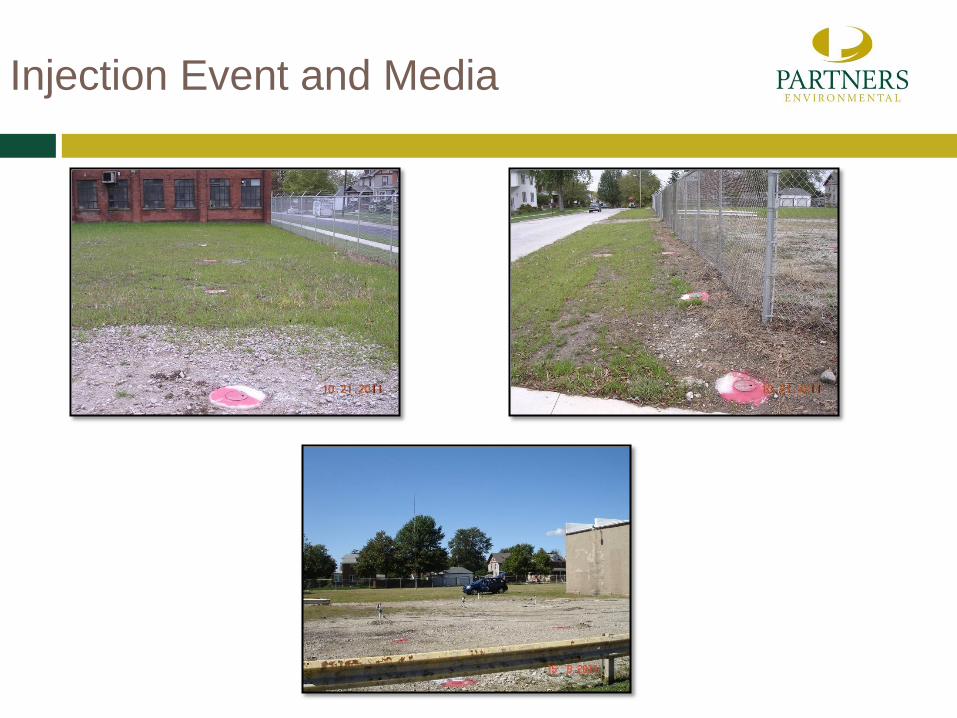
Injection Event and Media

QUESTIONS AND ANSWERS