particulate emissions from large north american wildfires ... · particulate emissions from large...
TRANSCRIPT
Atmos. Chem. Phys., 17, 6423–6438, 2017www.atmos-chem-phys.net/17/6423/2017/doi:10.5194/acp-17-6423-2017© Author(s) 2017. CC Attribution 3.0 License.
Particulate emissions from large North American wildfiresestimated using a new top-down methodTadas Nikonovas, Peter R. J. North, and Stefan H. DoerrGeography Department, College of Science, Swansea University, Singleton Park, Swansea, SA2 8PP, UK
Correspondence to: Tadas Nikonovas ([email protected])
Received: 31 March 2016 – Discussion started: 3 August 2016Revised: 3 February 2017 – Accepted: 14 April 2017 – Published: 30 May 2017
Abstract. Particulate matter emissions from wildfires affectclimate, weather and air quality. However, existing globaland regional aerosol emission estimates differ by a factor ofup to 4 between different methods. Using a novel approach,we estimate daily total particulate matter (TPM) emissionsfrom large wildfires in North American boreal and temper-ate regions. Moderate Resolution Imaging Spectroradiometer(MODIS) fire location and aerosol optical thickness (AOT)data sets are coupled with HYSPLIT (Hybrid Single-ParticleLagrangian Integrated Trajectory) atmospheric dispersionsimulations, attributing identified smoke plumes to sources.Unlike previous approaches, the method (i) combines infor-mation from both satellite and AERONET (AErosol ROboticNETwork) observations to take into account aerosol wateruptake and plume specific mass extinction efficiency whenconverting smoke AOT to TPM, and (ii) does not dependon instantaneous emission rates observed during individualsatellite overpasses, which do not sample night-time emis-sions. The method also allows multiple independent esti-mates for the same emission period from imagery taken onconsecutive days.
Repeated fire-emitted AOT estimates for the same emis-sion period over 2 to 3 days of plume evolution show in-creases in plume optical thickness by approximately 10 % forboreal events and by 40 % for temperate emissions. Inferredmedian water volume fractions for aged boreal and temper-ate smoke observations are 0.15 and 0.47 respectively, indi-cating that the increased AOT is partly explained by aerosolwater uptake. TPM emission estimates for boreal events,which predominantly burn during daytime, agree closelywith bottom-up Global Fire Emission Database (GFEDv4)and Global Fire Assimilation System (GFASv1.0) invento-ries, but are lower by approximately 30 % compared to Quick
Fire Emission Dataset (QFEDv2) PM2.5, and are higher byapproximately a factor of 2 compared to Fire Energetics andEmissions Research (FEERv1) TPM estimates. The discrep-ancies are larger for temperate fires, which are characterizedby lower median fire radiative power values and more sig-nificant night-time combustion. The TPM estimates for thisstudy for the biome are lower than QFED PM2.5 by 35 %, andare larger by factors of 2.4, 3.2 and 4 compared with FEER,GFED and GFAS inventories respectively. A large underesti-mation of TPM emission by bottom-up GFED and GFAS in-dicates low biases in emission factors or consumed biomassestimates for temperate fires.
1 Introduction
Large and often severe fires in boreal and temperate for-est regions alter atmospheric composition, considerably af-fecting the Earth’s radiative budget (Langmann et al., 2009;Bond et al., 2013) and degrading air quality (Johnstonet al., 2012). The burning regime in these regions is domi-nated by episodic extreme events (Stocks et al., 2002) emit-ting continental-scale plumes (Colarco et al., 2004) withinterhemispheric transport potential (Damoah et al., 2004;Dahlkötter et al., 2013). Future climate predictions indicateboth drier conditions and greater than average warming fornorthern latitudes, projecting a likely increase in area burned(Liu et al., 2010) and soil carbon consumption (Turetskyet al., 2015). For the quantification of smoke radiative forc-ing and impacts on human health, a realistic representation ofbiomass burning emissions in climate and air quality modelsis needed. Disagreement between bottom-up and top-down
Published by Copernicus Publications on behalf of the European Geosciences Union.
6424 T. Nikonovas et al.: Particulate emissions from large wildfires in North America
emission estimates of particulate matter, however, remainslarge (Kaiser et al., 2012; Ichoku and Ellison, 2014).
Bottom-up emission inventories use emission factors (EF)(Andreae and Merlet, 2001; Janhäll et al., 2010; Akagi et al.,2011; Urbanski, 2014), ratios of gases and particulate matteremitted per unit of dry fuel burned, compiled for differentbiomes from a range of burning experiment measurementsacross the globe. Emission factors are applied to biomassburned estimates, which are typically based on satellite ob-servations of ubiquitous but highly variable fire activity. TheGlobal Fire Emission Database (GFED) (van der Werf et al.,2010) makes use of satellite burned area products (Rander-son et al., 2012; Giglio et al., 2013) and active fire pixelcounts, while the Global Fire Assimilation System (GFAS)(Kaiser et al., 2012) employs fire radiative power (FRP) mea-surements (Giglio et al., 2006). Burned area estimates areconverted to biomass burned using modelled carbon poolsand soil-moisture-dependent combustion completeness char-acteristic to the fuel types. FRP-based methods rely on ob-served relationships between observed FRP and biomasscombustion rates (Kaufman and Tanre, 1998; Wooster et al.,2003, 2005).
The more top-down methods utilize satellite aerosol op-tical thickness (AOT) observations. The Quick Fire Emis-sion Database (QFED) uses regional AOT measurementsto scale emissions based on EFs (Darmenov and da Silva,2015). Similarly, atmospheric model assimilation of GFASemissions (Kaiser et al., 2012) suggested a 3.4 global en-hancement factor was needed to reconcile total particulatematter (TPM) estimates with observed AOTs. Purely top-down methods estimate emissions through inverse modellingof satellite AOT retrievals (Ichoku and Kaufman, 2005;Dubovik et al., 2008). A top-down global gridded Fire En-ergetics and Emissions Research (FEERv1) (Ichoku and El-lison, 2014) product is based on collocated satellite FRPand AOT observations. Inferred total particulate matter emis-sions rates are linked to observed FRP. The estimated TPMemission coefficients allow direct conversion from time-integrated FRP to emitted particulate matter without invok-ing the emissions factors.
Global and regional particulate matter estimates from thebottom-up burned area and fire pixel-count-based GFEDagree well with the FRP-based GFAS estimates. Model as-similations of these bottom-up emissions, however, suggestTPM underestimation by a factor of 2 to 4 compared tosatellite AOT observations (Kaiser et al., 2012). EnhancedGFAS TPM estimates and scaled QFED agree better withtop-down FEER emission coefficients on global scales. No-table discrepancies, however, are present for individual re-gions. North American emissions are larger for enhancedGFAS TPM and QFED when compared to top-down FEER,while FEER agrees closely with the bottom-up GFED inven-tory.
A number of uncertainties in both bottom-up and top-down estimates can contribute towards the apparent TPM
discrepancies. Average EFs for different biomes concealsmall sample numbers for some areas, and large variability inindividual measurement results from within-biome inconsis-tencies in vegetation density, climatic and burning conditions(Van Leeuwen and van der Werf, 2011; van Leeuwen et al.,2014). Consumed biomass estimates inherit errors of satel-lite burned area (Randerson et al., 2012), fire location (Hyeret al., 2009) or FRP retrieval (Giglio et al., 2006), and dependon a range of assumptions on availability and consumption ofcarbon in aboveground and soil pools (French et al., 2004).Top-down approaches are affected by AOT retrieval errorand large uncertainties in assumed smoke particle proper-ties, which are required to relate aerosol extinction to partic-ulate mass (Reid et al., 2005b). Moreover, estimates of emis-sion rates based on near-source retrievals are representativeof burning conditions at the time of satellite overpass. A re-cent study indicated that night-time TPM emissions might beunderestimated by a factor of 20–30 for a large temperate for-est fire in the western USA (Saide et al., 2015), stressing theneed for better representation of night-time emissions in theinventories. Methods based on regional AOT observations,on the other hand, must take into account poorly constrainedageing effects (Reid and Hobbs, 1998; O’Neill et al., 2002).
This study presents estimates of particulate matter emis-sions from large wildfires with identifiable plumes in NorthAmerican boreal and temperate regions. A newly developedtop-down method is applied which attributes satellite aerosolobservations to a specific fire event and emission period.Quantified daily fire-emitted AOT takes into account aerosolsinjected throughout the diurnal cycle and does not rely on in-stantaneous emission rates observed during a satellite over-pass. In some cases, AOT attribution for the same emissionperiod is achieved from satellite images taken on succes-sive days, allowing for an assessment of uncertainty and aninvestigation of systematic changes in plume optical thick-ness over time. Total particulate matter is quantified by ap-plying mass extinction efficiency, which is simulated usingAERONET particle properties, and accounts for inferred wa-ter uptake by aerosols. The results are compared with exist-ing estimates in order to investigate systematic differencesbetween the approaches.
2 Data and methods
Daily total particulate matter emissions for large and persis-tent fire events were estimated by combining Moderate Res-olution Imaging Spectroradiometer (MODIS) active fire ob-servations and aerosol optical thickness retrievals with plumedispersion simulated using the Hybrid Single-Particle La-grangian Integrated Trajectory (HYSPLIT) model.
Atmos. Chem. Phys., 17, 6423–6438, 2017 www.atmos-chem-phys.net/17/6423/2017/
T. Nikonovas et al.: Particulate emissions from large wildfires in North America 6425
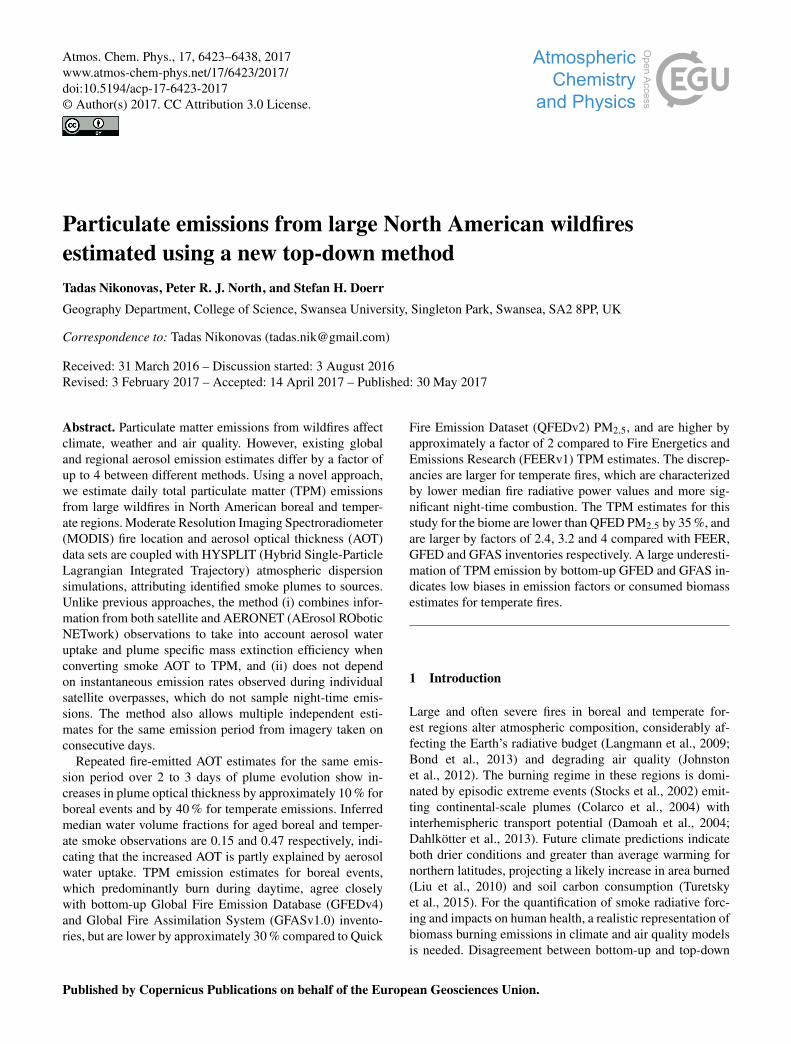
Figure 1. An illustration of the method showing an example of fire-emitted AOT attribution for two diurnal cycles of a temperate fire. Rowsin the figure represent 3 successive days of satellite imagery from which the attribution was achieved. Columns from left to right showMODIS AOT retrievals for the day from a single platform with the highest coverage (a–c), snapshots of HYSPLIT particle positions and agetaken at local noon (d–f), and AOT interpolated to 25 km equal-area grid (g–i). The two right columns show fire-emitted AOT attributed to28 (j) and (k) and 29 (l) and (m) July 2007 determined from images taken on different days. Total attributed AOT is shown within the plots.
2.1 Active fires
To represent fire activity we used the active fire location dataset MCD14ML produced by the University of Maryland andprovided by NASA Fire Information for Resource Manage-ment System (Giglio et al., 2006). The data product is basedon MODIS mid-range and thermal infrared observations.MODIS sensors are flown on board the sun-synchronouspolar-orbiting Terra and Aqua satellites which respectivelypass the equator at 10:30 and 13.30 local time during the day-time hours and at 22:30 and 01:30 at night. The instrumentshave a wide swath of approximately 2330 km, each providingnear-global coverage daily. For high latitudes the coverage isbetter due to increasing overlap between consecutive over-passes. Each detection in the data set represents an active firein a 1 km2 pixel at the time of satellite overpass, and containsinformation on the retrieved fire radiative power.
2.2 Fire event selection
Large and long-lived fire events, likely strong emissionsources, were identified and selected for the analysis. Burn-ing episodes larger than 100 km2 are not numerous, but ac-count for more than 80 % of total burned area in borealNorth America (Stocks et al., 2002; Kasischke et al., 2002),and are a dominant mode of burning in parts of temperateregions as well (Strauss et al., 1989). In order to identify
such events, individual MODIS active fire detections wereagglomerated into large wildfire events by performing two-step spatial–temporal clustering. First, any MODIS fire de-tections located closer than 10 km in space and 24 h in timewere grouped together. Single detections not assigned to anyof the formed clusters were removed from further analysis.The clusters were then filtered by selecting events with (i) aspatial bounding box containing all fire detections belongingto the cluster larger than 100 km2 and (ii) a duration longerthan 7 days. The duration was determined by the time spanbetween the first and the last MODIS active fire detectionsbelonging to the cluster. The burning was considered unin-terrupted if the largest temporal interval between subsequentMODIS fire observations was less than 24 h. During the sec-ond step of clustering, any of the selected events active at thesame time and located closer than 150 km were grouped intolarge burning episodes and assigned a unique source label.These events were classified into boreal and temperate firesusing the dominant emission source given in the GFEDv4 in-ventory for areas and periods in which the events were active.
2.3 Plume dispersion modelling
Smoke transport for the selected fire events was simulatedwith the HYSPLIT model (Draxler and Rolph, 2003). Plumedispersion from a source location was represented by the mo-tion of a large number of discrete particles moved by the
www.atmos-chem-phys.net/17/6423/2017/ Atmos. Chem. Phys., 17, 6423–6438, 2017
6426 T. Nikonovas et al.: Particulate emissions from large wildfires in North America
wind field with mean and random components. Global DataAssimilation System (GDAS) meteorological archive datawere employed to drive the model.
For each day of burning, particles were continuously re-leased into the model domain from the locations of the in-dividual active fire detections within the fire event. In orderto represent fire diurnal cycle, different MODIS active fireobservations were used to release particles for two 12 h in-tervals representing day and night emissions from 09:00 to21:00 and from 21:00 to 09:00 local time respectively. Emis-sion source number and locations for daytime periods weredetermined from the highest number of fire detections ob-served during a single Terra or Aqua daytime overpass with10.30 and 13.30 equatorial crossing time. Similarly, emit-ted particle source numbers for the night periods were de-termined by the largest burning extent observed during oneof the night-time overpasses with 22.30 and 1.30 equatorialcrossing times. Notably, the Terra overpass at 22.30 at highlatitudes makes observations of regions where local time isearlier than 21:00. In this study, however, all fires detectedduring this overpass were classed as night-time observations.If no valid observations were available for some of the timeintervals, the count and fire pixel locations were set to a min-imum non-zero value estimated for the burning episode fromall daytime or night-time observations. This was done toavoid total temporary shut-down of the emissions, which isan unlikely scenario for a long burning episode. Every hour,20 particles were released for each fire pixel. As a result,emitted particle number for a burning episode was deter-mined by the number of active fire pixels observed duringa given time period.
Particles were uniformly distributed between the surfaceand the top altitude of the planetary boundary layer as givenin GDAS archive. Satellite-based plume height estimates(Val Martin et al., 2010; Peterson et al., 2014) indicate thatin up to 80 % of the events analysed, injection heights werelimited to the planetary boundary layer. While confinementof the emissions to the mixing layer underestimates injectionheight for the most energetic burning episodes, such config-uration should nonetheless represent the majority of burningepisodes.
Throughout the simulations, modelled particle positions,their age and source burning event identifier were recordedeach day at local solar noon. The generated point clouds werelater used to compare against Terra and Aqua aerosol opticalthickness (AOT) observations.
2.4 Satellite aerosol data
MODIS AOT collection 5.1 data products M*D04_L2 wereused in this study. The dark target algorithm (Kaufman andTanre, 1998; Levy et al., 2009) retrieves AOT at 550 nmand 10km × 10 km spatial resolution at nadir. MODIS pixelsize increases with view angle, and pixels at the edge ofthe swath are approximately 9 times larger. For this study,
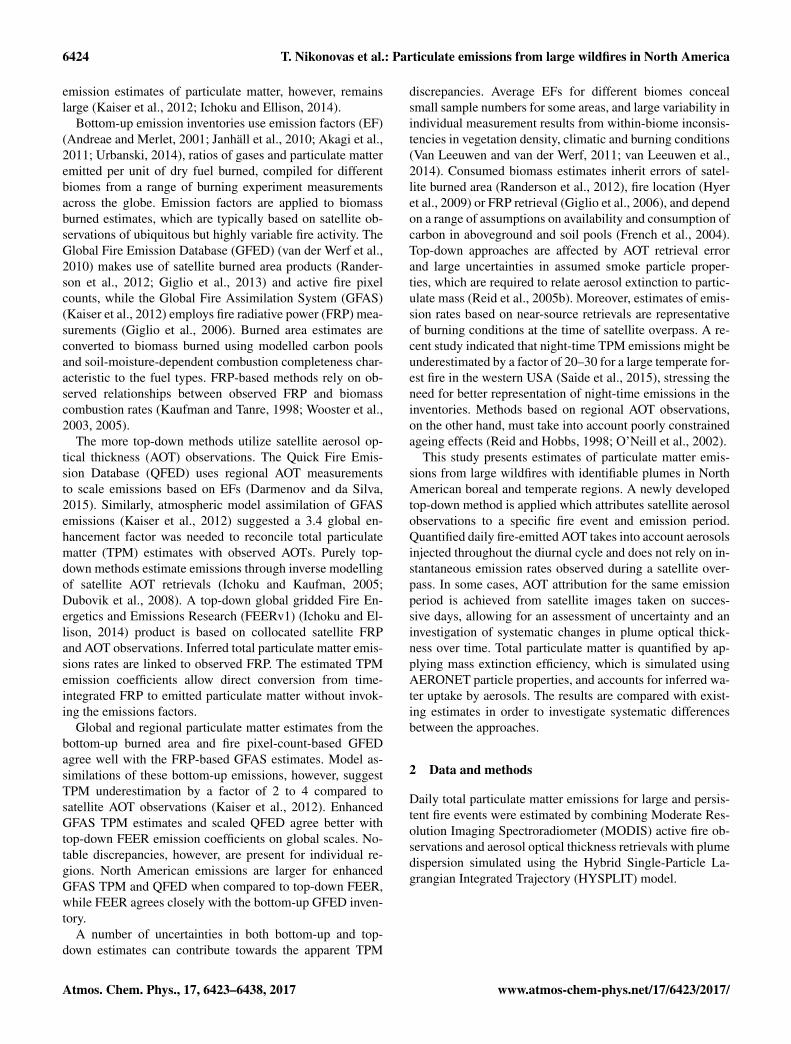
Figure 2. Changes in attributed AOT over time. Image shows 39boreal and 37 temperate diurnal emission cycles for which estimateswere obtained on 3 consecutive days, for both daytime and night-time periods.
all M*D04_L2 AOT retrievals with quality assurance con-fidence> 0 were selected. To maximize coverage, no cloudfraction filtering was applied. The AOT product global vali-dation against ground-based AERONET AOT observationssuggest a 1σ error which increases linearly with aerosolloading ± (0.05+ 0.20 %) (Levy et al., 2010) for overlandcases. A regional MODIS M*D04_L2 AOT product vali-dation (Hyer et al., 2011) indicates that performance variesgreatly within North America. The study found that for 0.2<AOT< 1.4 conditions, root mean square error varies from−0.01+0.51×AOT in arid western America where retrievalis hindered by bright surfaces, to 0.01+0.31×AOT in borealforest and 0.3+ 0.12×AOT in the eastern USA. The studyreported positive bias in MODIS AOT for some locations, inparticular for retrievals at extremely high aerosol loadings.The AOT retrieval values have an upper limit of 5.0, and inaddition, opaque smoke is often rejected as bright surfaceor cloud by the algorithm (Livingston et al., 2014), prevent-ing retrievals over extremely optically dense plumes. Conse-quently, AOT near the emission source is often not retrievedand the algorithm performs better when plumes are dispersedinto regional haze.
2.5 AOT attribution
Elevated MODIS AOT observations were attributed to a spe-cific fire event and emission period by comparing abovebackground MODIS AOT retrievals to plume extent mod-elled by HYSPLIT (Fig. 2). Attribution required three piecesof information: (i) the event-specific background AOT value,(ii) the modelled plume extent at local solar noon for eachday of burning and (iii) the coinciding MODIS AOT obser-vations. First of all, the background AOT value was estimatedfor each of the selected burning events. It was determined bythe median value of the AOT retrievals within 150 km radiusfrom the fire event centroid observed 2 days prior to igni-tion. For each day of fire activity, a modelled plume extent(Fig. 2d–f) was determined from the locations of all HYS-PLIT particle endpoints at solar noon, and AOT observations(Fig. 2a–c) with the highest spacial coverage for the day and
Atmos. Chem. Phys., 17, 6423–6438, 2017 www.atmos-chem-phys.net/17/6423/2017/
T. Nikonovas et al.: Particulate emissions from large wildfires in North America 6427
plume area were selected from either the Terra or Aqua plat-form.
After the required information was obtained, the followingsteps were performed for each day of burning in an attemptto estimate fire-emitted AOT. First, plume regions boundingthe particles released during the previous three daytime andnight-time emission periods were identified. An estimationof the emission was attempted individually for each of theregions which represented plume areas that emitted during aspecific time interval. This allowed the estimation of emittedAOT for up to 3 previous days from a single day of MODISimagery. Importantly, such an approach allows the estima-tion of some emission periods even if a full MODIS plumeoverview is not available. Emitted AOT attribution was per-formed for the plume regions and satisfied two conditions:(i) the region had at least 80 % of MODIS AOT areal cov-erage, assuming that a single AOT pixel represents 100 km2
area, and (ii) within-region AOT median value was higherthan the estimated background value for the fire event.
MODIS AOTs for the selected plume regions were in-terpolated to a 25 km-resolution equal-area grid (Fig. 2g–i)by employing radial basis function interpolation with a lin-ear kernel. Fire-emitted AOTs were estimated by subtract-ing the background value from the within-plume AOT. Theestimated fire-emitted AOT in every within-plume grid cellwas apportioned to different emission periods and differentsources based on information on release time and sourceof the HYSPLIT particles contained within the cell. If allparticles found within a grid cell were released during thesame emission period and originated from a single source,the cell’s AOT was simply attributed to that emission periodand source. If a mixture of particles were found within a cell,indicating that multiple fires and multiple emission periodscontributed towards the grid cell AOT, the attribution wasperformed by apportioning a grid cell’s fire-emitted AOT inproportion to the numbers of modelled particles released dur-ing the emission periods and with origin found within thegrid cell. For example, if a grid cell had an AOT value of1, and 100 HYSPLIT particles were located within the cellduring the satellite overpass, 80 of which were emitted twodiurnal cycles ago and 20 during the previous diurnal cycle,the grid cell AOT was split accordingly between the emissionperiods. Panels (k) and (l) in Fig. 2 illustrate the partition-ing of total plume AOT into two different emission periods.Similarly, if there were any particles emitted from differentfire events, grid cell AOT was divided both between differentemission periods and different fire events.
2.6 Smoke aerosol properties
The AErosol RObotic NETwork (AERONET) (Holben et al.,1998) level 2 retrievals (Dubovik and King, 2000) of aerosolmicrophysical and optical properties were used to character-ize particles in plumes under investigation. AERONET con-sists of ground-based globally distributed sun–sky scanning
photometers with a narrow field of view. The instrumentsare continuously monitored and calibrated, and the retrievedproperties have estimated accuracy ranges. The direct sun-beam extinction measurements provide spectral AOT at sev-eral wavelengths ranging from 0.34 to 1.02 µm with uncer-tainties of 0.01–0.02 (Dubovik et al., 2000). Measured AOTand angular distribution of sky radiances are used to retrievecolumn-integrated aerosol volume size distribution at 22 sizebins from 0.05 to 15 µm and spectral refractive index at 0.44,0.67, 0.87 and 1.02 µm. Size retrieval is expected to be ac-curate within 25 % for particles with radii between 0.1 and7 µm and within 25–100 % for size bins outside this range.Scans at high aerosol loadings (AOT 0.44 µm ≥ 0.4) allowthe retrieval of refractive index with estimated uncertaintiesof 0.04 and 30 % for real and imaginary parts respectively(Dubovik et al., 2000).
Available observations within areas identified by the dis-persion analysis as biomass burning plumes were attributedto a specific emission event and land cover type. Onlyretrievals containing refractive index (AOT 0.44 µm≥ 0.4)were selected. In order to minimize the presence of dustand urban aerosol dominated retrievals, cases with volumeconcentration of fine mode (particle diameter< 1 µm) frac-tion less than 0.8, sphericity parameter lower than 0.98 andabsorption Ångström exponent lower than 1 were filteredout. To make the samples more representative of plumesfor which particulate matter was estimated, we selectedAERONET observations within plume areas dominated byparticles that had aged over 1 to 3 days.
2.7 Water content retrieval
The available AERONET spectral refractive indices wereused to infer smoke aerosol water uptake. We employed theMaxwell Garnett effective medium approximation (Bohrenand Huffman, 1983) which provides a method to derive vol-ume fractions of the components in the mixture if their re-fractive indices are known. The approach for retrieving blackcarbon concentrations from AERONET climatologies is de-scribed in detail and demonstrated by Schuster et al. (2005).It was further developed to infer brown carbon content (Arolaet al., 2011), aerosol water uptake (Schuster et al., 2009),and to simultaneously retrieve fractions of carbonaceous ab-sorbers and dust (Schuster et al., 2016).
To infer water content we employed a three-componentmixture of black carbon and organic–inorganic matter in-cluded in a water host (Table 1). For black carbon we as-sumed the refractive index and density suggested in Bondand Bergstrom (2006). The second inclusion was used torepresent a broad range of chemical species observed inbiomass burning plumes (Brock et al., 2011), including or-ganic carbon, ammonium sulfate and ammonium nitrate.These species were represented by a single component be-cause they have n values close to 1.53. This value is char-acteristic of dry ammonium sulfate (Toon et al., 1976), was
www.atmos-chem-phys.net/17/6423/2017/ Atmos. Chem. Phys., 17, 6423–6438, 2017
6428 T. Nikonovas et al.: Particulate emissions from large wildfires in North America
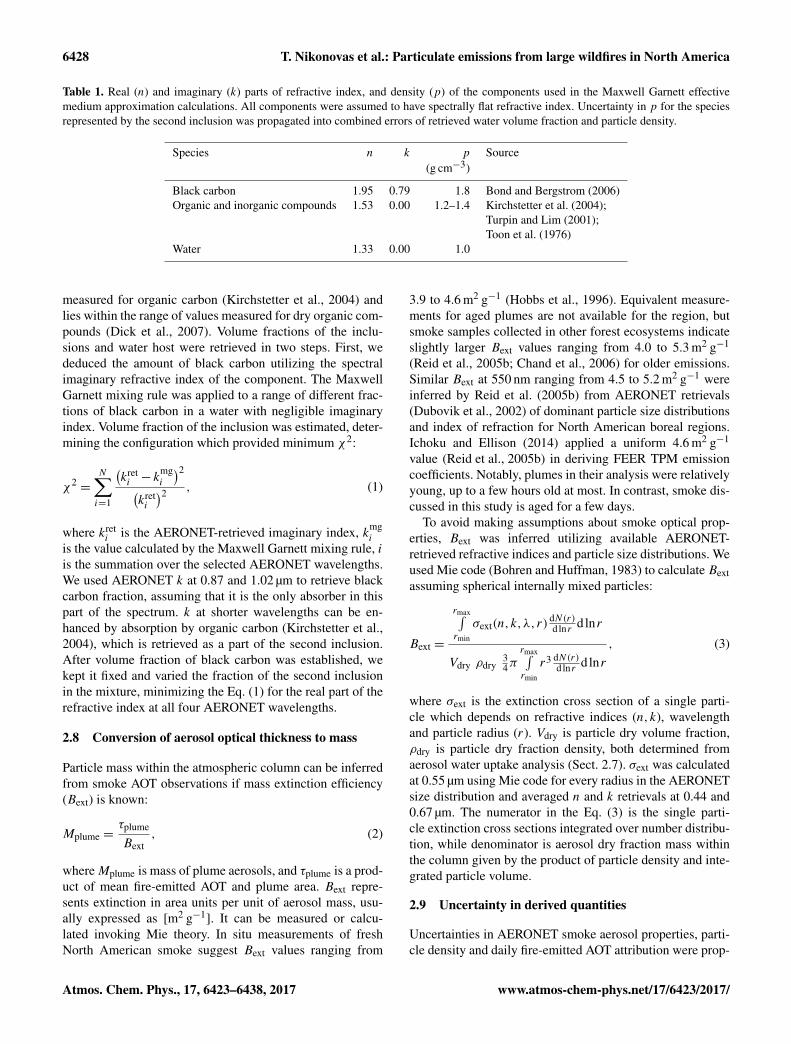
Table 1. Real (n) and imaginary (k) parts of refractive index, and density (p) of the components used in the Maxwell Garnett effectivemedium approximation calculations. All components were assumed to have spectrally flat refractive index. Uncertainty in p for the speciesrepresented by the second inclusion was propagated into combined errors of retrieved water volume fraction and particle density.
Species n k p Source(g cm−3)
Black carbon 1.95 0.79 1.8 Bond and Bergstrom (2006)Organic and inorganic compounds 1.53 0.00 1.2–1.4 Kirchstetter et al. (2004);
Turpin and Lim (2001);Toon et al. (1976)
Water 1.33 0.00 1.0
measured for organic carbon (Kirchstetter et al., 2004) andlies within the range of values measured for dry organic com-pounds (Dick et al., 2007). Volume fractions of the inclu-sions and water host were retrieved in two steps. First, wededuced the amount of black carbon utilizing the spectralimaginary refractive index of the component. The MaxwellGarnett mixing rule was applied to a range of different frac-tions of black carbon in a water with negligible imaginaryindex. Volume fraction of the inclusion was estimated, deter-mining the configuration which provided minimum χ2:
χ2=
N∑i=1
(kreti − k
mgi
)2(kreti
)2 , (1)
where kreti is the AERONET-retrieved imaginary index, kmg
i
is the value calculated by the Maxwell Garnett mixing rule, iis the summation over the selected AERONET wavelengths.We used AERONET k at 0.87 and 1.02 µm to retrieve blackcarbon fraction, assuming that it is the only absorber in thispart of the spectrum. k at shorter wavelengths can be en-hanced by absorption by organic carbon (Kirchstetter et al.,2004), which is retrieved as a part of the second inclusion.After volume fraction of black carbon was established, wekept it fixed and varied the fraction of the second inclusionin the mixture, minimizing the Eq. (1) for the real part of therefractive index at all four AERONET wavelengths.
2.8 Conversion of aerosol optical thickness to mass
Particle mass within the atmospheric column can be inferredfrom smoke AOT observations if mass extinction efficiency(Bext) is known:
Mplume =τplume
Bext, (2)
whereMplume is mass of plume aerosols, and τplume is a prod-uct of mean fire-emitted AOT and plume area. Bext repre-sents extinction in area units per unit of aerosol mass, usu-ally expressed as [m2 g−1]. It can be measured or calcu-lated invoking Mie theory. In situ measurements of freshNorth American smoke suggest Bext values ranging from
3.9 to 4.6 m2 g−1 (Hobbs et al., 1996). Equivalent measure-ments for aged plumes are not available for the region, butsmoke samples collected in other forest ecosystems indicateslightly larger Bext values ranging from 4.0 to 5.3 m2 g−1
(Reid et al., 2005b; Chand et al., 2006) for older emissions.Similar Bext at 550 nm ranging from 4.5 to 5.2 m2 g−1 wereinferred by Reid et al. (2005b) from AERONET retrievals(Dubovik et al., 2002) of dominant particle size distributionsand index of refraction for North American boreal regions.Ichoku and Ellison (2014) applied a uniform 4.6 m2 g−1
value (Reid et al., 2005b) in deriving FEER TPM emissioncoefficients. Notably, plumes in their analysis were relativelyyoung, up to a few hours old at most. In contrast, smoke dis-cussed in this study is aged for a few days.
To avoid making assumptions about smoke optical prop-erties, Bext was inferred utilizing available AERONET-retrieved refractive indices and particle size distributions. Weused Mie code (Bohren and Huffman, 1983) to calculate Bextassuming spherical internally mixed particles:
Bext =
rmax∫rmin
σext(n,k,λ,r)dN(r)dlnr dlnr
Vdry ρdry34π
rmax∫rmin
r3 dN(r)dlnr dlnr
, (3)
where σext is the extinction cross section of a single parti-cle which depends on refractive indices (n,k), wavelengthand particle radius (r). Vdry is particle dry volume fraction,ρdry is particle dry fraction density, both determined fromaerosol water uptake analysis (Sect. 2.7). σext was calculatedat 0.55 µm using Mie code for every radius in the AERONETsize distribution and averaged n and k retrievals at 0.44 and0.67 µm. The numerator in the Eq. (3) is the single parti-cle extinction cross sections integrated over number distribu-tion, while denominator is aerosol dry fraction mass withinthe column given by the product of particle density and inte-grated particle volume.
2.9 Uncertainty in derived quantities
Uncertainties in AERONET smoke aerosol properties, parti-cle density and daily fire-emitted AOT attribution were prop-
Atmos. Chem. Phys., 17, 6423–6438, 2017 www.atmos-chem-phys.net/17/6423/2017/
T. Nikonovas et al.: Particulate emissions from large wildfires in North America 6429
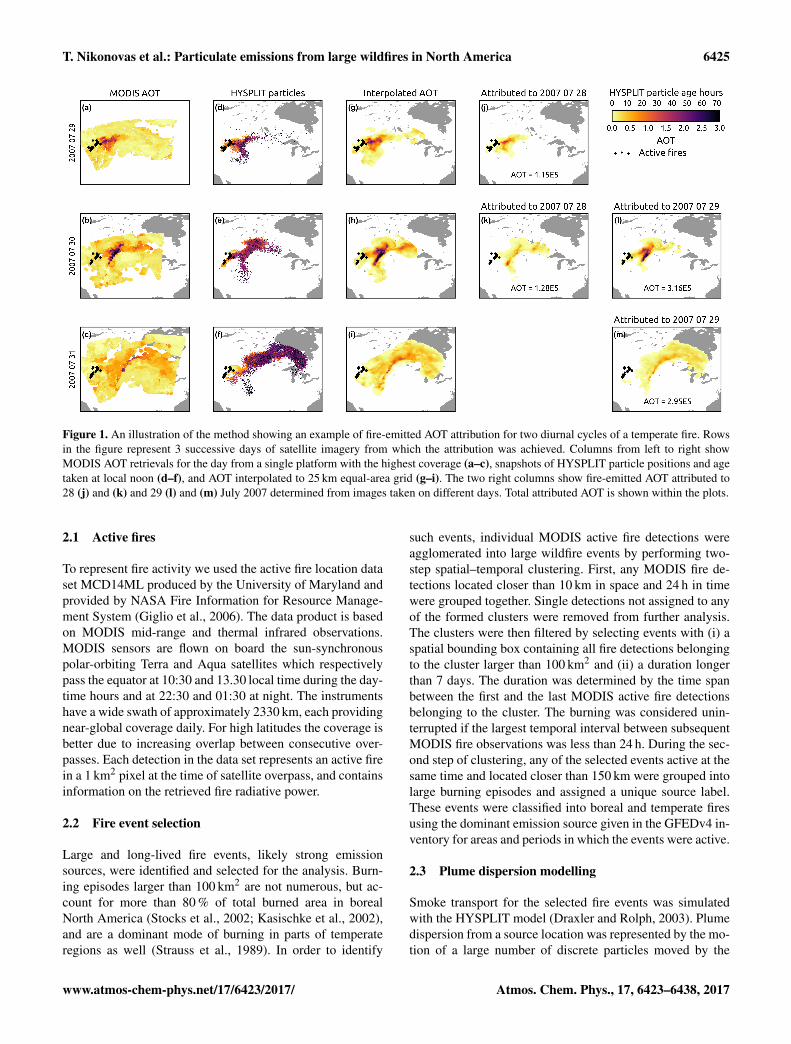
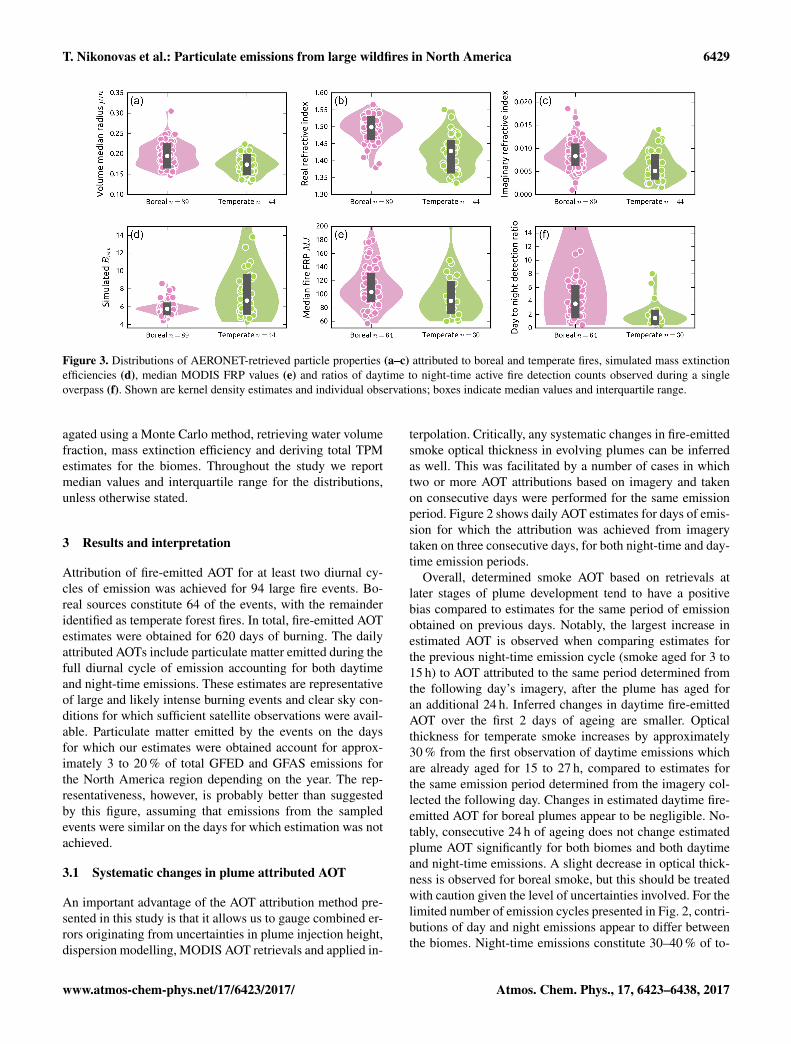
Figure 3. Distributions of AERONET-retrieved particle properties (a–c) attributed to boreal and temperate fires, simulated mass extinctionefficiencies (d), median MODIS FRP values (e) and ratios of daytime to night-time active fire detection counts observed during a singleoverpass (f). Shown are kernel density estimates and individual observations; boxes indicate median values and interquartile range.
agated using a Monte Carlo method, retrieving water volumefraction, mass extinction efficiency and deriving total TPMestimates for the biomes. Throughout the study we reportmedian values and interquartile range for the distributions,unless otherwise stated.
3 Results and interpretation
Attribution of fire-emitted AOT for at least two diurnal cy-cles of emission was achieved for 94 large fire events. Bo-real sources constitute 64 of the events, with the remainderidentified as temperate forest fires. In total, fire-emitted AOTestimates were obtained for 620 days of burning. The dailyattributed AOTs include particulate matter emitted during thefull diurnal cycle of emission accounting for both daytimeand night-time emissions. These estimates are representativeof large and likely intense burning events and clear sky con-ditions for which sufficient satellite observations were avail-able. Particulate matter emitted by the events on the daysfor which our estimates were obtained account for approx-imately 3 to 20 % of total GFED and GFAS emissions forthe North America region depending on the year. The rep-resentativeness, however, is probably better than suggestedby this figure, assuming that emissions from the sampledevents were similar on the days for which estimation was notachieved.
3.1 Systematic changes in plume attributed AOT
An important advantage of the AOT attribution method pre-sented in this study is that it allows us to gauge combined er-rors originating from uncertainties in plume injection height,dispersion modelling, MODIS AOT retrievals and applied in-
terpolation. Critically, any systematic changes in fire-emittedsmoke optical thickness in evolving plumes can be inferredas well. This was facilitated by a number of cases in whichtwo or more AOT attributions based on imagery and takenon consecutive days were performed for the same emissionperiod. Figure 2 shows daily AOT estimates for days of emis-sion for which the attribution was achieved from imagerytaken on three consecutive days, for both night-time and day-time emission periods.
Overall, determined smoke AOT based on retrievals atlater stages of plume development tend to have a positivebias compared to estimates for the same period of emissionobtained on previous days. Notably, the largest increase inestimated AOT is observed when comparing estimates forthe previous night-time emission cycle (smoke aged for 3 to15 h) to AOT attributed to the same period determined fromthe following day’s imagery, after the plume has aged foran additional 24 h. Inferred changes in daytime fire-emittedAOT over the first 2 days of ageing are smaller. Opticalthickness for temperate smoke increases by approximately30 % from the first observation of daytime emissions whichare already aged for 15 to 27 h, compared to estimates forthe same emission period determined from the imagery col-lected the following day. Changes in estimated daytime fire-emitted AOT for boreal plumes appear to be negligible. No-tably, consecutive 24 h of ageing does not change estimatedplume AOT significantly for both biomes and both daytimeand night-time emissions. A slight decrease in optical thick-ness is observed for boreal smoke, but this should be treatedwith caution given the level of uncertainties involved. For thelimited number of emission cycles presented in Fig. 2, contri-butions of day and night emissions appear to differ betweenthe biomes. Night-time emissions constitute 30–40 % of to-
www.atmos-chem-phys.net/17/6423/2017/ Atmos. Chem. Phys., 17, 6423–6438, 2017
6430 T. Nikonovas et al.: Particulate emissions from large wildfires in North America
tal fire-emitted AOT for temperate events. Boreal plumes aredominated by daytime emissions with night-time emissionscomprising under 20 % of total daily AOT. The difference isinfluenced by a larger number of night-time active fire pix-els observed for temperate fires (Fig. 3f) and, consequently,more particles released during the night-time emission periodin the dispersion simulations.
The effect of increasing AOT over time could be in part ex-plained by uncertainty in plume dispersion modelling. How-ever, the modelling error is expected to increase with timeand hence should be manifested by progressively larger dis-agreement and biases for older estimates. In contrast, the re-sults suggest that the agreement between the estimates for thesame emission period is reasonably static across the plumeage categories (Fig. 4b). The bias, on the other hand, isclearly largest for the first and the second plume observa-tions within the first two diurnal cycles. It is possible thatthe model-emitted night-time particles get mixed with sub-sequent daytime emissions during the transport, effectivelyscavenging part of AOT from the other emission periodsduring the attribution. However, the observed daytime AOTtends to increase as well. Additionally, there are significantdifferences in inferred AOT changes between boreal and tem-perate plumes, indicating that some physical processes mightbe driving the change.
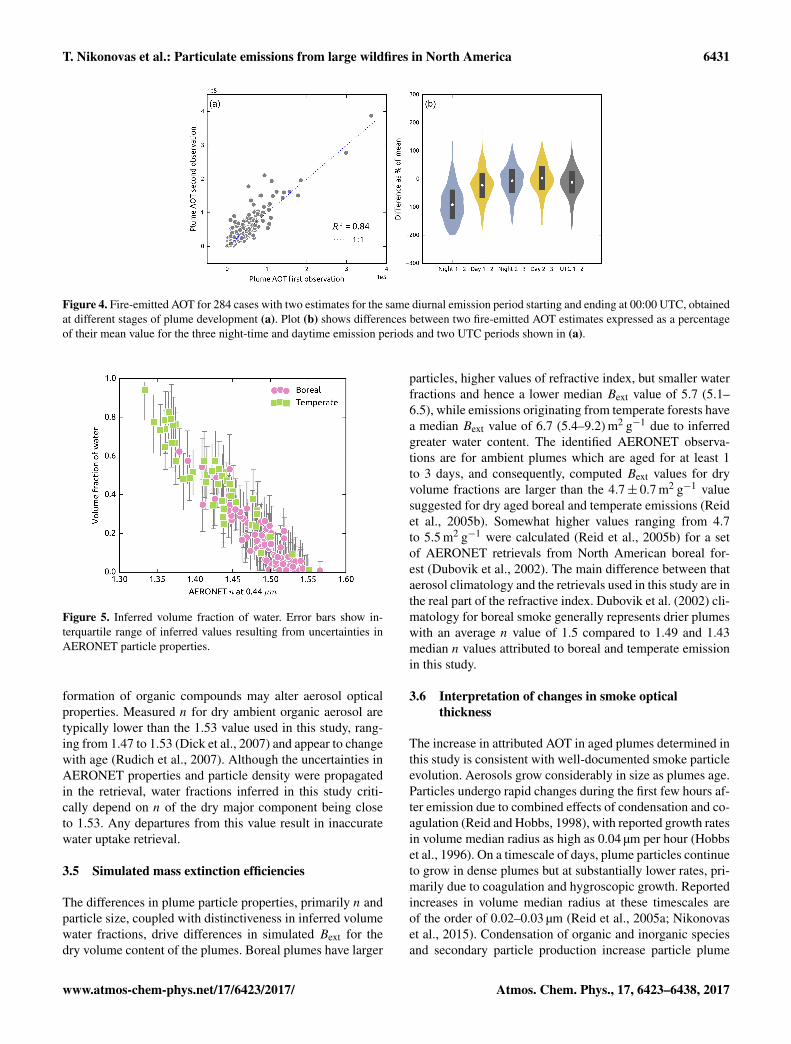
Particulate matter estimation and comparison with othermethods are based on fire-emitted AOT during emission cy-cles starting and ending at 00.00 UTC. For 159 and 125 emis-sion periods for boreal and temperate events respectively,AOT was determined from imagery taken on consecutivedays allowing us to estimate the attribution error. These es-timates do not include the problematic previous night emis-sions. Figure 4a shows the differences in fire-emitted AOTestimates for these cases. Given that the differences are ap-proximately normally distributed, we propagated 50 % onesigma uncertainty in attributed daily fire-emitted AOT to de-rive confidence intervals for TPM emission estimates.
3.2 Fire FRP and daytime–night-time pixel counts
Large and persistent fire events discussed in this study ex-hibit distinctiveness in FRP values and diurnal burning cy-cle. Median MODIS FRP retrieved for the boreal fires is103 (94–117) MW, while median FRP for temperate events is90 (78–103) MW. This suggests higher burning intensity andcombustion rates for boreal fires. A more striking difference,however, emerges when comparing ratios of maximum ac-tive fire pixel counts detected during individual daytime andnight-time satellite overpasses. The proportion of active firesat night are typically much higher for temperate fires. The av-erage daytime to night-time pixel count ratio is 1.4 (1.1–1.9)for the fires in this biome compared to median value of 3.6(1.8–4.8) for boreal fires. Such a pattern indicates a highercontribution of night burning for temperate events.
3.3 Variability in particle properties
The identified AERONET observations of boreal and temper-ate smoke suggest distinctiveness in retrieved size distribu-tions and refractive index (Fig. 3a–c). The selected observa-tions indicate that boreal emissions tend to have larger parti-cles with median volume median radius value of 0.19 (0.17–0.21) compared to 0.17 (0.16–0.19) µm obtained for tem-perate smoke. These differences may be influenced by dif-ferences in combustion phase between the biomes. Very in-tense and predominantly flaming fires emit larger particlesthan events with more important smouldering combustion(Reid et al., 2005a). Substantial differences exist when com-paring the indexes of refraction for boreal and temperatesmoke. Boreal plumes exhibit higher median n value of1.49 (1.47–1.52) in contrast to 1.43 (1.37–1.45) observedfor plumes attributed to temperate forest fires. Although bo-real smoke generally is more absorbing with median k value0.008 (0.007–0.01)i compared to the 0.005 (0.004–0.008)ivalue obtained for temperate emissions, plumes from bothbiomes are only weakly absorbing and characteristic k valueshave a negligible influence on calculated Bext. Variability inthe real part of the refractive index between the plume cate-gories, on the other hand, is larger and indicates differencesin particle chemistry.
3.4 Inferred volume water fractions
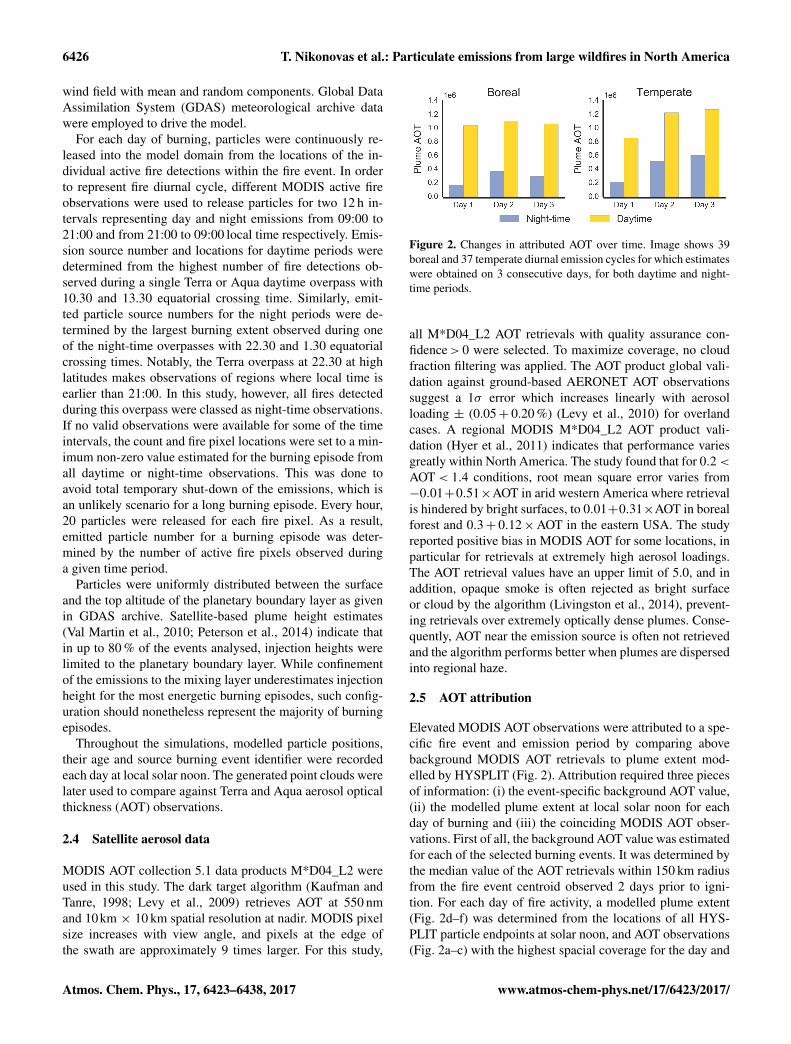
Maxwell Garnett medium approximation calculations usingthe discussed optical constants result in substantially differ-ent inferred water content for the two sources (Fig. 5). Thevariability is mainly driven by the real part of the refractiveindex. Inferred median black carbon fractions are less than1 % for both classes and thus have minimal impact on watercontent retrieval. Median water volume fraction for borealfires is 0.15 (0.1–0.31), whereas temperate plumes have me-dian value of 0.47 (0.29–0.67). The derived values agree withwater volume fractions inferred by Schuster et al. (2009) us-ing a similar approach, although dust was not included asone of the components in our retrieval. Converting the in-ferred median water volume fractions to geometric hygro-scopic growth factors results in values of 1.05 and 1.24 forboreal and temperate plumes respectively. These estimatescompare favourably to measured factors for biomass burningsmoke (Swietlicki et al., 2008), indicating near-hydrophobicparticles for boreal plumes, while temperate smoke couldbe classed as less hygroscopic. Notably, measured geomet-ric hygroscopic growth factors are reported at 90 % relativehumidity. In contrast, water volume fractions inferred in thisstudy are representative of ambient humidity levels, and as aresult direct comparison is not very meaningful.
The main limitations of the presented method are (i) theassumption that aerosols with n≥ 1.53 are dry and (ii) largeuncertainties in the chosen n values and different componentsused in the retrieval. In addition to increasing water content,
Atmos. Chem. Phys., 17, 6423–6438, 2017 www.atmos-chem-phys.net/17/6423/2017/
T. Nikonovas et al.: Particulate emissions from large wildfires in North America 6431
Figure 4. Fire-emitted AOT for 284 cases with two estimates for the same diurnal emission period starting and ending at 00:00 UTC, obtainedat different stages of plume development (a). Plot (b) shows differences between two fire-emitted AOT estimates expressed as a percentageof their mean value for the three night-time and daytime emission periods and two UTC periods shown in (a).
Figure 5. Inferred volume fraction of water. Error bars show in-terquartile range of inferred values resulting from uncertainties inAERONET particle properties.
formation of organic compounds may alter aerosol opticalproperties. Measured n for dry ambient organic aerosol aretypically lower than the 1.53 value used in this study, rang-ing from 1.47 to 1.53 (Dick et al., 2007) and appear to changewith age (Rudich et al., 2007). Although the uncertainties inAERONET properties and particle density were propagatedin the retrieval, water fractions inferred in this study criti-cally depend on n of the dry major component being closeto 1.53. Any departures from this value result in inaccuratewater uptake retrieval.
3.5 Simulated mass extinction efficiencies
The differences in plume particle properties, primarily n andparticle size, coupled with distinctiveness in inferred volumewater fractions, drive differences in simulated Bext for thedry volume content of the plumes. Boreal plumes have larger
particles, higher values of refractive index, but smaller waterfractions and hence a lower median Bext value of 5.7 (5.1–6.5), while emissions originating from temperate forests havea median Bext value of 6.7 (5.4–9.2) m2 g−1 due to inferredgreater water content. The identified AERONET observa-tions are for ambient plumes which are aged for at least 1to 3 days, and consequently, computed Bext values for dryvolume fractions are larger than the 4.7± 0.7 m2 g−1 valuesuggested for dry aged boreal and temperate emissions (Reidet al., 2005b). Somewhat higher values ranging from 4.7to 5.5 m2 g−1 were calculated (Reid et al., 2005b) for a setof AERONET retrievals from North American boreal for-est (Dubovik et al., 2002). The main difference between thataerosol climatology and the retrievals used in this study are inthe real part of the refractive index. Dubovik et al. (2002) cli-matology for boreal smoke generally represents drier plumeswith an average n value of 1.5 compared to 1.49 and 1.43median n values attributed to boreal and temperate emissionin this study.
3.6 Interpretation of changes in smoke opticalthickness
The increase in attributed AOT in aged plumes determined inthis study is consistent with well-documented smoke particleevolution. Aerosols grow considerably in size as plumes age.Particles undergo rapid changes during the first few hours af-ter emission due to combined effects of condensation and co-agulation (Reid and Hobbs, 1998), with reported growth ratesin volume median radius as high as 0.04 µm per hour (Hobbset al., 1996). On a timescale of days, plume particles continueto grow in dense plumes but at substantially lower rates, pri-marily due to coagulation and hygroscopic growth. Reportedincreases in volume median radius at these timescales areof the order of 0.02–0.03 µm (Reid et al., 2005a; Nikonovaset al., 2015). Condensation of organic and inorganic speciesand secondary particle production increase particle plume
www.atmos-chem-phys.net/17/6423/2017/ Atmos. Chem. Phys., 17, 6423–6438, 2017
6432 T. Nikonovas et al.: Particulate emissions from large wildfires in North America
mass, while coagulation only transforms particle distribu-tion. Both processes alter smoke optical thickness, mainly byenlarging scattering cross section and scattering efficiency,which is a strong function of particle size. Condensation hasbeen reported to increase particle mass by up to 30–40 % inAmazonian plumes, but is thought to be important only dur-ing the first 24 h at most (Reid and Hobbs, 1998). The in-ferred increase in fire-emitted AOT over the first 2 days ofageing reported in this current study only partially overlapswith this period. The first few hours of plume developmentwhen condensation is thought to be the most active are notrepresented; therefore condensation is unlikely to contributesignificantly towards the inferred AOT growth. A growth involume median radius of 0.02 µm due to coagulation theoret-ically could increase scattering efficiency by up to 30 % with-out changes in plume mass, but this process cannot explainthe differences in the magnitude of AOT change observedbetween the biomes.
An additional factor driving changes in AOT is water up-take by smoke particles. Absorption of water depends on airrelative humidity and aerosol solubility which in turn tendsto increase with atmospheric processing. It increases particlesize further, enhancing scattering cross section. Hygroscopicgrowth factors measured and inferred by optical methods forbiomass burning smoke at 80 % relative humidity range from1.1 to more than 2 (Kotchenmther and Hobbs, 1998; Kreiden-weis et al., 2001; Magi and Hobbs, 2003). Reid et al. (2005b)suggested an average enhancement factor of 1.35± 0.2. Bextvalues derived for dry volume fraction in this study suggestmedian scattering cross-section enhancement factors of 1.2and 2 for boreal and temperate plumes, assuming the 4.7 Bextvalue for dry smoke (Reid et al., 2005b).
Notably, the magnitude of AOT increase over time, shownin Fig. 2, corresponds to inferred median water fractions forthe two biomes. Temperate emissions exhibit generally hy-drophilic particles with much greater water content, whileboreal plumes seem to contain much less aerosol water. Thisdistinctiveness could be due to different ratios of smoulder-ing and flaming combustion. Field measurements indicatethat prescribed burns, and in particular wildfires in temper-ate regions, have lower combustion efficiencies (Urbanski,2014). Temperate fires discussed in this study have lowermean FRP values and a less pronounced diurnal burning cy-cle, and the emitted plumes have higher ratios of night-timeemissions. Smouldering night-time smoke has been reportedto contain more soluble organic compounds (Hoffer et al.,2006), which could explain the presence of more hydrophilicaerosols in temperate plumes. In addition, factors not ac-counted for in this study, such as significant differences inrelative humidity and atmospheric processing between thebiomes, may be partly responsible for the inferred variabilityin water uptake.
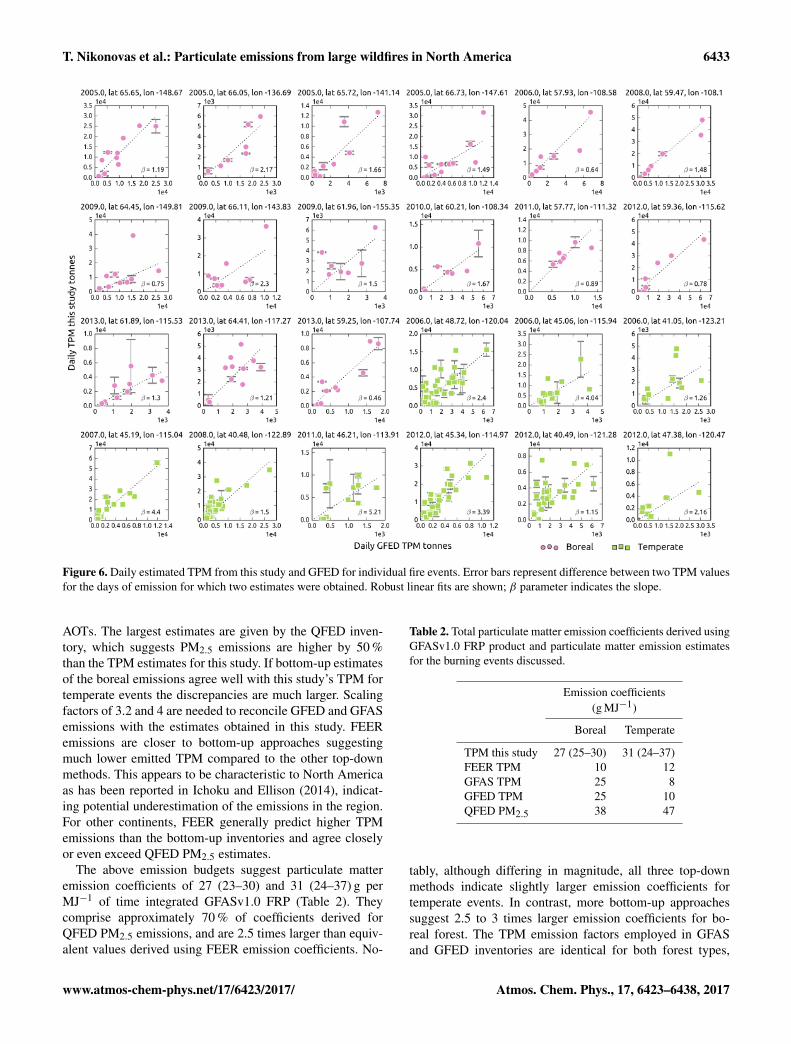
3.7 Daily TPM estimates for individual fires
On an individual event basis the relationships between dailyparticulate emissions given by the global inventories and thisstudy exhibit varying degrees of agreement. Figure 6 showsthe TPM from this study and GFED for the events for whichestimation was performed for at least seven diurnal cycles.Although some fires exhibit only fair or weak agreement,the result is nonetheless encouraging considering the error inAOT attribution and conversion to TPM method in this study,and large uncertainty associated with the date of burn in dailyburned area product (Giglio et al., 2013) on which GFEDdepends. Robust linear fits between GFED TPM and dailyestimated TPM, shown in Fig. 6, indicate considerable vari-ability in slopes, even in comparison to the events with gen-erally good agreement. This suggests distinctive combustionand emission characteristics for individual events. As wellas variability on a per burning event basis, large differencesexist when comparing relationships for fires in boreal andtemperate forests. Notably, for every tonne of GFED TPM,this study shows TPM ranges from 0.46 to over 2 t for bo-real burning events, while for temperate fires the conversionfactors range from approximately 1 to more than 5. The rela-tionships are similar in terms of agreement when comparingdaily TPM estimates with other inventories (not shown), butscaling factors, which are needed to reconcile the estimates,differ.
3.8 Comparison of total emissions and emissioncoefficients
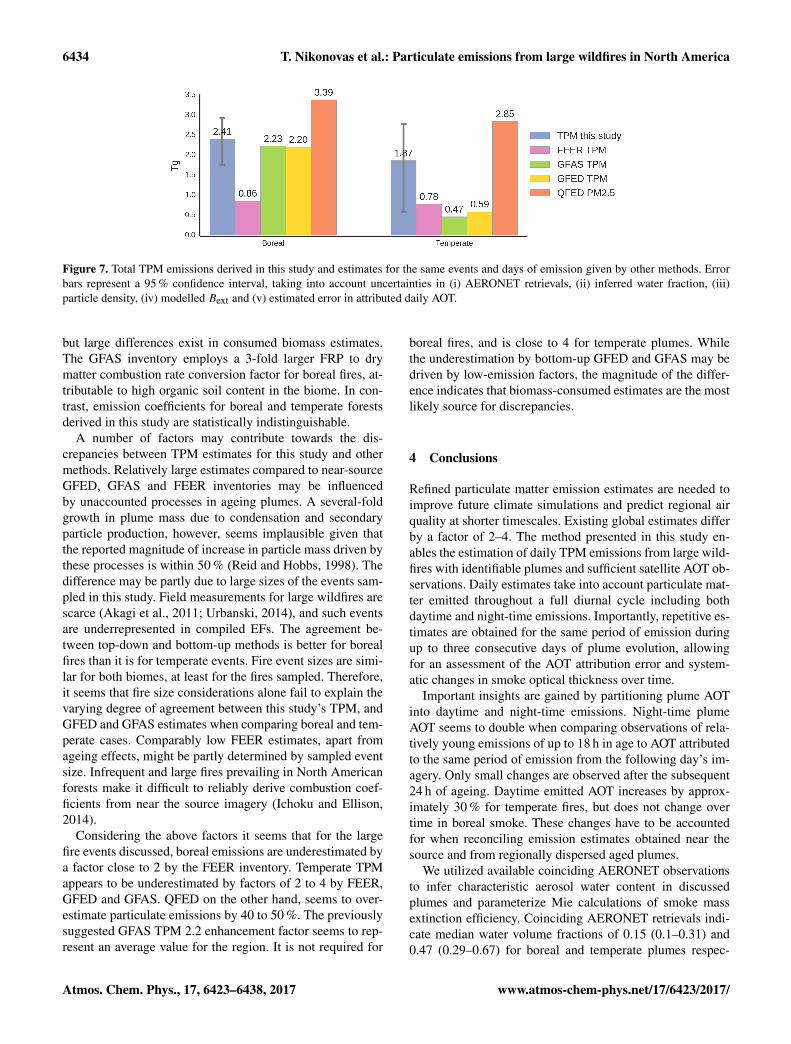
Total TPM emission estimates obtained in this study for thewildfires examined are large in comparison to FEER and,to a lesser degree, to GFED and GFAS inventories, but aresmaller than QFED estimates (Fig. 7). QFED emissions arereported for PM2.5 aerosol fraction only, which typically con-stitutes 70 to 85 % of TPM for the biomes discussed (Akagiet al., 2011). As a result, QFED TPM estimates should beapproximately 20–40 % higher than indicated in Fig. 7.
Substantial differences exist between the estimates for bo-real and temperate fires. For boreal forest events, total TPMemissions for this study are in close agreement with thebottom-up GFED and GFAS TPM estimates. The agreementindicates that application of the proposed 2.2 enhancementfactor (Kaiser et al., 2012) to GFAS TPM would overes-timate boreal emissions for the events discussed. In fact,assuming an increase in aerosol mass and AOT in ageingplumes, boreal TPM emissions for this study are low com-pared the near-source GFED and GFAS estimates. RegionalAOT-based QFED inventory suggests PM2.5 emissions arehigher by 40 %, while near-source FEER TPM estimates aresmaller by a factor of 2.8 when compared to TPM for thisstudy.
For temperate forests, a striking contrast exists betweenGFED and GFAS inventories and methods based on regional
Atmos. Chem. Phys., 17, 6423–6438, 2017 www.atmos-chem-phys.net/17/6423/2017/
T. Nikonovas et al.: Particulate emissions from large wildfires in North America 6433
Figure 6. Daily estimated TPM from this study and GFED for individual fire events. Error bars represent difference between two TPM valuesfor the days of emission for which two estimates were obtained. Robust linear fits are shown; β parameter indicates the slope.
AOTs. The largest estimates are given by the QFED inven-tory, which suggests PM2.5 emissions are higher by 50 %than the TPM estimates for this study. If bottom-up estimatesof the boreal emissions agree well with this study’s TPM fortemperate events the discrepancies are much larger. Scalingfactors of 3.2 and 4 are needed to reconcile GFED and GFASemissions with the estimates obtained in this study. FEERemissions are closer to bottom-up approaches suggestingmuch lower emitted TPM compared to the other top-downmethods. This appears to be characteristic to North Americaas has been reported in Ichoku and Ellison (2014), indicat-ing potential underestimation of the emissions in the region.For other continents, FEER generally predict higher TPMemissions than the bottom-up inventories and agree closelyor even exceed QFED PM2.5 estimates.
The above emission budgets suggest particulate matteremission coefficients of 27 (23–30) and 31 (24–37) g perMJ−1 of time integrated GFASv1.0 FRP (Table 2). Theycomprise approximately 70 % of coefficients derived forQFED PM2.5 emissions, and are 2.5 times larger than equiv-alent values derived using FEER emission coefficients. No-
Table 2. Total particulate matter emission coefficients derived usingGFASv1.0 FRP product and particulate matter emission estimatesfor the burning events discussed.
Emission coefficients(g MJ−1)
Boreal Temperate
TPM this study 27 (25–30) 31 (24–37)FEER TPM 10 12GFAS TPM 25 8GFED TPM 25 10QFED PM2.5 38 47
tably, although differing in magnitude, all three top-downmethods indicate slightly larger emission coefficients fortemperate events. In contrast, more bottom-up approachessuggest 2.5 to 3 times larger emission coefficients for bo-real forest. The TPM emission factors employed in GFASand GFED inventories are identical for both forest types,
www.atmos-chem-phys.net/17/6423/2017/ Atmos. Chem. Phys., 17, 6423–6438, 2017
6434 T. Nikonovas et al.: Particulate emissions from large wildfires in North America
Figure 7. Total TPM emissions derived in this study and estimates for the same events and days of emission given by other methods. Errorbars represent a 95 % confidence interval, taking into account uncertainties in (i) AERONET retrievals, (ii) inferred water fraction, (iii)particle density, (iv) modelled Bext and (v) estimated error in attributed daily AOT.
but large differences exist in consumed biomass estimates.The GFAS inventory employs a 3-fold larger FRP to drymatter combustion rate conversion factor for boreal fires, at-tributable to high organic soil content in the biome. In con-trast, emission coefficients for boreal and temperate forestsderived in this study are statistically indistinguishable.
A number of factors may contribute towards the dis-crepancies between TPM estimates for this study and othermethods. Relatively large estimates compared to near-sourceGFED, GFAS and FEER inventories may be influencedby unaccounted processes in ageing plumes. A several-foldgrowth in plume mass due to condensation and secondaryparticle production, however, seems implausible given thatthe reported magnitude of increase in particle mass driven bythese processes is within 50 % (Reid and Hobbs, 1998). Thedifference may be partly due to large sizes of the events sam-pled in this study. Field measurements for large wildfires arescarce (Akagi et al., 2011; Urbanski, 2014), and such eventsare underrepresented in compiled EFs. The agreement be-tween top-down and bottom-up methods is better for borealfires than it is for temperate events. Fire event sizes are simi-lar for both biomes, at least for the fires sampled. Therefore,it seems that fire size considerations alone fail to explain thevarying degree of agreement between this study’s TPM, andGFED and GFAS estimates when comparing boreal and tem-perate cases. Comparably low FEER estimates, apart fromageing effects, might be partly determined by sampled eventsize. Infrequent and large fires prevailing in North Americanforests make it difficult to reliably derive combustion coef-ficients from near the source imagery (Ichoku and Ellison,2014).
Considering the above factors it seems that for the largefire events discussed, boreal emissions are underestimated bya factor close to 2 by the FEER inventory. Temperate TPMappears to be underestimated by factors of 2 to 4 by FEER,GFED and GFAS. QFED on the other hand, seems to over-estimate particulate emissions by 40 to 50 %. The previouslysuggested GFAS TPM 2.2 enhancement factor seems to rep-resent an average value for the region. It is not required for
boreal fires, and is close to 4 for temperate plumes. Whilethe underestimation by bottom-up GFED and GFAS may bedriven by low-emission factors, the magnitude of the differ-ence indicates that biomass-consumed estimates are the mostlikely source for discrepancies.
4 Conclusions
Refined particulate matter emission estimates are needed toimprove future climate simulations and predict regional airquality at shorter timescales. Existing global estimates differby a factor of 2–4. The method presented in this study en-ables the estimation of daily TPM emissions from large wild-fires with identifiable plumes and sufficient satellite AOT ob-servations. Daily estimates take into account particulate mat-ter emitted throughout a full diurnal cycle including bothdaytime and night-time emissions. Importantly, repetitive es-timates are obtained for the same period of emission duringup to three consecutive days of plume evolution, allowingfor an assessment of the AOT attribution error and system-atic changes in smoke optical thickness over time.
Important insights are gained by partitioning plume AOTinto daytime and night-time emissions. Night-time plumeAOT seems to double when comparing observations of rela-tively young emissions of up to 18 h in age to AOT attributedto the same period of emission from the following day’s im-agery. Only small changes are observed after the subsequent24 h of ageing. Daytime emitted AOT increases by approx-imately 30 % for temperate fires, but does not change overtime in boreal smoke. These changes have to be accountedfor when reconciling emission estimates obtained near thesource and from regionally dispersed aged plumes.
We utilized available coinciding AERONET observationsto infer characteristic aerosol water content in discussedplumes and parameterize Mie calculations of smoke massextinction efficiency. Coinciding AERONET retrievals indi-cate median water volume fractions of 0.15 (0.1–0.31) and0.47 (0.29–0.67) for boreal and temperate plumes respec-
Atmos. Chem. Phys., 17, 6423–6438, 2017 www.atmos-chem-phys.net/17/6423/2017/
T. Nikonovas et al.: Particulate emissions from large wildfires in North America 6435
tively. Calculated Bext of the dry particle fraction suggestmedian values of 5.7 (5.1–6.5) and 6.5 (5.5–9.2) m2 g−1 forthe two plume categories. The inferred water fractions indi-cate that hygroscopic growth accounts for the majority of theobserved increase in plume optical thickness.
Daily total particulate matter emissions determined usingsimulated Bext indicate differences in agreement with otherinventories for the two forest type fires. For boreal fires,which have higher median FRP values and burn predomi-nantly during the daytime, TPM estimates agree closely withGFED and GFAS inventories, are higher by a factor of 2compared to FEER and are lower by 30 % than QFED PM2.5estimates. For temperate events, which are characterized bysmall changes in active fire pixel count throughout the diur-nal cycle and generally lower median FRP values, the dis-crepancies are larger. Our TPM estimates are lower thanQFED PM2.5 by 35 %, and higher by factors of 4, 3.2 and2.4 compared to GFAS, GFED and FEER TPM estimates forthe same emission events. The previously suggested scalingfactor of 2.2 for GFAS particulate emissions is not requiredfor boreal fires, but is too small for temperate events.
The large fire event bias and rapid ageing effects unac-counted for in this study could drive part of the difference,but are unlikely to explain all of it. Low FEER TPM forthe discussed events could be attributed to these factors to alarger extent. The comparison of TPM obtained in this studyto GFAS and GFED, however, suggest that TPM emissionfactors and consumed biomass estimates are underestimatedfor temperate fires within the bottom-up data sets.
Data availability. The results data set used for the interpretationsis provided in the Supplement. HYSPLIT dispersion simulationdata can be provided upon request to the corresponding authorTadas Nikonovas ([email protected]). Note that the simulationresults will be available for a limited time after the paper publica-tion.
The Supplement related to this article is available onlineat doi:10.5194/acp-17-6423-2017-supplement.
Competing interests. The authors declare that they have no conflictof interest.
Acknowledgements. This research was supported by the NaturalEnvironment Research Council (NERC) (Grant NE4/D501177/1).The authors gratefully acknowledge the AERONET team for theireffort in establishing and maintaining the network, and for the dataprovision. They thank NOAA Air Resources Laboratory (ARL)for the provision of the HYSPLIT transport and dispersion model.They further thank people at the University of Maryland and NASAFire Information for Resource Management System for creatingand providing active fire location data set MCD14ML, NASAAtmosphere Archive and Distribution System for providing AOT
products M*D04_L2, and teams behind GFED, GFAS, FEER andQFED emission inventories for producing and making the data setsavailable.
Edited by: A. DastoorReviewed by: two anonymous referees
References
Akagi, S. K., Yokelson, R. J., Wiedinmyer, C., Alvarado, M. J.,Reid, J. S., Karl, T., Crounse, J. D., and Wennberg, P. O.: Emis-sion factors for open and domestic biomass burning for usein atmospheric models, Atmos. Chem. Phys., 11, 4039–4072,doi:10.5194/acp-11-4039-2011, 2011.
Andreae, M. O. and Merlet, P.: Emission of trace gases and aerosolsfrom biomass burning, Global Biogeochem. Cy., 15, 955–966,doi:10.1029/2000GB001382, 2001.
Arola, A., Schuster, G., Myhre, G., Kazadzis, S., Dey, S., andTripathi, S. N.: Inferring absorbing organic carbon contentfrom AERONET data, Atmos. Chem. Phys., 11, 215–225,doi:10.5194/acp-11-215-2011, 2011.
Bohren, C. F. and Huffman, D. R.: Absorption and scattering oflight by small particles, John Wiley & Sons, New York, 1983.
Bond, T. C. and Bergstrom, R. W.: Light absorption by carbona-ceous particles: an investigative review, Aerosol Sci. Tech., 40,27–67, 2006.
Bond, T. C., Doherty, S. J., Fahey, D. W., Forster, P. M., Berntsen,T., DeAngelo, B. J., Flanner, M. G., Ghan, S., Kärcher, B., Koch,D., Kinne, S., Kondo, Y., Quinn, P. K., Sarofim, M. C., Schultz,M. G., Schulz, M., Venkataraman, C., Zhang, H., Zhang, S.,Bellouin, N., Guttikunda, S. K., Hopke, P. K., Jacobson, M.Z., Kaiser, J. W., Klimont, Z., Lohmann, U., Schwarz, J. P.,Shindell, D., Storelvmo, T., Warren, S. G., and Zender, C. S.:Bounding the role of black carbon in the climate system: a sci-entific assessment, J. Geophys. Res.-Atmos., 118, 5380–5552,doi:10.1002/jgrd.50171, 2013.
Brock, C. A., Cozic, J., Bahreini, R., Froyd, K. D., Middlebrook,A. M., McComiskey, A., Brioude, J., Cooper, O. R., Stohl, A.,Aikin, K. C., de Gouw, J. A., Fahey, D. W., Ferrare, R. A.,Gao, R.-S., Gore, W., Holloway, J. S., Hübler, G., Jefferson, A.,Lack, D. A., Lance, S., Moore, R. H., Murphy, D. M., Nenes,A., Novelli, P. C., Nowak, J. B., Ogren, J. A., Peischl, J., Pierce,R. B., Pilewskie, P., Quinn, P. K., Ryerson, T. B., Schmidt, K.S., Schwarz, J. P., Sodemann, H., Spackman, J. R., Stark, H.,Thomson, D. S., Thornberry, T., Veres, P., Watts, L. A., Warneke,C., and Wollny, A. G.: Characteristics, sources, and transport ofaerosols measured in spring 2008 during the aerosol, radiation,and cloud processes affecting Arctic Climate (ARCPAC) Project,Atmos. Chem. Phys., 11, 2423–2453, doi:10.5194/acp-11-2423-2011, 2011.
Chand, D., Guyon, P., Artaxo, P., Schmid, O., Frank, G. P., Rizzo,L. V., Mayol-Bracero, O. L., Gatti, L. V., and Andreae, M.O.: Optical and physical properties of aerosols in the bound-ary layer and free troposphere over the Amazon Basin duringthe biomass burning season, Atmos. Chem. Phys., 6, 2911–2925,doi:10.5194/acp-6-2911-2006, 2006.
Colarco, P., Schoeberl, M., Doddridge, B., Marufu, L., Torres, O.,and Welton, E.: Transport of smoke from Canadian forest fires to
www.atmos-chem-phys.net/17/6423/2017/ Atmos. Chem. Phys., 17, 6423–6438, 2017
6436 T. Nikonovas et al.: Particulate emissions from large wildfires in North America
the surface near Washington, DC: injection height, entrainment,and optical properties, J. Geophys. Res.-Atmos., 109, D06203,doi:10.1029/2003JD004248, 2004.
Dahlkötter, F., Gysel, M., Sauer, D., Minikin, A., Baumann, R.,Seifert, P., Ansmann, A., Fromm, M., Voigt, C., and Weinzierl,B.: The Pagami Creek smoke plume after long-range transportto the upper troposphere over Europe – aerosol properties andblack carbon mixing state, Atmos. Chem. Phys., 14, 6111–6137,doi:10.5194/acp-14-6111-2014, 2014.
Damoah, R., Spichtinger, N., Forster, C., James, P., Mattis, I.,Wandinger, U., Beirle, S., Wagner, T., and Stohl, A.: Aroundthe world in 17 days – hemispheric-scale transport of forest firesmoke from Russia in May 2003, Atmos. Chem. Phys., 4, 1311–1321, doi:10.5194/acp-4-1311-2004, 2004.
Darmenov, A. and da Silva, A.: The Quick Fire EmissionsDataset (QFED): Documentation of versions 2.1, 2.2 and 2.4.NASA/TM-2015-104606, 38, available at: http://gmao.gsfc.nasa.gov/pubs/docs/Darmenov796.pdf, last access: 1 December 2015.
Dick, W. D., Ziemann, P. J., and McMurry, P. H.: Multiangle light-scattering measurements of refractive index of submicron atmo-spheric particles, Aerosol Sci. Tech., 41, 549–569, 2007.
Draxler, R. and Rolph, G.: HYSPLIT (HYbrid Single-Particle La-grangian Integrated Trajectory) model access via NOAA ARLREADY website, available at: http://www.arl.noaa.gov/ready/hysplit4.html (last access: 17 December 2014), NOAA Air Re-sources Laboratory, Silver Spring, 2003.
Dubovik, O. and King, M. D.: a flexible inversion algorithm for re-trieval of aerosol optical properties from Sun and sky radiancemeasurements, J. Geophys. Res.-Atmos., 105, 20673–20696,2000.
Dubovik, O., Smirnov, A., Holben, B., King, M., Kaufman, Y.,Eck, T., and Slutsker, I.: Accuracy assessments of aerosol opticalproperties retrieved from Aerosol Robotic Network (AERONET)Sun and sky radiance measurements, J. Geophys. Res.-Atmos.,105, 9791–9806, 2000.
Dubovik, O., Holben, B., Eck, T. F., Smirnov, A., Kaufman, Y. J.,King, M. D., Tanre, D., and Slutsker, I.: Variability of absorptionand optical properties of key aerosol types observed in world-wide locations, J. Atmos. Sci., 59, 590–608, 2002.
Dubovik, O., Lapyonok, T., Kaufman, Y. J., Chin, M., Ginoux, P.,Kahn, R. A., and Sinyuk, A.: Retrieving global aerosol sourcesfrom satellites using inverse modeling, Atmos. Chem. Phys., 8,209–250, doi:10.5194/acp-8-209-2008, 2008.
French, N. H. F., Goovaerts, P., and Kasischke, E. S.: Uncertainty inestimating carbon emissions from boreal forest fires, J. Geophys.Res.-Atmos., 109, doi:10.1029/2003JD003635, 2004.
Giglio, L., Csiszar, I., and Justice, C. O.: Global distribution andseasonality of active fires as observed with the Terra and AquaModerate Resolution Imaging Spectroradiometer (MODIS) sen-sors, J. Geophys. Res., 111, doi:10.1029/2005JG000142, 2006.
Giglio, L., Randerson, J. T., and Van der Werf, G. R.: Analy-sis of daily, monthly, and annual burned area using the fourth-generation global fire emissions database (GFED4), J. Geophys.Res., 118, 317–328, doi:10.1002/jgrg.20042, 2013.
Hobbs, P. V., Reid, J. S., Herring, J. A., Nance, J. D., andWeiss, R. E.: Particle and Trace-Gas Measurements in the Smokefrom Prescribed Burns of Forest Products in the Pacific North-west, in: Biomass Burning and Global Change, Vol. 1, edited by:Levine, J. S., MIT Press, New York, 1006, 697–715, 1996.
Hoffer, A., Gelencsér, A., Guyon, P., Kiss, G., Schmid, O., Frank,G. P., Artaxo, P., and Andreae, M. O.: Optical properties ofhumic-like substances (HULIS) in biomass-burning aerosols, At-mos. Chem. Phys., 6, 3563–3570, doi:10.5194/acp-6-3563-2006,2006.
Holben, B., Eck, T., Slutsker, I., Tanre, D., Buis, J., Setzer, A., Ver-mote, E., Reagan, J., Kaufman, Y., Nakajima, T., Lavenu, F.,Jankowiak, I., and Smirnov, A.: AERONET a federated instru-ment network and data archive for aerosol characterization, Re-mote Sens. Environ., 66, 1–16, 1998.
Hyer, E. J. and Reid, J. S.: Baseline uncertainties in biomass burn-ing emission models resulting from spatial error in satelliteactive fire location data, J. Geophys. Res. Lett., 36, L05802,doi:10.1029/2008GL036767, 2009.
Hyer, E. J., Reid, J. S., and Zhang, J.: An over-land aerosol opti-cal depth data set for data assimilation by filtering, correction,and aggregation of MODIS Collection 5 optical depth retrievals,Atmos. Meas. Tech., 4, 379–408, doi:10.5194/amt-4-379-2011,2011.
Ichoku, C. and Ellison, L.: Global top-down smoke-aerosol emis-sions estimation using satellite fire radiative power measure-ments, Atmos. Chem. Phys., 14, 6643–6667, doi:10.5194/acp-14-6643-2014, 2014.
Ichoku, C. and Kaufman, Y. J.: a method to derive smokeemission rates from MODIS fire radiative energy mea-surements, IEEE T. Geosci. Remote, 43, 2636–2649,doi:10.1109/TGRS.2005.857328, 2005.
Janhäll, S., Andreae, M. O., and Pöschl, U.: Biomass burningaerosol emissions from vegetation fires: particle number andmass emission factors and size distributions, Atmos. Chem.Phys., 10, 1427–1439, doi:10.5194/acp-10-1427-2010, 2010.
Johnston, F. H., Henderson, S. B., Chen, Y., Randerson, J. T.,Marlier, M., DeFries, R. S., Kinney, P., Bowman, D. M., andBrauer, M.: Estimated global mortality attributable to smokefrom landscape fires, Environ. Health Persp., 120, 695–701,2012.
Kaiser, J. W., Heil, A., Andreae, M. O., Benedetti, A., Chubarova,N., Jones, L., Morcrette, J.-J., Razinger, M., Schultz, M. G.,Suttie, M., and van der Werf, G. R.: Biomass burning emis-sions estimated with a global fire assimilation system basedon observed fire radiative power, Biogeosciences, 9, 527–554,doi:10.5194/bg-9-527-2012, 2012.
Kasischke, E. S., Williams, D., and Barry, D.: Analysis of the pat-terns of large fires in the boreal forest region of Alaska, Int. J.Wildland Fire, 11, 131–144, 2002.
Kaufman, Y. J. and Tanre, D.: Algorithm for remote sensing of tro-pospheric aerosol from MODIS, NASA MODIS Algorithm The-oretical Basis Document, Goddard Space Flight Center, Green-belt, Md, 85 pp., 1998.
Kirchstetter, T. W., Novakov, T., and Hobbs, P. V.: Evidence that thespectral dependence of light absorption by aerosols is affectedby organic carbon, J. Geophys. Res.-Atmos., 109, D21208,doi:10.1029/2004JD004999, 2004.
Kotchenmther, R. A. and Hobbs, P. V.: Humidification factors ofaerosols from biomass burning, J. Geophys. Res.-Atmos., 104,2239–2251, 1998.
Kreidenweis, S. M., Remer, L. A., Bruintjes, R., and Dubovik, O.:Smoke aerosol from biomass burning in Mexico: Hygroscopic
Atmos. Chem. Phys., 17, 6423–6438, 2017 www.atmos-chem-phys.net/17/6423/2017/
T. Nikonovas et al.: Particulate emissions from large wildfires in North America 6437
smoke optical model, J. Geophys. Res.-Atmos., 106, 4831–4844,doi:10.1029/2000JD900488, 2001.
Langmann, B., Duncan, B., Textor, C., Trentmann, J., and van derWerf, G. R.: Vegetation fire emissions and their impact on airpollution and climate, Atmos. Environ., 43, 107–116, 2009.
Levy, R. C., Remer, L. A., Tanre, D., Mattoo, S., and Kaufman, Y. J.:Algorithm for Remote Sensing of Tropospheric Aerosol overDark Targets from MODIS: Collections 005 and 051: Revision2, February 2009, available at: http://modis-atmos.gsfc.nasa.gov/_docs/ATBD_MOD04_C005_rev2.pdf (last access: 24 February2015), 2009.
Levy, R. C., Remer, L. A., Kleidman, R. G., Mattoo, S., Ichoku,C., Kahn, R., and Eck, T. F.: Global evaluation of the Collection5 MODIS dark-target aerosol products over land, Atmos. Chem.Phys., 10, 10399–10420, doi:10.5194/acp-10-10399-2010, 2010.
Livingston, J. M., Redemann, J., Shinozuka, Y., Johnson, R., Rus-sell, P. B., Zhang, Q., Mattoo, S., Remer, L., Levy, R., Munchak,L., and Ramachandran, S.: Comparison of MODIS 3 km and10 km resolution aerosol optical depth retrievals over land withairborne sunphotometer measurements during ARCTAS summer2008, Atmos. Chem. Phys., 14, 2015–2038, doi:10.5194/acp-14-2015-2014, 2014.
Liu, Y., Stanturf, J., and Scott, G.: Trends in global wildfire potentialin a changing climate, Forest Ecol. Manag., 259, 685–697,2013.
Magi, B. I. and Hobbs, P. V.: Effects of humidity on aerosols insouthern Africa during the biomass burning season, J. Geophys.Res.-Atmos., 108, 2156–2202, 2003
Nikonovas, T., North, P. R. J., and Doerr, S. H.: Smoke aerosolproperties and ageing effects for northern temperate and bo-real regions derived from AERONET source and age attribution,Atmos. Chem. Phys., 15, 7929–7943, doi:10.5194/acp-15-7929-2015, 2015.
O’Neill, N. T., Eck, T. F., Holben, B. N., Smirnov, A., Royer, A.,and Li, Z.: Optical properties of boreal forest fire smoke derivedfrom Sun photometry, J. Geophys. Res.-Atmos., 107, AAC 6-1–AAC 6-19, doi:10.1029/2001JD000877, 2002.
Peterson, D., Hyer, E., and Wang, J.: Quantifying the potentialfor high-altitude smoke injection in the North American borealforest using the standard MODIS fire products and subpixel-based methods, J. Geophys. Res.-Atmos., 119, 3401–3419,doi:10.1002/2013JD021067, 2014.
Randerson, J. T., Chen, Y., Van der Werf, G. R., Rogers, B. M.,and Morton, D. C.: Global burned area and biomass burningemissions from small fires, J. Geophys. Res., 117, G04012,doi:10.1029/2012JG002128, 2012.
Reid, J. S., Koppmann, R., Eck, T. F., and Eleuterio, D. P.: A reviewof biomass burning emissions part II: intensive physical proper-ties of biomass burning particles, Atmos. Chem. Phys., 5, 799–825, doi:10.5194/acp-5-799-2005, 2005a.
Reid, J. S., Eck, T. F., Christopher, S. A., Koppmann, R., Dubovik,O., Eleuterio, D. P., Holben, B. N., Reid, E. A., and Zhang, J.:A review of biomass burning emissions part III: intensive opticalproperties of biomass burning particles, Atmos. Chem. Phys., 5,827–849, doi:10.5194/acp-5-827-2005, 2005b.
Reid, J. S. and Hobbs, P. V.: Physical and optical properties of youngsmoke from individual biomass fires in Brazil, J. Geophys. Res.-Atmos., 103, 32013–32030, 1998.
Rudich, Y., Donahue, N. M., and Mentel, T. F.: Aging of organicaerosol: Bridging the gap between laboratory and field studies,Annu. Rev. Phys. Chem., 58, 321–352, 2007.
Saide, P. E., Peterson, D. A., da Silva, A., Anderson, B., Ziemba,L. D., Diskin, G., Sachse, G., Hair, J., Butler, C., Fenn, M.,Jimenez, J. L., Campuzano-Jost, P., Perring, A. E., Schwarz, J.P., Markovic, M. Z., Russell, P., Redemann, J., Shinozuka, Y.,Streets, D. G., Yan, F., Dibb, J., Yokelson, R., Toon, O. B.,Hyer, E., and Carmichael, G. R.: Revealing important noctur-nal and day-to-day variations in fire smoke emissions througha multiplatform inversion, Geophys. Res. Lett., 42, 3609–3618,doi:10.1002/2015GL063737, 2015.
Schuster, G. L., Dubovik, O., Holben, B. N., and Clothiaux, E.E.: Inferring black carbon content and specific absorption fromAerosol Robotic Network (AERONET) aerosol retrievals, J.Geoph. Res.-Atmos., 110, doi:10.1029/2004JD004548, 2005.
Schuster, G. L., Lin, B., and Dubovik, O.: Remote sensingof aerosol water uptake, Geophys. Res. Lett., 36, L03814,doi:10.1029/2008GL036576, 2009.
Schuster, G. L., Dubovik, O., and Arola, A.: Remote sensing ofsoot carbon – Part 1: Distinguishing different absorbing aerosolspecies, Atmos. Chem. Phys., 16, 1565–1585, doi:10.5194/acp-16-1565-2016, 2016.
Stocks, B. J., Mason, J. A., Todd, J. B., Bosch, E. M., Wotton,B. M., Amiro, B. D., Flannigan, M. D., Hirsch, K. G., Logan,K. A., Martell, D. L., and Skinner, W. R.: Large forest firesin Canada, 1959–1997, J. Geophys. Res.-Atmos., 107, 8149,doi:10.1029/2001JD000484, 2002.
Strauss, D., Bednar, L., and Mees, R.: Do one percent of the forestfires cause ninety-nine percent of the damage?, Forest Sci., 35,319–328, 1989.
Swietlicki, E., Hansson, H.-C., Hämeri, K., Svenningsson, B.,Massling, A., Mcfiggans, G., Mcmurry, P. H., Petäjä, T., Tunved,P., Gysel, M., Topping, D., Weingartner, E., Baltensperger,U., Rissler, J., Wiedensohler, A., and Kulmala, M.: Hygro-scopic properties of submicrometer atmospheric aerosol parti-cles measured with H-TDMA instruments in various environ-ments – a review, Tellus B, 60, 432–469, doi:10.1111/j.1600-0889.2008.00350.x, 2008.
Toon, O. B., Pollack, J. B., and Khare, B. N.: The optical constantsof several atmospheric aerosol species: Ammonium sulfate, alu-minum oxide, and sodium chloride, J. Geophys. Res., 81, 5733–5748, doi:10.1029/JC081i033p05733, 1976.
Turetsky, M., R., Benscoter, B., Page, S., Rein, G., Van derWerf, G. R., and Watts, A.: Global vulnerability of peatlands tofire and carbon loss, Nat. Geosci., 8, 11–14, 2015.
Turpin, B. J. and Lim, H.: Species Contributions to PM2.5Mass Concentrations: Revisiting Common Assumptions forEstimating Organic Mass, Aerosol Sci. Tech., 35, 602–610,doi:10.1080/02786820119445, 2001.
Urbanski, S.: Wildland fire emissions, carbon, and cli-mate: Emission factors, Forest Ecol. Manag., 317, 51–60,doi:10.1016/j.foreco.2013.05.045, 2014.
Val Martin, M., Logan, J. A., Kahn, R. A., Leung, F.-Y., Nelson,D. L., and Diner, D. J.: Smoke injection heights from fires inNorth America: analysis of 5 years of satellite observations, At-mos. Chem. Phys., 10, 1491–1510, doi:10.5194/acp-10-1491-2010, 2010.
www.atmos-chem-phys.net/17/6423/2017/ Atmos. Chem. Phys., 17, 6423–6438, 2017
6438 T. Nikonovas et al.: Particulate emissions from large wildfires in North America
van der Werf, G. R., Randerson, J. T., Giglio, L., Collatz, G. J., Mu,M., Kasibhatla, P. S., Morton, D. C., DeFries, R. S., Jin, Y., andvan Leeuwen, T. T.: Global fire emissions and the contribution ofdeforestation, savanna, forest, agricultural, and peat fires (1997–2009), Atmos. Chem. Phys., 10, 11707–11735, doi:10.5194/acp-10-11707-2010, 2010.
van Leeuwen, T. T. and van der Werf, G. R.: Spatial and tempo-ral variability in the ratio of trace gases emitted from biomassburning, Atmos. Chem. Phys., 11, 3611–3629, doi:10.5194/acp-11-3611-2011, 2011.
van Leeuwen, T. T., van der Werf, G. R., Hoffmann, A. A., Detmers,R. G., Rücker, G., French, N. H. F., Archibald, S., Carvalho Jr.,J. A., Cook, G. D., de Groot, W. J., Hély, C., Kasischke, E. S.,Kloster, S., McCarty, J. L., Pettinari, M. L., Savadogo, P., Al-varado, E. C., Boschetti, L., Manuri, S., Meyer, C. P., Siegert,F., Trollope, L. A., and Trollope, W. S. W.: Biomass burningfuel consumption rates: a field measurement database, Biogeo-sciences, 11, 7305–7329, doi:10.5194/bg-11-7305-2014, 2014.
Wooster, M. J., Zhukov, B., and Oertel, D.: Fire radiative en-ergy for quantitative study of biomass burning: derivationfrom the {BIRD} experimental satellite and comparison to{MODIS} fire products, Remote Sens. Environ., 86, 83–107,doi:10.1016/S0034-4257(03)00070-1, 2003.
Wooster, M. J., Roberts, G., Perry, G. L. W., and Kaufman,Y. J.: Retrieval of biomass combustion rates and totals fromfire radiative power observations: FRP derivation and calibra-tion relationships between biomass consumption and fire ra-diative energy release, J. Geophys. Res.-Atmos., 110, D24311,doi:10.1029/2005JD006318, 2005.
Atmos. Chem. Phys., 17, 6423–6438, 2017 www.atmos-chem-phys.net/17/6423/2017/