particle tracking microrheology of purified gastrointestinal mucins
TRANSCRIPT
Particle Tracking Microrheology of Purified
Gastrointestinal Mucins
Pantelis Georgiades1,2
, Paul D. A. Pudney3, David J. Thornton
2*, Thomas
Waigh1,4+
1Biological Physics, Department of Physics and Astronomy, University of Manchester,
Manchester, M60 1QD, United Kingdom, 2Faculty of Life Sciences, Michael Smith Building,
University of Manchester, Oxford Road, Manchester, M13 9PT, United Kingdom, 3Unilever
Discover, Colworth Park, Shambrook, Bedfordshire MK44 1LQ, United Kingdom. 4Photon
Science Institute, University of Manchester, Oxford Road, Manchester, M60 1QD.
Keywords: mucin, rheology, gastric, intestinal, particle tracking, polyphenol, EGCG
The rheological characteristics of gastric and duodenal mucin solutions, the building blocks
of the mucus layer that covers the epithelia of the two organs, were investigated using particle
tracking microrheology. We used biochemically well characterised purified porcine mucins
(MUC5AC and MUC2) as models for human mucins, to probe their viscoelasticity as a
function of mucin concentration and pH. Furthermore, we used both reducing (dithiothreitol,
DTT) and chaotropic agents (guanidinium chloride and urea) to probe the mesoscopic forces
that mediate the integrity of the polymer network. At neutral pH both gastric and duodenal
mucins formed self-assembled semi-dilute networks above a certain critical mucin
concentration (c*) with the viscosity (η) scaling as �~��.����.�for MUC5AC and
�~��.����.� for MUC2, where c is the mucin concentration. Above an even higher mucin
concentration threshold (ce, the entanglement concentration) reptation occurs and there is a
Biopolymers
This article has been accepted for publication and undergone full peer review but has not beenthrough the copyediting, typesetting, pagination and proofreading process which may lead todifferences between this version and the Version of Record. Please cite this article as an‘Accepted Article’, doi: 10.1002/bip.22372© 2013 Wiley Periodicals, Inc.
2
dramatic increase in the viscosity scaling, �~��.����.� for MUC5AC and �~��. ��. for
MUC2. The dynamics of the self-assembled comb polymers is examined in terms of a scaling
model for flexible polyelectrolyte combs. Both duodenum and gastric mucin are found to be
pH switchable gels, gelation occurring at low pHs. There is a hundred-fold increase in the
elastic shear modulus once the pH is decreased. The addition of DTT, guanidinium chloride
and urea disassembles both the semi-dilute and gel structures causing a large increase in the
compliance (decrease in their shear moduli). Addition of the polyphenol EGCG has a reverse
effect on mucin viscoelasticity i.e. it triggers a sol-gel transition in semi-dilute mucin
solutions at neutral pH.
Page 2 of 54
John Wiley & Sons, Inc.
Biopolymers
3
1. Introduction
Mucus is a secreted viscoelastic fluid that lines the epithelium of the eye, respiratory,
gastrointestinal and urogenital tracts. The functions of mucus vary between the different
mucosal surfaces that it is found on. Mucus primarily acts as the first line of protection
against toxins, foreign particles and pathogens at the exposed mucosal surfaces, while its
other main role is mechanical, to reduce friction at the mucosal surfaces, by moving the plane
of shear away from the surface. In addition to the aforementioned general properties, mucus
also acts as a selective barrier, for example in the intestine, where it accommodates a colossal
number of bacteria and micro-organisms responsible for breaking down nutrients, while
allowing those nutrients to diffuse through it and be absorbed. In the stomach, mucus faces a
difficult challenge. During active digestion, gastric juices are formed in the stomach, which
are highly acidic to aid with protein digestion. The role of mucus is to form a pH gradient
ranging from neutral on the epithelium to pH 1-2 in the gastric lumen, to protect the stomach
walls from ingesting foreign particles, being damaged by the acidic conditions and preventing
the stomach from digesting itself.1–6
The major components of mucus are water (95%), immunoglobulins, cholesterol, lipids,
inorganic salts, proteins and the high molecular weight (Mw ranges from 2-3 MDa to tens of
MDa for secreted oligomers) glycoproteins known as mucins, which provide the structural
matrix from which the protective properties of the mucus layer are derived.7 There are two
main classes of mucins found in the human body; the secreted forms which are either
polymerising or nonpolymerising, and the cell-tethered forms1. The focus of the current work
is on polymerising secreted mucins, which are synthesized and secreted by specialised cells
found in the epithelium (goblet cells) and submucosal glands (mucous cells). These complex
O-linked glycoproteins are characterised by at least one large region of the polypeptide which
Page 3 of 54
John Wiley & Sons, Inc.
Biopolymers
4
is rich in serine, threonine and proline residues, called the STP-region or mucin domain1.
These mucin domains act as sites for covalent attachment of O-linked oligosaccharides,
resulting in extensive glycosylation and up to 70% of the molecule’s weight is accounted for
by carbohydrates. Furthermore, a common characteristic of polymerising secreted mucins is
the presence of cysteine-rich domains at their N- and C- termini that mediate disulphide
bonding between monomers, allowing the formation of disulphide linked polymeric
assemblies.1
The large size and complex chemical composition of mucins has made the characterisation of
their structure and physical properties in solution a difficult task for researchers. Previous
studies have concluded that isolated gastric and duodenal mucins share a common
mechanism for gel-formation and noncovalent interactions between the carbohydrate chains
contribute to the formation of the gel-network.8 Isolated porcine gastric mucins (PGM) have
been shown to adopt an isotropic random coil conformation in a dilute solution of neutral pH,
with most of the fibres ranging from 200-600 nm in length. When the pH of isolated
MUC5AC solutions was decreased below pH 4 a sol-gel transition is reported,3 which is
believed to be the result of the protonation of the carboxylates of the salt bridges, which
allows the unfolding and exposure of the protein’s hydrophobic regions. This leads to a
conformational transition of the molecule to an extended anisotropic random coil
configuration.9
Here we use isolated porcine gastric and duodenal mucins as biochemically well
characterised models for human mucins, to investigate the scaling of the viscoelasticity of the
materials in aqueous solutions. Viscoelasticity is a key physical property that determines the
behaviour of these materials in the stomach and intestines. For example, the microflora in the
stomach is required to swim through these materials during their life cycle.10
Viscoelasticity
Page 4 of 54
John Wiley & Sons, Inc.
Biopolymers
5
of materials is intimately related to the dynamics of the constituent molecules and its
measurement allows detailed molecular models of molecular dynamics to be created. In the
current article we use particle tracking microrheology (PTM) to probe the linear
viscoelasticity of mucin gels and solutions. This allows the viscoelasticity to be measured
over a broad range of frequencies (0.1-103
Hz) with small amounts of biological material
(~10 µL) and with the knowledge that the fragile biological specimens will not be damaged
(only thermal forces are applied). Furthermore, the effect of chaotropic and reducing agents
on the viscoelastic properties of mucin is probed, which yields information regarding the
forces that regulate the interactions in the gelled network. Moreover, the interaction of
polyphenols, a type of molecule abundant in tea and plant derived foods which is linked with
various health benefits, with mucins was examined. The polyphenol Epigallocatechin gallate
(EGCG), which is found in abundance in green tea and is believed to have a variety of health
benefits, was introduced to mucin solutions and its effect on the rheology of them was
investigated. It has been previously shown that EGCG has significant impact of the interfacial
shear rheology of human whole saliva, thus limiting the bioavailability of the molecule in the
body.11
Due to its importance in respiratory disease there have been a large number of rheology
studies on the viscoelasticity of mucus3,12–18
. Healthy animal mucus viscosities have been
measured in the range 0.0012-1000 Pas. This large variability in reported viscosities has in
part been due to the chemical heterogeneity and the variability in the mucin concentrations of
the samples. Therefore in the current study we used purified mucin samples and examined in
detail the concentration dependence of the mucin viscoelasticity.
Purified porcine mucins were chosen as model mucins, since previous studies using
commercially available Orthana mucin and partially purified mucin from Sigma, have
Page 5 of 54
John Wiley & Sons, Inc.
Biopolymers
6
concluded that the action of various proteases during their isolation has irreversibly altered
mucin structure and suppressed mucin-mucin interactions, which inhibits their ability to form
gels. Furthermore the carbohydrate side-chains are significantly deglycosylated in Orthana
samples and it is known that side chain dynamics can have a large impact on comb
polyelectrolyte viscoelasticity19
. Previous studies on these non-gelling Orthana mucins,
genetically similar to human MUC6, provided evidence for the double globular structure of
these materials and used scaling models for the structure and dynamics of flexible non-
associating polyelectrolytes to describe their behaviour.15,20,21
. In the current article we extend
on our previous studies to characterise gastrointestinal mucins whose purification process
was oriented towards maintaining their native structure and behaviour. Our findings suggest
that mucins demonstrate behaviour of large scale self-assembly of mucin oligomers into
fibrous aggregates which then cross-link to form gels at low pH.18
We expect differences in
the physical behaviour will still occur between purified mucins and naturally occurring
mucus secretions, but in terms of their linear viscoelasticity reasonably close agreement is
found between sample types i.e. mucin is the dominant contributing factor to the
viscoelasticity of mucus from healthy animals.
Page 6 of 54
John Wiley & Sons, Inc.
Biopolymers
7
2. Results
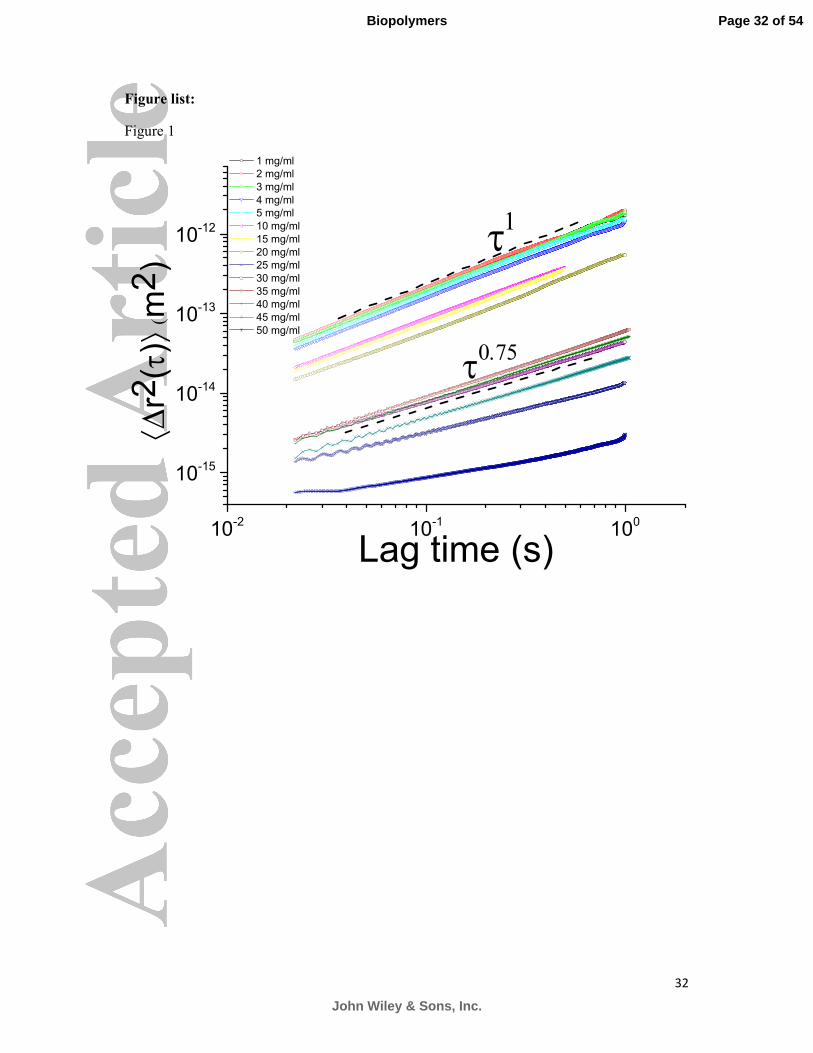
2.1 Microrheology of Porcine Gastric Mucin (PGM). Figure 1 shows the ensemble
averaged MSD curves of polystyrene spheres obtained for concentrations of PGM
(MUC5AC) in solution ranging from 1 to 50 mg/ml. The slope of the MSD curves obtained
from solutions of concentrations up to 20 mg/ml, when plotted on a loglog scale, is equal to
1. This indicates that stomach mucin solutions of up to 20 mg/ml behave as purely viscous,
Newtonian liquids and there is a monotonic increase of viscosity with mucin concentration.
The gradient of the loglog plot of the MSDs in the Newtonian regime is directly related to the
diffusion coefficient of the spheres’ Brownian motion in the mucin solutions. This allowed us
to calculate the viscosity of the samples in mPas, using Eq. (3). The scaling of the viscosities
as a function of concentration is shown in Figure 2. Viscosity increases with concentration, as
expected, but only to the relatively small value of 7 mPas at 15 mg/ml, about 7 times the
viscosity of water at the same temperature. The scaling of the viscosity of the solutions as a
function of mucin concentration (c) in the low concentration Newtonian regime follows a
power law behaviour of η ~ c0.53±0.0.08
characteristic of semi-dilute linear polyelectrolytes (the
Fuoss law)22
and also observed previously with non-associating Orthona mucin solutions.15
There is reasonable agreement between the current viscosity measurements and previous
measurements using optical tweezers and bulk rheology (diamond symbols on figure 2).
At the physiologically relevant concentration of 25 mg/ml (2-3% w/w of gastrointestinal
mucus is made up of mucin) a critical concentration is reached and a viscoelastic solution
forms. At this point the solution behaves as a complex liquid, exhibiting both viscous and
elastic behaviour, i.e. power laws with α<1 (Eq. 2) are required to describe the MSDs. The
slope of the loglog plot of the MSD at 25 and 30 mg/ml was found to be very close to 0.75, a
preliminary indication that mucins could self-assemble into semi-flexible fibres. Further
investigation of the compliance curve acquired by transforming the MSD dataset as per Eq. 4
Page 7 of 54
John Wiley & Sons, Inc.
Biopolymers
8
and fitting the Maxwell equation at long times for transition concentrations of 25 mg/ml,
enabled us to calculate the modulus of the semi-dilute network to be G = 1.4±0.1 Pa and its
viscosity, η = 70±4 mPas. Combining the two (using equation 6), the relaxation time of the
gel was found to be ����= 0.06±0.01 s, a value typical for viscoelastic polymer solutions.
At 40 mg/ml the viscosity of the solution was found to be 165±2 mPas, whereas the modulus
of the polymer network increased to 2.3±0.2 Pa. Consequently, the relaxation time of the
complex fluid was found to be 0.07±0.03 s, a clear indication of the formation of a stronger
entangled network. At even higher concentrations, namely around 50 mg/ml, the solution was
very viscous and the Brownian motion of the beads was barely detectable, thus further
investigation of higher concentrations of mucin was not possible with PTM. At this
concentration the viscosity of the solution was found to be 780±4 mPas, the elastic modulus
5.2±0.1 Pa and the relaxation time 0.15±0.03 s.
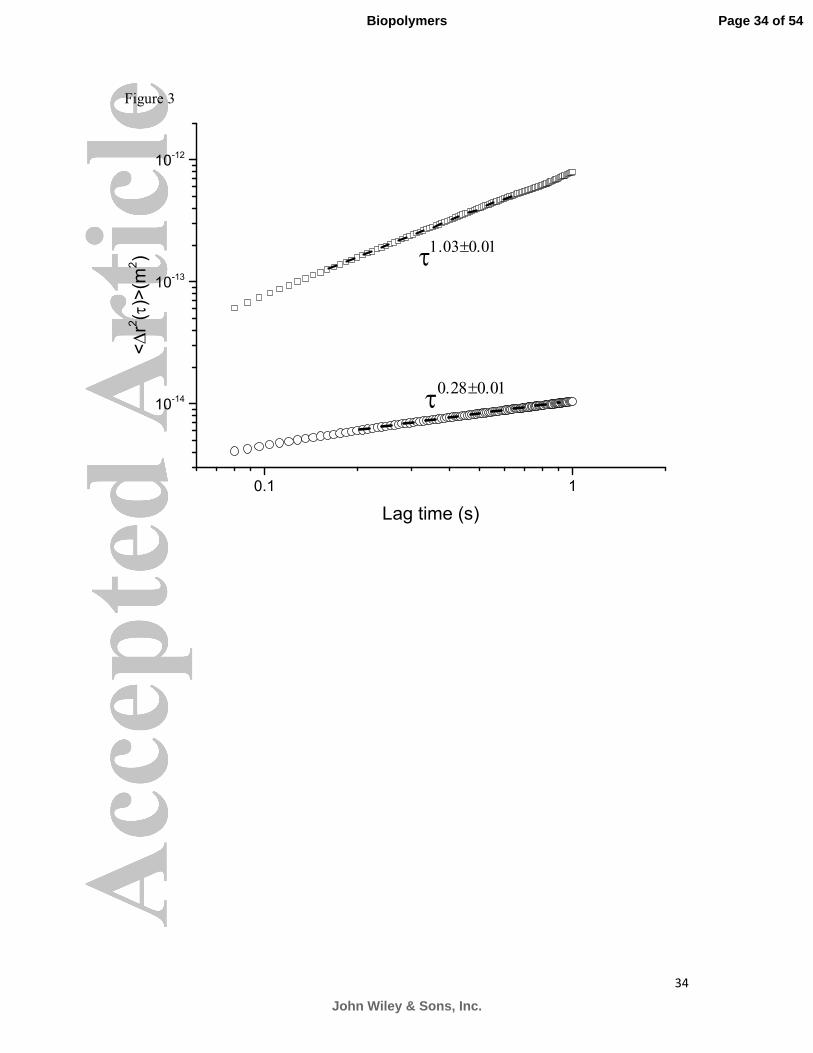
The most important physiological function of the mucus layer in the mammalian stomach is
to protect the epithelium from its hostile environment. In order to do so, a pH gradient is
maintained from near neutral on the epithelium to as low as pH 1 in the lumen. Figure 3
shows the effect of dropping the pH of a 10 mg/ml solution of stomach mucin to pH 1. It is
evident that the mobility of the embedded microspheres is severely compromised in the
acidic solution as a result of the sol-gel transition the solution undergoes due to the pH
change. The viscosity of the solution is increased by more than a 100-fold, namely to 3.0±0.2
Pas, whereas the elastic modulus was calculated to be 3.0±0.1 Pa. This results in a relaxation
time of 1.0±0.3 s, typical of a weak polymeric gel.
Page 8 of 54
John Wiley & Sons, Inc.
Biopolymers
9
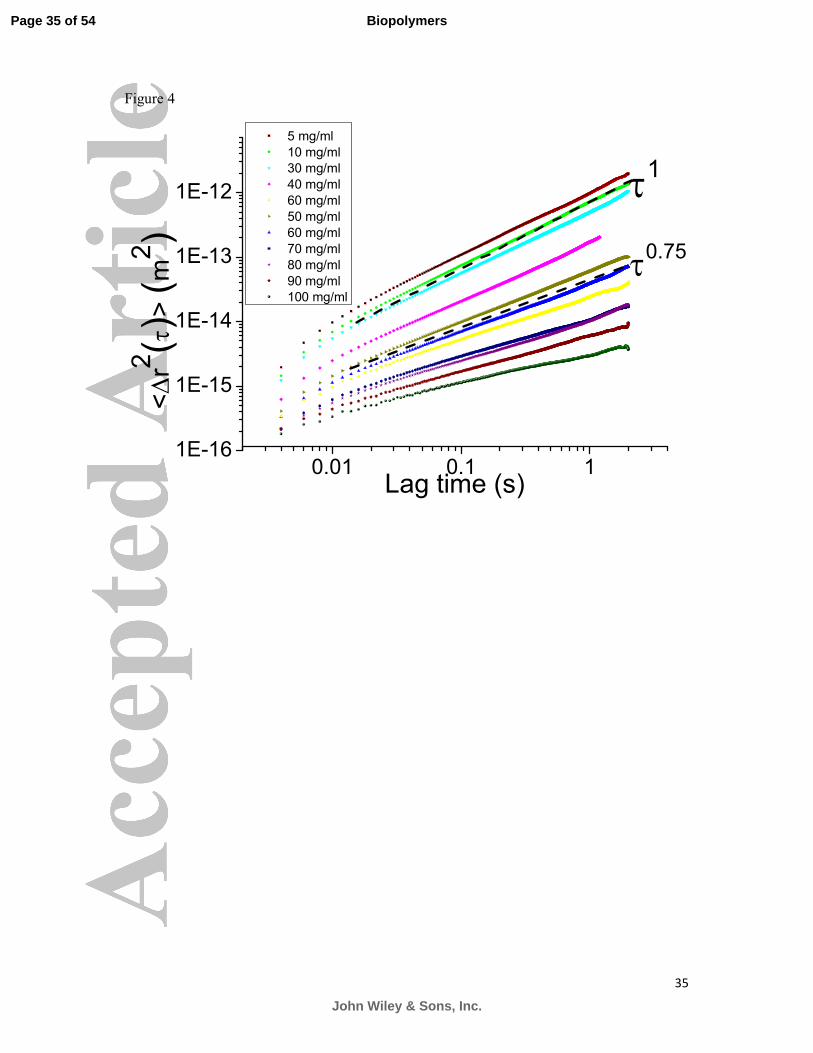
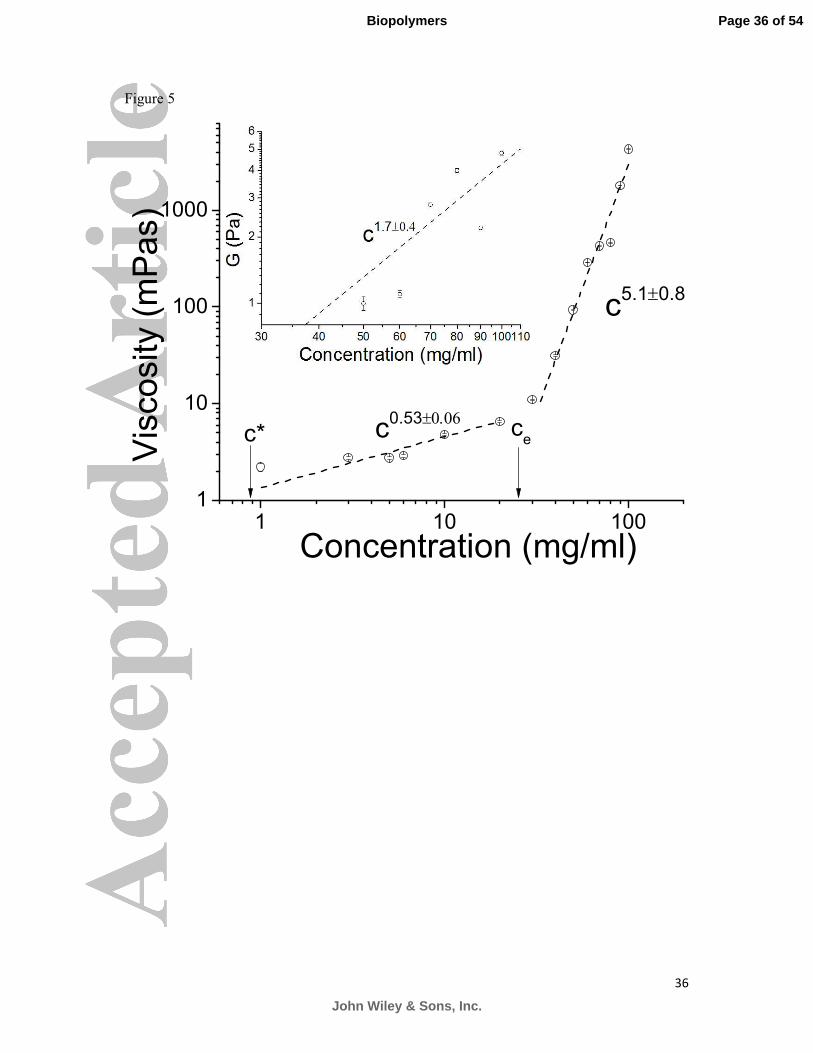
2.2 Microrheology of Porcine Duodenal Mucin (PDM).
Figure 4 shows the scaling of the MSD curves of polystyrene spheres in porcine duodenum
mucin (MUC2) as a function of mucin concentration. A similar trend as with PGM
(MUC5AC) was observed, with the transition from a purely viscous liquid to a complex fluid
occurring at a similar, physiologically relevant concentration of 30 mg/ml. Up to this
concentration the solutions behaved as a purely viscous, Newtonian liquid with a measured
viscosity of the order of a few mPas, with no elastic component detectable using PTM.
Above this critical entanglement concentration the slope of the loglog plot of MSDs was
found to be smaller than 1, indicating the formation of a viscoelastic polymer network.
Indeed, at 30 mg/ml the viscosity of the solution was found to be 11.0±0.1 mPas and the
elastic modulus was found to be 0.27±0.01 Pa. At concentrations of 40 mg/ml a considerable
elastic modulus is measured and the viscosity is of the order of tens of mPas, as seen in
Figure 5. It was concluded that the critical concentration for porcine duodenum mucin
solutions lies slightly above that of PGM, at 30 mg/ml.
The majority of the digestion and absorption of nutrients happens in the small intestine, after
the chyme from the stomach enters the duodenum. Here the acidic pH of the gastric juices is
neutralised by the secretion of bile, pancreatic and intestinal juices, thus the pH in the small
intestine is kept close to neutral. The hypothesis that both gastric and small intestinal mucins
polymerise and form gels by the same mechanism was tested by reducing the pH of a
10 mg/ml duodenum mucin solution to 1, using HCl. This resulted in the solution undergoing
a sol-gel transition, much like PGM. The effect of dropping the pH in duodenum mucin
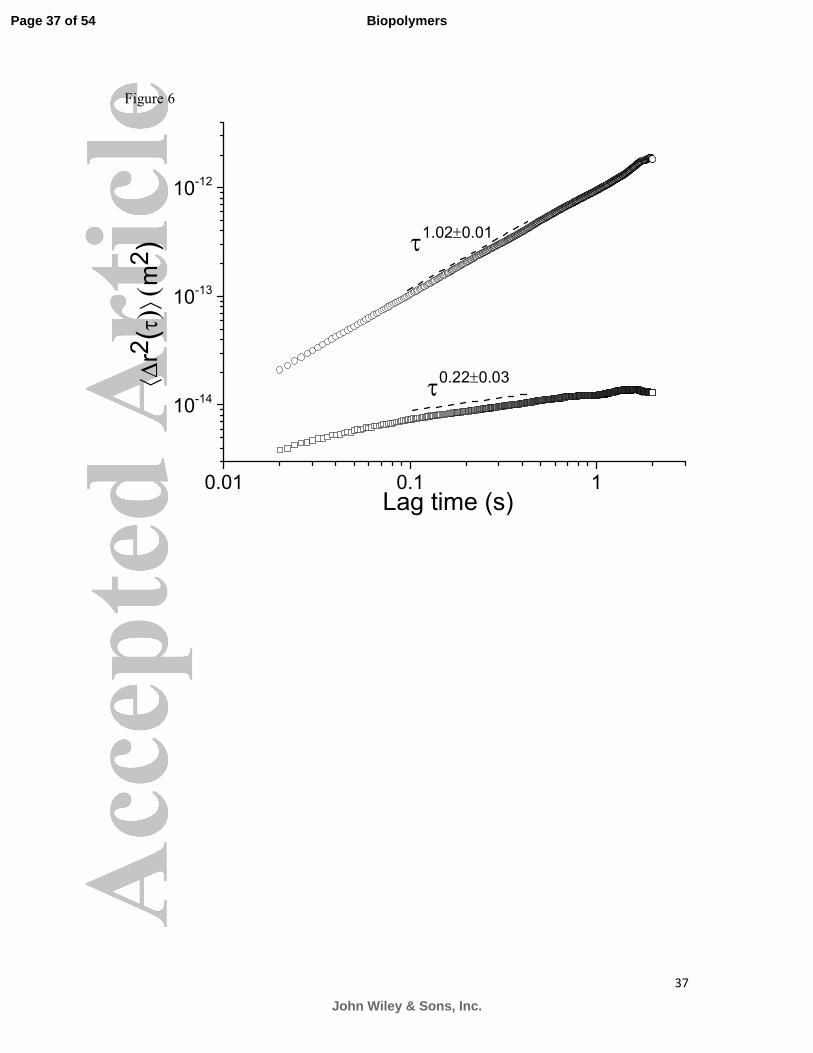
solution is seen in Figure 6.
The viscosity of the neutral pH 10 mg/ml duodenum mucin solution was found to be
5.0±0.1 mPas and no elastic component could be measured. Decreasing the pH of the
Page 9 of 54
John Wiley & Sons, Inc.
Biopolymers
10
solution had a large effect on its rheological characteristics, since the measured viscosity was
found to be 0.82±0.01 Pas (100-fold higher than the neutral solution’s) and its elastic
modulus was found to be 0.67±0.02 Pa. This is a somewhat unexpected finding, since there is
no physiological reason why small intestinal mucin should protect the epithelium from acidic
secretions, although it does provide a secondary protection mechanism for variations in pH
that may be caused by gastric juice leakage in the initial parts of the duodenum.
2.3 Microheology of chemically treated porcine gastric mucin (PGM)
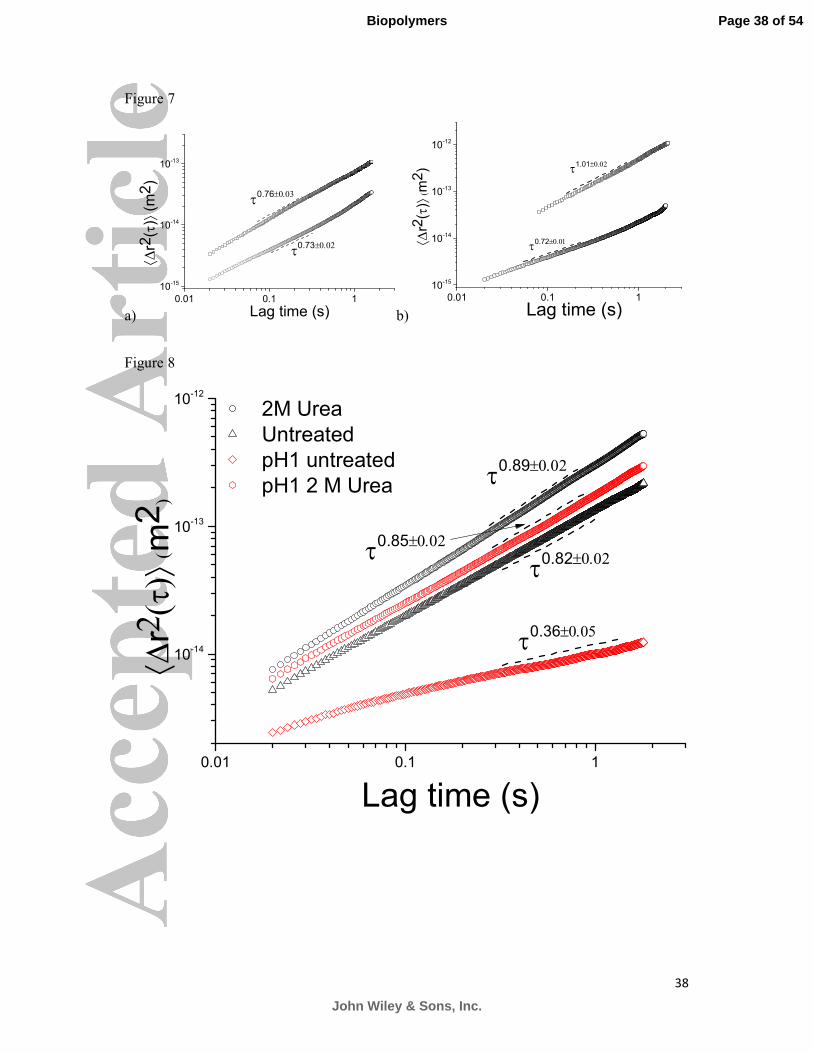
To investigate the bonding forces between mucin monomers, a 25 mg/ml PGM solution was
treated with 10 mM dithiothreitol (DTT), a reducing agent commonly used for disrupting
disulphide bonding, followed by 2 hr incubation. In order for DTT to have an effect the pH of
the solution was regulated at pH 8, using 1M NaOH. Following incubation, the mobility of
embedded microspheres between the control and the treated sample was compared, as seen in
Figure 7a. The viscosity of the solution was considerably decreased from 87±4 mPas to
42±1 mPas, whereas the measured elastic shear modulus were 1.4±0.1 Pa and 0.54±0.02 Pa
for the untreated and treated solutions respectively.
In order to study the effect of GuHCl on the rheological properties of mucins, a 20 mg/ml
PGM solution was treated with 8 M GuHCl and incubated for 10 min. Figure 7b shows the
MSD curves obtained from the two samples. The absolute MSD values are increased 10-fold
and no elastic component was detectable in the treated solution, where the elastic shear
modulus of the untreated solution was found to be 0.29±0.01 Pa. The viscosity of the treated
solution was found to be 9.03±0.01 mPas, decreased from 53.0±0.1 mPas for the untreated
20 mg/ml solution.
To study the effect of urea, a 20 mg/ml PGM solution at pH 7 (complex liquid) and at pH 1
(gel) were treated with 2 M urea and incubated for 1 hour. The MSD curves obtained from
Page 10 of 54
John Wiley & Sons, Inc.
Biopolymers
11
tracking the embedded microspheres in the aforementioned solutions can be seen in Figure 8.
Comparing the pH neutral solutions, we observe a decrease in viscosity from 52.5±1.0 mPas
to 16.1±0.5 mPas and a decrease in the elastic modulus from 0.31±0.03 Pa to 0.03±0.01 Pa.
Furthermore, the slope of the loglog plot of the MSD increased from 0.82 to 0.89, indicating
the increased mobility of the embedded micro-spheres. The greatest change is observed when
treating the PGM solution at pH 1 with 2 M urea. The transition from a thick gel to a complex
fluid was immediately observed by visual inspection, but also seen in the transitions of power
law exponents of the MSD curves, namely from 0.3 to 0.85 as a result of the large increase in
the absolute values of the MSDs. The viscosity and the elastic shear modulus of the acidic
solution were measured to be 4.10±0.14 Pas and 0.47±0.02 Pa, whereas the same parameters
were found to be 47±1 mPas and 0.21±0.01 Pa for the 2 M urea treated sample.
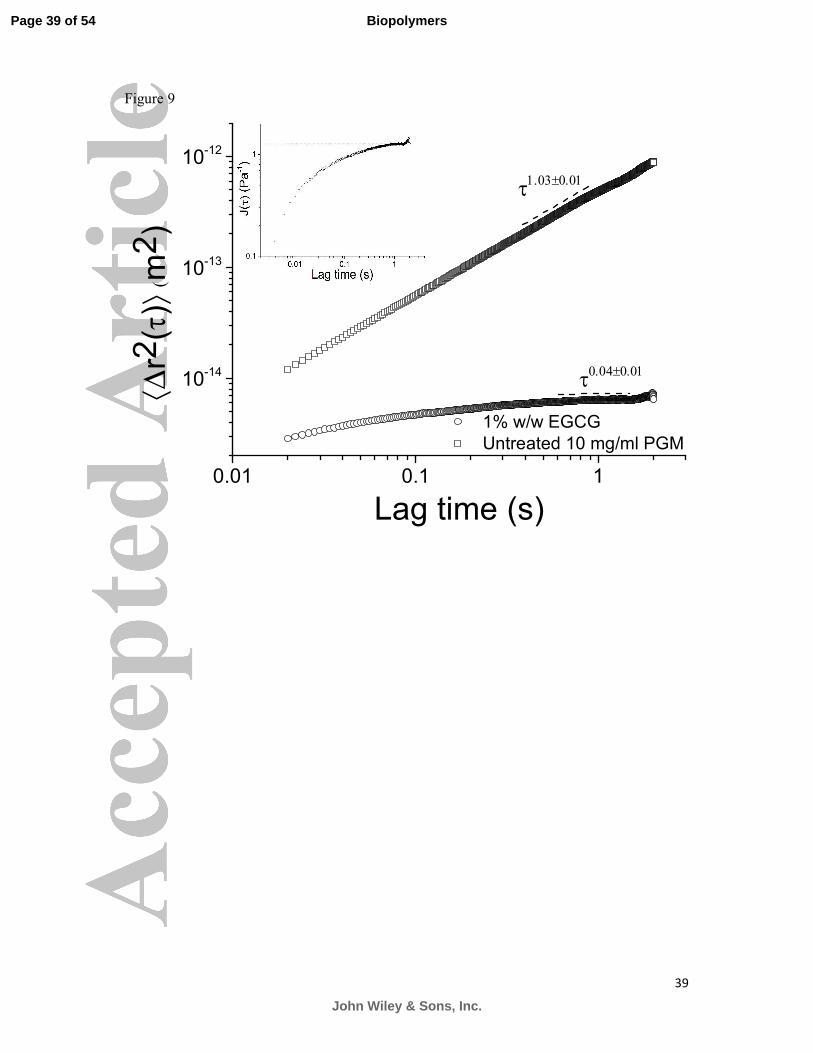
The bioavailability of polyphenols in the human body and their effect on human health have
been the centre of research for the past years. The interaction of a 10 mg/ml PGM solution
and EGCG, a polyphenol molecule found in abundance in tea, was investigated by treating
the solution with 1% w/w lyophilised EGCG. . This allowed us to probe the effect of phenolic
molecule on the rheological characteristics of the mucin solution. Immediately an adverse
effect was observed, since treating the PGM solution with EGCG caused it to undergo a sol-
gel transition. The viscosity of the gelled PGM sample could not be measured, since it was
too high for PTM, but an estimate of its elastic modulus can be made from the intercept of the
plateau’s extension to the compliance axis, which was found to be ~1 Pa, shown in Figure 9.
Page 11 of 54
John Wiley & Sons, Inc.
Biopolymers
12
3. Discussion
The viscoelastic properties of mucins are of great physiological significance, especially in the
airways and gastrointestinal tract. Over production of polymerising mucins (namely MUC5B
and MUC5AC) in the airways as a result of cystic fibrosis inhibits the removal of various
pathogens by mucociliary transport, with life-threatening consequences. Furthermore,
malfunction of the mucus layer in the stomach can lead to ulcers caused by the bacterium,
Helicobacter Pylori or even by the secretions in the stomach itself. The scaling of the
viscoelasticity of both porcine gastric and duodenal mucins as a function of mucin
concentration shows that at physiologically relevant concentrations the mucins form a semi-
dilute network. This will allow the diffusion of small particles through it, like nutrients in the
small intestine, but severely reduces the diffusion coefficient of larger particles, like dust
particles and bacteria23
. At concentrations higher than the typical concentration of mucins in
mucus (~3% w/w), both types of mucins form thick entangled semi-dilute networks.
It is therefore deduced that the semi-dilute networks form by self-assembly of secreted mucin
oligomers with an increase in mucin concentration. The aggregate dynamics depends on
mucin concentration, but the transition to a viscoelastic fluid occurs relatively rapidly above a
critical concentration (the entanglement concentration). At this transition point the MSD
often has a characteristic t0.75
scaling over two orders of magnitude in time (t), characteristic
of semi-flexible aggregates e.g. actin or fibrin.24
The exponent α of a power law (Eq. 2)
decreases with a further increase in concentration approaching values close to α=0, which is
characteristic of a strongly elastic solution.
The scaling of the viscosity (η) between c* and ce, �~��.����.� for MUC5AC and
�~��.����.� for MUC2, is in agreement with the Fuoss law for semi-dilute linear flexible
polyelectrolytes (1/ 2~ cη )
22. Slight modifications are predicted for the concentration
Page 12 of 54
John Wiley & Sons, Inc.
Biopolymers
13
dependence with flexible comb polyelectrolyte architectures, but the data is in broad
agreement with such predictions (the prediction with semi-flexible side chains is identical to
the Fuoss law). The prediction for the shear modulus (G) of entangled flexible comb
polyelectrolytes is 3/ 2~G c which is in good agreement with the observed result for MUC2,
1.7 0.4~G c ± and in reasonable agreement for MUC5AC �~� .����.� . The scaling of the
viscosity as a function of concentration for MUC2 above the entanglement concentration is
5.1 0.8~ cη ±and contrasts strongly with the scaling found previously for entangled Orthana
mucins that do not self-assemble and have a reduced number side-chains, 3/2~ cη 15
. The
Orthana mucins followed the scaling predictions for linear polyelectrolytes in the entangled
regime, whereas duodenal mucin follows the predictions for comb polyelectrolytes or more
specifically comb polyelectrolytes with entangled side chains (only this model can explain
the large exponent of 5.1 in the fluid phase i.e. the prediction 1/ 23~ acc eη , where a is a
constant, can only explain the high value of the exponent).25
In addition to the entanglement
of carbohydrate side-chains, there is also the possibility that the mucin aggregates create a
small number of branched nodes (the networks are not gelled, and the mucin oligomers are
known to be relatively small from scattering experiments, so the number of aggregate
branches must be relatively low, if they exist), which would result in a sparsely branched
network and a similarly large exponent is predicted for the dependence of the viscosity on the
concentration (due to the activated motion of the aggregate branches in this case). Thus above
the entanglement concentration both the backbone (protein) and the side-chains (carbohydrate
or possibly mucin aggregate branches) of MUC2 are expected to reptate. Similar behaviour is
observed with MUC5AC (Figure 2) with�~��.����.� in the entangled regime.
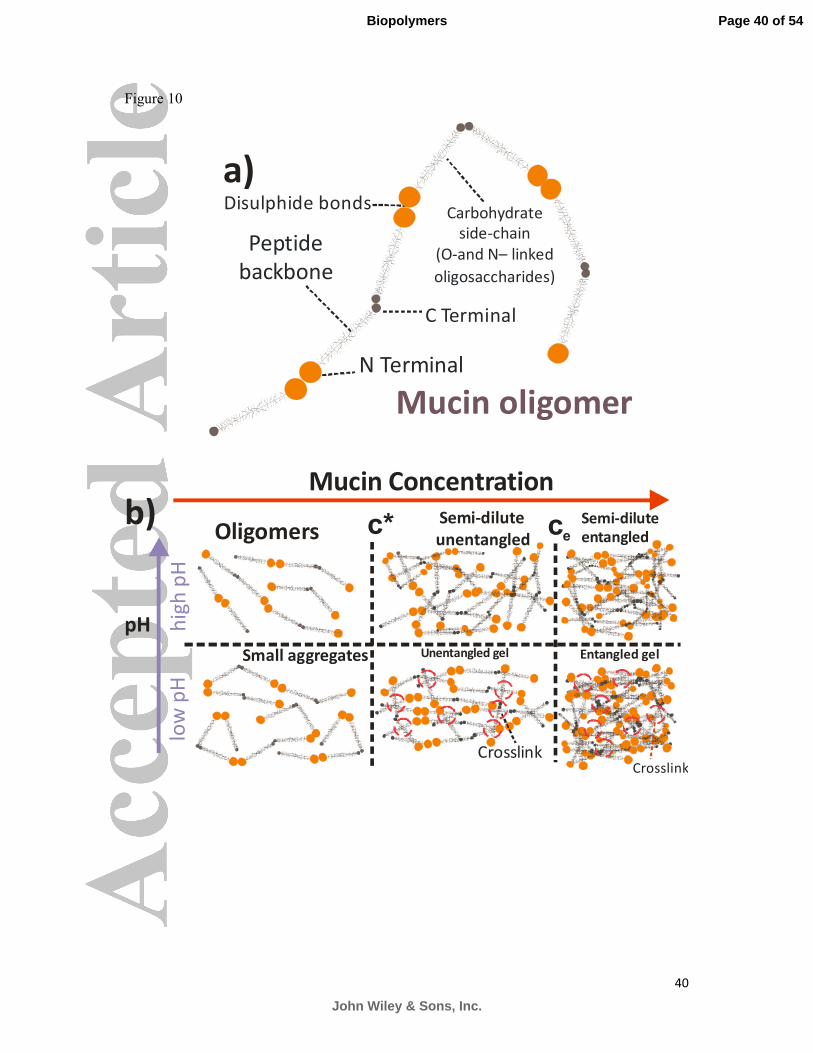
Based on these scaling results a schematic diagram of the mucin chains at different
concentrations can be drawn (Figure 10). Similar phase diagrams can be drawn for both
Page 13 of 54
John Wiley & Sons, Inc.
Biopolymers
14
stomach and duodenum mucin with a small rescaling of the phase boundaries. At low
concentrations the mucin molecules exist as non-interacting oligomers. As the mucin
concentration is increased the non-interacting oligomers start to interact with each and
contribute to the viscoelasticity of the solution, while also forming larger oligomers or
polymers. Further increases in concentration (� � �∗) cause the chains to overlap in the semi-
dilute unentangled regime. Above the entanglement concentration (ce) the comb solutions
begin to reptate. Dropping the pH induces permanent cross-links between neighbouring self-
assembled chains, due to protonation of salt bridges in the peptide backbone and exposure of
hydrophobic regions, and the network forms a gel. Gels can be either unentangled or
entangled depending on whether the comb polymers have reptation inducing physical
entanglements in addition to permanent cross-links, ie. whether the mucin concentration is
above or below the entanglement concentration.
Gastric and small intestinal mucins share structural homology (Supplementary material, S4).
The N- and C- termini contain von-Willebrand factor-like B, C, CK and D-domains, and the
central mucin domains, in which extensive glycosylation occurs, are interspersed with
cysteine-rich domains. Thiol groups that exist in the cysteine-rich domains at the two termini
of the glycoprotein form disulphide bonds between mucins, which eventually form fibrous
polymeric aggregates. Furthermore, recent reports have provided evidence for branched
polymerisation of MUC2.26
Treatment with DTT had a dramatic effect on both the viscous
and elastic component of the MUC5AC solution, due to effective reduction of the polymer
network. In non-chaotropic solvents DTT may not remove all of the disulphide interactions,
and a number of them are expected to reform after treatment. However it can be safely
concluded that disrupting disulphide bonding in the sample resulted in a weaker elastic
network, as a result of the reduction of a number of mucin polymers to smaller oligomers and
thus partial disassembly of the semi-dilute network.
Page 14 of 54
John Wiley & Sons, Inc.
Biopolymers
15
By its nature, biochemistry is often a reductionist science. In studying mucins, the most
common extraction method uses chaotropic agents, which break non-covalent bonds and
denature the proteins so they can be studied. A common denaturant is guanidinium
hydrochloride (GuHCl), which at concentrations of 8 M causes the proteins to lose their
structure and become randomly coiled. Treating with 8 M GuHCl effectively reduced the
viscoelastic 20 mg/ml mucin solution to a purely viscous liquid, with considerably decreased
viscosity and no measurable elastic component. Again it is deduced that the chaotropic agent
(GuHCl) has disassembled the semi-dilute network structure, this time by unfolding proteins
and breaking non-covalent bonds rather than disruption of the covalent interactions between
mucin monomers which occurred with DTT.
Another chaotropic agent commonly used in the study of complex proteins in biochemistry
laboratories is urea, an organic compound which is a powerful denaturant, since it disrupts
the noncovalent bonds in the protein. It is evident that for pH 7 and pH 1 20 mg/mL PGM
solutions (Figure 8), treatment with 2 M urea disrupts a portion of the polymer network,
resulting in weaker complex liquids. Urea is thus shown to disassemble the mucin gel at pH 1
and partially disassemble the semi-dilute network at pH 7.
The aforementioned observations imply that disrupting the non-covalent bonds reduces the
viscoelasticity of the pH neutral solution and reduces the gelled acidic solution to a
viscoelastic liquid, but steric interactions between the glycosylated regions of the mucins also
have significant contribution to the formation of the mucin network. This is in agreement
with the scaling results that imply mucin molecules above 20 mg/mL have entangled side
chains (Figure 10).
There has been great interest in the biological effects of plant-derived polyphenols, a family
of molecules that are characterised by the presence of several phenolic groups. Polyphenols
Page 15 of 54
John Wiley & Sons, Inc.
Biopolymers
16
have been shown to have a variety of beneficial health effects in humans and animals.27
Epicatechin (EC), found in various fruits and tea, has been postulated to act as a strong
antioxidant and promote the healthy functioning of hearts. Epigallocatechin gallate (EGCG),
which has a similar structure as EC with the addition of a galloyl ring, is found in abundance
in green tea, and has been reported to prevent cancer in animal models. However, the galloyl
ring in the molecule’s structure has also been reported to be toxic at high concentrations.
Experiments performed on HT29 adenocarcinoma cell lines, used to simulate the gut
epithelium in which mucin production is inhibited, have confirmed this toxicity. However,
the mucus layer on the surface of the HT29-MTX-E12 sub-clone successfully constrained the
EGCG molecules, thus protecting the cells from the toxic environment. No toxicity was
reported when using EC on the same cell-lines.8
Furthermore, the interfacial shear rheology of human whole saliva has shown the formation
of a strong intermolecular network between salivary proteins when treated with EGCG, as a
result of the complexation of salivary proline rich proteins (PRPs) with the galloyl group
found in the EGCG molecule. It was postulated that this mechanism of protein binding of
polyphenols is the body’s first line of defence against the toxic effects of EGCG at high
concentrations, possibly related to GI tract irritation after high consumption of green tea.11
However, the effect of EGCG on mucins remains largely unknown. It is evident in
microrheology experiments that addition of EGCG to the purely viscous PGM solution
causes a strong intermolecular network to form, which forms a gel matrix. It was concluded
that EGCG causes the purely viscous PGM solution to gel, and this could act as a defence
mechanism against high concentrations of this type of polyphenol.
The linear viscoelasticity (the viscosity and shear modulus) of the microrheology results
generated here from purified MUC2 and MUC5AC are compared with results from native
Page 16 of 54
John Wiley & Sons, Inc.
Biopolymers
17
mucus rheology experiments2. Good agreement is observed with a range of bulk rheology
measurements for pig intestinal mucin. It is also clear that pH and mucin concentration both
have a strong impact on the viscoelasticity of the solutions. The viscoelasticity of the purified
mucins is close to that of native mucus secretions, which indicates that MUC5AC and MUC2
are the dominant contributing factors to the viscoelasticity of gastric and intestinal mucins
respectively. These values of gastrointestinal mucins are reasonably close to those from
respiratory mucin from healthy animals. Sputum from human cystic fibrosis patients can have
viscosities as high as ~30 Pas, an order of magnitude higher than observed in our gastric
mucin studies and bacterial DNA is thought to be a major contributor to its viscoelasticity
(DNases are used in medical treatments)28
.
Future work will investigate the structure and dynamics of gastrointestinal mucins with other
experimental techniques to test the model for self-assembled entangled flexible
polyelectrolytes combs in more detail. Some microscopy data exists in the literature to
suggest that mucin chains can bundle side-by-side into lateral aggregates29
. It may be possible
to test these predictions in small angle X-ray and neutron scattering experiments.
Furthermore the mechanistic interaction of polyphenols with mucin will be studied in more
detail with a range of experimental methods.
Page 17 of 54
John Wiley & Sons, Inc.
Biopolymers
18
4. Conclusion
Particle tracking microrheology experiments demonstrate that both MUC5AC and MUC2
mucins (from the stomach and duodenum respectively) self-assemble to form viscoelastic
solutions at high mucin concentration. Above the semi-dilute overlap concentration, but
below the entanglement concentration, unentangled polyelectrolyte comb dynamics are
observed. Above the entanglement concentration the chains begin reptating due to physical
entanglements and the scaling for MUC2 and MUC5AC is in broad agreement with a model
of polyelectrolyte combs with entangled backbones and side-chains. Reduction of the pH of
solutions of both type of mucin subsequently causes the mucin solution to gel due to the
creation of cross-links. DTT, guanidinium hydrochloride and urea cause the disassembly of
the gels and a large decrease in the shear modulus (increase in the compliance). ECGC (a key
polyphenol molecule in tea) causes PGM to gel through the introduction of cross-links.
Page 18 of 54
John Wiley & Sons, Inc.
Biopolymers
19
5. Materials and Methods
5.1 Mucin purification. Porcine gastrointestinal mucin (PGM) was used as a model for
human mucin. Porcine stomachs and small intestines were collected from a local abattoir
shortly after death, washed with PBS and brought back to the laboratory. Following a second
wash the mucus was scraped from the epithelium and stored at -20 oC. Gastrointestinal (GI)
mucins were extracted by homogenising mucus for 1 min in 0.2M NaCl containing Protease
Inhibitors and Sodium Azide, followed by two steps of CsCl density gradient centrifugation.
No chaotropic agents were used during mucin extraction, to ensure that their native structure
was unaltered. In each CsCl-gradient step, the solution was divided in 20 fractions of
decreasing density and their glycoprotein content was assessed by periodic acid/Schiff’s
staining (PAS) staining and UV light (280 nm) absorbtion (supplementary information, S1
and S2). The mucin-rich fractions were pooled, extensively dialysed against water and
lyophilized.30
The presence of MUC5AC (stomach) and MUC2 (small intestine) was
confirmed as the dominant glycoprotein present by tandem mass spectrometry
(supplementary information, S3). The main fractions identified by chromatography are
relatively polydisperse as expected for molecules with heterogeneous carbohydrate side-
chains and with different numbers of subunits in their oligomers. Around 70% of the mucins’
weight is found to be carbohydrate and 30% protein. The carbohydrate side-chains are
relatively small with 1-10 monomeric subunits (the carbohyrdrate side-chains are shown to
scale on figure 10). The side chains are highly negatively charged at neutral pH due to sialic
acid groups on the monomers. Purified mucin solutions were prepared by dissolving mucin in
10 mM Sodium Phosphate with 10 mM Sodium Succinate buffer and the pH was adjusted
using aqueous HCl. All the solutions were prepared 48 hours prior to the experiments, so that
equilibrium was reached.
Page 19 of 54
John Wiley & Sons, Inc.
Biopolymers
20
5.2 Particle Tracking Microrheology. Carboxyl-activated polystyrene microspheres
(505 nm, Polysciences) were embedded in the mucin solutions. Polyethylene glycol coated
microspheres were also used, which exhibited similar behaviour as their uncoated
counterparts (supplementary information S4). This behaviour is in sharp contrast to that
found previously with fibrin glycoprotein microrheology in which PEGylation was found to
be necessary to measure microrheology representative of fibrin networks31
. We deduce that
the interaction between the beads and the mucin solutions are in the non-associating limit. A
previous study of O.Lieleg et al32
found larger effects of surface modification, but they were
examining much lower concentration mucin solutions (at or below the semi-dilute overlap
concentration measured with our purified specimens). For consistency purposes it was
decided to use the uncoated beads throughout. Following preparation, standard flat
microscope slides with Secure-seal imaging spacers containing 8 µl of sample were loaded
onto an Olympus IX-71 inverted microscope equipped with a 100× immersion oil objective.
The setup was placed on an active optical table to reduce the effect of vibrations. Videos of
the spheres’ Brownian motion were recorded using a FastCam 1024-PCI fast camera and a
bright CoolLED light source. This allowed the motion of the spheres to be followed at up to
27 000 frames per second and their two-dimensional tracks were extracted using a parallel
version of the MatLab based Polyparticletracker software.33
This is based on a polynomial fit
of the intensity around each feature point, weighted by a Gaussian function of the distance
from the centre.34
Special care was taken to only track spheres away from the surfaces of the
microscope slides to avoid detecting the hydrodynamic interactions between them (the
Faxen’s law corrections are negligible). These trajectories were subsequently converted to
mean-square displacements (MSDs) and the ensemble averaged MSD was plotted as a
function of lag time, τ. No substantial cage hopping events were observed in the tracks of the
Page 20 of 54
John Wiley & Sons, Inc.
Biopolymers
21
probe spheres, which have been shown to lead to artefacts with microrheology experiments
on actin solutions35
.
For Brownian motion of a probe in a Newtonian fluid the mean square displacement,
⟨������⟩, is linearly dependent on the lag time (τ) with proportionality constant D (the
diffusion coefficient):
⟨∆�����⟩ � 2� � (1)
where n is the number of dimensions (equal to 2 for microscopy experiments). More
generally a power law time dependence of the MSDs is observed for viscoelastic fluids
⟨∆�����⟩∼�! (2)
α=1 corresponds to spheres diffusing in a purely viscous material and combination of
equation (1) with the Stokes-Einstein relationship gives:
� "#/6&�' (3)
where η is viscosity, b is the sphere’s radius and kT is the thermal energy. This allows the
viscosity of the material to be calculated from the fluctuations of a probe sphere in the
solution. In the case where 0<α<1 (Eq. 2), the material’s response is dependent on the
timescale of the measurement relative to the characteristic time of the material, that is the
relaxation time ����.36
The MSD curve can be converted to the time dependent compliance
(J(τ)), a standard measure of viscoelasticity with units of Pa-1
(which assumes the generalised
Stokes Einstein relationship for its derivation) using:37
(��� �)!
*+⟨∆�����⟩ (4)
Page 21 of 54
John Wiley & Sons, Inc.
Biopolymers
22
This can be further investigated using the Maxwell model for linear viscoelasticity, which
relates J(τ) to both viscosity and its elastic modulus, G, as:
(��� �
,-
.
/ (5)
Viscosity is related to the relaxation time (τrel) and the modulus (G) by the expression:
� � ����� (6)
This expression is exactly true when a material is well described by a Maxwell model, but it
is also a good approximation with a wide range of other viscoelastic fluids. This relation
allows us to further characterise the viscoelastic properties of the material since τrel, the
characteristic relaxation time of the material, can be calculated e.g. the slowest characteristic
time scale of the molecules’ motions.38
The semi-dilute overlap concentration for a mucin chain can be calculated using
�∗ �012
3)45
3 (7)
where Mw is the molecular weight of a mucin monomer and Rg is the radius of gyration.
From separate light scattering, neutron scattering and X-ray scattering measurements (to be
presented separately) we have measured the radius of gyration of a MUC5AC mucin
monomer to be 43±5 nm and the molecular weight is approximately ~2.5 MDa. Thus, from
equation (7) the semi-dilute overlap concentration of monomers is 12 mg/mL. However the
semi-dilute overlap concentration of self-assembled aggregates is expected to be much
smaller than this value due to the much larger effective radius of gyration.
Page 22 of 54
John Wiley & Sons, Inc.
Biopolymers
23
6. Acknowledgements
We would like to acknowledge Unilever Discover for funding this project. Furthermore, we
would like to thank Heather Davies, Karine Rousseau, Caroline Ridley, Bill Frith and Gleb
Yakubov for useful conversations.
Table 1
Comparison of the viscosity and shear moduli for purified MUC5AC and MUC2 compared to
bulk rheology measurements in the literature2.
Porcine mucin type Viscosity (Pas) Shear modulus (Pa)
Previous studies Gastric 0.13-63 3.3-34
Small intestine 0.063-5.0 0.19-12
Colonic 0.16-1000 64-160
Current study Purified pH7
MUC5AC
0.001-0.6 2-5 (30-50 mg/mL)
Purified pH7 MUC 2 0.002-5.0 0.67-5 (50-100
mg/mL)
Purified pH1
MUC5AC
3 (10 mg/mL) 3 (10 mg/mL)
Purified pH1 MUC2 0.82 (10 mg/mL) 0.67 (10 mg/mL)
Page 23 of 54
John Wiley & Sons, Inc.
Biopolymers
24
7. References
(1) Thornton, D. J.; Rousseau, K.; McGuckin, M. A. Annual review of physiology 2008,
70, 459–86.
(2) Lai, S. K.; Wang, Y.-Y.; Wirtz, D.; Hanes, J. Advanced drug delivery reviews 2009,
61, 86–100.
(3) Celli, J. P.; Turner, B. S.; Afdhal, N. H.; Ewoldt, R. H.; McKinley, G. H.; Bansil, R.;
Erramilli, S. Rheology of gastric mucin exhibits a pH-dependent sol-gel transition.
Biomacromolecules 2007, 8, 1580–6.
(4) Olmsted, S. S.; Padgett, J. L.; Yudin, a I.; Whaley, K. J.; Moench, T. R.; Cone, R. A.
Biophysical journal 2001, 81, 1930–7.
(5) Johansson, M. E. V; Sjövall, H.; Hansson, G. C. Nature reviews. Gastroenterology &
hepatology 2013, 10, 352–61.
(6) Bhaskar, K.; Garik, P.; Turner, B.; Bradley, J. Nature 1992, 360, 458–461.
(7) Bansil, R. Annual Review of Physiology 1995, 57, 635–657.
(8) Sellers, L. A.; Allen, A. Carbohydrate research 1988, 178, 93–110.
(9) Bansil, R.; Turner, B. Current Opinion in Colloid & Interface Science 2006, 11, 164–
170.
(10) Celli, J. P.; Turner, B. S.; Afdhal, N. H.; Keates, S.; Ghiran, I.; Kelly, C. P.; Ewoldt, R.
H.; McKinley, G. H.; So, P.; Erramilli, S.; Bansil, R. Proceedings of the National
Academy of Sciences of the United States of America 2009, 106, 14321–6.
(11) D’Agostino, E. M.; Rossetti, D.; Atkins, D.; Ferdinando, D.; Yakubov, G. E. Journal
of agricultural and food chemistry 2012, 60, 3318–28.
(12) Lai, S. K.; Wang, Y.-Y.; Hanes, J. Advanced drug delivery reviews 2009, 61, 158–71.
(13) Haward, S. J.; Odell, J. a.; Berry, M.; Hall, T. Rheologica Acta 2010, 50, 869–879.
(14) Davies, G. A; Wantling, E.; Stokes, J. R. Food Hydrocolloids 2009, 23, 2261–2269.
(15) Yakubov, G. E.; Papagiannopoulos, A.; Rat, E.; Easton, R. L.; Waigh, T. A.
Biomacromolecules 2007, 8, 3467–77.
(16) Taylor, C.; Draget, K. I.; Pearson, J. P.; Smidsrød, O. Biomacromolecules 2005, 6,
1524–30.
(17) Bromberg, L. E.; Barr, D. P. Biomacromolecules 2000, 1, 325–34.
(18) Kocevar-Nared, J.; Kristl, J.; Smid-Korbar, J. Biomaterials 1997, 18, 677–81.
Page 24 of 54
John Wiley & Sons, Inc.
Biopolymers

25
(19) Papagiannopoulos, A; Fernyhough, C. M.; Waigh, T. A. The Journal of chemical
physics 2005, 123, 214904.
(20) Di Cola, E.; Yakubov, G. E.; Waigh, T. A. Biomacromolecules 2008, 9, 3216–22.
(21) Yakubov, G. E.; Papagiannopoulos, A.; Rat, E.; Waigh, T. A. Biomacromolecules
2007, 8, 3791–9.
(22) Dobrynin, A. V; Colby, R. H.; Rubinstein, M.; York, N. Macromolecules 1995, 28,
1859–1871.
(23) Lai, S. K.; Wang, Y.-Y.; Cone, R.; Wirtz, D.; Hanes, J. PloS one 2009, 4, e4294.
(24) Xu, J.; Palmer, A.; Wirtz, D. Macromolecules 1998, 31, 6486–6492.
(25) Papagiannopoulos, a.; Waigh, T. A.; Hardingham, T. E. Faraday Discussions 2008,
139, 337.
(26) Ambort, D.; Johansson, M. E. V; Gustafsson, J. K.; Nilsson, H. E.; Ermund, A.;
Johansson, B. R.; Koeck, P. J. B.; Hebert, H.; Hansson, G. C. Proceedings of the
National Academy of Sciences of the United States of America 2012, 109, 5645–50.
(27) El Gharras, H. International Journal of Food Science & Technology 2009, 44, 2512–
2518.
(28) Shak, S.; Capon, D. J.; Hellmiss, R.; Marsters, S. a; Baker, C. L. Proceedings of the
National Academy of Sciences of the United States of America 1990, 87, 9188–92.
(29) Cone, R. A. In Mucosal Immunology (3rd Edition); Jiri Mestecky, Lamm Michael,
Jerry R. McGhee, John Bienenstock, L. M. and W. S., Ed.; Elsevier Inc., 2002; pp. 49–
72.
(30) Cao, X.; Bansil, R.; Bhaskar, K. R.; Turner, B. S.; LaMont, J. T.; Niu, N.; Afdhal, N.
H. Biophysical journal 1999, 76, 1250–8.
(31) Valentine, M. T.; Perlman, Z. E.; Gardel, M. L.; Shin, J. H.; Matsudaira, P.; Mitchison,
T. J.; Weitz, D. A. Biophysical journal 2004, 86, 4004–14.
(32) Lieleg, O.; Vladescu, I.; Ribbeck, K. Biophysical journal 2010, 98, 1782–9.
(33) Kenwright, D.; Harrison, A.; Waigh, T.; Woodman, P.; Allan, V. Physical Review E
2012, 86, 031910.
(34) Rogers, S. S.; Waigh, T. A; Zhao, X.; Lu, J. R. Physical biology 2007, 4, 220–7.
(35) He, J.; Tang, J. X. Physical Review E 2011, 83, 041902.
(36) Waigh, T. A. Reports on Progress in Physics 2005, 68, 685–742.
(37) Xu, J.; Viasnoff, V.; Wirtz, D. Rheologica Acta 1998, 37, 387–398.
Page 25 of 54
John Wiley & Sons, Inc.
Biopolymers
26
(38) Goodwin, J W and Hughes, R. W. Rheology for Chemists: An Introduction; The Royal
Society of Chemistry, 2008; pp. P001–264.
(39) Celli, J.; Gregor, B.; Turner, B.; Afdhal, N. H.; Bansil, R.; Erramilli, S.
Biomacromolecules 2005, 6, 1329–33.
Page 26 of 54
John Wiley & Sons, Inc.
Biopolymers
27
Caption list:
Figure 1: The mean square displacement of probe spheres in PGM solutions at pH 7 as a
function of mucin concentration. The scaling of the MSD curves from increasing
concentration of stomach mucin reveals that mucins undergo a network self-assembly
transition at a physiological relevant concentration of 25 mg/ml. The trend lines of τ1 and τ
0.75
are a guide for viscous and semi-flexible behaviours respectively.
Figure 2: The scaling of the viscosity (η) of MUC5AC (stomach) mucin solutions as a
function of mucin concentration(c) followed a power law dependence �~��.����.� for the
dilute regime and �~��.����.� in the semi-dilute regime (○). The scaling of the elastic
modulus with concentration is seen in the inset and was found to follow a power law
dependence of �~� .����.� . The triangles show micro-DLS and bulk rheology data for
purified MUC5AC from the literature.39
Figure 3: Mean Square displacements of polystyrene spheres in MUC5AC solutions at
10 mg/ml at pH 7 (�) and pH 1 (�). Decreasing the pH of the solution causes a dramatic
effect on its viscoelastic properties. The MSD values obtained from the acidic solution are
one order of magnitude smaller than those obtained from the neutral sample. Power law fits
to the MSDs give ( )2 1.03 0.01~r τ τ ±∆ and ( )2 0.28 0.01~r τ τ ±∆ for the ungelled and gelled
samples respectively.
Figure 4: The ensemble averaged MSD curves of polystyrene spheres as a function of lag
time obtained from various concentrations of small intestinal mucin (MUC2) exhibit a similar
Page 27 of 54
John Wiley & Sons, Inc.
Biopolymers

28
behaviour to MUC5AC. The transition from a Newtonian liquid to a viscoelastic fluid occurs
at a slightly higher concentration when compared to MUC5AC, that is 30 mg/ml. The dashed
trend lines of τ1 and τ
0.75 are a guide for viscous and semi-flexible behaviours respectively.
Figure 5: Scaling of the viscosity (η) and the elastic shear modulus (G) of the porcine
duodenum mucin solutions as a function of mucin concentration (c), obtained with particle
tracking microrheology. c* is the semi-dilute overlap concentration and ce is the
entanglement concentration. The viscosity follows a scaling law of �~��.����.� between c*
and ce. Above ce the viscosity has a scaling law of 5.1 0.8~ cη ±
. The shear modulus follows a
scaling relation, 1.7 0.4~G c ± .
Figure 6: The mean square displacement of probe spheres in duodenum mucin solution at
10 mg/ml, at pH 1 (□) and pH 7 (○). The mobility of the embedded microspheres is severely
compromised upon the reduction of the solution’s pH. The duodenum mucin solution
undergoes a sol-gel transition when the pH is dropped to 1. At high pH the scaling of the
mean square displacement is ( )2 1.02 0.01~r τ τ ±∆ , whereas at low pH ( )2 0.22 0.03~r τ τ ±∆ .
Figure 7: The mean square displacement of probe spheres in PGM solutions at pH 7 with and
without the addition of DTT (a) and 6M GuHCl (b). The mobility of embedded microspheres
in the DTT treated mucin solution is considerably larger than the untreated solution.
Disruption of a number of disulphide bonds in the solution results in a weaker elastic
component, whereas treatment with 6M GuHCl (○) results in a purely viscous Newtonian
Page 28 of 54
John Wiley & Sons, Inc.
Biopolymers

29
liquid, with no detectable elastic component (⟨������⟩~� .� ��.��) (□). The MSD scaling of
the 25 mg/ml PGM solution (○) was found to be ⟨������⟩~��.6���.�� and treatment with 10
mM DTT (□) did not induce a significant change in the power law (⟨������⟩~��.6��.��).
Figure 8: The mean square displacement of probe spheres in 20 mg/mL PGM solutions at pH
7 and pH 1 with and without the addition of 2M urea. Treatment of the mucin solution with
2 M urea significantly increases the mobility of the embedded microspheres in the PGM
solutions. The most dramatic effect is observed with the acidic solution, since it irreversibly
disrupts the mucin network that forms the gel, resulting in a significantly weaker viscoelastic
liquid. The scaling exponents for the MSD curves obtained are ⟨������⟩~��.���,�� and
⟨������⟩~��.���,�� for the untreated and treated neutral PGM solutions respectively and
⟨������⟩~��.���,�� and ⟨������⟩~��.���,�� for the acidic solutions.
Figure 9: The ensemble averaged mean square displacement of probe spheres in 10 mg/ml
PGM solution with and without the addition of 1% w/w EGCG, a plant polyphenol abundant
in green tea. The plateau of the MSD curve of the EGCG treated solution at long times
implies gelation of the purely viscous untreated mucin solution. An estimation for the elastic
shear modulus could be made using the plateau value of the compliance curve (inset). For
untreated PGM ( )2 1.03 0.01~r τ τ ±∆ whereas with EGCG ( )2 0.04 0.01~r τ τ ±∆ .
Figure 10: a) Mucin oligomers form as the asymmetric dumbbell comb molecules self-
assemble end on end. b) A schematic diagram of the concentrations regimes that determine
the scaling of the viscoelasticity as a function of concentration and pH. Mucins are
synthesized and secreted as oligomers, which are assumed to be non-interacting below a
Page 29 of 54
John Wiley & Sons, Inc.
Biopolymers
30
certain concentration. Above a critical concentration (c*), mucins overlap to form a semi-
dilute solution. Above a second critical concentration (ce) the molecules begin to reptate. If
the pH is dropped mucins undergo a conformational change and aggregate, forming
hydrophobic bonds between the fibres (red circles), eventually forming a gel. c* is the semi-
dilute overlap concentration and ce is the entanglement concentration.
Figure S1: Analysis of the fractions obtained from a CsCl density gradient centrifugation of
a small intestinal mucus sample (top – starting density = 1.4 g/ml). The glycoprotein rich
fractions, assessed by PAS staining (blue line and diamonds), also have a low absorption of
UV light (green line and diamonds). The density of each fraction (red line and squares) was
measured by weighing 1 ml aliquots and confirms the density gradient was formed by
centrifugation. In this case fractions 1-16 were pooled and a 2nd
density gradient (bottom -
starting density = 1.5 g/ml) was done to further isolate the mucin rich fractions. Fractions 3-
16 were pooled from the second CsCl density gradient and were subsequently dialysed
against dd H2O and then lyophilised.
Figure S2: Analysis of the 20 fractions obtained from the two steps of CsCl density gradient
centrifugation obtained during the extraction of MUC5AC from stomach mucus. The
fractions of the first density gradient (top- starting density = 1.4 g/ml) were analysed as
described and fractions 2-17 were pooled. These were further expanded with a 2nd
CsCl
density gradient (bottom – starting density = 1.5 g/ml), were fractions 2-15 were pooled,
extensively dialysed against deionised water and lyophilised.
Page 30 of 54
John Wiley & Sons, Inc.
Biopolymers
31
Figure S3: MUC5AC (a) and MUC2 (b) peptide matches from MS/MS analysis of purified
pig stomach and duodenal mucins. Since the pig genome is not yet available, we relied on
predictions of the N-terminal of pig MUC2 and MUC5AC. Matched peptides are highlighted
in red. Predictions for the N-terminal of MUC6 also exist in our database, but tandem mass-
spec experiments have not identified any peptides corresponding to MUC6.
Figure S4: The ensemble averaged MSD curves obtained from PEG coated and uncoated
polystyrene microspheres embedded in a 20 mg/ml small intestinal mucin solution. The
exponent of the power laws fitted to all of them was found to be close to ⟨������⟩~��.. The
small difference in the absolute value of MSD was attributed to small differences in size
between the coated and uncoated probe spheres.
Figure S5: MUC2 and MUC5AC share common C- and N- terminal protein domains, which
are the sites for disulphide bonding between mucins, leading to polymer formation. In
contrast, the central domain of the two mucins differs, MUC2, has only 2 cysteine-rich (cys)
domains that interrupt the central mucin domain, whereas MUC5AC has at least 8. The
tandem repeated sequences rich in serine, threonine and proline comprise the central mucin
domain. In MUC2 the number of tandem repeats can differ between individuals, a property
referred to as polymorphism.1 The different number of cys-domains could provide larger
flexibility to MUC5AC, thus explaining the slower scaling of viscosity with respect to
concentration compared to MUC2. [Illustration adapted from Ref. 1]
Page 31 of 54
John Wiley & Sons, Inc.
Biopolymers
32
Figure list:
Figure 1
10-2
10-1
100
10-15
10-14
10-13
10-12
τ0.75
⟨∆r2(τ)⟩
(m2)
Lag time (s)
1 mg/ml
2 mg/ml
3 mg/ml
4 mg/ml
5 mg/ml
10 mg/ml
15 mg/ml
20 mg/ml
25 mg/ml
30 mg/ml
35 mg/ml
40 mg/ml
45 mg/ml
50 mg/ml
τ1
Page 32 of 54
John Wiley & Sons, Inc.
Biopolymers
33
Figure 2
1 10
1
10
100
Concentration (mg/ml)
Viscosity (mPas)
c3.92±0.38
c0.53±0.08
Page 33 of 54
John Wiley & Sons, Inc.
Biopolymers
34
Figure 3
0.1 1
10-14
10-13
10-12
τ1.03±0.01
<∆r2(τ)>(m
2)
Lag time (s)
τ0.28±0.01
Page 34 of 54
John Wiley & Sons, Inc.
Biopolymers
35
Figure 4
0.01 0.1 11E-16
1E-15
1E-14
1E-13
1E-12
τ0.75
5 mg/ml
10 mg/ml
30 mg/ml
40 mg/ml
60 mg/ml
50 mg/ml
60 mg/ml
70 mg/ml
80 mg/ml
90 mg/ml
100 mg/ml
<∆r2(τ)> (m2)
Lag time (s)
τ1
Page 35 of 54
John Wiley & Sons, Inc.
Biopolymers
36
Figure 5
1 10 1001
10
100
1000
c*
Concentration (mg/ml)
Viscosity (mPas)
c5.1±0.8
c0.53±0.06
ce
Page 36 of 54
John Wiley & Sons, Inc.
Biopolymers
37
Figure 6
0.01 0.1 1
10-14
10-13
10-12
τ0.22±0.03⟨∆
r2(τ
)⟩ (m2)
Lag time (s)
τ1.02±0.01
Page 37 of 54
John Wiley & Sons, Inc.
Biopolymers
38
Figure 7
a) b)
Figure 8
0.01 0.1 1
10-15
10-14
10-13
τ0.76±0.03
⟨∆r2(τ)⟩ (m2)
Lag time (s)
τ0.73±0.02
0.01 0.1 1
10-15
10-14
10-13
10-12
τ1.01±0.02
⟨∆r2(τ)⟩
(m2)
Lag time (s)
τ0.72±0.01
0.01 0.1 1
10-14
10-13
10-12
τ0.85±0.02
2M Urea
Untreated
pH1 untreated
pH1 2 M Urea
τ0.82±0.02
⟨∆r2
(τ)⟩
(m2
)
Lag time (s)
τ0.36±0.05
τ0.89±0.02
Page 38 of 54
John Wiley & Sons, Inc.
Biopolymers
39
Figure 9
0.01 0.1 1
10-14
10-13
10-12
1% w/w EGCG
Untreated 10 mg/ml PGM
τ1.03±0.01
⟨∆r2(τ)⟩
(m2)
Lag time (s)
τ0.04±0.01
Page 39 of 54
John Wiley & Sons, Inc.
Biopolymers
40
Figure 10
Peptide
backbone
Carbohydrate
side-chain
(O-and N– linked
oligosaccharides)
Disulphide bonds
Mucin oligomer
a)
N Terminal
C Terminal
Mucin Concentration
pH
low
pH
hig
h p
H
Oligomers Semi-dilute
unentangled
Semi-dilute
entangled
Entangled gelUnentangled gel
c* ce
b)
Crosslink
Small aggregates
Crosslink
Page 40 of 54
John Wiley & Sons, Inc.
Biopolymers