participatory development of soil conservation measures …€¦ · participatory development of...
TRANSCRIPT

J. Bio. & Env. Sci. 2011
199 | Fisseha et al.
RESEARCH PAPER OPEN ACCESS
Participatory Development of Soil Conservation Measures at the
Debre-Mewi Watershed in the Upper Catchment of the Blue Nile
Basin, Northwest Ethiopia
Getachew Fisseha1*, Heluf Gebrekidan2, Kibebew Kibret2, Bobe Bedadi2, Birru Yitaferu3
1Bahir Dar University, P. O. Box 79, Bahir Dar, Ethiopia
2Haramaya University, School of Natural Resources Management and Environmental
Sciences, P. O. Box 138, Dire Dawa, Ethiopia
3Amhara Region Agricultural Research Institute, P. O. Box 527, Bahir Dar, Ethiopia
Received: 12 October 2011 Revised: 03 November 2011 Accepted: 04 November 2011
Key words: Economic analysis, land degradation, participatory SC evaluation, SC
measures, soil erosion assessment.
Abstract
This study was carried out to assess the magnitude of soil erosion by water under different management practices
[Fanyajuu with elephant grass (FEG), Fanyajuu with vetiver grass (FVG), sole Fanyajuu (SF) and non-conserved
(NC) soil], evaluate response of crop yields, and develop appropriate soil conservation (SC) techniques through
participatory approach. The experiment was conducted on farmers’ fields in 2009 and 2010 at the Debre-Mewi
Watershed (DMW) in northwest Ethiopia. The overall reductions in soil loss due to the FEG, FVG and SF were
75.1, 80.3 and 63.6%, respectively, as compared to the NC. The increments in grain yields due to the FEG, FVG
and SF as compared to the yield on the NC soil were 51.5, 48.9 and 37.7%, respectively. It was observed that the
SC measures were effective in the tested plots of the DMW in increasing yield and net return as compared to the
control plot. Since the structural conservation measure (Fanyajuu) accompanied by grass species (Vetiver and
Elephant grasses) were found to be more effective in reducing soil erosion and increasing crop production, they
were selected as promising SC techniques by all stakeholders and recommended for promotion in the DMW and
areas with similar agro-climatic and socioeconomic conditions.
*Corresponding Author: Getachew Fisseha [email protected]
Journal of Biodiversity and Environmental Sciences (JBES)
ISSN: 2220-6663 (Print) 2222-3045 (Online)
Vol. 1, No. 6, p. 199-213, 2011
http://www.innspub.net

J. Bio. & Env. Sci. 2011
200 | Fisseha et al.
Introduction
Ethiopia has a total surface area of 112 million square
kilometers of which 60% (Ethiopia, 1992) is
estimated to be suitable for cultivation but cited as
one of the country’s most seriously affected by land
degradation (Eyasu, 2002). In agreement with the
foregoing facts, the Ethiopian Highlands
Reclamation Study (EHRS) group (EHRS, 1984)
estimated that 50% (25.2) of the Ethiopian
Highlands [> 1500 meters above sea level (masl)] is
significantly eroded and 25% (12.6 million ha) is
seriously eroded. According to Herweg and Stillhardt
(1999), the northwestern highland that is
represented by the Anjeni Research Unit exhibited
the highest soil erosion rates [130-170 tons (t) ha-1
per year] on cultivated plots and it was the highest
among the nationwide monitoring sites. Unfavorable
alteration in soil physical and chemical properties by
erosion causes decline in soil productivity. Oyedele
and Aina (1998) reported maize yield reduction of
10-17% on severely eroded land as compared with
uneroded farm plots. Similarly, Oyedele and Aina
(2006) found that the reduction in maize yield
ranged from 3.2 t ha-1 on the non conserved (control)
to 0.12 t ha-1 with the conserved soil.
Although it is recognized that soil conservation (SC)
practices can substantially contribute to reversing
soil degradation, the performances of past and
ongoing SC programs in Ethiopia have, in most
cases, been disappointing. Decisions on which type
of SC measures to use and where to use them were
not made by the farmers concerned; and only rarely
was an attempt made to include indigenous
experience and knowledge (Azene, 1997; Herweg and
Ludi, 1999). The blanket approach of technology
prescription without considering the socioeconomic
context of the farmers always brings failure in
adoption of technology. It needs to be tackled
through new conservation strategies, approaches and
technologies (Azene, 1997; Woldeamlak, 2003;
Mitiku et al., 2006).
The farmers in the Watershed suffer from the
impacts of severe soil erosion by water on their farm
and grazing lands. However, they hardly take actions
to reduce soil erosion and runoff water. Thus, this
study was conducted with specific objectives to
assess the status of soil erosion in the DMW through
actual survey at plot level and to evaluate the
performance of SC techniques and crop yield
responses to the SC measures with stakeholders.
Materials and methods
The study area
Debre-Mewi Watershed (DMW), is located between
110 20’ and 110 21’ N latitude
and 370 24’ and 370 25’ E longitude, in the western
plateau of the Ethiopian highlands at the northern
source region of the Blue Nile River. It is about 30
km southeast of Lake Tana and Bahir Dar city (Fig.
1). The elevation in the watershed extends from 2200
to 2360 meters above sea level.
The study area is almost crater-shaped having an
outlet in its southwestern part (Fig. 2). The
watershed is covered by recent deposits of volcanic
materials containing alkaline to transitional basalt
with of chains of volcanic hills and gently sloping
mountains (Anteneh, 2009).
According to Addisalem (2009), the soils of the study
area are Eutric Vertisols (33.28%; 181.0 ha), Eutric
Luvisols (24.83%; 135.0 ha), Pellic Vertisols (19.55%;
106.32 ha), Eutric Cambisols (8.29%; 45.1 ha), Eutric
Fluvisols (7.43%; 40.4 ha) and Eutric Aquic Vertisols
(6.62%; 36.0 ha). The Vertisols, Luvisols and
Fluvisols are found in gently undulating lands, while
the other soil types occupy the higher altitudes.
According to the Ethiopian agro-climatic zonation
(MOA, 1998), the study area falls in the Weyna Dega
(sub-humid) climatic zone. A twenty four years
(1986-2010) climatic data from a nearby
meteorological station (Adet, 2240 masl; 10 km away
from south of the study area) recorded an average
annual precipitation of 1,167.1 mm which is

J. Bio. & Env. Sci. 2011
201 | Fisseha et al.
characterized by a uni-modal rainfall pattern (Fig. 3).
The mean annual temperature is 20.4 0C with mean
annual maximum and minimum temperatures of
26.9 and 10.8 0C, respectively. The monthly mean
temperature ranges from 17.2 0C in November and
January to 22.1 0C in May.
The natural vegetation of the Watershed is
characterized by very few forests at the eastern
upland, scattered trees, and shrubs of different
species. The dominant tree species of the natural
forest are Acacia abyssinica Hochst and Croton
macrostachyus Del., and the shrub species such as
Vernina amygdalina Del., Calpurnea aurea, Carissa
edulis, and Bersama abyssinica. Subsistence
agriculture is the main livelihood of the community
and crop-livestock mixed farming system is
predominant. Crop production in the Watershed is
exclusively based on rainfed agriculture. The crops
commonly grown in order of decreasing area
coverage are teff (Eragrostis tef), maize (Zea mays),
grass pea (Lathyrus sativus), bread wheat (Triticum
aestivum), faba bean (Vicia faba), potato (Solanum
tubersoum), and hot pepper (Capsicum frutescence).
Data source and analysis
Procedures, assessments of soil erosion and
evaluation of soil conservation (SC) practices
In the effort for the development of appropriate soil
conservation measures, first, the possible measures
were listed and defined in such a way that they can
be clearly identified and properly implemented.
Secondly, the technical effectiveness of the
alternative measures to reduce soil loss and increase
yield was assessed. Following the assessment of the
technical effectiveness, the suitability of the
alternative measures for specific conditions,
stakeholder’s preference and the associated
constraints were evaluated. Similarly, the cost-
benefit scenario of the different soil conservation
measures, in economic terms, was assessed. Lastly,
selection was made based on the potential of the
structure and grasses serving for SC as well as
fulfilling the social and environmental situations’
requirements.
The study was carried out for two seasons (2009 and
2010). The experimental plots were constructed on
farmers’ fields with average slope gradient of 20-22%
and replicated three times. The plot sizes for all
treatments and replications were 5 m wide and 12 m
long (60 m2 area) bordered by stone bunds (Plate 1)
which were inserted into the soil to a depth of 20 cm
and 25 cm high above the soil surface to prevent
lateral flows from plots to plots. The conservation
treatments used were Fanyajuu with elephant grass
(FEG), Fanyajuu with vetivar grass (FVG), sole
Fanyajuu (SF) and a control or non-conserved (NC)
plots. Treatments were arranged (classified) into
three slope positions (upper, middle and lower). The
change in depth of the soil surface due to soil
removal or deposition was determined using soil
erosion pins which were inserted in each plot.
Amount of soil eroded, crop parameters (days to
maturity, stand count, plant height, grain yield,
above ground biomass), and stakeholders (farmers,
development agents and researchers) feedback
(visual assessment on the performance of the
measures during farm visit which was rated as: 4 =
very good, 3 = good, 2 = average, 1 = unsatisfactory)
were recorded. A group of ten farmers, five
development agents, and five researchers were
participated throughout the appraisals and the
scoring process. The conservation practices (FEG,
FVG, SF, and NC) were evaluated from the
perspectives of meeting the sustainable conservation
functions. The evaluation criteria were made based
on the knowledge and experiences of the
stakeholders involved in the study, complemented by
the observation of the test plots. Each practice was
evaluated against a list of evaluation criteria
independently, and was assessed on how distant they
were from the threshold line of sustainability. As a
rule-of-thumb, a practice is said to be sustainable if it
performs > 50% of the resultant value (Birru, 2007).

J. Bio. & Env. Sci. 2011
202 | Fisseha et al.
Data analysis
The changes in depth of the soil surface due to soil
removal and/or deposition were determined using
soil erosion pins and soil loss was calculated using
the following formula (Azene, 1997):
A
DWHL2
1
2
1
T
where T is soil loss in t ha-1 per year, H is average
height of triangle in m which represent the average
depth of soil eroded and/or deposited, W is the
width of plot in m, D is bulk density of the soil (kg m-
3), ½ is constant in the formula for calculating area
of a triangle, L is the plot length (spacing) between
two adjacent measure of terrace (m), and A is the
plot size (ha) estimated from the following
relationship:
10000
WLA
Clinometer was used to measure slope change (%)
due to soil eroded or deposited from uphill per unit
area as compared to the initial slope of the plot.
The cost effectiveness of the SC measures tested was
analyzed considering the area lost due to the space
occupied by SCs, labor required for implementation
or construction of SC measures and planting
material. The benefits of SC include fodder gained
from land occupied by Fanyajuu and crop yield
gained due to SC.
The potential of the SC structure and grasses as well
as full filling the social and environmental
requirements was evaluated with Multiple Objectives
Decision Support System (MODSS). This model is
appropriate to evaluate and appraise various SC and
land management practices or land use systems from
economic, ecological and social
criteria/sustainability by rating 1-5 (Robinson, 2000
and Birru, 2007).
In order to determine statistical differences in soil
loss among treatments, the data were subjected to a
two-way analysis of variance (ANOVA) using
MSTATC software (Gomez and Gomez, 1984).
Duncan’s Multiple Range Test was used to separate
the means where significant differences were
obtained. Single linear correlation analysis was also
carried out by calculating correlation coefficients
between yield and measured soil loss as affected by
slope and conservation practices.
Results and discussion
Descriptions of selected soil characteristics of the
study area
Some selected soil physico-chemical characteristics
of the Eutric Cambisols of the experimental site are
given in Table 1. The texture of the surface soil was
clay loam. It had a bulk density value of 1.3 g cm3.
According to Tekalign (1991), the soil is classified as:
pH as moderately acidic (5.5), low organic carbon
(1.23%), and medium total N (0.12%). Medium
available P (7.35 mg kg-1) (Olsen et al., 1954) and
based on the ratings of Hazelton and Murphy
(2007), the CEC (37.67 cmol(+) kg-1) and percent base
saturation (106.2) of the soil appeared to be a higher.
The exchangeable cations are well distributed.
According to FAO (2006) ratings, high value of Ca
(35.26 cmol(+) kg-1) and Mg (3.82 cmol(+) kg-1);
medium K (0.59 cmol(+) kg-1) and Na (0.34 cmol(+) kg-
1).
Soil loss, crop parameters, economic valuation and
development of sc techniques soil loss
The actual soil loss measured under the different
treatments during the experimental period is
presented in Table 2. The two years amount of soil
eroded under FEG, FVG, SF and NC were 35.3, 28.0,
51.7 and 141.9 t ha-1, respectively. All soil
conservation treatments significantly reduced soil
loss as compared to the control. Besides, treatments
with combined structural and biological SC measures
(FVG and FEG) significantly reduced soil loss as
compared to the SF and the control. However, no
significant differences (P > 0.05) were observed in
soil loss between FVG and FEG treated plots. The
result indicated that the mean to the soil eroded and

J. Bio. & Env. Sci. 2011
203 | Fisseha et al.
that due to rill erosion at the NC were significantly (P
< 0.01) higher than those from all conserved or
treated plots (Table 2). Rills contributed the largest
amount of soil loss as compared sheet loss and the
damage was higher on NC. The two years amount of
soil loss due to rill under FEG, FVG, SF and NC were
19.8, 15.4, 32.1 and 113.1 ton/ha, respectively. The
overall percentage reduction in soil loss due to the
FEG, FVG and SF were 75.1, 80.3 and 63.6%
respectively, as compared to the NC (Fig. 4). The
average slope reduction due to conservation
measures were 2, 3 and 1% by FEG, FVG and SF,
respectively. In the contrary, under NC plots slope
was increased by 3% in two years period (Fig. 5).
Table 1. Selected soil physicho-chemical characteristics of the study site
Physical property Value Chemical property Value
Sand (%) 38.7 pH in water (1:2.5) 5.52 Silt (%) 34.1 Electrical conductivity (1:2.5) 0.07 Clay (%) 27.2 Organic carbon (%) 1.23 Textural class Clay loam Total N (%) 0.12 Bulk density (g cm-3) 1.3 Available P (mg kg-1) 7.35 Field capacity (%) 39.9 Exchangeable Ca (cmol kg-1) 35.26 PWP (%) 21.9 Exchangeable Mg (cmol kg-1) 3.81 AWC (%) 18.1 Exchangeable K (cmol kg-1) 0.59 Exchangeable Na (cmol kg-1) 0.34 CEC (cmol kg-1) 37.67 Base saturation (%) 106.2
PWP = Permanent wilting point, AWC = Available water holding capacity, CEC = Cation exchange capacity
Table 2. Two years total soil loss as affected by SC measures.
Treatment Total soil loss (t ha-1) Sheet loss (t ha-1) Rill loss (t ha-1)
Non conservation 141.9a 28.8a 113.1a Sole fanyajuu 51.7b 19.6b 32.1b Fayajuu with vetivar grass 28.0c 12.6b 15.4c Fanyajuu with elephant grass 35.3c 15.5b 19.8c LSD 8.485** 9.58* 8.87** CV (%) 13.51 52.49 19.97
Mean values within a column followed by the same letter are not significantly different at the specific probability level; *, ** = Significant at P < 0.05 and P < 0.01, respectively; LSD = least significant difference; CV = coefficient of variation Table 3. Yield and yield components (wheat) as affected by SC measures.
Treatments DPM STD (/m2)
PLH (cm)
FBM (g)
DBM (g/m2)
GY (g/m2)
Not conserved soil 107.1 84.8 82.26 809.26 680.83 207.9c Sole fanyajuu 107.8 88.7 83.68 850.00 695.15 286.3b Fanyawith Vetiver grass 107.9 93.5 84.57 877.00 710.88 309.6a Fanyajuu with elephant grass 108.2 98.8 84.60 876.72 717.08 315.9a LSD NS NS NS NS NS 8.874** CV (%) 1.23 10.9 3.79 10.50 11.13 4.72
Mean values within a column followed by the same letter are not significantly different *, ** Significant at 5% and
1% respectively, NS = non significant, DPM = days to physiological maturity, STD = stand count, PLH = plant
height, DBM = dry biomass, FBM = fresh biomass/m2, GY = grain yield/ m2
Table 4. Correlation matrix among crop yield and soil parameters.
Soil parameters and grain yield Inter-rill loss Slope Rill loss Total loss
Grain yield -0.56** -0.60** -0.90** -0.93** Inter-rill loss 0.39 0.38 0.61**
Slope 0.46* 0.5** Rill loss 0.96**

J. Bio. & Env. Sci. 2011
204 | Fisseha et al.
Table 5. Economic analysis (Ethiopian birr) at Debre-Mewi Watershed for SC measures.
SCM Inception costs Benefits
FJCC GPC
FC
TVC CB
GYkg/67.5m
2
GP
GB
NB NB (%)
FEG 20 3 50 73 60 21.26 148.84 208.84 135.84 23.41
FVG 20 3 0 23 nu 20.86 146.00 146.00 123.00 11.74
SF 20 0 0 20 0 19.31 135.14 135.14 115.14 4.59
NC 0 0 0 0 0 15.73 110.09 110.09 110.09
FEG = Fanyajuu with elephant grass, FVG = Fanyajuu with vetevar grass, SF= Sole Fanyajuu and NC = No
conservation practice, nu = not used yet, FJCC = fanyaju construction cost = 200 Mandays/1 km, GPC = grass
planting cost = 30 mandays/1 km, 1 Manday = 20 Birr, FC = fencing cost, TVC = total variable cost, CB = cutting
benefit, GY = grain yield, GP = grain price 7 birr/kg, GB = gross benefit, NB = net benefit, plot size of conserved
plots = 13.5m*5 m =67.5 m2 including Fanyajuu, while, for NC plot = 12 m * 5 m = 60 m2 but yield was converted
to 67.5 m2 for compensation of the area occupied by the FJ, adjusted
Table 6. Summary for economic analysis of SC measures at Debre-Mewi Watershed for SC measures.
Treatment Summary ha-1
NB (EB) over
control
TVC (EB) NB (EB)
Fanyajuu with elephant grass 10,814.84 20,124.10 3814.47
Fanyajuu with vetiver grass 3407.40 18,222.60 1912.97
Sole fanyajuu 2963.00 17,057.00 747.37
No conservation 0.0 16.310
TVC = Total variable cost, NB = Net benefit, EB = Ethiopian birr
Table 7. Soil conservation measures appraised weight (score) and (%) by stakeholders at Debre-Mewi Watershed
MGTO Farmers DA Researchers Overall mean Score
wt % wt % wt % wt % 1 - 4
EGF 3.01 75.35 3.11 77.78 wt 83.75 3.16 78.96 3
VGF 3.29 82.36 3.60 89.44 3.35 90.69 3.51 87.50 3
SF 2.57 64.31 2.42 60.56 3.63 56.67 2.41 60.51 2
NC 1.84 45.90 1.47 36.67 2.24 31.67 1.54 38.08 1
Note: EGF = Elephant grass with Fanyajuu, VGF = Vetevar grass with Fanyajuu, SF= Sole Fanyajuu and NC = no
conservation practice, DAs’ = development agents, wt = weight; weight score: 4 = very good, 3 = good, 2 =
average, 1 = not good; Percentage: > 50% is sustainable
Table 8. Two years sediment accumulation of soil inside pit below the control plot
Rep BD (g cm-3)
L (m)
W (m)
D (m)
A (m2)
VA (m3)
V/A (m3/m2)
TA (ton/ha)
PM (ton/ha)
I 1.15 1.5 5.0 0.55 1.38 2.06 0.03 395.31 388.75 II 1.32 1.5 5.0 0.53 1.33 1.99 0.03 437.25 431.5 III 1.36 1.5 5.0 0.55 1.38 2.06 0.03 467.50 457.1 Mean 1.3 1.5 5.0 0.54 1.34 2.01 0.03 433.35 425.8
Rep = replication, BD = bulk density, L = Length, W = Width, D = Depth, A = cross-sectional area, VA = Volume
accumulation, V/A = Volume/area, TA = Total accumulation, and PM = Plot measured

J. Bio. & Env. Sci. 2011
205 | Fisseha et al.
Fig.1. Location map of Debre-Mewi watershed.
These soil loss values are in consent with those of the
previous studies, which reported soil loss values on
different slopes and SC practices ranging from 16 to
300 t ha-1yr-1 (Azene, 1997; Betru, 2003; Nyssen et
al., 2007). In line with the soil loss reduction due to
SC practices, Azene (1997) indicated that kabs (stone
terrace) constructed on steeper slopes resulted in
significant modification of slope from the initial
slope of 25, 17, 32 and 38% resulting in a net
decrease of 8, 5, 14 and 18% slope respectively in
three years time. Results obtained from test plots at
the Andit-Tid (north Shewa) SCRP site indicated that
soil loss is reduced by 32% with graded bunds, 54%
with graded Fanyajuu, and 66% with grass strip
(Betru, 2003). On average, after stone bund building
in Tigray, slope gradient decreases by 1% every 3
year (Nyssen et al., 2007)
The difference in soil loss among the upper, middle
and lower position of the plots was very small. There
was no significant difference among the three
positions of the treated plots that showed except
control plot higher soil loss at the lower position
(133.1 upper; 138.9 mid and 154.1 lower positions).

J. Bio. & Env. Sci. 2011
206 | Fisseha et al.
This is in agreement with Assefa (2009) who
reported the loss in the down slope position was
significantly greater than with the mid and upslope
fields of farmers practices.
Fig. 2. Aerial view of the landscape of Debre-Mewi watershed (image from Google Earth, 2007).
Crop parameters
Although there was no significant (P > 0.05) effect of
soil conservation on days to maturity, stand count,
plant height and dry biomass, the use of these
measures showed an increasing mean value in these
crop parameters (Table 3). The order of these crop
parameters obtained was FEG > FVG > SF > NC.
Significant differences (P ≤ 0.01) due to SC
treatments were observed with respect to grain yield
(Table 3). The soil conservation measures highly
significantly increased grain yield as compared to the
control (Table 3 and Plate 2). With FEG (315.9 g m-2)
and FVG (309.6 g m-2), significantly higher yield

J. Bio. & Env. Sci. 2011
207 | Fisseha et al.
were produced than the NC (207.9 g/m2). Though
soil loss under FVG was lower than FEG, yield in
FEG was slightly greater than that of FVG in two
years of the study. This may result from the lower
biomass produced with vetiver grass (first copping
season) compared to elephant grass (Plate 2) or the
slow improvement in soil quality with
implementation of conservation practices. But in the
second season, vetiver grass formed a dense
permanent hedge and strong root system so that
conserve and binds the soil very well (Plate 2).
Fig. 3. Mean monthly rainfall (RF), maximum and
minimum temperatures (Temp) of the Debre-Mewi
Watershed (1986 -2010).
Fig. 4. Percent Reduction in soil loss due to the soil
conservation practices as compared to the control
(EGF = Elephant grass with Fanyajuu, VGF =
Vetevar grass with Fanyajuu, SF= Sole Fanyajuu).
This result was in agreement with the findings of
other researchers who obtained the best crop yield
with proper soil conservation and fertilizer
application. Since erosion reduces yield (Kebrom,
1999; Walley et al., 1999; Sonneveld and Keyzer,
2003; Nyssen et al., 2004 and Haileslassie et al.,
2005), the lowest yield was obtained under NC (non
conserved plot). On severely eroded soils, less yield
has obtained than on slightly and moderately eroded
phases (Mokma and Seitz, 1992).
Fig. 5. Changes in slope gradients due to soil
movement and effect of SC practices (EGF =
Elephant grass with Fanya juu, VGF = Vetevar grass
with Fanya juu, SF= Sole Fanya juu, NC = no
conservation practices).
Fig. 6. Yield increments (%) by SC as compared to
the non-conserved soil.
The overall percentage increments in yield due to
FEG, FVG and SF were 51.5, 48.9 and 37.7%
respectively as compared to NC (Fig. 6). There are
also similar reports in other studies. For instance,
the average barley yields of above the bund (soil
accumulation area) was 43% higher than below the
bund (soil loss area) of fanyajuu terraces in the Andit
Tid area of northern Shoa, Ethiopia (Yohannes,
1989). Gebre Egziabher (1988) also found that soil
bunds are effective in controlling soil erosion in a
study from the Gununo twin watershed, Sidamo
Research Unit of SCRP. Yields of maize were found

J. Bio. & Env. Sci. 2011
208 | Fisseha et al.
to be higher in the soil accumulation zone (above
bunds) than in the soil loss zone (below bunds).
Plate 1. Field plots layout (A), sediment collection
pit at the lower slope positions of the control plot (B)
and grass treated bund (C).
Simple correlation coefficient among grain yield and
inter-rill, slope, rill and total loss gave a negative
value of r = -0.56**, -0.60**, -0.90** and -0.93**,
respectively (Table 4). These indicate that higher
erosion rate have contributed to grain yield
reduction. Valdés (1994) assessed the relationship
between erosion and yield using linear regression
analysis in two areas of Honduras. The analysis
produces negative relationships with correlation
coefficients, R², of 0.73 and 0.77 respectively,
indicating a high level of explanation. The same
author assessed the economic viability of investment
for scenarios with and without soil conservation
measures. It is assumed that for scenarios without
conservation, production ceases when yields fall to a
specific level below which production is assumed to
be no longer profitable. In scenarios with
conservation, the analysis limits yields such that they
cannot increase above the maximum sustainable
yield that can be achieved in the region.
Plate 2. Fanyajuu with elephant grass performs well
in SC (A and B) during the first cropping season
while vetiver not (C) but both of them established
well (D) in the second year.
Valuation of on-site effect of soil conservation
The impacts of SC measures on agricultural
production are complex and highly situation specific.
A farmer may experience loss in crop area due to the
occupation of land by conservation measures.
Excessive increase in soil moisture capacity can also
cause water logging and reduce yields, etc. Therefore,
to see the validity of these conservation measures in
different situations, economic analysis was
performed (Tables 5 and 6). In this study, land
management becomes the single largest factor
influencing the performance of the crop production.
Moreover, the same amount of other inputs was
applied to all treatments. Therefore, direct costs
incurred in this study were labor cost for Fanyajuu
(F) construction, grass planting and fencing costs.
The major benefit of the conservation technologies
considered in the analysis is the saved yield due to
reduced amount of soil erosion. Therefore, the

J. Bio. & Env. Sci. 2011
209 | Fisseha et al.
tangible benefit from these technologies is the
conserved amount of wheat yield multiplied by the
unit price of wheat during entire period. The other
benefit of adopting conservation technologies is the
improvement in the soil organic matter which
increases soil quality and ultimately the value of
land. However, these values are not considered in the
analysis. Nevertheless, value of fodder from Elephant
grass (EG) hedges are additional benefit of the hedge
rows system (Plate 3).
Plate 3. Fodder from Elephant grass hedges are
additional benefit for the farmers.
Plate 4. Sediment accumulation inside pits from the
3 replications of the control plot.
It was observed that SC measures were effective in
tested plots of DMW in increasing yield and net
return as compared to the control plot. The variable
cost was the highest under EGF, but in spite of this,
SC method proved profitable as compared to other
treatments. The net benefit was increased by 23.41,
11.74 and 4.59% under EGF, VGF and SF,
respectively over the control.
The profitability analysis of the same SC methods in
hectare bases for wheat crop is given in Table 6.
Although the variable cost was higher than the
others, net return obtained was found greatest under
EGF that was followed by VGF. The yield obtained
under EGF was the highest among all treatments.
Therefore, the net benefit in Ethiopian birr was
3814.47, 1912.97, and 747.37 under EGF, VGF and
SF, respectively over the control. Though the Vetiver
grass did not provide additional benefit in two years
time, it was more efficient in control of soil erosion
than even Elephant grass (Plate 2 D). It could also
provide thatch grass from which farmers can use for
various household activities in the long run. That is
why it was selected as the best soil control measure
by farmers, development experts and researchers as
we see in the next section.
According to Hudson (1992) the grass should be
vigorous, easily propagated, provide good quantity of
palatable fodder and not invasive into the crop area
in order to be effective. In this case, elephant grass
fulfills the criteria. However, livestock must be kept
away from this grass. That is why fencing was
considered in the variable cost. Grass which is
unsuitable for fodder can be used, such as Vetiver
grass (Vetivera zizanioides). Vetiver is quite
commonly used for this purpose since it can be
grown almost universally (Morgan and Rickson,
1995). Generally, application of SC measures
significantly increased the grain yield of the study
site.
Development of sustainable land management
options
Soil and cropping management practices (improved
and traditional practices) were evaluated to see if
they meet the various functions of sustainability
(economic, ecological and social functions) (Birru,
2007). The values as percentage and weight (score)
in the appraisals by different stakeholder for SC
measures are shown in Table 7. Of the tested of
management alternatives, all groups (farmers,
development experts and researchers) gave the
highest value for VGF followed by EGF and SF. As a
result, the overall mean were about 87.50, 78.96,
60.51 and 38.08% for VGF, EGF, SF, and NC,
respectively. As a rule-of-thumb, any management
practice whose overall value is less than 50% is said
to be unsustainable (Birru, 2007). In this regard, all
J. Bio. & Env. Sci. 2011
210 | Fisseha et al.
groups scored low value to the control plot (NC). The
overall weight score value for NC also less than 2 and
is said to be unsustainable (unsatisfactory) (Table 7).
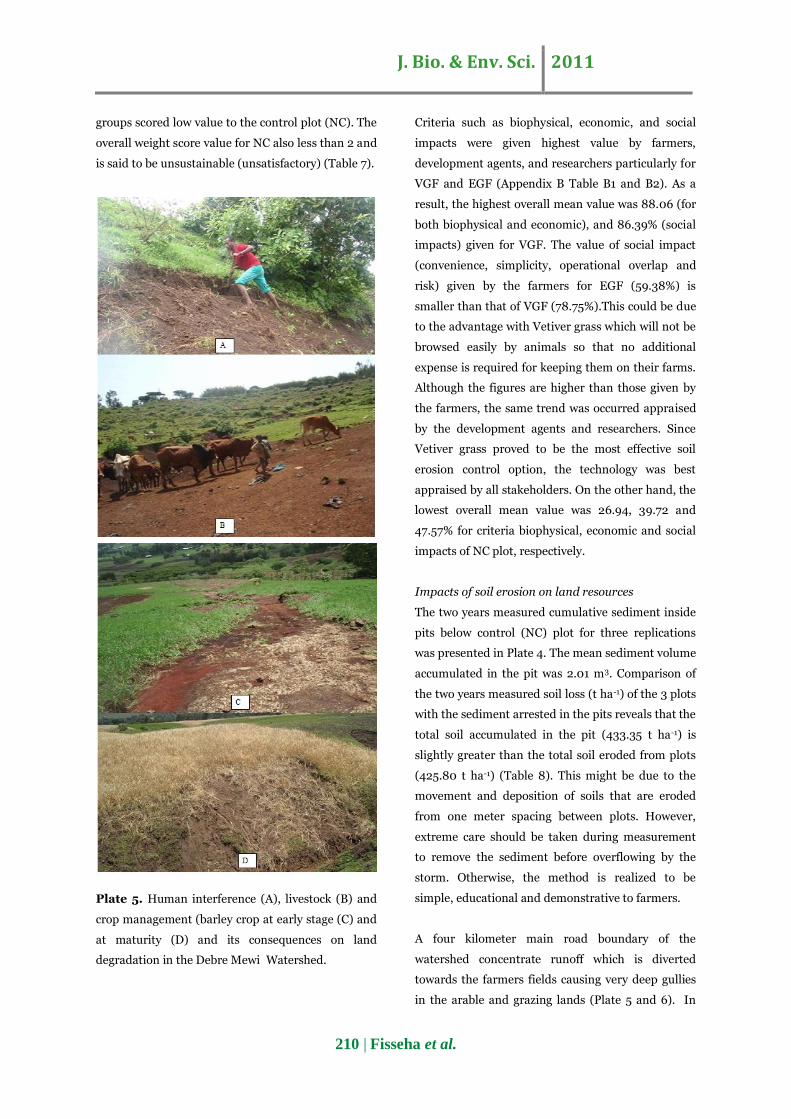
Plate 5. Human interference (A), livestock (B) and
crop management (barley crop at early stage (C) and
at maturity (D) and its consequences on land
degradation in the Debre Mewi Watershed.
Criteria such as biophysical, economic, and social
impacts were given highest value by farmers,
development agents, and researchers particularly for
VGF and EGF (Appendix B Table B1 and B2). As a
result, the highest overall mean value was 88.06 (for
both biophysical and economic), and 86.39% (social
impacts) given for VGF. The value of social impact
(convenience, simplicity, operational overlap and
risk) given by the farmers for EGF (59.38%) is
smaller than that of VGF (78.75%).This could be due
to the advantage with Vetiver grass which will not be
browsed easily by animals so that no additional
expense is required for keeping them on their farms.
Although the figures are higher than those given by
the farmers, the same trend was occurred appraised
by the development agents and researchers. Since
Vetiver grass proved to be the most effective soil
erosion control option, the technology was best
appraised by all stakeholders. On the other hand, the
lowest overall mean value was 26.94, 39.72 and
47.57% for criteria biophysical, economic and social
impacts of NC plot, respectively.
Impacts of soil erosion on land resources
The two years measured cumulative sediment inside
pits below control (NC) plot for three replications
was presented in Plate 4. The mean sediment volume
accumulated in the pit was 2.01 m3. Comparison of
the two years measured soil loss (t ha-1) of the 3 plots
with the sediment arrested in the pits reveals that the
total soil accumulated in the pit (433.35 t ha-1) is
slightly greater than the total soil eroded from plots
(425.80 t ha-1) (Table 8). This might be due to the
movement and deposition of soils that are eroded
from one meter spacing between plots. However,
extreme care should be taken during measurement
to remove the sediment before overflowing by the
storm. Otherwise, the method is realized to be
simple, educational and demonstrative to farmers.
A four kilometer main road boundary of the
watershed concentrate runoff which is diverted
towards the farmers fields causing very deep gullies
in the arable and grazing lands (Plate 5 and 6). In
J. Bio. & Env. Sci. 2011
211 | Fisseha et al.
line with this, Nyssen et al. (2002) concluded that
roads concentrate runoff, significantly increasing the
formation of gullies, as well as changing the size and
shape of watershed. Besides the soil loss through
erosion, loss of species diversity was found to be
critical in the watershed (Plate 6). Because of this
mismanagement of the land resources, gullies are
frequent and considerable area of the watershed has
become no longer able to produce crop/grass
resulting in expansion of rock-outcrop. Thus, from
the status of land cover and its dynamics it is evident
that considerable areas of the study areas are
exposed to land degradation. As a result during the
analysis period large areas of the study site was
exposed to the processes of soil erosion and immense
loss of biodiversity.
Conclusions
Land degradation caused by soil erosion is a major
threat to the sustainability of agriculture. The
measured soil loss in the experimental plots revealed
that soil erosion is a threat to agricultural production
in the study area suggesting the need for
conservation measures. This study revealed that,
structural conservation measure (Fanyajuu)
accompanied by grass species (Vetivar and Elephant
grasses) are found to be effective methods of soil
erosion control.
Adverse effects of erosion on crop yield and
productivity can be mitigated by adopting proper soil
conservation practices. The field experiment
revealed that SC measures were profitable and gave
net increased income over farmer's practices in
wheat (2-years) cropping season.
Ensuring the full involvement of stakeholders in the
process of identifying problems, planning solutions,
and implementation and evaluation of outcomes is
not only an option but also a necessity to a successful
sustainable land management. Our research results
regarding the SC appraisals indicate that shared
knowledge among stakeholders was found to be
higher. Participatory research approach used in this
study has tried to narrow the knowledge gap among
the stakeholders. In conclusion, the problem of land
degradation needs to be addressed in the context of
participatory integrated watershed approach.
Acknowledgements
The authors are grateful for the financial support by
the Haramaya University. Our acknowledgement
goes to the Bahir Dar University, Amhara Region
Agricultural Research Institute (ARARI) and Adet
Agricultural Research Center for their cooperation to
implement this study in the DMW. We also thank
Sosina Getachew for covering the expense of
publishing the article and the local residents of the
study area for their enthusiastic participation in the
interviews, group discussions and of hotspot areas of
land degradation suggested by the authors.
References
Addisalem A. 2009. Agricultural land suitability
evaluation for rainfed crops using GIS and RS
techniques: A Case Study of Debre-Mewi Watershed.
M. Sc. Thesis, Bahir Dar University, Ethiopia.
Anteneh Z. 2009. Geological controls in the
formations and expansions of gullies over hill slope
hydrological processes in the highlands of Ethiopia,
Northern Blue Nile Region. MSc Thesis, Cornell
University and Bahir Dar University, Bahir Dar,
Ethiopia.
Assefa D. 2009. Assessment of upland erosion
processes and farmer’s perception of land
conservation in Debre-Mewi Watershed, near Lake
Tana, Ethiopia. M.Sc Thesis Thesis, Cornell
University and Bahir Dar University, Bahir Dar,
Ethiopia.
Azene B. 1997. A participatory agroforestry
approach for soil and water conservation in Ethiopia.
PhD Thesis, Wageningen Agricutureal University,
The Netherlands.
Betru N. 2003. Soil and water conservation
program in the Amhara National Regional State. In

J. Bio. & Env. Sci. 2011
212 | Fisseha et al.
Tilahun Amede (ed.). 2003. Natural Resource
Degradation and Environmental Concerns in the
Amhara National Regional State: Impact on Food
Security. Ethiopian Soil Science Society. Pp. 173-183.
Birru Y. 2007. Land degradation and options for
sustainable land management in Lake Tana Basin
(LTB), Amhara Region, Ethiopia. PhD dissertation.
Switzerland.
EHRS (Ethiopian Highlands Reclamation
Study). 1984. Annual Report (1983-1984) of the
Ethiopian Highlands Reclamation Study, Addis
Ababa.
Ethiopia. 1992. National Report on Environment
and Development: A report prepared for United
Nations Conference on Environment and
Development in Rio de Janeiro, Brazil. Transitional
Government of Ethiopia Addis Ababa, Ethiopia.
Eyasu E. 2002. Farmers perceptions of soil
fertility. PhD Theses, School of Development Studies
of The University of East Angla Published by
Institute for Sustainable Development Addis Ababa,
Ethiopia.
FAO (Food and Agriculture Organization).
2006. Plant nutrition for food security: A guide for
integrated nutrient management. FAO, Fertilizer and
Plant Nutrition Bulletin 16, Rome.
Gebre Egziabher A. 1988. Socio-economic and
ecological analysis of soil conservation in Ethiopia:
Cases from Gununo Twin catchments. M.Sc. Thesis,
Agricultural University of Norway (NLH).
Gomez AK, Gomez, AA. 1984. Statistical
procedure for agricultural research 2nd ed. Inter
national Rice Research Institute Book. A Wiley Inter
science Publication New York.
Haileslassie A, Priess J, Veldkamp E, Demil
T, Lesschen, J. P. 2005. Assessment of Soil
nutrient depletion and its spatial variability on
smallholders' mixed farming Systems in Ethiopia
using partial versus full nutrient balances, Agric.
Ecosys. Environ. 108.
Hazelton P, Murphy B. 2007. Interpreting soil
test results: What do all the numbers mean? 2nd
Edition. CSIRO Publishing. p. 152.
Herweg K, Ludi E. 1999. The performance of
selected soil and water conservation measures- case
studies from Ethiopia and Eritrea. Catena, 36, 99-
144.
Herweg K, Stillhardt B. 1999. The variability of
soil erosion in the highlands of Ethiopia and Eritrea,
Research Report (42). Soil Conservation Research.
Hudson NW. 1992. Field measurement of soil
erosion and runoff. In FAO Bulletin No 68. Silsoe
Associates. Amphil. Belford, United Kingdom.
Kebrom T. 1999. Land degradation problems and
their implications for food shortages in South Wello,
Ethiopia, Environ. Manage., 23 (4), 419-427.
Mitiku H, Herwig K, Stillhardt B. 2006.
Sustainable land management- A new Approach to
Soil and Water Conservation in Ethiopia. Mekelle,
E t h i o p i a . M e ke l le Un i v e r s i t y ; C en t e r fo r
Development and Environment (CDE), University of
Bern and Swiss National Center of Competence in
r e s e a r c h ( N C C R ) N o r t h - S o u t h . p . 2 6 9 .
MOA (Ministry of Agriculture). 1998. Agro-
ecological zones of Ethiopia, Natural Resources
Management and Regulatory Department, Addis
Ababa, Ethiopia.
Mokma D. L, Seitz MA. 1992. Effect of soil
erosion on corn yields on Marlette soil in South-
Central Michigan. J. Soil and Water Cons., 47: 325-
327.

J. Bio. & Env. Sci. 2011
213 | Fisseha et al.
Morgan RPC, Rickson RJ. 1995. Water erosion
control. pp. 133-199. In: R.P.C. Morgan and R.J.
Rickson (eds.), Slope stabilization and erosion
control: a bioengineering approach. E & FN Spon,
London.
Nyssen J, Poesen J, Moeyersons J, Luyten C,
Veyerety Picot, M, Deckers J, Mitiku H,
Govers G. 2002. Impact of road building on gully
erosion risk: a case study from the northern Ethiopia
highlands. Earth Surface Processesses and
Landforms 27, 1267-1283.
Nyssen J, Poesen J, Moeyersons J, Deckers J,
Mitiku H, Lang A. 2004. Human impact on the
environment in the Ethiopian and Eritrean
highlands-a state of the art, Earth Sci. Rev. 64, 273-
320.
Nyssen J, Munro R.N, Mitiku H, Poesen J,
Descheemaeker K, Nigussie H, Moeyersons J,
Govers G, Deckers J. 2007. Understanding the
environmental changes in Tigray: a photographic
record over 30 years. Tigray Livelihood Papers No. 3,
VLIR – Mekelle University IUC Programme and
Zala-Daget Project, p. 82.
Olsen SR, Cole CV, Watanabe FS, Dean L.A.
1954. Estimation of available phosphorus in soil by
extraction with sodium bicarbonate USDA, Circ 939.
Oyedele DJ, Aina PO. 1998. A study of soil
factors in relation to erosion and yield of maize on a
Nigerian soil. Soil. Till Res., 48, 115-125.
Oyedele DJ, Aina PO. 2006. Response of soil
properties and maize yield to simulated erosion by
artificial topsoil removal. Plant Soil. 284: 375-384.
Robinson J. 2000. Motivating stakeholders to
participate in natural resource management:
Assesment of the outcomes from a multiple objective
decision support system. Natural Resource
Management 3(2), 25-30. The University of
Queensland, Australia.
Sonneveld BG, Keyzer J S. 2003. Land under
pressure: soil conservation concerns and
opportunities for Ethiopia, Land Degrad. Dev. 14, 5-
23.
Tekalign T. 1991. Soil, plant, water, fertilizer,
animal manure and compost analysis. Working
Document No. 13. International Livestock Research
Center for Africa, Addis Ababa.
Tilahun Y. 1996. Impacts of conservation bunds on
crop yields in Degua Tembien, northern Ethiopia.
M.Sc. thesis, Agricultural University of Norway
(NLH).
Valdés PA. 1994. Economic analysis of soil
conservation in Honduras in E. Lutz, S. Pagiola, & C.
Reiche (eds) Economic and institutional analyses of
soil conservation projects in Central America and
the Caribbean. World Bank Environment Paper No.
8, The World Bank, Washington DC p. 63-74.
Walley, FL, Lafond GP, Matus A, Kessel CV.
1999. Water use efficiency and carbonisotopic
compostition in reduced tillage system. Soil Sci. Soc.
Am.J., 63, 356-361.
Woldeamlak B. 2003. Towards integrated
watershed management in highland Ethiopia: the
Chemoga watershed case study. PhD Thesis.
Wageningen University, The Netherlands.
Yohannes GM. 1989. Crop production and
conservation methods in Andit Tid area, northern
Shoa. Soil Conservation Research Project, Addis
Ababa.