parent guide - camelot academymedia.camelotacademy.org/documents/2016/parent_guide_subscore... ·...
TRANSCRIPT
PARENT GUIDEUNDERSTANDING YOUR CHILD'S INDIVIDUAL SUBSCORE REPORT
WITH LEXILE® AND QUANTILE® MEASURES
percentage of the questions that your child answered correctly. The percentile rank is a percentage of students in a norm group. Look at the sample student's Quantitative Reasoning score percentile rank in the independent norm group. This percentile rank indicates what percentage of students at independent schools the sample student scored higher than on Quantitative Reasoning. The comparison is made against independent school students who took Quantitative Reasoning while they were in the same grade that the sample student is currently in.
Because some norm groups perform better than others, your child’s percentile rank will differ from one norm group to another. A student’s percentile rank will be lower in a stronger norm group and higher in a weaker norm group. The students in schools using the CTP tend to be an academically strong group in comparison to all students in the nation. Because of this, the sample student's Quantitative Reasoning score has a lower percentile rank in the independent norm group, than in the national norm group.
WHAT IS A STANINE?A stanine is another way of comparing your child’s performance with the performance of a norm group. Stanines are formed by dividing the students in the norm group into nine subgroups on the basis of their test scores. These subgroups are called “stanines” and are numbered 1 to 9, lowest to highest.
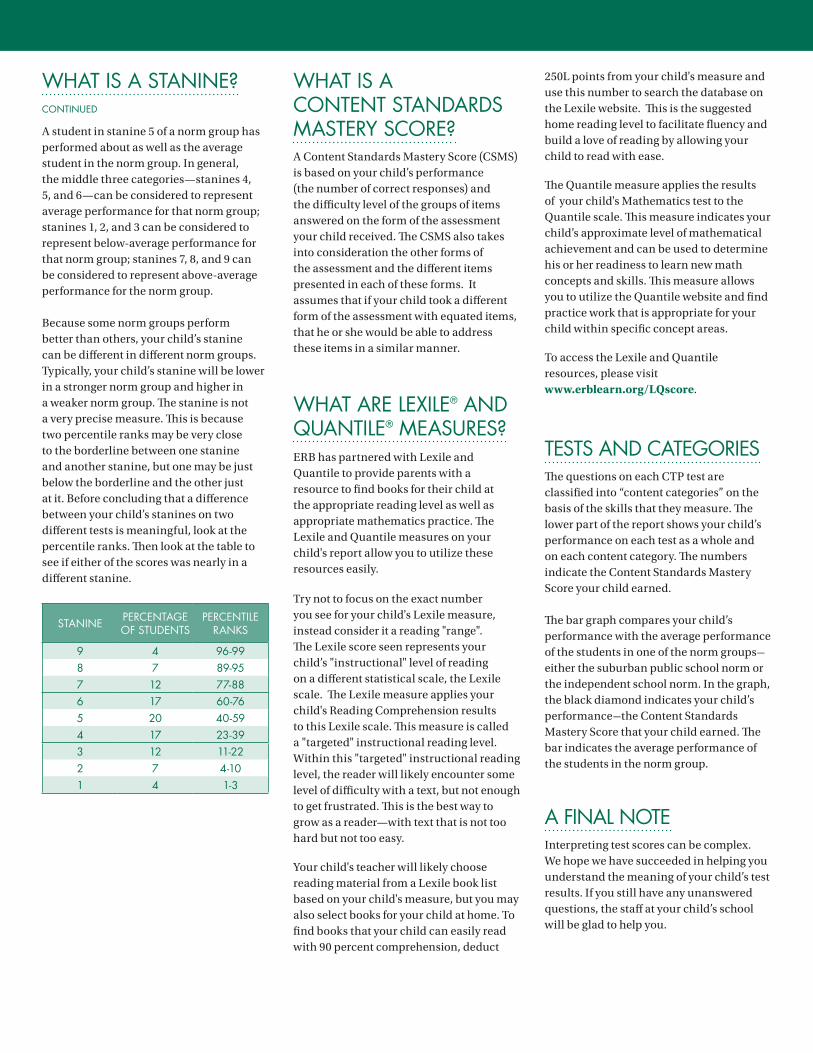
The nine subgroups are not all the same size. The middle stanines include more students; those at either end include fewer students. Stanine 5 is the largest; stanines 1 and 9 are the smallest. The following table shows the percentage of the students in the norm group who are in each stanine. Because these percentages are always the same, each stanine is associated with a range of percentile ranks. Those percentile ranks are also shown in the table.
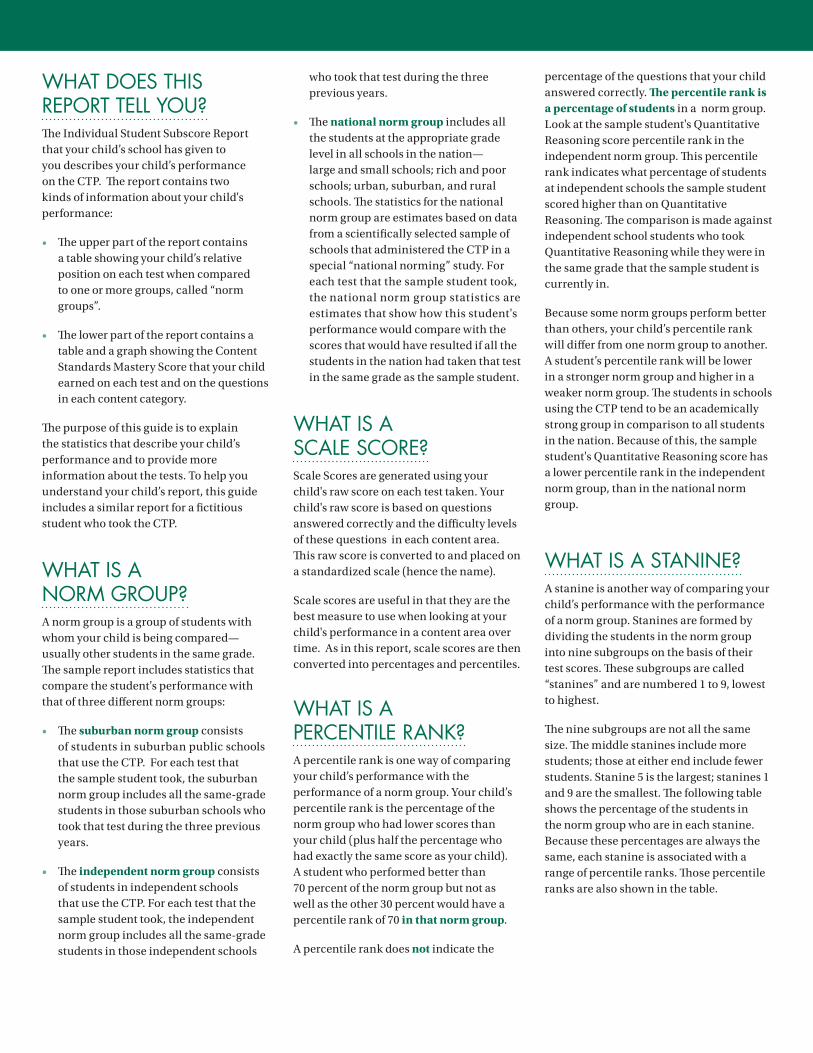
WHAT DOES THIS REPORT TELL YOU?The Individual Student Subscore Report that your child’s school has given to you describes your child’s performance on the CTP. The report contains two kinds of information about your child's performance:
• The upper part of the report contains a table showing your child’s relative position on each test when compared to one or more groups, called “norm groups”.
• The lower part of the report contains a table and a graph showing the Content Standards Mastery Score that your child earned on each test and on the questions in each content category.
The purpose of this guide is to explain the statistics that describe your child’s performance and to provide more information about the tests. To help you understand your child’s report, this guide includes a similar report for a fictitious student who took the CTP.
WHAT IS A NORM GROUP?A norm group is a group of students with whom your child is being compared— usually other students in the same grade. The sample report includes statistics that compare the student's performance with that of three different norm groups:
• The suburban norm group consists of students in suburban public schools that use the CTP. For each test that the sample student took, the suburban norm group includes all the same-grade students in those suburban schools who took that test during the three previous years.
• The independent norm group consists of students in independent schools that use the CTP. For each test that the sample student took, the independent norm group includes all the same-grade students in those independent schools
who took that test during the three previous years.
• The national norm group includes all the students at the appropriate grade level in all schools in the nation— large and small schools; rich and poor schools; urban, suburban, and rural schools. The statistics for the national norm group are estimates based on data from a scientifically selected sample of schools that administered the CTP in a special “national norming” study. For each test that the sample student took, the national norm group statistics are estimates that show how this student's performance would compare with the scores that would have resulted if all the students in the nation had taken that test in the same grade as the sample student.
WHAT IS A SCALE SCORE?Scale Scores are generated using your child's raw score on each test taken. Your child's raw score is based on questions answered correctly and the difficulty levels of these questions in each content area. This raw score is converted to and placed on a standardized scale (hence the name).
Scale scores are useful in that they are the best measure to use when looking at your child's performance in a content area over time. As in this report, scale scores are then converted into percentages and percentiles.
WHAT IS A PERCENTILE RANK?A percentile rank is one way of comparing your child’s performance with the performance of a norm group. Your child’s percentile rank is the percentage of the norm group who had lower scores than your child (plus half the percentage who had exactly the same score as your child). A student who performed better than 70 percent of the norm group but not as well as the other 30 percent would have a percentile rank of 70 in that norm group.
A percentile rank does not indicate the
WHAT IS A CONTENT STANDARDS MASTERY SCORE?A Content Standards Mastery Score (CSMS) is based on your child’s performance (the number of correct responses) and the difficulty level of the groups of items answered on the form of the assessment your child received. The CSMS also takes into consideration the other forms of the assessment and the different items presented in each of these forms. It assumes that if your child took a different form of the assessment with equated items, that he or she would be able to address these items in a similar manner.
WHAT ARE LEXILE® AND QUANTILE® MEASURES?ERB has partnered with Lexile and Quantile to provide parents with a resource to find books for their child at the appropriate reading level as well as appropriate mathematics practice. The Lexile and Quantile measures on your child's report allow you to utilize these resources easily.
Try not to focus on the exact number you see for your child's Lexile measure, instead consider it a reading "range".The Lexile score seen represents your child’s "instructional" level of reading on a different statistical scale, the Lexile scale. The Lexile measure applies your child's Reading Comprehension results to this Lexile scale. This measure is called a "targeted" instructional reading level. Within this "targeted" instructional reading level, the reader will likely encounter some level of difficulty with a text, but not enough to get frustrated. This is the best way to grow as a reader—with text that is not too hard but not too easy.
Your child's teacher will likely choose reading material from a Lexile book list based on your child's measure, but you may also select books for your child at home. To find books that your child can easily read with 90 percent comprehension, deduct
250L points from your child's measure and use this number to search the database on the Lexile website. This is the suggested home reading level to facilitate fluency and build a love of reading by allowing your child to read with ease.
The Quantile measure applies the results of your child's Mathematics test to the Quantile scale. This measure indicates your child’s approximate level of mathematical achievement and can be used to determine his or her readiness to learn new math concepts and skills. This measure allows you to utilize the Quantile website and find practice work that is appropriate for your child within specific concept areas.
To access the Lexile and Quantile resources, please visit www.erblearn.org/LQscore.
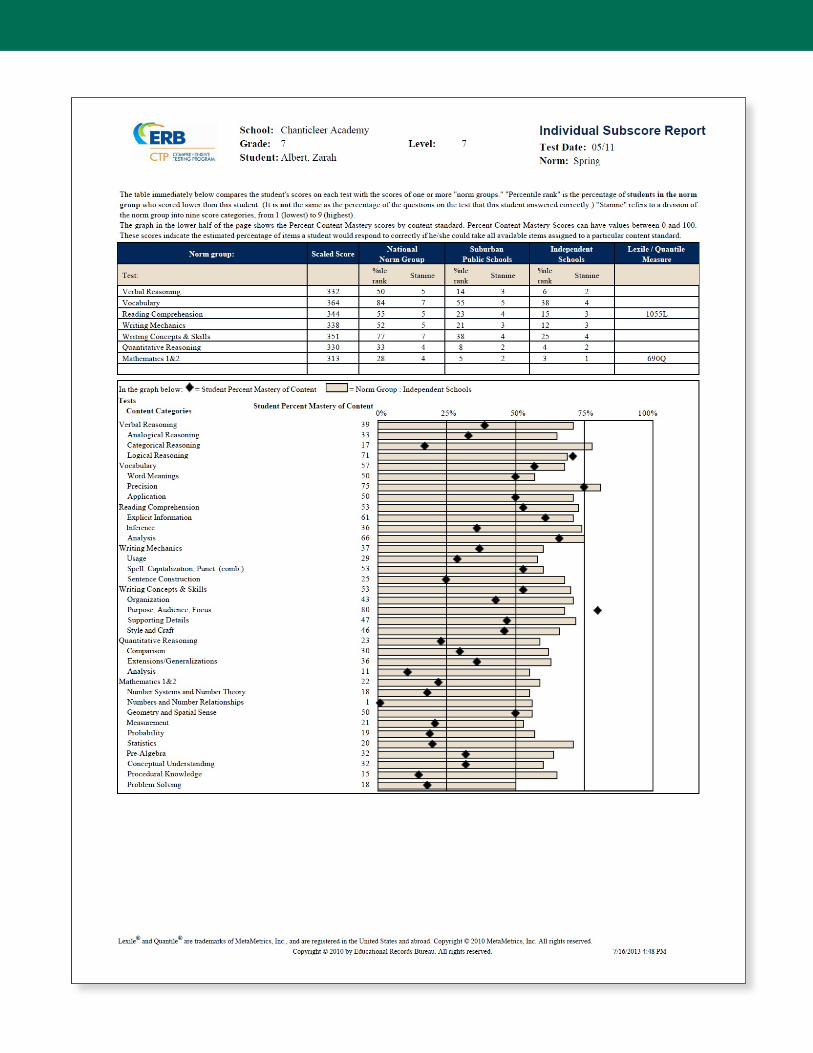
TESTS AND CATEGORIESThe questions on each CTP test are classified into “content categories” on the basis of the skills that they measure. The lower part of the report shows your child’s performance on each test as a whole and on each content category. The numbers indicate the Content Standards Mastery Score your child earned.
The bar graph compares your child’s performance with the average performance of the students in one of the norm groups-either the suburban public school norm or the independent school norm. In the graph, the black diamond indicates your child’s performance-the Content Standards Mastery Score that your child earned. The bar indicates the average performance of the students in the norm group.
A FINAL NOTEInterpreting test scores can be complex. We hope we have succeeded in helping you understand the meaning of your child’s test results. If you still have any unanswered questions, the staff at your child’s school will be glad to help you.
WHAT IS A STANINE?CONTINUED
A student in stanine 5 of a norm group has performed about as well as the average student in the norm group. In general, the middle three categories—stanines 4, 5, and 6—can be considered to represent average performance for that norm group; stanines 1, 2, and 3 can be considered to represent below-average performance for that norm group; stanines 7, 8, and 9 can be considered to represent above-average performance for the norm group.
Because some norm groups perform better than others, your child’s stanine can be different in different norm groups. Typically, your child’s stanine will be lower in a stronger norm group and higher in a weaker norm group. The stanine is not a very precise measure. This is because two percentile ranks may be very close to the borderline between one stanine and another stanine, but one may be just below the borderline and the other just at it. Before concluding that a difference between your child’s stanines on two different tests is meaningful, look at the percentile ranks. Then look at the table to see if either of the scores was nearly in a different stanine.
STANINE PERCENTAGE OF STUDENTS
PERCENTILE RANKS
9 4 96-998 7 89-957 12 77-886 17 60-765 20 40-594 17 23-393 12 11-222 7 4-101 4 1-3
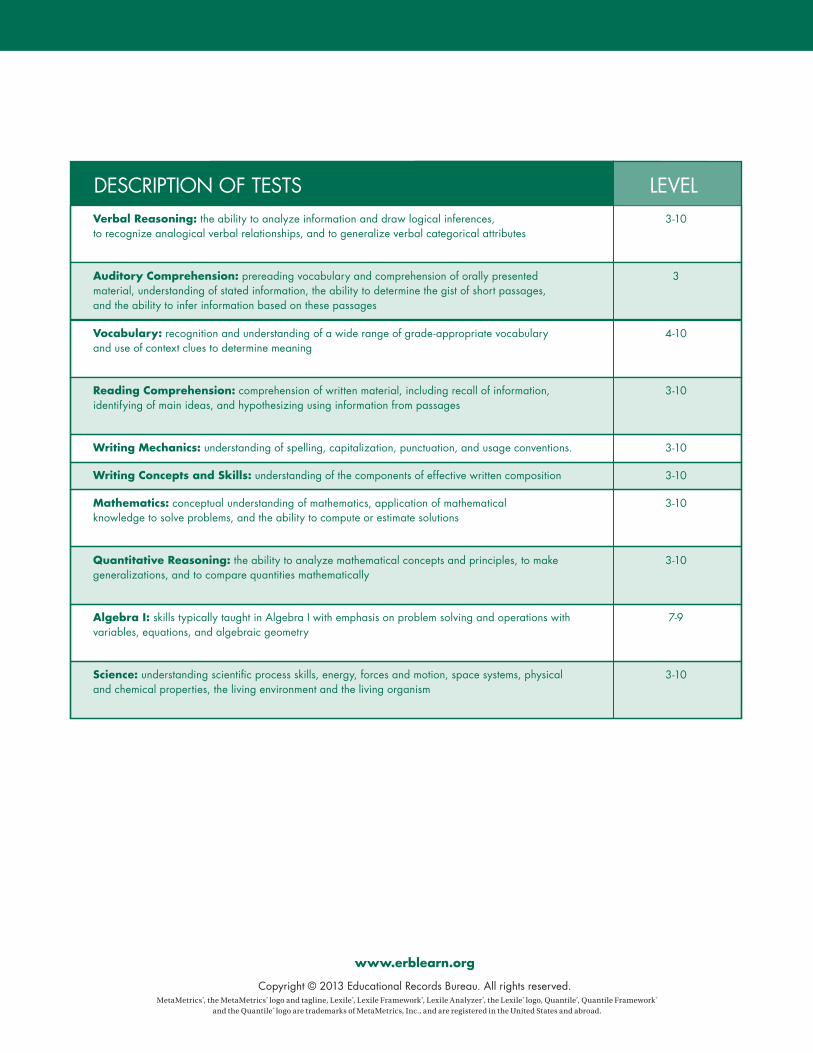
Verbal Reasoning: the ability to analyze information and draw logical inferences, to recognize analogical verbal relationships, and to generalize verbal categorical attributes
Auditory Comprehension: prereading vocabulary and comprehension of orally presented material, understanding of stated information, the ability to determine the gist of short passages, and the ability to infer information based on these passages
Vocabulary: recognition and understanding of a wide range of grade-appropriate vocabulary and use of context clues to determine meaning
Reading Comprehension: comprehension of written material, including recall of information, identifying of main ideas, and hypothesizing using information from passages
Writing Mechanics: understanding of spelling, capitalization, punctuation, and usage conventions.
Writing Concepts and Skills: understanding of the components of effective written composition
Mathematics: conceptual understanding of mathematics, application of mathematical knowledge to solve problems, and the ability to compute or estimate solutions
Quantitative Reasoning: the ability to analyze mathematical concepts and principles, to make generalizations, and to compare quantities mathematically
Algebra I: skills typically taught in Algebra I with emphasis on problem solving and operations with variables, equations, and algebraic geometry
Science: understanding scientific process skills, energy, forces and motion, space systems, physical and chemical properties, the living environment and the living organism
DESCRIPTION OF TESTS LEVEL3-10
3
4-10
3-10
3-10
3-10
3-10
3-10
7-9
3-10
• www.erblearn.org
Copyright © 2013 Educational Records Bureau. All rights reserved.MetaMetrics®, the MetaMetrics® logo and tagline, Lexile®, Lexile Framework®, Lexile Analyzer®, the Lexile® logo, Quantile®, Quantile Framework®
and the Quantile® logo are trademarks of MetaMetrics, Inc., and are registered in the United States and abroad.