paracellular diffusion in caco-2 cell monolayers: effect of perturbation on the transport of...
TRANSCRIPT
Paracellular Diffusion in Caco-2 Cell Monolayers: Effect of Perturbation onthe Transport of Hydrophilic Compounds That Vary in Charge and Size
GREGORY T. KNIPP*, NORMAN F. H. HO‡, CRAIG L. BARSUHN‡, AND RONALD T. BORCHARDT*,X
Received January 23, 1997, from the *Department of Pharmaceutical Chemistry, The University of Kansas, 2095 Constant Avenue,Lawrence, KS 66047, and ‡Drug Delivery Systems Research, Pharmacia and Upjohn Company, Kalamazoo, MI 49001. Final revisedmanuscript received July 9, 1997. Accepted for publication July 10, 1997X.
Abstract 0 We applied the principles of molecular-size-restricted diffusionwithin a negative electrostatic field of force to follow the changes in theaqueous pore radius of tight junctions (TJs) induced by perturbants andthe accompanying influence on the permeation of neutral (urea andmannitol), cationic (methylamine and atenolol), and anionic (formate andlactate) compounds that vary in size. The perturbants included palmitoyl-DL-carnitine (PC), which opens TJs by an unknown Ca++-independentmechanism, and ethyleneglycol-bis-(â-aminoethyl ether)-N,N,N′,N′-tet-raacetic acid (EGTA), a Ca++ chelator. Mass transfer resistances of thecollagen−coated filter support and the aqueous boundary layers werefactored out to yield paracellular permeability coefficients (PP). As viewedfrom the PP values of urea and mannitol, EGTA exhibited insignificanteffects on pore size at low concentrations compared with control, andthen caused a dramatic opening of the TJs over a narrow concentrationrange (1.35−1.4 mM). The PP values for urea and mannitol remainedconstant at >1.4 mM EGTA. However, PC produced dose−dependentresponses from 0 to 0.15 mM that plateaued at >0.15 mM. In general,cations permeated the cellular TJs faster and anions slower than theirneutral images. The effects of changes in pore size (4.6 to 14.6 Å ineffective radius) on the ability of these solutes to permeate the TJs wereanalyzed by the Renkin molecular sieving function. These studiesestablished an experimental, theoretical, and quantitative template toassess perturbants of the TJ and define the limits, short of detrimentaleffects, at which the TJs may be sufficiently perturbed for maximalenhancement of permeation of solutes varying in size and charge.
IntroductionThe utilization of in vitro cell culture models for assessing
the permeability of solutes across biological barriers hasgained considerable attention in the pharmaceutical sciences.1-9
The Caco-2 cell culture model, a human-derived colon adeno-carcinoma cell line, has been shown to mimic the absorptivecells of the intestinal epithelium, and has been useful fordetermining the permeation of solutes.10,11 The presence oftight junctions (TJs) around the cells acts to restrict passivediffusion across the paracellular route. Although active routesof transport have been clearly characterized,12 it has beendifficult to delineate the extent to which a solute permeatesa cell monolayer by the paracellular or transcellular route.1Hydrophobic solutes are considered to traverse the cellmonolayer predominantly by the transcellular route andhydrophilic solutes predominantly by the paracellular route.9However, these are generalizations; there remains the needto quantitatively delineate the contributions of each routetaken by solutes, which may span the range in hydrophilicproperties, particularly when one desires to define mecha-nisms specific to transport pathways.13The ability of various perturbants to loosen TJs and
increase drug transport via the paracellular route has been
widely demonstrated.5,9,14 The effects of perturbation on thepermeation of solutes are used as criteria to determine thepreferred route of transport (e.g., paracellular or transcellu-lar).5,9 If the transmonolayer permeation of a solute issignificantly affected by perturbation of the cellular TJs, thenthe permeation of that solute is presumed to occur predomi-nantly by the paracellular route. If the effect of perturbationon permeation is minor, permeation is said to occur principallyvia the transcellular route. Thus, an experimental strategyhas been developed to qualitatively assess the route(s) oftransport that a solute uses to cross a cellular barrier. Adsonet al.1 used the principles of molecular-size-restricted diffusionwithin a negative electrostatic field of force to delineate therate-determining steps and factors in the paracellular diffu-sion of hydrophilic solutes across cell monolayers.1
In this study, we have applied these principles to quantifythe paracellular diffusion of hydrophilic solutes under controland perturbed conditions. We selected the following solutepairs: neutral solutes, urea and mannitol; positively chargedsolutes, methylamine and atenolol; and negatively chargedsolutes, formate and lactate. For perturbants, we selectedethyleneglycol-bis-(â-aminoethyl ether)-N,N,N′,N′-tetraaceticacid (EGTA) and palmitoyl-DL-carnitine (PC). By using theseadjuvants to perturbate the cellular TJs and studying theireffect on the paracellular diffusion of the hydrophilic solutes,we have elucidated the change in the average aqueous poreradius of the TJs induced by the perturbants. The influenceof pore size changes on the paracellular permeability of soluteswas calculated by the Renkin molecular sieving function.These studies have established an experimental, theoretical,and quantitative template to assess perturbants of the TJ andto define the limits at which the TJs may be sufficientlyperturbed for maximal enhancement of transport of solutesvarying in size and charge, short of detrimental effects.
Materials and Methods
MaterialssMannitol, urea, formic acid, lactic acid, and methyl-amine were purchased as 14C-labeled stock solutions from theAmerican Radiolabeled Company (St. Louis, MO). Atenolol, EGTA,and PC were purchased from Sigma Chemical Company (St. Louis,MO). Hanks’ balanced salt solution (HBSS), N-2-hydroxyethylpip-erazine-N′-2-ethanesulfonate (HEPES), nonessential amino acids,trypsin/EDTA, and Dulbecco’s Modified Eagle Medium (DMEM) werepurchased from JRH Biosciences (Lenexa, KS). Penicillin and strep-tomycin were purchased as a mixture from Irvine Scientific (SantaAna, CA). Fetal bovine serum and type I rat tail collagen werepurchased from Atlanta Biologicals (Norcross, GA) and CollaborativeResearch (Lexington, MA), respectively.
Cell CulturesThe Caco-2 cell line, which originated from a humanadenocarcinoma,15 was obtained from the American Type CultureCollection (Rockville, MD) and was cultured as described previouslyby Hildago et al.10 The cells were grown in 150-cm2 culture flasksX Abstract published in Advance ACS Abstracts, September 1, 1997.
© 1997, American Chemical Society and S0022-3549(97)00030-0 CCC: $14.00 Journal of Pharmaceutical Sciences / 1105American Pharmaceutical Association Vol. 86, No. 10, October 1997
from Corning, Inc. (Corning, NY) in complete culture medium, whichconsisted of DMEM with 100 mg/mL of penicillin, 100 mg/mL ofstreptomycin, 1% nonessential amino acids, and 10% fetal bovineserum. Before they reached full confluency, the cells were trypsinizedwith 0.25% trypsin and 0.02% EDTA and removed from the surfaceof the flask. The cells were then collected and counted with ahemocytometer. They were plated at a density of 63,000 cells/cm2 inthe culture medium on Transwell polycarbonate membranes (3.0 µmpore size and a surface area of 4.71 cm2) purchased from CostarCorporation (Cambridge, MA), which had been previously coated withrat tail collagen. Cells were maintained at 37 °C in an atmosphereof 95% relative humidity and 5% CO2. The culture medium wasreplaced every other day for the first week and daily thereafter. Cellswere used on days 21-28 of culture. All cells used in this study werebetween 35 and 70 passages. Mannitol fluxes were monitored intriplicate across unperturbed cell monolayers that were seeded underidentical conditions as the monolayers utilized for other transportstudies. All cell monolayers used in these studies, irrespectiveof passage number, exhibited mannitol fluxes ranging from0.25-0.35%/h.Transport StudiessAll transport experiments were performed
with 30 rpm shaking in a Precision Scientific water bath from FisherScientific (Pittsburgh, PA). All of the transport studies were con-ducted at 37 °C in pH 7.35 HBSS containing 25 mM glucose and 10mM HEPES buffer. Experiments were run for 3 h in triplicate. Alltransport studies were performed in the apical (AP)-to-basolateral(BL) direction. Prior to the experiments, the cells were washed threetimes with HBSS. The third wash was left on the cells at 37 °C foran incubation period of 10 min. In each perturbant study, the cellswere pretreated for 30 min with equimolar concentrations of pertur-bant on both the AP and BL sides. The AP volume (donor side) forthe transport studies was 1.5 mL and the BL volume (receiver side)was 2.6 mL. The 14C-radiolabeled solutes placed in the donorsolutions were prepared to give ∼5-7 × 10⁶ dpm/mL. A 0.1-mLsample was withdrawn from the receiver side every 30 min. Toaccount for the change in volume, the sample volume was replacedby 0.1 mL of the appropriate perturbant containing HBSS. Samplingfrom the donor side was performed by removing 0.1 mL at 0 and 180min. When 14C-radiolabeled solutes were used, 4 mL of 3a70Bcomplete counting scintillation cocktail from Research ProductsInternational (Mount Prospect, IL) was added to the sample takenfrom the donor or receiver side. The samples were analyzed by liquidscintillation counting on a Beckman LS 6000IC liquid scintillator.In the atenolol studies, the donor solutions were prepared at a
concentration of ∼400 µM in HBSS. Receiver samples (0.1 mL) werediluted with 0.9 mL of HBSS and analyzed by gradient reversed-phase HPLC. A Rainin Dynamax 300A C18 column (5 µm, 4.6 × 250mm) with a Dynamax C18 guard column was used for each analysis.The eluents consisted of Milli-Q H2O:ACN:trifluoroacetic acid in ratiosof 95:5:0.1 (solvent A) and 20:80:0.1 (solvent B). Elution wasaccomplished using a gradient that consisted of ramping from 0 to30% B over 12 min. All reagents were of HPLC grade or better. Thefluorescence detector was set to excitation and emission wavelengthsof 275 and 295 nm, respectively. A flow rate of 1.0 mL/min was used.The permeation rates for all of the solutes were estimated across
the collagen-coated filter support in the absence of the cells. Thesampling intervals were changed to every 10 min over a 1-h period.Assessment of Cell Monolayer IntegritysThe integrity of the
cell monolayers following maximal perturbation of the tight junctionsby PC and EGTA was indirectly determined by actin staining withrhodamine phalloidin.16 The culture medium was removed from themonolayers and the monolayers were equilibrated for 3 h with HBSS(control), 0.3 mM PC, or 1.5 mM EGTA. The cells were then washedthree times for 1 min with phosphate-buffered saline (PBS) at roomtemperature. The cells were fixed with 3.7% formaldehyde for 10 minat room temperature and then permeabilized with 0.1% Triton-X in3.7% formaldehyde for 10 min at room temperature. The cells werewashed three times for 2 min with PBS. The filter support containingthe cells was cut from the Transwell and placed into the bottom of aPetri dish. The cells were incubated for 1 h in the dark at roomtemperature in 10 µL of rhodamine phalloidin in 400 µL of PBS perfilter in the Petri dish. Excess rhodamine phalloidin was removedby three washes with PBS. Each filter was mounted on a microscopeslide with 50% glycerol in PBS, and the cells were observed with afluorescence microscope.
Theoretical AnalysissThe effective permeability coefficient (Pe)was calculated from the appearance kinetics of the hydrophilic solutein the receiver at steady state:
whereMR is the mass in the receiver side;MD(0) is the initial mass inthe donor side; VR (2.6 mL) and VD (1.5 mL) are volumes of thereceiver and donor sides, respectively; t and tL are the actual timeand the lag time to steady state, respectively; A is the surface area ofthe filter support (4.71 cm2); and Pe is the effective permeabilitycoefficient. Equation 1 takes into account the nonsink conditions andthe different volumes of the Transwell system employed in theexperimental method and it is appropriate for solutes traversing theparacellular pathway wherein cell partitioning is negligible. Whentransport ceases, MR/MD(0) is governed by the ratio of the volumes.When the appearance kinetics were linear, generally less than a 5%loss of the donor mass, the Pe was determined by eq 3:
where (∆MR/∆t) is the rate of the solute appearing on the receiverside and CD(0) is the initial concentration of solute applied to the donorside.The Pe is further defined by eq 4:
where PABL is the permeability across the aqueous boundary layers;PF is the permeability across the filter support, PC is the permeabilityacross the collagen, and PP is the permeability of the paracellularpathway. The contributions from PABL, PF, and PC can be assessedby measuring the permeation (PABL/F/C) of the solutes across thecollagen-coated filter support. Therefore:
The anatomical features of the paracellular route in the Caco-2monolayer indicate the presence of two barriers in series: the TJs(length < 0.1 µm) followed by the relatively long and tortuous lateralspace (2.0-2.5 tortuousity factor, ∼20 µm cell height, ∼75 Å gapwidth).1 It is generally assumed that the TJ is the rate-limitingbarrier. Without making a clear distinction between the TJ andlateral space at this time, the paracellular permeability coefficientsof the permeants varying in molecular size and charge are given bythe following equations:
where ε is the porosity of the monolayer, δ ) τL is the tortuousity (τ)times the path length (L) across the monolayer, D is the aqueousdiffusion coefficient of the solute, F(r/R) is the Renkin function, andκ is a dimensionless electrochemical energy function across the pore.1The electrochemical energy function κ can be defined as κ ) ez|∆ψ|/kT, where e is the unit charge of an ion (4.8 × 10⁻¹⁰ esu), z is thevalence of an anion or cation, kT is the thermal energy in ergs, and|∆ψ| is the net electrical potential across the TJ. The dimensionless
MR
MD(0))( VR
VR + VD)[1 - e-Râ(t-tL)] (1)
R ) APe/VD (2a)
â ) (VR + VD)/VR (2b)
Pe )∆MR/∆tACD(0)
(3)
1Pe
) 1PP
+ 1PABL
+ 1PF
+ 1PC
(4)
1Pe
) 1PP
+ 1PABL/F/C
(5)
Neutral Pp )εDF(r/R)
δ(6a)
Anionic Pp- )
εDF(r/R)δ ( κ
eκ-1) (6b)
Cationic Pp+ )
εDF(r/R)δ ( κ
1 - e-κ) (6c)
1106 / Journal of Pharmaceutical SciencesVol. 86, No. 10, October 1997
Renkin molecular sieving function, or hindrance function, comparesthe molecular radius (r) and the cylindrical pore radius (R) and takesvalues of 0 < F(r/R) < 1:
The aqueous pore radius was calculated from the ratio of theparacellular permeabilities of each solute pair of like charges (i.e.,eqs 6a, 6b, or 6c as the case may be) by the following relationship:
where the subscripts x and y denote the solute pair. The aqueousdiffusion coefficients, molecular radii (Table 1), and experimentallyobtained PP values are known, so the only unknown is the pore radius.Triplicate determinations of the PP values were obtained. Calcula-tions of the pore radius were then performed using each combinationof replicate pairs (nine combinations) to yield the average pore radius.The single pore size model was applied to all transport experimentsin the unperturbed and perturbed cell monolayers.
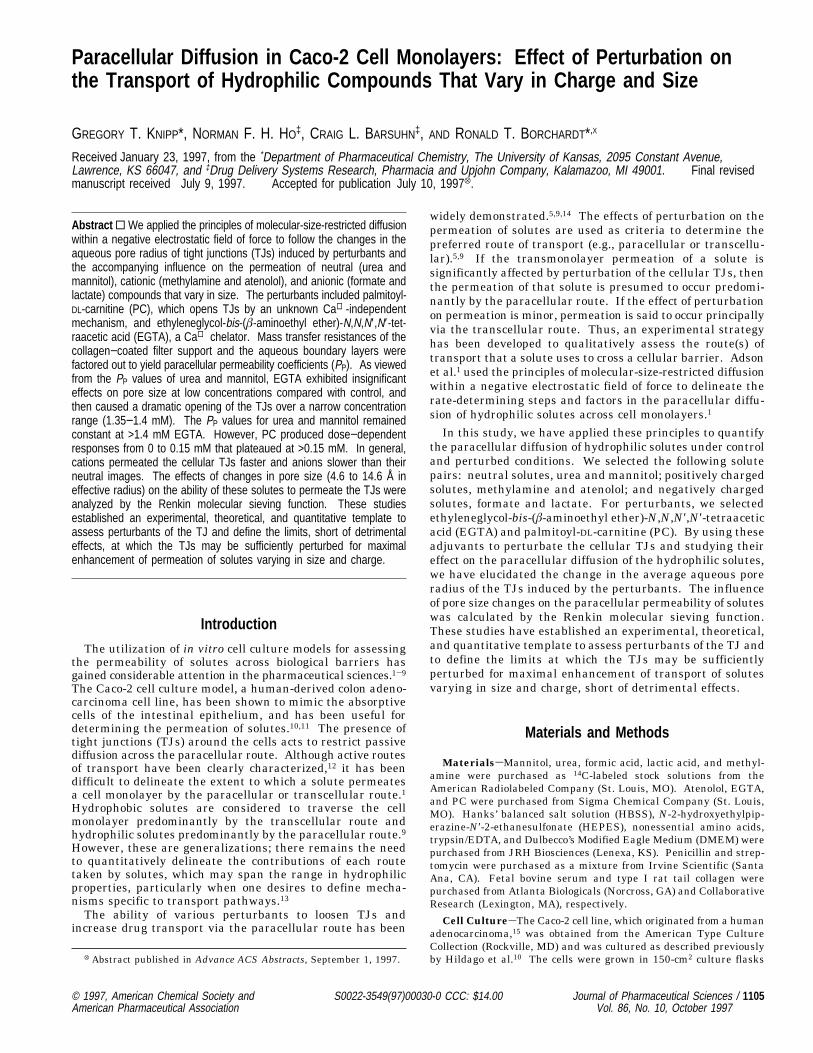
ResultsThe appearance kinetics of urea in the absence and presence
of varying PC concentrations are shown in Figure 1. Whencompared with the nonperturbed (control) cell monolayer, thetransport kinetics were more rapid and the kinetic profiles
became increasingly curvilinear with time as the TJs wereperturbed with increasing PC concentrations. At 0.3 mM PC,the MD markedly decreased exponentially with time andapproached zero as the mass ratio,MR/MD(0), approached 0.634in accordance with the theoretical predictions. In general, thekinetic profiles were typical of those for all of the hydrophilicpermeants traversing the paracellular route of the cell mono-layer under various states of perturbation with PC and EGTA,including the control. Good mass balances were accountedfor between the donor and receiver solutions. The effectivepermeability coefficients were obtained with eq 1, wherein thelag times to steady state were taken into account. To allowthe TJs to reach an equilibrium perturbed state, the cellmonolayers underwent a 30-min preincubation period in thepresence of PC and EGTA in accordance with previous studieson perturbed cell monolayers.5,14,17 However, it was not clearwhether the lag times to steady state, which ranged from 5to 20 min and were more often observed with PC than withEGTA, could be attributed to perturbed tight junctions thatmay not have yet reached equilibrium.To take into account the overall mass transfer resistances
of the ABLs, the microporous filter, and the collagen matrixover the micropores, the permeability coefficients (PABL/F/C) ofall permeants were experimentally determined in the absenceand presence of PC (0.2 mM) and EGTA (1.5 mM) in equimolarconcentrations on both sides of the cell monolayer-free system.The tendency of methylamine and atenolol to bind with EGTAprecluded their permeability measurements. The results (notshown) indicate that PC and EGTA did not affect the perme-abilities of the compounds and that one could use the valuesof 13.1 × 10⁻⁵ cm/s for methylamine, urea, formate, andlactate and 8 × 10⁻⁵ cm/s for mannitol and atenolol to factorout PABL/F/C from Pe to get the corresponding PP values. Thetransport resistance of the collagen layer was relatively largebecause, in its absence, the PABL/F values of the representativesolutes were ∼2.5 times larger than 13.1 × 10⁻⁵ cm/s foundin the presence of collagen, and were independent of molecularsize. It must be noted that the PABL/F/C values were deter-mined with 10-min sampling intervals, which required inter-mittent removal of the Transwell system from the platformof the water bath shaker. The Pe values for the cell monolayerwere determined with 30-min sampling intervals. Therefore,the PABL/F/C values underestimate the hydrodynamic conditionsof the cell monolayer transport studies. This leads to anoverestimation of the PP values, especially those determinedfor the small molecular size permeants (principally urea andmethylamine) across the perturbed cell monolayers.The PP value of each solute in the unperturbed and PC
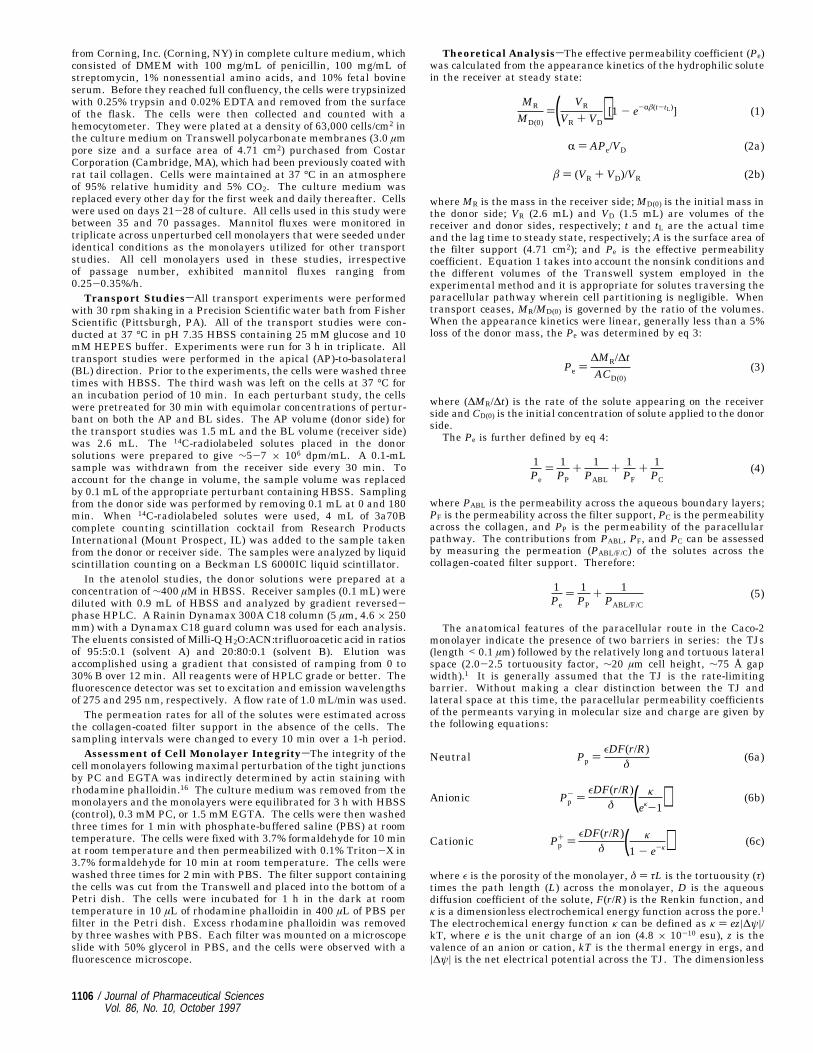
perturbed cell monolayer was plotted against its molecularradius (Figure 2). Within each pair of solutes of like charge(e.g., urea and mannitol, formate and lactate, etc.), PP valuesdecreased with molecular radius. When one compares the PPvalues of each charged solute with the PP values of a neutralsolute of similar size, it is obvious that the permeation ofmethylamine (2.65 Å radius) was faster than that of itsneutral image (e.g., urea, 2.67 Å radius), and the permeationof the formate anion was slower than that of its neutral image.Although the study lacked a sufficient number of each kindof permeant varying in size to define the curves moreprecisely, it appears that the curves for the cationic andanionic solutes tend to converge, with respect to that for theneutral solutes, in a telescopic-like manner with increasingmolecular radius. The results between the unperturbed andperturbed cell monolayers were quantitatively similar, thedifference being the larger PP values in the perturbed mono-layer. The general trends shown here are consistent with themechanism of molecular-size-restricted diffusion in an elec-tronegative field of force.1
Table 1sPhysicochemical Properties of Hydrophilic Solutes
Solute MW pKa
MolecularDensity(gm/mL)
Aqueous DiffusionCoefficient
(×105 cm2/s)a
MolecularRadius(Å)
Urea 60 neutral 1.32 1.22 2.67Mannitol 182 neutral 1.52 0.89 4.10Methylamine 31 10.65 0.70 1.24 2.65Atenolol 266 9.55 1.00 0.72 4.80Formate 46 3.75 1.22 1.30 2.51Lactate 90 3.83 1.22 1.04 3.13
a Calculated by the Stokes−Einstein equation for equivalent spheres.
Figure 1sAppearance kinetics of urea across Caco-2 cell monolayer as a functionof PC concentration. The solid curves were generated from the best fit of thekinetics using eq 1.
F( rR) ) (1 - ( rR))2[1 - 2.104( rR) + 2.09( rR)
3- 0.95( rR)
5] (7)
PP,x
PP,y)ryF(rx/R)
rxF(ry/R)(8)
Journal of Pharmaceutical Sciences / 1107Vol. 86, No. 10, October 1997
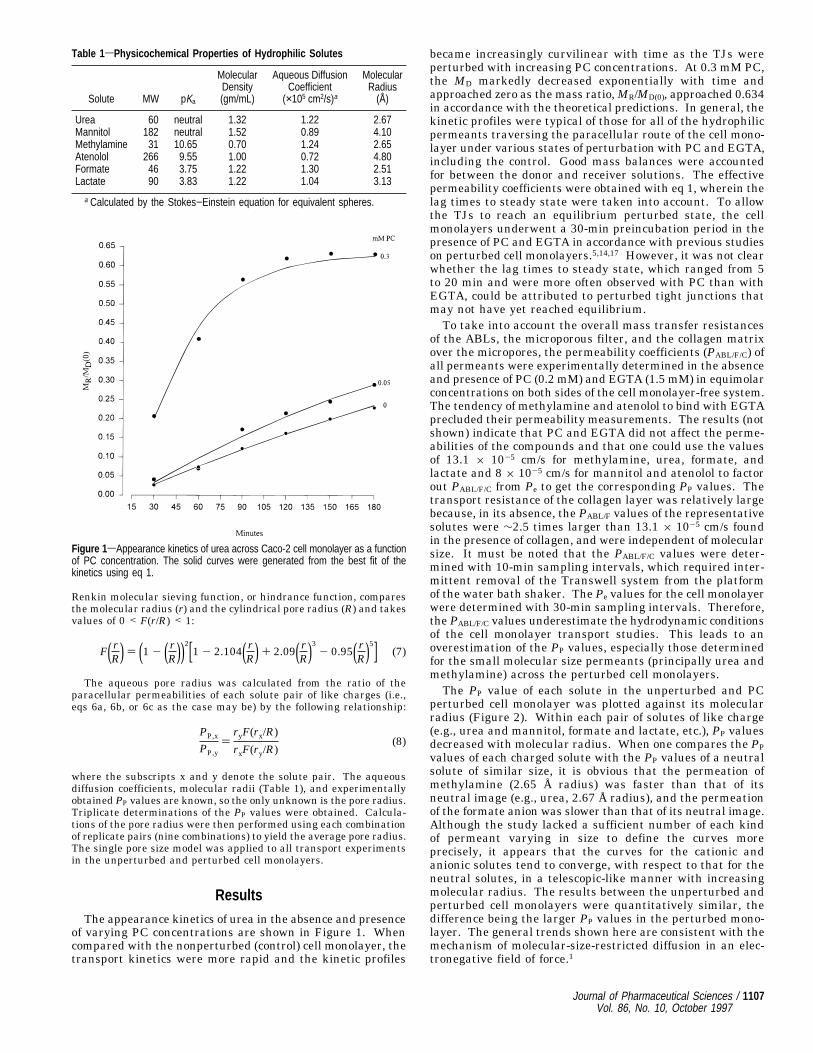
In Figure 3, the PP values of urea and mannitol and theeffective pore radii, estimated with eq 8, are shown as afunction of equimolar concentrations of PC or EGTA in theAP and BL sides of the monolayer. Upon TJ perturbation byPC, there was a dose-dependent increase in the pore radiusuntil a maximum plateau of 14.6 Å was achieved. Thisincrease was reflected by incremental increases in the PP
values of urea and mannitol leading to plateau values of 101× 10-6 cm/s for urea and 35.7 × 10⁻⁶ cm/s for mannitol. Incomparing the maximally perturbed monolayer to the unper-turbed monolayer (pore radius of 4.6 Å and PP of 10.2 × 10⁻⁶
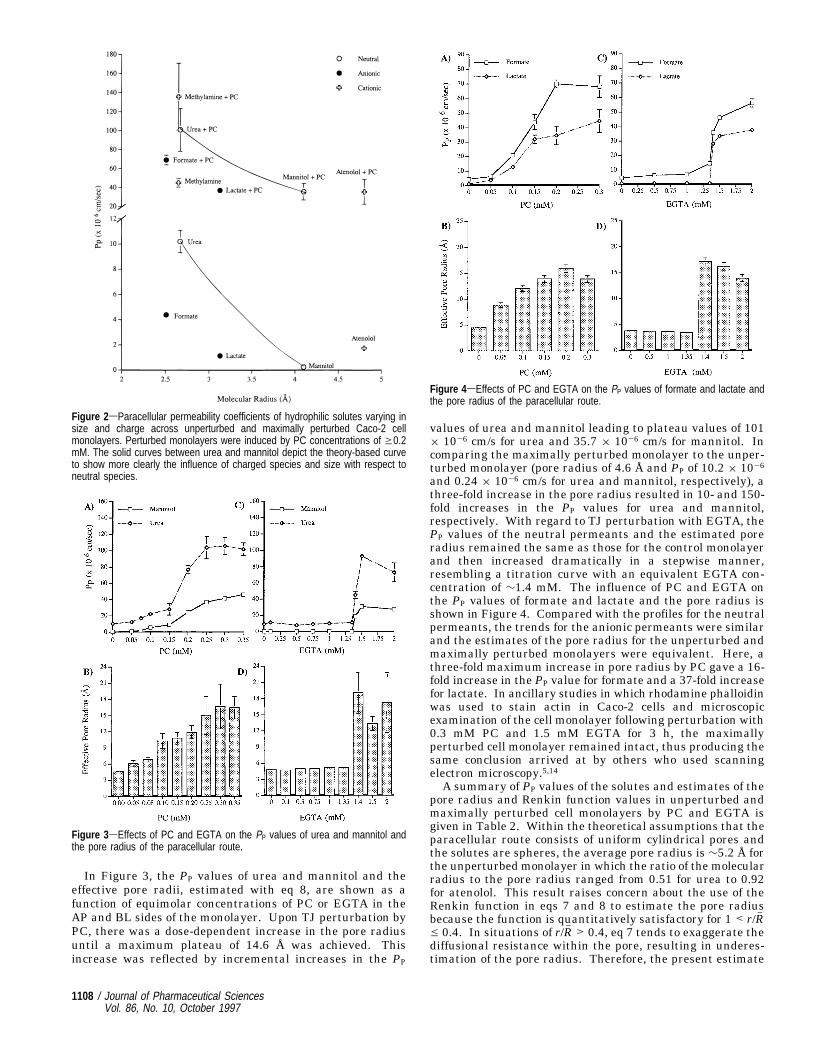
and 0.24 × 10⁻⁶ cm/s for urea and mannitol, respectively), athree-fold increase in the pore radius resulted in 10- and 150-fold increases in the PP values for urea and mannitol,respectively. With regard to TJ perturbation with EGTA, thePP values of the neutral permeants and the estimated poreradius remained the same as those for the control monolayerand then increased dramatically in a stepwise manner,resembling a titration curve with an equivalent EGTA con-centration of ∼1.4 mM. The influence of PC and EGTA onthe PP values of formate and lactate and the pore radius isshown in Figure 4. Compared with the profiles for the neutralpermeants, the trends for the anionic permeants were similarand the estimates of the pore radius for the unperturbed andmaximally perturbed monolayers were equivalent. Here, athree-fold maximum increase in pore radius by PC gave a 16-fold increase in the PP value for formate and a 37-fold increasefor lactate. In ancillary studies in which rhodamine phalloidinwas used to stain actin in Caco-2 cells and microscopicexamination of the cell monolayer following perturbation with0.3 mM PC and 1.5 mM EGTA for 3 h, the maximallyperturbed cell monolayer remained intact, thus producing thesame conclusion arrived at by others who used scanningelectron microscopy.5,14A summary of PP values of the solutes and estimates of the
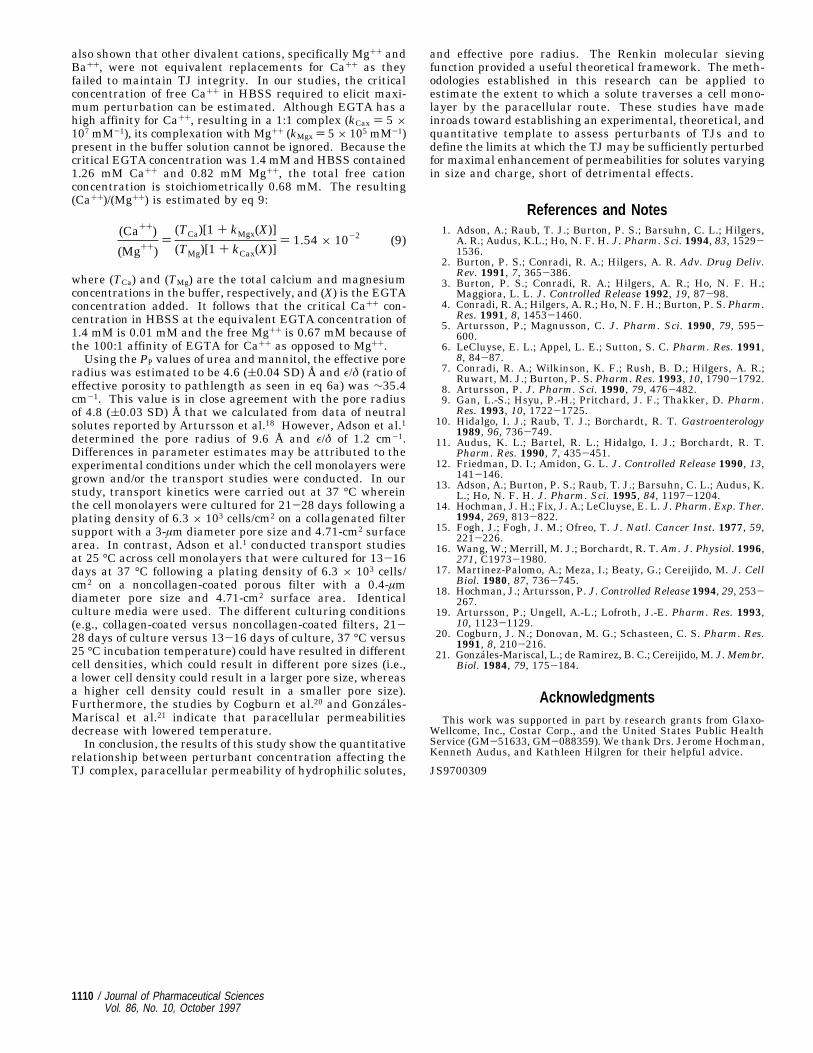
pore radius and Renkin function values in unperturbed andmaximally perturbed cell monolayers by PC and EGTA isgiven in Table 2. Within the theoretical assumptions that theparacellular route consists of uniform cylindrical pores andthe solutes are spheres, the average pore radius is ∼5.2 Å forthe unperturbed monolayer in which the ratio of the molecularradius to the pore radius ranged from 0.51 for urea to 0.92for atenolol. This result raises concern about the use of theRenkin function in eqs 7 and 8 to estimate the pore radiusbecause the function is quantitatively satisfactory for 1 < r/Rhe 0.4. In situations of r/Rh > 0.4, eq 7 tends to exaggerate thediffusional resistance within the pore, resulting in underes-timation of the pore radius. Therefore, the present estimate
Figure 2sParacellular permeability coefficients of hydrophilic solutes varying insize and charge across unperturbed and maximally perturbed Caco-2 cellmonolayers. Perturbed monolayers were induced by PC concentrations of g0.2mM. The solid curves between urea and mannitol depict the theory-based curveto show more clearly the influence of charged species and size with respect toneutral species.
Figure 3sEffects of PC and EGTA on the PP values of urea and mannitol andthe pore radius of the paracellular route.
Figure 4sEffects of PC and EGTA on the PP values of formate and lactate andthe pore radius of the paracellular route.
1108 / Journal of Pharmaceutical SciencesVol. 86, No. 10, October 1997
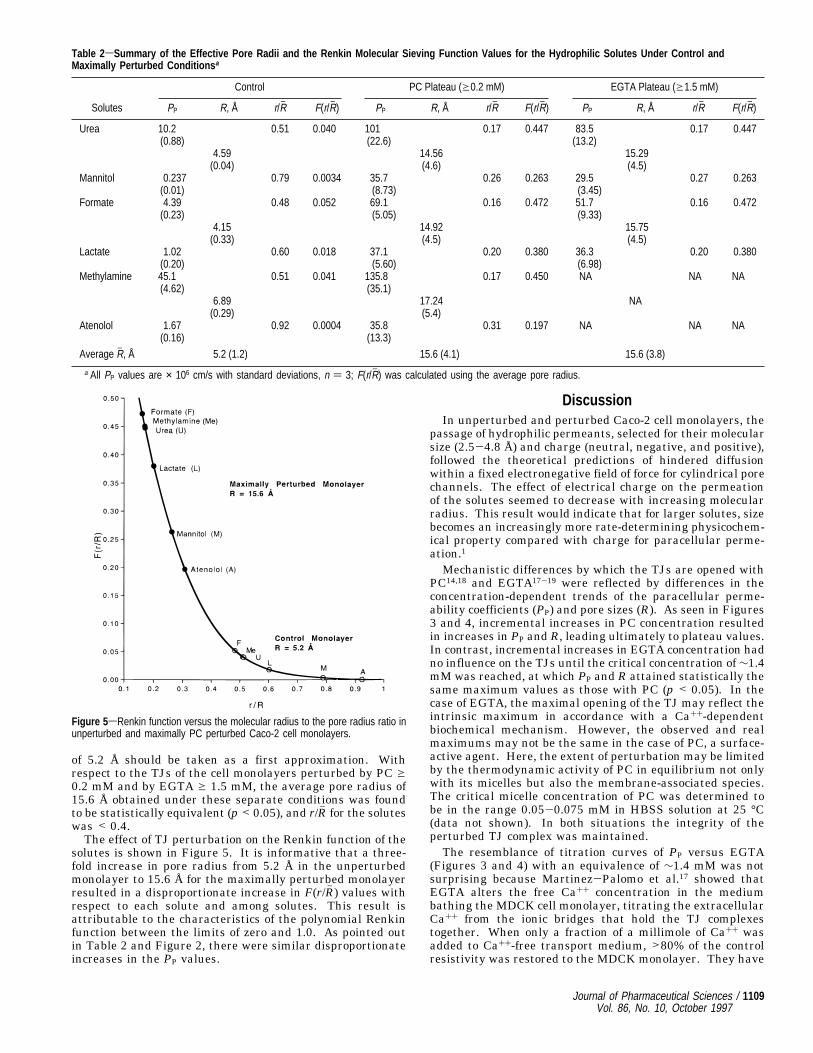
of 5.2 Å should be taken as a first approximation. Withrespect to the TJs of the cell monolayers perturbed by PC g0.2 mM and by EGTA g 1.5 mM, the average pore radius of15.6 Å obtained under these separate conditions was foundto be statistically equivalent (p < 0.05), and r/Rh for the soluteswas < 0.4.The effect of TJ perturbation on the Renkin function of the
solutes is shown in Figure 5. It is informative that a three-fold increase in pore radius from 5.2 Å in the unperturbedmonolayer to 15.6 Å for the maximally perturbed monolayerresulted in a disproportionate increase in F(r/Rh ) values withrespect to each solute and among solutes. This result isattributable to the characteristics of the polynomial Renkinfunction between the limits of zero and 1.0. As pointed outin Table 2 and Figure 2, there were similar disproportionateincreases in the PP values.
DiscussionIn unperturbed and perturbed Caco-2 cell monolayers, the
passage of hydrophilic permeants, selected for their molecularsize (2.5-4.8 Å) and charge (neutral, negative, and positive),followed the theoretical predictions of hindered diffusionwithin a fixed electronegative field of force for cylindrical porechannels. The effect of electrical charge on the permeationof the solutes seemed to decrease with increasing molecularradius. This result would indicate that for larger solutes, sizebecomes an increasingly more rate-determining physicochem-ical property compared with charge for paracellular perme-ation.1
Mechanistic differences by which the TJs are opened withPC14,18 and EGTA17-19 were reflected by differences in theconcentration-dependent trends of the paracellular perme-ability coefficients (PP) and pore sizes (R). As seen in Figures3 and 4, incremental increases in PC concentration resultedin increases in PP and R, leading ultimately to plateau values.In contrast, incremental increases in EGTA concentration hadno influence on the TJs until the critical concentration of∼1.4mM was reached, at which PP and R attained statistically thesame maximum values as those with PC (p < 0.05). In thecase of EGTA, the maximal opening of the TJ may reflect theintrinsic maximum in accordance with a Ca++-dependentbiochemical mechanism. However, the observed and realmaximums may not be the same in the case of PC, a surface-active agent. Here, the extent of perturbation may be limitedby the thermodynamic activity of PC in equilibrium not onlywith its micelles but also the membrane-associated species.The critical micelle concentration of PC was determined tobe in the range 0.05-0.075 mM in HBSS solution at 25 °C(data not shown). In both situations the integrity of theperturbed TJ complex was maintained.The resemblance of titration curves of PP versus EGTA
(Figures 3 and 4) with an equivalence of ∼1.4 mM was notsurprising because Martinez-Palomo et al.17 showed thatEGTA alters the free Ca++ concentration in the mediumbathing the MDCK cell monolayer, titrating the extracellularCa++ from the ionic bridges that hold the TJ complexestogether. When only a fraction of a millimole of Ca++ wasadded to Ca++-free transport medium, >80% of the controlresistivity was restored to the MDCK monolayer. They have
Table 2sSummary of the Effective Pore Radii and the Renkin Molecular Sieving Function Values for the Hydrophilic Solutes Under Control andMaximally Perturbed Conditions a
Control PC Plateau (g0.2 mM) EGTA Plateau (g1.5 mM)
Solutes PP R, Å r/Rh F(r/Rh) PP R, Å r/Rh F(r/Rh) PP R, Å r/Rh F(r/Rh)
Urea 10.2 0.51 0.040 101 0.17 0.447 83.5 0.17 0.447(0.88) (22.6) (13.2)
4.59 14.56 15.29(0.04) (4.6) (4.5)
Mannitol 0.237 0.79 0.0034 35.7 0.26 0.263 29.5 0.27 0.263(0.01) (8.73) (3.45)
Formate 4.39 0.48 0.052 69.1 0.16 0.472 51.7 0.16 0.472(0.23) (5.05) (9.33)
4.15 14.92 15.75(0.33) (4.5) (4.5)
Lactate 1.02 0.60 0.018 37.1 0.20 0.380 36.3 0.20 0.380(0.20) (5.60) (6.98)
Methylamine 45.1 0.51 0.041 135.8 0.17 0.450 NA NA NA(4.62) (35.1)
6.89 17.24 NA(0.29) (5.4)
Atenolol 1.67 0.92 0.0004 35.8 0.31 0.197 NA NA NA(0.16) (13.3)
Average Rh , Å 5.2 (1.2) 15.6 (4.1) 15.6 (3.8)
a All PP values are × 106 cm/s with standard deviations, n ) 3; F(r/Rh) was calculated using the average pore radius.
Figure 5sRenkin function versus the molecular radius to the pore radius ratio inunperturbed and maximally PC perturbed Caco-2 cell monolayers.
Journal of Pharmaceutical Sciences / 1109Vol. 86, No. 10, October 1997
also shown that other divalent cations, specifically Mg++ andBa++, were not equivalent replacements for Ca++ as theyfailed to maintain TJ integrity. In our studies, the criticalconcentration of free Ca++ in HBSS required to elicit maxi-mum perturbation can be estimated. Although EGTA has ahigh affinity for Ca++, resulting in a 1:1 complex (kCax ) 5 ×10⁷ mM-1), its complexation with Mg++ (kMgx ) 5 × 10⁵ mM-1)present in the buffer solution cannot be ignored. Because thecritical EGTA concentration was 1.4 mM and HBSS contained1.26 mM Ca++ and 0.82 mM Mg++, the total free cationconcentration is stoichiometrically 0.68 mM. The resulting(Ca++)/(Mg++) is estimated by eq 9:
where (TCa) and (TMg) are the total calcium and magnesiumconcentrations in the buffer, respectively, and (X) is the EGTAconcentration added. It follows that the critical Ca++ con-centration in HBSS at the equivalent EGTA concentration of1.4 mM is 0.01 mM and the free Mg++ is 0.67 mM because ofthe 100:1 affinity of EGTA for Ca++ as opposed to Mg++.Using the PP values of urea and mannitol, the effective pore
radius was estimated to be 4.6 ((0.04 SD) Å and ε/δ (ratio ofeffective porosity to pathlength as seen in eq 6a) was ∼35.4cm-1. This value is in close agreement with the pore radiusof 4.8 ((0.03 SD) Å that we calculated from data of neutralsolutes reported by Artursson et al.18 However, Adson et al.1determined the pore radius of 9.6 Å and ε/δ of 1.2 cm-1.Differences in parameter estimates may be attributed to theexperimental conditions under which the cell monolayers weregrown and/or the transport studies were conducted. In ourstudy, transport kinetics were carried out at 37 °C whereinthe cell monolayers were cultured for 21-28 days following aplating density of 6.3 × 10³ cells/cm2 on a collagenated filtersupport with a 3-µm diameter pore size and 4.71-cm2 surfacearea. In contrast, Adson et al.1 conducted transport studiesat 25 °C across cell monolayers that were cultured for 13-16days at 37 °C following a plating density of 6.3 × 10³ cells/cm2 on a noncollagen-coated porous filter with a 0.4-µmdiameter pore size and 4.71-cm2 surface area. Identicalculture media were used. The different culturing conditions(e.g., collagen-coated versus noncollagen-coated filters, 21-28 days of culture versus 13-16 days of culture, 37 °C versus25 °C incubation temperature) could have resulted in differentcell densities, which could result in different pore sizes (i.e.,a lower cell density could result in a larger pore size, whereasa higher cell density could result in a smaller pore size).Furthermore, the studies by Cogburn et al.20 and Gonzales-Mariscal et al.21 indicate that paracellular permeabilitiesdecrease with lowered temperature.In conclusion, the results of this study show the quantitative
relationship between perturbant concentration affecting theTJ complex, paracellular permeability of hydrophilic solutes,
and effective pore radius. The Renkin molecular sievingfunction provided a useful theoretical framework. The meth-odologies established in this research can be applied toestimate the extent to which a solute traverses a cell mono-layer by the paracellular route. These studies have madeinroads toward establishing an experimental, theoretical, andquantitative template to assess perturbants of TJs and todefine the limits at which the TJ may be sufficiently perturbedfor maximal enhancement of permeabilities for solutes varyingin size and charge, short of detrimental effects.
References and Notes1. Adson, A.; Raub, T. J.; Burton, P. S.; Barsuhn, C. L.; Hilgers,
A. R.; Audus, K.L.; Ho, N. F. H. J. Pharm. Sci. 1994, 83, 1529-1536.
2. Burton, P. S.; Conradi, R. A.; Hilgers, A. R. Adv. Drug Deliv.Rev. 1991, 7, 365-386.
3. Burton, P. S.; Conradi, R. A.; Hilgers, A. R.; Ho, N. F. H.;Maggiora, L. L. J. Controlled Release 1992, 19, 87-98.
4. Conradi, R. A.; Hilgers, A. R.; Ho, N. F. H.; Burton, P. S. Pharm.Res. 1991, 8, 1453-1460.
5. Artursson, P.; Magnusson, C. J. Pharm. Sci. 1990, 79, 595-600.
6. LeCluyse, E. L.; Appel, L. E.; Sutton, S. C. Pharm. Res. 1991,8, 84-87.
7. Conradi, R. A.; Wilkinson, K. F.; Rush, B. D.; Hilgers, A. R.;Ruwart, M. J.; Burton, P. S. Pharm. Res. 1993, 10, 1790-1792.
8. Artursson, P. J. Pharm. Sci. 1990, 79, 476-482.9. Gan, L.-S.; Hsyu, P.-H.; Pritchard, J. F.; Thakker, D. Pharm.
Res. 1993, 10, 1722-1725.10. Hidalgo, I. J.; Raub, T. J.; Borchardt, R. T. Gastroenterology
1989, 96, 736-749.11. Audus, K. L.; Bartel, R. L.; Hidalgo, I. J.; Borchardt, R. T.
Pharm. Res. 1990, 7, 435-451.12. Friedman, D. I.; Amidon, G. L. J. Controlled Release 1990, 13,
141-146.13. Adson, A.; Burton, P. S.; Raub, T. J.; Barsuhn, C. L.; Audus, K.
L.; Ho, N. F. H. J. Pharm. Sci. 1995, 84, 1197-1204.14. Hochman, J. H.; Fix, J. A.; LeCluyse, E. L. J. Pharm. Exp. Ther.
1994, 269, 813-822.15. Fogh, J.; Fogh, J. M.; Ofreo, T. J. Natl. Cancer Inst. 1977, 59,
221-226.16. Wang, W.; Merrill, M. J.; Borchardt, R. T. Am. J. Physiol. 1996,
271, C1973-1980.17. Martinez-Palomo, A.; Meza, I.; Beaty, G.; Cereijido, M. J. Cell
Biol. 1980, 87, 736-745.18. Hochman, J.; Artursson, P. J. Controlled Release 1994, 29, 253-
267.19. Artursson, P.; Ungell, A.-L.; Lofroth, J.-E. Pharm. Res. 1993,
10, 1123-1129.20. Cogburn, J. N.; Donovan, M. G.; Schasteen, C. S. Pharm. Res.
1991, 8, 210-216.21. Gonzales-Mariscal, L.; de Ramirez, B. C.; Cereijido, M. J. Membr.
Biol. 1984, 79, 175-184.
AcknowledgmentsThis work was supported in part by research grants from Glaxo-
Wellcome, Inc., Costar Corp., and the United States Public HealthService (GM-51633, GM-088359). We thank Drs. Jerome Hochman,Kenneth Audus, and Kathleen Hilgren for their helpful advice.
JS9700309
(Ca++)
(Mg++))(TCa)[1 + kMgx(X)]
(TMg)[1 + kCax(X)]) 1.54 × 10⁻² (9)
1110 / Journal of Pharmaceutical SciencesVol. 86, No. 10, October 1997