pan orient energy corp. orient... · pan orient energy corp. condensed interim consolidated...
TRANSCRIPT
PAN ORIENT ENERGY CORP.
CONDENSED INTERIM CONSOLIDATED FINANCIAL STATEMENTS FOR THE THREE AND SIX MONTHS ENDED JUNE 30, 2013
(Unaudited)

2
Pan Orient Energy Corp. Condensed Interim Consolidated Statements of Financial Position (Expressed in Canadian dollars, unless otherwise noted) (Unaudited) ($000s) June 30, 2013 December 31, 2012 Assets Current Cash and cash equivalents 66,085 133,836 Accounts receivable 14,103 13,088
Taxes receivable (note 10) 1,937 - 82,125 146,924 Deposits 2,254 2,166 Property, plant and equipment (note 4) 60,147 38,819 Exploration and evaluation (note 5) 150,629 194,209 295,155 382,118 Liabilities Current Accounts payable and accrued liabilities 30,033 17,993 Taxes payable (note 10) 1 14,721 30,034 32,714 Deferred tax liabilities 23,411 19,127 Employee pension liabilities 60 49 Decommissioning provision (note 7) 3,286 2,192 Long term royalty provision (note 8) - 2,197 56,791 56,279 Shareholders’ equity Share capital (note 9) 117,656 117,430 Contributed surplus 19,913 18,460 Non-controlling interest 17,612 17,683 Accumulated other comprehensive income (loss) 3,956 (4,297) Retained earnings 79,227 176,563 238,364 325,839
Commitments (note 13) Subsequent event (note 14)
295,155 382,118 See accompanying notes to the condensed interim consolidated financial statements.

3
Pan Orient Energy Corp. Condensed Interim Consolidated Statements of Operations and Comprehensive Income (Expressed in Canadian dollars, unless otherwise noted) (Unaudited)
Three Months Ended Six Months Ended June 30 June 30
($000s, except per share amounts) 2013 2012 2013 2012 Revenue Oil 8,475 12,502 15,919 38,156 Royalties (425) (619) (784) (1,941) Interest 212 98 520 176 8,262 11,981 15,655 36,391 Expenses Depletion and depreciation 3,265 2,325 6,942 6,722 General and administrative 856 1,795 1,746 3,118 Production and operating 911 1,761 1,663 3,887 Stock-based compensation 483 206 963 586 Transportation 141 249 252 693 Foreign exchange gain (103) (222) (25) (189) Impairment on Indonesia assets (note 6) 99,627 - 99,627 - Gain on sale of Thailand interests - (93,393) - (93,393) 105,180 (87,279) 111,168 (78,576) Income (loss) before taxes and non-controlling interest (96,918) 99,260 (95,513) 114,967 Taxes (note 10) Current income tax (recovery) expense (1,855) 17,599 (1,936) 19,495 Deferred tax expense 2,620 2,427 3,830 8,166 765 20,026 1,894 27,661 Net income (loss) for the period (97,683) 79,234 (97,407) 87,306 Foreign exchange gain on translation of foreign operations 2,712 2,358 8,253 1,273 Comprehensive income (loss) for the period (94,971) 81,592 (89,154) 88,579 Net income (loss) attributable to:
Common shareholders (97,677) 79,285 (97,336) 87,409 Non-controlling interest (6) (51) (71) (103) Net income (loss) for the period (97,683) 79,234 (97,407) 87,306 Comprehensive income (loss) for the period attributable to: Common shareholders (94,965) 81,643 (89,083) 88,682 Non-controlling interest (6) (51) (71) (103) Comprehensive income (loss) for the period (94,971) 81,592 (89,154) 88,579
Net income (loss) per share attributable to common shareholders (note 9)
Basic $ (1.73) $ 1.40 $ (1.72) $ 1.54 Diluted $ (1.73) $ 1.40 $ (1.72) $ 1.54
See accompanying notes to the condensed interim consolidated financial statements.
4
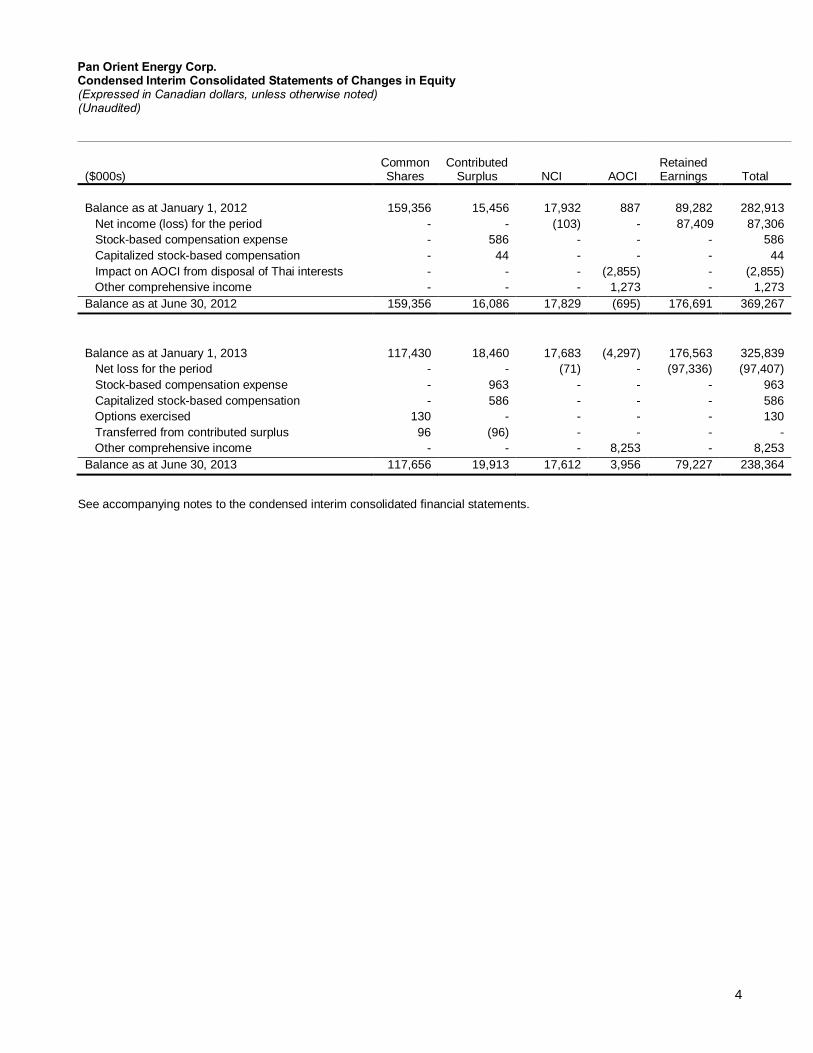
Pan Orient Energy Corp. Condensed Interim Consolidated Statements of Changes in Equity (Expressed in Canadian dollars, unless otherwise noted) (Unaudited)
See accompanying notes to the condensed interim consolidated financial statements.
Common Shares
Contributed Surplus NCI AOCI
Retained Earnings Total
($000s)
Balance as at January 1, 2012 159,356 15,456 17,932 887
89,282 282,913 Net income (loss) for the period - - (103) - 87,409 87,306 Stock-based compensation expense - 586 - - - 586 Capitalized stock-based compensation - 44 - - - 44 Impact on AOCI from disposal of Thai interests - - - (2,855) - (2,855) Other comprehensive income - - - 1,273 - 1,273 Balance as at June 30, 2012 159,356 16,086 17,829 (695) 176,691 369,267 Balance as at January 1, 2013 117,430 18,460 17,683 (4,297) 176,563 325,839 Net loss for the period - - (71) - (97,336) (97,407) Stock-based compensation expense - 963 - - - 963 Capitalized stock-based compensation - 586 - - - 586 Options exercised 130 - - - - 130 Transferred from contributed surplus 96 (96) - - - - Other comprehensive income - - - 8,253 - 8,253 Balance as at June 30, 2013 117,656 19,913 17,612 3,956 79,227 238,364
5
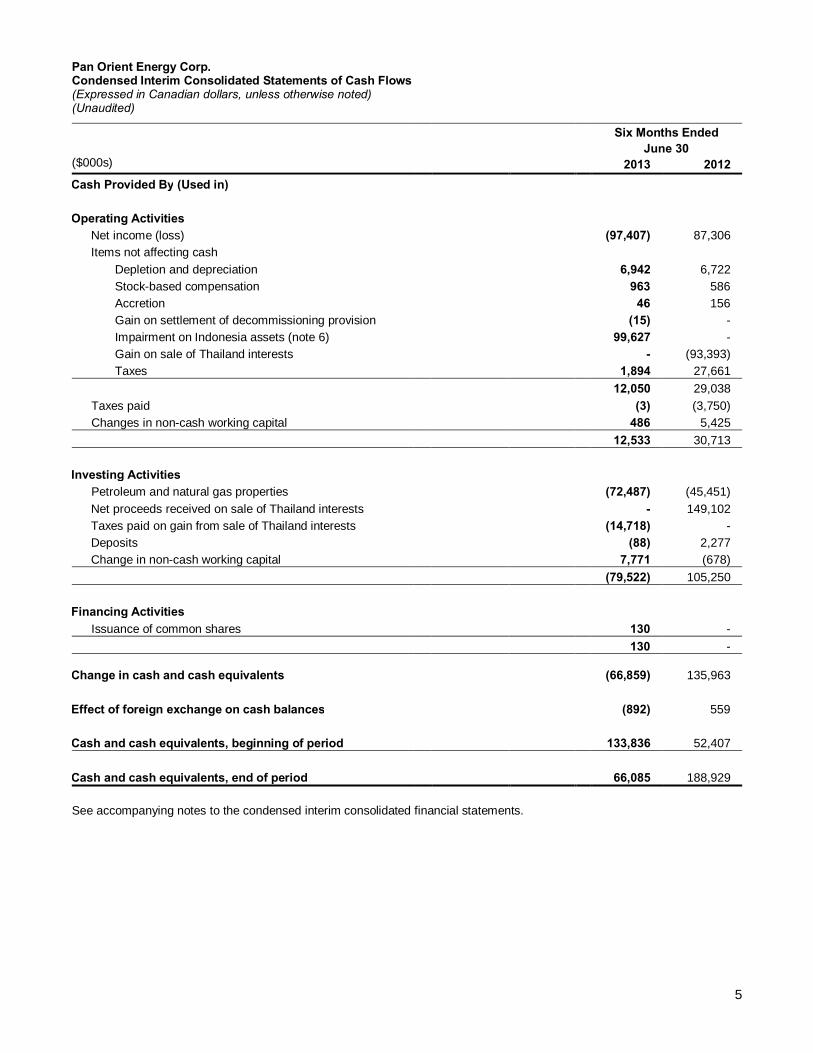
Pan Orient Energy Corp. Condensed Interim Consolidated Statements of Cash Flows (Expressed in Canadian dollars, unless otherwise noted) (Unaudited)
Six Months Ended June 30
($000s) 2013 2012 Cash Provided By (Used in) Operating Activities Net income (loss) (97,407) 87,306 Items not affecting cash Depletion and depreciation 6,942 6,722 Stock-based compensation 963 586 Accretion 46 156 Gain on settlement of decommissioning provision (15) - Impairment on Indonesia assets (note 6) 99,627 - Gain on sale of Thailand interests - (93,393) Taxes 1,894 27,661 12,050 29,038 Taxes paid (3) (3,750) Changes in non-cash working capital 486 5,425 12,533 30,713 Investing Activities Petroleum and natural gas properties (72,487) (45,451)
Net proceeds received on sale of Thailand interests - 149,102 Taxes paid on gain from sale of Thailand interests (14,718) -
Deposits (88) 2,277 Change in non-cash working capital 7,771 (678) (79,522) 105,250 Financing Activities Issuance of common shares 130 - 130 -
Change in cash and cash equivalents
(66,859) 135,963 Effect of foreign exchange on cash balances (892) 559 Cash and cash equivalents, beginning of period 133,836 52,407 Cash and cash equivalents, end of period 66,085 188,929 See accompanying notes to the condensed interim consolidated financial statements.

Pan Orient Energy Corp. Notes to the Condensed Interim Consolidated Financial Statements (Expressed in Canadian dollars, unless otherwise noted) (Unaudited)
6
1) DESCRIPTION OF BUSINESS Pan Orient Energy Corp. (“Pan Orient” or the “Company”) is an oil and natural gas company based in Calgary, Alberta, which holds properties onshore Thailand, onshore and offshore Indonesia and interests in a subsidiary with properties in Northern Alberta. The Company is continually pursuing other oil and natural gas exploration opportunities in Asia.
2) BASIS OF PRESENTATION The condensed interim consolidated financial statements for the Company as at June 30, 2013 and for the three and six months ended June 30, 2013 and 2012 should be read in conjunction with the audited consolidated financial statements as at and for the year ended December 31, 2012. The condensed interim consolidated financial statements are prepared using the same accounting policies and methods of computation as disclosed in the annual consolidated financial statements except as noted below (note 3). The condensed interim consolidated financial statements are stated in Canadian dollars and have been prepared in accordance with the International Accounting Standards 34, “Interim Financial Reporting”. The condensed interim consolidated financial statements were approved by the Company’s Board of Directors on August 26, 2013.
3) CHANGES IN ACCOUNTING POLICIES IFRS 10 Consolidated Financial Statements As of January 1, 2013 the Company adopted IFRS 10, “Consolidated Financial Statements” which requires an entity to consolidate an investee when it is exposed, or has rights, to variable returns from its involvement with the investee and has the ability to affect those returns through its power over the investee. IFRS 10 replaces SIC-12 “Consolidation - Special Purpose Entities” and parts of IAS 27 “Consolidated and Separate Financial Statements”. The adoption of this standard did not impact these condensed interim financial statements. IFRS 11 Joint Arrangements As of January 1, 2013 the Company adopted IFRS 11, “Joint Arrangements” which requires a venturer to classify its interest in a joint arrangement as a joint venture or a joint operation. Joint ventures will be accounted for using the equity method of accounting whereas for a joint operation the venturer will recognize its share of the assets, liabilities, revenue and expenses of the joint operation. IFRS 11 supersedes IAS 31 “Interests in Joint Ventures” and SIC-13 “Jointly Controlled Entities - Non-Monetary Contributions by Venturers”. This standard has no impact on the Company as all joint arrangements are considered jointly controlled assets and the Company will continue to include herein its proportionate share of the relevant assets and liabilities. IFRS 12 Disclosure of Interests in Other Entities As of January 1, 2013 the Company adopted IFRS 12, “Disclosure of Interests in Other Entities” which applies to entities that have an interest in a subsidiary, a joint arrangement, an associate or an unconsolidated structured entity. The adoption of this standard did not impact these condensed interim financial statements. IFRS 13 Fair Value Measurements As of January 1, 2013 the Company adopted IFRS 13, “Fair Value Measurements” which defines fair value, sets out a single IFRS framework for measuring value and requires disclosure about fair value measurements. IFRS 13 applies to IFRSs that require or permit fair value measurements or disclosures about fair value measurement, except in specified circumstances. The adoption of this standard did not impact these condensed interim financial statements.
Pan Orient Energy Corp. Notes to the Condensed Interim Consolidated Financial Statements (Expressed in Canadian dollars, unless otherwise noted) (Unaudited)
7
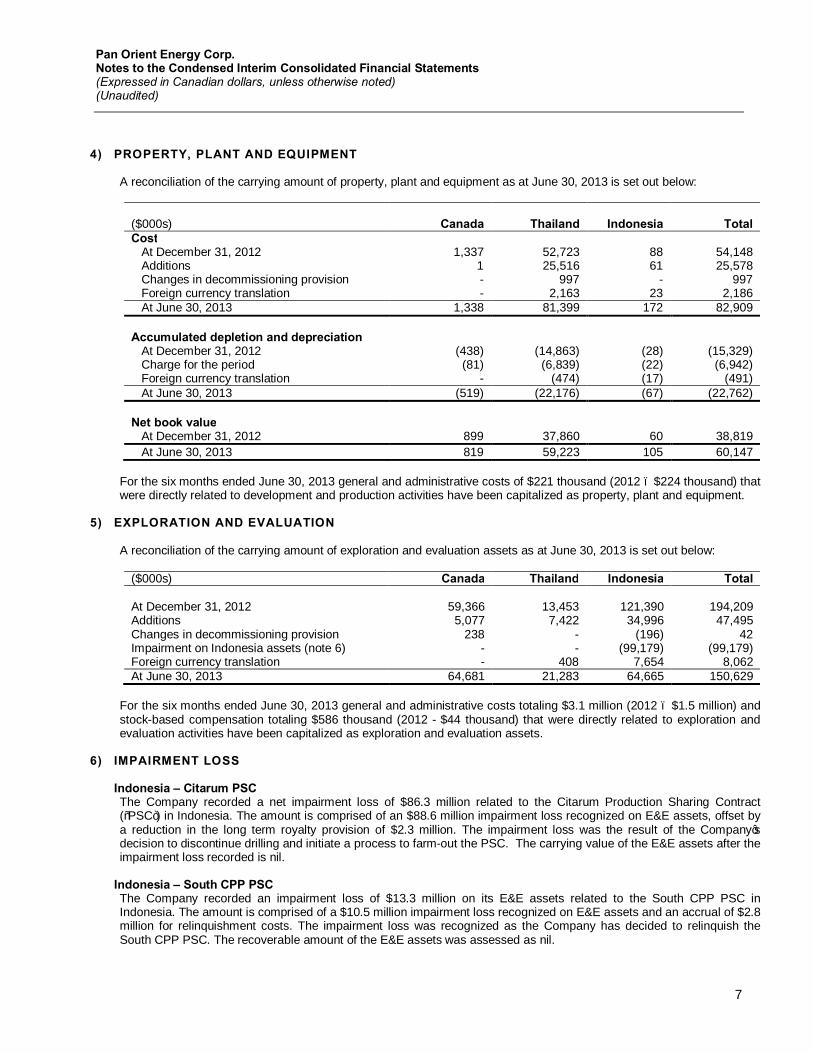
4) PROPERTY, PLANT AND EQUIPMENT A reconciliation of the carrying amount of property, plant and equipment as at June 30, 2013 is set out below:
($000s) Canada Thailand
Indonesia
Total
Cost At December 31, 2012 1,337 52,723 88 54,148 Additions 1 25,516 61 25,578 Changes in decommissioning provision - 997 - 997 Foreign currency translation - 2,163 23 2,186 At June 30, 2013 1,338 81,399 172 82,909 Accumulated depletion and depreciation At December 31, 2012 (438) (14,863) (28) (15,329) Charge for the period (81) (6,839) (22) (6,942) Foreign currency translation - (474) (17) (491) At June 30, 2013 (519) (22,176) (67) (22,762) Net book value At December 31, 2012 899 37,860 60 38,819 At June 30, 2013 819 59,223 105 60,147
For the six months ended June 30, 2013 general and administrative costs of $221 thousand (2012 – $224 thousand) that were directly related to development and production activities have been capitalized as property, plant and equipment.
5) EXPLORATION AND EVALUATION
A reconciliation of the carrying amount of exploration and evaluation assets as at June 30, 2013 is set out below:
($000s) Canada Thailand Indonesia Total At December 31, 2012 59,366 13,453 121,390 194,209 Additions 5,077 7,422 34,996 47,495 Changes in decommissioning provision 238 - (196) 42 Impairment on Indonesia assets (note 6) - - (99,179) (99,179) Foreign currency translation - 408 7,654 8,062 At June 30, 2013 64,681 21,283 64,665 150,629
For the six months ended June 30, 2013 general and administrative costs totaling $3.1 million (2012 – $1.5 million) and stock-based compensation totaling $586 thousand (2012 - $44 thousand) that were directly related to exploration and evaluation activities have been capitalized as exploration and evaluation assets.
6) IMPAIRMENT LOSS
Indonesia – Citarum PSC The Company recorded a net impairment loss of $86.3 million related to the Citarum Production Sharing Contract (“PSC”) in Indonesia. The amount is comprised of an $88.6 million impairment loss recognized on E&E assets, offset by a reduction in the long term royalty provision of $2.3 million. The impairment loss was the result of the Company’s decision to discontinue drilling and initiate a process to farm-out the PSC. The carrying value of the E&E assets after the impairment loss recorded is nil.
Indonesia – South CPP PSC The Company recorded an impairment loss of $13.3 million on its E&E assets related to the South CPP PSC in Indonesia. The amount is comprised of a $10.5 million impairment loss recognized on E&E assets and an accrual of $2.8 million for relinquishment costs. The impairment loss was recognized as the Company has decided to relinquish the South CPP PSC. The recoverable amount of the E&E assets was assessed as nil.
Pan Orient Energy Corp. Notes to the Condensed Interim Consolidated Financial Statements (Expressed in Canadian dollars, unless otherwise noted) (Unaudited)
8
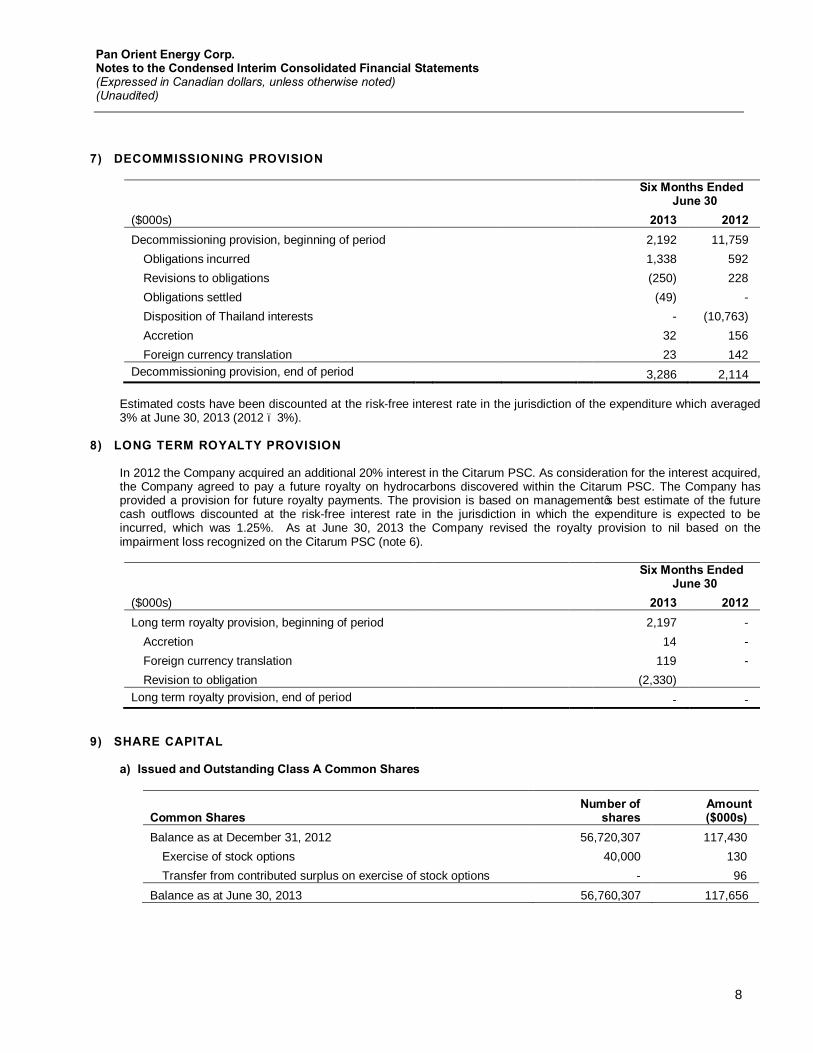
7) DECOMMISSIONING PROVISION
Six Months Ended
June 30 ($000s) 2013 2012 Decommissioning provision, beginning of period 2,192 11,759
Obligations incurred 1,338 592 Revisions to obligations (250) 228 Obligations settled (49) - Disposition of Thailand interests - (10,763) Accretion 32 156 Foreign currency translation 23 142
Decommissioning provision, end of period 3,286 2,114
Estimated costs have been discounted at the risk-free interest rate in the jurisdiction of the expenditure which averaged 3% at June 30, 2013 (2012 – 3%).
8) LONG TERM ROYALTY PROVISION
In 2012 the Company acquired an additional 20% interest in the Citarum PSC. As consideration for the interest acquired, the Company agreed to pay a future royalty on hydrocarbons discovered within the Citarum PSC. The Company has provided a provision for future royalty payments. The provision is based on management’s best estimate of the future cash outflows discounted at the risk-free interest rate in the jurisdiction in which the expenditure is expected to be incurred, which was 1.25%. As at June 30, 2013 the Company revised the royalty provision to nil based on the impairment loss recognized on the Citarum PSC (note 6).
Six Months Ended
June 30 ($000s) 2013 2012 Long term royalty provision, beginning of period 2,197 -
Accretion 14 - Foreign currency translation 119 - Revision to obligation (2,330)
Long term royalty provision, end of period - -
9) SHARE CAPITAL
a) Issued and Outstanding Class A Common Shares
Common Shares Number of
shares Amount ($000s)
Balance as at December 31, 2012 56,720,307 117,430 Exercise of stock options 40,000 130 Transfer from contributed surplus on exercise of stock options - 96
Balance as at June 30, 2013 56,760,307 117,656

Pan Orient Energy Corp. Notes to the Condensed Interim Consolidated Financial Statements (Expressed in Canadian dollars, unless otherwise noted) (Unaudited)
9
b) Options to Purchase Common Shares
Number of
options
Weighted average exercise price ($)
Balance as at December 31, 2012 4,988,167 4.63 Granted 400,000 4.15 Exercised (40,000) 3.25 Cancelled (89,667) 3.57
Balance as at June 30, 2013 5,258,500 4.62 Exercisable at June 30, 2013 3,762,004 5.28
c) Stock-based Compensation
The fair value of the stock options granted has been estimated on the grant dates using the Black-Scholes option pricing model. Weighted average assumptions and resultant fair values for stock options granted during the periods ended June 30, 2013 and 2012 are as follows:
Three Months Ended June 30
Six Months Ended June 30
2013 2012 2013 2012 Risk free interest rate (%) - 1 1 1 Expected lives (years) - 5 5 5 Expected volatility (%) - 65 68 65 Dividend per share (%) - - - - Forfeiture rate (%) - 10 10 10 Weighted average fair value - $ 1.83 $ 2.36 $ 1.83
d) Andora Energy Corporation
i) Issued and Outstanding Class A Common Shares
As at June 30, 2013 Andora had 100.0 million (December 31, 2012 – 100.0 million) common shares issued and outstanding of which Pan Orient held 71.8% (December 31, 2012 – 71.8%).
ii) Options to Purchase Common Shares of Andora
Number
Weighted Average
Exercise Price Balance, as at December 31, 2012 and June 30, 2013 10,000,000 $ 0.60Exercisable at June 30, 2013 4,213,217 $ 0.60
Pan Orient Energy Corp. Notes to the Condensed Interim Consolidated Financial Statements (Expressed in Canadian dollars, unless otherwise noted) (Unaudited)
10
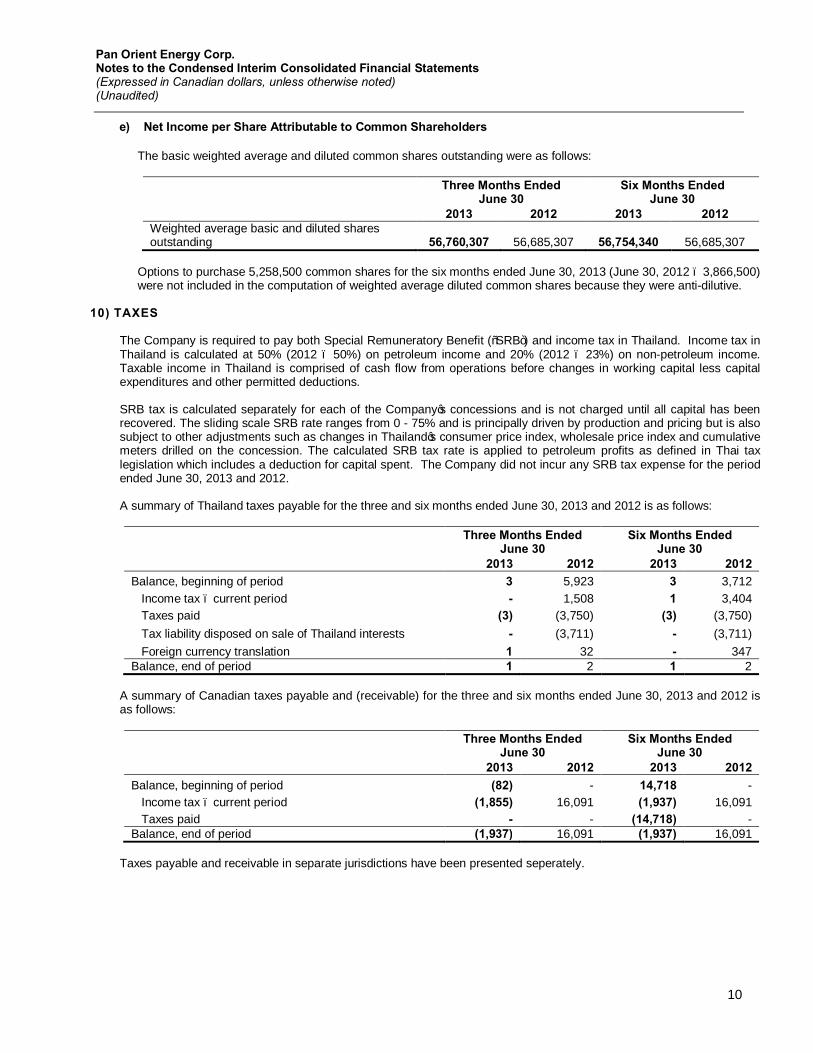
e) Net Income per Share Attributable to Common Shareholders
The basic weighted average and diluted common shares outstanding were as follows:
Three Months Ended June 30
Six Months Ended June 30
2013 2012 2013 2012 Weighted average basic and diluted shares outstanding 56,760,307 56,685,307 56,754,340 56,685,307
Options to purchase 5,258,500 common shares for the six months ended June 30, 2013 (June 30, 2012 – 3,866,500) were not included in the computation of weighted average diluted common shares because they were anti-dilutive.
10) TAXES The Company is required to pay both Special Remuneratory Benefit (“SRB”) and income tax in Thailand. Income tax in Thailand is calculated at 50% (2012 – 50%) on petroleum income and 20% (2012 – 23%) on non-petroleum income. Taxable income in Thailand is comprised of cash flow from operations before changes in working capital less capital expenditures and other permitted deductions. SRB tax is calculated separately for each of the Company’s concessions and is not charged until all capital has been recovered. The sliding scale SRB rate ranges from 0 - 75% and is principally driven by production and pricing but is also subject to other adjustments such as changes in Thailand’s consumer price index, wholesale price index and cumulative meters drilled on the concession. The calculated SRB tax rate is applied to petroleum profits as defined in Thai tax legislation which includes a deduction for capital spent. The Company did not incur any SRB tax expense for the period ended June 30, 2013 and 2012. A summary of Thailand taxes payable for the three and six months ended June 30, 2013 and 2012 is as follows:
Three Months Ended June 30
Six Months Ended June 30
2013 2012 2013 2012 Balance, beginning of period 3 5,923 3 3,712 Income tax – current period - 1,508 1 3,404 Taxes paid (3) (3,750) (3) (3,750) Tax liability disposed on sale of Thailand interests - (3,711) - (3,711) Foreign currency translation 1 32 - 347 Balance, end of period 1 2 1 2
A summary of Canadian taxes payable and (receivable) for the three and six months ended June 30, 2013 and 2012 is as follows:
Three Months Ended June 30
Six Months Ended June 30
2013 2012 2013 2012 Balance, beginning of period (82) - 14,718 - Income tax – current period (1,855) 16,091 (1,937) 16,091 Taxes paid - - (14,718) - Balance, end of period (1,937) 16,091 (1,937) 16,091
Taxes payable and receivable in separate jurisdictions have been presented seperately.

Pan Orient Energy Corp. Notes to the Condensed Interim Consolidated Financial Statements (Expressed in Canadian dollars, unless otherwise noted) (Unaudited)
11
11) FINANCIAL INSTRUMENTS The Company’s reporting currency is the Canadian dollar and its functional currencies are the Canadian dollar, the Thai baht and the U.S. dollar (“USD”). Changes in foreign exchange rates between the Canadian dollar and the U.S. dollar and Thai baht can affect net income and other comprehensive income. As at June 30 the following financial instruments were denominated in currencies other than the Canadian dollar:
As at June 30, 2013
As at June 30, 2012
Thai baht (000s of Thai
baht) USD ($000s)
Thai baht (000s of Thai
baht) USD ($000s) Cash and cash equivalents 44,671 2,579 128,274 108,505 Accounts receivable 230,785 4,830 34,710 22,674 Deposits 29,731 1,968 20,000 - Accounts payable (263,178) (15,626) (110,320) (8,472) Taxes payable (37) - (143) - Net exposure in functional currency 41,972 (6,249) 72,521 122,707 Net exposure in Canadian dollars(1) ($000s) 1,430 (6,549) 2,378 125,026
(1) Translated at June 30, 2013 and 2012 exchange rates. Due to the short term nature of the Company’s financial instruments the fair value approximates the carrying value. Accumulated other comprehensive income is comprised of unrealized foreign exchange gains and losses on translation of foreign operations. These gains and losses are recycled into net income on the disposition of the foreign operation.
Pan Orient Energy Corp. Notes to the Condensed Interim Consolidated Financial Statements (Expressed in Canadian dollars, unless otherwise noted) (Unaudited)
12
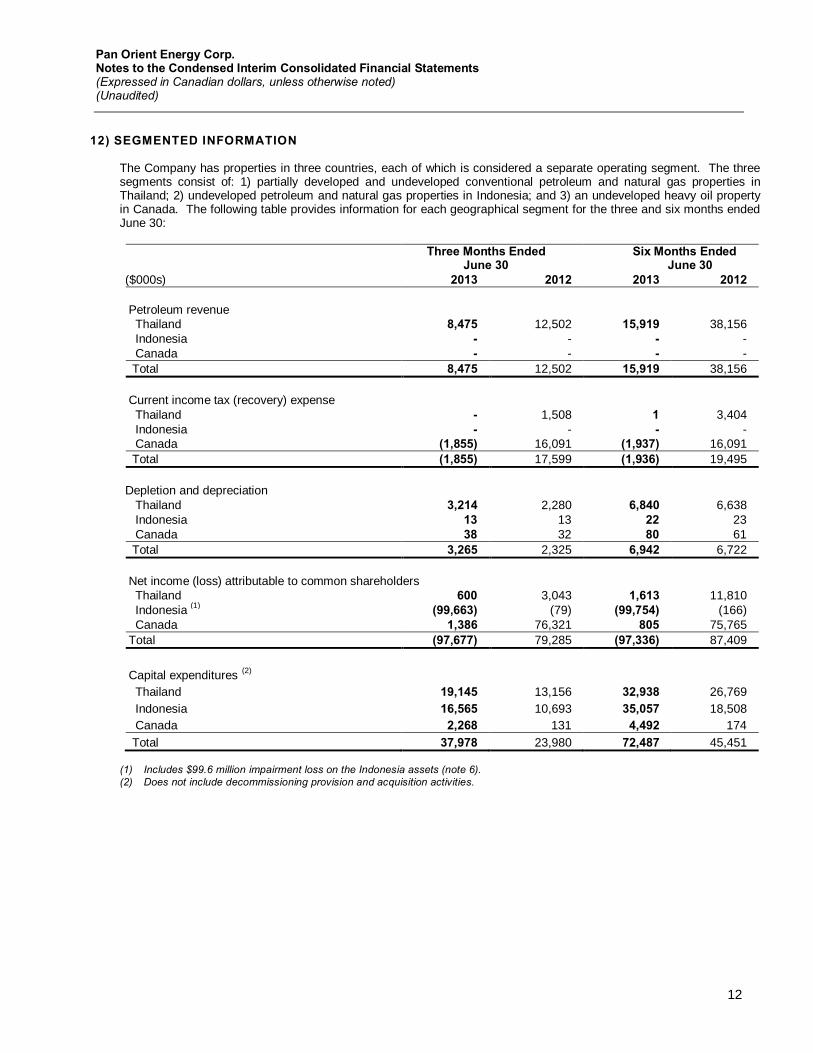
12) SEGMENTED INFORMATION
The Company has properties in three countries, each of which is considered a separate operating segment. The three segments consist of: 1) partially developed and undeveloped conventional petroleum and natural gas properties in Thailand; 2) undeveloped petroleum and natural gas properties in Indonesia; and 3) an undeveloped heavy oil property in Canada. The following table provides information for each geographical segment for the three and six months ended June 30:
Three Months Ended
June 30 Six Months Ended
June 30 ($000s) 2013 2012 2013 2012
Petroleum revenue Thailand 8,475 12,502 15,919 38,156 Indonesia - - - - Canada - - - - Total 8,475 12,502 15,919 38,156 Current income tax (recovery) expense Thailand - 1,508 1 3,404 Indonesia - - - - Canada (1,855) 16,091 (1,937) 16,091 Total (1,855) 17,599 (1,936) 19,495 Depletion and depreciation Thailand 3,214 2,280 6,840 6,638 Indonesia 13 13 22 23 Canada 38 32 80 61 Total 3,265 2,325 6,942 6,722 Net income (loss) attributable to common shareholders Thailand 600 3,043 1,613 11,810 Indonesia (1) (99,663) (79) (99,754) (166) Canada 1,386 76,321 805 75,765 Total (97,677) 79,285 (97,336) 87,409 Capital expenditures (2) Thailand 19,145 13,156 32,938 26,769 Indonesia 16,565 10,693 35,057 18,508 Canada 2,268 131 4,492 174 Total 37,978 23,980 72,487 45,451
(1) Includes $99.6 million impairment loss on the Indonesia assets (note 6). (2) Does not include decommissioning provision and acquisition activities.
Pan Orient Energy Corp. Notes to the Condensed Interim Consolidated Financial Statements (Expressed in Canadian dollars, unless otherwise noted) (Unaudited)
13
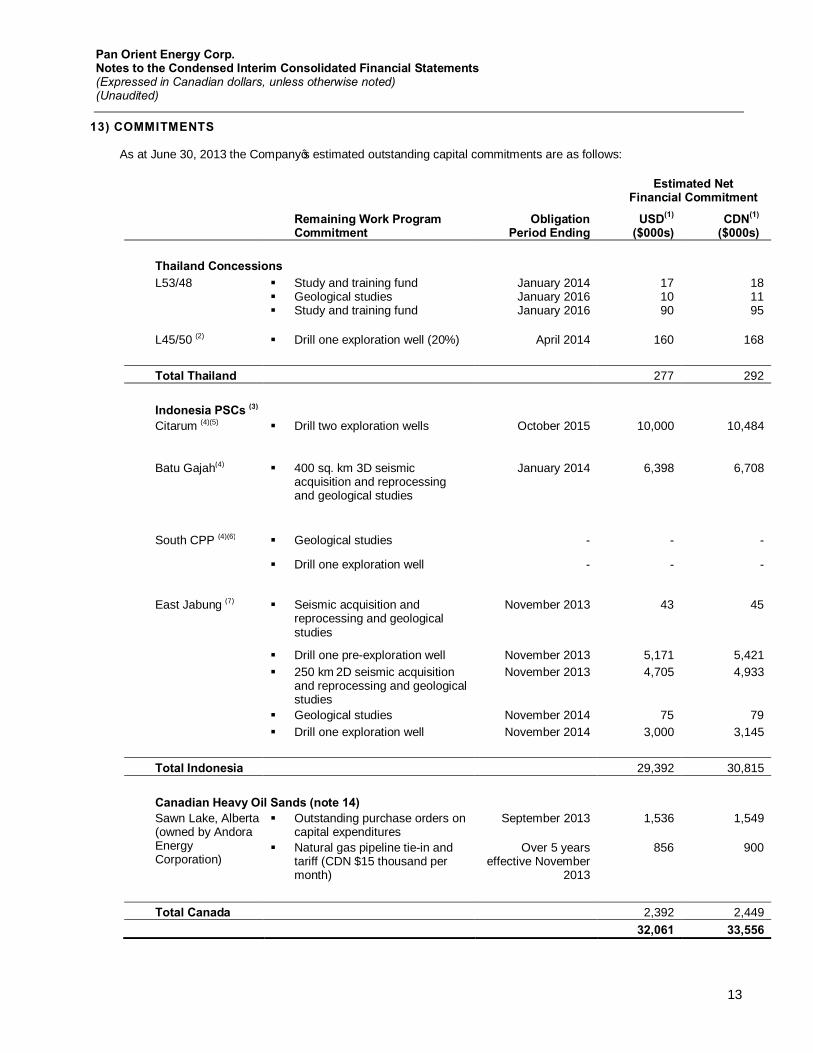
13) COMMITMENTS As at June 30, 2013 the Company’s estimated outstanding capital commitments are as follows:
Estimated Net
Financial Commitment
Remaining Work Program Commitment
Obligation Period Ending
USD(1) ($000s)
CDN(1) ($000s)
Thailand Concessions L53/48 § Study and training fund
§ Geological studies § Study and training fund
January 2014 January 2016 January 2016
17 10 90
18 11 95
L45/50 (2) § Drill one exploration well (20%) April 2014 160 168 Total Thailand 277 292 Indonesia PSCs (3) Citarum (4)(5) § Drill two exploration wells October 2015 10,000 10,484
Batu Gajah(4) § 400 sq. km 3D seismic
acquisition and reprocessing and geological studies
January 2014 6,398 6,708
South CPP (4)(6) § Geological studies - - -
§ Drill one exploration well - - -
East Jabung (7) § Seismic acquisition and
reprocessing and geological studies
November 2013 43 45
§ Drill one pre-exploration well November 2013 5,171 5,421 § 250 km 2D seismic acquisition
and reprocessing and geological studies
November 2013 4,705 4,933
§ Geological studies November 2014 75 79 § Drill one exploration well November 2014 3,000 3,145 Total Indonesia 29,392 30,815 Canadian Heavy Oil Sands (note 14) Sawn Lake, Alberta (owned by Andora Energy Corporation)
§ Outstanding purchase orders on capital expenditures
September 2013 1,536 1,549
§ Natural gas pipeline tie-in and tariff (CDN $15 thousand per month)
Over 5 years effective November
2013
856 900
Total Canada 2,392 2,449
32,061 33,556
Pan Orient Energy Corp. Notes to the Condensed Interim Consolidated Financial Statements (Expressed in Canadian dollars, unless otherwise noted) (Unaudited)
14
(1) Translated at June 30, 2013 exchange rates. (2) Commitment shown is Pan Orient’s 20% share of the gross USD $800,000 stated in the Concession L45 Agreement. Pan Orient
has earned a 20% interest pursuant to the Farm-in Agreement as at June 30, 2013. Under the Farm-in Agreement Pan Orient can elect to drill two additional exploration wells to earn an additional 20% working interest for each well drilled. The Company can increase its working interest from 20% to a maximum of 60% based on its election to drill the additional wells.
(3) Indonesia financial commitments as provided above represent the required initial 3-year firm exploration work program required under the PSC. With respect to Citarum, Batu Gajah and South CPP, extension of these initial 3-year firm exploration work program commitments have been successfully negotiated in the past with the Government of Indonesia (“GOI”) to the dates indicated above. The deadlines for commitments and potential extension of the total exploration period with potential additional commitments is determined on a year-by-year basis as part of an annual submission of a work program which is approved by the GOI. Although extension of the deadline for completion of the 3-year firm exploration work program is a departure from the original contract, it is considered standard practice in Indonesia. In the past, such applications on behalf of Pan Orient have been approved by the GOI and management has no reason to believe that future requests will not be granted approval; however, there is no guarantee. Upon default of a commitment related to any of the first three years of a PSC, the operator is required to relinquish 15% of the original PSC area (the actual acreage relinquished is at the discretion of the operator) and to date, Citarum, Batu Gajah and South CPP have complied with these penalty relinquishments. Depending on the stage of the PSC, failure to fulfill the required firm commitments may also result in penalty payment equal to the unfulfilled commitments and/or forfeiture of the PSC.
(4) Amounts recorded in the condensed interim consolidated financial statements and work commitments related to these PSCs include amounts paid by Pan Orient on behalf of a partner’s carried interest (3% for the Citarum PSC, 23% for the Batu Gajah and South CPP PSC’s).
(5) The Company believes that it has satisfied the Citarum PSC commitment for two wells with the drilling operations of the Jatayu-1 and Cataka-1A wells, however this has not been finalized with the GOI and the GOI may have a different interpretation of the requirement. The amount shown is based on the US$5 million per well as stated in the PSC.
(6) The Company has decided to relinquish the South CPP PSC. As part of the relinquishment it is expected that the Company will be required to pay the GOI for the unfulfilled commitments. The Company has accrued CDN $2.8 million as at June 30, 2013 for the estimated unfulfilled firm commitments representing $2.6 million for one unfulfilled exploration well and $0.2 million for the unfulfilled geological studies.
(7) The Company has submitted an application to the GOI to extend the East Jabung commitments. As at June 30, 2013 the application for extension has not yet been approved.
Management’s estimate of the minimum amount to fulfill the commitments in Indonesia is based either on the amount stated in the PSC agreement, or the work program budget approved by the GOI if the work program activity has commenced. Commitments in Thailand are estimated based on the amount stated in the concession agreement. Actual expenditures required to carry out these commitments may be significantly different from the estimates. The Company intends to fund commitments through expected cash flows from Thailand and the Company’s existing cash balance.
14) SUBSEQUENT EVENT On August 15, 2013, Andora’s joint venture partners elected to participate in the Sawn Lake Steam Assisted Gravity Drainage Demonstration Project located in North Central Alberta, Canada and have taken steps to secure funding for their share of the project. The project will proceed with Andora as operator with a 50% working interest and a 50% working interest held by the non-operating joint venture partners. Andora's 50% share of the 2013 phase of the project is expected to be $12.1 million. To June 30, 2013 Andora has invested approximately $5.5 million in the project, with $4.5 million in the period of January to June 2013. As part of the arrangement, Andora is allowing the joint venture partners to repurchase the 3% gross overriding royalty on their 40% working interest on 12 sections of land in the central block, where the demonstration project is located, for $2.8 million, under certain terms and conditions.