pakistan microfinance review...
TRANSCRIPT
PAKISTANMICROFINANCE REVIEW 2014
ANNUAL ASSESSMENT OF THE MICROFINANCE INDUSTRY
F I N A N C I A L S E R V I C E S F O R A L L


Produced by Pakistan Microfinance NetworkDesign and Layout by O3 Interfaceswww.o3interfaces.com
Pakistan Microfinance Review 2014Annual Assessmentof the Microfinance Industry

Fina
ncia
l Ser
vice
s fo
r all
Paki
stan
Micr
ofin
ance
Rev
iew
201
4
i
Editorial Board
Mr. Ghalib NishtarChairperson Editorial BoardPresident, Khushhali Bank Limited (KBL)
Dr. Saeed AhmedDirector, Agriculture Credit and Microfinance Department,State Bank of Pakistan (SBP)
Mr. Blain StephensCOO and Director of Analysis Microfinance Information eXchange, Inc. (MIX)
Mr. Raza KhanStatistics & Results Adviser, Results & Evaluation Team- Economic Growth Group,Department for International Development (UK)
Mr. Yasir AshfaqGroup Head, Financial Services Group, Pakistan Poverty Alleviation Fund (PPAF)
Mr. Abrar MirSEVP & Group Executive Banking Products Group,United Bank Limited (UBL)
Mr. Masood Safdar GillDirector Program, Urban Poverty Alleviation Program, National Rural Support Programme (NRSP)
Fina
ncia
l Ser
vice
s fo
r all
Annu
al A
sses
smen
t of t
he M
icrof
inan
ce In
dust
ry
ii
PMR Team
Mr. Ali BasharatAuthor and Managing Editor
Mr. Ammar ArshadCo–Author and Data Collection
Ms. Khadija AliCo–Author and Data Collection
Fina
ncia
l Ser
vice
s fo
r all
Paki
stan
Micr
ofin
ance
Rev
iew
201
4
iii
Acronyms and Abbreviations
AC &MFD Agriculture and Microfinance Division
ADB Asian Development Bank
AMRDO Al-Mehran Rural Development Organization
AML Anti-Money Laundering
BPS Basis Points
CAR Capital Adequacy Ratio
CIB Credit Information Bureau
CDD Customer Due Diligence
CGAP Consultative Group to Assist the Poor
CNIC Computerized National Identity Card
CPP Client Protection Principles
CPI Consumer Price Index
CPC Consumer Protection Code
DFI Development Financial Institution
DFID Department for International Development, UK
DPF Depositor’s Protection Fund
ECA Eastern and Central Europe
ESM Environment and Social Management
EUR Euro
FATF Financial Action Task Force
FIP Financial Inclusion Program
FMFB The First Microfinance Bank Ltd.
FSS Financial Self Sufficiency
FY Financial Year
G2P Government to Person
GBP Great Britain Pound
GDP Gross Domestic Product
GLP Gross Loan Portfolio
GNI Gross National Income
GoP Government of Pakistan
IAFSF Improving Access to Financial Services Support Fund
IFAD International Fund for Agricultural Development
IFC International Finance Corporation
JIWS Jinnah Welfare Society
KBL Khushhali Bank Ltd.
KF Kashf Foundation
Fina
ncia
l Ser
vice
s fo
r all
Annu
al A
sses
smen
t of t
he M
icrof
inan
ce In
dust
ry
iv
Acronyms and Abbreviations
KIBOR Karachi Inter-Bank Offering Rate
KMFBL Kashf Microfinance Bank Ltd.
KP Khyber Pakhtunkhwa
MCGF Microfinance Credit Guarantee Facility
MCR Minimum Capital Requirement
MENA Middle East and North Africa
MFB Microfinance Bank
MFCG Microfinance Consultative Group
MF-CIB Microfinance Credit Information Bureau
MFP Microfinance Providers
MFI Microfinance Institution
MIS Management Information System
MSME Micro, Small and Medium Enterprises
MIV Microfinance Investment Vehicle
MO Micro-Options
NADRA National Database and Registration Authority
NGO Non-Governmental Organization
NFLP National Financial Literacy Program
NMFB Network Microfinance Bank Limited
NPLs Non-Performing Loans
NRDP National Rural Development Program
NRSP National Rural Support Programme
OPD Organization for Participatory Development
OSS Operational Self Sufficiency
P2P Person to Person
PAR Portfolio at Risk
PBA Pakistan Banks Association
PKR Pakistan Rupee
PMN Pakistan Microfinance Network
PO Partner Organization
PPAF Pakistan Poverty Alleviation Fund
PRISM Programme for Increasing Sustainable Microfinance
PRSP Punjab Rural Support Program
PTA Pakistan Telecom Authority
ROA Return on Assets
ROE Return on Equity
RSP Rural Support Programme
SBP State Bank of Pakistan
SC The Smart Campaign
SDS SAATH Development Society
SECP Securities and Exchange Commission of Pakistan
SPTF Social Performance Task Force
SME Small and Medium Enterprise
SRSO Sindh Rural Support Organization
SRDO Shadab Rural Development Organization
SVDP Soon Valley Development Program

Fina
ncia
l Ser
vice
s fo
r all
Paki
stan
Micr
ofin
ance
Rev
iew
201
4
v
TMFB Tameer Microfinance Bank Ltd
UBL United Bank Limited
USD United State Dollar
USSPM Universal Standards for Social Performance Management
VDO Village Development Organization
WPI Wholesale Price Index
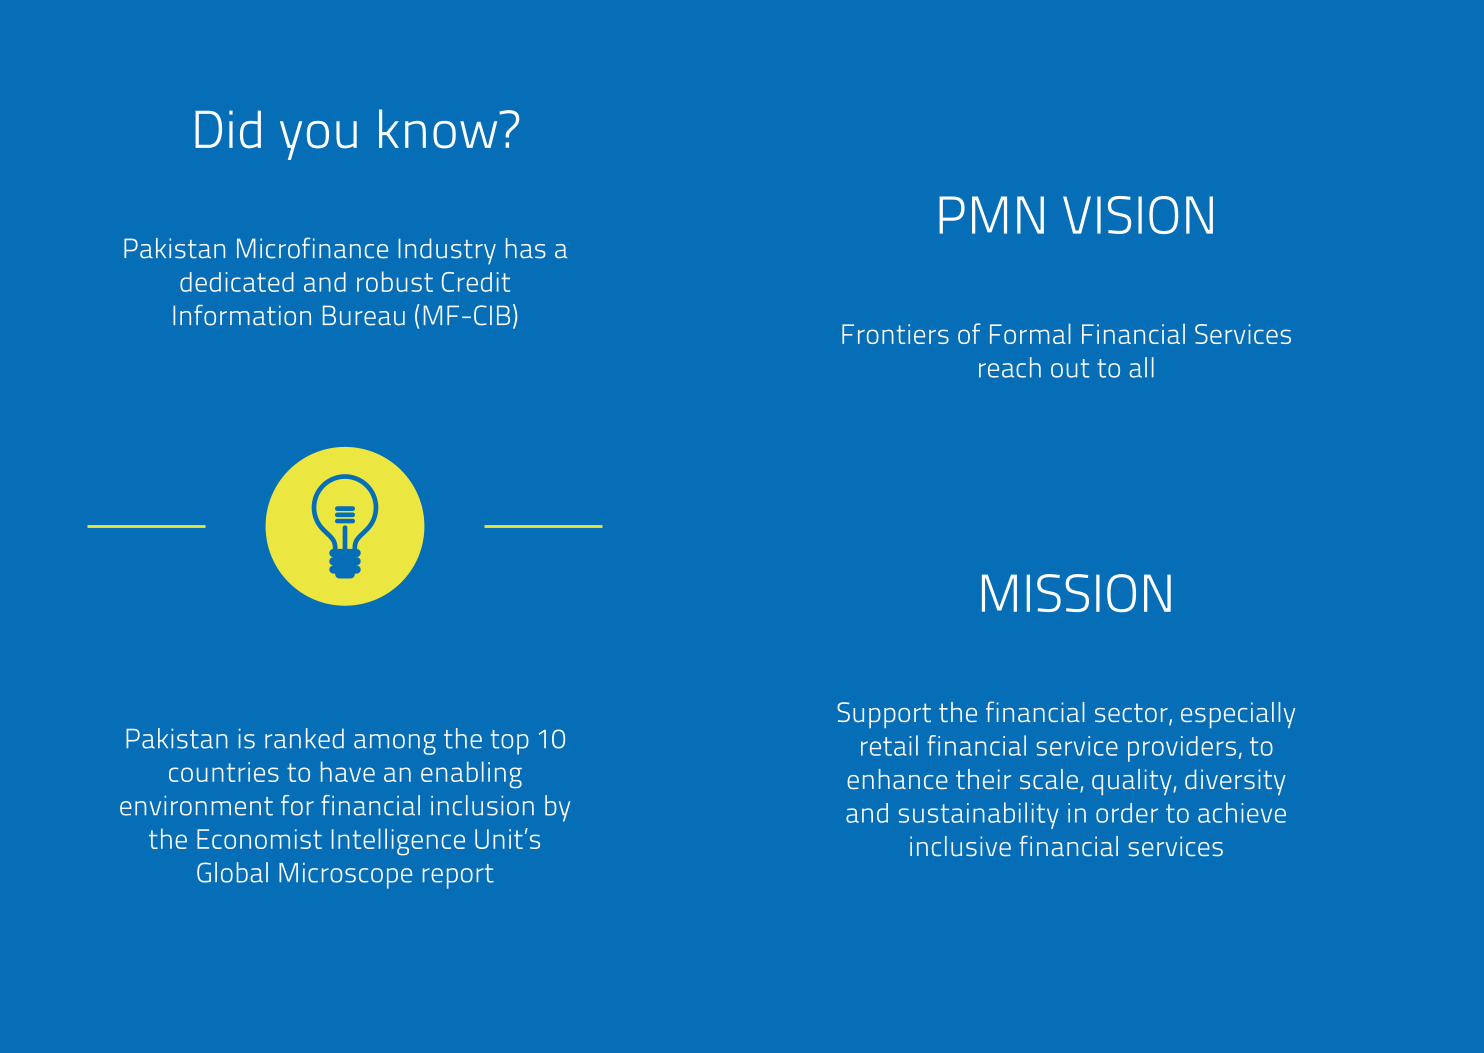
Did you know?
Pakistan Microfinance Industry has a dedicated and robust Credit
Information Bureau (MF-CIB)
PMN VISION
Frontiers of Formal Financial Services reach out to all
MISSION
Support the financial sector, especially retail financial service providers, to
enhance their scale, quality, diversity and sustainability in order to achieve
inclusive financial services
Pakistan is ranked among the top 10 countries to have an enabling
environment for financial inclusion by the Economist Intelligence Unit’s
Global Microscope report
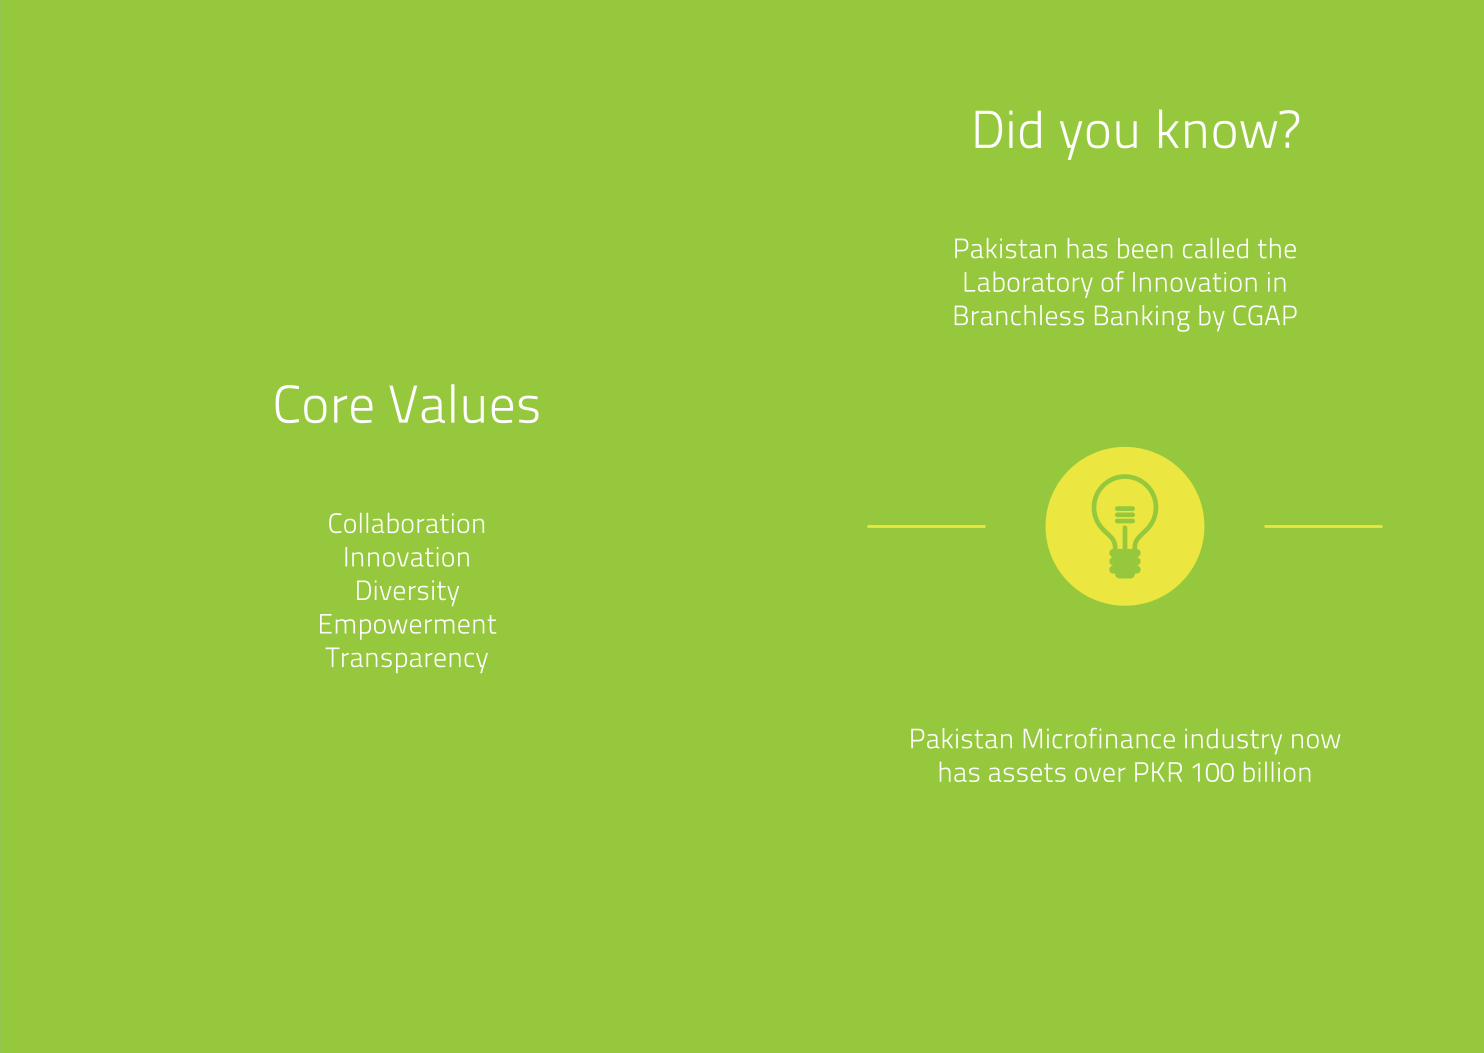
Did you know?
Pakistan has been called the Laboratory of Innovation in
Branchless Banking by CGAP
Pakistan Microfinance industry now has assets over PKR 100 billion
Core Values
CollaborationInnovationDiversity
EmpowermentTransparency
Did you know?
Pakistan Microfinance Industry has a dedicated and robust Credit
Information Bureau (MF-CIB)
PMN VISION
Frontiers of Formal Financial Services reach out to all
MISSION
Support the financial sector, especially retail financial service providers, to
enhance their scale, quality, diversity and sustainability in order to achieve
inclusive financial services
Pakistan is ranked among the top 10 countries to have an enabling
environment for financial inclusion by the Economist Intelligence Unit’s
Global Microscope report
Confidenceof Regulator
Availability ofFunds for
Mid-Sized MFPs
Mitigate ExternalInterference
RetailsDeposits
InvestorConfidence
TurnaroundTime
MainstreamingNon-Bank MFPs
Access toClearing House
Microfinance CreditGuarantee Facility
Draft NBMFIRegulations
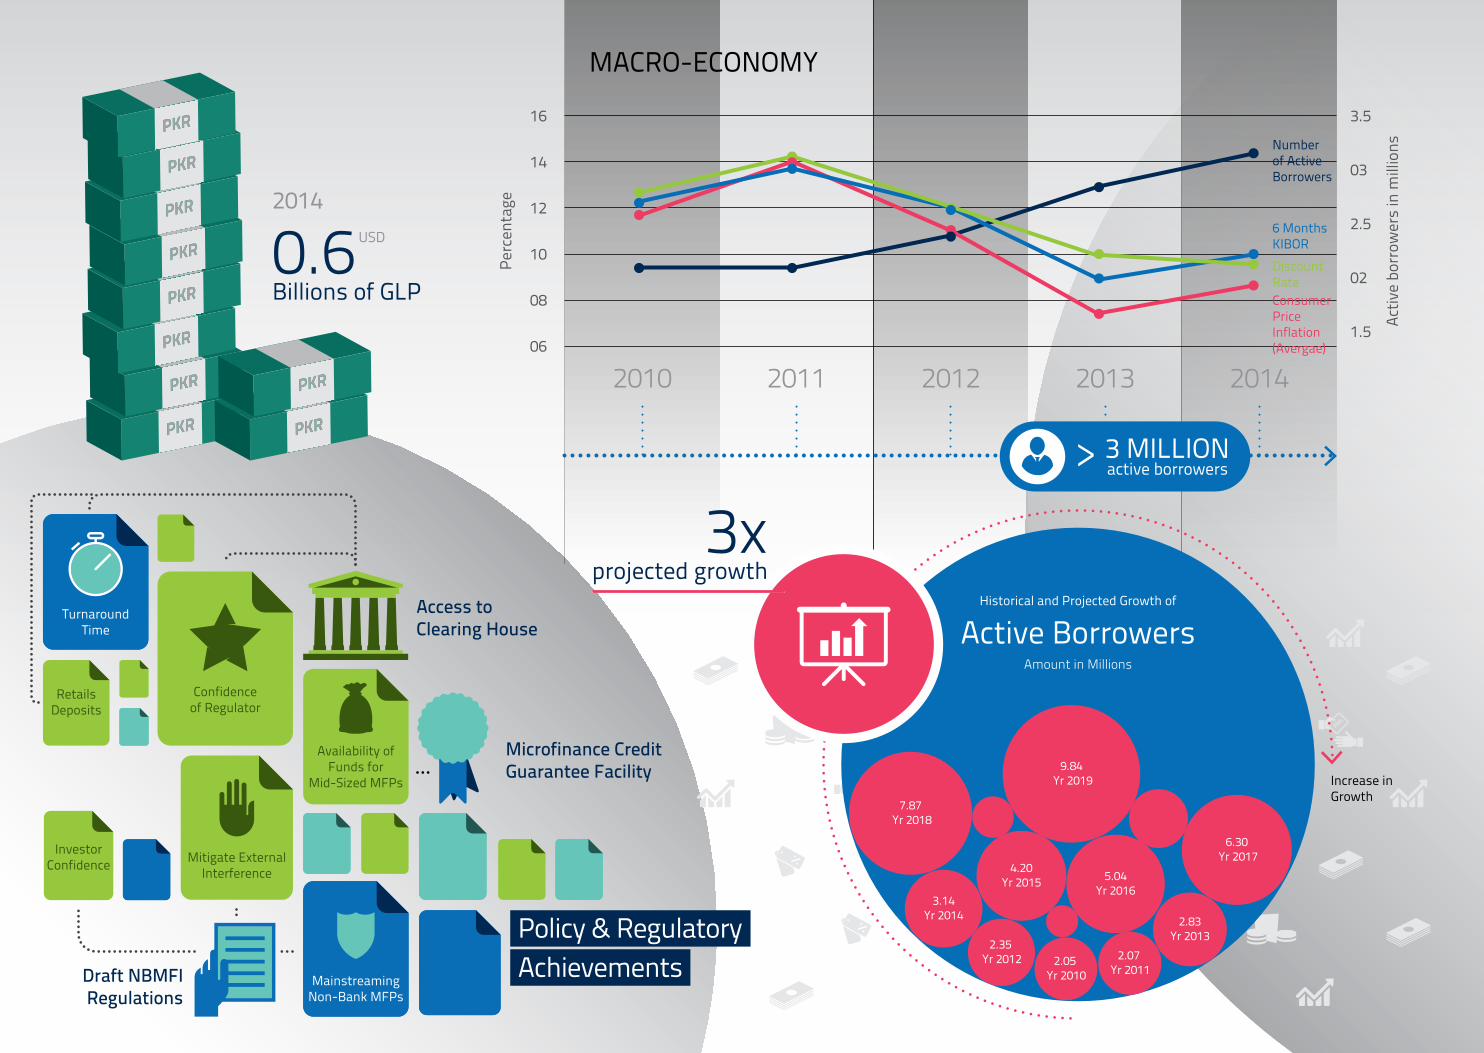
2010 2011 2012 2013 2014
Numberof ActiveBorrowers
6 MonthsKIBORDiscountRateConsumerPriceInflation(Avergae)06
08
10
12
14
16
1.5
02
2.5
03
3.5
MACRO-ECONOMY
Perc
enta
ge
Activ
e bo
rrow
ers
in m
illio
ns
2.05 Yr 2010
2.07 Yr 2011
2.35 Yr 2012
2.83Yr 2013
3.14Yr 2014
4.20Yr 2015 5.04
Yr 2016
6.30 Yr 2017
7.87 Yr 2018
9.84 Yr 2019
Historical and Projected Growth of
Active BorrowersAmount in Millions
Increase inGrowth
3xprojected growth
0.6Billions of GLP
2014USD
3 MILLIONactive borrowers>
Policy & RegulatoryAchievements

Confidenceof Regulator
Availability ofFunds for
Mid-Sized MFPs
Mitigate ExternalInterference
RetailsDeposits
InvestorConfidence
TurnaroundTime
MainstreamingNon-Bank MFPs
Access toClearing House
Microfinance CreditGuarantee Facility
Draft NBMFIRegulations
2010 2011 2012 2013 2014
Numberof ActiveBorrowers
6 MonthsKIBORDiscountRateConsumerPriceInflation(Avergae)06
08
10
12
14
16
1.5
02
2.5
03
3.5
MACRO-ECONOMY
Perc
enta
ge
Activ
e bo
rrow
ers
in m
illio
ns
2.05 Yr 2010
2.07 Yr 2011
2.35 Yr 2012
2.83Yr 2013
3.14Yr 2014
4.20Yr 2015 5.04
Yr 2016
6.30 Yr 2017
7.87 Yr 2018
9.84 Yr 2019
Historical and Projected Growth of
Active BorrowersAmount in Millions
Increase inGrowth
3xprojected growth
0.6Billions of GLP
2014USD
3 MILLIONactive borrowers>
Policy & RegulatoryAchievements
20102011201220132014
0 10 20 30 40 50 60
ACTIVE BORROWERS BY URBAN/RURAL AREAS
58%female borrowers 42%
male borrowers
5.3Million Depositors
in 2014
Regulatoryframework for NBMFIs
Funding
Center ofExcellence
0%
20%
40%
60%
80%
100%
AppropriateProduct Design & Delivery
Channels
TransparencyPrivacy of Client Data
Prevention ofOver-Indebtedness
Mechanism forComplaint Resolution
Responsible PricingFair & RespectfulTreatment of Clients
% of indicators that are not met
% of indicators that are partially met
% of indicators that are fully met
DisasterRisk Management
Equity
Debt
Deposits
0
20
40
60
80
100
44%
23%
33%
CAPITALSTRUCTURE
Rural
Urban
CLIENTPROTECTION

Fina
ncia
l Ser
vice
s fo
r all
Paki
stan
Micr
ofin
ance
Rev
iew
201
4
xi
Highlights
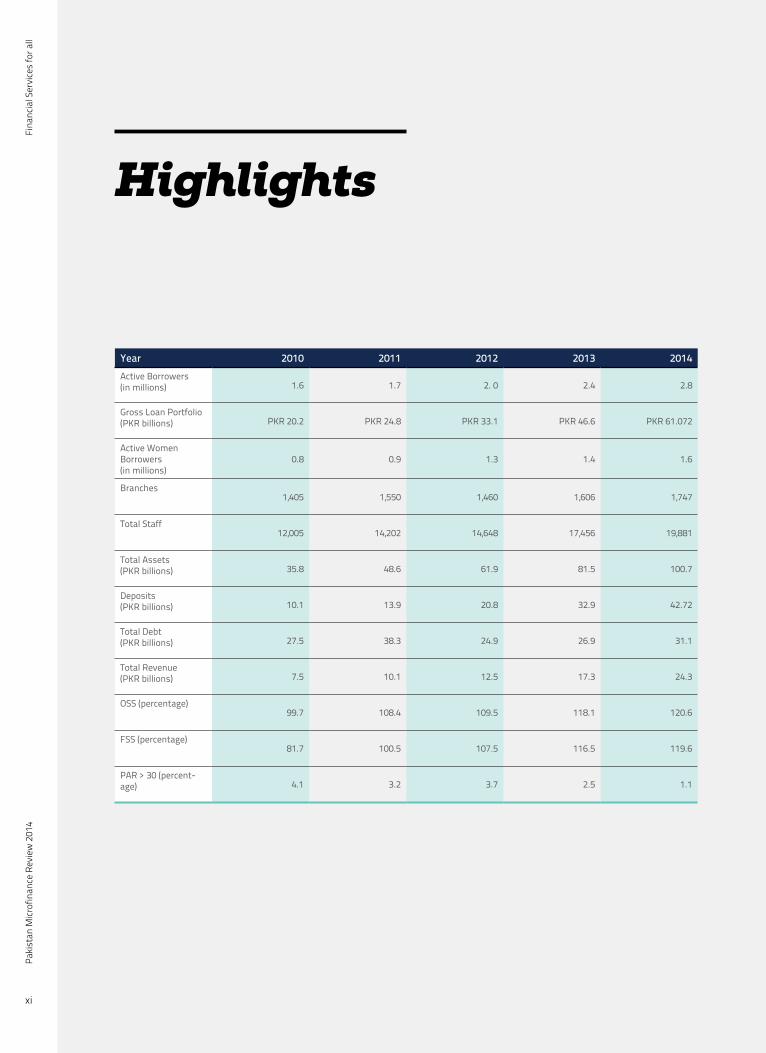
Year 2010 2011 2012 2013 2014Active Borrowers (in millions) 1.6 1.7 2. 0 2.4 2.8
Gross Loan Portfolio(PKR billions) PKR 20.2 PKR 24.8 PKR 33.1 PKR 46.6 PKR 61.072
Active Women Borrowers(in millions)
0.8 0.9 1.3 1.4 1.6
Branches1,405 1,550 1,460 1,606 1,747
Total Staff12,005 14,202 14,648 17,456 19,881
Total Assets (PKR billions) 35.8 48.6 61.9 81.5 100.7
Deposits (PKR billions) 10.1 13.9 20.8 32.9 42.72
Total Debt (PKR billions) 27.5 38.3 24.9 26.9 31.1
Total Revenue(PKR billions) 7.5 10.1 12.5 17.3 24.3
OSS (percentage)99.7 108.4 109.5 118.1 120.6
FSS (percentage)81.7 100.5 107.5 116.5 119.6
PAR > 30 (percent-age) 4.1 3.2 3.7 2.5 1.1
Fina
ncia
l Ser
vice
s fo
r all
Annu
al A
sses
smen
t of t
he M
icrof
inan
ce In
dust
ry
xii
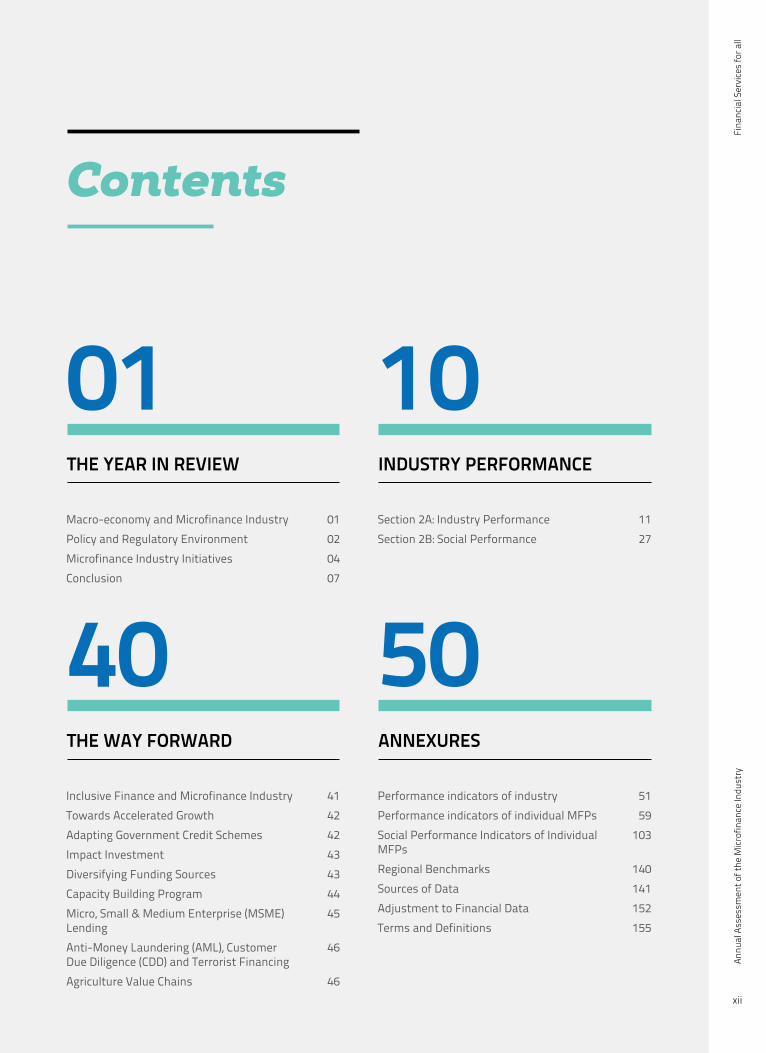
Contents
THE YEAR IN REVIEW
THE WAY FORWARD
INDUSTRY PERFORMANCE
ANNEXURES
01
40
10
50Macro-economy and Microfinance Industry 01Policy and Regulatory Environment 02Microfinance Industry Initiatives 04Conclusion 07
Inclusive Finance and Microfinance Industry 41Towards Accelerated Growth 42Adapting Government Credit Schemes 42Impact Investment 43Diversifying Funding Sources 43Capacity Building Program 44Micro, Small & Medium Enterprise (MSME) Lending
45
Anti-Money Laundering (AML), Customer Due Diligence (CDD) and Terrorist Financing
46
Agriculture Value Chains 46
Section 2A: Industry Performance 11Section 2B: Social Performance 27
Performance indicators of industry 51Performance indicators of individual MFPs 59Social Performance Indicators of Individual MFPs
103
Regional Benchmarks 140Sources of Data 141Adjustment to Financial Data 152Terms and Definitions 155


Section 1
The Year in Review
Fina
ncia
l Ser
vice
s fo
r all
Paki
stan
Micr
ofin
ance
Rev
iew
201
4
1
Section 1
The year 2014 saw the industry achieve a major mile-stone by crossing the 3 million active borrowers mark for the first time. Overall, the industry witnessed double digit growth in not only credit but also in sav-ings and insurance.
Although the national economy grew at a modest rate, the macroeconomic stability ensured a favor-able environment for the players. Despite the per-sistent energy crisis and security challenges, posi-tive economic indicators like lower inflation, falling interest rates and uptake on private credit led to a positive impact on the sector in terms of growth and sustainability.
On the policy and regulatory side, the microfinance banks (MFBs) have been allowed to become mem-bers of the national clearing house which will greatly enhance their ability to mobilize their retail depos-its. In addition, to facilitate mid-tier players to raise funds from commercial sources, risk coverage under the Microfinance Credit Guarantee Fund (MCGF) was
enhanced to 60 percent by the State Bank of Pakistan (SBP). One of key challenge facing the industry has been the lack of a regulatory umbrella for the non-bank microfinance providers (MFPs). In this regard, the last year saw the Securities and Exchange Com-mission of Pakistan (SECP) sharing a draft of pro-posed regulations with players for comments.
Among other major developments in the sector last year an industry risk register is being developed by the Pakistan Microfinance Network (PMN). In addi-tion, branchless banking continues to witness growth and the Microfinance Credit Information Bureau (MF-CIB) is fully operational with most of the MFPs gen-erating enquiries. The PM Interest Free Loan Scheme announced in 2013 was formally launched last year through the Pakistan Poverty Alleviation Fund (PPAF), with an aim of reaching out to 1 million clients in the next three years. As part of the responsible fi-nance initiative, client protection assessments were carried out under the SMART campaign.
The year 2014 was a better year for Pakistan’s econ-omy as it witnessed lower than expected inflation, reduction in fiscal deficit and improvement in private sector credit. In addition, the overall economy grew by 4.1 percent compared to the 3.7 percent in 2013. However, this was less than the target of 4.4 percent for the year 2014.
Inflation for the year clocked at 8.6 percent - high-er than the previous year’s 7.4%, but lower than the expected rate of 11-12 percent. However, despite the lower inflation, the central bank took a cautious approach to monetary policy with the policy rate re-maining constant for the better part of the year.
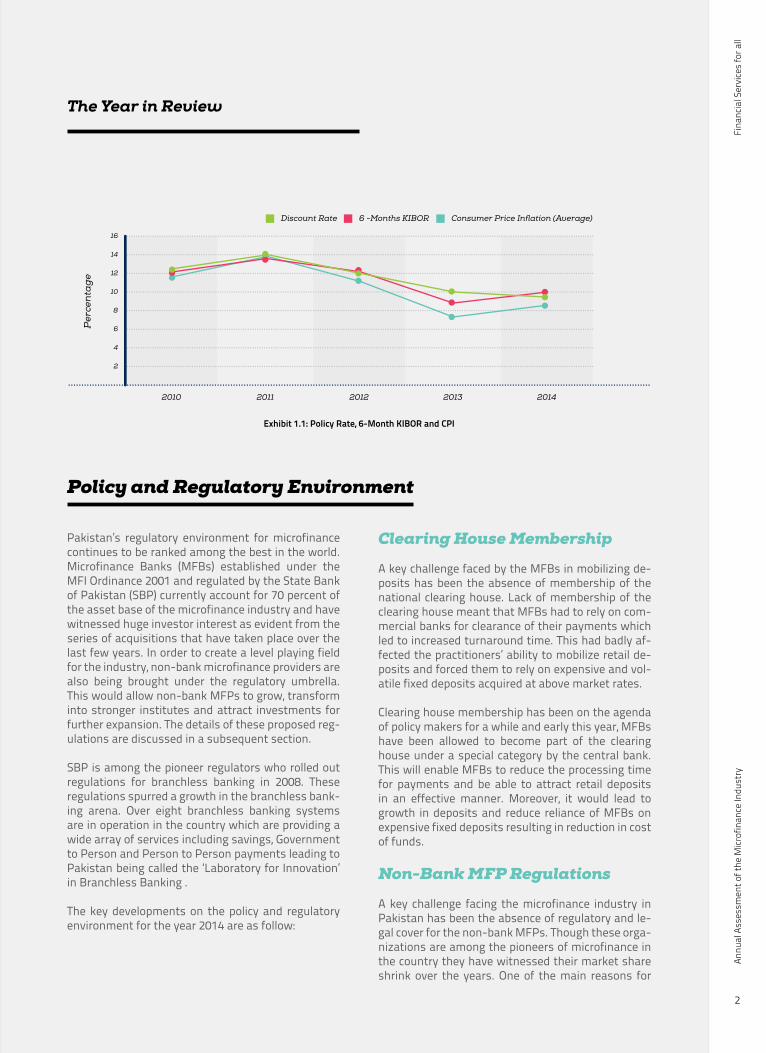
The end of the year saw the policy rate cut by 50 bps taking it from 10 percent to 9.5 percent as shown in Exhibit 1.1. This trend which continued in early 2015, would likely result in the lowering of borrowing costs of Microfinance Providers (MFPs).
Another positive for the year was the uptake in pri-vate sector credit growth which registered a double digit growth of 11.4 percent. This increase which was the highest in the last six years came on the back of an increased supply of loanable funds, improvement in business confidence and lower effective cost of borrowing. This augurs well for MFPs which are wit-nessing increased dependence upon commercial bor-rowing to meet their funding needs.
Macro-economy and the Microfinance Industry
The Year in Review
Fina
ncia
l Ser
vice
s fo
r all
Annu
al A
sses
smen
t of t
he M
icrof
inan
ce In
dust
ry
2
The Year in Review
Pakistan’s regulatory environment for microfinance continues to be ranked among the best in the world. Microfinance Banks (MFBs) established under the MFI Ordinance 2001 and regulated by the State Bank of Pakistan (SBP) currently account for 70 percent of the asset base of the microfinance industry and have witnessed huge investor interest as evident from the series of acquisitions that have taken place over the last few years. In order to create a level playing field for the industry, non-bank microfinance providers are also being brought under the regulatory umbrella. This would allow non-bank MFPs to grow, transform into stronger institutes and attract investments for further expansion. The details of these proposed reg-ulations are discussed in a subsequent section.
SBP is among the pioneer regulators who rolled out regulations for branchless banking in 2008. These regulations spurred a growth in the branchless bank-ing arena. Over eight branchless banking systems are in operation in the country which are providing a wide array of services including savings, Government to Person and Person to Person payments leading to Pakistan being called the ‘Laboratory for Innovation’ in Branchless Banking .
The key developments on the policy and regulatory environment for the year 2014 are as follow:
Clearing House Membership
A key challenge faced by the MFBs in mobilizing de-posits has been the absence of membership of the national clearing house. Lack of membership of the clearing house meant that MFBs had to rely on com-mercial banks for clearance of their payments which led to increased turnaround time. This had badly af-fected the practitioners’ ability to mobilize retail de-posits and forced them to rely on expensive and vol-atile fixed deposits acquired at above market rates.
Clearing house membership has been on the agenda of policy makers for a while and early this year, MFBs have been allowed to become part of the clearing house under a special category by the central bank. This will enable MFBs to reduce the processing time for payments and be able to attract retail deposits in an effective manner. Moreover, it would lead to growth in deposits and reduce reliance of MFBs on expensive fixed deposits resulting in reduction in cost of funds.
Non-Bank MFP Regulations
A key challenge facing the microfinance industry in Pakistan has been the absence of regulatory and le-gal cover for the non-bank MFPs. Though these orga-nizations are among the pioneers of microfinance in the country they have witnessed their market share shrink over the years. One of the main reasons for
Policy and Regulatory Environment
2
4
6
8
10
12
14
16
2010 2011 2012 2013 2014
Consumer Price Inflation (Average)6 -Months KIBORDiscount Rate
Per
cen
tag
e
Exhibit 1.1: Policy Rate, 6-Month KIBOR and CPI

Fina
ncia
l Ser
vice
s fo
r all
Paki
stan
Micr
ofin
ance
Rev
iew
201
4
3
Section 1
this has been lack of regulatory umbrella. Due to this non-bank MFPs have found it difficult to attract commercial financing. Moreover, this has resulted in a lack of recourse mechanism for clients and practi-tioners and the non-bank MFPs have remained vul-nerable to the risk of external interference.
Keeping in view the above, a steering committee was formed in 2012 chaired by Chairman Securities and Exchange Commission of Pakistan (SECP) that in-cluded all key stakeholders of the industry like SBP, Pakistan Poverty Alleviation Fund (PPAF), PMN and key MFPs to extend legal and regulatory cover for the non-bank MFPs. Last year a draft of proposed regu-lations were shared with the players for their feed-back. A summary of the main points raised by the players and PMN is as follows:
• It is hoped that SECP shall play a stewardship role post-regulations similar to that of SBP in case of MFBs.
• A liberal interest rate regime for non-bank MFPs should be followed that focuses on market in-struments of competition and full disclosures as followed by SBP.
• The current and proposed Non-Bank Financial Companies (NBFC) laws do not adequately ca-ter to the microfinance sector as they do not provide for micro-financing as a distinct form of business carried out by NBFCs. Certain con-ditions and requirements of the NBFC Laws are not realistic when taken in the context of the working microfinance industry in Pakistan; thus, there is a need for microfinance to be treated as a distinct class of NBFCs and specific regulations applicable upon them are required.
• With the exception of one non-bank MFP, all others are not for profit entities and many of them would like to continue as non-profit under the proposed regulatory framework. Therefore the proposed regulatory framework, in addition to designating NBMFIs as a specific class of NBFCs, should allow for the creation of a further distinction in the NBFC Laws between “for prof-it” non-bank MFP and “not for profit” non-bank MFPs.
• Since the proposed regulations cater for the es-tablishment of a consultative group with repre-sentatives of the sector to review the regulations and restrictions, limits, requirements, criterion, etc. it has been proposed that the consultative group meet with SECP every six months to bring the regulator and the industry on the same page
and to revise the regulations as the industry evolves.
It is hoped that regulations will come into effect by the end of 2015 with adequate time being provided for non-bank MFPs to conform to their requirements. These regulations will play a role of catalyst for this segment of the microfinance industry to attract both debt and equity capital from the private sector and be recognized as a mainstream part of the financial landscape in Pakistan.
Amendments in Microfinance Credit Guarantee Facility (MCGF)
MCGF was launched in 2009 under the auspices of the Financial Inclusion Program (FIP) with the aim of boosting commercial funding to the industry by of-fering partial risk coverage to lenders. In order for the sector to become sustainable and grow into a viable part of the financial industry, commercial funding is undeniably important. Initially MFBs and later, MFIs and RSPs were allowed to utilize the facility to ob-tain loans from commercial banks and also issue re-deemable capital. However, the uptake of the facility among small and mid-sized MFBs was low as many had riskier profiles compared to their larger, more es-tablished peers.
SBP recently revised guidelines regarding the MCGF in order to facilitate and promote lending from com-mercial financial institutions for small to mid-sized MFPs. In this regard, a tiering criterion has been de-veloped and the risk coverage for the lender has been enhanced.
Initially under the MCGF, 25 percent first loss guar-antee or 40 percent partial guarantee was provided in case of bilateral loans or redeemable capital to the lenders. However, now in the case of bilateral loans to Tier 2 MFPs, 60 percent partial guarantee is now being provided. Tier 2 MFPs are defined as those en-tities that have been in business for 3 years instead of 5 years which is a criterion for Tier 1 MFPs and have a GLP above PKR 500 million as compared to PKR 3 billion for Tier 1. Among other conditions, the Tier 2 MFP needs to have an improving trend in its return on assets (ROA) for the past three years and for last year the ROA needs to be greater than -10 percent. In addition, the Portfolio at Risk (PAR) > 30 days also needs to below 10 percent.
These amendments will likely lead to enhancement in lending to small and mid-sized MFPs which are largely reliant on funding from the national apex and
Fina
ncia
l Ser
vice
s fo
r all
Annu
al A
sses
smen
t of t
he M
icrof
inan
ce In
dust
ry
4
The Year in Review
have yet to initiate commercial borrowing relation-ships. This would allow them to not only enhance but also diversify their funding sources leading to in-
crease in outreach and upscaling of loan sizes.
Risk Register
Risk taking is an inherent element of financial ser-vices, and like all financial institutions, microfinance providers (MFPs) face risks that they must manage effectively to achieve their financial and social objec-tives. Poorly managed risks can lead to losses en-dangering the safety and soundness of microfinance institutions. Hence, it is imperative for microfinance providers to have a formal risk management struc-ture in place to counter potential threats.
As part of PMN’s long term strategy to achieve sus-tainable growth in the Pakistan microfinance sector, the Network is taking constructive steps to promote sound risk management practices among microfi-nance practitioners. One initiative PMN has under-way is the development of a comprehensive risk reg-ister for the microfinance sector in Pakistan.
A risk register is a tool widely used by organizations for the identification and assessment of risks. The tool is considered a vital component of the risk man-agement process which serves as a central source for the organization’s risk information and acts as a risk directory. The tool is used by organizations to list var-ious risks, highlighting their probability and severity of impact, along with possible risk mitigation steps and strategies.
PMN is of the opinion that such a tool will enable MFPs (especially those with no existing risk manage-ment structures in place) to understand the nature of risks faced by the institutes at the departmen-tal and strategic level. The risk register will provide management and key stakeholders with significant information on various threats, which can be utilized to design risk management strategies to mitigate potential threats.
Prime Minister Interest Free Loan Scheme
The Government of Pakistan (GoP) launched an inter-est-free microloan scheme last year to address the issues of poverty and rising unemployment in the
country. Under the scheme, PKR 3.5 billion were ear-marked for the poor and destitute segments of the population. Initially, the industry stakeholders were apprehensive about the scheme as it could have distorted the market for conventional microfinance. However, in order to safeguard the interest of the MFPs it was decided that the funds for the scheme would be routed through the national apex, PPAF and loans will be extended to those individual who fall be-low 40 on the poverty scorecard. In order to mitigate the overlap between interest free loans and conven-tional microloans, the loans under this scheme would only be extended in Union Councils that have low or no penetration of conventional microfinance.
Currently, 24 MFPs have partnered with PPAF in ex-tending interest free loans under this scheme. It is hoped that the scheme would lead to over 1 million additional active borrowers over the next three years. Since this scheme is targeted toward those areas where conventional microfinance has little or no pen-etration, it provides MFPs an opportunity to expand outreach in newer geographic markets. Moreover, it has the potential to allow for borrowers of interest free loans to graduate to conventional microfinance. This is ensured as the interest free loan would be provided only once to an individual and after the completion of the first cycle he/she would be eligible only for a conventional microfinance loan. Lastly in an industry that views funding as one of the key con-straints to growth, it is felt that despite the skepti-cism, this scheme can be useful for the industry with change in design and understanding that the interest free loan program can help in graduation of clients to the next level and mainstreaming them into the microfinance segment.
Client Protection Assessments in collaboration with the SMART Campaign
Third-party client protection assessments using the SMART Campaign’s Smart Assessment Tool were conducted for six MFPs during the year in review. In total, 18 assessments have been conducted since the inception of the Client Protection Initiative (CPI), cov-
Microfinance Industry Initiatives
Fina
ncia
l Ser
vice
s fo
r all
Paki
stan
Micr
ofin
ance
Rev
iew
201
4
5
Section 1
ering over 70 percent of the market in terms of over-all outreach to active borrowers. These assessments were made possible with funding support from the SBP through the DFID-sponsored FIP. The assess-ments provide a unique opportunity for PMN to ob-serve the state of practice in client protection among member MFPs; for some of the key findings see Box 1.1. For participating MFPs, the assessments provide an opportunity to evaluate their practices in compar-ison with globally accepted standards of client pro-tection, and seek recommendations for institutional improvements to better comply with the standards. They also indicate whether an institution is ready to pursue SMART Certification, a designation recognized across the global market that an institution success-fully integrates Client Protection Principles into their practices. After undergoing an assessment through the CPI project and acting on its results, one MFP be-
came the first in Pakistan to achieve SMART Certifi-cation in 2014.
Microfinance–Credit Information Bureau (MF-CIB)
The Microfinance Credit Information Bureau (MF-CIB) was launched nation-wide in 2012, with the support of SBP, PPAF, Department for International Develop-ment (DFID) and International Finance Corporation (IFC). It was aimed at mitigating the various challeng-es faced by the microfinance sector ranging from in-formation asymmetry, adverse selection, and moral hazard to over-indebtedness due to multiple borrow-ing. The delinquency crisis in India’s Andhra Pradesh (2009) and Pakistan’s Punjab (2008-9) also served as stark reminders for the industry to institutionalize
Box 1.1
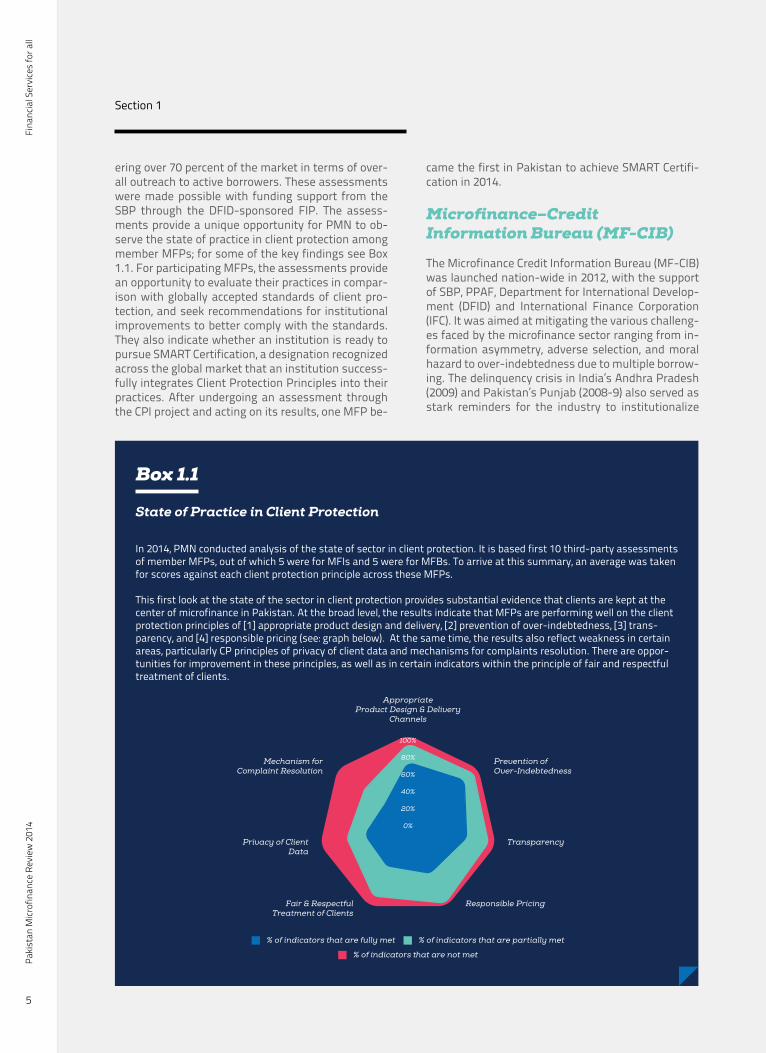
State of Practice in Client Protection
In 2014, PMN conducted analysis of the state of sector in client protection. It is based first 10 third-party assessments of member MFPs, out of which 5 were for MFIs and 5 were for MFBs. To arrive at this summary, an average was taken for scores against each client protection principle across these MFPs.
This first look at the state of the sector in client protection provides substantial evidence that clients are kept at the center of microfinance in Pakistan. At the broad level, the results indicate that MFPs are performing well on the client protection principles of [1] appropriate product design and delivery, [2] prevention of over-indebtedness, [3] trans-parency, and [4] responsible pricing (see: graph below). At the same time, the results also reflect weakness in certain areas, particularly CP principles of privacy of client data and mechanisms for complaints resolution. There are oppor-tunities for improvement in these principles, as well as in certain indicators within the principle of fair and respectful treatment of clients.
0%
20%
40%
60%
80%
100%
AppropriateProduct Design & Delivery
Channels
Prevention ofOver-Indebtedness
Mechanism forComplaint Resolution
TransparencyPrivacy of ClientData
Responsible PricingFair & RespectfulTreatment of Clients
% of indicators that are not met
% of indicators that are partially met% of indicators that are fully met
Fina
ncia
l Ser
vice
s fo
r all
Annu
al A
sses
smen
t of t
he M
icrof
inan
ce In
dust
ry
6
The Year in Review
the use of the Bureau as an integral part of the loan approval process in order to manage credit risk and assess credit worthiness.
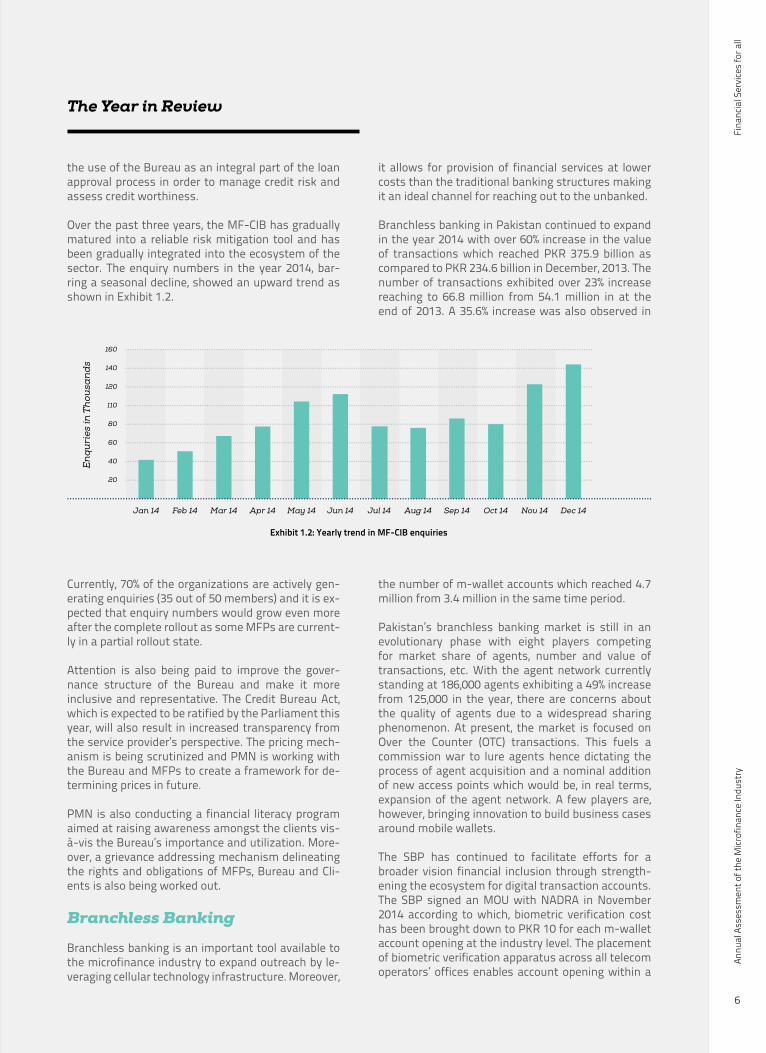
Over the past three years, the MF-CIB has gradually matured into a reliable risk mitigation tool and has been gradually integrated into the ecosystem of the sector. The enquiry numbers in the year 2014, bar-ring a seasonal decline, showed an upward trend as shown in Exhibit 1.2.
Currently, 70% of the organizations are actively gen-erating enquiries (35 out of 50 members) and it is ex-pected that enquiry numbers would grow even more after the complete rollout as some MFPs are current-ly in a partial rollout state.
Attention is also being paid to improve the gover-nance structure of the Bureau and make it more inclusive and representative. The Credit Bureau Act, which is expected to be ratified by the Parliament this year, will also result in increased transparency from the service provider’s perspective. The pricing mech-anism is being scrutinized and PMN is working with the Bureau and MFPs to create a framework for de-termining prices in future.
PMN is also conducting a financial literacy program aimed at raising awareness amongst the clients vis-à-vis the Bureau’s importance and utilization. More-over, a grievance addressing mechanism delineating the rights and obligations of MFPs, Bureau and Cli-ents is also being worked out.
Branchless Banking
Branchless banking is an important tool available to the microfinance industry to expand outreach by le-veraging cellular technology infrastructure. Moreover,
it allows for provision of financial services at lower costs than the traditional banking structures making it an ideal channel for reaching out to the unbanked.
Branchless banking in Pakistan continued to expand in the year 2014 with over 60% increase in the value of transactions which reached PKR 375.9 billion as compared to PKR 234.6 billion in December, 2013. The number of transactions exhibited over 23% increase reaching to 66.8 million from 54.1 million in at the end of 2013. A 35.6% increase was also observed in
the number of m-wallet accounts which reached 4.7 million from 3.4 million in the same time period.
Pakistan’s branchless banking market is still in an evolutionary phase with eight players competing for market share of agents, number and value of transactions, etc. With the agent network currently standing at 186,000 agents exhibiting a 49% increase from 125,000 in the year, there are concerns about the quality of agents due to a widespread sharing phenomenon. At present, the market is focused on Over the Counter (OTC) transactions. This fuels a commission war to lure agents hence dictating the process of agent acquisition and a nominal addition of new access points which would be, in real terms, expansion of the agent network. A few players are, however, bringing innovation to build business cases around mobile wallets.
The SBP has continued to facilitate efforts for a broader vision financial inclusion through strength-ening the ecosystem for digital transaction accounts. The SBP signed an MOU with NADRA in November 2014 according to which, biometric verification cost has been brought down to PKR 10 for each m-wallet account opening at the industry level. The placement of biometric verification apparatus across all telecom operators’ offices enables account opening within a
Exhibit 1.2: Yearly trend in MF-CIB enquiries
20
40
60
80
110
120
140
160
Jan 14 Feb 14 Mar 14 Apr 14 May 14 Jun 14 Jul 14 Aug 14 Sep 14 Oct 14 Nov 14 Dec 14
En
qu
ries
in T
hou
san
ds

Fina
ncia
l Ser
vice
s fo
r all
Paki
stan
Micr
ofin
ance
Rev
iew
201
4
7
Section 1
few seconds via fingerprint verification, and coupled with PTA’s directive of mandatory biometric mobile SIM verification, this will result in the country’s mo-bile clientele ready to be inducted in the branchless banking arena. This has also proven to be a catalyst for the explosive growth of m-wallets since the be-ginning of 2015.
Branchless banking can serve as a growth driver ow-ing to its capacity to increase outreach by lowering delivery cost and aiding profitability of institutions.
Over 12 microfinance institutions are currently pro-viding disbursement and recovery services to their clients through digital channels. Some players have also started extending insurance services to their clients through branchless banking channels. The industry is poised to witness accelerated growth in future in volume and variety of financial services.
The microfinance industry in Pakistan having wit-nessed continuous growth over the last few years in not only credit but also savings, insurance and remit-tances, is ideally positioned to play an important role in the inclusive finance sphere. It can offer a wide va-riety of financial services to the unbanked particularly at the base of the pyramid.
The current macroeconomic stability in the coun-try provides an ideal environment for the sector to grow and expand. Falling interest rates on the back of lower inflation and uptake on private credit provides an opportunity for the microfinance sector to reduce costs and fund their expansion by borrowing from commercial sources.
With major policy and regulatory initiatives like clear-ing house membership for MFBs and enhanced risk coverage for lenders to mid-tier MFPs being taken,
players are better poised to address funding chal-lenges. Also, the launch of non-bank MFPs regula-tory framework will lead to strengthening of these institutes and provide them with an opportunity to expand.
Branchless banking continues to gain popularity and provides opportunities to not only expand outreach and reduce costs but also expand the variety of fi-nancial services on offer. MF-CIB is fully operation with enquiries being generated by MFPs and remains a key catalyst for future growth of the industry. In addition, significant steps towards ensuring respon-sible inclusive finance, by working towards global best practices in client protection have been taken. Establishment of an industry risk register will allow members to identify risks and take steps to mitigate their impact.
Conclusion

Fina
ncia
l Ser
vice
s fo
r all
Annu
al A
sses
smen
t of t
he M
icrof
inan
ce In
dust
ry
8
The Year in Review

Fina
ncia
l Ser
vice
s fo
r all
Paki
stan
Micr
ofin
ance
Rev
iew
201
4
9
Section 1
Fina
ncia
l Ser
vice
s fo
r all
Annu
al A
sses
smen
t of t
he M
icrof
inan
ce In
dust
ry
10
Industry Performance
Section 2
Industry Performance
Fina
ncia
l Ser
vice
s fo
r all
Paki
stan
Micr
ofin
ance
Rev
iew
201
4
11
Section 2
The section is divided into two parts. Section 2A covers the financial performance of the microfinance industry whereas Section 2B deals with the social performance of the industry.
Industry Performance
This section provides a detailed analysis of the fi-nancial performance of Pakistan’s microfinance in-dustry in 2014. Performance has been assessed on three levels: industry wise, across peer groups and institution wise. The analysis is backed by 88 finan-cial indicators, calculated from the audited financial statements of the reporting organizations. These indicators have been compared across time and re-gions to develop a reliable and fair assessment of sector.
Detailed financial information is provided in Annex A-I and A-II of the PMR. Aggregate data has been re-produced for five years, whereas, the peer group and
institution specific data has been made available only for the year 2014.
A total of 42 MFPs submitted their audited financial statements for PMR 2014. During the period, five new respondents provided their dataset for the first time. For a complete list of reporting organizations refer to Annex B.
Industry players are categorized into three groups for benchmarking and comparison purposes: Microfi-nance Banks (MFBs), Microfinance Institutions (MFIs) and Rural Support Programmes (RSPs). See Box 2A.1 for detailed definitions.
Section 2A: Industry Performance
Box 2A.1
Peer Groups
Microfinance Institution: A non-bank non-government organization (NGO) providing microfinance services. Orga-nizations in this group are registered under a variety of regulations, including the Societies Act, Trust Act, and the Companies Ordinance. The MFI peer group includes local as well as multinational NGOs such as BRAC-Pakistan and ASA-Pakistan.
Microfinance Bank: A commercial bank licensed and prudentially regulated by the SBP to exclusively service the microfinance market. The first MFB was established in 2000 under a presidential decree. Since then, ten MFBs have been licensed under the Microfinance Institutions Ordinance, 2001. Eight of them are operating at national level, while two at the provincial level. MFBs are legally empowered to accept and intermediate deposits from the public.
Rural Support Programme: An NGO registered as a non-profit company under the Companies Ordinance. An RSP is differentiated from the MFI peer group based on the purely rural focus of its credit operations. As a group, the RSPs are registered with and supervised by the Securities and Exchange Commission of Pakistan (SECP).
Fina
ncia
l Ser
vice
s fo
r all
Annu
al A
sses
smen
t of t
he M
icrof
inan
ce In
dust
ry
12
Industry Performance
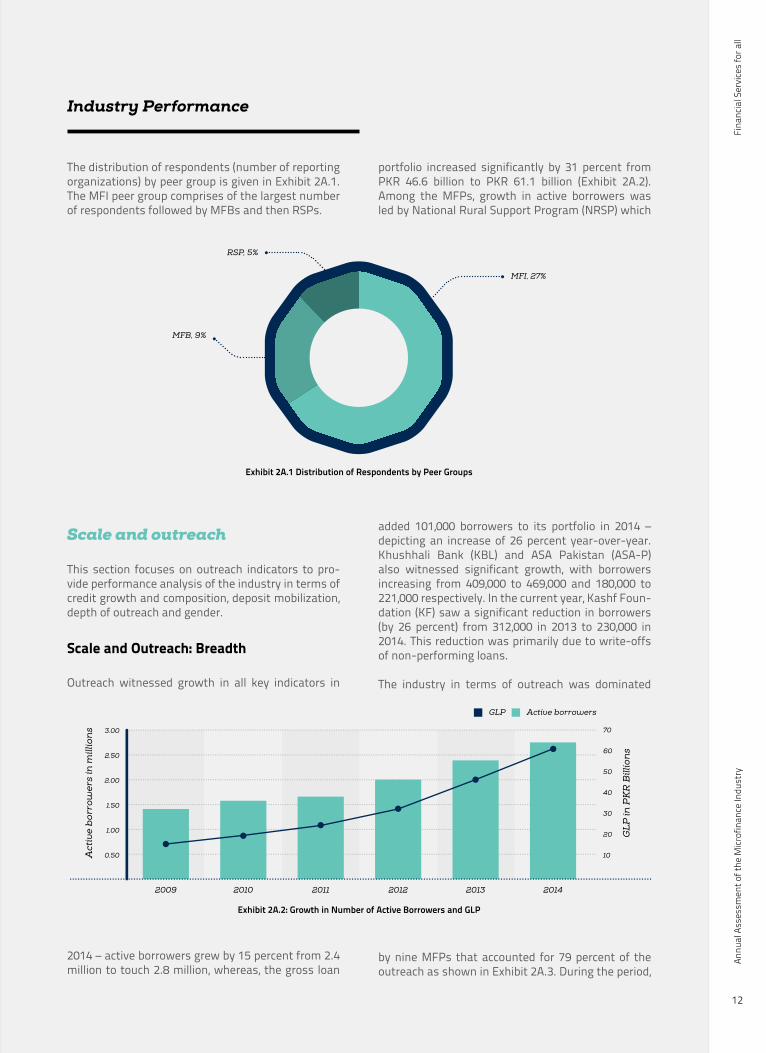
The distribution of respondents (number of reporting organizations) by peer group is given in Exhibit 2A.1. The MFI peer group comprises of the largest number of respondents followed by MFBs and then RSPs.
Scale and outreach
This section focuses on outreach indicators to pro-vide performance analysis of the industry in terms ofcredit growth and composition, deposit mobilization, depth of outreach and gender.
Scale and Outreach: Breadth
Outreach witnessed growth in all key indicators in
2014 – active borrowers grew by 15 percent from 2.4 million to touch 2.8 million, whereas, the gross loan
portfolio increased significantly by 31 percent from PKR 46.6 billion to PKR 61.1 billion (Exhibit 2A.2). Among the MFPs, growth in active borrowers was led by National Rural Support Program (NRSP) which
added 101,000 borrowers to its portfolio in 2014 – depicting an increase of 26 percent year-over-year. Khushhali Bank (KBL) and ASA Pakistan (ASA-P) also witnessed significant growth, with borrowers increasing from 409,000 to 469,000 and 180,000 to 221,000 respectively. In the current year, Kashf Foun-dation (KF) saw a significant reduction in borrowers (by 26 percent) from 312,000 in 2013 to 230,000 in 2014. This reduction was primarily due to write-offs of non-performing loans.
The industry in terms of outreach was dominated
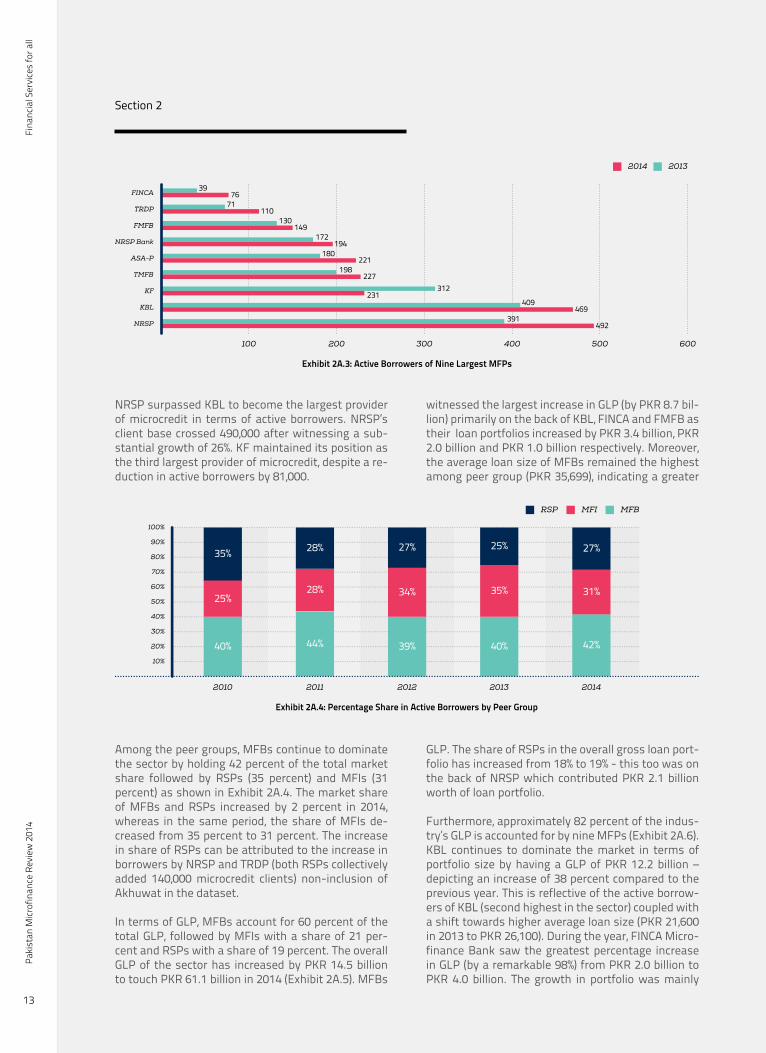
by nine MFPs that accounted for 79 percent of the outreach as shown in Exhibit 2A.3. During the period,
MFI, 27%
RSP, 5%
MFB, 9%
Exhibit 2A.1 Distribution of Respondents by Peer Groups
Act
ive
bor
row
ers
in m
illio
ns
GL
P in
PK
R B
illio
ns
0.50
1.00
1.50
2.00
2.50
3.00
10
20
30
40
50
60
70
2009 2010 2011 2012 2013 2014
Active borrowersGLP
Exhibit 2A.2: Growth in Number of Active Borrowers and GLP
Fina
ncia
l Ser
vice
s fo
r all
Paki
stan
Micr
ofin
ance
Rev
iew
201
4
13
Section 2
NRSP surpassed KBL to become the largest provider of microcredit in terms of active borrowers. NRSP’s client base crossed 490,000 after witnessing a sub-stantial growth of 26%. KF maintained its position as the third largest provider of microcredit, despite a re-duction in active borrowers by 81,000.
Among the peer groups, MFBs continue to dominate the sector by holding 42 percent of the total market share followed by RSPs (35 percent) and MFIs (31 percent) as shown in Exhibit 2A.4. The market share of MFBs and RSPs increased by 2 percent in 2014, whereas in the same period, the share of MFIs de-creased from 35 percent to 31 percent. The increase in share of RSPs can be attributed to the increase in borrowers by NRSP and TRDP (both RSPs collectively added 140,000 microcredit clients) non-inclusion of Akhuwat in the dataset.
In terms of GLP, MFBs account for 60 percent of the total GLP, followed by MFIs with a share of 21 per-cent and RSPs with a share of 19 percent. The overall GLP of the sector has increased by PKR 14.5 billion to touch PKR 61.1 billion in 2014 (Exhibit 2A.5). MFBs
witnessed the largest increase in GLP (by PKR 8.7 bil-lion) primarily on the back of KBL, FINCA and FMFB as their loan portfolios increased by PKR 3.4 billion, PKR 2.0 billion and PKR 1.0 billion respectively. Moreover, the average loan size of MFBs remained the highest among peer group (PKR 35,699), indicating a greater
GLP. The share of RSPs in the overall gross loan port-folio has increased from 18% to 19% - this too was on the back of NRSP which contributed PKR 2.1 billion worth of loan portfolio.
Furthermore, approximately 82 percent of the indus-try’s GLP is accounted for by nine MFPs (Exhibit 2A.6). KBL continues to dominate the market in terms of portfolio size by having a GLP of PKR 12.2 billion – depicting an increase of 38 percent compared to the previous year. This is reflective of the active borrow-ers of KBL (second highest in the sector) coupled with a shift towards higher average loan size (PKR 21,600 in 2013 to PKR 26,100). During the year, FINCA Micro-finance Bank saw the greatest percentage increase in GLP (by a remarkable 98%) from PKR 2.0 billion to PKR 4.0 billion. The growth in portfolio was mainly
NRSP
KBL
KF
TMFB
ASA-P
NRSP Bank
FMFB
TRDP
FINCA
100 200 300 400 500 600
20132014
39
71
130149
172194
180221
198227
312
409
391492
469
231
110
76
Exhibit 2A.3: Active Borrowers of Nine Largest MFPs
10%
20%
30%
40%
50%
60%
70%
80%
90%
100%
2010 2011 2012 2013 2014
MFBMFIRSP
35%
25%
40% 44% 39% 40% 42%
28% 34% 35% 31%
28% 27% 25% 27%
Exhibit 2A.4: Percentage Share in Active Borrowers by Peer Group

Fina
ncia
l Ser
vice
s fo
r all
Annu
al A
sses
smen
t of t
he M
icrof
inan
ce In
dust
ry
14
Industry Performance
supported by a large deposit base of the bank. TMFB, backed by its above average loans sizes, remained the second largest player in terms of portfolio size with a GLP of PKR 9.0 billion.
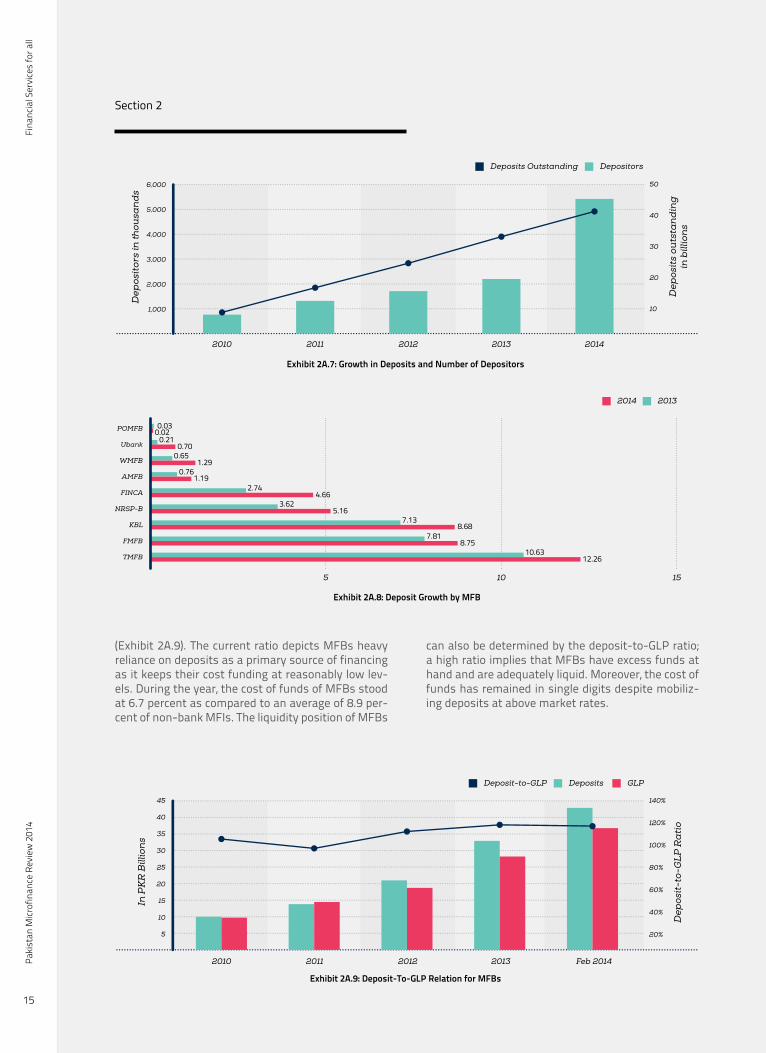
In the year under review, the sector witnessed a stag-gering rise in the number of depositors (by 150 per-cent) from 2.2 million in 2013 to 5.7 million in 2014. Similarly, the value of deposits grew by 30 percent in the same year, from PKR 32.9 billion to PKR 42.7 billion (Exhibit 2A.7). Resultantly, deposits now rep-
resent 78 percent of the total liabilities of the MFB peer group – an increase from 72 percent in the pre-vious year. Moreover, deposits continue to outgrow the loan portfolio of MFBs, as is evident from the de-posits-to-gross loan portfolio ratio which currently stands at 116.1%.The largest increase in the number of depositors came from TMFB which added 2.65 million new de-positors (an increase of over 300 percent). The hefty
growth in depositors can be attributed to the surge in branchless banking activities, especially the opening of m-wallet accounts, along with increasing govern-ment disbursements for safety net programs such as the Benazir Income Support Program (BISP). TMFB was followed by KBL and NRSP Bank which contrib-uted 226,000 and 219,000 depositors respectively in the reporting year. In terms of growth in value of deposits, FINCA was the largest contributor to the value of deposits; by adding PKR 1.9 billion worth of deposits to increase
its deposit base from PKR from PKR 2.7 billion in 2013 to PKR 4.7 billion in 2014 (Exhibit 2A.8). FINCA was followed by TMFB whose deposits grew by PKR 1.6 billion to close its balance sheet at PKR 12.3 bil-lion deposits.
The Deposit-to-GLP ratio for MFBs remained stag-nant in the current year; the ratio decreased by 1 per-cent from 117 percent in 2013 to 116 percent in 2014
10
20
30
40
50
60
70
2010 2011 2012 2013 2014
MFBMFIRSP
9.83.96.6
14.6
5.05.3
18.7
7.66.7
28.1
10.2
8.4
36.8
12.9
11.4
PK
R in
Bill
ion
s
Exhibit 2A.5: GLP (PKR billions) by Peer Group 2013-14
Exhibit 2A.6: GLP of Nine Largest MFPs
KBL
TMFB
NRSP
NRSP Bank
FMFB
FINCA
KF
ASA-P
SRSO
20132014
1.1
1.9
3.5
2.04.0
3.54.5
2.7
3.8
1.2
5 10 15
4.85.2
5.67.7
8.39.0
8.912.2
Fina
ncia
l Ser
vice
s fo
r all
Paki
stan
Micr
ofin
ance
Rev
iew
201
4
15
Section 2
(Exhibit 2A.9). The current ratio depicts MFBs heavy reliance on deposits as a primary source of financing as it keeps their cost funding at reasonably low lev-els. During the year, the cost of funds of MFBs stood at 6.7 percent as compared to an average of 8.9 per-cent of non-bank MFIs. The liquidity position of MFBs
can also be determined by the deposit-to-GLP ratio; a high ratio implies that MFBs have excess funds at hand and are adequately liquid. Moreover, the cost of funds has remained in single digits despite mobiliz-ing deposits at above market rates.
Dep
osit
ors
in th
ousa
nd
s
1,000
2,000
3,000
4,000
5,000
6,000
Dep
osit
s ou
tsta
nd
ing
in b
illio
ns
10
20
30
40
50
2010 2011 2012 2013 2014
DepositorsDeposits Outstanding
Exhibit 2A.7: Growth in Deposits and Number of Depositors
Exhibit 2A.8: Deposit Growth by MFB
POMFB
Ubank
WMFB
AMFB
FINCA
NRSP-B
KBL
FMFB
TMFB
20132014
0.030.02
0.210.70
0.651.29
0.761.19
2.744.66
3.625.16
7.138.68
7.818.75
10.6312.26
5 10 15
Exhibit 2A.9: Deposit-To-GLP Relation for MFBs
In P
KR
Bill
ion
s
5
10
15
20
25
30
35
40
45
Dep
osit
-to-
GL
P R
ati
o
20%
40%
60%
80%
100%
120%
140%
Deposits GLPDeposit-to-GLP
2010 2011 2012 2013 Feb 2014

Fina
ncia
l Ser
vice
s fo
r all
Annu
al A
sses
smen
t of t
he M
icrof
inan
ce In
dust
ry
16
Industry Performance
Micro-insurance indicators – number of policy hold-ers and sum insured – both showed a significant improvement in the year 2014. The number of poli-cy holders grew by 23.8 percent over the year, rising from 3.0 million to 3.8 million, while the sum insured increased by 50.0 percent from PKR 40.3 billion to PKR 60.4 billion (see Exhibit 2A.10).
The greatest increase in micro-insurance came from the MFB peer group whose policy holders and sum insured increased by 46 percent and 80 percent re-
spectively. During the year, MFBs enhanced the cov-erage of their insurance products by securing more credit clients, along with their spouses. However, among individual institutes, NRSP remained the larg-est providers of micro-insurance; holding a market share of 22 percent and 24 percent in terms of policy holders and total sum insured, respectively. Among the types of insurance policies, health insurance con-stituted almost 51 percent of total insurance policies followed by credit life at 49 percent.
Scale and Outreach: Depth
The depth of outreach in microcredit operations is measured by a proxy indicator: average loan balance per borrower in proportion to per capita Gross Nation-al Income (GNI). A value below 20 percent is assumed to mean that the MFP is poverty focused. Except for KBL and NRSP Bank, all of the other MFBs fall above this benchmark (Exhibit 2A.11). Comparison across peer groups shows that the ratio of average loan bal-ance to per capita GNI for MFBs has been on the rise
for the past four years. MFBs tend to target the upper end of the market through relatively larger loan siz-es, and hence have a ratio of 20 percent compared to MFIs and RSPs which have a ratio of 10 percent each.
The ratio of average loan balance to per capita GNI witnessed a modest increase for MFBs (by 2 percent) and MFIs (by 1 percent), while the ratio for RSPs re-mained stagnant at 10.0 percent. This could be inter-preted as the sector continuing to target the poor but also has implications for appropriate loan sizes in the
Pol
icy
Hol
der
s in
mill
ion
s
1.70
2.20
2.70
3.20
3.70
4.20
Su
m In
sure
d in
PK
R B
illio
ns
10
20
30
40
50
60
70
2010 2011 2012 2013 2014
Policy HoldersSum Insured
Exhibit 2A.10: Growth in Number of Policy Holders and Sum Insured
5%
10%
15%
20%
25%
2009 2010 2011 2012 2013 2014
MFBMFIRSPIndustryCut-off
Ave
rag
e L
oan
Ba
lan
ceP
er G
DP
Exhibit 2A.11: Depth of Outreach by Peer Groups
Fina
ncia
l Ser
vice
s fo
r all
Paki
stan
Micr
ofin
ance
Rev
iew
201
4
17
Section 2
context of Pakistan’s inflationary environment. Ero-sion in the value of money means that a loan worth PKR 30,000 in one year would be considerably lower in value in the following year.
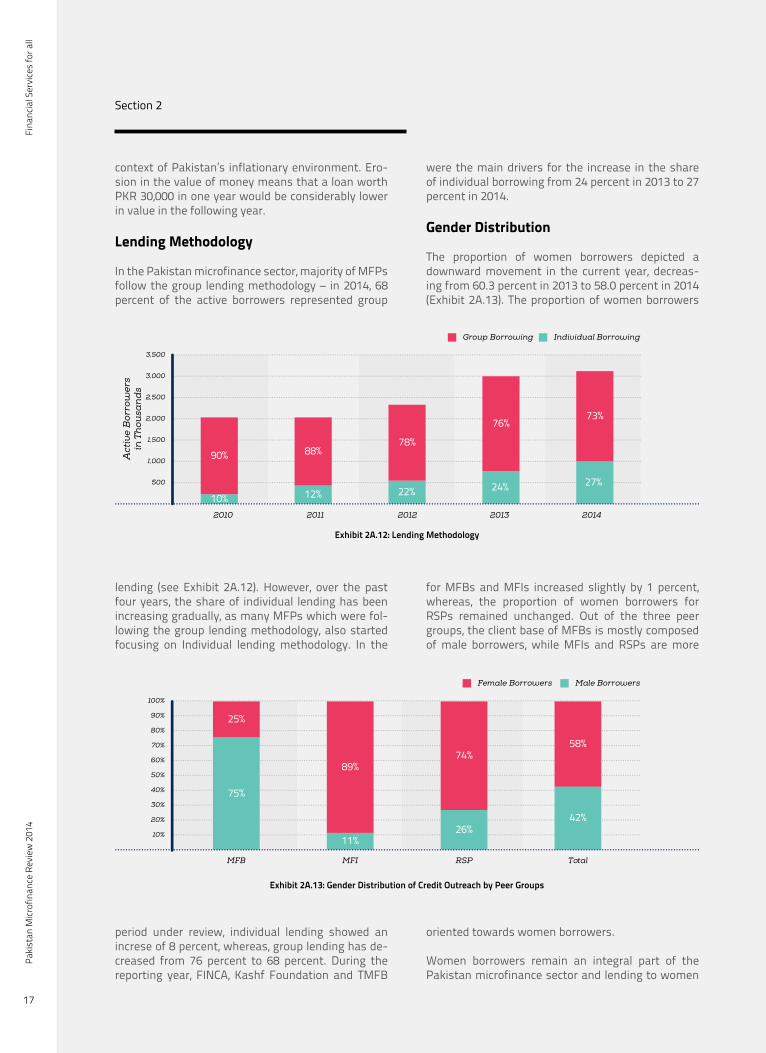
Lending Methodology
In the Pakistan microfinance sector, majority of MFPs follow the group lending methodology – in 2014, 68 percent of the active borrowers represented group
lending (see Exhibit 2A.12). However, over the past four years, the share of individual lending has been increasing gradually, as many MFPs which were fol-lowing the group lending methodology, also started focusing on Individual lending methodology. In the
period under review, individual lending showed an increse of 8 percent, whereas, group lending has de-creased from 76 percent to 68 percent. During the reporting year, FINCA, Kashf Foundation and TMFB
were the main drivers for the increase in the share of individual borrowing from 24 percent in 2013 to 27 percent in 2014.
Gender Distribution
The proportion of women borrowers depicted a downward movement in the current year, decreas-ing from 60.3 percent in 2013 to 58.0 percent in 2014 (Exhibit 2A.13). The proportion of women borrowers
for MFBs and MFIs increased slightly by 1 percent, whereas, the proportion of women borrowers for RSPs remained unchanged. Out of the three peer groups, the client base of MFBs is mostly composed of male borrowers, while MFIs and RSPs are more
oriented towards women borrowers.
Women borrowers remain an integral part of the Pakistan microfinance sector and lending to women
500
1,000
1,500
2,000
2,500
3,000
3,500
2010 2011 2012 2013 2014
Individual BorrowingGroup Borrowing
90%
10% 12% 22% 24% 27%
88%78%
76%73%
Act
ive
Bor
row
ers
in T
hou
san
ds
Exhibit 2A.12: Lending Methodology
Exhibit 2A.13: Gender Distribution of Credit Outreach by Peer Groups
20%
10%
30%
40%
50%
60%
70%
80%
90%
100%
Male BorrowersFemale Borrowers
MFB MFI RSP Total
25%
75%
89%
11%
74%
26%
58%
42%
Fina
ncia
l Ser
vice
s fo
r all
Annu
al A
sses
smen
t of t
he M
icrof
inan
ce In
dust
ry
18
Industry Performance
has been encouraged by various donor and regulato-ry bodies. The national apex – PPAF – provides fund-ing to MFPs based on a commitment that at least 40 percent of the borrowers will be women. Large players such as NRSP, ASA Pakistan, and SRSO have portfolios that mostly constitute of women borrow-ers, whereas, Kashf Foundation only lends to women borrowers.
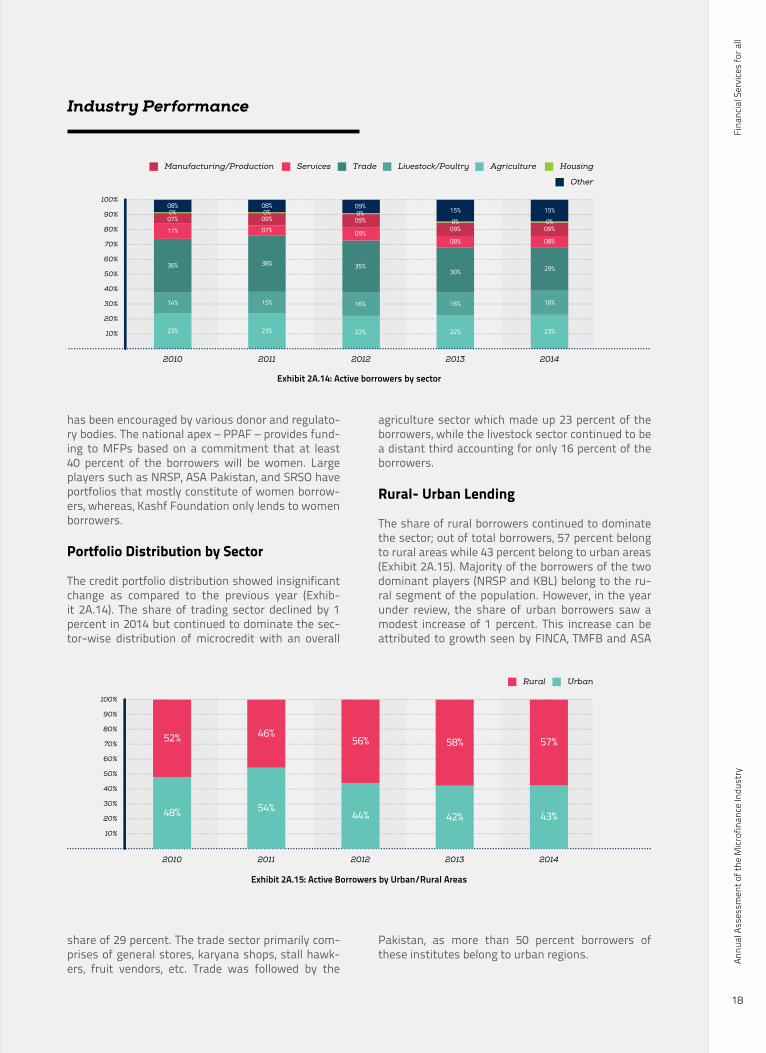
Portfolio Distribution by Sector
The credit portfolio distribution showed insignificant change as compared to the previous year (Exhib-it 2A.14). The share of trading sector declined by 1 percent in 2014 but continued to dominate the sec-tor-wise distribution of microcredit with an overall
share of 29 percent. The trade sector primarily com-prises of general stores, karyana shops, stall hawk-ers, fruit vendors, etc. Trade was followed by the
agriculture sector which made up 23 percent of the borrowers, while the livestock sector continued to be a distant third accounting for only 16 percent of the borrowers.
Rural- Urban Lending
The share of rural borrowers continued to dominate the sector; out of total borrowers, 57 percent belong to rural areas while 43 percent belong to urban areas (Exhibit 2A.15). Majority of the borrowers of the two dominant players (NRSP and KBL) belong to the ru-ral segment of the population. However, in the year under review, the share of urban borrowers saw a modest increase of 1 percent. This increase can be attributed to growth seen by FINCA, TMFB and ASA
Pakistan, as more than 50 percent borrowers of these institutes belong to urban regions.
2010 2011 2012 2013 2014
UrbanRural
20%
10%
30%
40%
50%
60%
70%
80%
90%
100%
48%
52%
54%
46%
44%
56%
42%
58%
43%
57%
Exhibit 2A.15: Active Borrowers by Urban/Rural Areas
Exhibit 2A.14: Active borrowers by sector
20%
10%
30%
40%
50%
60%
70%
80%
90%
100%
2010 2011 2012 2013 2014
Other
Agriculture HousingLivestock/PoultryTradeServicesManufacturing/Production
23% 23% 22% 22% 23%
16%
29%
08%
09%0%
15%
16%
30%
08%
09%0%
15%
16%
35%
09%
09%0%
09%
15%
38%
07%09%0%
08%
14%
36%
11%
07%0%
08%
Fina
ncia
l Ser
vice
s fo
r all
Paki
stan
Micr
ofin
ance
Rev
iew
201
4
19
Section 2
Financial Structure
Asset Base
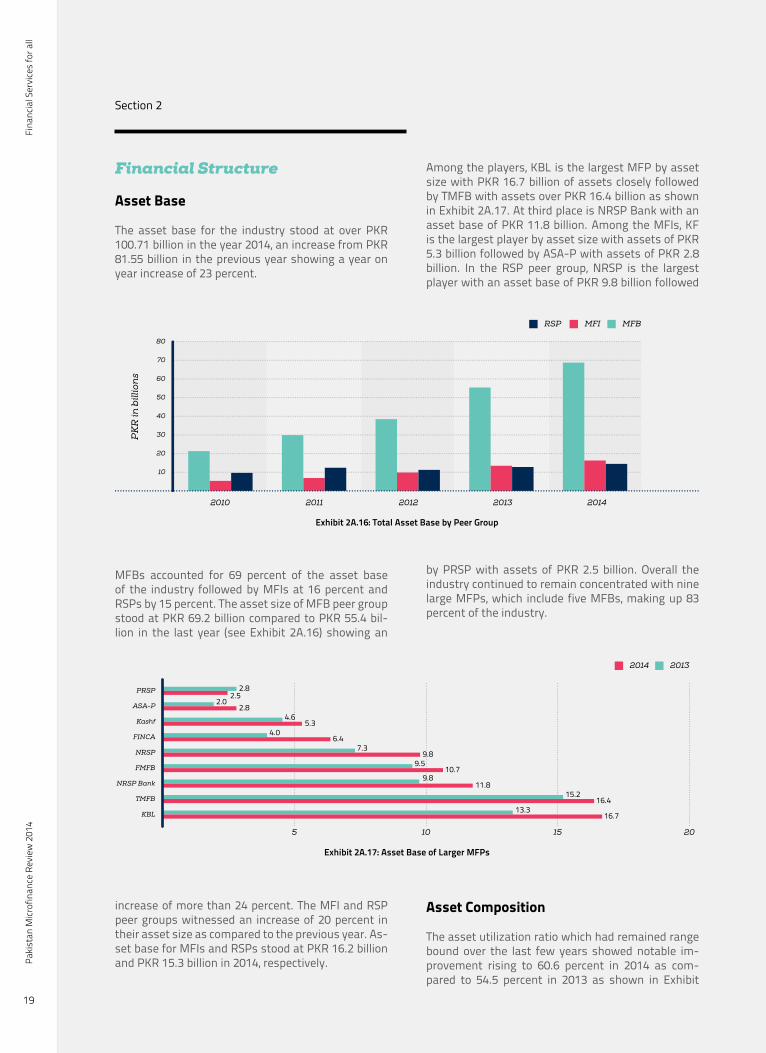
The asset base for the industry stood at over PKR 100.71 billion in the year 2014, an increase from PKR 81.55 billion in the previous year showing a year on year increase of 23 percent.
MFBs accounted for 69 percent of the asset base of the industry followed by MFIs at 16 percent and RSPs by 15 percent. The asset size of MFB peer group stood at PKR 69.2 billion compared to PKR 55.4 bil-lion in the last year (see Exhibit 2A.16) showing an
increase of more than 24 percent. The MFI and RSP peer groups witnessed an increase of 20 percent in their asset size as compared to the previous year. As-set base for MFIs and RSPs stood at PKR 16.2 billion and PKR 15.3 billion in 2014, respectively.
Among the players, KBL is the largest MFP by asset size with PKR 16.7 billion of assets closely followed by TMFB with assets over PKR 16.4 billion as shown in Exhibit 2A.17. At third place is NRSP Bank with an asset base of PKR 11.8 billion. Among the MFIs, KF is the largest player by asset size with assets of PKR 5.3 billion followed by ASA-P with assets of PKR 2.8 billion. In the RSP peer group, NRSP is the largest player with an asset base of PKR 9.8 billion followed
by PRSP with assets of PKR 2.5 billion. Overall the industry continued to remain concentrated with nine large MFPs, which include five MFBs, making up 83 percent of the industry.
Asset Composition
The asset utilization ratio which had remained range bound over the last few years showed notable im-provement rising to 60.6 percent in 2014 as com-pared to 54.5 percent in 2013 as shown in Exhibit
2010 2011 2012 2013 2014
MFBMFIRSP
20
10
30
40
50
60
70
80
PK
R in
bill
ion
s
Exhibit 2A.16: Total Asset Base by Peer Group
Exhibit 2A.17: Asset Base of Larger MFPs
KBL
TMFB
NRSP Bank
FMFB
NRSP
FINCA
Kashf
ASA-P
PRSP
20132014
2.82.5
2.02.8
5.34.0
6.47.3
5 10 15 20
9.89.5
10.79.8
11.815.2
16.413.3
16.7
4.6

Fina
ncia
l Ser
vice
s fo
r all
Annu
al A
sses
smen
t of t
he M
icrof
inan
ce In
dust
ry
20
Industry Performance
2A.18. Improvements were witnessed in the asset utilization ratio of the MFI and RSP peer group which stood at 79.2 percent and 74.7 percent respectively whereas the MFBs experienced an increase from 50.7 percent in 2013 to 53.2 percent in 2014.
Despite the improvement in the asset utilization ratio in the year 2014, it was below its regional peers as shown in the Exhibit 2A.19. For the industry to im-prove its bottom line there is a need to improve their utilization ratio through better liquidity management.
Asset composition remained varied across the in-dustry. MFIs accounted for the highest advances to total assets ratio closely followed by RSPs as shown in Exhibit 2A.20. Improvement in the ratio for MFIs and RSPs is largely due to increase in grace period being offered by the national apex. MFB peer group has lower advances to total assets as a number of players have recently been acquired and their credit business is in formative stages. In addition, one of the larger players, FMFB, has only been able to deploy half of its deposit base leading to lower value for the
entire peer group. Over time, as these re-established players grow and achieve scale, there will be further increase in the ratio for MFBs.
Funding Profile
The capital structure of the industry continued to wit-ness the trend of increasing deposits and decrease in debt in 2014 as shown in Exhibit 2A.21. Deposits now make up 44 percent of the total funding of the sector as compared to 39 percent in 2013. Debt has fallen to 33 percent of the funding from 39 percent in the same time period. Equity witnessed a slight increase to account for 23 percent of the total fund-ing on the back of increasing profitability among the practitioners.
The capital structure continues to be differ among the peer groups with non-bank MFPs relying on debt and equity for funding as they are prohibited to mobi-
2010 2011 2012 2013 2014
Asset Utilization Ratio
20%
10%
30%
40%
50%
60%
70%
Exhibit 2A.18: Asset Utilization Trend 2010-14
Africa East Asiaand thePacific
Eastern Europeand
Central Asia
Latin Americaand The
Caribbean
Middle Eastand
North Africa
South Asia Pakistan
20%
40%
60%
80%
100%
Exhibit 2A.19: Regional Comparison of Asset Utilization Ratio

Fina
ncia
l Ser
vice
s fo
r all
Paki
stan
Micr
ofin
ance
Rev
iew
201
4
21
Section 2
lize deposits. Meanwhile, MFBs continue to witness notable success in deposit mobilization which is re-flected in their increasing reliance on deposits as a
source of funds.
64 percent of the MFBs funding is made up of depos-its up from 62 percent in the previous year as shown in Exhibit 2A.22. In case of MFI peer group, debt con-tinues to make up 80 percent of the funding whereas in the case of RSPs debt accounts for 70 percent of the capital, slightly up from 69 percent in the preced-ing year.
While MFBs are relying on deposits to meet the bulk of their funding needs, it is pertinent to note that out of nine MFBs reporting for PMR only six have a
deposit base larger than their GLP. In addition, two thirds of the deposits are accounted for by three MFBs namely, TMFB, KBL and FMFB.
Profitability and Sustainability
The total net income and total revenues for the in-dustry stood at PKR 3.5 billion and PKR 24.3 billion in the year 2014 respectively. The unadjusted ROA and ROE for the industry stood at 4.2 percent and 20.7 percent for the year. Out of the total profit for the in-dustry the MFB peer group accounted for 47 percent of the profit whereas the MFI and RSP peer groups made up 25 percent and 28 percent.
The industry continues to be sustainable with Oper-ational Self Sufficiency (OSS) and Financial Self Suffi-
Equity, 23%
Debt, 33%
Deposits, 44%
Exhibit 2A.21: Capital Structure of Microfinance Industry
Exhibit 2A.20: Asset Composition among Peer Groups
2013 2014 2013 2014 2013 2014
20%
40%
60%
80%
100%
MFIMFB RSP
55%
22%
4%
19%
53%
24%
3%
20%
76%
0%4%
20%
79%
0%3%
18%
70%
9%5%
16%
75%
7%4%
14%
AdvancesInvestmentsFixed AssetsCash and Bank Balance
Pro
por
tion
of
Tot
al A
sset
s

Fina
ncia
l Ser
vice
s fo
r all
Annu
al A
sses
smen
t of t
he M
icrof
inan
ce In
dust
ry
22
Industry Performance
ciency (FSS) not only above 100 percent but also show an improving trend as seen in Exhibit 2A.23. Out of the 41 reporting organizations 35 have an OSS above 100 percent. Improvement in OSS and FSS is fuelled primarily by increasing GLP and growth in outreach. This points towards the increasing maturity of the practitioners business models. In addition, MFPs are
now ideally geared towards accelerated growth and innovation.
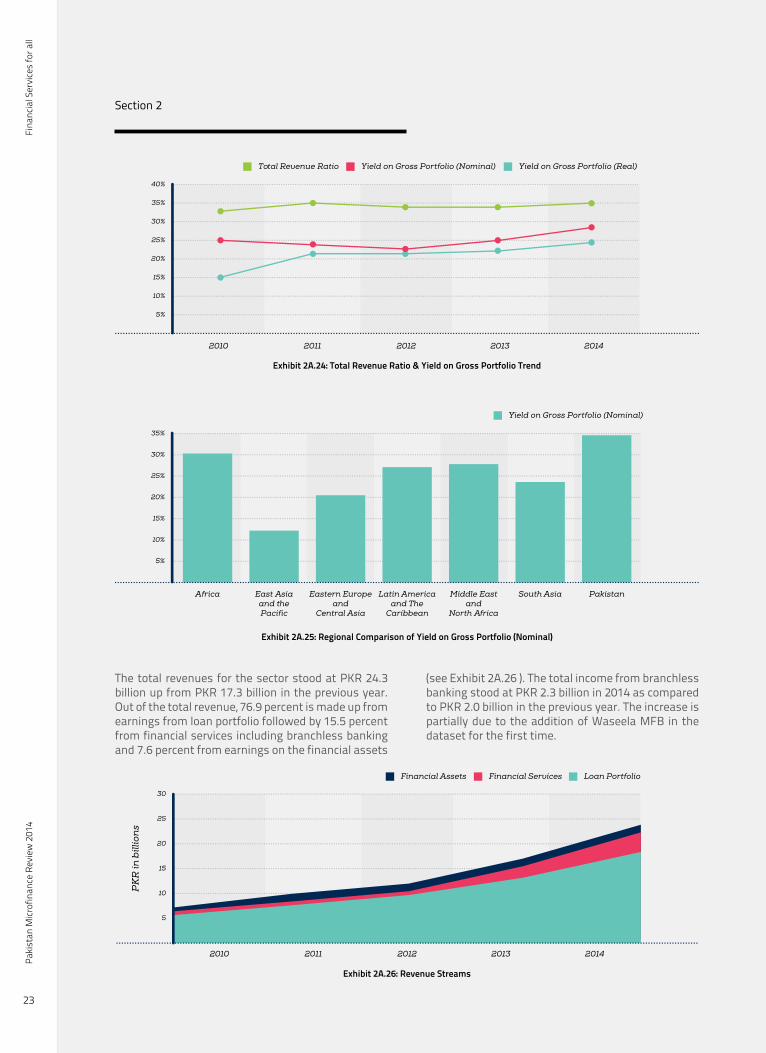
The total revenue ratio for the industry increased to 28.5 percent from 24.8 in 2013 on the back of in-creasing GLP and income generated from branchless banking operations. In addition, the yield on gross portfolio remained stable, (shown in Exhibit 2A.24) to close at 34.6 percent.
Compared globally, the yield on gross portfolio (nom-inal) continues to be on the higher side (see Exhibit 2A.25). However, the higher yield is largely as a result of high operating costs which are a function of the relatively smaller loan sizes offered by the industry. As the loan sizes increase over time especially after the start of lending to microenterprises it is antici-
pated that operating costs will decline resulting in reduction of yield on loan portfolio.
20%
40%
60%
80%
100%
120%
140%
2010 2011 2012 2013 2014
Financial self sufficiency (FSS)Operational Self Sufficiency (OSS)
Exhibit 2A.23: OSS and FSS Trend
Exhibit 2A.22: Capital Structure by Peer Group
20%
10%
30%
40%
50%
60%
70%
80%
90%
2013 2014 2013 2014 2013 2014
MFIMFB RSP
EquityDebtDeposits
Fina
ncia
l Ser
vice
s fo
r all
Paki
stan
Micr
ofin
ance
Rev
iew
201
4
23
Section 2
The total revenues for the sector stood at PKR 24.3 billion up from PKR 17.3 billion in the previous year. Out of the total revenue, 76.9 percent is made up from earnings from loan portfolio followed by 15.5 percent from financial services including branchless banking and 7.6 percent from earnings on the financial assets
(see Exhibit 2A.26 ). The total income from branchless banking stood at PKR 2.3 billion in 2014 as compared to PKR 2.0 billion in the previous year. The increase is partially due to the addition of Waseela MFB in the dataset for the first time.
5
10
15
20
25
30
2010 2011 2012 2013 2014
Loan PortfolioFinancial ServicesFinancial Assets
PK
R in
bill
ion
s
Exhibit 2A.26: Revenue Streams
Exhibit 2A.24: Total Revenue Ratio & Yield on Gross Portfolio Trend
5%
10%
15%
20%
25%
30%
35%
40%
2010 2011 2012 2013 2014
Yield on Gross Portfolio (Real)Yield on Gross Portfolio (Nominal)Total Revenue Ratio
Exhibit 2A.25: Regional Comparison of Yield on Gross Portfolio (Nominal)
Africa East Asiaand thePacific
Eastern Europeand
Central Asia
Latin Americaand The
Caribbean
Middle Eastand
North Africa
South Asia Pakistan
5%
10%
15%
20%
25%
30%
35%
Yield on Gross Portfolio (Nominal)
Fina
ncia
l Ser
vice
s fo
r all
Annu
al A
sses
smen
t of t
he M
icrof
inan
ce In
dust
ry
24
Industry Performance
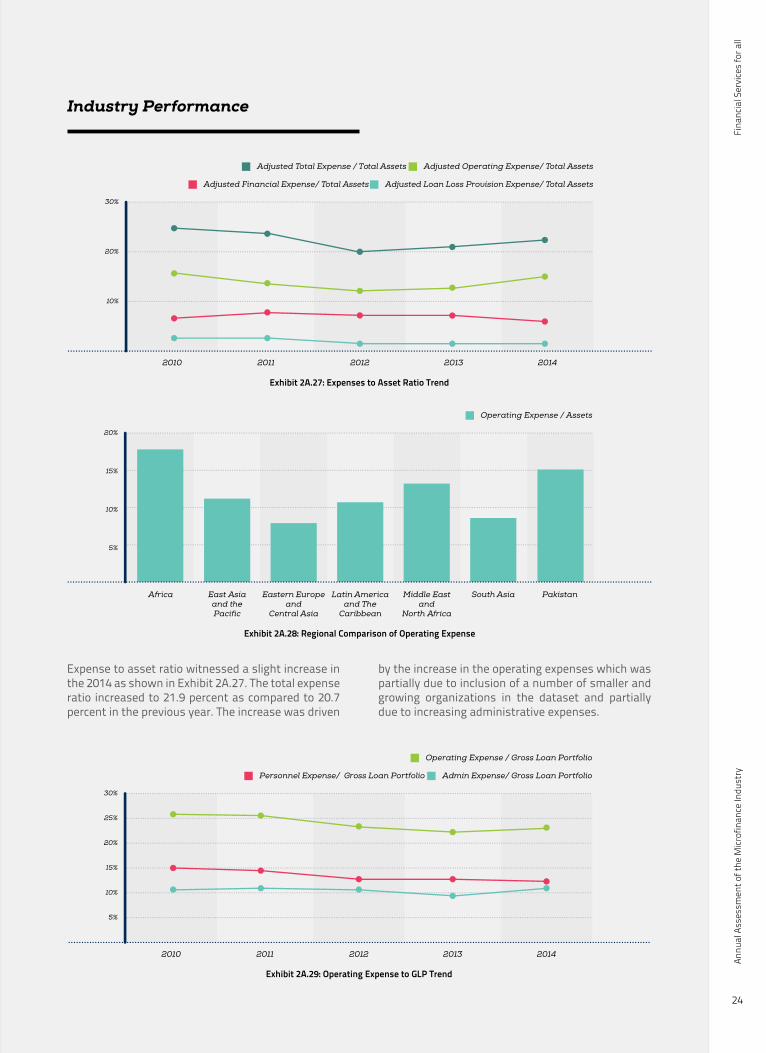
Expense to asset ratio witnessed a slight increase in the 2014 as shown in Exhibit 2A.27. The total expense ratio increased to 21.9 percent as compared to 20.7 percent in the previous year. The increase was driven
by the increase in the operating expenses which was partially due to inclusion of a number of smaller and growing organizations in the dataset and partially due to increasing administrative expenses.
Africa East Asiaand thePacific
Eastern Europeand
Central Asia
Latin Americaand The
Caribbean
Middle Eastand
North Africa
South Asia Pakistan
5%
10%
15%
20%
Operating Expense / Assets
Exhibit 2A.28: Regional Comparison of Operating Expense
Exhibit 2A.27: Expenses to Asset Ratio Trend
10%
20%
30%
2010 2011 2012 2013 2014
Adjusted Loan Loss Provision Expense/ Total AssetsAdjusted Financial Expense/ Total Assets
Adjusted Operating Expense/ Total AssetsAdjusted Total Expense / Total Assets
Exhibit 2A.29: Operating Expense to GLP Trend
5%
10%
15%
20%
25%
30%
2010 2011 2012 2013 2014
Admin Expense/ Gross Loan PortfolioPersonnel Expense/ Gross Loan Portfolio
Operating Expense / Gross Loan Portfolio
Fina
ncia
l Ser
vice
s fo
r all
Paki
stan
Micr
ofin
ance
Rev
iew
201
4
25
Section 2
The operating expense was on the higher end as compared to other regions as seen in Exhibit 2A.28. This points towards the fact that MFPs in Pakistan have yet to achieve scale and only then costs can be reduced. Branchless banking can play a crucial role in bringing down the operating costs of the industry.
Operating expense to GLP also witnessed an increase in 2014 after exhibiting a declining trend over the last few years as shown in Exhibit 2A.29. Operating ex-pense to GLP stood at 23.0 percent as compared to 22.1 percent in the previous year. The increase in the expense was due to rise in the administrative ex-pense.
Productivity
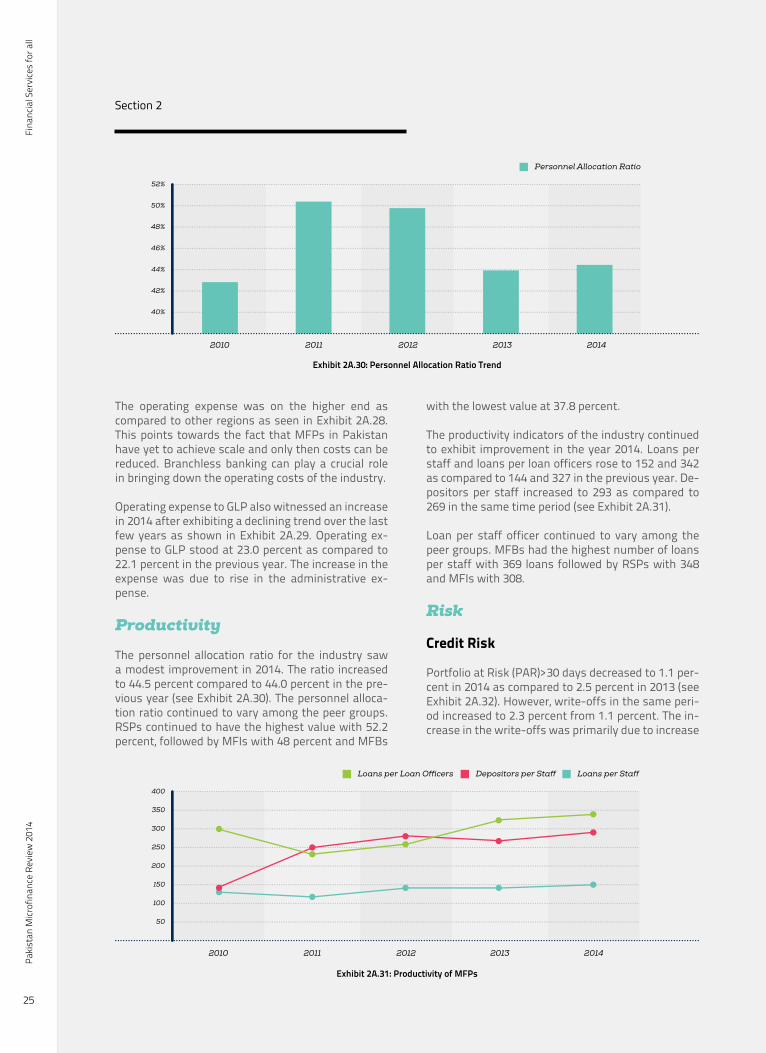
The personnel allocation ratio for the industry saw a modest improvement in 2014. The ratio increased to 44.5 percent compared to 44.0 percent in the pre-vious year (see Exhibit 2A.30). The personnel alloca-tion ratio continued to vary among the peer groups. RSPs continued to have the highest value with 52.2 percent, followed by MFIs with 48 percent and MFBs
with the lowest value at 37.8 percent.
The productivity indicators of the industry continued to exhibit improvement in the year 2014. Loans per staff and loans per loan officers rose to 152 and 342 as compared to 144 and 327 in the previous year. De-positors per staff increased to 293 as compared to 269 in the same time period (see Exhibit 2A.31).
Loan per staff officer continued to vary among the peer groups. MFBs had the highest number of loans per staff with 369 loans followed by RSPs with 348 and MFIs with 308.
Risk
Credit Risk
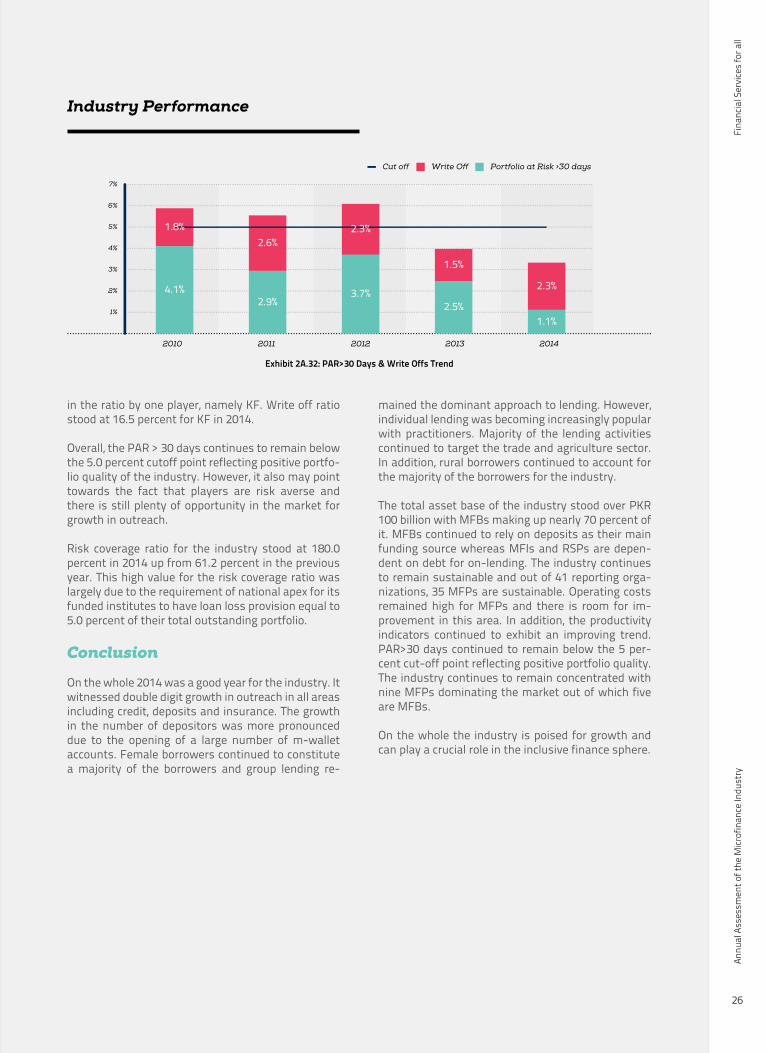
Portfolio at Risk (PAR)>30 days decreased to 1.1 per-cent in 2014 as compared to 2.5 percent in 2013 (see Exhibit 2A.32). However, write-offs in the same peri-od increased to 2.3 percent from 1.1 percent. The in-crease in the write-offs was primarily due to increase
Exhibit 2A.30: Personnel Allocation Ratio Trend
2010 2011 2012 2013 2014
Personnel Allocation Ratio
40%
42%
44%
46%
48%
50%
52%
Exhibit 2A.31: Productivity of MFPs
50
100
150
200
250
300
350
400
2010 2011 2012 2013 2014
Loans per StaffDepositors per StaffLoans per Loan Officers
Fina
ncia
l Ser
vice
s fo
r all
Annu
al A
sses
smen
t of t
he M
icrof
inan
ce In
dust
ry
26
Industry Performance
in the ratio by one player, namely KF. Write off ratio stood at 16.5 percent for KF in 2014.
Overall, the PAR > 30 days continues to remain below the 5.0 percent cutoff point reflecting positive portfo-lio quality of the industry. However, it also may point towards the fact that players are risk averse and there is still plenty of opportunity in the market for growth in outreach.
Risk coverage ratio for the industry stood at 180.0 percent in 2014 up from 61.2 percent in the previous year. This high value for the risk coverage ratio was largely due to the requirement of national apex for its funded institutes to have loan loss provision equal to 5.0 percent of their total outstanding portfolio.
Conclusion
On the whole 2014 was a good year for the industry. It witnessed double digit growth in outreach in all areas including credit, deposits and insurance. The growth in the number of depositors was more pronounced due to the opening of a large number of m-wallet accounts. Female borrowers continued to constitute a majority of the borrowers and group lending re-
mained the dominant approach to lending. However, individual lending was becoming increasingly popular with practitioners. Majority of the lending activities continued to target the trade and agriculture sector. In addition, rural borrowers continued to account for the majority of the borrowers for the industry.
The total asset base of the industry stood over PKR 100 billion with MFBs making up nearly 70 percent of it. MFBs continued to rely on deposits as their main funding source whereas MFIs and RSPs are depen-dent on debt for on-lending. The industry continues to remain sustainable and out of 41 reporting orga-nizations, 35 MFPs are sustainable. Operating costs remained high for MFPs and there is room for im-provement in this area. In addition, the productivity indicators continued to exhibit an improving trend. PAR>30 days continued to remain below the 5 per-cent cut-off point reflecting positive portfolio quality. The industry continues to remain concentrated with nine MFPs dominating the market out of which five are MFBs.
On the whole the industry is poised for growth and can play a crucial role in the inclusive finance sphere.
2010 2011 2012 2013 2014
Portfolio at Risk >30 daysWrite OffCut off
1%
2%
3%
4%
5%
6%
7%
4.1%
1.8%
2.9%
2.6%
3.7%
2.3%
2.5%
1.5%
1.1%
2.3%
Exhibit 2A.32: PAR>30 Days & Write Offs Trend
Fina
ncia
l Ser
vice
s fo
r all
Paki
stan
Micr
ofin
ance
Rev
iew
201
4
27
Section 2
Introduction
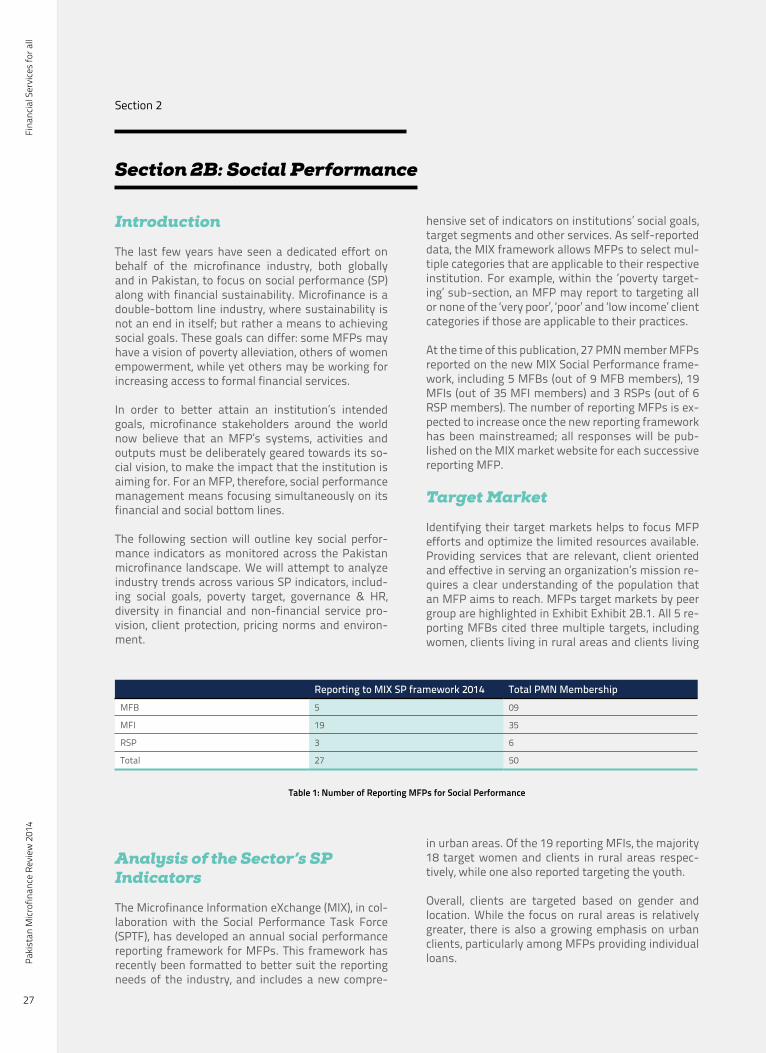
The last few years have seen a dedicated effort on behalf of the microfinance industry, both globally and in Pakistan, to focus on social performance (SP) along with financial sustainability. Microfinance is a double-bottom line industry, where sustainability is not an end in itself; but rather a means to achieving social goals. These goals can differ: some MFPs may have a vision of poverty alleviation, others of women empowerment, while yet others may be working for increasing access to formal financial services.
In order to better attain an institution’s intended goals, microfinance stakeholders around the world now believe that an MFP’s systems, activities and outputs must be deliberately geared towards its so-cial vision, to make the impact that the institution is aiming for. For an MFP, therefore, social performance management means focusing simultaneously on its financial and social bottom lines.
The following section will outline key social perfor-mance indicators as monitored across the Pakistan microfinance landscape. We will attempt to analyze industry trends across various SP indicators, includ-ing social goals, poverty target, governance & HR, diversity in financial and non-financial service pro-vision, client protection, pricing norms and environ-ment.
Analysis of the Sector’s SP Indicators
The Microfinance Information eXchange (MIX), in col-laboration with the Social Performance Task Force (SPTF), has developed an annual social performance reporting framework for MFPs. This framework has recently been formatted to better suit the reporting needs of the industry, and includes a new compre-
hensive set of indicators on institutions’ social goals, target segments and other services. As self-reported data, the MIX framework allows MFPs to select mul-tiple categories that are applicable to their respective institution. For example, within the ‘poverty target-ing’ sub-section, an MFP may report to targeting all or none of the ‘very poor’, ‘poor’ and ‘low income’ client categories if those are applicable to their practices.
At the time of this publication, 27 PMN member MFPs reported on the new MIX Social Performance frame-work, including 5 MFBs (out of 9 MFB members), 19 MFIs (out of 35 MFI members) and 3 RSPs (out of 6 RSP members). The number of reporting MFPs is ex-pected to increase once the new reporting framework has been mainstreamed; all responses will be pub-lished on the MIX market website for each successive reporting MFP.
Target Market
Identifying their target markets helps to focus MFP efforts and optimize the limited resources available. Providing services that are relevant, client oriented and effective in serving an organization’s mission re-quires a clear understanding of the population that an MFP aims to reach. MFPs target markets by peer group are highlighted in Exhibit Exhibit 2B.1. All 5 re-porting MFBs cited three multiple targets, including women, clients living in rural areas and clients living
in urban areas. Of the 19 reporting MFIs, the majority 18 target women and clients in rural areas respec-tively, while one also reported targeting the youth.
Overall, clients are targeted based on gender and location. While the focus on rural areas is relatively greater, there is also a growing emphasis on urban clients, particularly among MFPs providing individual loans.
Section 2B: Social Performance
Reporting to MIX SP framework 2014 Total PMN MembershipMFB 5 09
MFI 19 35
RSP 3 6
Total 27 50
Table 1: Number of Reporting MFPs for Social Performance
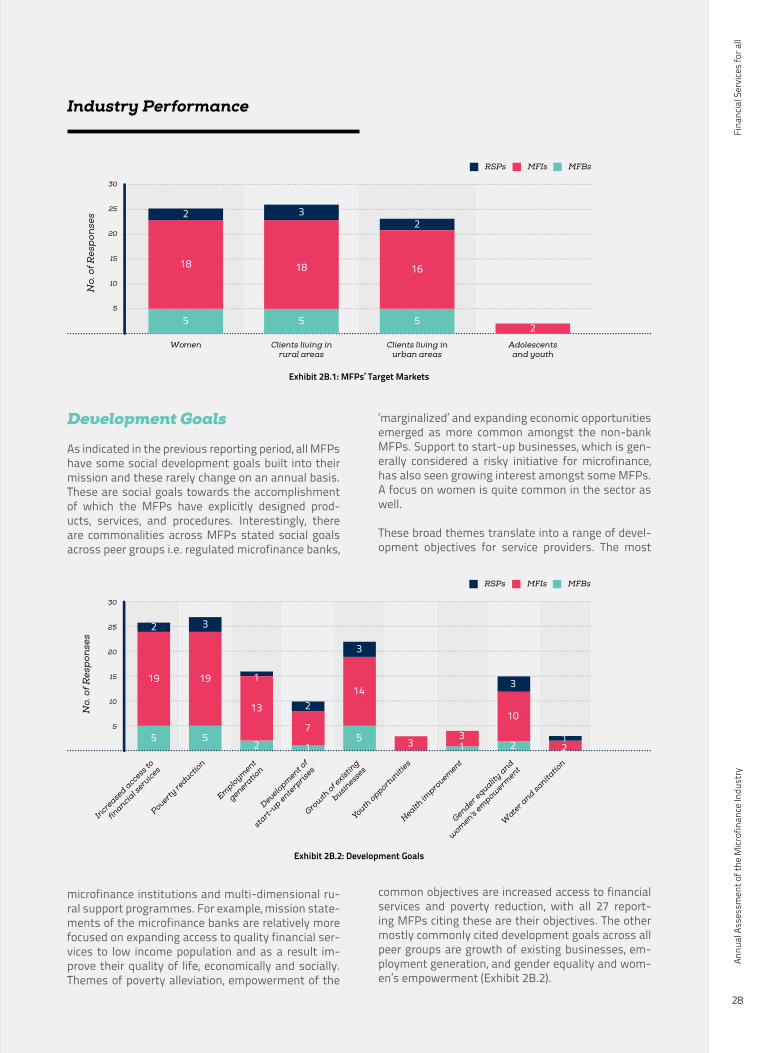
Fina
ncia
l Ser
vice
s fo
r all
Annu
al A
sses
smen
t of t
he M
icrof
inan
ce In
dust
ry
28
Industry Performance
Development Goals
As indicated in the previous reporting period, all MFPs have some social development goals built into their mission and these rarely change on an annual basis. These are social goals towards the accomplishment of which the MFPs have explicitly designed prod-ucts, services, and procedures. Interestingly, there are commonalities across MFPs stated social goals across peer groups i.e. regulated microfinance banks,
microfinance institutions and multi-dimensional ru-ral support programmes. For example, mission state-ments of the microfinance banks are relatively more focused on expanding access to quality financial ser-vices to low income population and as a result im-prove their quality of life, economically and socially. Themes of poverty alleviation, empowerment of the
‘marginalized’ and expanding economic opportunities emerged as more common amongst the non-bank MFPs. Support to start-up businesses, which is gen-erally considered a risky initiative for microfinance, has also seen growing interest amongst some MFPs. A focus on women is quite common in the sector as well.
These broad themes translate into a range of devel-opment objectives for service providers. The most
common objectives are increased access to financial services and poverty reduction, with all 27 report-ing MFPs citing these are their objectives. The other mostly commonly cited development goals across all peer groups are growth of existing businesses, em-ployment generation, and gender equality and wom-en’s empowerment (Exhibit 2B.2).
Incre
ased a
ccess to
financia
l serv
ices
Poverty re
duction
Employm
ent
generatio
n
Development o
f
start-
up enterp
rises
Grow
th of e
xistin
g
business
es
Youth opportu
nities
Health im
provem
ent
Gender equalit
y and
wom
en's em
powerm
ent
Wate
r and sa
nitatio
n
MFBsMFIsRSPs
5
10
15
20
25
30
5
19
2
5
19
3
2
13
1
7
2
5
14
3
3 13
2
10
3
21
1
No.
of R
esp
onse
s
Exhibit 2B.2: Development Goals
Exhibit 2B.1: MFPs’ Target Markets
MFBsMFIsRSPs
5
10
15
20
25
30
Women Clients living inrural areas
Clients living inurban areas
Adolescentsand youth
No.
of R
esp
onse
s
5
18
2
5
18
3
52
16
2
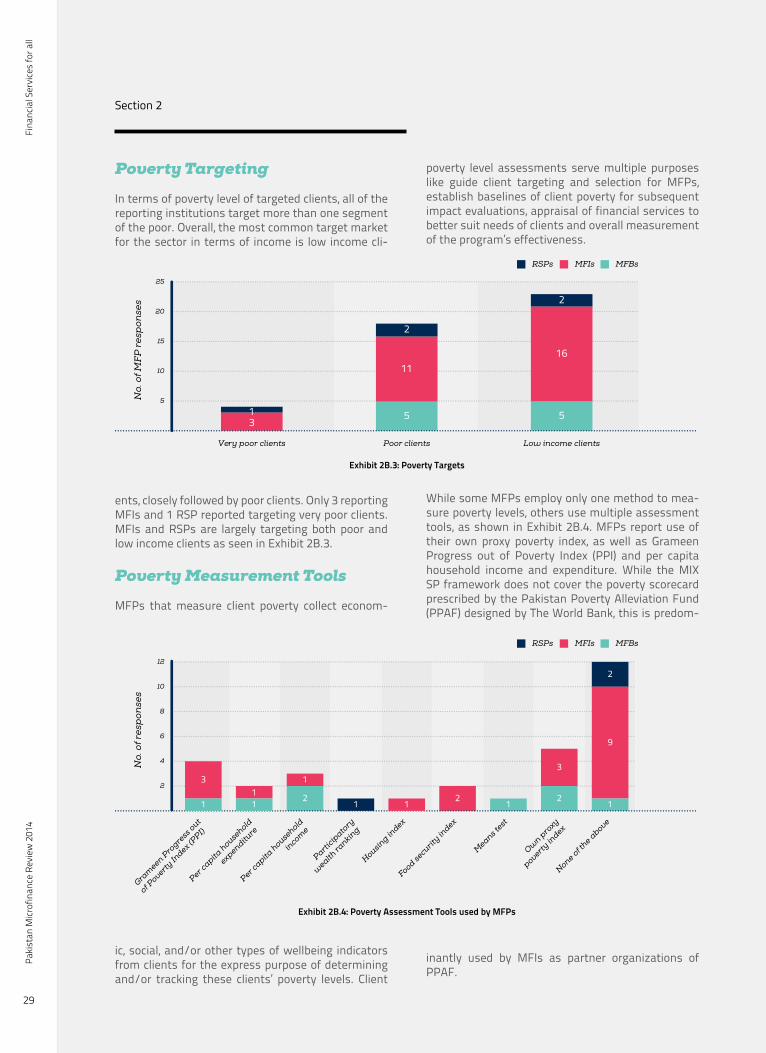
Fina
ncia
l Ser
vice
s fo
r all
Paki
stan
Micr
ofin
ance
Rev
iew
201
4
29
Section 2
Poverty Targeting
In terms of poverty level of targeted clients, all of the reporting institutions target more than one segment of the poor. Overall, the most common target market for the sector in terms of income is low income cli-
ents, closely followed by poor clients. Only 3 reporting MFIs and 1 RSP reported targeting very poor clients. MFIs and RSPs are largely targeting both poor and low income clients as seen in Exhibit 2B.3.
Poverty Measurement Tools
MFPs that measure client poverty collect econom-
ic, social, and/or other types of wellbeing indicators from clients for the express purpose of determining and/or tracking these clients’ poverty levels. Client
poverty level assessments serve multiple purposes like guide client targeting and selection for MFPs, establish baselines of client poverty for subsequent impact evaluations, appraisal of financial services to better suit needs of clients and overall measurement of the program’s effectiveness.
While some MFPs employ only one method to mea-sure poverty levels, others use multiple assessment tools, as shown in Exhibit 2B.4. MFPs report use of their own proxy poverty index, as well as Grameen Progress out of Poverty Index (PPI) and per capita household income and expenditure. While the MIX SP framework does not cover the poverty scorecard prescribed by the Pakistan Poverty Alleviation Fund (PPAF) designed by The World Bank, this is predom-
inantly used by MFIs as partner organizations of PPAF.
Exhibit 2B.4: Poverty Assessment Tools used by MFPs
MFBsMFIsRSPs
No.
of r
esp
onse
s
2
4
6
8
10
12
Gra
meen P
rogre
ss out
of Poverty
Index (
PPI)
Per c
apita h
ousehold
expenditure
Per c
apita h
ousehold
incom
e
Parti
cipato
ry
wealth
rankin
g
Housin
g index
Food securit
y index
Means t
est
Ow
n pro
xy
poverty in
dex
None of t
he above
1 11 2
1
1 1 2 1 2
3
1
9
2
3
Exhibit 2B.3: Poverty Targets
MFBsMFIsRSPs
5
10
15
20
25
No.
of M
FP
res
pon
ses
Very poor clients Poor clients Low income clients
3 5
11
2
5
16
2
1

Fina
ncia
l Ser
vice
s fo
r all
Annu
al A
sses
smen
t of t
he M
icrof
inan
ce In
dust
ry
30
Industry Performance
Governance & HR
Governance and Human Resource (HR) policies re-lated to social performance allow MFPs to gauge commitment to their social development goals at the institutional level. Governance refers to Board mem-bers receiving orientation on the social mission of the MFP, the presence of a SP champion or committee at the Board level, and Board level experience in SPM. During orientation, Board members are provided with an explanation of (or training on) the institution’s so-cial mission and goals. Social performance champi-ons are members of the Board of Directors that are assigned to oversee integration of social performance management practices within an institution while SP committees are formal entities within the Board that meet on a regular basis to discuss topics related to institutional SP. SP-related work experience should
be understood broadly as referring to any experience or training related to managing social performance at MFPs.
Exhibit 2B.5 shows all 5 of the reporting MFBs re-sponded positively to Board members receiving SP orientation on a routine basis and 4 of the 5 MFBs have Board members with experience in SP man-agement. Moreover, it is primarily MFBs with social investors on their Board who reported to having a SP champion or committee, with regular meetings and updates on the bank’s progress on SP management.
The strong performance of 15-16 MFIs on Board orientation of social mission and experience in SPM relates to a number of initiatives taken by the Paki-stan Poverty Alleviation Fund. PPAF has conducted numerous institutional level trainings for its part-
Box 2B.1
Poverty Scorecard used by PPAF Partner Organizations (POs)
The Poverty Scorecard for Pakistan developed by The World Bank is a tool to measure change in poverty in an effective way and to support the management of development programmes that focus on alleviating poverty. It is also a useful tool for social investors that need to measure results according to the triple bottom line objectives i.e. financial, social and environmental results. By ranking targeted households relative poverty, it helps managers target the poor, track changes in poverty, and manage depth of outreach.
One of the ways that the apex lender for microfinance practitioners in the country (PPAF) has ensured incorporation of SPM into partner organizations is through the use of a standard poverty scorecard. All PPAF partner organizations are required to complete the poverty scorecard system for new/repeat clients, and submit reports on these scorecards to the PPAF. While analysis based on poverty research needs to be strengthened, these scorecards provide an important foundation for the industry to work toward standardized measurement of what is perhaps the most predominant social goal of microfinance practitioners, i.e. targeting the poor.
MFBsMFIsRSPs
No.
of r
esp
onse
s
5
10
15
20
25
Board orientationof social mission
SPM champion/committeeat Board
Board experiencein SPM
5 3 4
16
3
41
15
2
Exhibit 2B.5: Social Performance Management at the Board
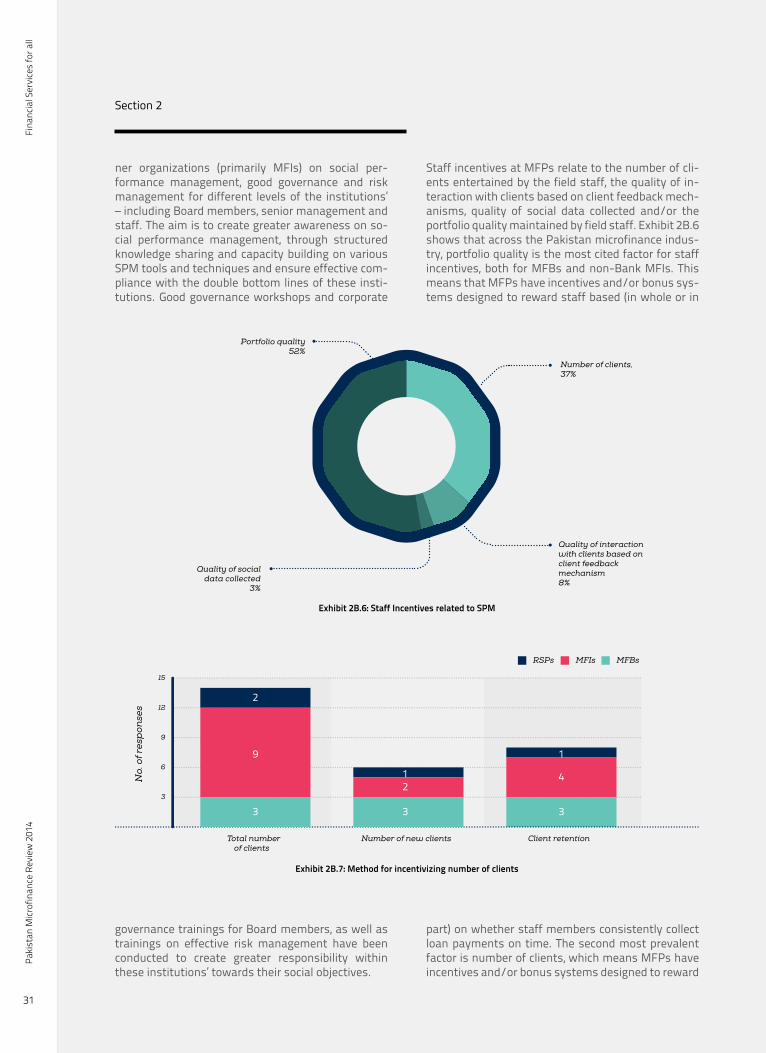
Fina
ncia
l Ser
vice
s fo
r all
Paki
stan
Micr
ofin
ance
Rev
iew
201
4
31
Section 2
ner organizations (primarily MFIs) on social per-formance management, good governance and risk management for different levels of the institutions’ – including Board members, senior management and staff. The aim is to create greater awareness on so-cial performance management, through structured knowledge sharing and capacity building on various SPM tools and techniques and ensure effective com-pliance with the double bottom lines of these insti-tutions. Good governance workshops and corporate
governance trainings for Board members, as well as trainings on effective risk management have been conducted to create greater responsibility within these institutions’ towards their social objectives.
Staff incentives at MFPs relate to the number of cli-ents entertained by the field staff, the quality of in-teraction with clients based on client feedback mech-anisms, quality of social data collected and/or the portfolio quality maintained by field staff. Exhibit 2B.6 shows that across the Pakistan microfinance indus-try, portfolio quality is the most cited factor for staff incentives, both for MFBs and non-Bank MFIs. This means that MFPs have incentives and/or bonus sys-tems designed to reward staff based (in whole or in
part) on whether staff members consistently collect loan payments on time. The second most prevalent factor is number of clients, which means MFPs have incentives and/or bonus systems designed to reward
Number of clients, 37%
Quality of interactionwith clients based onclient feedbackmechanism8%
Quality of socialdata collected
3%
Portfolio quality52%
Exhibit 2B.6: Staff Incentives related to SPM
Exhibit 2B.7: Method for incentivizing number of clients
MFBsMFIsRSPs
No.
of r
esp
onse
s
Total numberof clients
Number of new clients Client retention
3
6
9
12
15
3 3
21
3
4
19
2
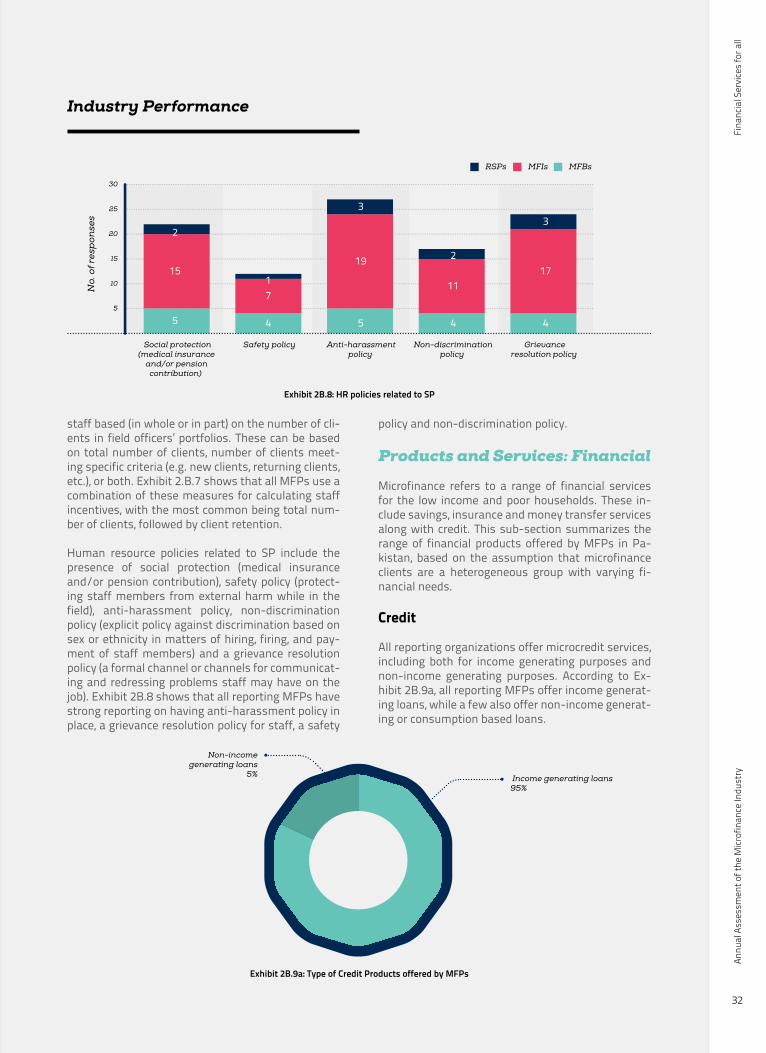
Fina
ncia
l Ser
vice
s fo
r all
Annu
al A
sses
smen
t of t
he M
icrof
inan
ce In
dust
ry
32
Industry Performance
staff based (in whole or in part) on the number of cli-ents in field officers’ portfolios. These can be based on total number of clients, number of clients meet-ing specific criteria (e.g. new clients, returning clients, etc.), or both. Exhibit 2.B.7 shows that all MFPs use a combination of these measures for calculating staff incentives, with the most common being total num-ber of clients, followed by client retention.
Human resource policies related to SP include the presence of social protection (medical insurance and/or pension contribution), safety policy (protect-ing staff members from external harm while in the field), anti-harassment policy, non-discrimination policy (explicit policy against discrimination based on sex or ethnicity in matters of hiring, firing, and pay-ment of staff members) and a grievance resolution policy (a formal channel or channels for communicat-ing and redressing problems staff may have on the job). Exhibit 2B.8 shows that all reporting MFPs have strong reporting on having anti-harassment policy in place, a grievance resolution policy for staff, a safety
policy and non-discrimination policy.
Products and Services: Financial
Microfinance refers to a range of financial services for the low income and poor households. These in-clude savings, insurance and money transfer services along with credit. This sub-section summarizes the range of financial products offered by MFPs in Pa-kistan, based on the assumption that microfinance clients are a heterogeneous group with varying fi-nancial needs.
Credit
All reporting organizations offer microcredit services, including both for income generating purposes and non-income generating purposes. According to Ex-hibit 2B.9a, all reporting MFPs offer income generat-ing loans, while a few also offer non-income generat-ing or consumption based loans.
MFBsMFIsRSPs
No.
of r
esp
onse
s
Social protection(medical insurance
and/or pensioncontribution)
Safety policy Anti-harassmentpolicy
Non-discriminationpolicy
Grievanceresolution policy
5
10
15
20
25
30
15
2
5 4
71
5
19
3
4
11
2
4
17
3
Exhibit 2B.8: HR policies related to SP
Exhibit 2B.9a: Type of Credit Products offered by MFPs
Income generating loans95%
Non-incomegenerating loans
5%
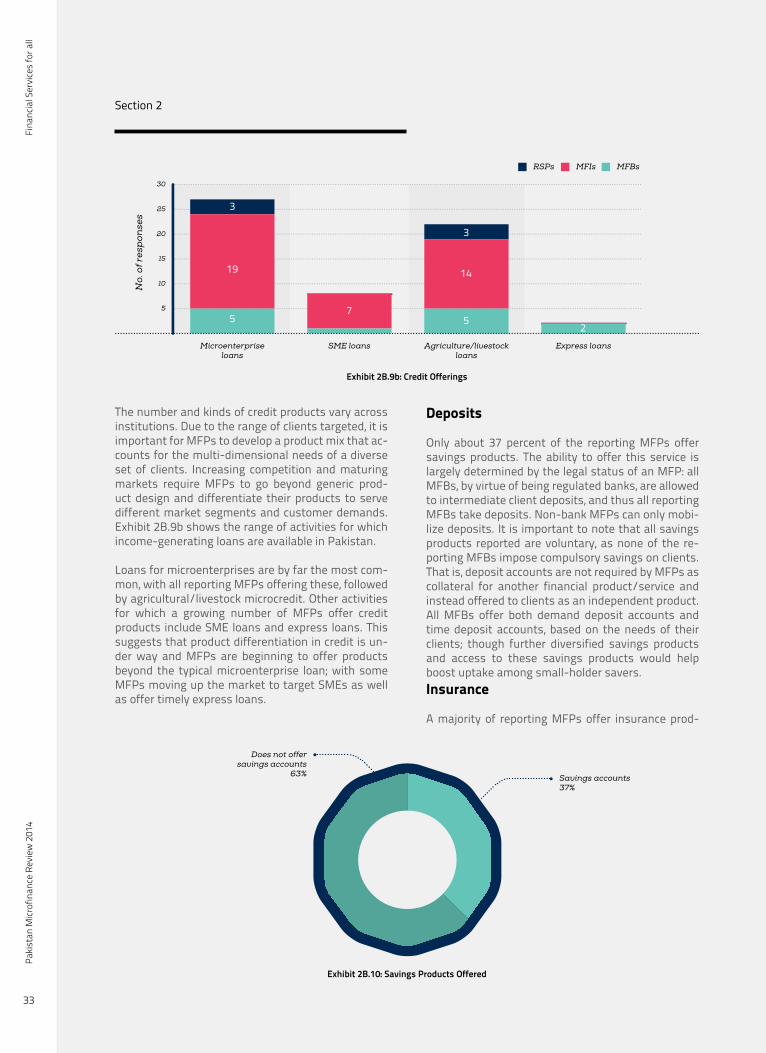
Fina
ncia
l Ser
vice
s fo
r all
Paki
stan
Micr
ofin
ance
Rev
iew
201
4
33
Section 2
The number and kinds of credit products vary across institutions. Due to the range of clients targeted, it is important for MFPs to develop a product mix that ac-counts for the multi-dimensional needs of a diverse set of clients. Increasing competition and maturing markets require MFPs to go beyond generic prod-uct design and differentiate their products to serve different market segments and customer demands. Exhibit 2B.9b shows the range of activities for which income-generating loans are available in Pakistan.
Loans for microenterprises are by far the most com-mon, with all reporting MFPs offering these, followed by agricultural/livestock microcredit. Other activities for which a growing number of MFPs offer credit products include SME loans and express loans. This suggests that product differentiation in credit is un-der way and MFPs are beginning to offer products beyond the typical microenterprise loan; with some MFPs moving up the market to target SMEs as well as offer timely express loans.
Deposits
Only about 37 percent of the reporting MFPs offer savings products. The ability to offer this service is largely determined by the legal status of an MFP: all MFBs, by virtue of being regulated banks, are allowed to intermediate client deposits, and thus all reporting MFBs take deposits. Non-bank MFPs can only mobi-lize deposits. It is important to note that all savings products reported are voluntary, as none of the re-porting MFBs impose compulsory savings on clients. That is, deposit accounts are not required by MFPs as collateral for another financial product/service and instead offered to clients as an independent product. All MFBs offer both demand deposit accounts and time deposit accounts, based on the needs of their clients; though further diversified savings products and access to these savings products would help boost uptake among small-holder savers. Insurance
A majority of reporting MFPs offer insurance prod-
MFBsMFIsRSPs
No.
of r
esp
onse
s
Microenterpriseloans
SME loans Agriculture/livestockloans
Express loans
5
10
15
20
25
30
19
3
57
5
14
3
2
Exhibit 2B.9b: Credit Offerings
Savings accounts37%
Does not offersavings accounts
63%
Exhibit 2B.10: Savings Products Offered
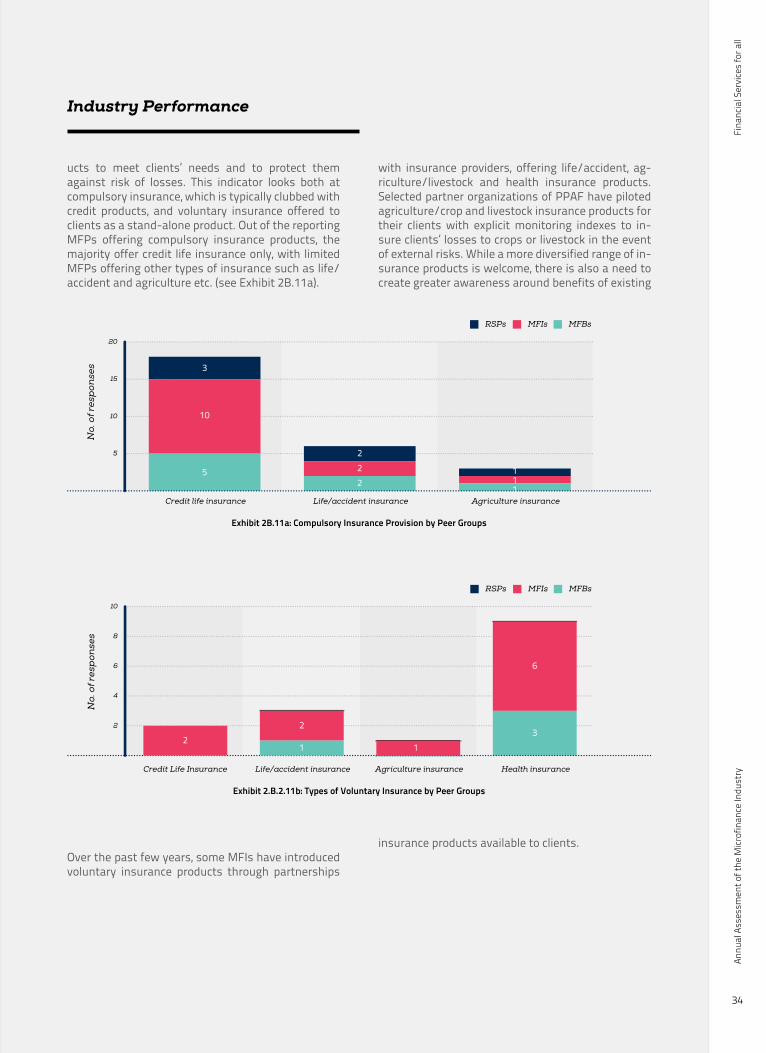
Fina
ncia
l Ser
vice
s fo
r all
Annu
al A
sses
smen
t of t
he M
icrof
inan
ce In
dust
ry
34
Industry Performance
ucts to meet clients’ needs and to protect them against risk of losses. This indicator looks both at compulsory insurance, which is typically clubbed with credit products, and voluntary insurance offered to clients as a stand-alone product. Out of the reporting MFPs offering compulsory insurance products, the majority offer credit life insurance only, with limited MFPs offering other types of insurance such as life/accident and agriculture etc. (see Exhibit 2B.11a).
Over the past few years, some MFIs have introduced voluntary insurance products through partnerships
with insurance providers, offering life/accident, ag-riculture/livestock and health insurance products. Selected partner organizations of PPAF have piloted agriculture/crop and livestock insurance products for their clients with explicit monitoring indexes to in-sure clients’ losses to crops or livestock in the event of external risks. While a more diversified range of in-surance products is welcome, there is also a need to create greater awareness around benefits of existing
insurance products available to clients.
MFBsMFIsRSPs
No.
of r
esp
onse
s
Credit life insurance Life/accident insurance Agriculture insurance
5
10
15
20
52
1
10
3
22
11
Exhibit 2B.11a: Compulsory Insurance Provision by Peer Groups
Exhibit 2.B.2.11b: Types of Voluntary Insurance by Peer Groups
MFBsMFIsRSPs
No.
of r
esp
onse
s
Credit Life Insurance Life/accident insurance Agriculture insurance Health insurance
2
4
6
8
10
21 1
3
6
2
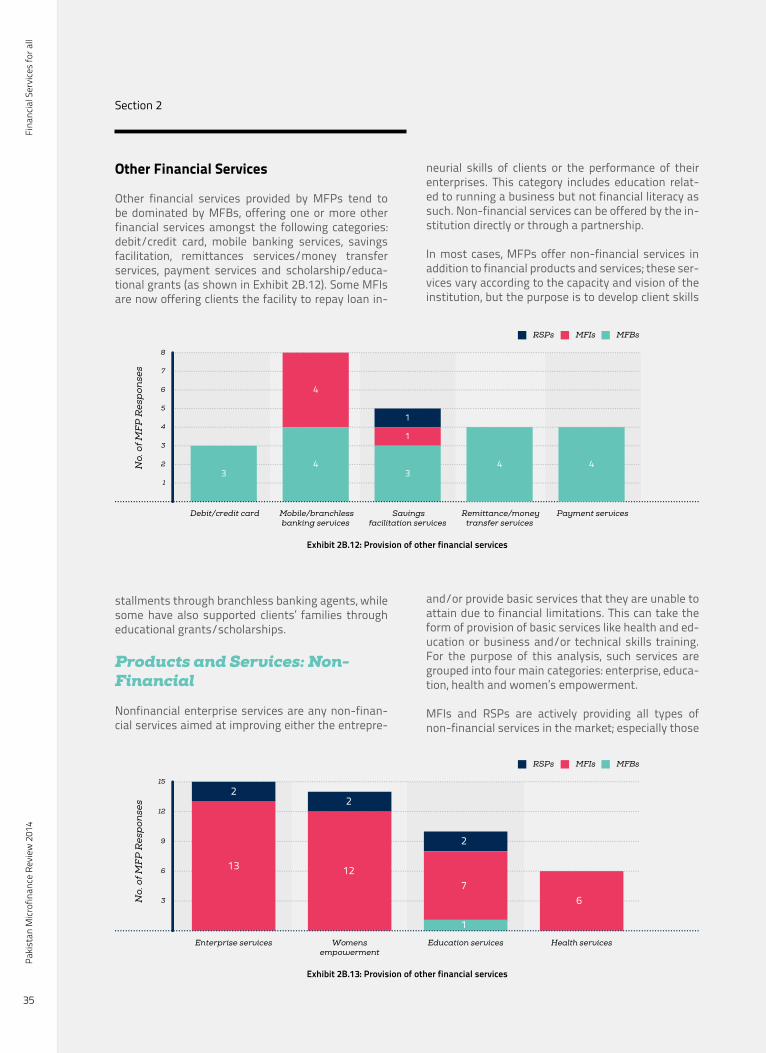
Fina
ncia
l Ser
vice
s fo
r all
Paki
stan
Micr
ofin
ance
Rev
iew
201
4
35
Section 2
Other Financial Services
Other financial services provided by MFPs tend to be dominated by MFBs, offering one or more other financial services amongst the following categories: debit/credit card, mobile banking services, savings facilitation, remittances services/money transfer services, payment services and scholarship/educa-tional grants (as shown in Exhibit 2B.12). Some MFIs are now offering clients the facility to repay loan in-
stallments through branchless banking agents, while some have also supported clients’ families through educational grants/scholarships.
Products and Services: Non-Financial
Nonfinancial enterprise services are any non-finan-cial services aimed at improving either the entrepre-
neurial skills of clients or the performance of their enterprises. This category includes education relat-ed to running a business but not financial literacy as such. Non-financial services can be offered by the in-stitution directly or through a partnership.
In most cases, MFPs offer non-financial services in addition to financial products and services; these ser-vices vary according to the capacity and vision of the institution, but the purpose is to develop client skills
and/or provide basic services that they are unable to attain due to financial limitations. This can take the form of provision of basic services like health and ed-ucation or business and/or technical skills training. For the purpose of this analysis, such services are grouped into four main categories: enterprise, educa-tion, health and women’s empowerment.
MFIs and RSPs are actively providing all types of non-financial services in the market; especially those
Exhibit 2B.12: Provision of other financial services
MFBsMFIsRSPs
No.
of M
FP
Res
pon
ses
Debit/credit card Mobile/branchlessbanking services
Savingsfacilitation services
Remittance/moneytransfer services
Payment services
1
2
3
4
5
6
7
8
34
4
3
1
1
4 4
MFBsMFIsRSPs
No.
of M
FP
Res
pon
ses
Enterprise services Womensempowerment
Education services Health services
3
6
9
12
15
13 12
2
7
2
1
6
2
Exhibit 2B.13: Provision of other financial services
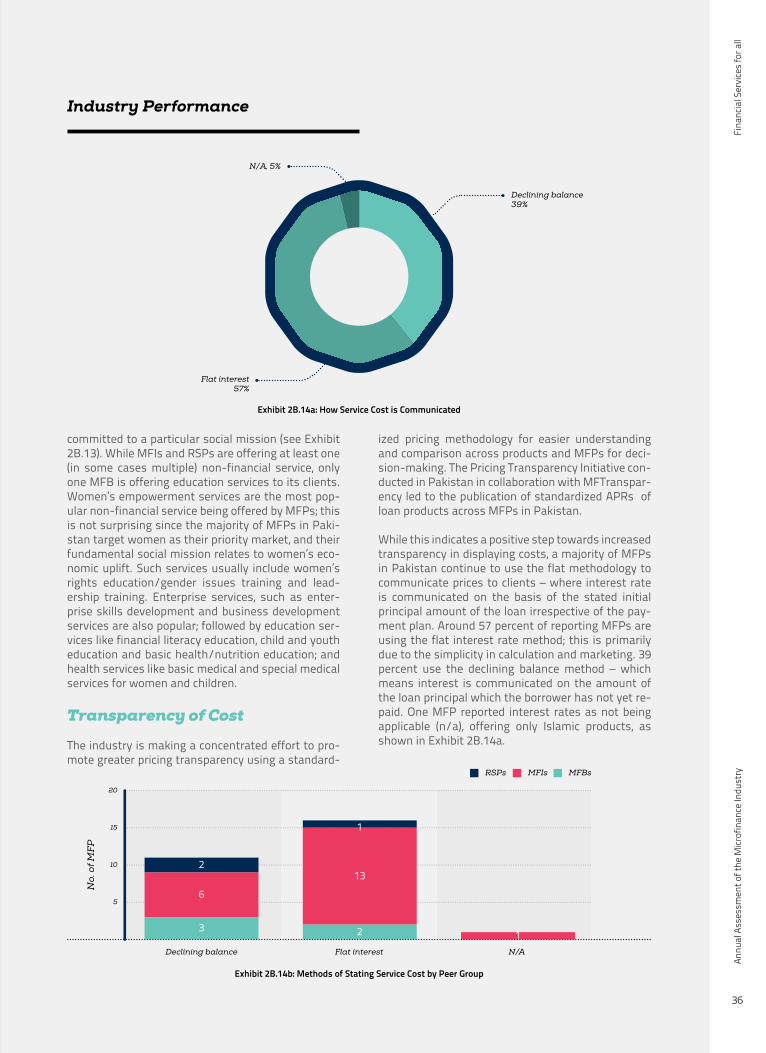
Fina
ncia
l Ser
vice
s fo
r all
Annu
al A
sses
smen
t of t
he M
icrof
inan
ce In
dust
ry
36
Industry Performance
committed to a particular social mission (see Exhibit 2B.13). While MFIs and RSPs are offering at least one (in some cases multiple) non-financial service, only one MFB is offering education services to its clients. Women’s empowerment services are the most pop-ular non-financial service being offered by MFPs; this is not surprising since the majority of MFPs in Paki-stan target women as their priority market, and their fundamental social mission relates to women’s eco-nomic uplift. Such services usually include women’s rights education/gender issues training and lead-ership training. Enterprise services, such as enter-prise skills development and business development services are also popular; followed by education ser-vices like financial literacy education, child and youth education and basic health/nutrition education; and health services like basic medical and special medical services for women and children.
Transparency of Cost
The industry is making a concentrated effort to pro-mote greater pricing transparency using a standard-
ized pricing methodology for easier understanding and comparison across products and MFPs for deci-sion-making. The Pricing Transparency Initiative con-ducted in Pakistan in collaboration with MFTranspar-ency led to the publication of standardized APRs of loan products across MFPs in Pakistan.
While this indicates a positive step towards increased transparency in displaying costs, a majority of MFPs in Pakistan continue to use the flat methodology to communicate prices to clients – where interest rate is communicated on the basis of the stated initial principal amount of the loan irrespective of the pay-ment plan. Around 57 percent of reporting MFPs are using the flat interest rate method; this is primarily due to the simplicity in calculation and marketing. 39 percent use the declining balance method – which means interest is communicated on the amount of the loan principal which the borrower has not yet re-paid. One MFP reported interest rates as not being applicable (n/a), offering only Islamic products, as shown in Exhibit 2B.14a.
Declining balance39%
N/A, 5%
Flat interest57%
Exhibit 2B.14a: How Service Cost is Communicated
Exhibit 2B.14b: Methods of Stating Service Cost by Peer Group
MFBsMFIsRSPs
No.
of M
FP
5
10
15
20
N/ADeclining balance Flat interest
3 2 1
13
1
6
2
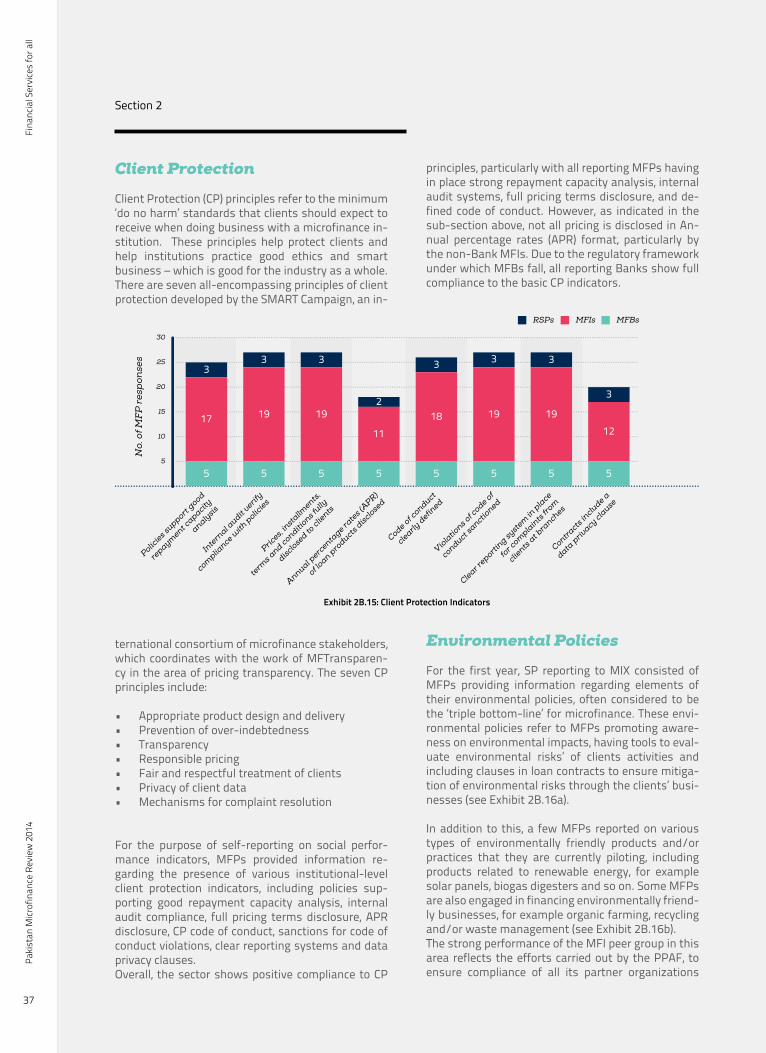
Fina
ncia
l Ser
vice
s fo
r all
Paki
stan
Micr
ofin
ance
Rev
iew
201
4
37
Section 2
Client Protection
Client Protection (CP) principles refer to the minimum ‘do no harm’ standards that clients should expect to receive when doing business with a microfinance in-stitution. These principles help protect clients and help institutions practice good ethics and smart business – which is good for the industry as a whole. There are seven all-encompassing principles of client protection developed by the SMART Campaign, an in-
ternational consortium of microfinance stakeholders, which coordinates with the work of MFTransparen-cy in the area of pricing transparency. The seven CP principles include: • Appropriate product design and delivery• Prevention of over-indebtedness• Transparency• Responsible pricing• Fair and respectful treatment of clients• Privacy of client data• Mechanisms for complaint resolution
For the purpose of self-reporting on social perfor-mance indicators, MFPs provided information re-garding the presence of various institutional-level client protection indicators, including policies sup-porting good repayment capacity analysis, internal audit compliance, full pricing terms disclosure, APR disclosure, CP code of conduct, sanctions for code of conduct violations, clear reporting systems and data privacy clauses. Overall, the sector shows positive compliance to CP
principles, particularly with all reporting MFPs having in place strong repayment capacity analysis, internal audit systems, full pricing terms disclosure, and de-fined code of conduct. However, as indicated in the sub-section above, not all pricing is disclosed in An-nual percentage rates (APR) format, particularly by the non-Bank MFIs. Due to the regulatory framework under which MFBs fall, all reporting Banks show full compliance to the basic CP indicators.
Environmental Policies
For the first year, SP reporting to MIX consisted of MFPs providing information regarding elements of their environmental policies, often considered to be the ‘triple bottom-line’ for microfinance. These envi-ronmental policies refer to MFPs promoting aware-ness on environmental impacts, having tools to eval-uate environmental risks’ of clients activities and including clauses in loan contracts to ensure mitiga-tion of environmental risks through the clients’ busi-nesses (see Exhibit 2B.16a). In addition to this, a few MFPs reported on various types of environmentally friendly products and/or practices that they are currently piloting, including products related to renewable energy, for example solar panels, biogas digesters and so on. Some MFPs are also engaged in financing environmentally friend-ly businesses, for example organic farming, recycling and/or waste management (see Exhibit 2B.16b). The strong performance of the MFI peer group in this area reflects the efforts carried out by the PPAF, to ensure compliance of all its partner organizations
MFBsMFIsRSPs
No.
of M
FP
res
pon
ses
5
10
15
20
25
30
Policie
s support
good
repaym
ent capacity
analysis
Inte
rnal a
udit verif
y
complia
nce with
polic
ies
Prices,
inst
allments
,
term
s and conditi
ons fully
disclose
d to clie
nts
Annual perc
entage ra
tes (
APR)
of loan p
roducts
disc
losed
Code of conduct
clearly d
efined
Viola
tions o
f code of
conduct sanctio
ned
Clear reporti
ng syst
em in
pla
ce
for c
ompla
ints
from
clients
at b
ranches
Contracts
inclu
de a
data p
rivacy cla
use
5 5 5 5 5 5 5 5
17
3
19
3
19
3
11
218
3
19
3
19
3
12
3
Exhibit 2B.15: Client Protection Indicators
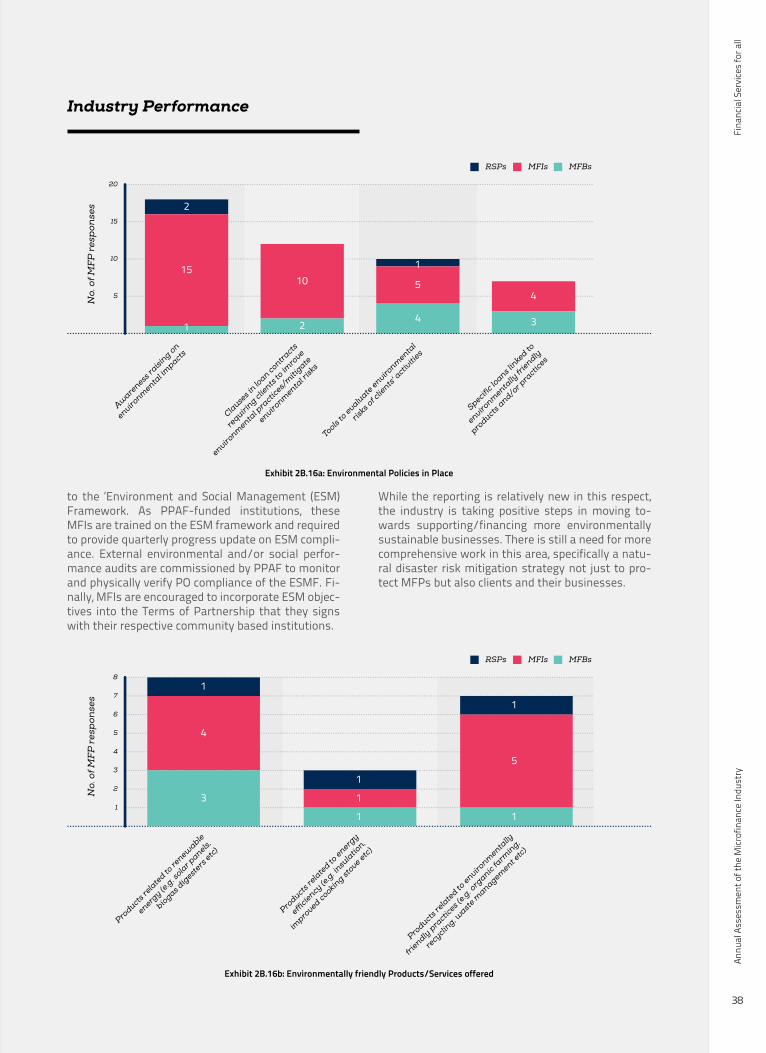
Fina
ncia
l Ser
vice
s fo
r all
Annu
al A
sses
smen
t of t
he M
icrof
inan
ce In
dust
ry
38
Industry Performance
to the ‘Environment and Social Management (ESM) Framework. As PPAF-funded institutions, these MFIs are trained on the ESM framework and required to provide quarterly progress update on ESM compli-ance. External environmental and/or social perfor-mance audits are commissioned by PPAF to monitor and physically verify PO compliance of the ESMF. Fi-nally, MFIs are encouraged to incorporate ESM objec-tives into the Terms of Partnership that they signs with their respective community based institutions.
While the reporting is relatively new in this respect, the industry is taking positive steps in moving to-wards supporting/financing more environmentally sustainable businesses. There is still a need for more comprehensive work in this area, specifically a natu-ral disaster risk mitigation strategy not just to pro-tect MFPs but also clients and their businesses.
33
MFBsMFIsRSPs
No.
of M
FP
res
pon
ses
Aware
ness ra
ising on
environm
ental im
pacts
Clause
s in lo
an contracts
requiri
ng clients
to im
rove
environm
ental p
ractic
es/m
itigate
environm
ental r
isks
Tools to
evaluate
environm
ental
risks o
f clie
nts' a
ctiviti
es
Specific lo
ans lin
ked to
environm
entally
frie
ndly
products
and/o
r pra
ctices
5
10
15
20
1 2
10
4
5
1
3
4
15
2
Exhibit 2B.16a: Environmental Policies in Place
Exhibit 2B.16b: Environmentally friendly Products/Services offered
MFBsMFIsRSPs
No.
of M
FP
res
pon
ses
Products
rela
ted to
renew
able
energy (e
.g. s
olar p
anels,
biogas d
igest
ers etc
)
Products
rela
ted to
energy
efficie
ncy (e.g
. insu
latio
n,
impro
ved cooking st
ove etc)
Products
rela
ted to
environm
entally
friendly
pra
ctices (
e.g. o
rganic fa
rmin
g,
recyclin
g, wast
e managem
ent etc
)
1
2
3
4
5
6
7
8
3 1
1
1
5
1
1
4
1

Fina
ncia
l Ser
vice
s fo
r all
Paki
stan
Micr
ofin
ance
Rev
iew
201
4
39
Section 2
Fina
ncia
l Ser
vice
s fo
r all
Annu
al A
sses
smen
t of t
he M
icrof
inan
ce In
dust
ry
40
The Way Forward
Section 3
The Way Forward
Fina
ncia
l Ser
vice
s fo
r all
Paki
stan
Micr
ofin
ance
Rev
iew
201
4
41
Section 3
With the industry growing at a double digit rate over the last few years buoyed by an enabling regulatory and policy environment some of the key challenges and opportunities faced by the practitioners are as follow:
The Way Forward
Financial exclusion has been labelled the “new apart-heid”. Access to financial services plays an important role in the development of the financial sector and the economy at large.
Access to financial services is one of the key chal-lenges faced by the country. Keeping this in view the State Bank of Pakistan in collaboration with World Bank (WB) has recently developed the National Fi-nancial Inclusion Strategy (NFIS) with an aim of im-proving access to financial services for the unbanked population of the country.
Pakistan continues to lag behind in the World Bank’s Financial Inclusion Index (FINDEX). Only 8.7 percent of the adult population in the country has an account with a formal financial institution as compared to 45.5 percent for South Asia . In addition, only 3.3 per-cent of the adults placed their savings with financial institutions while only 1.5 percent borrowed from fi-nancial institutions as against 39.3 percent who bor-rowed from family and informal money lenders . This shows there is a huge unmet demand which has not yet been tapped by the formal financial sector forc-
ing large segments of population to rely on informal sources for financial services.
The Microfinance industry can play a crucial and crit-ical role in the inclusive finance sphere. It can offer a wide array of financial services including not only credit products but also savings, insurance and pay-ments services. With its potential clientele being those who belong to the lower income strata of the society, the microfinance industry can bring a large segment of population into formal financial system as compared to other players in the financial indus-try. Utilizing its synergies with branchless banking and outreach in rural areas the sector can be an ef-fective conduit for improving access to financial ser-vices across the country. Areas like low cost housing segments, loans to small and marginalized farmers, value chains and health insurance can be best ex-tended by the microfinance industry as compared to other players in the financial sectors. It is felt that clear demarcation is needed for the role of MFPs in the inclusive finance sphere in the upcoming NFIS.
Inclusive Finance and Microfinance Industry
Fina
ncia
l Ser
vice
s fo
r all
Annu
al A
sses
smen
t of t
he M
icrof
inan
ce In
dust
ry
42
The Way Forward
The microfinance industry in the country despite the enabling environment and progressive regulatory framework, investments in industry infrastructure and institutional strengthening, and entry of a new range of practitioners in the market, has been grow-ing at a rate far below its potential in the past few years. Current penetration of 11.5 percent is inade-quate showing that practitioners have to cover a lot of ground. Despite all its achievements to date, the industry is far from realizing its potential and con-tributing significantly to the financial inclusion agen-da in Pakistan. Policymakers and financial industry stakeholders are starting to analyze and question the ability of the microfinance sector to make a sig-nificant and large scale contribution to the financial exclusion challenge in the country: with such an en-abling environment and extensive, sustained support from the donors, why is the sector unable to grow and achieve the scale it needs to have? Thus, in order for microfinance to remain relevant and become an important, integral part of the financial industry, the sector needs to demonstrate it can scale up and grow sustainably, and resultantly have meaningful impact on the financial inclusion landscape within Pakistan and globally.
According to recently authored strategy paper by PMN on growth, setting an ambitious credit outreach target for itself will not only allow the industry to fur-
ther its goal of inclusive finance but also make it a permanent feature of the financial landscape. More-over, that level of scale and growth would perma-nently place microfinance on the policy and growth agenda of the State. A larger size would also in-crease the industry’s ability to absorb distortions and threats emanating from external interference either in the form of government led credit schemes or is-sues pertaining to pricing of loans.
MFPs can utilize government directed credit schemes and government initiatives like credit guarantees for small and marginalized farmers and low cost hous-ing guarantee schemes to increase outreach in rural areas and enter new market segments like low cost housing. In addition, the fast growing branchless banking segment can be utilized to expand outreach by identifying potential clients based on cell phone us-age similar what is being done by M-Shawri in Kenya. Moreover, apprehensions regarding whether growth at accelerated growth could lead to delinquency crisis as witnessed globally in 2008 in Nicaragua, Bosnia, Morocco and Pakistan have been addressed by set-ting up of MF-CIB, launch of responsible finance and client protection initiatives, strengthening of corpo-rate governance among the players and developing regulatory umbrella for the entire sector.
Pakistan’s economy has witnessed the launch of a number of government sponsored credit schemes by various administrations over the years. The aim of these schemes has largely been provision of employ-ment coupled with poverty alleviation. The conduit for these schemes has generally been public sector banks and DFIs whose number has substantially declined due to privatization over the last few de-cades. Moreover, the result of the schemes has been far from satisfactory. The fault largely lies with the structure of the scheme and the design of the prod-ucts offered to clients.
The incumbent government soon after taking office in 2013 launched two credit schemes namely the Prime Minister (PM) Youth Loan Scheme and Prime Minister (PM) Interest-Free Loan Scheme with an
aim of employment generation and poverty allevia-tion. The interest-free loan scheme was s source of concern for the microfinance industry stakeholders as it had the potential to distort the conventional microfinance industry. However, the scheme was structured and designed in such a manner that rath-er than overlapping with conventional microfinance it now complements it. The funding for the scheme has been routed through the national apex, PPAF, and loans are extended by selected MFPs to clients Only clients falling below 40 on the poverty scorecard and belonging to those areas where there little or no outreach of conventional microfinance.
This successful adaptation of a government cred-it scheme can work as prelude to how other similar schemes can be structured and designed in a man-
Towards Accelerated Growth
Adapting Government Credit Schemes
Fina
ncia
l Ser
vice
s fo
r all
Paki
stan
Micr
ofin
ance
Rev
iew
201
4
43
Section 3
ner which would result in a win-win situation for all. Similarly, PM Youth Loan Scheme under which subsidized loans are extended to existing and new business can be modified and adapted. In addition, other recently announced government initiatives like the Credit Guarantee Scheme for Small & Marginal-ized Farmers and Low Cost Housing Guarantee can be utilized for expanding outreach in rural areas and housing segments.
Moreover, the schemes can be handled efficiently and generate the required impact if they are channel-ized through MFPs. Microfinance practitioners have
experience in extending non-collateralized loans to borrowers from lower income strata. This experi-ence, market awareness and skill set can be used to channel government credit initiatives. Finally, for an industry which counts funding as one of the key con-straints to growth these credit schemes can prove to be quite useful.
According to Global Impact Investing Network (GIIN), “Impact investments are investments made into companies, organizations, and funds with the inten-tion to generate social and environmental impact alongside a financial return.” The impact investors provide funds, both equity and debt, to meet the world’s most pressing challenges in areas like ag-riculture, housing, education, renewable energy, healthcare, clean technology, and access to financial services. There are over three hundred impact funds globally. In 2012, over USD 8 billion were committed by impact investors as compared to USD 2.5 billion in 2010 . More than 70 percent of the impact investing allocations is to the microfinance industry .
In its report “The Landscape for Impact Investing in South Asia”, GIIN has stated that Pakistan has one of the largest impact investment landscapes in the re-gion. Impact investors have deployed over USD 2 bil-lion so far. There are a variety of impact investors in the country including fund managers, high net worth
individuals, development financial institutes (DFIs) and other financial institutions. However, most of the capital has been deployed by DFIs and mostly in the form of debt. The majority of the impact investments in the country so far have been in the energy sector. With increasing global popularity of impact investing and additional funds being committed by impact in-vestors, microfinance players in Pakistan provide an ideal channel for these investors. Moreover, both im-pact investors and microfinance players share similar objectives i.e. social impact and also, to earn a near market return on their investments. MFPs can work with impact investors for specific interventions like access to financial services, funding low cost private schools, provide off-grid energy solutions and low cost housing. This would require MFPs to develop innovative products to tap these market segments. Impact investments provide MFPs with an opportu-nity to not only grow but also enter into other market segments.
A key challenge for the microfinance industry in Pakistan to grow and reach scale is funding. MFPs have been relying for funding upon the national apex, guarantee schemes and deposits (in case of MFBs only). To grow and expand outreach MFPs will have to diversify their sources of funds to meet financing needs in the future.
Deposits
MFBs have witnessed exponential growth in depos-it mobilization in the last few years. The growth has come at the back of above market rates being offered to institutional clients and high net-worth individ-uals. However, opening of national clearing house membership for MFBs will allow them to mobilize
Impact Investment
Diversifying Funding Sources
Fina
ncia
l Ser
vice
s fo
r all
Annu
al A
sses
smen
t of t
he M
icrof
inan
ce In
dust
ry
44
The Way Forward
retail deposits effectively. This would lead to not only increase in deposits but also lower cost of funds. In addition as a result of recent biometric re-verification of SIMs, m-wallet accounts can now be opened with-out even visiting an agent by customers have had their SIM verified. This initiative is a big opportunity for the sector to migrate the large number of over-the-counter users of branchless banking services to m-wallets. With this step MFBs can extend financial services to a large number of unbanked client and enhance their deposit base.
To be able to truly extend saving products to client at the base of pyramid innovative products need to be developed. Currently, clients are being offered a stereotypical product mix which is similar to the one being offered by commercial banks. In addition, MFBs can link up with RSPs and MFIs to attract the savings being mobilized by them and parked at various finan-cial institutes since non-bank MFPs are legally not allowed to mobilize deposits. This would require cre-ating partnerships and incentive structure between deposit-taking and non-deposit taking institutes.
Debt
Currently, the practitioners are availing debt facilities primarily from the national apex and funds obtained under the two loan guarantee schemes. While the bigger players have been successful is raising funds from commercial banks which are partially or fully
secured by the guarantee funds but the same can-not be said for the mid and small sized practitioners. But recent enhancement of risk coverage MFCG to 60 percent for these MFPs will better place them to tap finances from commercial sources.
In order to meet their increasing funding needs, MFPs would need to explore options to avail loans from international lenders and also tap debt capital markets. A number of international development fi-nancial institutions (DFIs) and microfinance invest-ment vehicles (MIVs) have been exploring the market over the years for possible debt placements. How-ever, the high hedging costs and availability of funds at competitive rates locally had been the inhibiting factors. But recent growth in outreach and lowering of hedging premiums has led to two successful debt placements by an international lender. With contin-ued investor interest in the sector, there is potential for players to tap international lenders to meet their funding needs. Debt capital markets offer microf-inance practitioners another avenue to raise funds. Although, there have been only two instances when MFPs have issued redeemable capital but their suc-cess coupled with the extension of MCGF coverage to debt capital markets make it an attractive option for practitioners. In addition as large firms move globally towards creating shared values which focuses on the connection between societies and economic prog-ress, microfinance practitioners can tap these shared value initiatives to meet their funding needs.
With the sector growing at a steady rate, the de-mand for capacity building initiatives, in terms of the provision of consistent training opportunities, far outstripped the supply. Since then the Microfinance sector has made many strides through an enabling environment created by the State Bank of Pakistan, Pakistan Poverty Alleviation Fund, UK-Aid’s DFID, PMN and other stakeholders, but the goal of achiev-ing scale has yet to be realized. It is believed that one of the major impediments to achieving growth and sustainability is lack of staff capacities, especially at the middle and lower management levels at the MFPs. It is also true that trained human resource is one of the pre-requisites for a strong, dynamic and growing Microfinance sector, which would need to
invest in enhancing capacity by imparting the neces-sary knowledge and skills which will help equip staff to shoulder their responsibilities effectively in the mi-crofinance organizations they are employed.
Efforts to develop the capacity of the human resource in the past were primarily focused on undertaking one-off training programs while the demand for such trainings has been increasing rapidly. The unavail-ability of adequate external training facilities has also minimized the long-term impact of the various train-ing programs carried out arbitrarily by different sec-tor level institutions. With less dependable sources to provide assistance to help meet the technical and management training needs for microfinance and for
Capacity Building Program: Laying the foundation for a
Training Centre of Excellence for MFPs

Fina
ncia
l Ser
vice
s fo
r all
Paki
stan
Micr
ofin
ance
Rev
iew
201
4
45
Section 3
Inclusive Finance in general, most of the MFPs are currently grappling with issues related to growth and cost effectiveness.
However, to reach scale will be challenging for the sector given its current capacity and state. Human Resource Development is a key area that needs to be focused on to achieve such scale, as mentioned ear-lier. HRD is also of critical importance for the indus-try given the labor intensive nature of the work and limited trained staff is considered a major barrier to achieving scale through product diversification. With the focus on growth, the staff in the microfinance in-dustry is estimated to increase four fold over the next five years.
With current staff capacity already being a major is-sue, a strategic approach to HRD at the sector level needs to be undertaken. Currently PMN facilitates the provision of opportunities to the senior manage-ment tier to enhance its capacity through exposure
visits, corporate governance and international train-ings with the primary focus on strategic leadership. It is also important to know that the industry is com-prised of diverse players each having its own differ-ent set of requirements. Whereas large for-profit or-ganizations can support in-house training programs for their mid and lower level staff, medium sized and smaller organizations which constitute the bulk of the industry cannot afford similar trainings.
Keeping this in view, the establishment of a Training Centre of Excellence for the Microfinance Providers would be the need of the hour, where technical and managerial trainings can be offered on consistent basis to the increasing number of mid and operation-al level staff which will be employed in the coming years as the sector moves up on the growth trajecto-ry. Consequently, the long term objective of increas-ing outreach through the development of innovative products will come to fruition.
Micro and Small enterprises in Pakistan face seri-ous issues with access to formal finance given their informal nature, lack of documentation and accept-able collateral. Although commercial banks have had some success with downscaling to meet the needs of medium sized firms in Pakistan, small entrepreneurs remain off their radar and it seems highly unlikely that the mainstream banks will serve this segment in the near future. However, MFPs, especially the MFBs and large MFIs, seem well positioned to enter this market due to its similarities with the microfinance clientele.
During the year 2012, the State Bank of Pakistan has revised the loan limits for MFBs from PKR 150,000 to PKR 500,000 in order to promote enterprise lending. Furthermore, the State Bank also initiated the SME Guarantee Fund during the same period. The purpose of the fund was to facilitate MFBs in raising capital from financial institutions in order to move up-mar-ket.
With the introduction of the above mentioned gov-ernment initiatives, majority of the MFBs have been successfully piloting microenterprise lending and are continuously improving their product offerings to fully cater the niche market. Many MFBs are in the process of establishing dedicated departments for MSE lending and have also trained their staff with
the necessary skills for serving the needs small en-terprises.
However, this shift will represent some challenges to MFPs lacking expertise in larger enterprise lending. It requires significant up-scaling of loan sizes from the present average loan of PKR 28,269 . In order to fully capture the enterprise segment, MFBs will need to treat micro and small enterprise clients different-ly from the conventional retail segment. Emphasis should be on product development that can fulfill the requirements of small enterprises while not burden-ing the resources of the microfinance banks.
Moreover, the focus of conventional microfinance has been on household repayment capacity which will now have to shift to the enterprise’s repayment capacity. This will require investment into under-standing the demands and needs of the market seg-ment, building a different skill set amongst field staff, finding sources of funds to meet the financing needs driven by the relatively larger loan sizes, and under-standing the risks.
Despite many challenges, MFPs might bring import-ant advantages to the MSE market. Compared to mainstream banks, MFPs may have closer relation-ships with their customers, maintaining a high lev-el of trust and making it easy to understand client
Micro, Small & Medium Enterprise (MSME) Lending
Fina
ncia
l Ser
vice
s fo
r all
Annu
al A
sses
smen
t of t
he M
icrof
inan
ce In
dust
ry
46
The Way Forward
needs. Another advantage is that MFPs often have faster lending procedures and require less collater-al than commercial banks. Finally, MFPs can reach customers who do not have access to banks or who
face serious obstacles, such as their own informality or high bank fees.
Agriculture is the backbone of the economy for ma-jority of the developing countries. The potential of this segment becomes fully clear if we look at the value chains that link farm production to rural trading and other sectors of the economy. These chains show that farmers do not operate in isolation, but are part of a wider system which encompasses processors, traders, transporters, input suppliers and retailers. However, the lack of financing limits the growth po-tential of different micro-entrepreneurs at different parts of the value chain. Private financial institutions have tended to regard such micro-entrepreneurs as un-bankable as they lack the kind of collateral and guarantees banks demand before lending. For bank-ers it is easier and more lucrative to provide a handful of large loans to well-established businesses, rather than lots of small loans to such micro-entrepreneurs.In Pakistan, the State Bank of Pakistan is taking commendable steps to ensure the success of value
chains by facilitating various chain actors. A compo-nent of these initiatives is the ‘Value-Chain Contract Farmer Financing’ scheme to build a link between banks and small farmers who have no access to for-mal financing .
The introduction of the Value Chain Contract Farmer Financing scheme will enable farmers to avail financ-ing from banks backed by a processor’s guarantee and in return buyers/processors may get assurance of getting required quantity and quality of agricultur-al produce. Under the scheme, banks will be accept-ing guarantees from a lead firm acting as a bridge between banks and farmers. The term ‘lead firm’ ap-plies to the processors of agricultural produce, input suppliers, stockist, a marketing company, trader or exporter.
Furthermore, SBP has also introduced ‘Warehouse
Over the past year, the SBP has taken comprehensive measures to combat money laundering and terror-ist financing activities. These measures were visible in the revision of prudential regulations for MFBs in 2014 which introduced a broad set of guidelines covering areas such as customer identification and verification requirements, ongoing and enhanced due diligence, record retention, cash and suspicious trans-actions reporting in line with standards prescribed by Financial Action Task Force (FATF). Moreover, SBP has allowed MFBs to take additional measures as per risk involved in line with the FATF recommendations. The AML and CDD requirements may entail some MFBs to enhance their internal controls by updating their client in-take forms, operating procedures, and information systems. Similarly, training staff in new procedures is vital to the successful implementation
of the AML and CDD guidelines. In addition, these regulations would impact branchless banking where operators are aiming for convenience and hassle opening of m-wallets. This would require balancing of AML and CDD requirements with ease of opening of accounts.
The guidelines introduced by SBP are aimed to safe-guard MFBs from the threat of money laundering, terrorist financing and other related unlawful activi-ties which can damage the national financial system. Illegitimate financial holdings and assets are unre-liable sources of investment capital for sustainable economic development and can destabilize the na-tional economy.
Agriculture Value Chains
Anti-Money Laundering (AML), Customer Due Diligence
(CDD) and Terrorist Financing
Fina
ncia
l Ser
vice
s fo
r all
Paki
stan
Micr
ofin
ance
Rev
iew
201
4
47
Section 3
Receipt Financing’ to reduce uncertainty and increase efficiency in the agriculture market. The warehouse receipts system, also known as inventory credits, can facilitate financing for inventory or products held in storage. Warehouse receipt financing is a collateral-ized commodity transaction where the goods them-selves provide security for the loan. This type of fi-nancing allows lenders to immediately sell off a very liquid asset, namely the commodities they grow, if a
farmer defaults on the loan. The underlying collater-al is usually a soft commodity like wheat, rice, maize, cotton and other grains .
On the whole, agriculture value chains provide an ideal platform to extend credit in the rural areas at a relatively lower cost and reduced risk for the MFPs.

Fina
ncia
l Ser
vice
s fo
r all
Annu
al A
sses
smen
t of t
he M
icrof
inan
ce In
dust
ry
48
The Way Forward

Fina
ncia
l Ser
vice
s fo
r all
Paki
stan
Micr
ofin
ance
Rev
iew
201
4
49
Section 3
Fina
ncia
l Ser
vice
s fo
r all
Annu
al A
sses
smen
t of t
he M
icrof
inan
ce In
dust
ry
50
Annexures
Annexures
Annexures
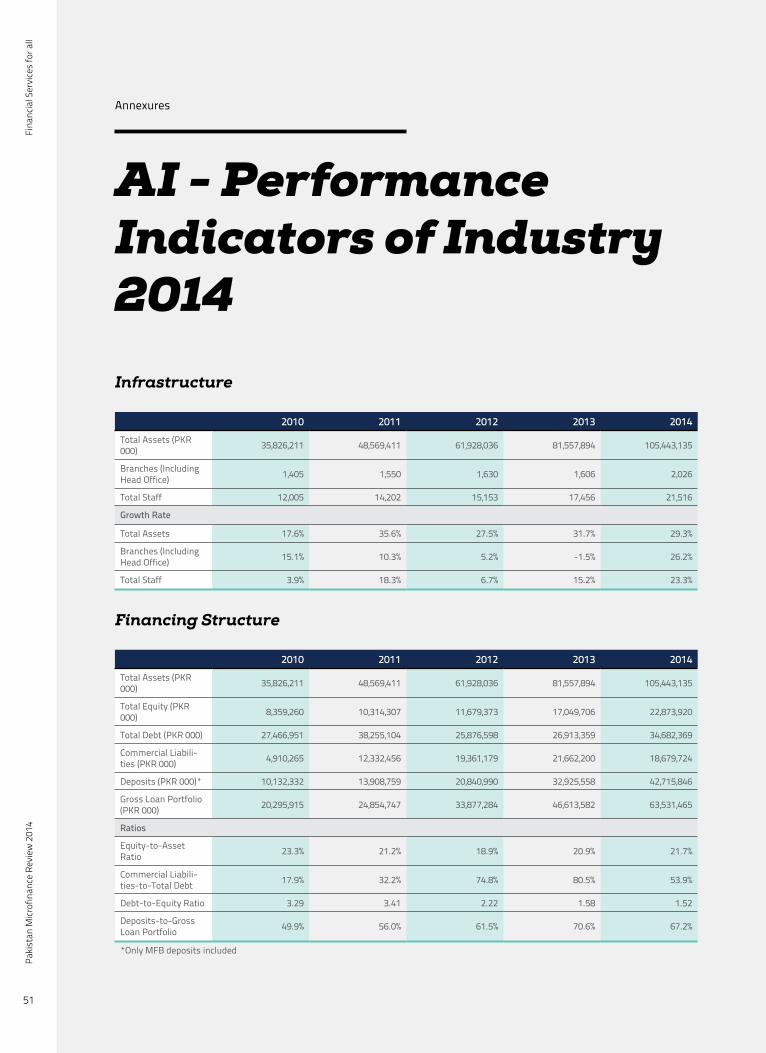
Fina
ncia
l Ser
vice
s fo
r all
Paki
stan
Micr
ofin
ance
Rev
iew
201
4
51
Annexures
AI - Performance Indicators of Industry 2014
Infrastructure
2010 2011 2012 2013 2014Total Assets (PKR 000) 35,826,211 48,569,411 61,928,036 81,557,894 105,443,135
Branches (Including Head Office) 1,405 1,550 1,630 1,606 2,026
Total Staff 12,005 14,202 15,153 17,456 21,516
Growth Rate
Total Assets 17.6% 35.6% 27.5% 31.7% 29.3%
Branches (Including Head Office) 15.1% 10.3% 5.2% -1.5% 26.2%
Total Staff 3.9% 18.3% 6.7% 15.2% 23.3%
Financing Structure
2010 2011 2012 2013 2014Total Assets (PKR 000) 35,826,211 48,569,411 61,928,036 81,557,894 105,443,135
Total Equity (PKR 000) 8,359,260 10,314,307 11,679,373 17,049,706 22,873,920
Total Debt (PKR 000) 27,466,951 38,255,104 25,876,598 26,913,359 34,682,369
Commercial Liabili-ties (PKR 000) 4,910,265 12,332,456 19,361,179 21,662,200 18,679,724
Deposits (PKR 000)* 10,132,332 13,908,759 20,840,990 32,925,558 42,715,846
Gross Loan Portfolio (PKR 000) 20,295,915 24,854,747 33,877,284 46,613,582 63,531,465
Ratios
Equity-to-Asset Ratio 23.3% 21.2% 18.9% 20.9% 21.7%
Commercial Liabili-ties-to-Total Debt 17.9% 32.2% 74.8% 80.5% 53.9%
Debt-to-Equity Ratio 3.29 3.41 2.22 1.58 1.52
Deposits-to-Gross Loan Portfolio 49.9% 56.0% 61.5% 70.6% 67.2%
*Only MFB deposits included
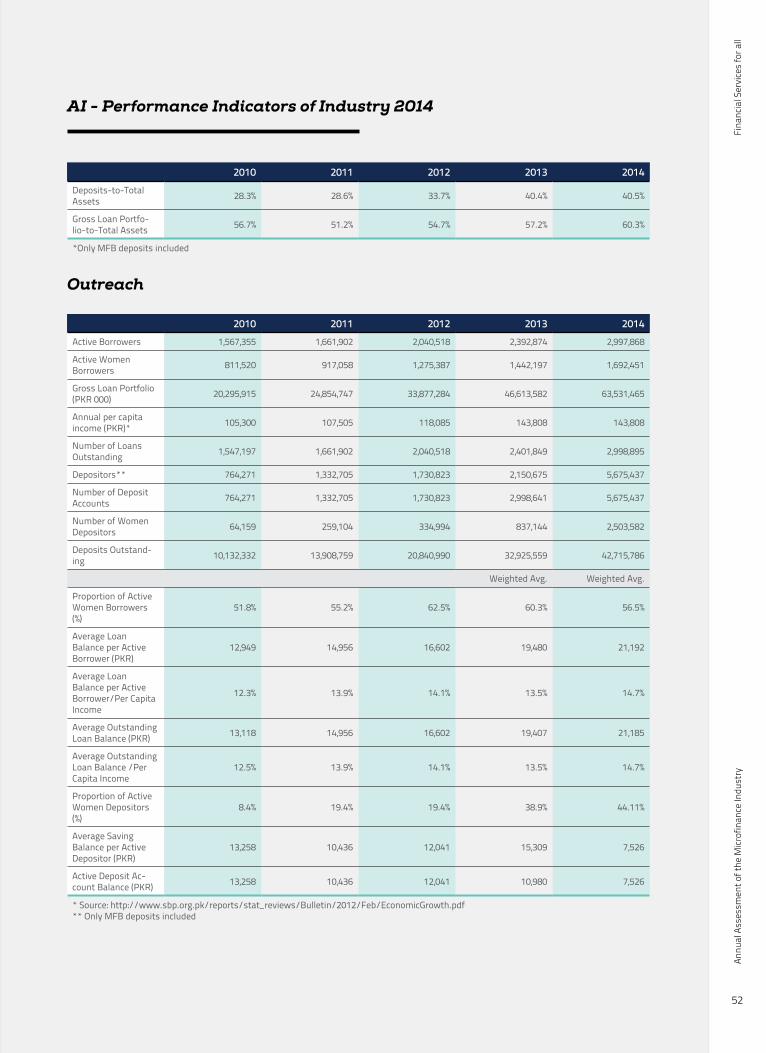
Fina
ncia
l Ser
vice
s fo
r all
Annu
al A
sses
smen
t of t
he M
icrof
inan
ce In
dust
ry
52
AI - Performance Indicators of Industry 2014
2010 2011 2012 2013 2014Deposits-to-Total Assets 28.3% 28.6% 33.7% 40.4% 40.5%
Gross Loan Portfo-lio-to-Total Assets 56.7% 51.2% 54.7% 57.2% 60.3%
*Only MFB deposits included
Outreach
2010 2011 2012 2013 2014Active Borrowers 1,567,355 1,661,902 2,040,518 2,392,874 2,997,868
Active Women Borrowers 811,520 917,058 1,275,387 1,442,197 1,692,451
Gross Loan Portfolio (PKR 000) 20,295,915 24,854,747 33,877,284 46,613,582 63,531,465
Annual per capita income (PKR)* 105,300 107,505 118,085 143,808 143,808
Number of Loans Outstanding 1,547,197 1,661,902 2,040,518 2,401,849 2,998,895
Depositors** 764,271 1,332,705 1,730,823 2,150,675 5,675,437
Number of Deposit Accounts 764,271 1,332,705 1,730,823 2,998,641 5,675,437
Number of Women Depositors 64,159 259,104 334,994 837,144 2,503,582
Deposits Outstand-ing 10,132,332 13,908,759 20,840,990 32,925,559 42,715,786
Weighted Avg. Weighted Avg.
Proportion of Active Women Borrowers (%)
51.8% 55.2% 62.5% 60.3% 56.5%
Average Loan Balance per Active Borrower (PKR)
12,949 14,956 16,602 19,480 21,192
Average Loan Balance per Active Borrower/Per Capita Income
12.3% 13.9% 14.1% 13.5% 14.7%
Average Outstanding Loan Balance (PKR) 13,118 14,956 16,602 19,407 21,185
Average Outstanding Loan Balance /Per Capita Income
12.5% 13.9% 14.1% 13.5% 14.7%
Proportion of Active Women Depositors (%)
8.4% 19.4% 19.4% 38.9% 44.11%
Average Saving Balance per Active Depositor (PKR)
13,258 10,436 12,041 15,309 7,526
Active Deposit Ac-count Balance (PKR) 13,258 10,436 12,041 10,980 7,526
* Source: http://www.sbp.org.pk/reports/stat_reviews/Bulletin/2012/Feb/EconomicGrowth.pdf** Only MFB deposits included
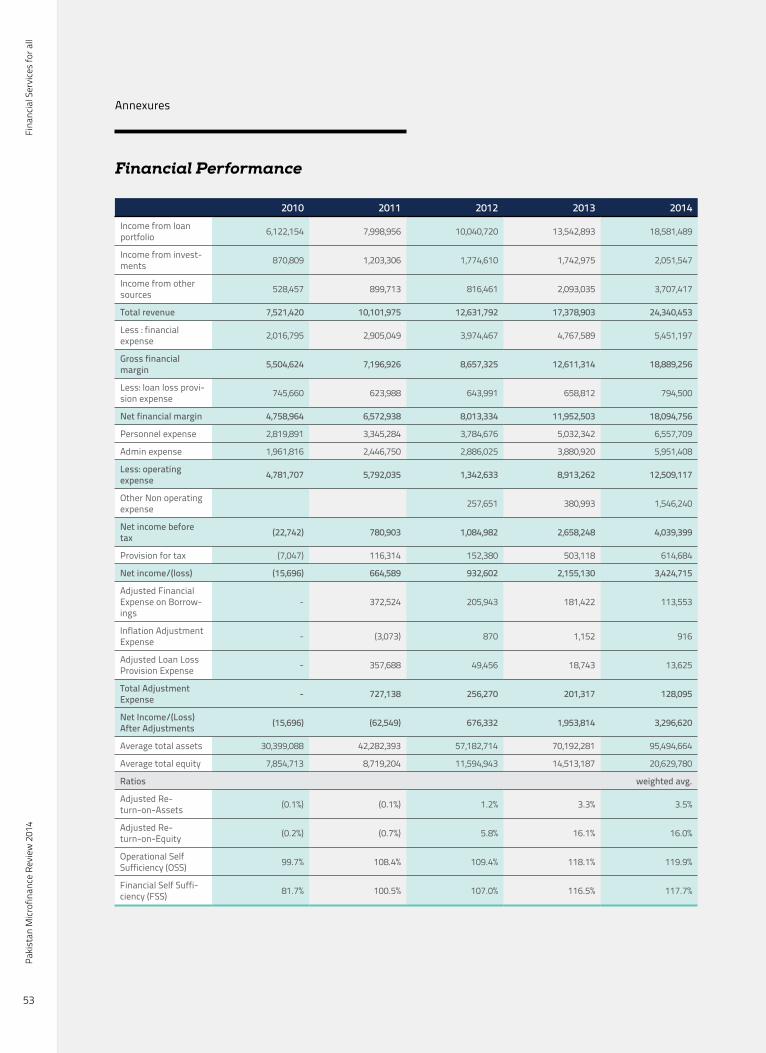
Fina
ncia
l Ser
vice
s fo
r all
Paki
stan
Micr
ofin
ance
Rev
iew
201
4
53
Annexures
Financial Performance
2010 2011 2012 2013 2014Income from loan portfolio 6,122,154 7,998,956 10,040,720 13,542,893 18,581,489
Income from invest-ments 870,809 1,203,306 1,774,610 1,742,975 2,051,547
Income from other sources 528,457 899,713 816,461 2,093,035 3,707,417
Total revenue 7,521,420 10,101,975 12,631,792 17,378,903 24,340,453
Less : financial expense 2,016,795 2,905,049 3,974,467 4,767,589 5,451,197
Gross financial margin 5,504,624 7,196,926 8,657,325 12,611,314 18,889,256
Less: loan loss provi-sion expense 745,660 623,988 643,991 658,812 794,500
Net financial margin 4,758,964 6,572,938 8,013,334 11,952,503 18,094,756
Personnel expense 2,819,891 3,345,284 3,784,676 5,032,342 6,557,709
Admin expense 1,961,816 2,446,750 2,886,025 3,880,920 5,951,408
Less: operating expense 4,781,707 5,792,035 1,342,633 8,913,262 12,509,117
Other Non operating expense 257,651 380,993 1,546,240
Net income before tax (22,742) 780,903 1,084,982 2,658,248 4,039,399
Provision for tax (7,047) 116,314 152,380 503,118 614,684
Net income/(loss) (15,696) 664,589 932,602 2,155,130 3,424,715
Adjusted Financial Expense on Borrow-ings
- 372,524 205,943 181,422 113,553
Inflation Adjustment Expense - (3,073) 870 1,152 916
Adjusted Loan Loss Provision Expense - 357,688 49,456 18,743 13,625
Total Adjustment Expense - 727,138 256,270 201,317 128,095
Net Income/(Loss) After Adjustments (15,696) (62,549) 676,332 1,953,814 3,296,620
Average total assets 30,399,088 42,282,393 57,182,714 70,192,281 95,494,664
Average total equity 7,854,713 8,719,204 11,594,943 14,513,187 20,629,780
Ratios weighted avg.
Adjusted Re-turn-on-Assets (0.1%) (0.1%) 1.2% 3.3% 3.5%
Adjusted Re-turn-on-Equity (0.2%) (0.7%) 5.8% 16.1% 16.0%
Operational Self Sufficiency (OSS) 99.7% 108.4% 109.4% 118.1% 119.9%
Financial Self Suffi-ciency (FSS) 81.7% 100.5% 107.0% 116.5% 117.7%
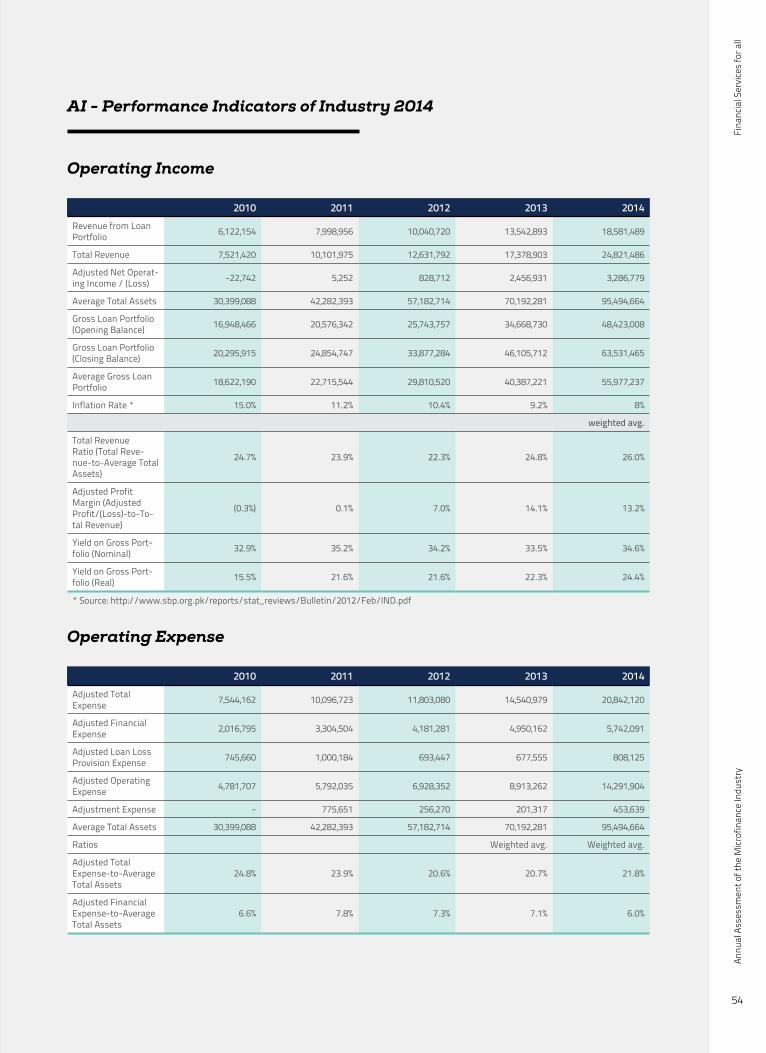
Fina
ncia
l Ser
vice
s fo
r all
Annu
al A
sses
smen
t of t
he M
icrof
inan
ce In
dust
ry
54
AI - Performance Indicators of Industry 2014
Operating Income
2010 2011 2012 2013 2014Revenue from Loan Portfolio 6,122,154 7,998,956 10,040,720 13,542,893 18,581,489
Total Revenue 7,521,420 10,101,975 12,631,792 17,378,903 24,821,486
Adjusted Net Operat-ing Income / (Loss) -22,742 5,252 828,712 2,456,931 3,286,779
Average Total Assets 30,399,088 42,282,393 57,182,714 70,192,281 95,494,664
Gross Loan Portfolio (Opening Balance) 16,948,466 20,576,342 25,743,757 34,668,730 48,423,008
Gross Loan Portfolio (Closing Balance) 20,295,915 24,854,747 33,877,284 46,105,712 63,531,465
Average Gross Loan Portfolio 18,622,190 22,715,544 29,810,520 40,387,221 55,977,237
Inflation Rate * 15.0% 11.2% 10.4% 9.2% 8%
weighted avg.
Total Revenue Ratio (Total Reve-nue-to-Average Total Assets)
24.7% 23.9% 22.3% 24.8% 26.0%
Adjusted Profit Margin (Adjusted Profit/(Loss)-to-To-tal Revenue)
(0.3%) 0.1% 7.0% 14.1% 13.2%
Yield on Gross Port-folio (Nominal) 32.9% 35.2% 34.2% 33.5% 34.6%
Yield on Gross Port-folio (Real) 15.5% 21.6% 21.6% 22.3% 24.4%
* Source: http://www.sbp.org.pk/reports/stat_reviews/Bulletin/2012/Feb/IND.pdf
Operating Expense
2010 2011 2012 2013 2014Adjusted Total Expense 7,544,162 10,096,723 11,803,080 14,540,979 20,842,120
Adjusted Financial Expense 2,016,795 3,304,504 4,181,281 4,950,162 5,742,091
Adjusted Loan Loss Provision Expense 745,660 1,000,184 693,447 677,555 808,125
Adjusted Operating Expense 4,781,707 5,792,035 6,928,352 8,913,262 14,291,904
Adjustment Expense - 775,651 256,270 201,317 453,639
Average Total Assets 30,399,088 42,282,393 57,182,714 70,192,281 95,494,664
Ratios Weighted avg. Weighted avg.
Adjusted Total Expense-to-Average Total Assets
24.8% 23.9% 20.6% 20.7% 21.8%
Adjusted Financial Expense-to-Average Total Assets
6.6% 7.8% 7.3% 7.1% 6.0%
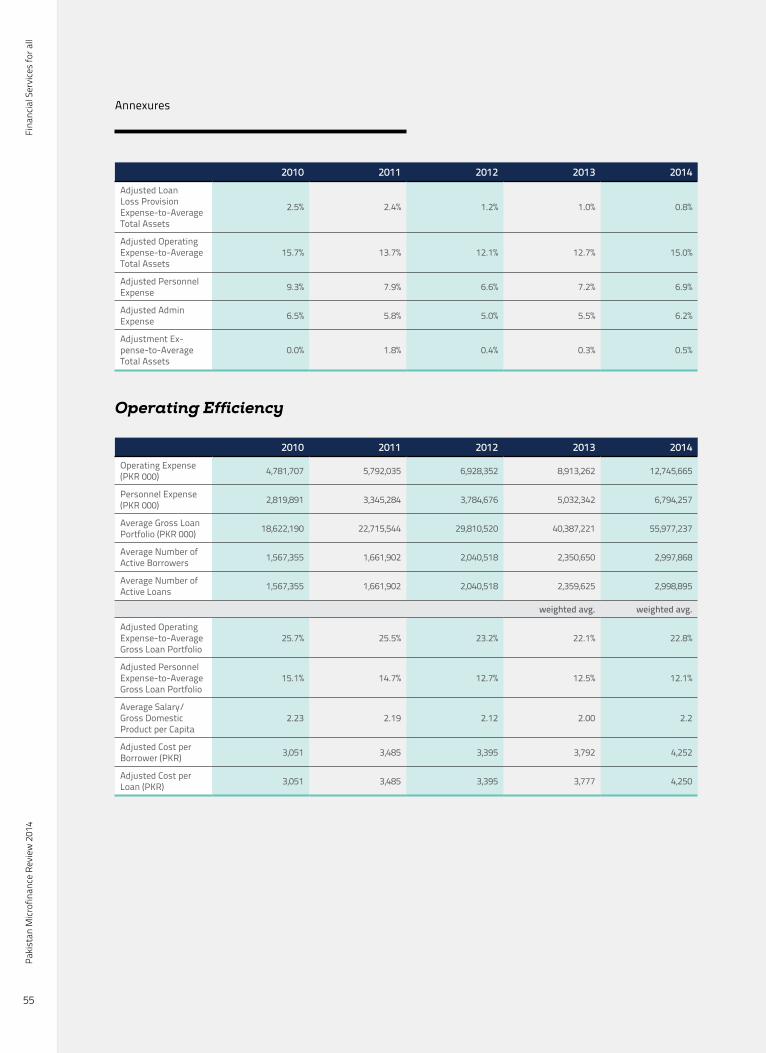
Fina
ncia
l Ser
vice
s fo
r all
Paki
stan
Micr
ofin
ance
Rev
iew
201
4
55
Annexures
2010 2011 2012 2013 2014Adjusted Loan Loss Provision Expense-to-Average Total Assets
2.5% 2.4% 1.2% 1.0% 0.8%
Adjusted Operating Expense-to-Average Total Assets
15.7% 13.7% 12.1% 12.7% 15.0%
Adjusted Personnel Expense 9.3% 7.9% 6.6% 7.2% 6.9%
Adjusted Admin Expense 6.5% 5.8% 5.0% 5.5% 6.2%
Adjustment Ex-pense-to-Average Total Assets
0.0% 1.8% 0.4% 0.3% 0.5%
Operating Efficiency
2010 2011 2012 2013 2014Operating Expense (PKR 000) 4,781,707 5,792,035 6,928,352 8,913,262 12,745,665
Personnel Expense (PKR 000) 2,819,891 3,345,284 3,784,676 5,032,342 6,794,257
Average Gross Loan Portfolio (PKR 000) 18,622,190 22,715,544 29,810,520 40,387,221 55,977,237
Average Number of Active Borrowers 1,567,355 1,661,902 2,040,518 2,350,650 2,997,868
Average Number of Active Loans 1,567,355 1,661,902 2,040,518 2,359,625 2,998,895
weighted avg. weighted avg.
Adjusted Operating Expense-to-Average Gross Loan Portfolio
25.7% 25.5% 23.2% 22.1% 22.8%
Adjusted Personnel Expense-to-Average Gross Loan Portfolio
15.1% 14.7% 12.7% 12.5% 12.1%
Average Salary/Gross Domestic Product per Capita
2.23 2.19 2.12 2.00 2.2
Adjusted Cost per Borrower (PKR) 3,051 3,485 3,395 3,792 4,252
Adjusted Cost per Loan (PKR) 3,051 3,485 3,395 3,777 4,250
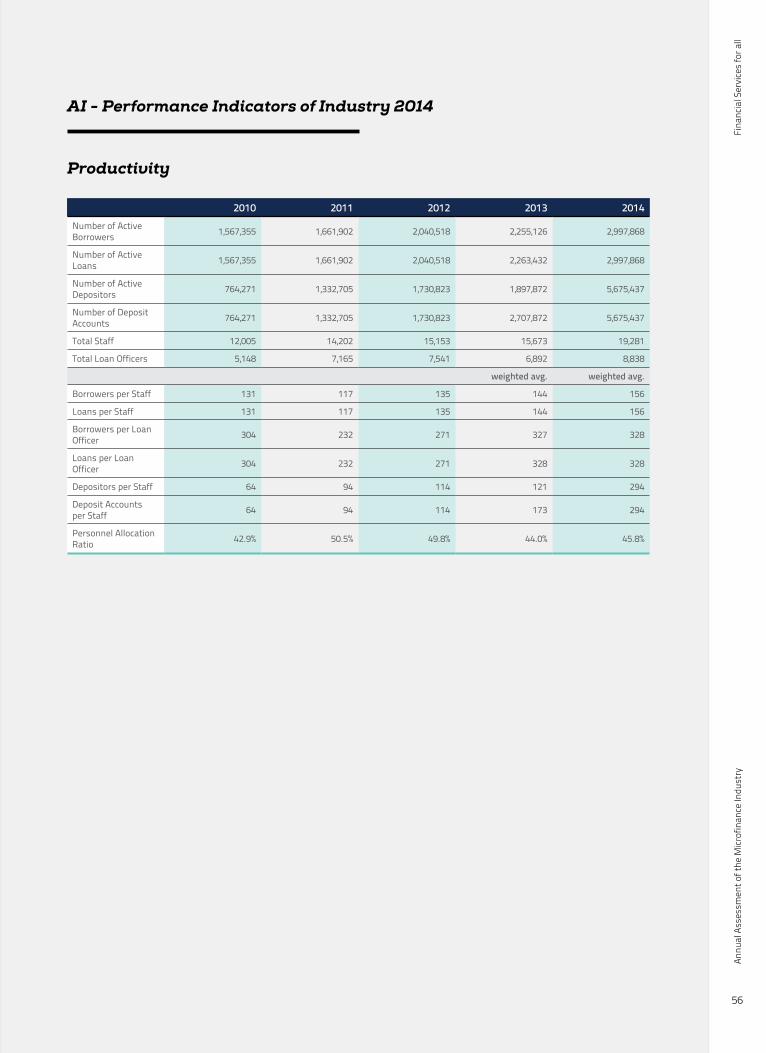
Fina
ncia
l Ser
vice
s fo
r all
Annu
al A
sses
smen
t of t
he M
icrof
inan
ce In
dust
ry
56
AI - Performance Indicators of Industry 2014
Productivity
2010 2011 2012 2013 2014Number of Active Borrowers 1,567,355 1,661,902 2,040,518 2,255,126 2,997,868
Number of Active Loans 1,567,355 1,661,902 2,040,518 2,263,432 2,997,868
Number of Active Depositors 764,271 1,332,705 1,730,823 1,897,872 5,675,437
Number of Deposit Accounts 764,271 1,332,705 1,730,823 2,707,872 5,675,437
Total Staff 12,005 14,202 15,153 15,673 19,281
Total Loan Officers 5,148 7,165 7,541 6,892 8,838
weighted avg. weighted avg.
Borrowers per Staff 131 117 135 144 156
Loans per Staff 131 117 135 144 156
Borrowers per Loan Officer 304 232 271 327 328
Loans per Loan Officer 304 232 271 328 328
Depositors per Staff 64 94 114 121 294
Deposit Accounts per Staff 64 94 114 173 294
Personnel Allocation Ratio 42.9% 50.5% 49.8% 44.0% 45.8%
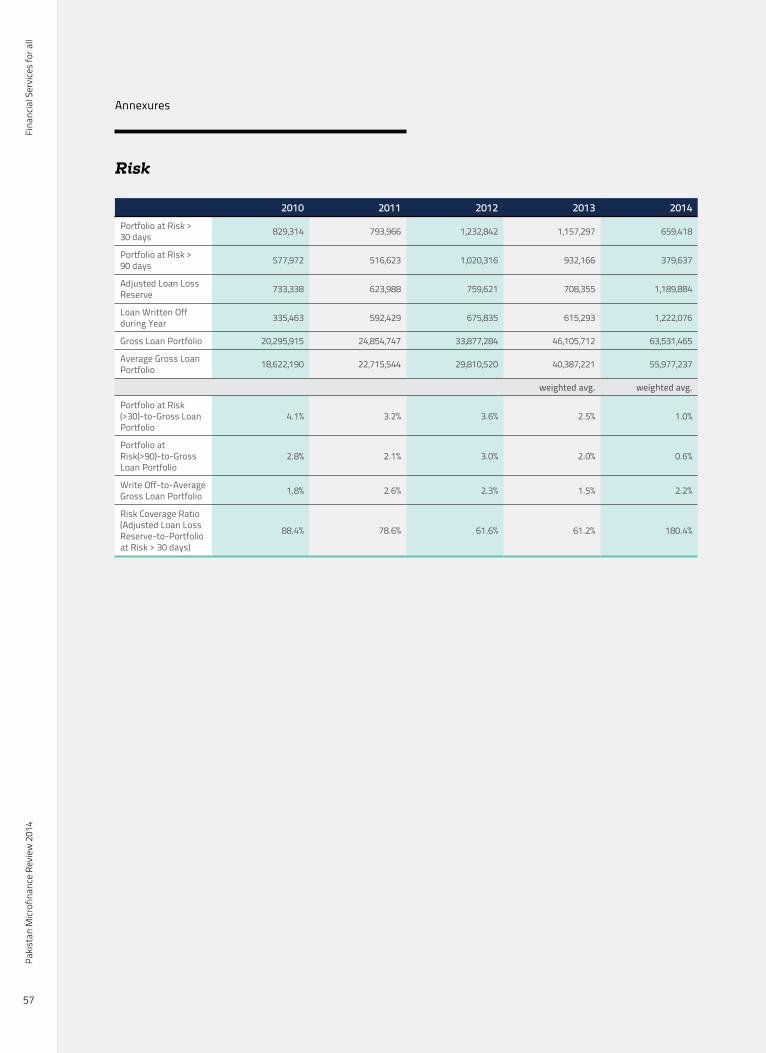
Fina
ncia
l Ser
vice
s fo
r all
Paki
stan
Micr
ofin
ance
Rev
iew
201
4
57
Annexures
Risk
2010 2011 2012 2013 2014Portfolio at Risk > 30 days 829,314 793,966 1,232,842 1,157,297 659,418
Portfolio at Risk > 90 days 577,972 516,623 1,020,316 932,166 379,637
Adjusted Loan Loss Reserve 733,338 623,988 759,621 708,355 1,189,884
Loan Written Off during Year 335,463 592,429 675,835 615,293 1,222,076
Gross Loan Portfolio 20,295,915 24,854,747 33,877,284 46,105,712 63,531,465
Average Gross Loan Portfolio 18,622,190 22,715,544 29,810,520 40,387,221 55,977,237
weighted avg. weighted avg.
Portfolio at Risk (>30)-to-Gross Loan Portfolio
4.1% 3.2% 3.6% 2.5% 1.0%
Portfolio at Risk(>90)-to-Gross Loan Portfolio
2.8% 2.1% 3.0% 2.0% 0.6%
Write Off-to-Average Gross Loan Portfolio 1.8% 2.6% 2.3% 1.5% 2.2%
Risk Coverage Ratio (Adjusted Loan Loss Reserve-to-Portfolio at Risk > 30 days)
88.4% 78.6% 61.6% 61.2% 180.4%

Fina
ncia
l Ser
vice
s fo
r all
Annu
al A
sses
smen
t of t
he M
icrof
inan
ce In
dust
ry
58
AI - Performance Indicators of Industry 2014

Fina
ncia
l Ser
vice
s fo
r all
Paki
stan
Micr
ofin
ance
Rev
iew
201
4
59
Annexures
AII - Performance Indicators of Individual MFPs 2014
Infrastructure
MFBKBL TMFB POMFB FMFB NRSP-B FINCA
Total Assets (PKR 000) 16,692,434 16,393,293 1,114,932 10,674,730 11,797,616 6,380,471
Total Equity (PKR 000) 3,285,461 2,843,921 1,069,234 1,237,139 2,126,104 1,263,975
Total Liabilities (PKR 000) 13,406,972 13,549,372 45,698 9,437,591 9,671,512 5,116,495
Branches (including Head Office) 118 149 16 100 58 100
Personnel 2,622 2,058 206 1,169 1,429 1,268
MFBAMFB WASEELA U-Bank Sub
Total Assets (PKR 000) 1,758,955 2,540,847 1,832,009 69,185,285
Total Equity (PKR 000) 542,609 1,036,330 956,749 14,361,522
Total Liabilities (PKR 000) 1,216,346 1,504,517 875,260 54,823,764
Branches (including Head Office) 17 41 28 627
Personnel 271 412 338 9,773
MFIOCT KASHF SAFCO DAMEN CSC GBTI
Total Assets (PKR 000) 681,771 5,311,217 611,905 1,331,084 747,631 125,416
Total Equity (PKR 000) 283,345 414,033 93,172 251,241 62,629 98,135
Total Liabilities (PKR 000) 398,426 4,897,184 518,733 1,079,843 685,003 27,281
Branches (including Head Office) 21 178 27 30 17 13
Personnel 100 2,064 245 228 180 67
MFIFFO ASA-P BRAC-P JWS Sungi ORIX
Total Assets (PKR 000) 350,324 2,810,461 1,238,183 725,716 114,187 360,506
Total Equity (PKR 000) 17,024 1,140,198 113,310 236,474 90,243 65,249
Total Liabilities (PKR 000) 333,299 1,670,263 1,124,873 489,243 23,914 295,257
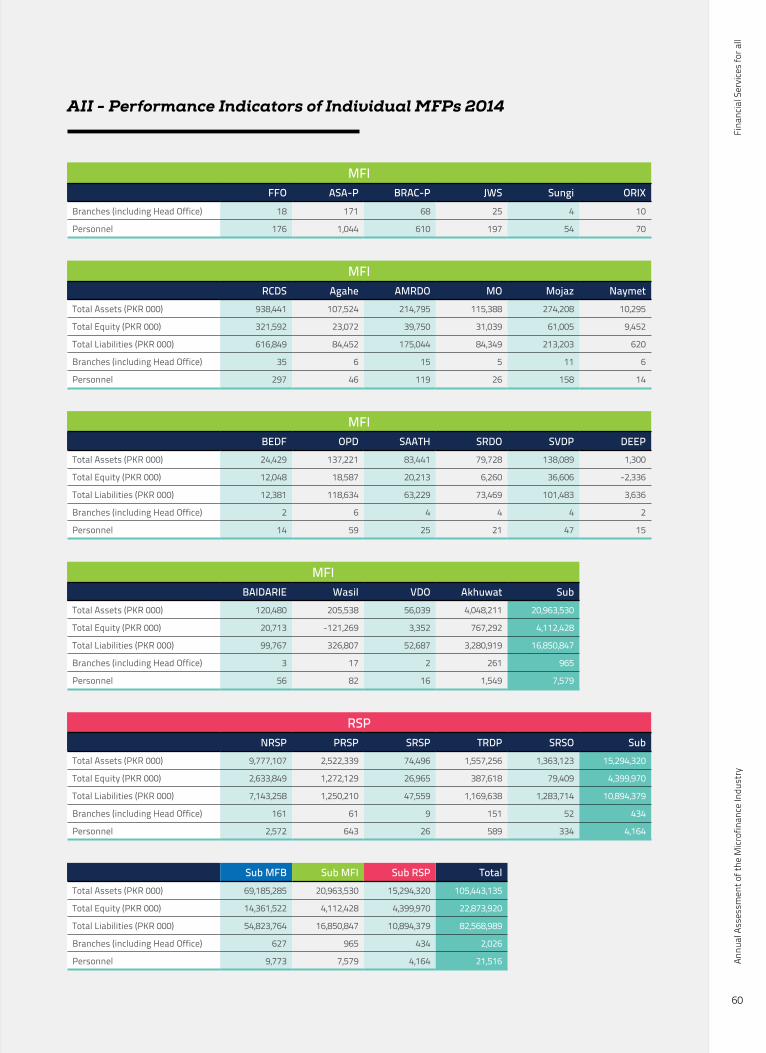
Fina
ncia
l Ser
vice
s fo
r all
Annu
al A
sses
smen
t of t
he M
icrof
inan
ce In
dust
ry
60
AII - Performance Indicators of Individual MFPs 2014
MFIFFO ASA-P BRAC-P JWS Sungi ORIX
Branches (including Head Office) 18 171 68 25 4 10
Personnel 176 1,044 610 197 54 70
MFIRCDS Agahe AMRDO MO Mojaz Naymet
Total Assets (PKR 000) 938,441 107,524 214,795 115,388 274,208 10,295
Total Equity (PKR 000) 321,592 23,072 39,750 31,039 61,005 9,452
Total Liabilities (PKR 000) 616,849 84,452 175,044 84,349 213,203 620
Branches (including Head Office) 35 6 15 5 11 6
Personnel 297 46 119 26 158 14
MFIBEDF OPD SAATH SRDO SVDP DEEP
Total Assets (PKR 000) 24,429 137,221 83,441 79,728 138,089 1,300
Total Equity (PKR 000) 12,048 18,587 20,213 6,260 36,606 -2,336
Total Liabilities (PKR 000) 12,381 118,634 63,229 73,469 101,483 3,636
Branches (including Head Office) 2 6 4 4 4 2
Personnel 14 59 25 21 47 15
MFIBAIDARIE Wasil VDO Akhuwat Sub
Total Assets (PKR 000) 120,480 205,538 56,039 4,048,211 20,963,530
Total Equity (PKR 000) 20,713 -121,269 3,352 767,292 4,112,428
Total Liabilities (PKR 000) 99,767 326,807 52,687 3,280,919 16,850,847
Branches (including Head Office) 3 17 2 261 965
Personnel 56 82 16 1,549 7,579
RSPNRSP PRSP SRSP TRDP SRSO Sub
Total Assets (PKR 000) 9,777,107 2,522,339 74,496 1,557,256 1,363,123 15,294,320
Total Equity (PKR 000) 2,633,849 1,272,129 26,965 387,618 79,409 4,399,970
Total Liabilities (PKR 000) 7,143,258 1,250,210 47,559 1,169,638 1,283,714 10,894,379
Branches (including Head Office) 161 61 9 151 52 434
Personnel 2,572 643 26 589 334 4,164
Sub MFB Sub MFI Sub RSP Total Total Assets (PKR 000) 69,185,285 20,963,530 15,294,320 105,443,135
Total Equity (PKR 000) 14,361,522 4,112,428 4,399,970 22,873,920
Total Liabilities (PKR 000) 54,823,764 16,850,847 10,894,379 82,568,989
Branches (including Head Office) 627 965 434 2,026
Personnel 9,773 7,579 4,164 21,516
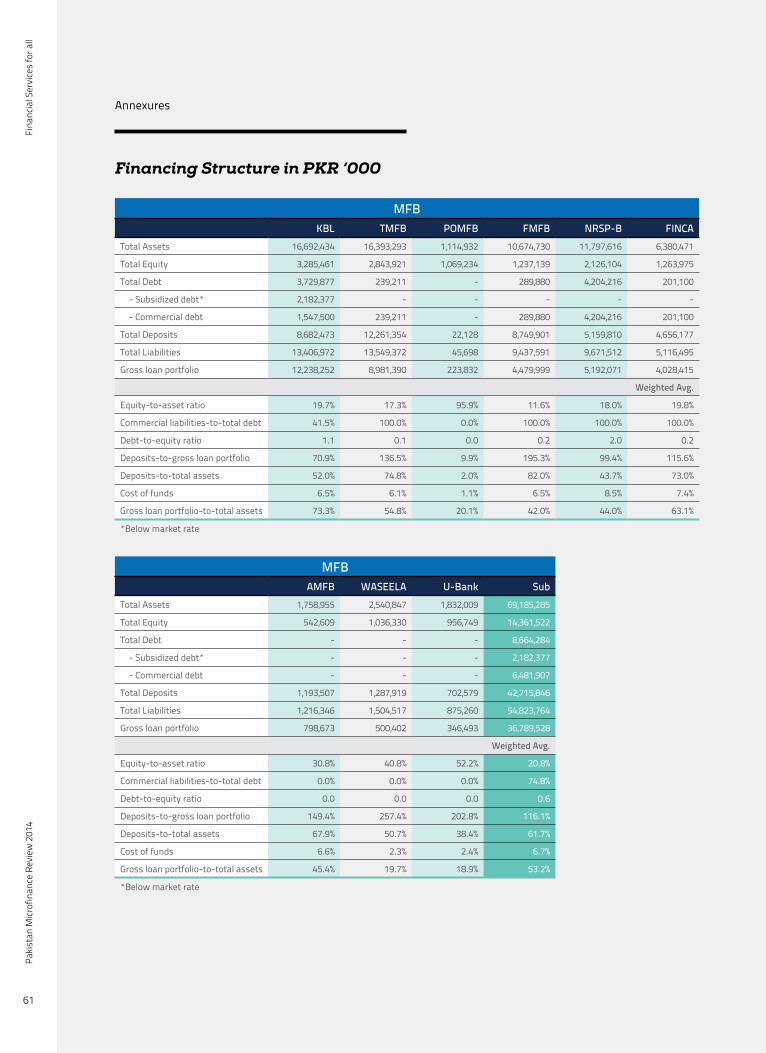
Fina
ncia
l Ser
vice
s fo
r all
Paki
stan
Micr
ofin
ance
Rev
iew
201
4
61
Annexures
Financing Structure in PKR ‘000
MFBKBL TMFB POMFB FMFB NRSP-B FINCA
Total Assets 16,692,434 16,393,293 1,114,932 10,674,730 11,797,616 6,380,471
Total Equity 3,285,461 2,843,921 1,069,234 1,237,139 2,126,104 1,263,975
Total Debt 3,729,877 239,211 - 289,880 4,204,216 201,100
- Subsidized debt* 2,182,377 - - - - -
- Commercial debt 1,547,500 239,211 - 289,880 4,204,216 201,100
Total Deposits 8,682,473 12,261,354 22,128 8,749,901 5,159,810 4,656,177
Total Liabilities 13,406,972 13,549,372 45,698 9,437,591 9,671,512 5,116,495
Gross loan portfolio 12,238,252 8,981,390 223,832 4,479,999 5,192,071 4,028,415
Weighted Avg.
Equity-to-asset ratio 19.7% 17.3% 95.9% 11.6% 18.0% 19.8%
Commercial liabilities-to-total debt 41.5% 100.0% 0.0% 100.0% 100.0% 100.0%
Debt-to-equity ratio 1.1 0.1 0.0 0.2 2.0 0.2
Deposits-to-gross loan portfolio 70.9% 136.5% 9.9% 195.3% 99.4% 115.6%
Deposits-to-total assets 52.0% 74.8% 2.0% 82.0% 43.7% 73.0%
Cost of funds 6.5% 6.1% 1.1% 6.5% 8.5% 7.4%
Gross loan portfolio-to-total assets 73.3% 54.8% 20.1% 42.0% 44.0% 63.1%
*Below market rate
MFBAMFB WASEELA U-Bank Sub
Total Assets 1,758,955 2,540,847 1,832,009 69,185,285
Total Equity 542,609 1,036,330 956,749 14,361,522
Total Debt - - - 8,664,284
- Subsidized debt* - - - 2,182,377
- Commercial debt - - - 6,481,907
Total Deposits 1,193,507 1,287,919 702,579 42,715,846
Total Liabilities 1,216,346 1,504,517 875,260 54,823,764
Gross loan portfolio 798,673 500,402 346,493 36,789,528
Weighted Avg.
Equity-to-asset ratio 30.8% 40.8% 52.2% 20.8%
Commercial liabilities-to-total debt 0.0% 0.0% 0.0% 74.8%
Debt-to-equity ratio 0.0 0.0 0.0 0.6
Deposits-to-gross loan portfolio 149.4% 257.4% 202.8% 116.1%
Deposits-to-total assets 67.9% 50.7% 38.4% 61.7%
Cost of funds 6.6% 2.3% 2.4% 6.7%
Gross loan portfolio-to-total assets 45.4% 19.7% 18.9% 53.2%
*Below market rate
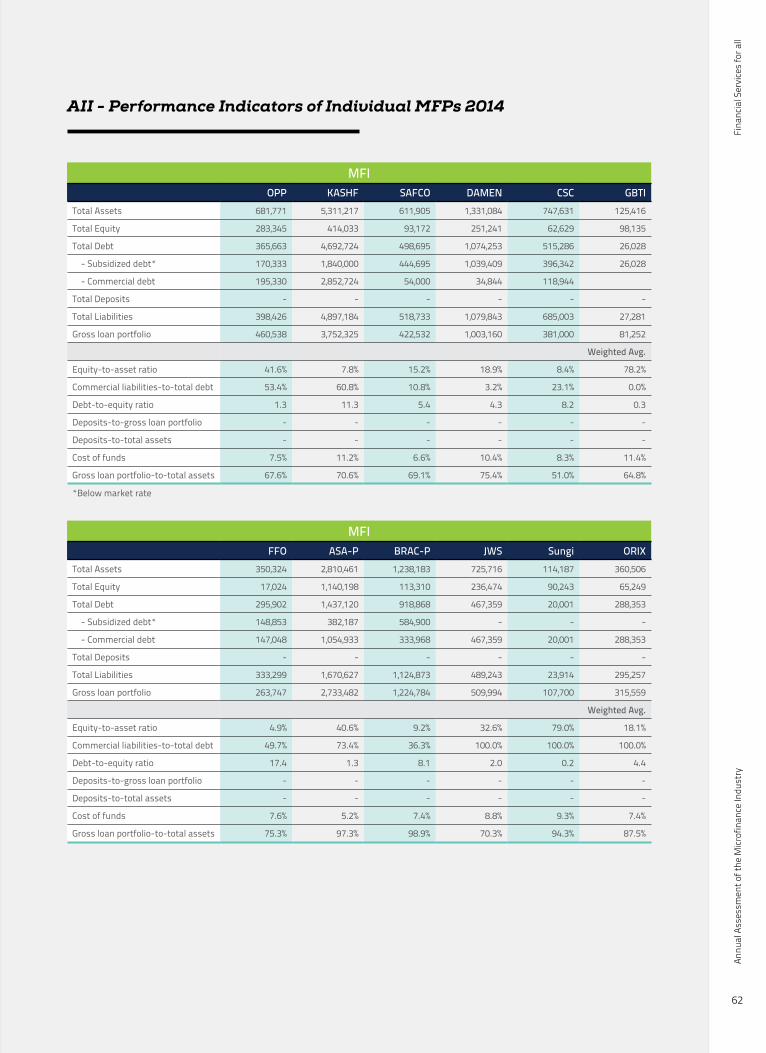
Fina
ncia
l Ser
vice
s fo
r all
Annu
al A
sses
smen
t of t
he M
icrof
inan
ce In
dust
ry
62
AII - Performance Indicators of Individual MFPs 2014
MFIOPP KASHF SAFCO DAMEN CSC GBTI
Total Assets 681,771 5,311,217 611,905 1,331,084 747,631 125,416
Total Equity 283,345 414,033 93,172 251,241 62,629 98,135
Total Debt 365,663 4,692,724 498,695 1,074,253 515,286 26,028
- Subsidized debt* 170,333 1,840,000 444,695 1,039,409 396,342 26,028
- Commercial debt 195,330 2,852,724 54,000 34,844 118,944
Total Deposits - - - - - -
Total Liabilities 398,426 4,897,184 518,733 1,079,843 685,003 27,281
Gross loan portfolio 460,538 3,752,325 422,532 1,003,160 381,000 81,252
Weighted Avg.
Equity-to-asset ratio 41.6% 7.8% 15.2% 18.9% 8.4% 78.2%
Commercial liabilities-to-total debt 53.4% 60.8% 10.8% 3.2% 23.1% 0.0%
Debt-to-equity ratio 1.3 11.3 5.4 4.3 8.2 0.3
Deposits-to-gross loan portfolio - - - - - -
Deposits-to-total assets - - - - - -
Cost of funds 7.5% 11.2% 6.6% 10.4% 8.3% 11.4%
Gross loan portfolio-to-total assets 67.6% 70.6% 69.1% 75.4% 51.0% 64.8%
*Below market rate
MFIFFO ASA-P BRAC-P JWS Sungi ORIX
Total Assets 350,324 2,810,461 1,238,183 725,716 114,187 360,506
Total Equity 17,024 1,140,198 113,310 236,474 90,243 65,249
Total Debt 295,902 1,437,120 918,868 467,359 20,001 288,353
- Subsidized debt* 148,853 382,187 584,900 - - -
- Commercial debt 147,048 1,054,933 333,968 467,359 20,001 288,353
Total Deposits - - - - - -
Total Liabilities 333,299 1,670,627 1,124,873 489,243 23,914 295,257
Gross loan portfolio 263,747 2,733,482 1,224,784 509,994 107,700 315,559
Weighted Avg.
Equity-to-asset ratio 4.9% 40.6% 9.2% 32.6% 79.0% 18.1%
Commercial liabilities-to-total debt 49.7% 73.4% 36.3% 100.0% 100.0% 100.0%
Debt-to-equity ratio 17.4 1.3 8.1 2.0 0.2 4.4
Deposits-to-gross loan portfolio - - - - - -
Deposits-to-total assets - - - - - -
Cost of funds 7.6% 5.2% 7.4% 8.8% 9.3% 7.4%
Gross loan portfolio-to-total assets 75.3% 97.3% 98.9% 70.3% 94.3% 87.5%
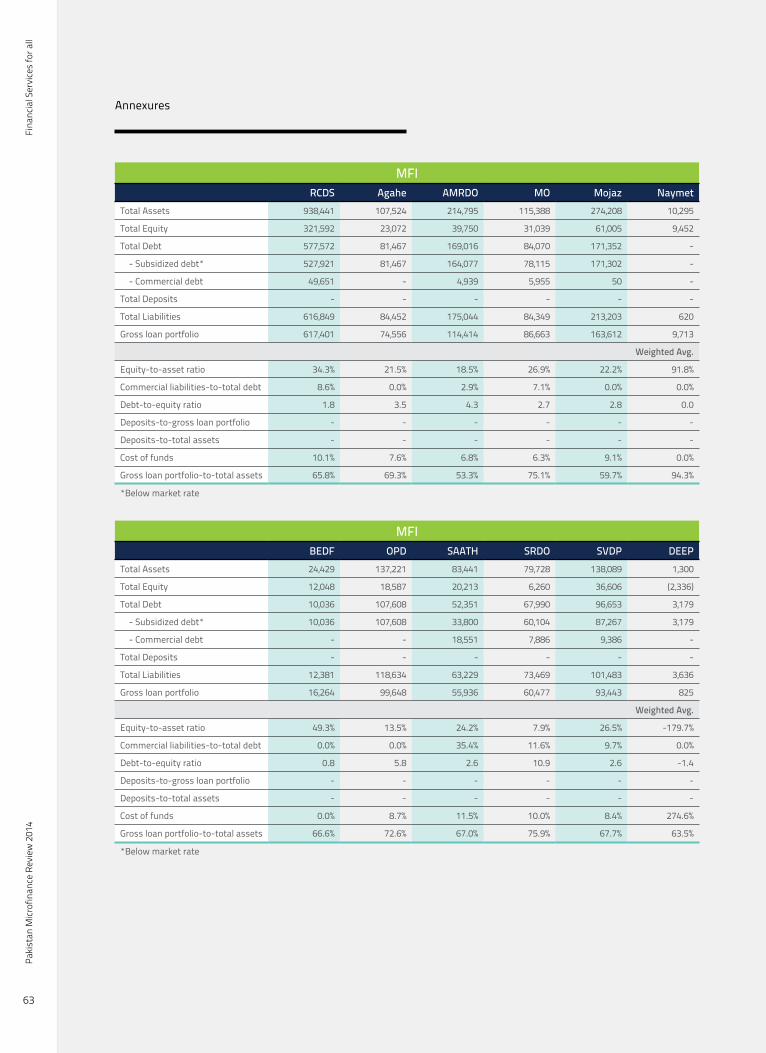
Fina
ncia
l Ser
vice
s fo
r all
Paki
stan
Micr
ofin
ance
Rev
iew
201
4
63
Annexures
MFIRCDS Agahe AMRDO MO Mojaz Naymet
Total Assets 938,441 107,524 214,795 115,388 274,208 10,295
Total Equity 321,592 23,072 39,750 31,039 61,005 9,452
Total Debt 577,572 81,467 169,016 84,070 171,352 -
- Subsidized debt* 527,921 81,467 164,077 78,115 171,302 -
- Commercial debt 49,651 - 4,939 5,955 50 -
Total Deposits - - - - - -
Total Liabilities 616,849 84,452 175,044 84,349 213,203 620
Gross loan portfolio 617,401 74,556 114,414 86,663 163,612 9,713
Weighted Avg.
Equity-to-asset ratio 34.3% 21.5% 18.5% 26.9% 22.2% 91.8%
Commercial liabilities-to-total debt 8.6% 0.0% 2.9% 7.1% 0.0% 0.0%
Debt-to-equity ratio 1.8 3.5 4.3 2.7 2.8 0.0
Deposits-to-gross loan portfolio - - - - - -
Deposits-to-total assets - - - - - -
Cost of funds 10.1% 7.6% 6.8% 6.3% 9.1% 0.0%
Gross loan portfolio-to-total assets 65.8% 69.3% 53.3% 75.1% 59.7% 94.3%
*Below market rate
MFIBEDF OPD SAATH SRDO SVDP DEEP
Total Assets 24,429 137,221 83,441 79,728 138,089 1,300
Total Equity 12,048 18,587 20,213 6,260 36,606 (2,336)
Total Debt 10,036 107,608 52,351 67,990 96,653 3,179
- Subsidized debt* 10,036 107,608 33,800 60,104 87,267 3,179
- Commercial debt - - 18,551 7,886 9,386 -
Total Deposits - - - - - -
Total Liabilities 12,381 118,634 63,229 73,469 101,483 3,636
Gross loan portfolio 16,264 99,648 55,936 60,477 93,443 825
Weighted Avg.
Equity-to-asset ratio 49.3% 13.5% 24.2% 7.9% 26.5% -179.7%
Commercial liabilities-to-total debt 0.0% 0.0% 35.4% 11.6% 9.7% 0.0%
Debt-to-equity ratio 0.8 5.8 2.6 10.9 2.6 -1.4
Deposits-to-gross loan portfolio - - - - - -
Deposits-to-total assets - - - - - -
Cost of funds 0.0% 8.7% 11.5% 10.0% 8.4% 274.6%
Gross loan portfolio-to-total assets 66.6% 72.6% 67.0% 75.9% 67.7% 63.5%
*Below market rate

Fina
ncia
l Ser
vice
s fo
r all
Annu
al A
sses
smen
t of t
he M
icrof
inan
ce In
dust
ry
64
AII - Performance Indicators of Individual MFPs 2014
MFIBAIDARIE Wasil VDO Akhuwat Sub
Total Assets 120,480 205,538 56,039 4,048,211 20,963,530
Total Equity 20,713 (121,269) 3,352 767,292 4,112,428
Total Debt 96,088 286,423 27,865 3,248,297 15,680,221
- Subsidized debt* 88,129 286,423 19,084 3,248,297 9,999,558
- Commercial debt 7,959 - 8,782 - 5,680,663
Total Deposits - - - - -
Total Liabilities 99,767 326,807 52,687 3,280,919 16,851,211
Gross loan portfolio 56,105 115,659 29,047 2,465,625 15,315,461
Weighted Avg.
Equity-to-asset ratio 17.2% -59.0% 6.0% 19.0% 19.6%
Commercial liabilities-to-total debt 8.3% 0.0% 31.5% 0.0% 36.2%
Debt-to-equity ratio 4.6 -2.4 8.3 4.2 3.81
Deposits-to-gross loan portfolio - - - - -
Deposits-to-total assets - - - - -
Cost of funds 7.0% 8.9% 19.7% 35.4% 7.3%
Gross loan portfolio-to-total assets 46.6% 56.3% 51.8% 60.9% 73.1%
*Below market rate
RSPNRSP PRSP SRSP TRDP SRSO Sub
Total Assets 9,777,107 2,522,339 74,496 1,557,256 1,363,123 15,294,320
Total Equity 2,633,849 1,272,129 26,965 387,618 79,409 4,399,970
Total Debt 6,844,633 1,064,064 34,500 1,124,667 1,270,000 10,337,864
- Subsidized debt* 2,091,544 - 34,500 974,667 720,000 3,820,710
- Commercial debt 4,753,089 1,064,064 - 150,000 550,000 6,517,153
Total Deposits - - - - - -
Total Liabilities 7,143,258 1,250,210 47,559 1,169,638 1,283,714 10,894,351
Gross loan portfolio 7,653,444 1,149,283 37,519 1,376,726 1,209,504 11,426,476
Weighted Avg.
Equity-to-asset ratio 26.9% 50.4% 36.2% 24.9% 5.8% 28.8%
Commercial liabilities-to-total debt 69.4% 100.0% 0.0% 13.3% 43.3% 63.0%
Debt-to-equity ratio 2.6 0.8 1.3 2.9 16.0 2.35
Deposits-to-gross loan portfolio - - - - - -
Deposits-to-total assets - - - - - -
Cost of funds 8.3% 9.7% 7.0% 8.5% 7.5% 8.3%
Gross loan portfolio-to-total assets 78.3% 45.6% 50.4% 88.4% 88.7% 74.7%
*Below market rate
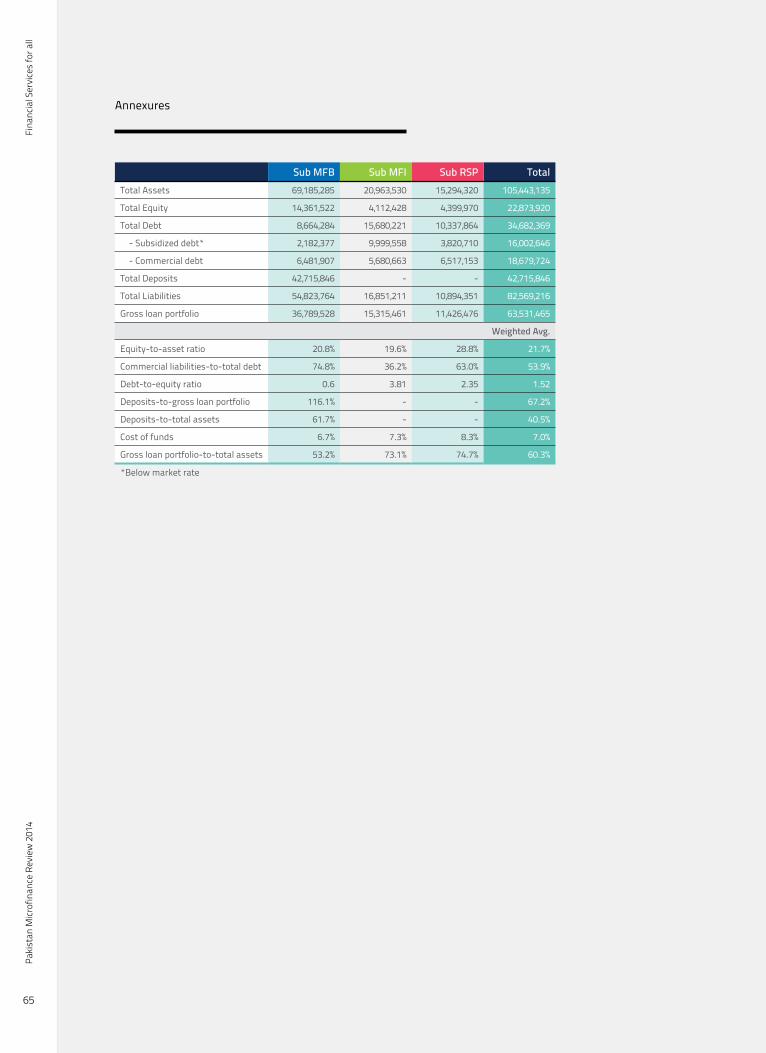
Fina
ncia
l Ser
vice
s fo
r all
Paki
stan
Micr
ofin
ance
Rev
iew
201
4
65
Annexures
Sub MFB Sub MFI Sub RSP TotalTotal Assets 69,185,285 20,963,530 15,294,320 105,443,135
Total Equity 14,361,522 4,112,428 4,399,970 22,873,920
Total Debt 8,664,284 15,680,221 10,337,864 34,682,369
- Subsidized debt* 2,182,377 9,999,558 3,820,710 16,002,646
- Commercial debt 6,481,907 5,680,663 6,517,153 18,679,724
Total Deposits 42,715,846 - - 42,715,846
Total Liabilities 54,823,764 16,851,211 10,894,351 82,569,216
Gross loan portfolio 36,789,528 15,315,461 11,426,476 63,531,465
Weighted Avg.
Equity-to-asset ratio 20.8% 19.6% 28.8% 21.7%
Commercial liabilities-to-total debt 74.8% 36.2% 63.0% 53.9%
Debt-to-equity ratio 0.6 3.81 2.35 1.52
Deposits-to-gross loan portfolio 116.1% - - 67.2%
Deposits-to-total assets 61.7% - - 40.5%
Cost of funds 6.7% 7.3% 8.3% 7.0%
Gross loan portfolio-to-total assets 53.2% 73.1% 74.7% 60.3%
*Below market rate
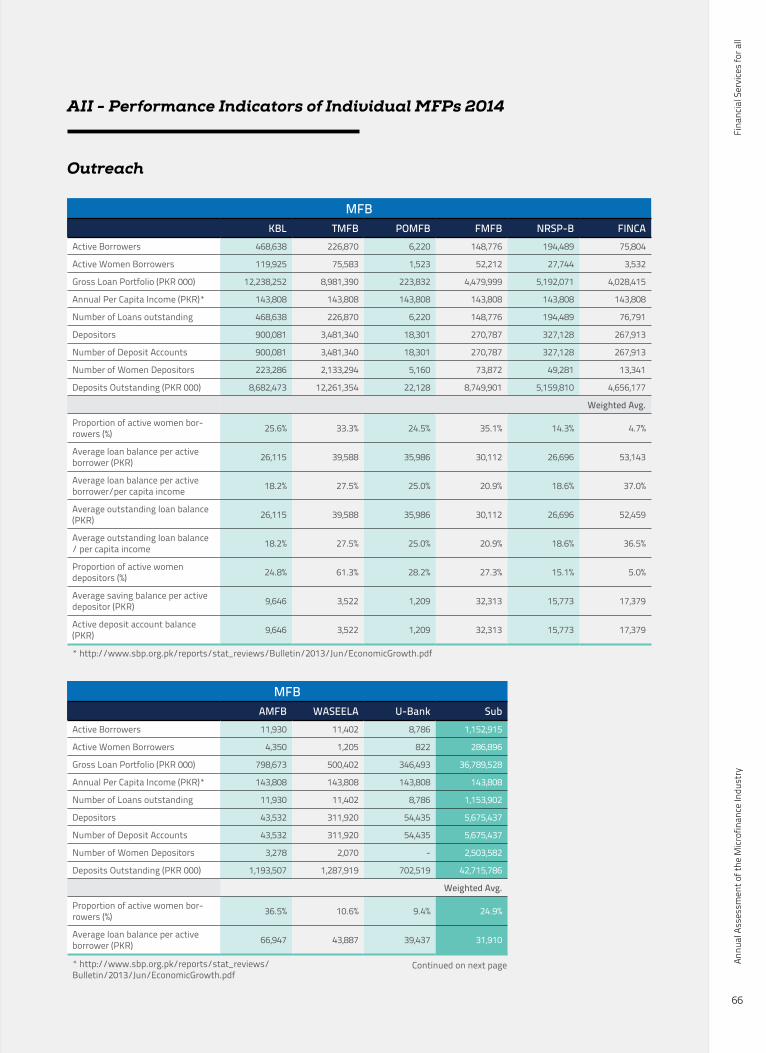
Fina
ncia
l Ser
vice
s fo
r all
Annu
al A
sses
smen
t of t
he M
icrof
inan
ce In
dust
ry
66
AII - Performance Indicators of Individual MFPs 2014
Outreach
MFBKBL TMFB POMFB FMFB NRSP-B FINCA
Active Borrowers 468,638 226,870 6,220 148,776 194,489 75,804
Active Women Borrowers 119,925 75,583 1,523 52,212 27,744 3,532
Gross Loan Portfolio (PKR 000) 12,238,252 8,981,390 223,832 4,479,999 5,192,071 4,028,415
Annual Per Capita Income (PKR)* 143,808 143,808 143,808 143,808 143,808 143,808
Number of Loans outstanding 468,638 226,870 6,220 148,776 194,489 76,791
Depositors 900,081 3,481,340 18,301 270,787 327,128 267,913
Number of Deposit Accounts 900,081 3,481,340 18,301 270,787 327,128 267,913
Number of Women Depositors 223,286 2,133,294 5,160 73,872 49,281 13,341
Deposits Outstanding (PKR 000) 8,682,473 12,261,354 22,128 8,749,901 5,159,810 4,656,177
Weighted Avg.
Proportion of active women bor-rowers (%) 25.6% 33.3% 24.5% 35.1% 14.3% 4.7%
Average loan balance per active borrower (PKR) 26,115 39,588 35,986 30,112 26,696 53,143
Average loan balance per active borrower/per capita income 18.2% 27.5% 25.0% 20.9% 18.6% 37.0%
Average outstanding loan balance (PKR) 26,115 39,588 35,986 30,112 26,696 52,459
Average outstanding loan balance / per capita income 18.2% 27.5% 25.0% 20.9% 18.6% 36.5%
Proportion of active women depositors (%) 24.8% 61.3% 28.2% 27.3% 15.1% 5.0%
Average saving balance per active depositor (PKR) 9,646 3,522 1,209 32,313 15,773 17,379
Active deposit account balance (PKR) 9,646 3,522 1,209 32,313 15,773 17,379
* http://www.sbp.org.pk/reports/stat_reviews/Bulletin/2013/Jun/EconomicGrowth.pdf
MFBAMFB WASEELA U-Bank Sub
Active Borrowers 11,930 11,402 8,786 1,152,915
Active Women Borrowers 4,350 1,205 822 286,896
Gross Loan Portfolio (PKR 000) 798,673 500,402 346,493 36,789,528
Annual Per Capita Income (PKR)* 143,808 143,808 143,808 143,808
Number of Loans outstanding 11,930 11,402 8,786 1,153,902
Depositors 43,532 311,920 54,435 5,675,437
Number of Deposit Accounts 43,532 311,920 54,435 5,675,437
Number of Women Depositors 3,278 2,070 - 2,503,582
Deposits Outstanding (PKR 000) 1,193,507 1,287,919 702,519 42,715,786
Weighted Avg.
Proportion of active women bor-rowers (%) 36.5% 10.6% 9.4% 24.9%
Average loan balance per active borrower (PKR) 66,947 43,887 39,437 31,910
* http://www.sbp.org.pk/reports/stat_reviews/Bulletin/2013/Jun/EconomicGrowth.pdf
Continued on next page

Fina
ncia
l Ser
vice
s fo
r all
Paki
stan
Micr
ofin
ance
Rev
iew
201
4
67
Annexures
MFBAMFB WASEELA U-Bank Sub
Average loan balance per active borrower/per capita income 46.6% 30.5% 27.4% 22.2%
Average outstanding loan balance (PKR) 66,947 43,887 39,437 31,883
Average outstanding loan balance / per capita income 46.6% 30.5% 27.4% 22.2%
Proportion of active women depositors (%) 7.5% 0.7% 0.0% 44.1%
Average saving balance per active depositor (PKR) 27,417 4,129 12,906 7,526
Active deposit account balance (PKR) 27,417 4,129 12,906 7,526
* http://www.sbp.org.pk/reports/stat_reviews/Bulletin/2013/Jun/EconomicGrowth.pdf
MFIOCT KASHF SAFCO DAMEN CSC GBTI
Active Borrowers 47,486 230,810 38,234 38,063 19,753 8,835
Active Women Borrowers 13,296 230,810 19,004 38,063 19,607 8,237
Gross Loan Portfolio (PKR 000) 460,538 3,752,325 422,532 1,003,160 381,000 81,252
Annual Per Capita Income (PKR)* 143,808 143,808 143,808 143,808 143,808 143,808
Number of Loans outstanding 47,486 230,810 38,234 38,063 19,753 8,835
Depositors
Number of Deposit Accounts
Number of Women Depositors
Deposits Outstanding (PKR 000)
Weighted Avg.
Proportion of active women bor-rowers (%) 28.0% 100.0% 49.7% 100.0% 99.3% 93.2%
Average loan balance per active borrower (PKR) 9,698 16,257 11,051 26,355 19,288 9,197
Average loan balance per active borrower/per capita income 6.7% 11.3% 7.7% 18.3% 13.4% 6.4%
Average outstanding loan balance (PKR) 9,698 16,257 11,051 26,355 19,288 9,197
Average outstanding loan balance / per capita income 6.7% 11.3% 7.7% 18.3% 13.4% 6.4%
Proportion of active women depositors (%) - - - - - -
Average saving balance per active depositor (PKR) - - - - - -
Active deposit account balance (PKR) - - - - - -
* http://www.sbp.org.pk/reports/stat_reviews/Bulletin/2013/Jun/EconomicGrowth.pdf
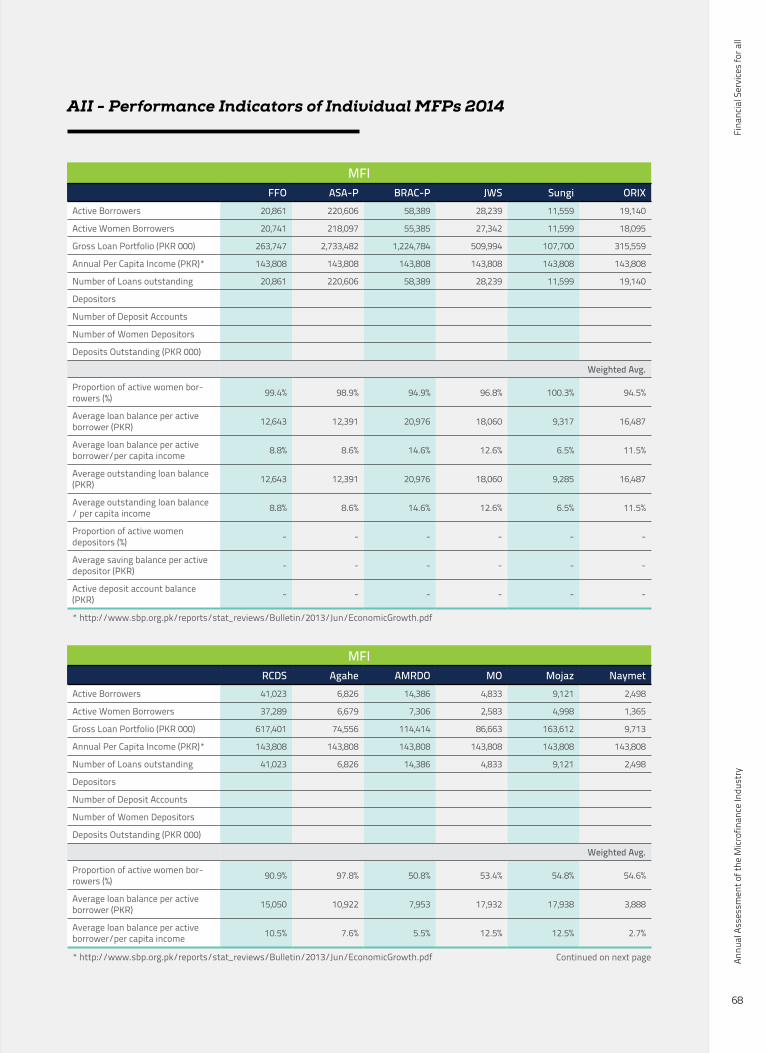
Fina
ncia
l Ser
vice
s fo
r all
Annu
al A
sses
smen
t of t
he M
icrof
inan
ce In
dust
ry
68
AII - Performance Indicators of Individual MFPs 2014
MFIFFO ASA-P BRAC-P JWS Sungi ORIX
Active Borrowers 20,861 220,606 58,389 28,239 11,559 19,140
Active Women Borrowers 20,741 218,097 55,385 27,342 11,599 18,095
Gross Loan Portfolio (PKR 000) 263,747 2,733,482 1,224,784 509,994 107,700 315,559
Annual Per Capita Income (PKR)* 143,808 143,808 143,808 143,808 143,808 143,808
Number of Loans outstanding 20,861 220,606 58,389 28,239 11,599 19,140
Depositors
Number of Deposit Accounts
Number of Women Depositors
Deposits Outstanding (PKR 000)
Weighted Avg.
Proportion of active women bor-rowers (%) 99.4% 98.9% 94.9% 96.8% 100.3% 94.5%
Average loan balance per active borrower (PKR) 12,643 12,391 20,976 18,060 9,317 16,487
Average loan balance per active borrower/per capita income 8.8% 8.6% 14.6% 12.6% 6.5% 11.5%
Average outstanding loan balance (PKR) 12,643 12,391 20,976 18,060 9,285 16,487
Average outstanding loan balance / per capita income 8.8% 8.6% 14.6% 12.6% 6.5% 11.5%
Proportion of active women depositors (%) - - - - - -
Average saving balance per active depositor (PKR) - - - - - -
Active deposit account balance (PKR) - - - - - -
* http://www.sbp.org.pk/reports/stat_reviews/Bulletin/2013/Jun/EconomicGrowth.pdf
MFIRCDS Agahe AMRDO MO Mojaz Naymet
Active Borrowers 41,023 6,826 14,386 4,833 9,121 2,498
Active Women Borrowers 37,289 6,679 7,306 2,583 4,998 1,365
Gross Loan Portfolio (PKR 000) 617,401 74,556 114,414 86,663 163,612 9,713
Annual Per Capita Income (PKR)* 143,808 143,808 143,808 143,808 143,808 143,808
Number of Loans outstanding 41,023 6,826 14,386 4,833 9,121 2,498
Depositors
Number of Deposit Accounts
Number of Women Depositors
Deposits Outstanding (PKR 000)
Weighted Avg.
Proportion of active women bor-rowers (%) 90.9% 97.8% 50.8% 53.4% 54.8% 54.6%
Average loan balance per active borrower (PKR) 15,050 10,922 7,953 17,932 17,938 3,888
Average loan balance per active borrower/per capita income 10.5% 7.6% 5.5% 12.5% 12.5% 2.7%
* http://www.sbp.org.pk/reports/stat_reviews/Bulletin/2013/Jun/EconomicGrowth.pdf Continued on next page
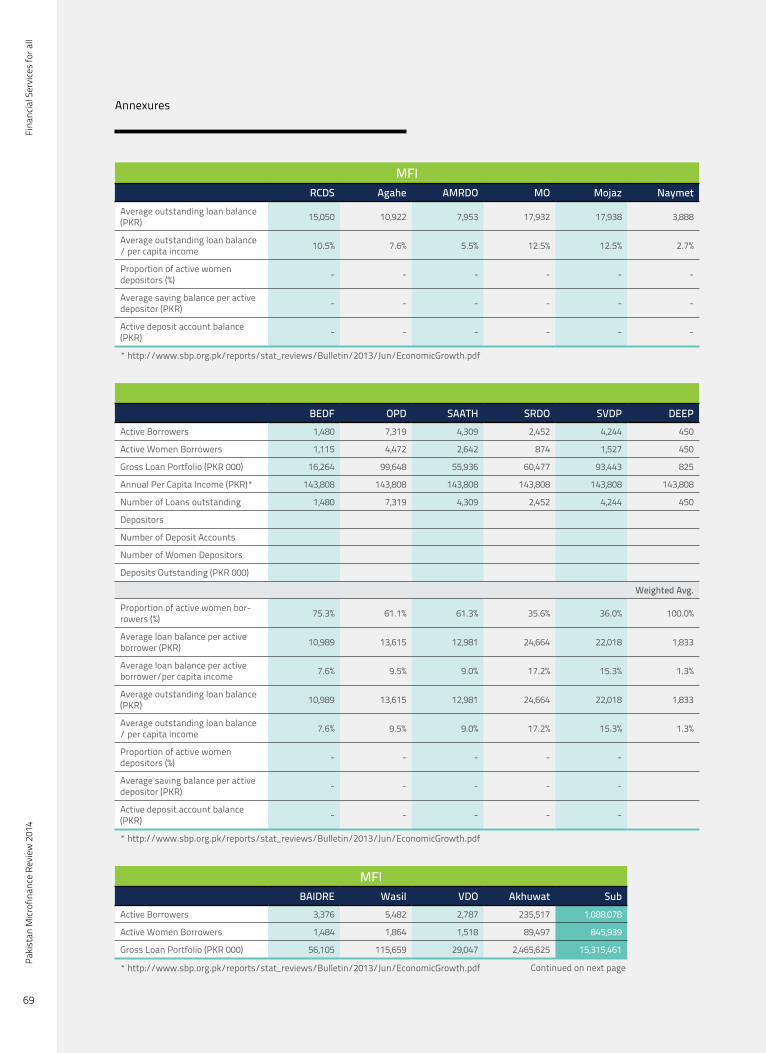
Fina
ncia
l Ser
vice
s fo
r all
Paki
stan
Micr
ofin
ance
Rev
iew
201
4
69
Annexures
MFIRCDS Agahe AMRDO MO Mojaz Naymet
Average outstanding loan balance (PKR) 15,050 10,922 7,953 17,932 17,938 3,888
Average outstanding loan balance / per capita income 10.5% 7.6% 5.5% 12.5% 12.5% 2.7%
Proportion of active women depositors (%) - - - - - -
Average saving balance per active depositor (PKR) - - - - - -
Active deposit account balance (PKR) - - - - - -
* http://www.sbp.org.pk/reports/stat_reviews/Bulletin/2013/Jun/EconomicGrowth.pdf
BEDF OPD SAATH SRDO SVDP DEEPActive Borrowers 1,480 7,319 4,309 2,452 4,244 450
Active Women Borrowers 1,115 4,472 2,642 874 1,527 450
Gross Loan Portfolio (PKR 000) 16,264 99,648 55,936 60,477 93,443 825
Annual Per Capita Income (PKR)* 143,808 143,808 143,808 143,808 143,808 143,808
Number of Loans outstanding 1,480 7,319 4,309 2,452 4,244 450
Depositors
Number of Deposit Accounts
Number of Women Depositors
Deposits Outstanding (PKR 000)
Weighted Avg.
Proportion of active women bor-rowers (%) 75.3% 61.1% 61.3% 35.6% 36.0% 100.0%
Average loan balance per active borrower (PKR) 10,989 13,615 12,981 24,664 22,018 1,833
Average loan balance per active borrower/per capita income 7.6% 9.5% 9.0% 17.2% 15.3% 1.3%
Average outstanding loan balance (PKR) 10,989 13,615 12,981 24,664 22,018 1,833
Average outstanding loan balance / per capita income 7.6% 9.5% 9.0% 17.2% 15.3% 1.3%
Proportion of active women depositors (%) - - - - -
Average saving balance per active depositor (PKR) - - - - -
Active deposit account balance (PKR) - - - - -
* http://www.sbp.org.pk/reports/stat_reviews/Bulletin/2013/Jun/EconomicGrowth.pdf
MFIBAIDRE Wasil VDO Akhuwat Sub
Active Borrowers 3,376 5,482 2,787 235,517 1,088,078
Active Women Borrowers 1,484 1,864 1,518 89,497 845,939
Gross Loan Portfolio (PKR 000) 56,105 115,659 29,047 2,465,625 15,315,461
* http://www.sbp.org.pk/reports/stat_reviews/Bulletin/2013/Jun/EconomicGrowth.pdf Continued on next page

Fina
ncia
l Ser
vice
s fo
r all
Annu
al A
sses
smen
t of t
he M
icrof
inan
ce In
dust
ry
70
AII - Performance Indicators of Individual MFPs 2014
MFIBAIDRE Wasil VDO Akhuwat Sub
Annual Per Capita Income (PKR)* 143,808 143,808 143,808 143,808 143,808
Number of Loans outstanding 3,376 5,482 2,787 235,517 1,088,118
Depositors -
Number of Deposit Accounts -
Number of Women Depositors -
Deposits Outstanding (PKR 000) -
Weighted Avg.
Proportion of active women bor-rowers (%) 44.0% 34.0% 54.5% 38.0% 77.7%
Average loan balance per active borrower (PKR) 16,619 21,098 10,422 10,469 14,076
Average loan balance per active borrower/per capita income 11.6% 14.7% 7.2% 7.3% 10%
Average outstanding loan balance (PKR) 16,619 21,098 10,422 10,469 14,075
Average outstanding loan balance / per capita income 11.6% 14.7% 7.2% 7.3% 9.8%
Proportion of active women depositors (%) - - -
Average saving balance per active depositor (PKR) - - -
Active deposit account balance (PKR) - - -
* http://www.sbp.org.pk/reports/stat_reviews/Bulletin/2013/Jun/EconomicGrowth.pdf
RSPNRSP PRSP SRSP TRDP SRSO Sub
Active Borrowers 492,338 74,864 4,770 109,688 75,215 756,875
Active Women Borrowers 383,814 38,705 4,342 62,383 70,372 559,616
Gross Loan Portfolio (PKR 000) 7,653,444 1,149,283 37,519 1,376,726 1,209,504 11,426,476
Annual Per Capita Income (PKR)* 143,808 143,808 143,808 143,808 143,808 143,808
Number of Loans outstanding 492,338 74,864 4,770 109,688 75,215 756,875
Depositors - - - - - -
Number of Deposit Accounts - - - - - -
Number of Women Depositors - - - - - -
Deposits Outstanding (PKR 000) - - - - - -
Weighted Avg.
Proportion of active women bor-rowers (%) 78.0% 51.7% 91.0% 56.9% 93.6% 73.9%
Average loan balance per active borrower (PKR) 15,545 15,352 7,866 12,551 16,081 15,097
Average loan balance per active borrower/per capita income 11% 11% 5% 9% 11% 10%
Average outstanding loan balance (PKR) 15,545 15,352 7,866 12,551 16,081 15,097
Average outstanding loan balance / per capita income 10.8% 10.7% 5% 9% 11.2% 10.5%
* http://www.sbp.org.pk/reports/stat_reviews/Bulletin/2013/Jun/EconomicGrowth.pdf Continued on next page
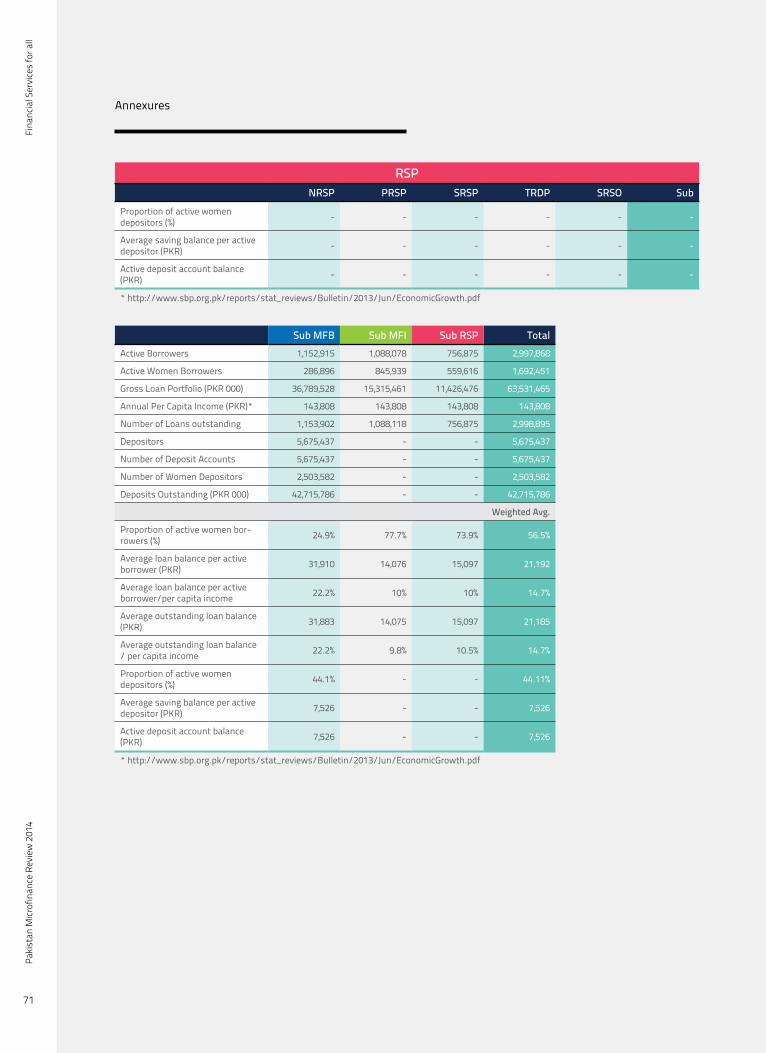
Fina
ncia
l Ser
vice
s fo
r all
Paki
stan
Micr
ofin
ance
Rev
iew
201
4
71
Annexures
RSPNRSP PRSP SRSP TRDP SRSO Sub
Proportion of active women depositors (%) - - - - - -
Average saving balance per active depositor (PKR) - - - - - -
Active deposit account balance (PKR) - - - - - -
* http://www.sbp.org.pk/reports/stat_reviews/Bulletin/2013/Jun/EconomicGrowth.pdf
Sub MFB Sub MFI Sub RSP TotalActive Borrowers 1,152,915 1,088,078 756,875 2,997,868
Active Women Borrowers 286,896 845,939 559,616 1,692,451
Gross Loan Portfolio (PKR 000) 36,789,528 15,315,461 11,426,476 63,531,465
Annual Per Capita Income (PKR)* 143,808 143,808 143,808 143,808
Number of Loans outstanding 1,153,902 1,088,118 756,875 2,998,895
Depositors 5,675,437 - - 5,675,437
Number of Deposit Accounts 5,675,437 - - 5,675,437
Number of Women Depositors 2,503,582 - - 2,503,582
Deposits Outstanding (PKR 000) 42,715,786 - - 42,715,786
Weighted Avg.
Proportion of active women bor-rowers (%) 24.9% 77.7% 73.9% 56.5%
Average loan balance per active borrower (PKR) 31,910 14,076 15,097 21,192
Average loan balance per active borrower/per capita income 22.2% 10% 10% 14.7%
Average outstanding loan balance (PKR) 31,883 14,075 15,097 21,185
Average outstanding loan balance / per capita income 22.2% 9.8% 10.5% 14.7%
Proportion of active women depositors (%) 44.1% - - 44.11%
Average saving balance per active depositor (PKR) 7,526 - - 7,526
Active deposit account balance (PKR) 7,526 - - 7,526
* http://www.sbp.org.pk/reports/stat_reviews/Bulletin/2013/Jun/EconomicGrowth.pdf

Fina
ncia
l Ser
vice
s fo
r all
Annu
al A
sses
smen
t of t
he M
icrof
inan
ce In
dust
ry
72
AII - Performance Indicators of Individual MFPs 2014
Financial Performance in PKR ‘000
MFBKBL TMFB POMFB FMFB NRSP-B FINCA
Income from loan portfolio 3,483,074 2,934,536 127,903 1,292,267 1,791,295 1,364,494
Income from investments 124,303 446,494 - 471,001 127,957 101,576
Income from other sources 216,810 967,975 5,514 16,621 140,010 16,292
Total revenue 3,824,187 4,349,005 133,418 1,779,889 2,059,262 1,482,362
Less : financial expense 809,557 766,186 250 590,199 793,087 361,258
Gross financial margin 3,014,629 3,582,819 133,167 1,189,690 1,266,174 1,121,104
Less: loan loss provision expense 157,686 115,582 1,512 109,972 62,231 47,016
Net financial margin 2,856,943 3,467,237 131,655 1,079,718 1,203,943 1,074,089
Personnel expense 872,220 1,155,631 64,948 479,259 472,418 537,350
Admin expense 1,017,612 1,269,769 64,010 497,463 445,795 505,943
Less: operating expense 1,889,832 2,425,400 128,958 976,722 918,213 1,043,293
Other Non operating expense 24,701 21,348 1,532 2,817 10,032 -
Net income before tax 942,410 1,020,489 1,165 100,179 275,698 30,796
Provision for tax 239,198 311,996 8,437 (9,232) 88,053 (145,350)
Net income/(loss) 703,212 708,493 (7,272) 109,411 187,646 176,146
Adjusted Financial Expense on Borrowings 42,702 22,109 - -
Inflation Adjustment Expense 205 142 66 79 99 71
Adjusted Loan Loss Provision Expense - - - - - -
Total Adjustment Expense 42,907 142 66 22,189 99 71
Net Income/(Loss) After Adjust-ments 660,305 708,351 (7,338) 87,222 187,547 176,075
Average total assets 14,991,045 15,791,681 997,014 10,094,386 10,800,815 5,179,667
Average total equity 3,018,975 2,526,673 944,002 1,169,601 1,758,422 1,184,257
weighted avg.
Adjusted return-on-assets 4.4% 4.5% -0.7% 0.9% 1.7% 3.4%
Adjusted return-on-equity 21.9% 28.0% -0.8% 7.5% 10.7% 14.9%
Financial expense ratio 7.7% 8.9% 0.1% 14.8% 15.8% 11.9%
Operational self sufficiency (OSS) 132.7% 130.7% 100.9% 106.0% 115.5% 102.1%
Financial self sufficiency (FSS) 130.8% 130.7% 100.8% 104.6% 115.5% 102.1%
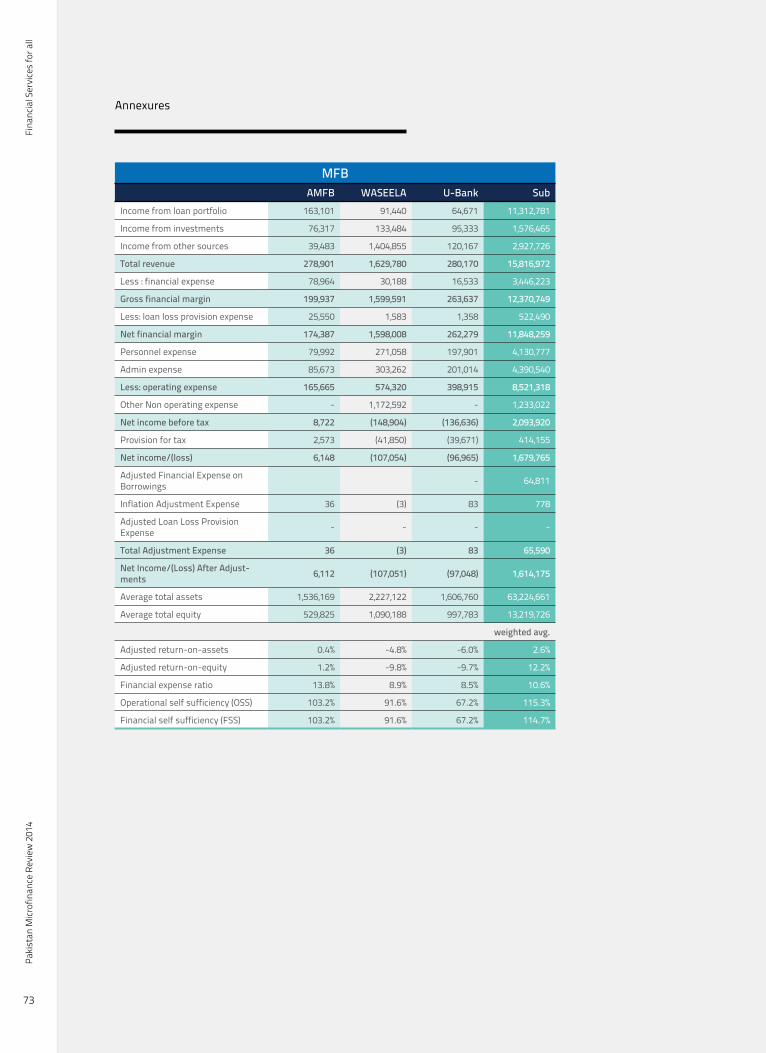
Fina
ncia
l Ser
vice
s fo
r all
Paki
stan
Micr
ofin
ance
Rev
iew
201
4
73
Annexures
MFBAMFB WASEELA U-Bank Sub
Income from loan portfolio 163,101 91,440 64,671 11,312,781
Income from investments 76,317 133,484 95,333 1,576,465
Income from other sources 39,483 1,404,855 120,167 2,927,726
Total revenue 278,901 1,629,780 280,170 15,816,972
Less : financial expense 78,964 30,188 16,533 3,446,223
Gross financial margin 199,937 1,599,591 263,637 12,370,749
Less: loan loss provision expense 25,550 1,583 1,358 522,490
Net financial margin 174,387 1,598,008 262,279 11,848,259
Personnel expense 79,992 271,058 197,901 4,130,777
Admin expense 85,673 303,262 201,014 4,390,540
Less: operating expense 165,665 574,320 398,915 8,521,318
Other Non operating expense - 1,172,592 - 1,233,022
Net income before tax 8,722 (148,904) (136,636) 2,093,920
Provision for tax 2,573 (41,850) (39,671) 414,155
Net income/(loss) 6,148 (107,054) (96,965) 1,679,765
Adjusted Financial Expense on Borrowings - 64,811
Inflation Adjustment Expense 36 (3) 83 778
Adjusted Loan Loss Provision Expense - - - -
Total Adjustment Expense 36 (3) 83 65,590
Net Income/(Loss) After Adjust-ments 6,112 (107,051) (97,048) 1,614,175
Average total assets 1,536,169 2,227,122 1,606,760 63,224,661
Average total equity 529,825 1,090,188 997,783 13,219,726
weighted avg.
Adjusted return-on-assets 0.4% -4.8% -6.0% 2.6%
Adjusted return-on-equity 1.2% -9.8% -9.7% 12.2%
Financial expense ratio 13.8% 8.9% 8.5% 10.6%
Operational self sufficiency (OSS) 103.2% 91.6% 67.2% 115.3%
Financial self sufficiency (FSS) 103.2% 91.6% 67.2% 114.7%
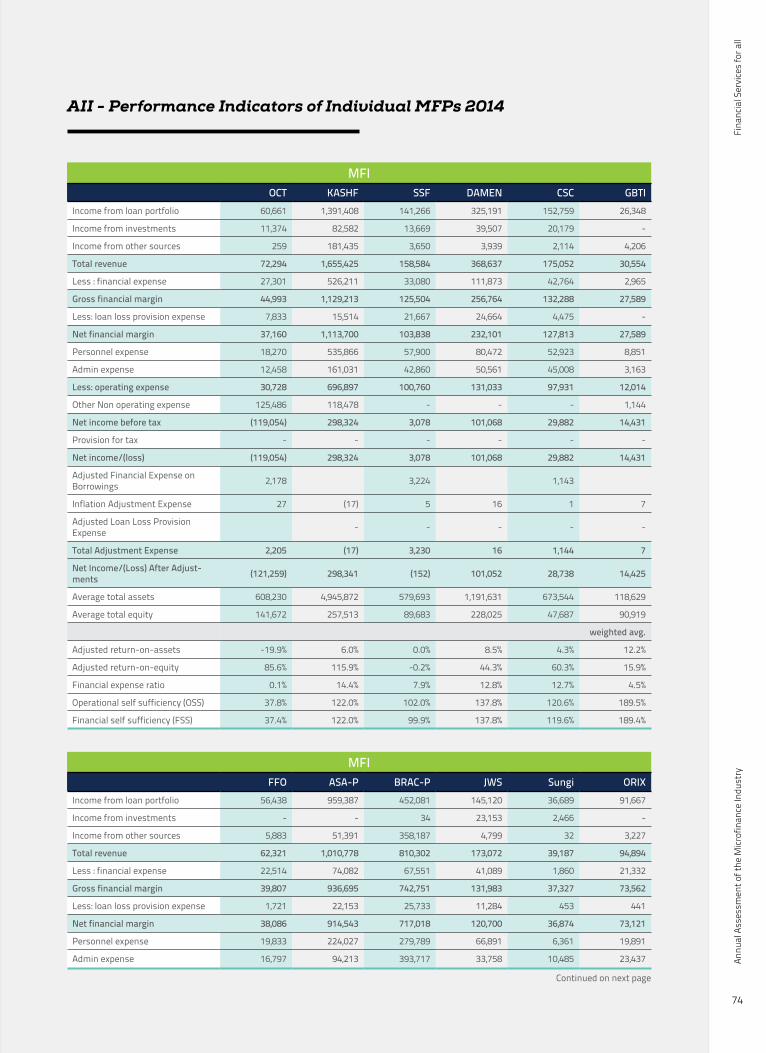
Fina
ncia
l Ser
vice
s fo
r all
Annu
al A
sses
smen
t of t
he M
icrof
inan
ce In
dust
ry
74
AII - Performance Indicators of Individual MFPs 2014
MFIOCT KASHF SSF DAMEN CSC GBTI
Income from loan portfolio 60,661 1,391,408 141,266 325,191 152,759 26,348
Income from investments 11,374 82,582 13,669 39,507 20,179 -
Income from other sources 259 181,435 3,650 3,939 2,114 4,206
Total revenue 72,294 1,655,425 158,584 368,637 175,052 30,554
Less : financial expense 27,301 526,211 33,080 111,873 42,764 2,965
Gross financial margin 44,993 1,129,213 125,504 256,764 132,288 27,589
Less: loan loss provision expense 7,833 15,514 21,667 24,664 4,475 -
Net financial margin 37,160 1,113,700 103,838 232,101 127,813 27,589
Personnel expense 18,270 535,866 57,900 80,472 52,923 8,851
Admin expense 12,458 161,031 42,860 50,561 45,008 3,163
Less: operating expense 30,728 696,897 100,760 131,033 97,931 12,014
Other Non operating expense 125,486 118,478 - - - 1,144
Net income before tax (119,054) 298,324 3,078 101,068 29,882 14,431
Provision for tax - - - - - -
Net income/(loss) (119,054) 298,324 3,078 101,068 29,882 14,431
Adjusted Financial Expense on Borrowings 2,178 3,224 1,143
Inflation Adjustment Expense 27 (17) 5 16 1 7
Adjusted Loan Loss Provision Expense - - - - -
Total Adjustment Expense 2,205 (17) 3,230 16 1,144 7
Net Income/(Loss) After Adjust-ments (121,259) 298,341 (152) 101,052 28,738 14,425
Average total assets 608,230 4,945,872 579,693 1,191,631 673,544 118,629
Average total equity 141,672 257,513 89,683 228,025 47,687 90,919
weighted avg.
Adjusted return-on-assets -19.9% 6.0% 0.0% 8.5% 4.3% 12.2%
Adjusted return-on-equity 85.6% 115.9% -0.2% 44.3% 60.3% 15.9%
Financial expense ratio 0.1% 14.4% 7.9% 12.8% 12.7% 4.5%
Operational self sufficiency (OSS) 37.8% 122.0% 102.0% 137.8% 120.6% 189.5%
Financial self sufficiency (FSS) 37.4% 122.0% 99.9% 137.8% 119.6% 189.4%
MFIFFO ASA-P BRAC-P JWS Sungi ORIX
Income from loan portfolio 56,438 959,387 452,081 145,120 36,689 91,667
Income from investments - - 34 23,153 2,466 -
Income from other sources 5,883 51,391 358,187 4,799 32 3,227
Total revenue 62,321 1,010,778 810,302 173,072 39,187 94,894
Less : financial expense 22,514 74,082 67,551 41,089 1,860 21,332
Gross financial margin 39,807 936,695 742,751 131,983 37,327 73,562
Less: loan loss provision expense 1,721 22,153 25,733 11,284 453 441
Net financial margin 38,086 914,543 717,018 120,700 36,874 73,121
Personnel expense 19,833 224,027 279,789 66,891 6,361 19,891
Admin expense 16,797 94,213 393,717 33,758 10,485 23,437
Continued on next page

Fina
ncia
l Ser
vice
s fo
r all
Paki
stan
Micr
ofin
ance
Rev
iew
201
4
75
Annexures
MFIFFO ASA-P BRAC-P JWS Sungi ORIX
Less: operating expense 36,631 318,240 673,506 100,649 16,846 43,328
Other Non operating expense 1,349 11,926 7,427 173 - 7,829
Net income before tax 106 584,376 36,085 19,878 20,028 21,964
Provision for tax - 192,569 4,702 - - -
Net income/(loss) 106 391,808 31,383 19,878 20,028 21,964
Adjusted Financial Expense on Borrowings 3,402 21,210 - - 2,371
Inflation Adjustment Expense 1 0 (26) 16 6 3
Adjusted Loan Loss Provision Expense - - - - - 70
Total Adjustment Expense 1 3,402 21,185 16 6 2,445
Net Income/(Loss) After Adjust-ments 106 388,406 10,199 19,862 20,023 19,519
Average total assets 288,358 2,388,094 1,291,247 628,067 105,011 308,377
Average total equity 16,998 975,253 43,527 226,535 80,229 54,267
weighted avg.
Adjusted return-on-assets 0.0% 16.3% 0.8% 3.2% 19.1% 6.3%
Adjusted return-on-equity 0.6% 39.8% -23.4% 8.8% -25.0% 36.0%
Financial expense ratio 1.0% 3.2% 6.4% 9.9% 0.7% 7.8%
Operational self sufficiency (OSS) 100.2% 237.0% 104.7% 113.0% 204.5% 130.1%
Financial self sufficiency (FSS) 100.2% 235.2% 101.9% 113.0% 204.5% 125.9%
MFIRCDS Agahe AMRDO MO Mojaz Naymet
Income from loan portfolio 213,655 21,113 36,464 27,108 41,651 472
Income from investments 22,253 1,278 2,333 - - 275
Income from other sources 8,515 3,725 2,024 5,863 4,449 13,083
Total revenue 244,423 26,116 40,821 32,971 46,100 13,830
Less : financial expense 58,368 6,168 11,508 5,325 15,616 -
Gross financial margin 186,055 19,947 29,313 27,647 30,484 13,830
Less: loan loss provision expense 22,001 1,651 4,117 2,073 4,251 224
Net financial margin 164,054 18,296 25,195 25,574 26,234 13,606
Personnel expense 59,196 8,126 15,429 6,908 15,529 3,423
Admin expense 40,358 7,226 8,258 8,513 9,534 10,043
Less: operating expense 99,554 15,352 23,687 15,422 25,062 13,467
Other Non operating expense 4,206 - 2,656 - 35
Net income before tax 60,294 2,944 1,508 7,496 1,171 105
Provision for tax - - - - -
Net income/(loss) 60,294 2,944 1,508 7,496 1,171 105
Adjusted Financial Expense on Borrowings - - - 1,516
Inflation Adjustment Expense 14 1 3 2 3 1
Adjusted Loan Loss Provision Expense -
Continued on next page

Fina
ncia
l Ser
vice
s fo
r all
Annu
al A
sses
smen
t of t
he M
icrof
inan
ce In
dust
ry
76
AII - Performance Indicators of Individual MFPs 2014
MFIRCDS Agahe AMRDO MO Mojaz Naymet
Total Adjustment Expense 14 1 3 1,518 3 1
Net Income/(Loss) After Adjust-ments 60,280 2,943 1,505 5,979 1,168 104
Average total assets 851,842 95,714 107,487 100,334 249,777 10,501
Average total equity 268,445 21,599 19,896 27,291 57,676 9,399
weighted avg.
Adjusted return-on-assets 7.1% 3.1% 1.4% 6.0% 0.5% 1.0%
Adjusted return-on-equity 22.5% 13.6% 7.6% 21.9% 2.0% 1.1%
Financial expense ratio 11.0% 10.4% 12.0% 7.1% 12.9% 0.0%
Operational self sufficiency (OSS) 132.7% 112.7% 103.8% 129.4% 102.6% 100.8%
Financial self sufficiency (FSS) 132.7% 112.7% 103.8% 122.1% 102.6% 100.8%
MFIBEDF OPD SAATH SRDO SVDP DEEP
Income from loan portfolio 6,966 30,856 16,875 9,844 26,046 10,057
Income from investments 992 2,996 914 406 1,855 -
Income from other sources 6,040 2,636 766 5,304 6,070 -
Total revenue 13,999 36,488 18,555 15,554 33,970 10,057
Less : financial expense 2,103 9,342 6,036 6,807 8,143 8,731
Gross financial margin 11,896 27,146 12,519 8,748 25,828 1,326
Less: loan loss provision expense 341 1,444 1,990 1,326 1,109 -
Net financial margin 11,555 25,702 10,529 7,422 24,718 1,326
Personnel expense 3,826 10,582 4,348 2,850 12,231 359
Admin expense 3,633 7,490 4,609 3,127 11,149 1,300
Less: operating expense 7,459 18,071 8,957 5,976 23,380 1,659
Other Non operating expense 4,106 2,054 - - 3 -
Net income before tax (9) 5,577 1,572 1,446 1,336 (333)
Provision for tax - 2,269 - - - -
Net income/(loss) (9) 3,308 1,572 1,446 1,336 (333)
Adjusted Financial Expense on Borrowings 188 - 663 -
Inflation Adjustment Expense 1 1 58 0 3 (185)
Adjusted Loan Loss Provision Expense - -
Total Adjustment Expense 188 1 58 0 666 (185)
Net Income/(Loss) After Adjust-ments (197) 3,307 1,514 1,445 670 (149)
Average total assets 60,132 121,399 72,595 73,285 138,689 1,328
Average total equity 41,132 16,445 14,534 5,630 35,938 (2,170)
weighted avg.
Adjusted return-on-assets -0.3% 2.7% 2.1% 2.0% 0.5% -11.2%
Adjusted return-on-equity -0.5% 20.1% 10.4% 25.7% 1.9% 6.9%
Financial expense ratio 4.0% 12.2% 15.3% 12.9% 9.7% 1103.8%
Operational self sufficiency (OSS) 99.9% 118.0% 109.3% 110.2% 104.1% 96.8%
Financial self sufficiency (FSS) 98.6% 118.0% 108.9% 110.2% 102.0% 98.5%
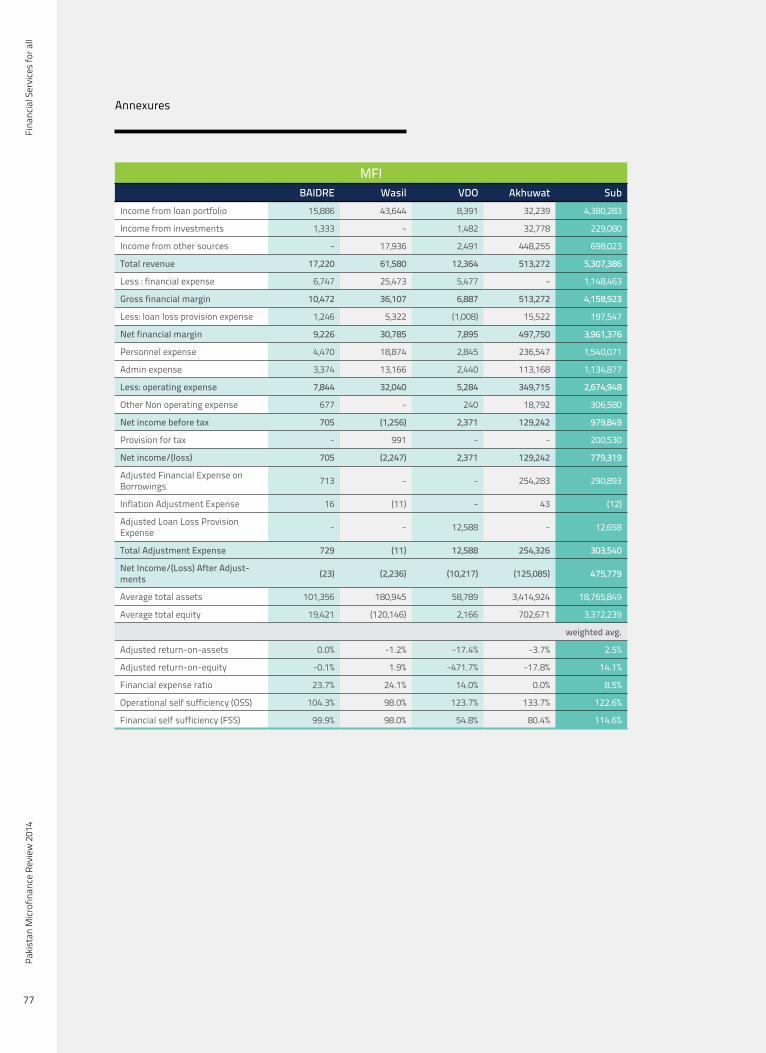
Fina
ncia
l Ser
vice
s fo
r all
Paki
stan
Micr
ofin
ance
Rev
iew
201
4
77
Annexures
MFIBAIDRE Wasil VDO Akhuwat Sub
Income from loan portfolio 15,886 43,644 8,391 32,239 4,380,283
Income from investments 1,333 - 1,482 32,778 229,080
Income from other sources - 17,936 2,491 448,255 698,023
Total revenue 17,220 61,580 12,364 513,272 5,307,386
Less : financial expense 6,747 25,473 5,477 - 1,148,463
Gross financial margin 10,472 36,107 6,887 513,272 4,158,923
Less: loan loss provision expense 1,246 5,322 (1,008) 15,522 197,547
Net financial margin 9,226 30,785 7,895 497,750 3,961,376
Personnel expense 4,470 18,874 2,845 236,547 1,540,071
Admin expense 3,374 13,166 2,440 113,168 1,134,877
Less: operating expense 7,844 32,040 5,284 349,715 2,674,948
Other Non operating expense 677 - 240 18,792 306,580
Net income before tax 705 (1,256) 2,371 129,242 979,849
Provision for tax - 991 - - 200,530
Net income/(loss) 705 (2,247) 2,371 129,242 779,319
Adjusted Financial Expense on Borrowings 713 - - 254,283 290,893
Inflation Adjustment Expense 16 (11) - 43 (12)
Adjusted Loan Loss Provision Expense - - 12,588 - 12,658
Total Adjustment Expense 729 (11) 12,588 254,326 303,540
Net Income/(Loss) After Adjust-ments (23) (2,236) (10,217) (125,085) 475,779
Average total assets 101,356 180,945 58,789 3,414,924 18,765,849
Average total equity 19,421 (120,146) 2,166 702,671 3,372,239
weighted avg.
Adjusted return-on-assets 0.0% -1.2% -17.4% -3.7% 2.5%
Adjusted return-on-equity -0.1% 1.9% -471.7% -17.8% 14.1%
Financial expense ratio 23.7% 24.1% 14.0% 0.0% 8.5%
Operational self sufficiency (OSS) 104.3% 98.0% 123.7% 133.7% 122.6%
Financial self sufficiency (FSS) 99.9% 98.0% 54.8% 80.4% 114.6%

Fina
ncia
l Ser
vice
s fo
r all
Annu
al A
sses
smen
t of t
he M
icrof
inan
ce In
dust
ry
78
AII - Performance Indicators of Individual MFPs 2014
RSPNRSP PRSP SRSP TRDP SRSO Sub
Income from loan portfolio 2,070,895 230,464 6,901 327,582 252,585 2,888,425
Income from investments 129,953 71,655 - 23,022 21,371 246,002
Income from other sources 19,900 7,616 16,317 24,923 12,912 81,668
Total revenue 2,220,748 309,734 23,218 375,527 286,868 3,216,095
Less : financial expense 569,281 103,164 2,402 86,526 95,137 856,511
Gross financial margin 1,651,467 206,570 20,816 289,001 191,731 2,359,584
Less: loan loss provision expense 20,365 1,349 28 2,852 49,868 74,463
Net financial margin 1,631,101 205,221 20,788 286,149 141,862 2,285,121
Personnel expense 668,229 35,429 6,183 93,189 83,832 886,861
Admin expense 304,717 20,181 6,974 38,280 55,839 425,991
Less: operating expense 972,946 55,610 13,157 131,469 139,671 1,312,852
Other Non operating expense - 3,348 - 1,860 1,430 6,638
Net income before tax 658,155 146,263 7,631 152,820 761 965,631
Provision for tax -
Net income/(loss) 658,155 146,263 7,631 152,820 761 965,631
Adjusted Financial Expense on Borrowings - - - - 12,132 12,132
Inflation Adjustment Expense 157 - - 20 16 192
Adjusted Loan Loss Provision Expense - - - 967 - 967
Total Adjustment Expense 157 - - 987 12,148 13,291
Net Income/(Loss) After Adjust-ments 657,998 146,263 7,631 151,834 (11,386) 952,340
Average total assets 8,551,884 2,678,281 59,970 779,284 1,434,735 13,504,154
Average total equity 2,303,229 1,192,351 27,705 193,936 320,595 4,037,815
weighted avg.
Adjusted return-on-assets 7.7% 5.5% 12.7% 19.5% -0.8% 7.1%
Adjusted return-on-equity 28.6% 12.3% 27.5% 78.3% -3.6% 23.6%
Financial expense ratio 8.6% 10.1% 6.9% 8.0% 8.3% 8.6%
Operational self sufficiency (OSS) 142.1% 189.5% 149.0% 168.6% 100.3% 142.9%
Financial self sufficiency (FSS) 142.1% 189.5% 149.0% 167.9% 96.2% 142.1%
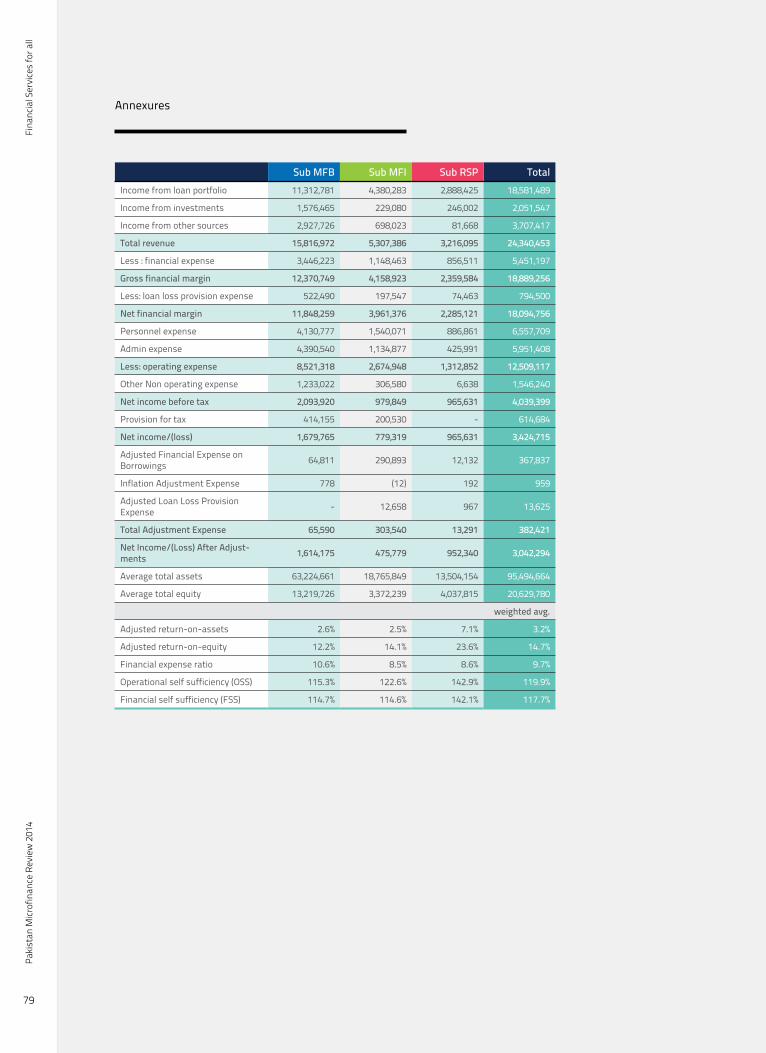
Fina
ncia
l Ser
vice
s fo
r all
Paki
stan
Micr
ofin
ance
Rev
iew
201
4
79
Annexures
Sub MFB Sub MFI Sub RSP TotalIncome from loan portfolio 11,312,781 4,380,283 2,888,425 18,581,489
Income from investments 1,576,465 229,080 246,002 2,051,547
Income from other sources 2,927,726 698,023 81,668 3,707,417
Total revenue 15,816,972 5,307,386 3,216,095 24,340,453
Less : financial expense 3,446,223 1,148,463 856,511 5,451,197
Gross financial margin 12,370,749 4,158,923 2,359,584 18,889,256
Less: loan loss provision expense 522,490 197,547 74,463 794,500
Net financial margin 11,848,259 3,961,376 2,285,121 18,094,756
Personnel expense 4,130,777 1,540,071 886,861 6,557,709
Admin expense 4,390,540 1,134,877 425,991 5,951,408
Less: operating expense 8,521,318 2,674,948 1,312,852 12,509,117
Other Non operating expense 1,233,022 306,580 6,638 1,546,240
Net income before tax 2,093,920 979,849 965,631 4,039,399
Provision for tax 414,155 200,530 - 614,684
Net income/(loss) 1,679,765 779,319 965,631 3,424,715
Adjusted Financial Expense on Borrowings 64,811 290,893 12,132 367,837
Inflation Adjustment Expense 778 (12) 192 959
Adjusted Loan Loss Provision Expense - 12,658 967 13,625
Total Adjustment Expense 65,590 303,540 13,291 382,421
Net Income/(Loss) After Adjust-ments 1,614,175 475,779 952,340 3,042,294
Average total assets 63,224,661 18,765,849 13,504,154 95,494,664
Average total equity 13,219,726 3,372,239 4,037,815 20,629,780
weighted avg.
Adjusted return-on-assets 2.6% 2.5% 7.1% 3.2%
Adjusted return-on-equity 12.2% 14.1% 23.6% 14.7%
Financial expense ratio 10.6% 8.5% 8.6% 9.7%
Operational self sufficiency (OSS) 115.3% 122.6% 142.9% 119.9%
Financial self sufficiency (FSS) 114.7% 114.6% 142.1% 117.7%

Fina
ncia
l Ser
vice
s fo
r all
Annu
al A
sses
smen
t of t
he M
icrof
inan
ce In
dust
ry
80
AII - Performance Indicators of Individual MFPs 2014
Operating Income in PKR ‘000
MFBKBL TMFB POMFB FMFB NRSP-B FINCA
Revenue from loan portfolio 3,483,074 2,934,536 127,903 1,292,267 1,791,295 1,364,494
Total revenue 3,824,187 4,349,005 133,418 1,779,889 2,059,262 1,482,362
Adjusted net operating income / (loss) 660,305 708,351 (7,338) 87,222 187,547 176,075
Average total assets 14,991,045 15,791,681 997,014 10,094,386 10,800,815 5,179,667
Gross loan portfolio (opening balance) 8,859,405 8,331,554 117,931 3,499,317 4,845,000 2,036,069
Gross loan portfolio (closing balance) 12,238,252 8,981,390 223,832 4,479,999 5,192,071 4,028,415
Average gross loan portfolio 10,548,829 8,656,472 170,882 3,989,658 5,018,536 3,032,242
Inflation rate * 8% 8% 8% 8% 8% 8%
weighted avg.
Total revenue ratio (total reve-nue-to-average total assets) 25.5% 27.5% 13.4% 17.6% 19.1% 28.6%
Adjusted profit margin (adjusted profit/(loss)-to-total revenue) 17.3% 16.3% -5.5% 4.9% 9.1% 11.9%
Yield on gross portfolio (nominal) 33.0% 33.9% 74.8% 32.4% 35.7% 45.0%
Yield on gross portfolio (real) 22.9% 23.8% 61.6% 22.4% 25.4% 34.0%
* http://www.sbp.org.pk/reports/stat_reviews/Bulletin/2013/May/IND.pdf
MFBAMFB WASEELA U-Bank Sub
Revenue from loan portfolio 163,101 91,440 64,671 11,312,781
Total revenue 278,901 1,629,780 280,170 15,816,972
Adjusted net operating income / (loss) 6,112 (107,051) (97,048) 1,614,175
Average total assets 1,536,169 2,227,122 1,606,760 63,224,661
Gross loan portfolio (opening balance) 341,838 178,328 41,381 28,250,823
Gross loan portfolio (closing balance) 798,673 500,402 346,493 36,789,528
Average gross loan portfolio 570,256 339,365 193,937 32,520,176
Inflation rate * 8% 8% 8% 8%
weighted avg.
Total revenue ratio (total reve-nue-to-average total assets) 18.2% 73.2% 17.4% 25.0%
Adjusted profit margin (adjusted profit/(loss)-to-total revenue) 2.2% -6.6% -34.6% 10.2%
Yield on gross portfolio (nominal) 28.6% 26.9% 33.3% 34.8%
Yield on gross portfolio (real) 18.9% 17.5% 23.2% 24.6%
* http://www.sbp.org.pk/reports/stat_reviews/Bulletin/2013/May/IND.pdf

Fina
ncia
l Ser
vice
s fo
r all
Paki
stan
Micr
ofin
ance
Rev
iew
201
4
81
Annexures
MFIOPP KASHF SAFCO DAMEN CSC GBTI
Revenue from loan portfolio 60,661 1,391,408 141,266 325,191 152,759 26,348
Total revenue 72,294 1,655,425 158,584 368,637 175,052 30,554
Adjusted net operating income / (loss) (121,259) 298,341 (152) 101,052 28,738 14,425
Average total assets 608,230 4,945,872 579,693 1,191,631 673,544 118,629
Gross loan portfolio (opening balance) 470,392 3,543,155 413,875 750,530 293,493 50,763
Gross loan portfolio (closing balance) 460,538 3,752,325 422,532 1,003,160 381,000 81,252
Average gross loan portfolio 465,465 3,647,740 418,203 876,845 337,247 66,007
Inflation rate * 8% 8% 8% 8% 8% 8%
weighted avg.
Total revenue ratio (total reve-nue-to-average total assets) 11.9% 33.5% 27.4% 30.9% 26.0% 25.8%
Adjusted profit margin (adjusted profit/(loss)-to-total revenue) -167.7% 18.0% -0.1% 27.4% 16.4% 47.2%
Yield on gross portfolio (nominal) 13.0% 38.1% 33.8% 37.1% 45.3% 39.9%
Yield on gross portfolio (real) 4.5% 27.7% 23.6% 26.7% 34.3% 29.3%
* http://www.sbp.org.pk/reports/stat_reviews/Bulletin/2013/May/IND.pdf
MFIFFO ASA-P BRAC-P JWS Sungi ORIX
Revenue from loan portfolio 56,438 959,387 452,081 145,120 36,689 91,667
Total revenue 62,321 1,010,778 810,302 173,072 39,187 94,894
Adjusted net operating income / (loss) 106 388,406 10,199 19,862 20,023 19,519
Average total assets 288,358 2,388,094 1,291,247 628,067 105,011 308,377
Gross loan portfolio (opening balance) 125,333 1,896,801 884,295 319,169 89,582 233,715
Gross loan portfolio (closing balance) 263,747 2,733,482 1,224,784 509,994 107,700 315,559
Average gross loan portfolio 194,540 2,315,142 1,054,540 414,581 98,641 274,637
Inflation rate * 8% 8% 8% 8% 8% 8%
weighted avg.
Total revenue ratio (total reve-nue-to-average total assets) 21.6% 42.3% 62.8% 27.6% 37.3% 30.8%
Adjusted profit margin (adjusted profit/(loss)-to-total revenue) 0.2% 38.4% 1.3% 11.5% 51.1% 8.4%
Yield on gross portfolio (nominal) 29.0% 41.4% 42.9% 35.0% 37.2% 33.4%
Yield on gross portfolio (real) 19.2% 30.7% 32.0% 24.8% 26.8% 23.3%
* http://www.sbp.org.pk/reports/stat_reviews/Bulletin/2013/May/IND.pdf
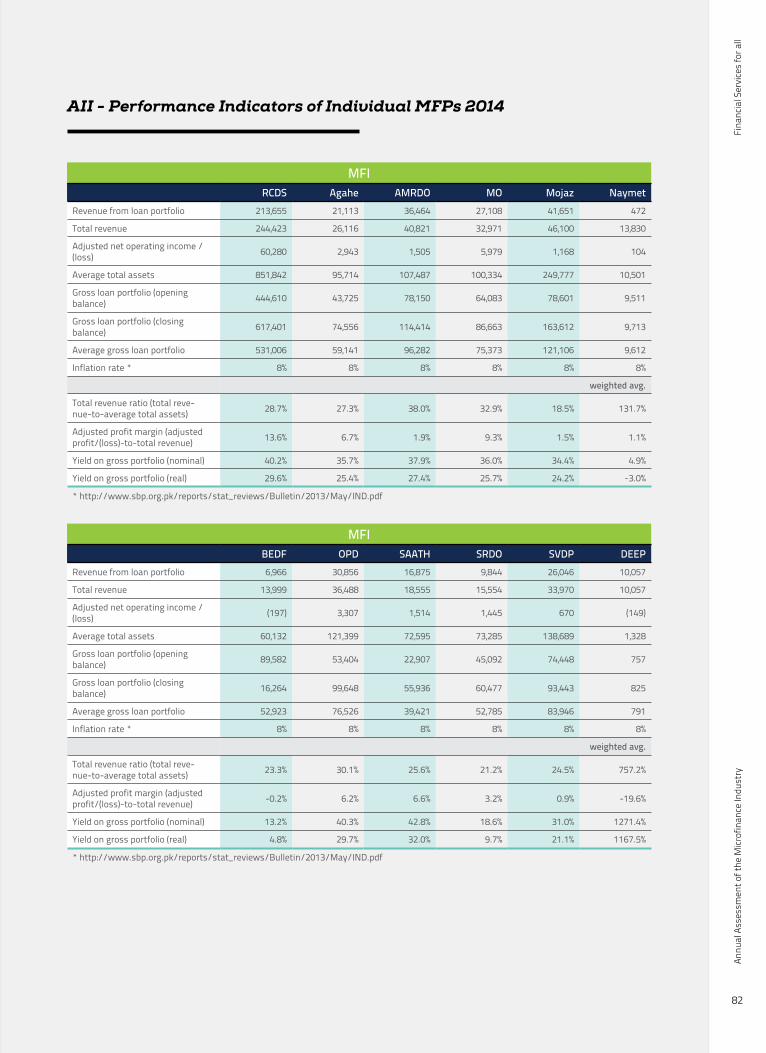
Fina
ncia
l Ser
vice
s fo
r all
Annu
al A
sses
smen
t of t
he M
icrof
inan
ce In
dust
ry
82
AII - Performance Indicators of Individual MFPs 2014
MFIRCDS Agahe AMRDO MO Mojaz Naymet
Revenue from loan portfolio 213,655 21,113 36,464 27,108 41,651 472
Total revenue 244,423 26,116 40,821 32,971 46,100 13,830
Adjusted net operating income / (loss) 60,280 2,943 1,505 5,979 1,168 104
Average total assets 851,842 95,714 107,487 100,334 249,777 10,501
Gross loan portfolio (opening balance) 444,610 43,725 78,150 64,083 78,601 9,511
Gross loan portfolio (closing balance) 617,401 74,556 114,414 86,663 163,612 9,713
Average gross loan portfolio 531,006 59,141 96,282 75,373 121,106 9,612
Inflation rate * 8% 8% 8% 8% 8% 8%
weighted avg.
Total revenue ratio (total reve-nue-to-average total assets) 28.7% 27.3% 38.0% 32.9% 18.5% 131.7%
Adjusted profit margin (adjusted profit/(loss)-to-total revenue) 13.6% 6.7% 1.9% 9.3% 1.5% 1.1%
Yield on gross portfolio (nominal) 40.2% 35.7% 37.9% 36.0% 34.4% 4.9%
Yield on gross portfolio (real) 29.6% 25.4% 27.4% 25.7% 24.2% -3.0%
* http://www.sbp.org.pk/reports/stat_reviews/Bulletin/2013/May/IND.pdf
MFIBEDF OPD SAATH SRDO SVDP DEEP
Revenue from loan portfolio 6,966 30,856 16,875 9,844 26,046 10,057
Total revenue 13,999 36,488 18,555 15,554 33,970 10,057
Adjusted net operating income / (loss) (197) 3,307 1,514 1,445 670 (149)
Average total assets 60,132 121,399 72,595 73,285 138,689 1,328
Gross loan portfolio (opening balance) 89,582 53,404 22,907 45,092 74,448 757
Gross loan portfolio (closing balance) 16,264 99,648 55,936 60,477 93,443 825
Average gross loan portfolio 52,923 76,526 39,421 52,785 83,946 791
Inflation rate * 8% 8% 8% 8% 8% 8%
weighted avg.
Total revenue ratio (total reve-nue-to-average total assets) 23.3% 30.1% 25.6% 21.2% 24.5% 757.2%
Adjusted profit margin (adjusted profit/(loss)-to-total revenue) -0.2% 6.2% 6.6% 3.2% 0.9% -19.6%
Yield on gross portfolio (nominal) 13.2% 40.3% 42.8% 18.6% 31.0% 1271.4%
Yield on gross portfolio (real) 4.8% 29.7% 32.0% 9.7% 21.1% 1167.5%
* http://www.sbp.org.pk/reports/stat_reviews/Bulletin/2013/May/IND.pdf
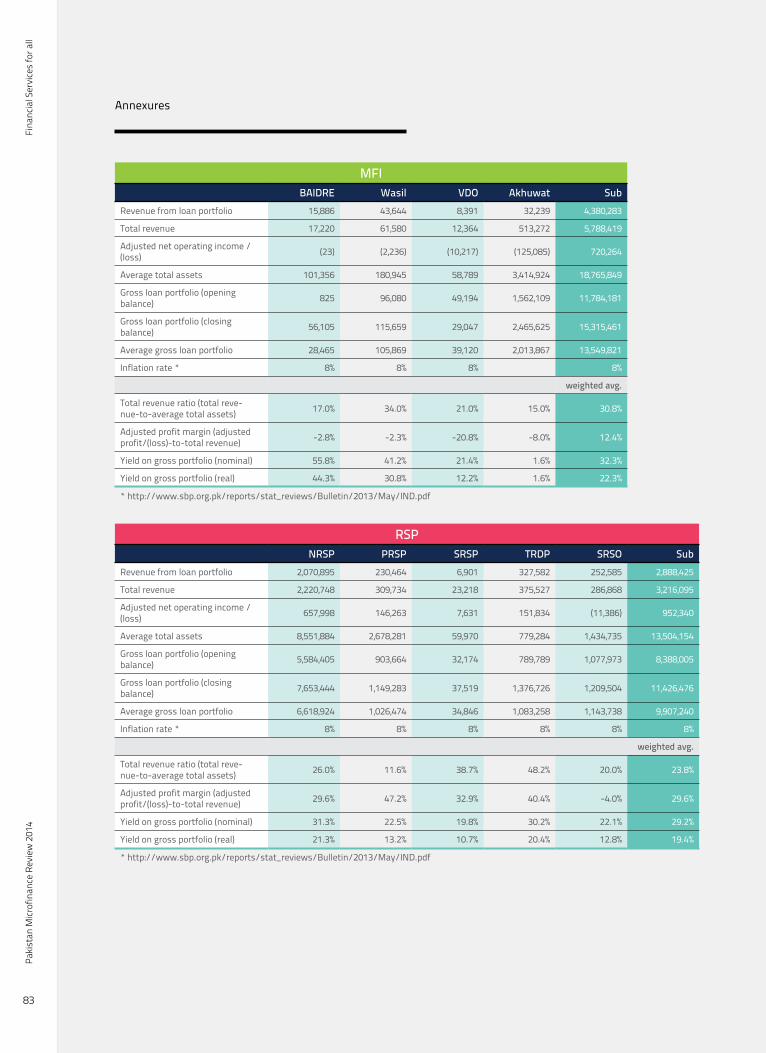
Fina
ncia
l Ser
vice
s fo
r all
Paki
stan
Micr
ofin
ance
Rev
iew
201
4
83
Annexures
MFIBAIDRE Wasil VDO Akhuwat Sub
Revenue from loan portfolio 15,886 43,644 8,391 32,239 4,380,283
Total revenue 17,220 61,580 12,364 513,272 5,788,419
Adjusted net operating income / (loss) (23) (2,236) (10,217) (125,085) 720,264
Average total assets 101,356 180,945 58,789 3,414,924 18,765,849
Gross loan portfolio (opening balance) 825 96,080 49,194 1,562,109 11,784,181
Gross loan portfolio (closing balance) 56,105 115,659 29,047 2,465,625 15,315,461
Average gross loan portfolio 28,465 105,869 39,120 2,013,867 13,549,821
Inflation rate * 8% 8% 8% 8%
weighted avg.
Total revenue ratio (total reve-nue-to-average total assets) 17.0% 34.0% 21.0% 15.0% 30.8%
Adjusted profit margin (adjusted profit/(loss)-to-total revenue) -2.8% -2.3% -20.8% -8.0% 12.4%
Yield on gross portfolio (nominal) 55.8% 41.2% 21.4% 1.6% 32.3%
Yield on gross portfolio (real) 44.3% 30.8% 12.2% 1.6% 22.3%
* http://www.sbp.org.pk/reports/stat_reviews/Bulletin/2013/May/IND.pdf
RSPNRSP PRSP SRSP TRDP SRSO Sub
Revenue from loan portfolio 2,070,895 230,464 6,901 327,582 252,585 2,888,425
Total revenue 2,220,748 309,734 23,218 375,527 286,868 3,216,095
Adjusted net operating income / (loss) 657,998 146,263 7,631 151,834 (11,386) 952,340
Average total assets 8,551,884 2,678,281 59,970 779,284 1,434,735 13,504,154
Gross loan portfolio (opening balance) 5,584,405 903,664 32,174 789,789 1,077,973 8,388,005
Gross loan portfolio (closing balance) 7,653,444 1,149,283 37,519 1,376,726 1,209,504 11,426,476
Average gross loan portfolio 6,618,924 1,026,474 34,846 1,083,258 1,143,738 9,907,240
Inflation rate * 8% 8% 8% 8% 8% 8%
weighted avg.
Total revenue ratio (total reve-nue-to-average total assets) 26.0% 11.6% 38.7% 48.2% 20.0% 23.8%
Adjusted profit margin (adjusted profit/(loss)-to-total revenue) 29.6% 47.2% 32.9% 40.4% -4.0% 29.6%
Yield on gross portfolio (nominal) 31.3% 22.5% 19.8% 30.2% 22.1% 29.2%
Yield on gross portfolio (real) 21.3% 13.2% 10.7% 20.4% 12.8% 19.4%
* http://www.sbp.org.pk/reports/stat_reviews/Bulletin/2013/May/IND.pdf
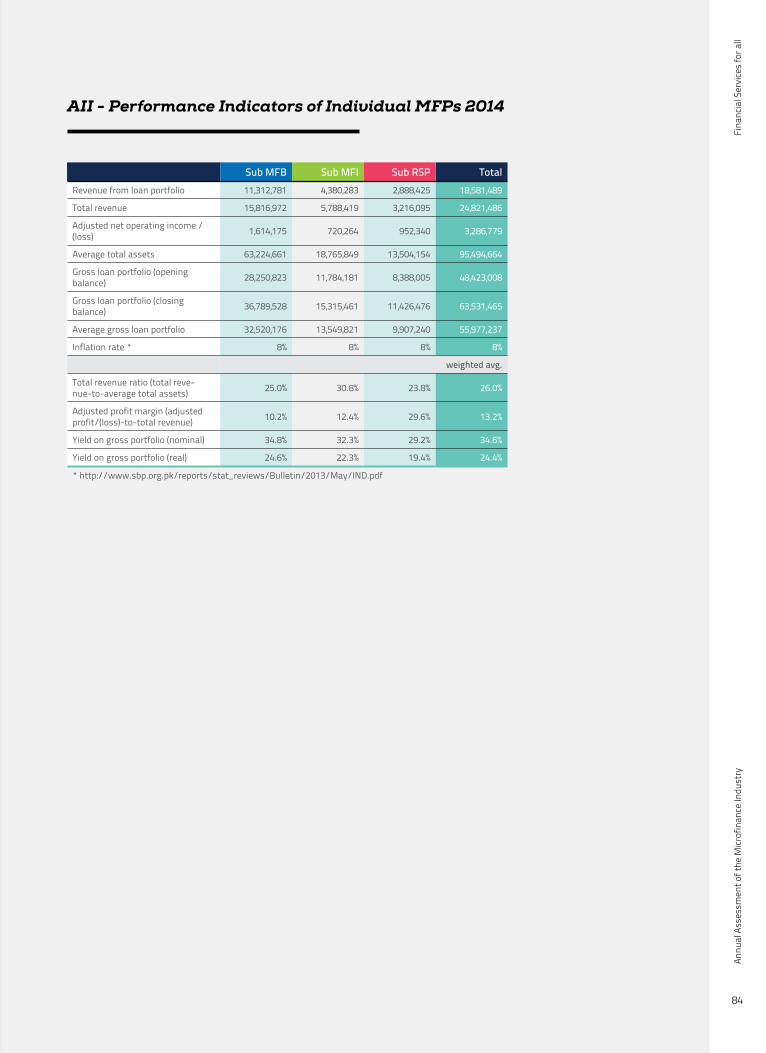
Fina
ncia
l Ser
vice
s fo
r all
Annu
al A
sses
smen
t of t
he M
icrof
inan
ce In
dust
ry
84
AII - Performance Indicators of Individual MFPs 2014
Sub MFB Sub MFI Sub RSP TotalRevenue from loan portfolio 11,312,781 4,380,283 2,888,425 18,581,489
Total revenue 15,816,972 5,788,419 3,216,095 24,821,486
Adjusted net operating income / (loss) 1,614,175 720,264 952,340 3,286,779
Average total assets 63,224,661 18,765,849 13,504,154 95,494,664
Gross loan portfolio (opening balance) 28,250,823 11,784,181 8,388,005 48,423,008
Gross loan portfolio (closing balance) 36,789,528 15,315,461 11,426,476 63,531,465
Average gross loan portfolio 32,520,176 13,549,821 9,907,240 55,977,237
Inflation rate * 8% 8% 8% 8%
weighted avg.
Total revenue ratio (total reve-nue-to-average total assets) 25.0% 30.8% 23.8% 26.0%
Adjusted profit margin (adjusted profit/(loss)-to-total revenue) 10.2% 12.4% 29.6% 13.2%
Yield on gross portfolio (nominal) 34.8% 32.3% 29.2% 34.6%
Yield on gross portfolio (real) 24.6% 22.3% 19.4% 24.4%
* http://www.sbp.org.pk/reports/stat_reviews/Bulletin/2013/May/IND.pdf
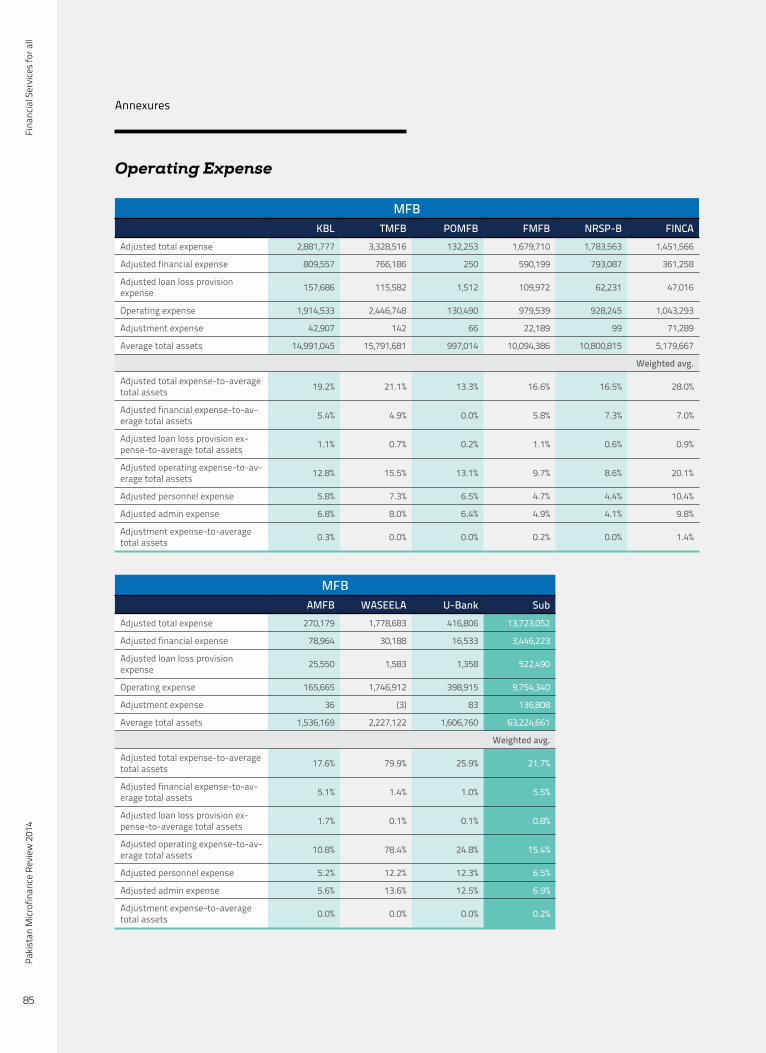
Fina
ncia
l Ser
vice
s fo
r all
Paki
stan
Micr
ofin
ance
Rev
iew
201
4
85
Annexures
Operating Expense
MFBKBL TMFB POMFB FMFB NRSP-B FINCA
Adjusted total expense 2,881,777 3,328,516 132,253 1,679,710 1,783,563 1,451,566
Adjusted financial expense 809,557 766,186 250 590,199 793,087 361,258
Adjusted loan loss provision expense 157,686 115,582 1,512 109,972 62,231 47,016
Operating expense 1,914,533 2,446,748 130,490 979,539 928,245 1,043,293
Adjustment expense 42,907 142 66 22,189 99 71,289
Average total assets 14,991,045 15,791,681 997,014 10,094,386 10,800,815 5,179,667
Weighted avg.
Adjusted total expense-to-average total assets 19.2% 21.1% 13.3% 16.6% 16.5% 28.0%
Adjusted financial expense-to-av-erage total assets 5.4% 4.9% 0.0% 5.8% 7.3% 7.0%
Adjusted loan loss provision ex-pense-to-average total assets 1.1% 0.7% 0.2% 1.1% 0.6% 0.9%
Adjusted operating expense-to-av-erage total assets 12.8% 15.5% 13.1% 9.7% 8.6% 20.1%
Adjusted personnel expense 5.8% 7.3% 6.5% 4.7% 4.4% 10.4%
Adjusted admin expense 6.8% 8.0% 6.4% 4.9% 4.1% 9.8%
Adjustment expense-to-average total assets 0.3% 0.0% 0.0% 0.2% 0.0% 1.4%
MFBAMFB WASEELA U-Bank Sub
Adjusted total expense 270,179 1,778,683 416,806 13,723,052
Adjusted financial expense 78,964 30,188 16,533 3,446,223
Adjusted loan loss provision expense 25,550 1,583 1,358 522,490
Operating expense 165,665 1,746,912 398,915 9,754,340
Adjustment expense 36 (3) 83 136,808
Average total assets 1,536,169 2,227,122 1,606,760 63,224,661
Weighted avg.
Adjusted total expense-to-average total assets 17.6% 79.9% 25.9% 21.7%
Adjusted financial expense-to-av-erage total assets 5.1% 1.4% 1.0% 5.5%
Adjusted loan loss provision ex-pense-to-average total assets 1.7% 0.1% 0.1% 0.8%
Adjusted operating expense-to-av-erage total assets 10.8% 78.4% 24.8% 15.4%
Adjusted personnel expense 5.2% 12.2% 12.3% 6.5%
Adjusted admin expense 5.6% 13.6% 12.5% 6.9%
Adjustment expense-to-average total assets 0.0% 0.0% 0.0% 0.2%
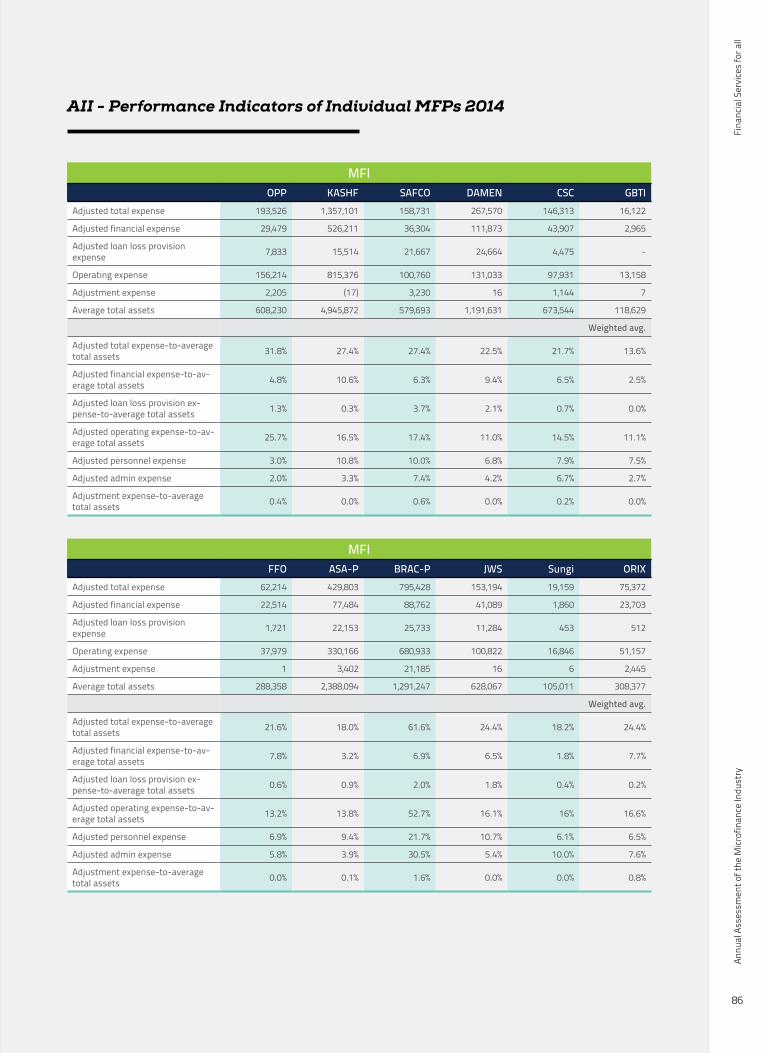
Fina
ncia
l Ser
vice
s fo
r all
Annu
al A
sses
smen
t of t
he M
icrof
inan
ce In
dust
ry
86
AII - Performance Indicators of Individual MFPs 2014
MFIOPP KASHF SAFCO DAMEN CSC GBTI
Adjusted total expense 193,526 1,357,101 158,731 267,570 146,313 16,122
Adjusted financial expense 29,479 526,211 36,304 111,873 43,907 2,965
Adjusted loan loss provision expense 7,833 15,514 21,667 24,664 4,475 -
Operating expense 156,214 815,376 100,760 131,033 97,931 13,158
Adjustment expense 2,205 (17) 3,230 16 1,144 7
Average total assets 608,230 4,945,872 579,693 1,191,631 673,544 118,629
Weighted avg.
Adjusted total expense-to-average total assets 31.8% 27.4% 27.4% 22.5% 21.7% 13.6%
Adjusted financial expense-to-av-erage total assets 4.8% 10.6% 6.3% 9.4% 6.5% 2.5%
Adjusted loan loss provision ex-pense-to-average total assets 1.3% 0.3% 3.7% 2.1% 0.7% 0.0%
Adjusted operating expense-to-av-erage total assets 25.7% 16.5% 17.4% 11.0% 14.5% 11.1%
Adjusted personnel expense 3.0% 10.8% 10.0% 6.8% 7.9% 7.5%
Adjusted admin expense 2.0% 3.3% 7.4% 4.2% 6.7% 2.7%
Adjustment expense-to-average total assets 0.4% 0.0% 0.6% 0.0% 0.2% 0.0%
MFIFFO ASA-P BRAC-P JWS Sungi ORIX
Adjusted total expense 62,214 429,803 795,428 153,194 19,159 75,372
Adjusted financial expense 22,514 77,484 88,762 41,089 1,860 23,703
Adjusted loan loss provision expense 1,721 22,153 25,733 11,284 453 512
Operating expense 37,979 330,166 680,933 100,822 16,846 51,157
Adjustment expense 1 3,402 21,185 16 6 2,445
Average total assets 288,358 2,388,094 1,291,247 628,067 105,011 308,377
Weighted avg.
Adjusted total expense-to-average total assets 21.6% 18.0% 61.6% 24.4% 18.2% 24.4%
Adjusted financial expense-to-av-erage total assets 7.8% 3.2% 6.9% 6.5% 1.8% 7.7%
Adjusted loan loss provision ex-pense-to-average total assets 0.6% 0.9% 2.0% 1.8% 0.4% 0.2%
Adjusted operating expense-to-av-erage total assets 13.2% 13.8% 52.7% 16.1% 16% 16.6%
Adjusted personnel expense 6.9% 9.4% 21.7% 10.7% 6.1% 6.5%
Adjusted admin expense 5.8% 3.9% 30.5% 5.4% 10.0% 7.6%
Adjustment expense-to-average total assets 0.0% 0.1% 1.6% 0.0% 0.0% 0.8%
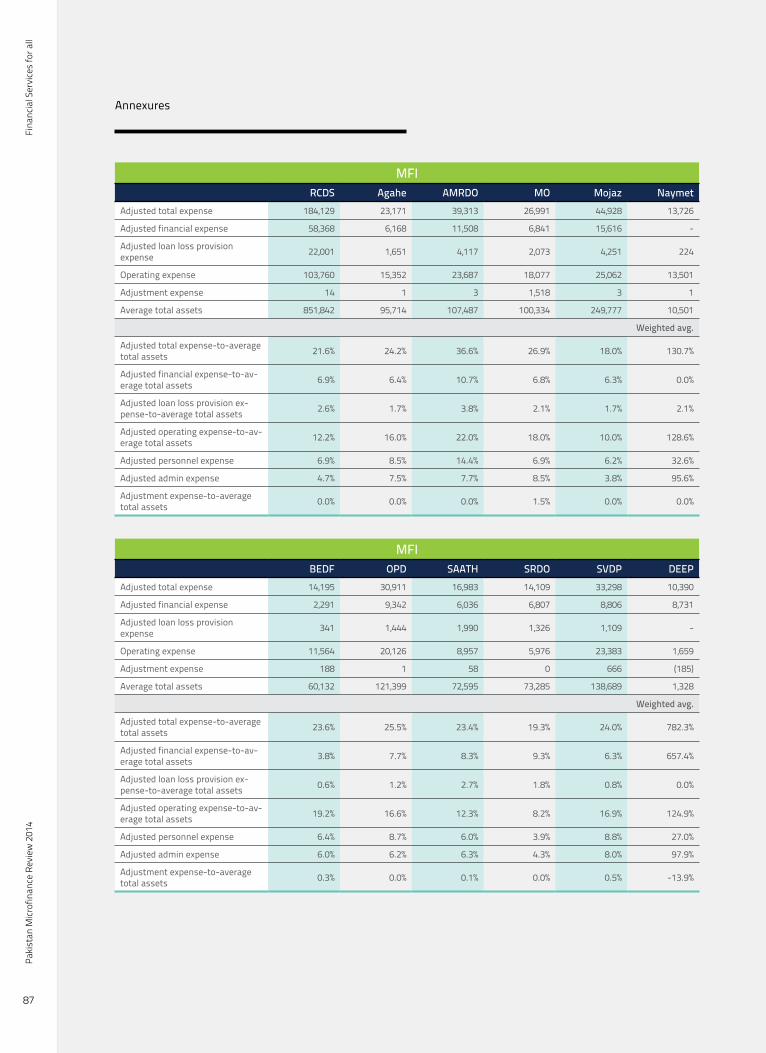
Fina
ncia
l Ser
vice
s fo
r all
Paki
stan
Micr
ofin
ance
Rev
iew
201
4
87
Annexures
MFIRCDS Agahe AMRDO MO Mojaz Naymet
Adjusted total expense 184,129 23,171 39,313 26,991 44,928 13,726
Adjusted financial expense 58,368 6,168 11,508 6,841 15,616 -
Adjusted loan loss provision expense 22,001 1,651 4,117 2,073 4,251 224
Operating expense 103,760 15,352 23,687 18,077 25,062 13,501
Adjustment expense 14 1 3 1,518 3 1
Average total assets 851,842 95,714 107,487 100,334 249,777 10,501
Weighted avg.
Adjusted total expense-to-average total assets 21.6% 24.2% 36.6% 26.9% 18.0% 130.7%
Adjusted financial expense-to-av-erage total assets 6.9% 6.4% 10.7% 6.8% 6.3% 0.0%
Adjusted loan loss provision ex-pense-to-average total assets 2.6% 1.7% 3.8% 2.1% 1.7% 2.1%
Adjusted operating expense-to-av-erage total assets 12.2% 16.0% 22.0% 18.0% 10.0% 128.6%
Adjusted personnel expense 6.9% 8.5% 14.4% 6.9% 6.2% 32.6%
Adjusted admin expense 4.7% 7.5% 7.7% 8.5% 3.8% 95.6%
Adjustment expense-to-average total assets 0.0% 0.0% 0.0% 1.5% 0.0% 0.0%
MFIBEDF OPD SAATH SRDO SVDP DEEP
Adjusted total expense 14,195 30,911 16,983 14,109 33,298 10,390
Adjusted financial expense 2,291 9,342 6,036 6,807 8,806 8,731
Adjusted loan loss provision expense 341 1,444 1,990 1,326 1,109 -
Operating expense 11,564 20,126 8,957 5,976 23,383 1,659
Adjustment expense 188 1 58 0 666 (185)
Average total assets 60,132 121,399 72,595 73,285 138,689 1,328
Weighted avg.
Adjusted total expense-to-average total assets 23.6% 25.5% 23.4% 19.3% 24.0% 782.3%
Adjusted financial expense-to-av-erage total assets 3.8% 7.7% 8.3% 9.3% 6.3% 657.4%
Adjusted loan loss provision ex-pense-to-average total assets 0.6% 1.2% 2.7% 1.8% 0.8% 0.0%
Adjusted operating expense-to-av-erage total assets 19.2% 16.6% 12.3% 8.2% 16.9% 124.9%
Adjusted personnel expense 6.4% 8.7% 6.0% 3.9% 8.8% 27.0%
Adjusted admin expense 6.0% 6.2% 6.3% 4.3% 8.0% 97.9%
Adjustment expense-to-average total assets 0.3% 0.0% 0.1% 0.0% 0.5% -13.9%
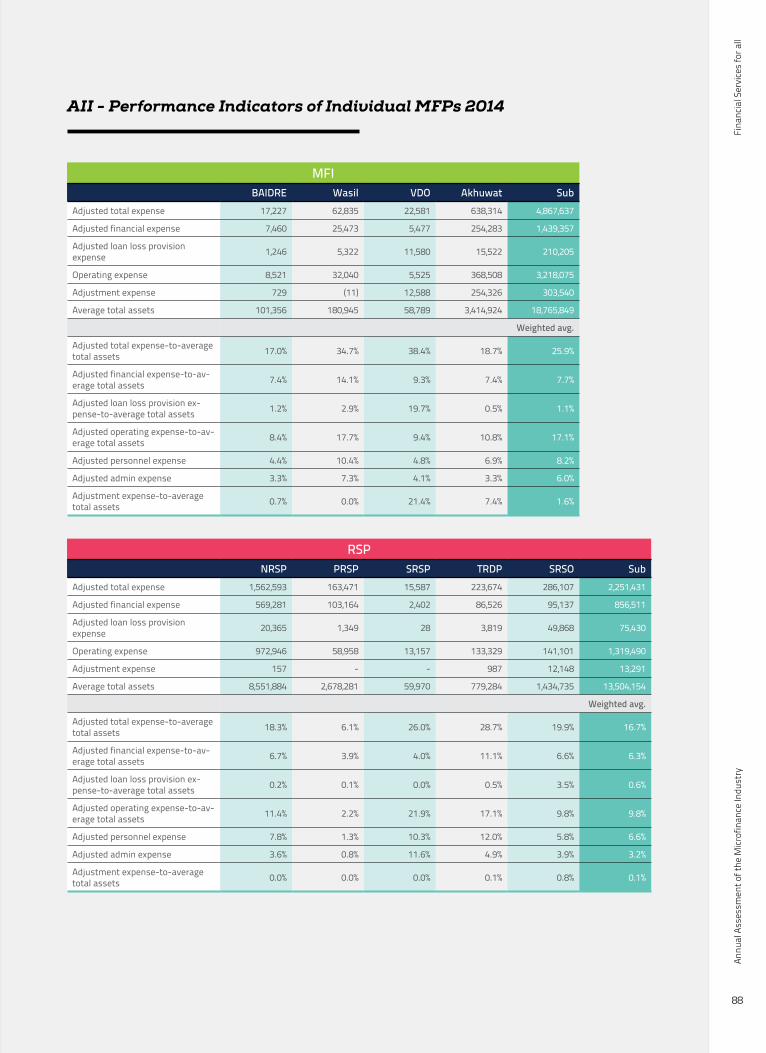
Fina
ncia
l Ser
vice
s fo
r all
Annu
al A
sses
smen
t of t
he M
icrof
inan
ce In
dust
ry
88
AII - Performance Indicators of Individual MFPs 2014
MFIBAIDRE Wasil VDO Akhuwat Sub
Adjusted total expense 17,227 62,835 22,581 638,314 4,867,637
Adjusted financial expense 7,460 25,473 5,477 254,283 1,439,357
Adjusted loan loss provision expense 1,246 5,322 11,580 15,522 210,205
Operating expense 8,521 32,040 5,525 368,508 3,218,075
Adjustment expense 729 (11) 12,588 254,326 303,540
Average total assets 101,356 180,945 58,789 3,414,924 18,765,849
Weighted avg.
Adjusted total expense-to-average total assets 17.0% 34.7% 38.4% 18.7% 25.9%
Adjusted financial expense-to-av-erage total assets 7.4% 14.1% 9.3% 7.4% 7.7%
Adjusted loan loss provision ex-pense-to-average total assets 1.2% 2.9% 19.7% 0.5% 1.1%
Adjusted operating expense-to-av-erage total assets 8.4% 17.7% 9.4% 10.8% 17.1%
Adjusted personnel expense 4.4% 10.4% 4.8% 6.9% 8.2%
Adjusted admin expense 3.3% 7.3% 4.1% 3.3% 6.0%
Adjustment expense-to-average total assets 0.7% 0.0% 21.4% 7.4% 1.6%
RSPNRSP PRSP SRSP TRDP SRSO Sub
Adjusted total expense 1,562,593 163,471 15,587 223,674 286,107 2,251,431
Adjusted financial expense 569,281 103,164 2,402 86,526 95,137 856,511
Adjusted loan loss provision expense 20,365 1,349 28 3,819 49,868 75,430
Operating expense 972,946 58,958 13,157 133,329 141,101 1,319,490
Adjustment expense 157 - - 987 12,148 13,291
Average total assets 8,551,884 2,678,281 59,970 779,284 1,434,735 13,504,154
Weighted avg.
Adjusted total expense-to-average total assets 18.3% 6.1% 26.0% 28.7% 19.9% 16.7%
Adjusted financial expense-to-av-erage total assets 6.7% 3.9% 4.0% 11.1% 6.6% 6.3%
Adjusted loan loss provision ex-pense-to-average total assets 0.2% 0.1% 0.0% 0.5% 3.5% 0.6%
Adjusted operating expense-to-av-erage total assets 11.4% 2.2% 21.9% 17.1% 9.8% 9.8%
Adjusted personnel expense 7.8% 1.3% 10.3% 12.0% 5.8% 6.6%
Adjusted admin expense 3.6% 0.8% 11.6% 4.9% 3.9% 3.2%
Adjustment expense-to-average total assets 0.0% 0.0% 0.0% 0.1% 0.8% 0.1%
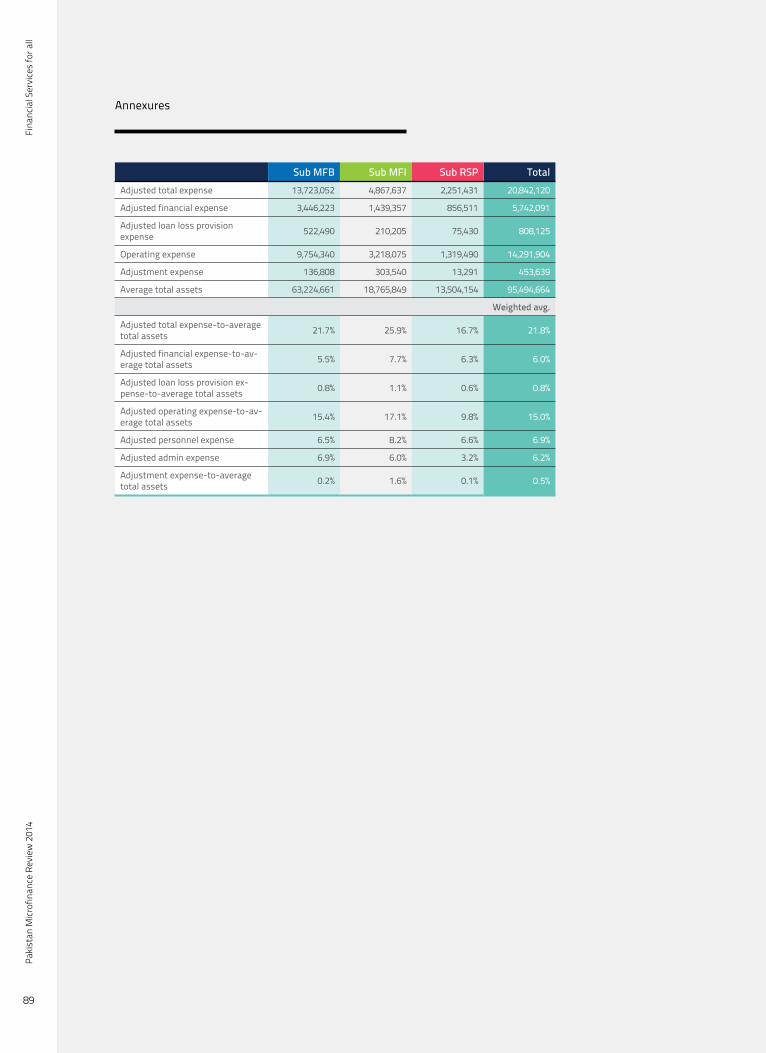
Fina
ncia
l Ser
vice
s fo
r all
Paki
stan
Micr
ofin
ance
Rev
iew
201
4
89
Annexures
Sub MFB Sub MFI Sub RSP TotalAdjusted total expense 13,723,052 4,867,637 2,251,431 20,842,120
Adjusted financial expense 3,446,223 1,439,357 856,511 5,742,091
Adjusted loan loss provision expense 522,490 210,205 75,430 808,125
Operating expense 9,754,340 3,218,075 1,319,490 14,291,904
Adjustment expense 136,808 303,540 13,291 453,639
Average total assets 63,224,661 18,765,849 13,504,154 95,494,664
Weighted avg.
Adjusted total expense-to-average total assets 21.7% 25.9% 16.7% 21.8%
Adjusted financial expense-to-av-erage total assets 5.5% 7.7% 6.3% 6.0%
Adjusted loan loss provision ex-pense-to-average total assets 0.8% 1.1% 0.6% 0.8%
Adjusted operating expense-to-av-erage total assets 15.4% 17.1% 9.8% 15.0%
Adjusted personnel expense 6.5% 8.2% 6.6% 6.9%
Adjusted admin expense 6.9% 6.0% 3.2% 6.2%
Adjustment expense-to-average total assets 0.2% 1.6% 0.1% 0.5%
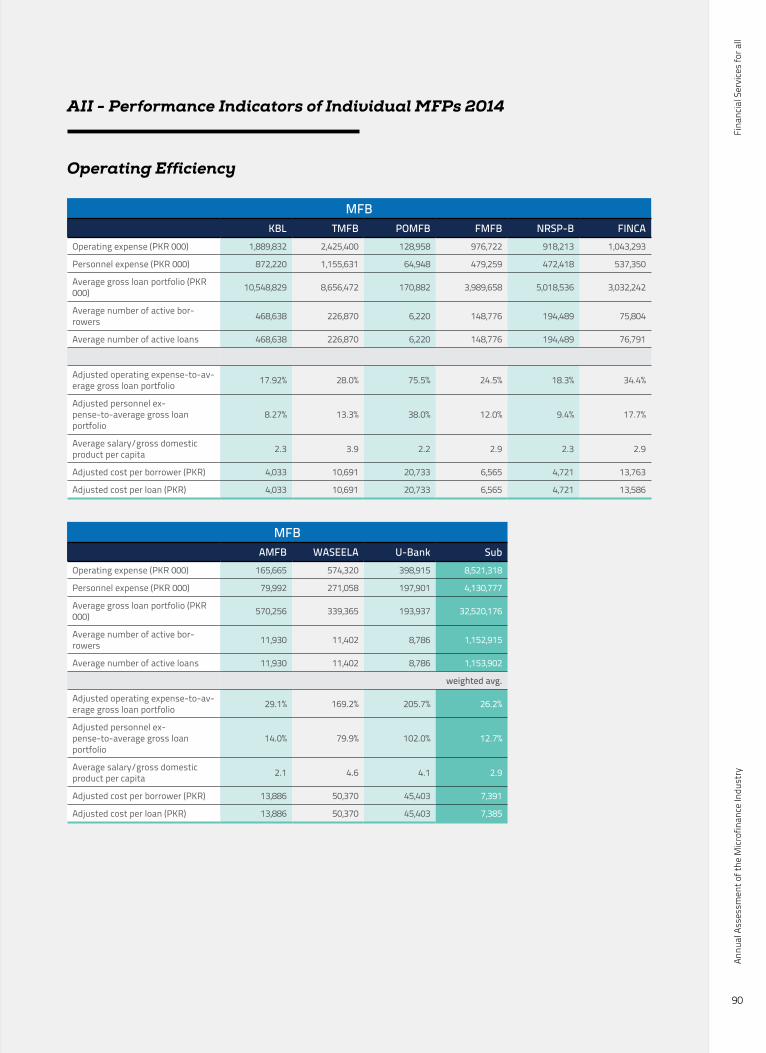
Fina
ncia
l Ser
vice
s fo
r all
Annu
al A
sses
smen
t of t
he M
icrof
inan
ce In
dust
ry
90
AII - Performance Indicators of Individual MFPs 2014
Operating Efficiency
MFBKBL TMFB POMFB FMFB NRSP-B FINCA
Operating expense (PKR 000) 1,889,832 2,425,400 128,958 976,722 918,213 1,043,293
Personnel expense (PKR 000) 872,220 1,155,631 64,948 479,259 472,418 537,350
Average gross loan portfolio (PKR 000) 10,548,829 8,656,472 170,882 3,989,658 5,018,536 3,032,242
Average number of active bor-rowers 468,638 226,870 6,220 148,776 194,489 75,804
Average number of active loans 468,638 226,870 6,220 148,776 194,489 76,791
Adjusted operating expense-to-av-erage gross loan portfolio 17.92% 28.0% 75.5% 24.5% 18.3% 34.4%
Adjusted personnel ex-pense-to-average gross loan portfolio
8.27% 13.3% 38.0% 12.0% 9.4% 17.7%
Average salary/gross domestic product per capita 2.3 3.9 2.2 2.9 2.3 2.9
Adjusted cost per borrower (PKR) 4,033 10,691 20,733 6,565 4,721 13,763
Adjusted cost per loan (PKR) 4,033 10,691 20,733 6,565 4,721 13,586
MFBAMFB WASEELA U-Bank Sub
Operating expense (PKR 000) 165,665 574,320 398,915 8,521,318
Personnel expense (PKR 000) 79,992 271,058 197,901 4,130,777
Average gross loan portfolio (PKR 000) 570,256 339,365 193,937 32,520,176
Average number of active bor-rowers 11,930 11,402 8,786 1,152,915
Average number of active loans 11,930 11,402 8,786 1,153,902
weighted avg.
Adjusted operating expense-to-av-erage gross loan portfolio 29.1% 169.2% 205.7% 26.2%
Adjusted personnel ex-pense-to-average gross loan portfolio
14.0% 79.9% 102.0% 12.7%
Average salary/gross domestic product per capita 2.1 4.6 4.1 2.9
Adjusted cost per borrower (PKR) 13,886 50,370 45,403 7,391
Adjusted cost per loan (PKR) 13,886 50,370 45,403 7,385
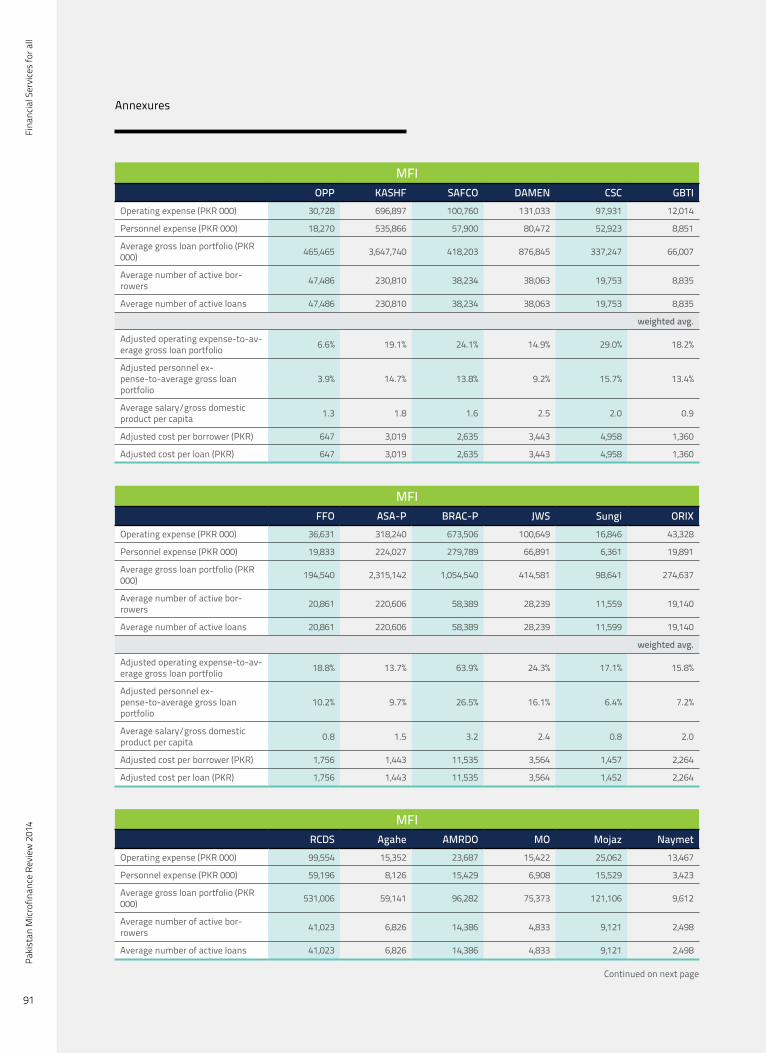
Fina
ncia
l Ser
vice
s fo
r all
Paki
stan
Micr
ofin
ance
Rev
iew
201
4
91
Annexures
MFIOPP KASHF SAFCO DAMEN CSC GBTI
Operating expense (PKR 000) 30,728 696,897 100,760 131,033 97,931 12,014
Personnel expense (PKR 000) 18,270 535,866 57,900 80,472 52,923 8,851
Average gross loan portfolio (PKR 000) 465,465 3,647,740 418,203 876,845 337,247 66,007
Average number of active bor-rowers 47,486 230,810 38,234 38,063 19,753 8,835
Average number of active loans 47,486 230,810 38,234 38,063 19,753 8,835
weighted avg.
Adjusted operating expense-to-av-erage gross loan portfolio 6.6% 19.1% 24.1% 14.9% 29.0% 18.2%
Adjusted personnel ex-pense-to-average gross loan portfolio
3.9% 14.7% 13.8% 9.2% 15.7% 13.4%
Average salary/gross domestic product per capita 1.3 1.8 1.6 2.5 2.0 0.9
Adjusted cost per borrower (PKR) 647 3,019 2,635 3,443 4,958 1,360
Adjusted cost per loan (PKR) 647 3,019 2,635 3,443 4,958 1,360
MFIFFO ASA-P BRAC-P JWS Sungi ORIX
Operating expense (PKR 000) 36,631 318,240 673,506 100,649 16,846 43,328
Personnel expense (PKR 000) 19,833 224,027 279,789 66,891 6,361 19,891
Average gross loan portfolio (PKR 000) 194,540 2,315,142 1,054,540 414,581 98,641 274,637
Average number of active bor-rowers 20,861 220,606 58,389 28,239 11,559 19,140
Average number of active loans 20,861 220,606 58,389 28,239 11,599 19,140
weighted avg.
Adjusted operating expense-to-av-erage gross loan portfolio 18.8% 13.7% 63.9% 24.3% 17.1% 15.8%
Adjusted personnel ex-pense-to-average gross loan portfolio
10.2% 9.7% 26.5% 16.1% 6.4% 7.2%
Average salary/gross domestic product per capita 0.8 1.5 3.2 2.4 0.8 2.0
Adjusted cost per borrower (PKR) 1,756 1,443 11,535 3,564 1,457 2,264
Adjusted cost per loan (PKR) 1,756 1,443 11,535 3,564 1,452 2,264
MFIRCDS Agahe AMRDO MO Mojaz Naymet
Operating expense (PKR 000) 99,554 15,352 23,687 15,422 25,062 13,467
Personnel expense (PKR 000) 59,196 8,126 15,429 6,908 15,529 3,423
Average gross loan portfolio (PKR 000) 531,006 59,141 96,282 75,373 121,106 9,612
Average number of active bor-rowers 41,023 6,826 14,386 4,833 9,121 2,498
Average number of active loans 41,023 6,826 14,386 4,833 9,121 2,498
Continued on next page
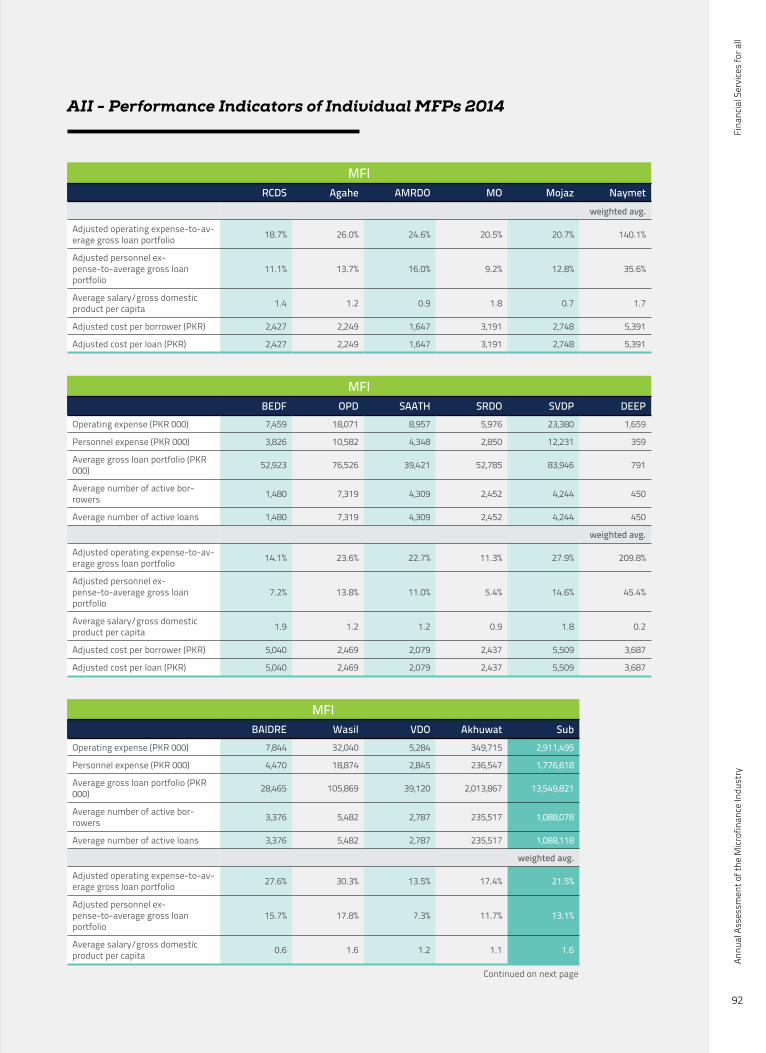
Fina
ncia
l Ser
vice
s fo
r all
Annu
al A
sses
smen
t of t
he M
icrof
inan
ce In
dust
ry
92
AII - Performance Indicators of Individual MFPs 2014
MFIRCDS Agahe AMRDO MO Mojaz Naymet
weighted avg.
Adjusted operating expense-to-av-erage gross loan portfolio 18.7% 26.0% 24.6% 20.5% 20.7% 140.1%
Adjusted personnel ex-pense-to-average gross loan portfolio
11.1% 13.7% 16.0% 9.2% 12.8% 35.6%
Average salary/gross domestic product per capita 1.4 1.2 0.9 1.8 0.7 1.7
Adjusted cost per borrower (PKR) 2,427 2,249 1,647 3,191 2,748 5,391
Adjusted cost per loan (PKR) 2,427 2,249 1,647 3,191 2,748 5,391
MFIBEDF OPD SAATH SRDO SVDP DEEP
Operating expense (PKR 000) 7,459 18,071 8,957 5,976 23,380 1,659
Personnel expense (PKR 000) 3,826 10,582 4,348 2,850 12,231 359
Average gross loan portfolio (PKR 000) 52,923 76,526 39,421 52,785 83,946 791
Average number of active bor-rowers 1,480 7,319 4,309 2,452 4,244 450
Average number of active loans 1,480 7,319 4,309 2,452 4,244 450
weighted avg.
Adjusted operating expense-to-av-erage gross loan portfolio 14.1% 23.6% 22.7% 11.3% 27.9% 209.8%
Adjusted personnel ex-pense-to-average gross loan portfolio
7.2% 13.8% 11.0% 5.4% 14.6% 45.4%
Average salary/gross domestic product per capita 1.9 1.2 1.2 0.9 1.8 0.2
Adjusted cost per borrower (PKR) 5,040 2,469 2,079 2,437 5,509 3,687
Adjusted cost per loan (PKR) 5,040 2,469 2,079 2,437 5,509 3,687
MFIBAIDRE Wasil VDO Akhuwat Sub
Operating expense (PKR 000) 7,844 32,040 5,284 349,715 2,911,495
Personnel expense (PKR 000) 4,470 18,874 2,845 236,547 1,776,618
Average gross loan portfolio (PKR 000) 28,465 105,869 39,120 2,013,867 13,549,821
Average number of active bor-rowers 3,376 5,482 2,787 235,517 1,088,078
Average number of active loans 3,376 5,482 2,787 235,517 1,088,118
weighted avg.
Adjusted operating expense-to-av-erage gross loan portfolio 27.6% 30.3% 13.5% 17.4% 21.5%
Adjusted personnel ex-pense-to-average gross loan portfolio
15.7% 17.8% 7.3% 11.7% 13.1%
Average salary/gross domestic product per capita 0.6 1.6 1.2 1.1 1.6
Continued on next page
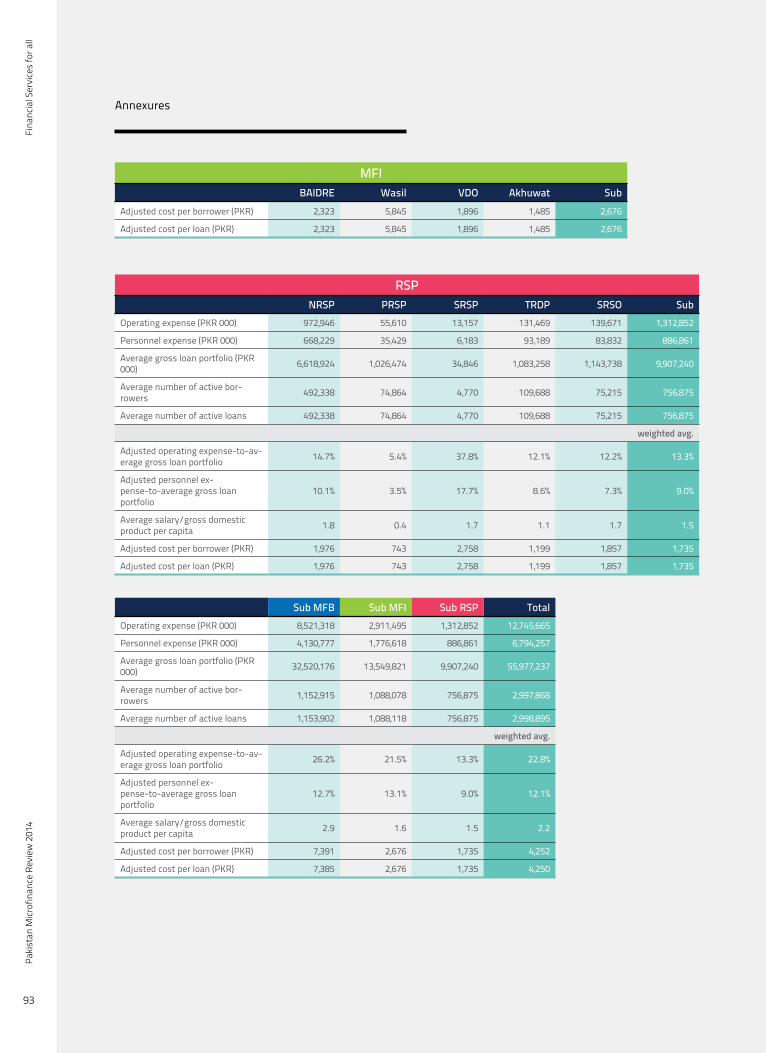
Fina
ncia
l Ser
vice
s fo
r all
Paki
stan
Micr
ofin
ance
Rev
iew
201
4
93
Annexures
MFIBAIDRE Wasil VDO Akhuwat Sub
Adjusted cost per borrower (PKR) 2,323 5,845 1,896 1,485 2,676
Adjusted cost per loan (PKR) 2,323 5,845 1,896 1,485 2,676
RSPNRSP PRSP SRSP TRDP SRSO Sub
Operating expense (PKR 000) 972,946 55,610 13,157 131,469 139,671 1,312,852
Personnel expense (PKR 000) 668,229 35,429 6,183 93,189 83,832 886,861
Average gross loan portfolio (PKR 000) 6,618,924 1,026,474 34,846 1,083,258 1,143,738 9,907,240
Average number of active bor-rowers 492,338 74,864 4,770 109,688 75,215 756,875
Average number of active loans 492,338 74,864 4,770 109,688 75,215 756,875
weighted avg.
Adjusted operating expense-to-av-erage gross loan portfolio 14.7% 5.4% 37.8% 12.1% 12.2% 13.3%
Adjusted personnel ex-pense-to-average gross loan portfolio
10.1% 3.5% 17.7% 8.6% 7.3% 9.0%
Average salary/gross domestic product per capita 1.8 0.4 1.7 1.1 1.7 1.5
Adjusted cost per borrower (PKR) 1,976 743 2,758 1,199 1,857 1,735
Adjusted cost per loan (PKR) 1,976 743 2,758 1,199 1,857 1,735
Sub MFB Sub MFI Sub RSP TotalOperating expense (PKR 000) 8,521,318 2,911,495 1,312,852 12,745,665
Personnel expense (PKR 000) 4,130,777 1,776,618 886,861 6,794,257
Average gross loan portfolio (PKR 000) 32,520,176 13,549,821 9,907,240 55,977,237
Average number of active bor-rowers 1,152,915 1,088,078 756,875 2,997,868
Average number of active loans 1,153,902 1,088,118 756,875 2,998,895
weighted avg.
Adjusted operating expense-to-av-erage gross loan portfolio 26.2% 21.5% 13.3% 22.8%
Adjusted personnel ex-pense-to-average gross loan portfolio
12.7% 13.1% 9.0% 12.1%
Average salary/gross domestic product per capita 2.9 1.6 1.5 2.2
Adjusted cost per borrower (PKR) 7,391 2,676 1,735 4,252
Adjusted cost per loan (PKR) 7,385 2,676 1,735 4,250
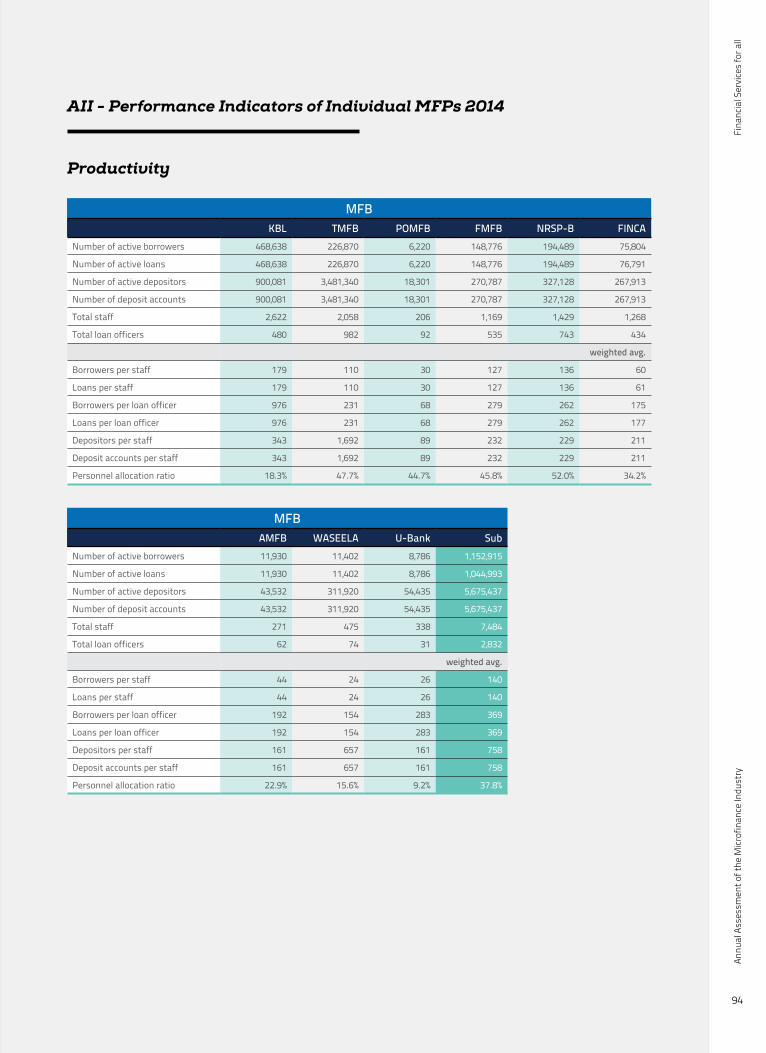
Fina
ncia
l Ser
vice
s fo
r all
Annu
al A
sses
smen
t of t
he M
icrof
inan
ce In
dust
ry
94
AII - Performance Indicators of Individual MFPs 2014
Productivity
MFBKBL TMFB POMFB FMFB NRSP-B FINCA
Number of active borrowers 468,638 226,870 6,220 148,776 194,489 75,804
Number of active loans 468,638 226,870 6,220 148,776 194,489 76,791
Number of active depositors 900,081 3,481,340 18,301 270,787 327,128 267,913
Number of deposit accounts 900,081 3,481,340 18,301 270,787 327,128 267,913
Total staff 2,622 2,058 206 1,169 1,429 1,268
Total loan officers 480 982 92 535 743 434
weighted avg.
Borrowers per staff 179 110 30 127 136 60
Loans per staff 179 110 30 127 136 61
Borrowers per loan officer 976 231 68 279 262 175
Loans per loan officer 976 231 68 279 262 177
Depositors per staff 343 1,692 89 232 229 211
Deposit accounts per staff 343 1,692 89 232 229 211
Personnel allocation ratio 18.3% 47.7% 44.7% 45.8% 52.0% 34.2%
MFBAMFB WASEELA U-Bank Sub
Number of active borrowers 11,930 11,402 8,786 1,152,915
Number of active loans 11,930 11,402 8,786 1,044,993
Number of active depositors 43,532 311,920 54,435 5,675,437
Number of deposit accounts 43,532 311,920 54,435 5,675,437
Total staff 271 475 338 7,484
Total loan officers 62 74 31 2,832
weighted avg.
Borrowers per staff 44 24 26 140
Loans per staff 44 24 26 140
Borrowers per loan officer 192 154 283 369
Loans per loan officer 192 154 283 369
Depositors per staff 161 657 161 758
Deposit accounts per staff 161 657 161 758
Personnel allocation ratio 22.9% 15.6% 9.2% 37.8%
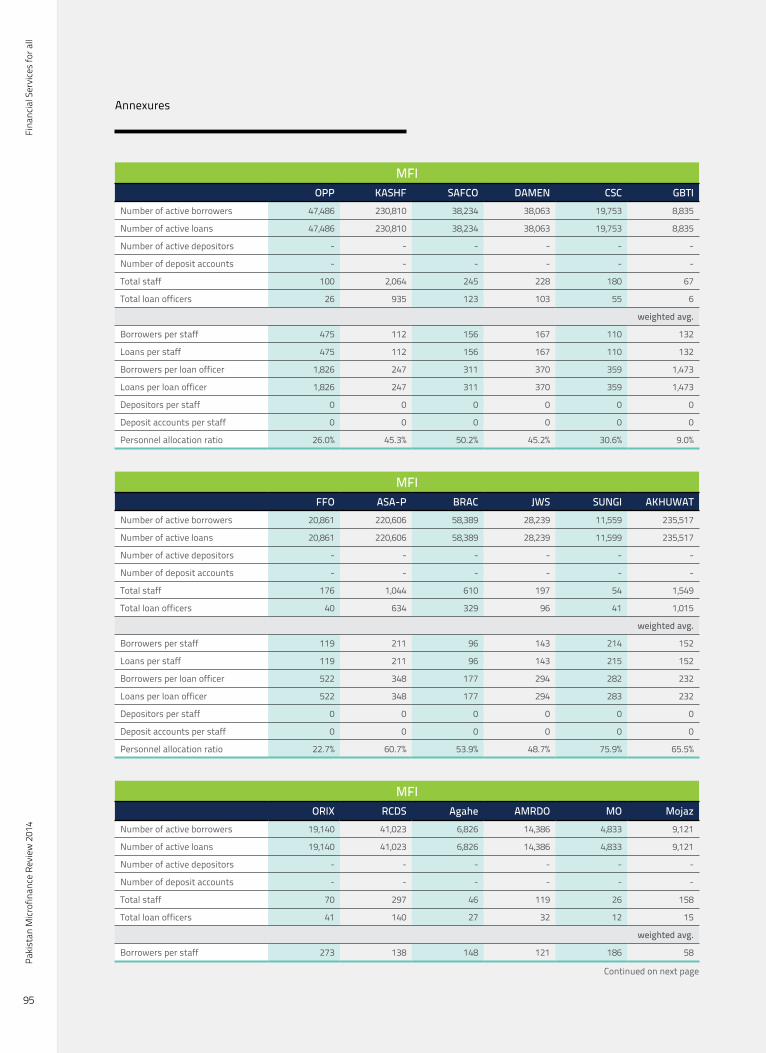
Fina
ncia
l Ser
vice
s fo
r all
Paki
stan
Micr
ofin
ance
Rev
iew
201
4
95
Annexures
MFIOPP KASHF SAFCO DAMEN CSC GBTI
Number of active borrowers 47,486 230,810 38,234 38,063 19,753 8,835
Number of active loans 47,486 230,810 38,234 38,063 19,753 8,835
Number of active depositors - - - - - -
Number of deposit accounts - - - - - -
Total staff 100 2,064 245 228 180 67
Total loan officers 26 935 123 103 55 6
weighted avg.
Borrowers per staff 475 112 156 167 110 132
Loans per staff 475 112 156 167 110 132
Borrowers per loan officer 1,826 247 311 370 359 1,473
Loans per loan officer 1,826 247 311 370 359 1,473
Depositors per staff 0 0 0 0 0 0
Deposit accounts per staff 0 0 0 0 0 0
Personnel allocation ratio 26.0% 45.3% 50.2% 45.2% 30.6% 9.0%
MFIFFO ASA-P BRAC JWS SUNGI AKHUWAT
Number of active borrowers 20,861 220,606 58,389 28,239 11,559 235,517
Number of active loans 20,861 220,606 58,389 28,239 11,599 235,517
Number of active depositors - - - - - -
Number of deposit accounts - - - - - -
Total staff 176 1,044 610 197 54 1,549
Total loan officers 40 634 329 96 41 1,015
weighted avg.
Borrowers per staff 119 211 96 143 214 152
Loans per staff 119 211 96 143 215 152
Borrowers per loan officer 522 348 177 294 282 232
Loans per loan officer 522 348 177 294 283 232
Depositors per staff 0 0 0 0 0 0
Deposit accounts per staff 0 0 0 0 0 0
Personnel allocation ratio 22.7% 60.7% 53.9% 48.7% 75.9% 65.5%
MFIORIX RCDS Agahe AMRDO MO Mojaz
Number of active borrowers 19,140 41,023 6,826 14,386 4,833 9,121
Number of active loans 19,140 41,023 6,826 14,386 4,833 9,121
Number of active depositors - - - - - -
Number of deposit accounts - - - - - -
Total staff 70 297 46 119 26 158
Total loan officers 41 140 27 32 12 15
weighted avg.
Borrowers per staff 273 138 148 121 186 58
Continued on next page

Fina
ncia
l Ser
vice
s fo
r all
Annu
al A
sses
smen
t of t
he M
icrof
inan
ce In
dust
ry
96
AII - Performance Indicators of Individual MFPs 2014
MFIORIX RCDS Agahe AMRDO MO Mojaz
Loans per staff 273 138 148 121 186 58
Borrowers per loan officer 467 293 253 450 403 608
Loans per loan officer 467 293 253 450 403 608
Depositors per staff 0 0 0 0 0 0
Deposit accounts per staff 0 0 0 0 0 0
Personnel allocation ratio 58.6% 47.1% 58.7% 26.9% 46.2% 9.5%
MFINaymet BEDF OPD SAATH SRDO SVDP
Number of active borrowers 2,498 1,480 7,319 4,309 2,452 4,244
Number of active loans 2,498 1,480 7,319 4,309 2,452 4,244
Number of active depositors - - - - - -
Number of deposit accounts - - - - - -
Total staff 14 14 59 25 21 47
Total loan officers 4 6 17 10 6 15
weighted avg.
Borrowers per staff 178 106 124 172 117 90
Loans per staff 178 106 124 172 117 90
Borrowers per loan officer 625 247 431 431 409 283
Loans per loan officer 625 247 431 431 409 283
Depositors per staff 0 0 0 0 0 0
Deposit accounts per staff 0 0 0 0 0 0
Personnel allocation ratio 28.6% 42.9% 28.8% 40.0% 28.6% 31.9%
MFIDEEP BAIDRE Wasil VDO Sub
Number of active borrowers 450 3,376 5,482 2,787 1,088,078
Number of active loans 450 3,376 5,482 2,787 1,099,717
Number of active depositors - - - - -
Number of deposit accounts - - - - -
Total staff 15 56 82 16 7,633
Total loan officers 3 14 44 8 3,834
weighted avg.
Borrowers per staff 30 60 67 174 144
Loans per staff 30 60 67 174 144
Borrowers per loan officer 150 241 125 348 287
Loans per loan officer 150 241 125 348 287
Depositors per staff 0 0 0 0 -
Deposit accounts per staff 0 0 0 0 -
Personnel allocation ratio 20.0% 25.0% 53.7% 50.0% 50.2%
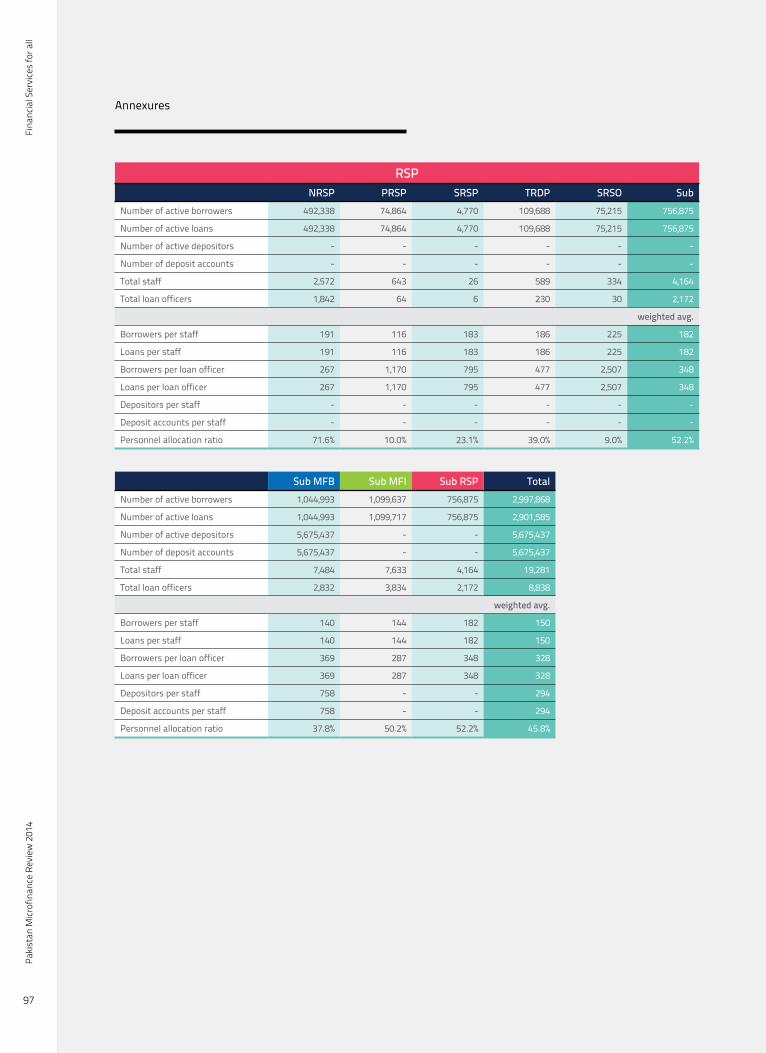
Fina
ncia
l Ser
vice
s fo
r all
Paki
stan
Micr
ofin
ance
Rev
iew
201
4
97
Annexures
RSPNRSP PRSP SRSP TRDP SRSO Sub
Number of active borrowers 492,338 74,864 4,770 109,688 75,215 756,875
Number of active loans 492,338 74,864 4,770 109,688 75,215 756,875
Number of active depositors - - - - - -
Number of deposit accounts - - - - - -
Total staff 2,572 643 26 589 334 4,164
Total loan officers 1,842 64 6 230 30 2,172
weighted avg.
Borrowers per staff 191 116 183 186 225 182
Loans per staff 191 116 183 186 225 182
Borrowers per loan officer 267 1,170 795 477 2,507 348
Loans per loan officer 267 1,170 795 477 2,507 348
Depositors per staff - - - - - -
Deposit accounts per staff - - - - - -
Personnel allocation ratio 71.6% 10.0% 23.1% 39.0% 9.0% 52.2%
Sub MFB Sub MFI Sub RSP TotalNumber of active borrowers 1,044,993 1,099,637 756,875 2,997,868
Number of active loans 1,044,993 1,099,717 756,875 2,901,585
Number of active depositors 5,675,437 - - 5,675,437
Number of deposit accounts 5,675,437 - - 5,675,437
Total staff 7,484 7,633 4,164 19,281
Total loan officers 2,832 3,834 2,172 8,838
weighted avg.
Borrowers per staff 140 144 182 150
Loans per staff 140 144 182 150
Borrowers per loan officer 369 287 348 328
Loans per loan officer 369 287 348 328
Depositors per staff 758 - - 294
Deposit accounts per staff 758 - - 294
Personnel allocation ratio 37.8% 50.2% 52.2% 45.8%
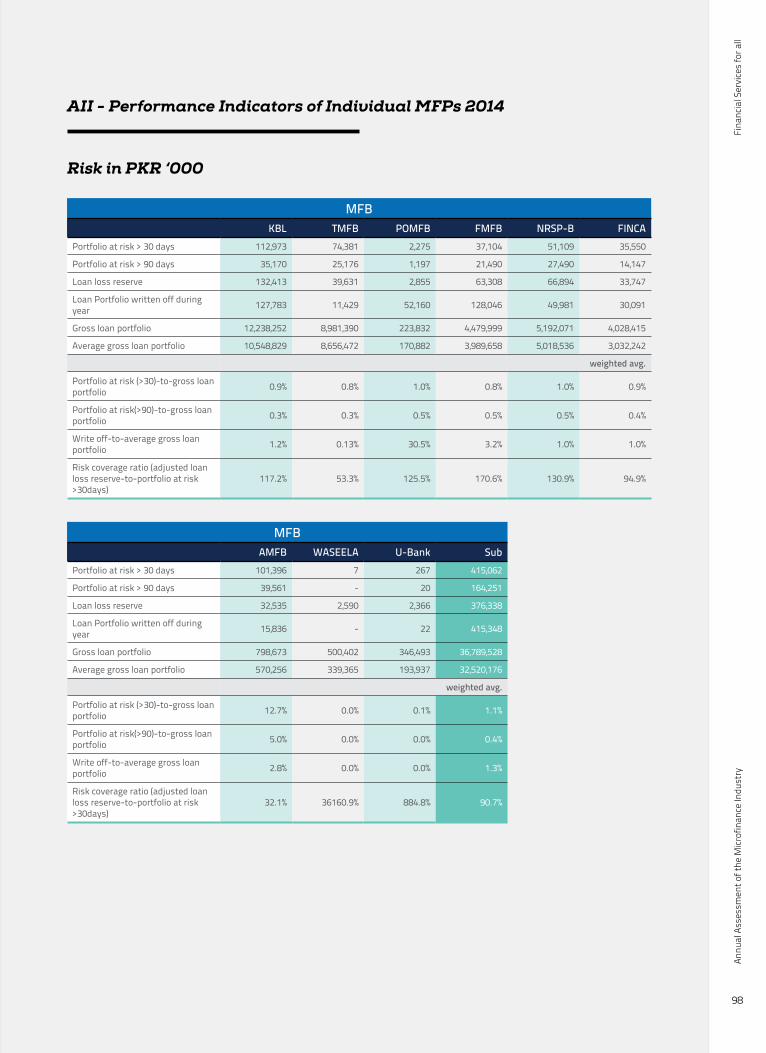
Fina
ncia
l Ser
vice
s fo
r all
Annu
al A
sses
smen
t of t
he M
icrof
inan
ce In
dust
ry
98
AII - Performance Indicators of Individual MFPs 2014
Risk in PKR ‘000
MFBKBL TMFB POMFB FMFB NRSP-B FINCA
Portfolio at risk > 30 days 112,973 74,381 2,275 37,104 51,109 35,550
Portfolio at risk > 90 days 35,170 25,176 1,197 21,490 27,490 14,147
Loan loss reserve 132,413 39,631 2,855 63,308 66,894 33,747
Loan Portfolio written off during year 127,783 11,429 52,160 128,046 49,981 30,091
Gross loan portfolio 12,238,252 8,981,390 223,832 4,479,999 5,192,071 4,028,415
Average gross loan portfolio 10,548,829 8,656,472 170,882 3,989,658 5,018,536 3,032,242
weighted avg.
Portfolio at risk (>30)-to-gross loan portfolio 0.9% 0.8% 1.0% 0.8% 1.0% 0.9%
Portfolio at risk(>90)-to-gross loan portfolio 0.3% 0.3% 0.5% 0.5% 0.5% 0.4%
Write off-to-average gross loan portfolio 1.2% 0.13% 30.5% 3.2% 1.0% 1.0%
Risk coverage ratio (adjusted loan loss reserve-to-portfolio at risk >30days)
117.2% 53.3% 125.5% 170.6% 130.9% 94.9%
MFBAMFB WASEELA U-Bank Sub
Portfolio at risk > 30 days 101,396 7 267 415,062
Portfolio at risk > 90 days 39,561 - 20 164,251
Loan loss reserve 32,535 2,590 2,366 376,338
Loan Portfolio written off during year 15,836 - 22 415,348
Gross loan portfolio 798,673 500,402 346,493 36,789,528
Average gross loan portfolio 570,256 339,365 193,937 32,520,176
weighted avg.
Portfolio at risk (>30)-to-gross loan portfolio 12.7% 0.0% 0.1% 1.1%
Portfolio at risk(>90)-to-gross loan portfolio 5.0% 0.0% 0.0% 0.4%
Write off-to-average gross loan portfolio 2.8% 0.0% 0.0% 1.3%
Risk coverage ratio (adjusted loan loss reserve-to-portfolio at risk >30days)
32.1% 36160.9% 884.8% 90.7%
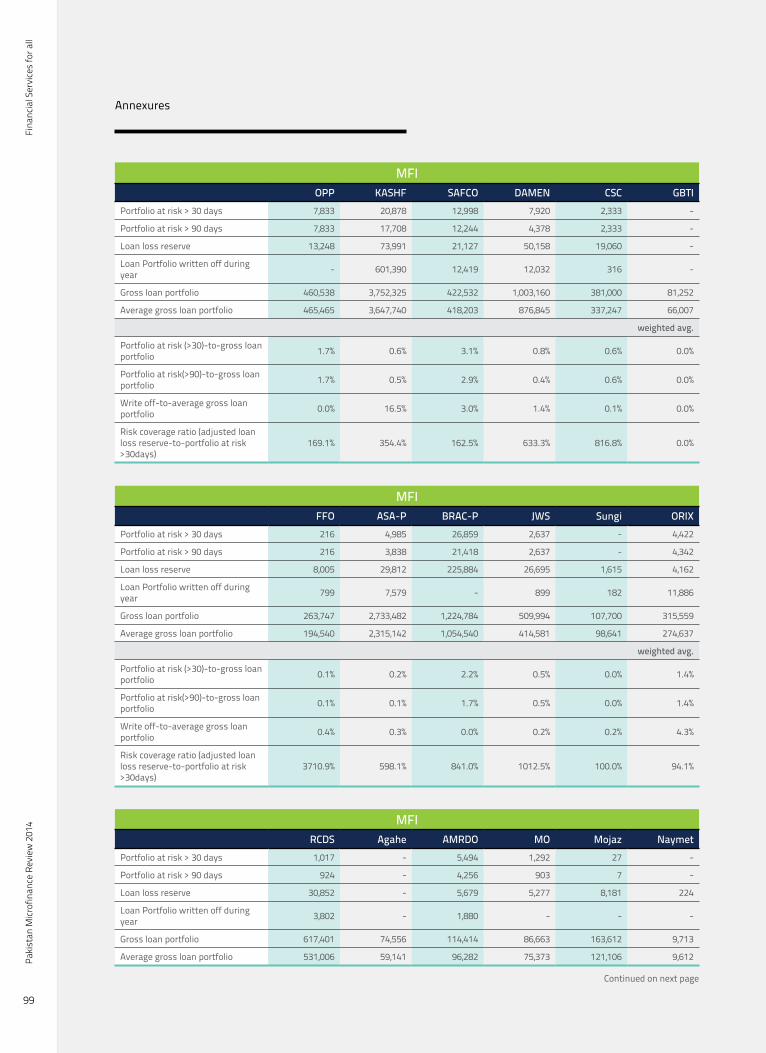
Fina
ncia
l Ser
vice
s fo
r all
Paki
stan
Micr
ofin
ance
Rev
iew
201
4
99
Annexures
MFIOPP KASHF SAFCO DAMEN CSC GBTI
Portfolio at risk > 30 days 7,833 20,878 12,998 7,920 2,333 -
Portfolio at risk > 90 days 7,833 17,708 12,244 4,378 2,333 -
Loan loss reserve 13,248 73,991 21,127 50,158 19,060 -
Loan Portfolio written off during year - 601,390 12,419 12,032 316 -
Gross loan portfolio 460,538 3,752,325 422,532 1,003,160 381,000 81,252
Average gross loan portfolio 465,465 3,647,740 418,203 876,845 337,247 66,007
weighted avg.
Portfolio at risk (>30)-to-gross loan portfolio 1.7% 0.6% 3.1% 0.8% 0.6% 0.0%
Portfolio at risk(>90)-to-gross loan portfolio 1.7% 0.5% 2.9% 0.4% 0.6% 0.0%
Write off-to-average gross loan portfolio 0.0% 16.5% 3.0% 1.4% 0.1% 0.0%
Risk coverage ratio (adjusted loan loss reserve-to-portfolio at risk >30days)
169.1% 354.4% 162.5% 633.3% 816.8% 0.0%
MFIFFO ASA-P BRAC-P JWS Sungi ORIX
Portfolio at risk > 30 days 216 4,985 26,859 2,637 - 4,422
Portfolio at risk > 90 days 216 3,838 21,418 2,637 - 4,342
Loan loss reserve 8,005 29,812 225,884 26,695 1,615 4,162
Loan Portfolio written off during year 799 7,579 - 899 182 11,886
Gross loan portfolio 263,747 2,733,482 1,224,784 509,994 107,700 315,559
Average gross loan portfolio 194,540 2,315,142 1,054,540 414,581 98,641 274,637
weighted avg.
Portfolio at risk (>30)-to-gross loan portfolio 0.1% 0.2% 2.2% 0.5% 0.0% 1.4%
Portfolio at risk(>90)-to-gross loan portfolio 0.1% 0.1% 1.7% 0.5% 0.0% 1.4%
Write off-to-average gross loan portfolio 0.4% 0.3% 0.0% 0.2% 0.2% 4.3%
Risk coverage ratio (adjusted loan loss reserve-to-portfolio at risk >30days)
3710.9% 598.1% 841.0% 1012.5% 100.0% 94.1%
MFIRCDS Agahe AMRDO MO Mojaz Naymet
Portfolio at risk > 30 days 1,017 - 5,494 1,292 27 -
Portfolio at risk > 90 days 924 - 4,256 903 7 -
Loan loss reserve 30,852 - 5,679 5,277 8,181 224
Loan Portfolio written off during year 3,802 - 1,880 - - -
Gross loan portfolio 617,401 74,556 114,414 86,663 163,612 9,713
Average gross loan portfolio 531,006 59,141 96,282 75,373 121,106 9,612
Continued on next page
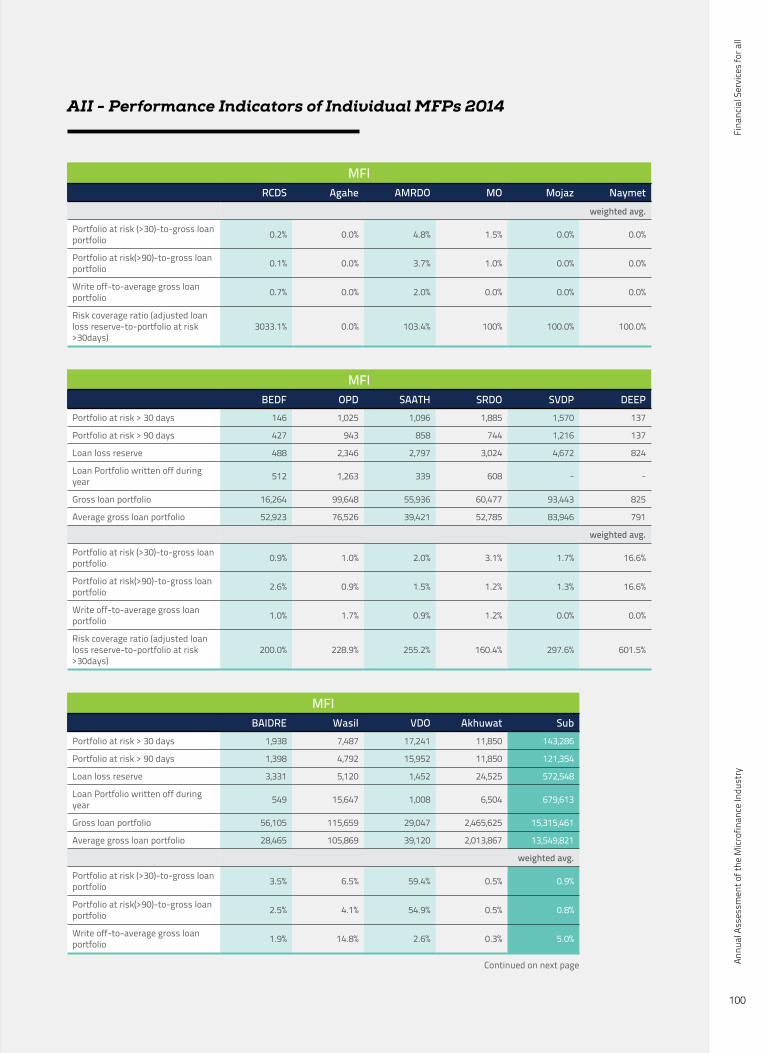
Fina
ncia
l Ser
vice
s fo
r all
Annu
al A
sses
smen
t of t
he M
icrof
inan
ce In
dust
ry
100
AII - Performance Indicators of Individual MFPs 2014
MFIRCDS Agahe AMRDO MO Mojaz Naymet
weighted avg.
Portfolio at risk (>30)-to-gross loan portfolio 0.2% 0.0% 4.8% 1.5% 0.0% 0.0%
Portfolio at risk(>90)-to-gross loan portfolio 0.1% 0.0% 3.7% 1.0% 0.0% 0.0%
Write off-to-average gross loan portfolio 0.7% 0.0% 2.0% 0.0% 0.0% 0.0%
Risk coverage ratio (adjusted loan loss reserve-to-portfolio at risk >30days)
3033.1% 0.0% 103.4% 100% 100.0% 100.0%
MFIBEDF OPD SAATH SRDO SVDP DEEP
Portfolio at risk > 30 days 146 1,025 1,096 1,885 1,570 137
Portfolio at risk > 90 days 427 943 858 744 1,216 137
Loan loss reserve 488 2,346 2,797 3,024 4,672 824
Loan Portfolio written off during year 512 1,263 339 608 - -
Gross loan portfolio 16,264 99,648 55,936 60,477 93,443 825
Average gross loan portfolio 52,923 76,526 39,421 52,785 83,946 791
weighted avg.
Portfolio at risk (>30)-to-gross loan portfolio 0.9% 1.0% 2.0% 3.1% 1.7% 16.6%
Portfolio at risk(>90)-to-gross loan portfolio 2.6% 0.9% 1.5% 1.2% 1.3% 16.6%
Write off-to-average gross loan portfolio 1.0% 1.7% 0.9% 1.2% 0.0% 0.0%
Risk coverage ratio (adjusted loan loss reserve-to-portfolio at risk >30days)
200.0% 228.9% 255.2% 160.4% 297.6% 601.5%
MFIBAIDRE Wasil VDO Akhuwat Sub
Portfolio at risk > 30 days 1,938 7,487 17,241 11,850 143,286
Portfolio at risk > 90 days 1,398 4,792 15,952 11,850 121,354
Loan loss reserve 3,331 5,120 1,452 24,525 572,548
Loan Portfolio written off during year 549 15,647 1,008 6,504 679,613
Gross loan portfolio 56,105 115,659 29,047 2,465,625 15,315,461
Average gross loan portfolio 28,465 105,869 39,120 2,013,867 13,549,821
weighted avg.
Portfolio at risk (>30)-to-gross loan portfolio 3.5% 6.5% 59.4% 0.5% 0.9%
Portfolio at risk(>90)-to-gross loan portfolio 2.5% 4.1% 54.9% 0.5% 0.8%
Write off-to-average gross loan portfolio 1.9% 14.8% 2.6% 0.3% 5.0%
Continued on next page

Fina
ncia
l Ser
vice
s fo
r all
Paki
stan
Micr
ofin
ance
Rev
iew
201
4
101
Annexures
MFIBAIDRE Wasil VDO Akhuwat Sub
Risk coverage ratio (adjusted loan loss reserve-to-portfolio at risk >30days)
171.9% 68.4% 8.4% 207.0% 399.6%
RSPNRSP PRSP SRSP TRDP SRSO Sub
Portfolio at risk > 30 days 23,148 2,032 - 22,674 53,216 101,070
Portfolio at risk > 90 days 20,152 1,922 - 22,425 49,532 94,032
Loan loss reserve 88,494 79,562 28 967 71,946 240,997
Loan Portfolio written off during year 81,476 - 28 - 45,611 127,115
Gross loan portfolio 7,653,444 1,149,283 37,519 1,376,726 1,209,504 11,426,476
Average gross loan portfolio 6,618,924 1,026,474 34,846 1,083,258 1,143,738 9,907,240
weighted avg.
Portfolio at risk (>30)-to-gross loan portfolio 0.3% 0.2% 0.0% 1.6% 4.4% 0.9%
Portfolio at risk(>90)-to-gross loan portfolio 0.3% 0.2% 0.0% 1.6% 4.1% 0.8%
Write off-to-average gross loan portfolio 1.2% 0.0% 0.1% 0.0% 4.0% 1.3%
Risk coverage ratio (adjusted loan loss reserve-to-portfolio at risk >30days)
382.3% 3916.2% 0.0% 4.3% 135.2% 238.4%
Sub MFB Sub MFI Sub RSP TotalPortfolio at risk > 30 days 415,062 143,286 101,070 659,418
Portfolio at risk > 90 days 164,251 121,354 94,032 379,637
Loan loss reserve 376,338 572,548 240,997 1,189,884
Loan Portfolio written off during year 415,348 679,613 127,115 1,222,076
Gross loan portfolio 36,789,528 15,315,461 11,426,476 63,531,465
Average gross loan portfolio 32,520,176 13,549,821 9,907,240 55,977,237
weighted avg.
Portfolio at risk (>30)-to-gross loan portfolio 1.1% 0.9% 0.9% 1.0%
Portfolio at risk(>90)-to-gross loan portfolio 0.4% 0.8% 0.8% 0.6%
Write off-to-average gross loan portfolio 1.3% 5.0% 1.3% 2.2%
Risk coverage ratio (adjusted loan loss reserve-to-portfolio at risk >30days)
90.7% 399.6% 238.4% 180.4%

Fina
ncia
l Ser
vice
s fo
r all
Annu
al A
sses
smen
t of t
he M
icrof
inan
ce In
dust
ry
102
AII - Performance Indicators of Individual MFPs 2014
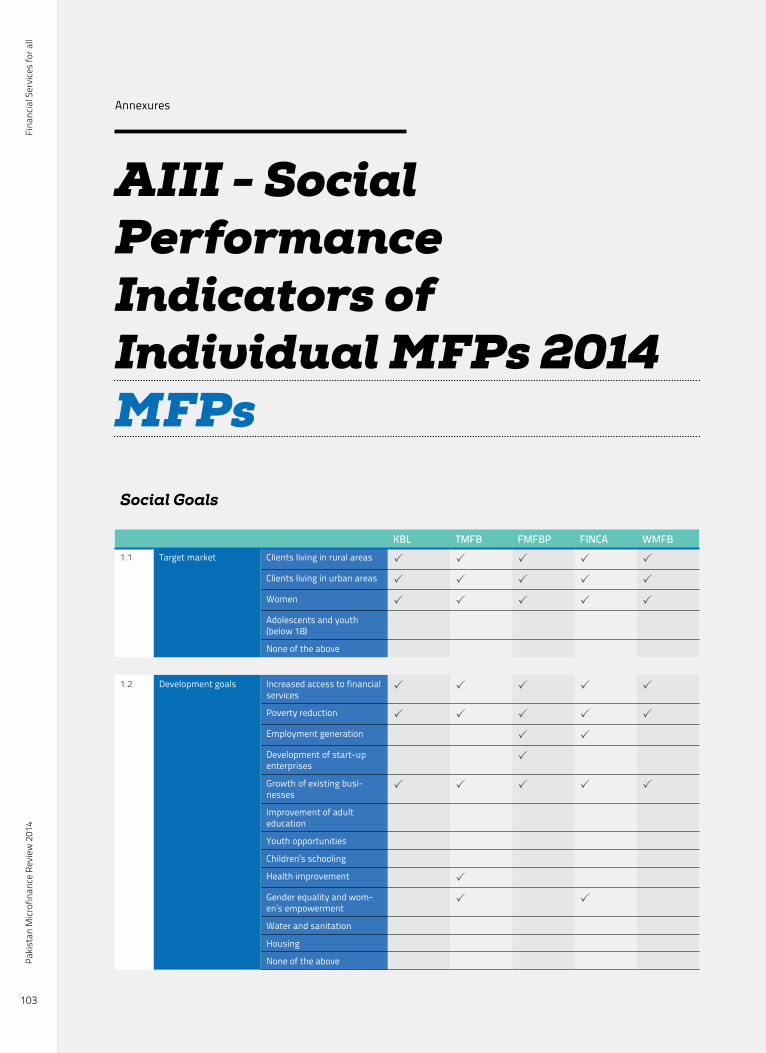
Fina
ncia
l Ser
vice
s fo
r all
Paki
stan
Micr
ofin
ance
Rev
iew
201
4
103
Annexures
AIII - Social Performance Indicators of Individual MFPs 2014
Social Goals
KBL TMFB FMFBP FINCA WMFB1.1 Target market Clients living in rural areas P P P P P
Clients living in urban areas P P P P P
Women P P P P P
Adolescents and youth (below 18)
None of the above
1.2 Development goals Increased access to financial services
P P P P P
Poverty reduction P P P P P
Employment generation P P
Development of start-up enterprises
P
Growth of existing busi-nesses
P P P P P
Improvement of adult education
Youth opportunities
Children’s schooling
Health improvement P
Gender equality and wom-en’s empowerment
P P
Water and sanitation
Housing
None of the above
MFPs
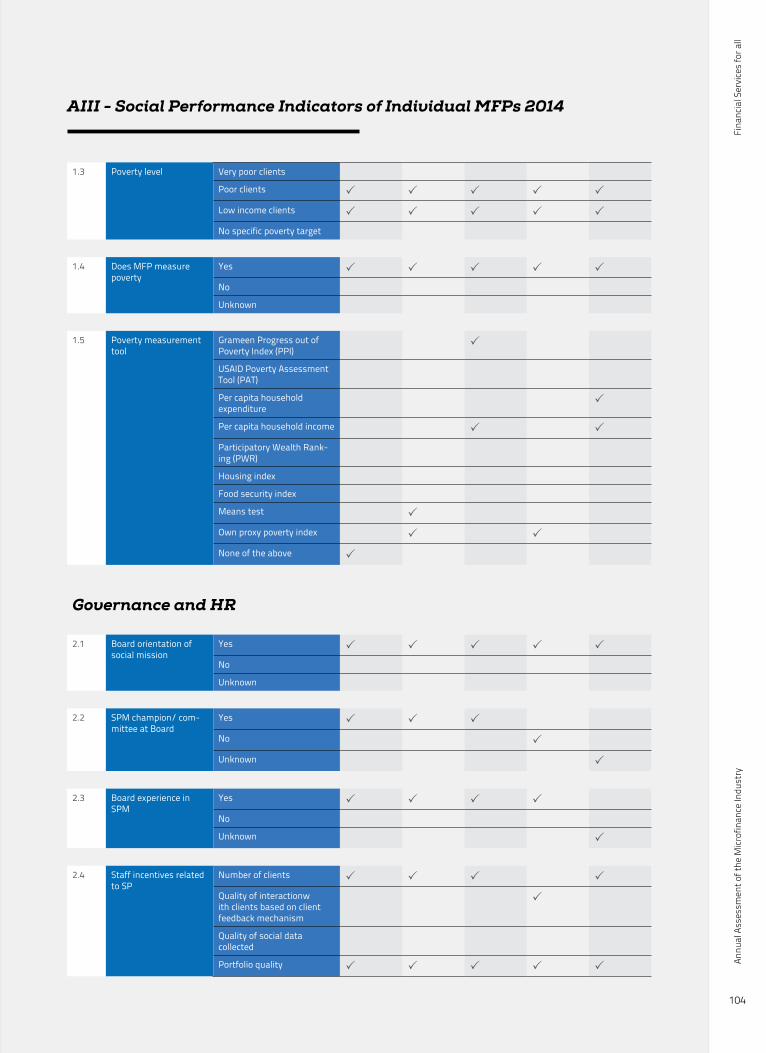
Fina
ncia
l Ser
vice
s fo
r all
Annu
al A
sses
smen
t of t
he M
icrof
inan
ce In
dust
ry
104
AIII - Social Performance Indicators of Individual MFPs 2014
1.3 Poverty level Very poor clients
Poor clients P P P P P
Low income clients P P P P P
No specific poverty target
1.4 Does MFP measure poverty
Yes P P P P P
No
Unknown
1.5 Poverty measurement tool
Grameen Progress out of Poverty Index (PPI)
P
USAID Poverty Assessment Tool (PAT)
Per capita household expenditure
P
Per capita household income P P
Participatory Wealth Rank-ing (PWR)
Housing index
Food security index
Means test P
Own proxy poverty index P P
None of the above P
Governance and HR
2.1 Board orientation of social mission
Yes P P P P P
No
Unknown
2.2 SPM champion/ com-mittee at Board
Yes P P P
No P
Unknown P
2.3 Board experience in SPM
Yes P P P P
No
Unknown P
2.4 Staff incentives related to SP
Number of clients P P P P
Quality of interactionw ith clients based on client feedback mechanism
P
Quality of social data collected
Portfolio quality P P P P P
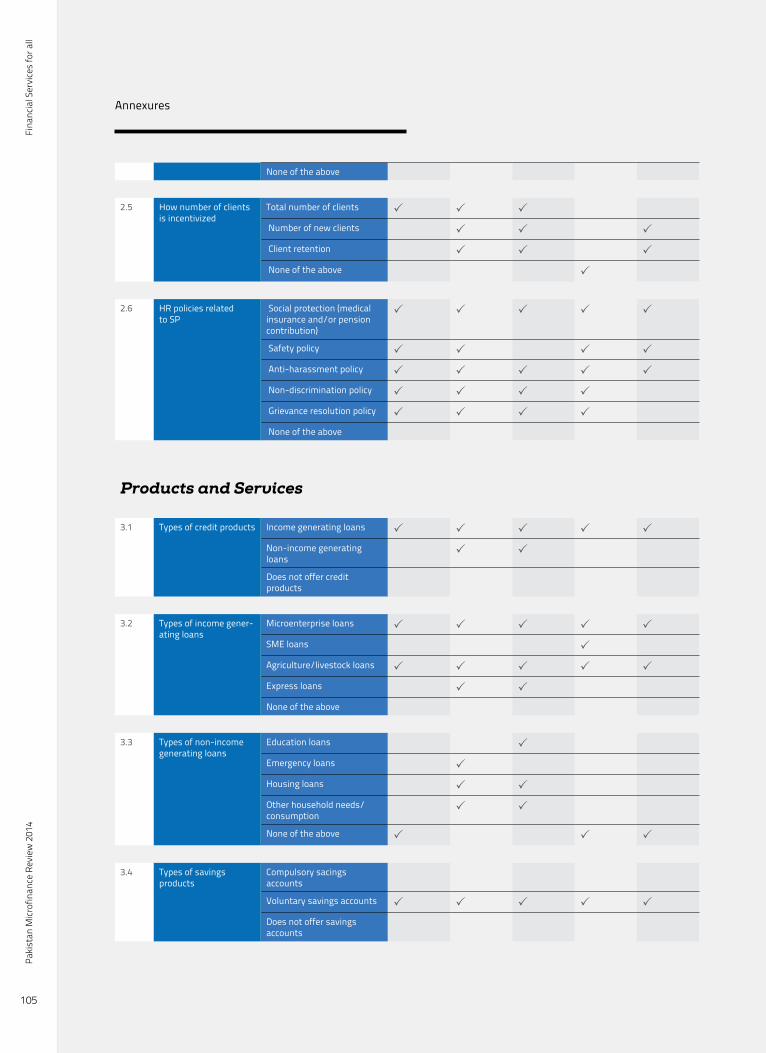
Fina
ncia
l Ser
vice
s fo
r all
Paki
stan
Micr
ofin
ance
Rev
iew
201
4
105
Annexures
None of the above
2.5 How number of clients is incentivized
Total number of clients P P P
Number of new clients P P P
Client retention P P P
None of the above P
2.6 HR policies related to SP
Social protection (medical insurance and/or pension contribution)
P P P P P
Safety policy P P P P
Anti-harassment policy P P P P P
Non-discrimination policy P P P P
Grievance resolution policy P P P P
None of the above
Products and Services
3.1 Types of credit products Income generating loans P P P P P
Non-income generating loans
P P
Does not offer credit products
3.2 Types of income gener-ating loans
Microenterprise loans P P P P P
SME loans P
Agriculture/livestock loans P P P P P
Express loans P P
None of the above
3.3 Types of non-income generating loans
Education loans P
Emergency loans P
Housing loans P P
Other household needs/consumption
P P
None of the above P P P
3.4 Types of savings products
Compulsory sacings accounts
Voluntary savings accounts P P P P P
Does not offer savings accounts
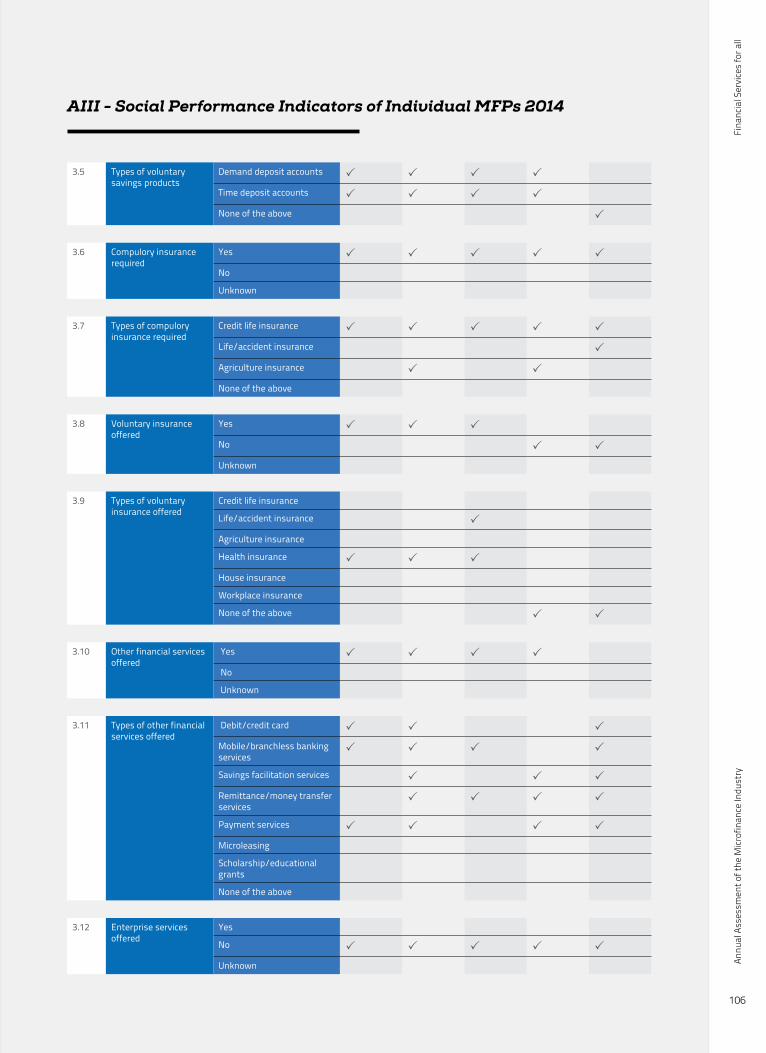
Fina
ncia
l Ser
vice
s fo
r all
Annu
al A
sses
smen
t of t
he M
icrof
inan
ce In
dust
ry
106
AIII - Social Performance Indicators of Individual MFPs 2014
3.5 Types of voluntary savings products
Demand deposit accounts P P P P
Time deposit accounts P P P P
None of the above P
3.6 Compulory insurance required
Yes P P P P P
No
Unknown
3.7 Types of compulory insurance required
Credit life insurance P P P P P
Life/accident insurance P
Agriculture insurance P P
None of the above
3.8 Voluntary insurance offered
Yes P P P
No P P
Unknown
3.9 Types of voluntary insurance offered
Credit life insurance
Life/accident insurance P
Agriculture insurance
Health insurance P P P
House insurance
Workplace insurance
None of the above P P
3.10 Other financial services offered
Yes P P P P
No
Unknown
3.11 Types of other financial services offered
Debit/credit card P P P
Mobile/branchless banking services
P P P P
Savings facilitation services P P P
Remittance/money transfer services
P P P P
Payment services P P P P
Microleasing
Scholarship/educational grants
None of the above
3.12 Enterprise services offered
Yes
No P P P P P
Unknown
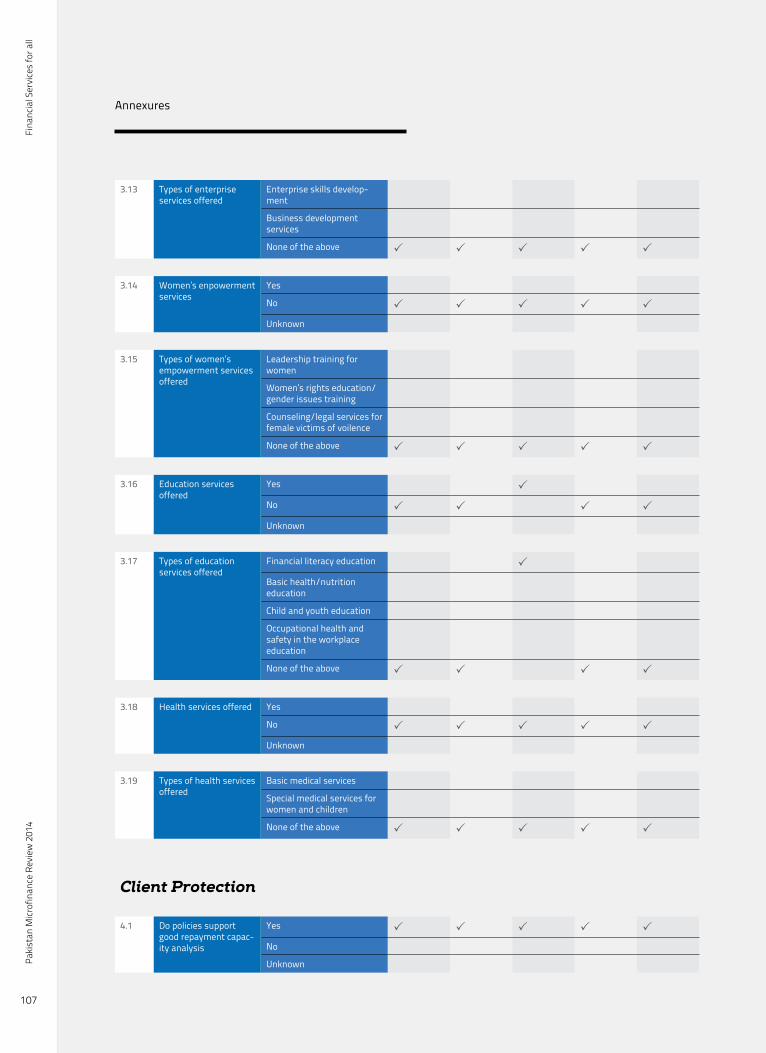
Fina
ncia
l Ser
vice
s fo
r all
Paki
stan
Micr
ofin
ance
Rev
iew
201
4
107
Annexures
3.13 Types of enterprise services offered
Enterprise skills develop-ment
Business development services
None of the above P P P P P
3.14 Women’s enpowerment services
Yes
No P P P P P
Unknown
3.15 Types of women’s empowerment services offered
Leadership training for women
Women’s rights education/gender issues training
Counseling/legal services for female victims of voilence
None of the above P P P P P
3.16 Education services offered
Yes P
No P P P P
Unknown
3.17 Types of education services offered
Financial literacy education P
Basic health/nutrition education
Child and youth education
Occupational health and safety in the workplace education
None of the above P P P P
3.18 Health services offered Yes
No P P P P P
Unknown
3.19 Types of health services offered
Basic medical services
Special medical services for women and children
None of the above P P P P P
Client Protection
4.1 Do policies support good repayment capac-ity analysis
Yes P P P P P
No
Unknown
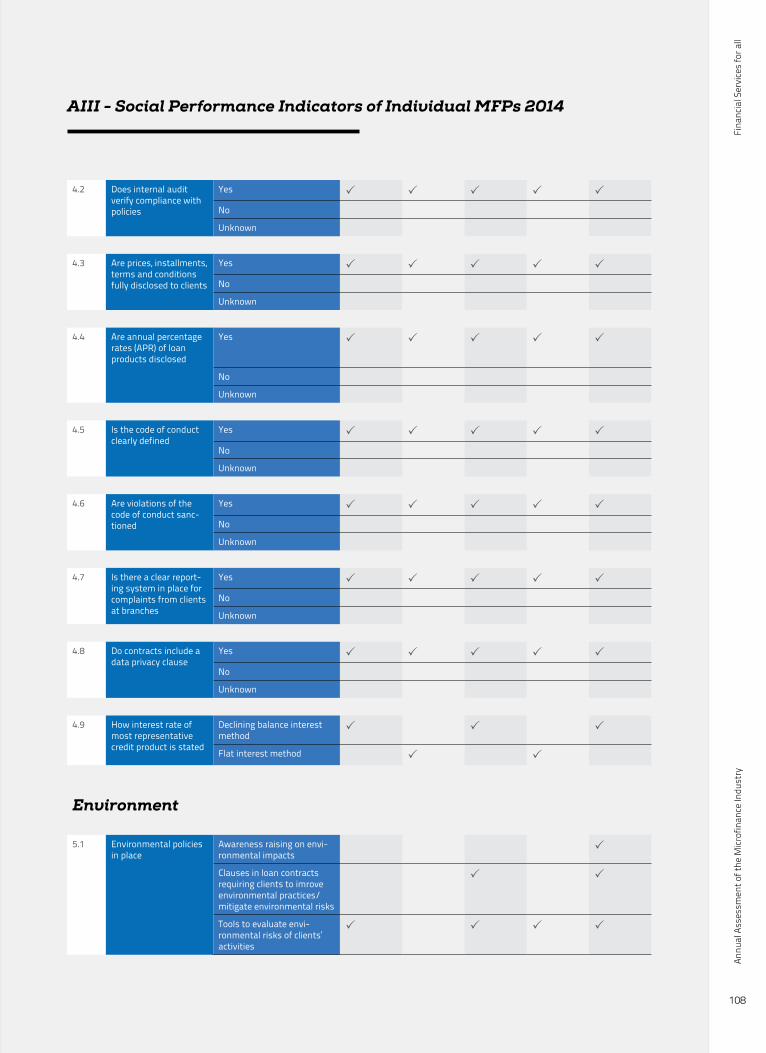
Fina
ncia
l Ser
vice
s fo
r all
Annu
al A
sses
smen
t of t
he M
icrof
inan
ce In
dust
ry
108
AIII - Social Performance Indicators of Individual MFPs 2014
4.2 Does internal audit verify compliance with policies
Yes P P P P P
No
Unknown
4.3 Are prices, installments, terms and conditions fully disclosed to clients
Yes P P P P P
No
Unknown
4.4 Are annual percentage rates (APR) of loan products disclosed
Yes P P P P P
No
Unknown
4.5 Is the code of conduct clearly defined
Yes P P P P P
No
Unknown
4.6 Are violations of the code of conduct sanc-tioned
Yes P P P P P
No
Unknown
4.7 Is there a clear report-ing system in place for complaints from clients at branches
Yes P P P P P
No
Unknown
4.8 Do contracts include a data privacy clause
Yes P P P P P
No
Unknown
4.9 How interest rate of most representative credit product is stated
Declining balance interest method
P P P
Flat interest method P P
Environment
5.1 Environmental policies in place
Awareness raising on envi-ronmental impacts
P
Clauses in loan contracts requiring clients to imrove environmental practices/mitigate environmental risks
P P
Tools to evaluate envi-ronmental risks of clients’ activities
P P P P
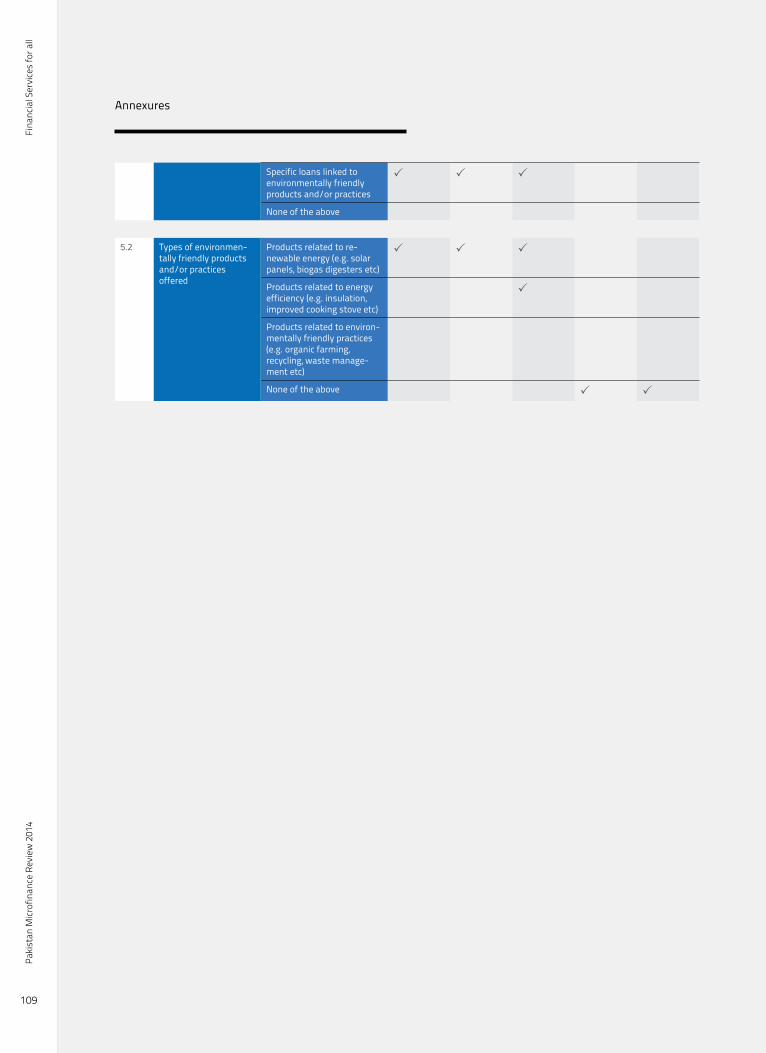
Fina
ncia
l Ser
vice
s fo
r all
Paki
stan
Micr
ofin
ance
Rev
iew
201
4
109
Annexures
Specific loans linked to environmentally friendly products and/or practices
P P P
None of the above
5.2 Types of environmen-tally friendly products and/or practices offered
Products related to re-newable energy (e.g. solar panels, biogas digesters etc)
P P P
Products related to energy efficiency (e.g. insulation, improved cooking stove etc)
P
Products related to environ-mentally friendly practices (e.g. organic farming, recycling, waste manage-ment etc)
None of the above P P
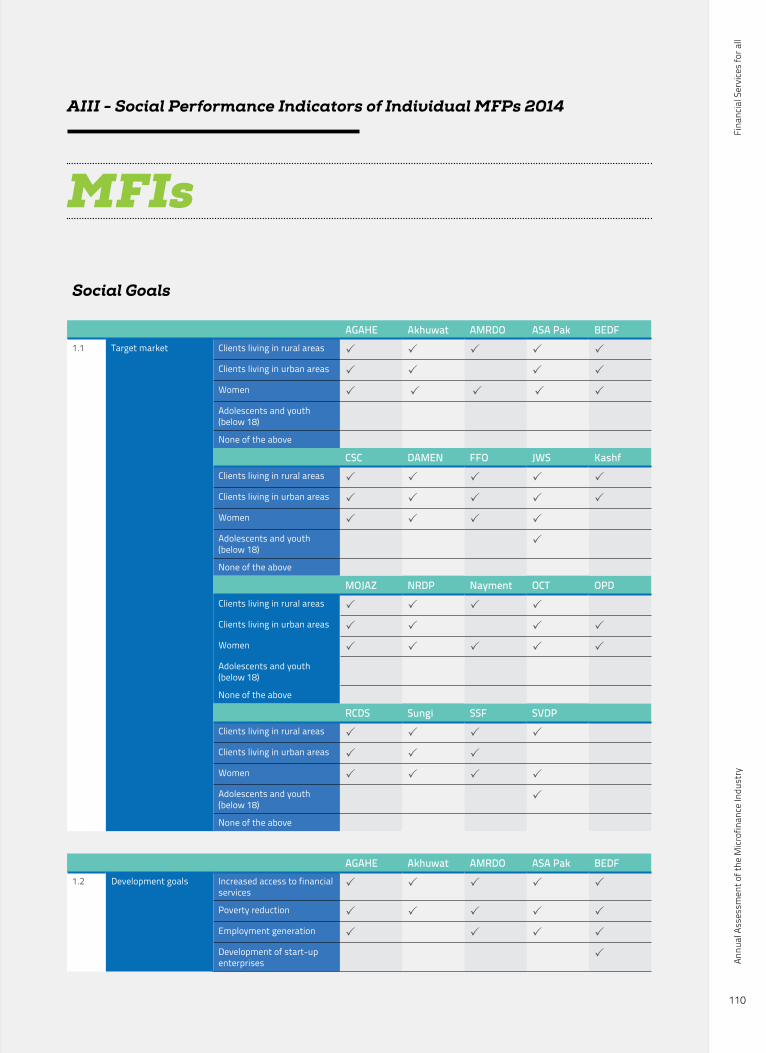
Fina
ncia
l Ser
vice
s fo
r all
Annu
al A
sses
smen
t of t
he M
icrof
inan
ce In
dust
ry
110
AIII - Social Performance Indicators of Individual MFPs 2014
Social Goals
AGAHE Akhuwat AMRDO ASA Pak BEDF1.1 Target market Clients living in rural areas P P P P P
Clients living in urban areas P P P P
Women P P P P P
Adolescents and youth (below 18)
None of the above
CSC DAMEN FFO JWS KashfClients living in rural areas P P P P P
Clients living in urban areas P P P P P
Women P P P P
Adolescents and youth (below 18)
P
None of the above
MOJAZ NRDP Nayment OCT OPDClients living in rural areas P P P P
Clients living in urban areas P P P P
Women P P P P P
Adolescents and youth (below 18)
None of the above
RCDS Sungi SSF SVDPClients living in rural areas P P P P
Clients living in urban areas P P P
Women P P P P
Adolescents and youth (below 18)
P
None of the above
AGAHE Akhuwat AMRDO ASA Pak BEDF1.2 Development goals Increased access to financial
servicesP P P P P
Poverty reduction P P P P P
Employment generation P P P P
Development of start-up enterprises
P
MFIs
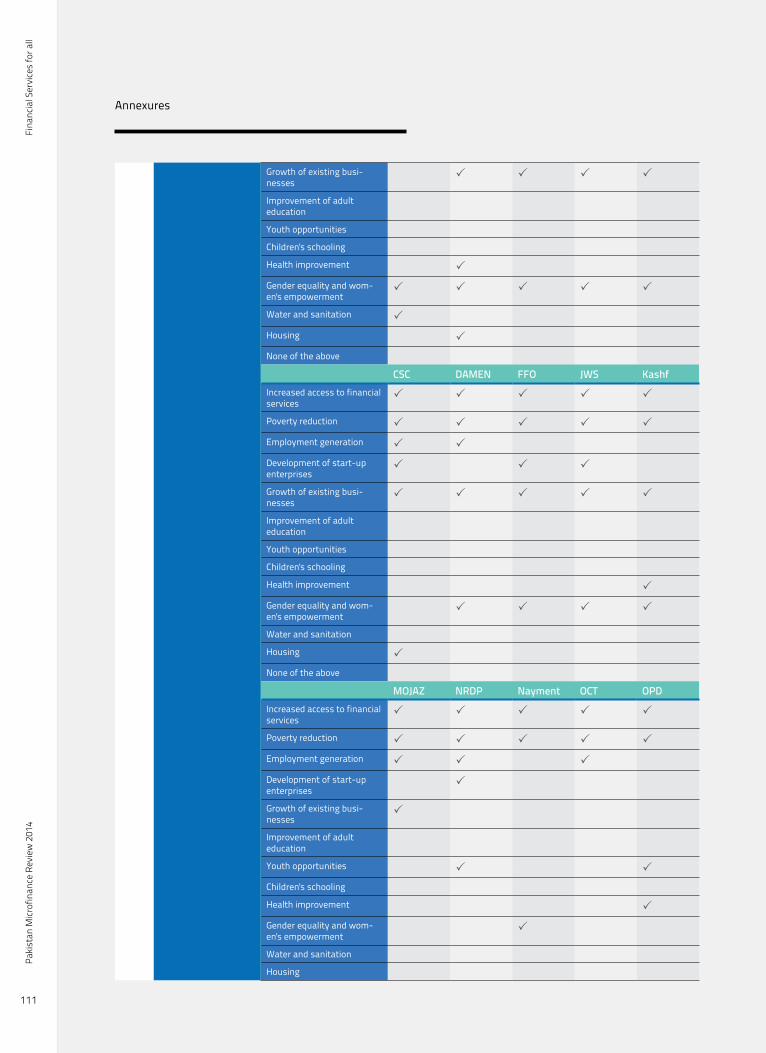
Fina
ncia
l Ser
vice
s fo
r all
Paki
stan
Micr
ofin
ance
Rev
iew
201
4
111
Annexures
Growth of existing busi-nesses
P P P P
Improvement of adult education
Youth opportunities
Children's schooling
Health improvement P
Gender equality and wom-en's empowerment
P P P P P
Water and sanitation P
Housing P
None of the above
CSC DAMEN FFO JWS KashfIncreased access to financial services
P P P P P
Poverty reduction P P P P P
Employment generation P P
Development of start-up enterprises
P P P
Growth of existing busi-nesses
P P P P P
Improvement of adult education
Youth opportunities
Children's schooling
Health improvement P
Gender equality and wom-en's empowerment
P P P P
Water and sanitation
Housing P
None of the above
MOJAZ NRDP Nayment OCT OPDIncreased access to financial services
P P P P P
Poverty reduction P P P P P
Employment generation P P P
Development of start-up enterprises
P
Growth of existing busi-nesses
P
Improvement of adult education
Youth opportunities P P
Children's schooling
Health improvement P
Gender equality and wom-en's empowerment
P
Water and sanitation
Housing
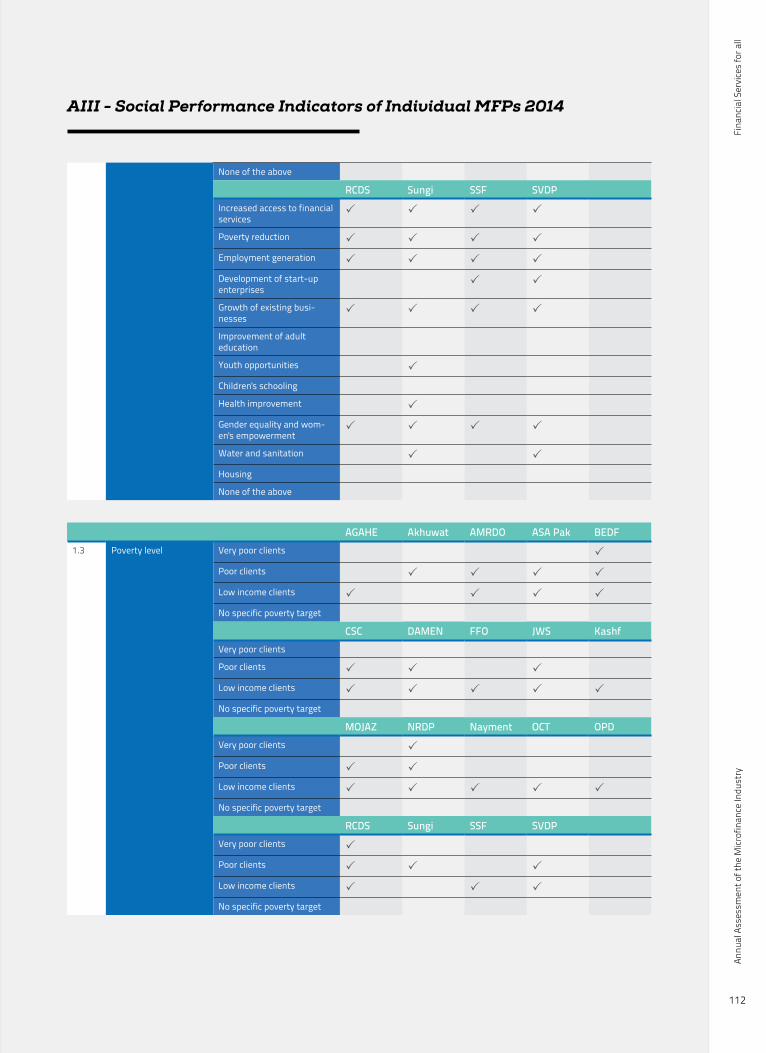
Fina
ncia
l Ser
vice
s fo
r all
Annu
al A
sses
smen
t of t
he M
icrof
inan
ce In
dust
ry
112
AIII - Social Performance Indicators of Individual MFPs 2014
None of the above
RCDS Sungi SSF SVDPIncreased access to financial services
P P P P
Poverty reduction P P P P
Employment generation P P P P
Development of start-up enterprises
P P
Growth of existing busi-nesses
P P P P
Improvement of adult education
Youth opportunities P
Children's schooling
Health improvement P
Gender equality and wom-en's empowerment
P P P P
Water and sanitation P P
Housing
None of the above
AGAHE Akhuwat AMRDO ASA Pak BEDF1.3 Poverty level Very poor clients P
Poor clients P P P P
Low income clients P P P P
No specific poverty target
CSC DAMEN FFO JWS KashfVery poor clients
Poor clients P P P
Low income clients P P P P P
No specific poverty target
MOJAZ NRDP Nayment OCT OPDVery poor clients P
Poor clients P P
Low income clients P P P P P
No specific poverty target
RCDS Sungi SSF SVDPVery poor clients P
Poor clients P P P
Low income clients P P P
No specific poverty target
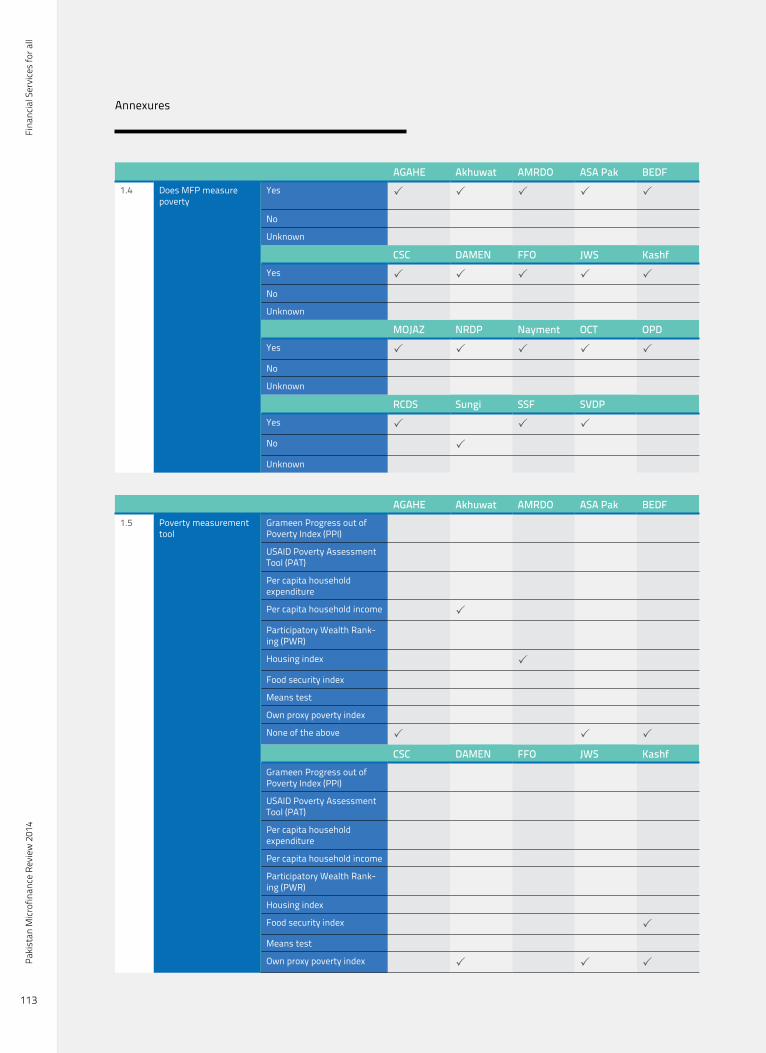
Fina
ncia
l Ser
vice
s fo
r all
Paki
stan
Micr
ofin
ance
Rev
iew
201
4
113
Annexures
AGAHE Akhuwat AMRDO ASA Pak BEDF1.4 Does MFP measure
povertyYes P P P P P
No
Unknown
CSC DAMEN FFO JWS KashfYes P P P P P
No
Unknown
MOJAZ NRDP Nayment OCT OPDYes P P P P P
No
Unknown
RCDS Sungi SSF SVDPYes P P P
No P
Unknown
AGAHE Akhuwat AMRDO ASA Pak BEDF1.5 Poverty measurement
toolGrameen Progress out of Poverty Index (PPI)
USAID Poverty Assessment Tool (PAT)
Per capita household expenditure
Per capita household income P
Participatory Wealth Rank-ing (PWR)
Housing index P
Food security index
Means test
Own proxy poverty index
None of the above P P P
CSC DAMEN FFO JWS KashfGrameen Progress out of Poverty Index (PPI)
USAID Poverty Assessment Tool (PAT)
Per capita household expenditure
Per capita household income
Participatory Wealth Rank-ing (PWR)
Housing index
Food security index P
Means test
Own proxy poverty index P P P
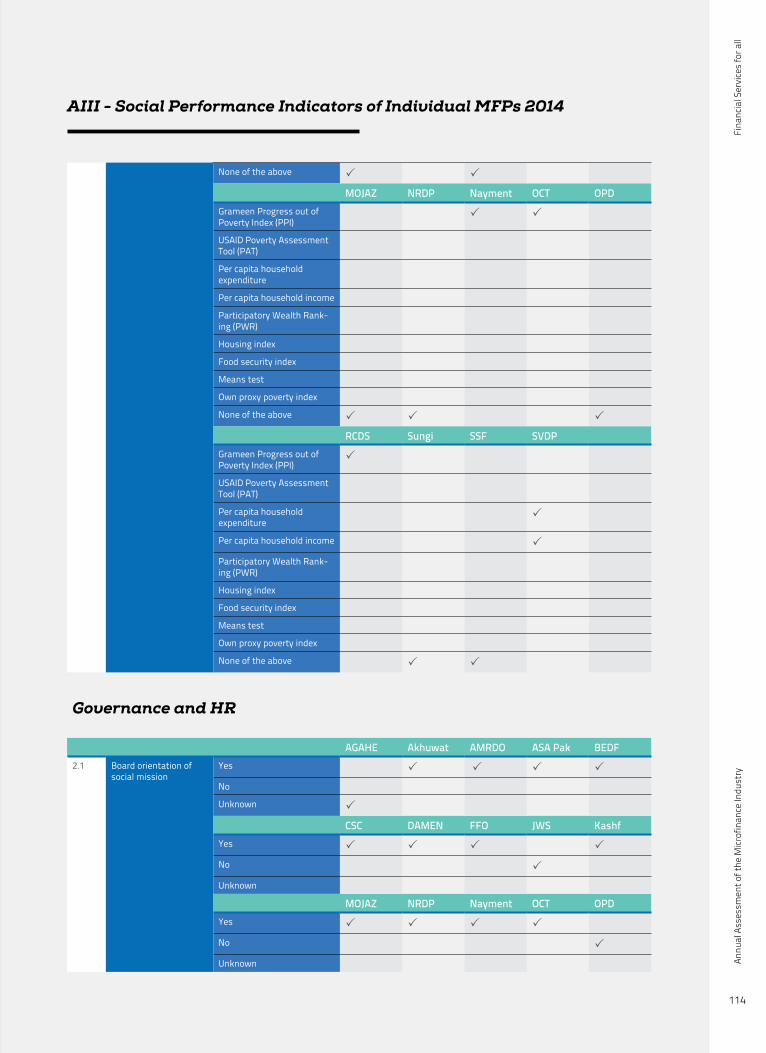
Fina
ncia
l Ser
vice
s fo
r all
Annu
al A
sses
smen
t of t
he M
icrof
inan
ce In
dust
ry
114
AIII - Social Performance Indicators of Individual MFPs 2014
None of the above P P
MOJAZ NRDP Nayment OCT OPDGrameen Progress out of Poverty Index (PPI)
P P
USAID Poverty Assessment Tool (PAT)
Per capita household expenditure
Per capita household income
Participatory Wealth Rank-ing (PWR)
Housing index
Food security index
Means test
Own proxy poverty index
None of the above P P P
RCDS Sungi SSF SVDPGrameen Progress out of Poverty Index (PPI)
P
USAID Poverty Assessment Tool (PAT)
Per capita household expenditure
P
Per capita household income P
Participatory Wealth Rank-ing (PWR)
Housing index
Food security index
Means test
Own proxy poverty index
None of the above P P
Governance and HR
AGAHE Akhuwat AMRDO ASA Pak BEDF2.1 Board orientation of
social missionYes P P P P
No
Unknown P
CSC DAMEN FFO JWS KashfYes P P P P
No P
Unknown
MOJAZ NRDP Nayment OCT OPDYes P P P P
No P
Unknown

Fina
ncia
l Ser
vice
s fo
r all
Paki
stan
Micr
ofin
ance
Rev
iew
201
4
115
Annexures
RCDS Sungi SSF SVDPYes P P P
No
Unknown P
AGAHE Akhuwat AMRDO ASA Pak BEDF2.2 SPM champion/ com-
mittee at BoardYes P P
No P P P
Unknown
CSC DAMEN FFO JWS KashfYes
No P P P P
Unknown P
MOJAZ NRDP Nayment OCT OPDYes P
No P P P P
Unknown
RCDS Sungi SSF SVDPYes P
No P P
Unknown P
AGAHE Akhuwat AMRDO ASA Pak BEDF2.3 Board experience in
SPMYes P P P
No
Unknown P P
CSC DAMEN FFO JWS KashfYes P P P P P
No
Unknown
MOJAZ NRDP Nayment OCT OPDYes P P P P
No P
Unknown
RCDS Sungi SSF SVDPYes P P P P
No
Unknown
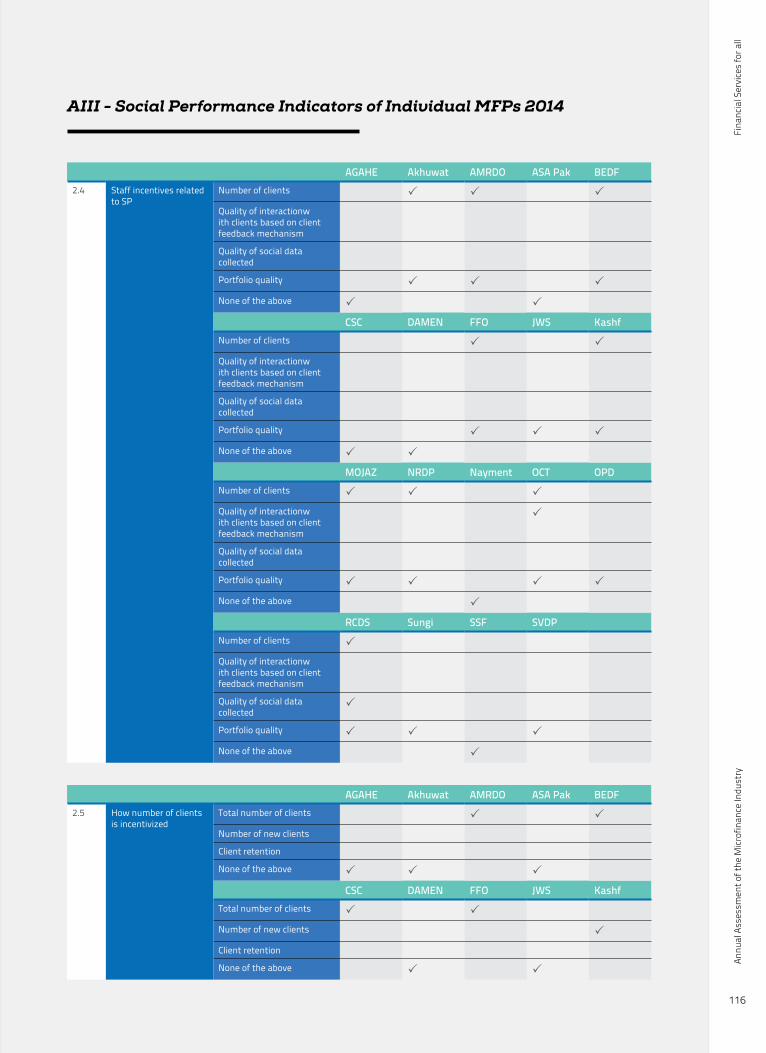
Fina
ncia
l Ser
vice
s fo
r all
Annu
al A
sses
smen
t of t
he M
icrof
inan
ce In
dust
ry
116
AIII - Social Performance Indicators of Individual MFPs 2014
AGAHE Akhuwat AMRDO ASA Pak BEDF2.4 Staff incentives related
to SPNumber of clients P P P
Quality of interactionw ith clients based on client feedback mechanism
Quality of social data collected
Portfolio quality P P P
None of the above P P
CSC DAMEN FFO JWS KashfNumber of clients P P
Quality of interactionw ith clients based on client feedback mechanism
Quality of social data collected
Portfolio quality P P P
None of the above P P
MOJAZ NRDP Nayment OCT OPDNumber of clients P P P
Quality of interactionw ith clients based on client feedback mechanism
P
Quality of social data collected
Portfolio quality P P P P
None of the above P
RCDS Sungi SSF SVDPNumber of clients P
Quality of interactionw ith clients based on client feedback mechanism
Quality of social data collected
P
Portfolio quality P P P
None of the above P
AGAHE Akhuwat AMRDO ASA Pak BEDF2.5 How number of clients
is incentivizedTotal number of clients P P
Number of new clients
Client retention
None of the above P P P
CSC DAMEN FFO JWS KashfTotal number of clients P P
Number of new clients P
Client retention
None of the above P P
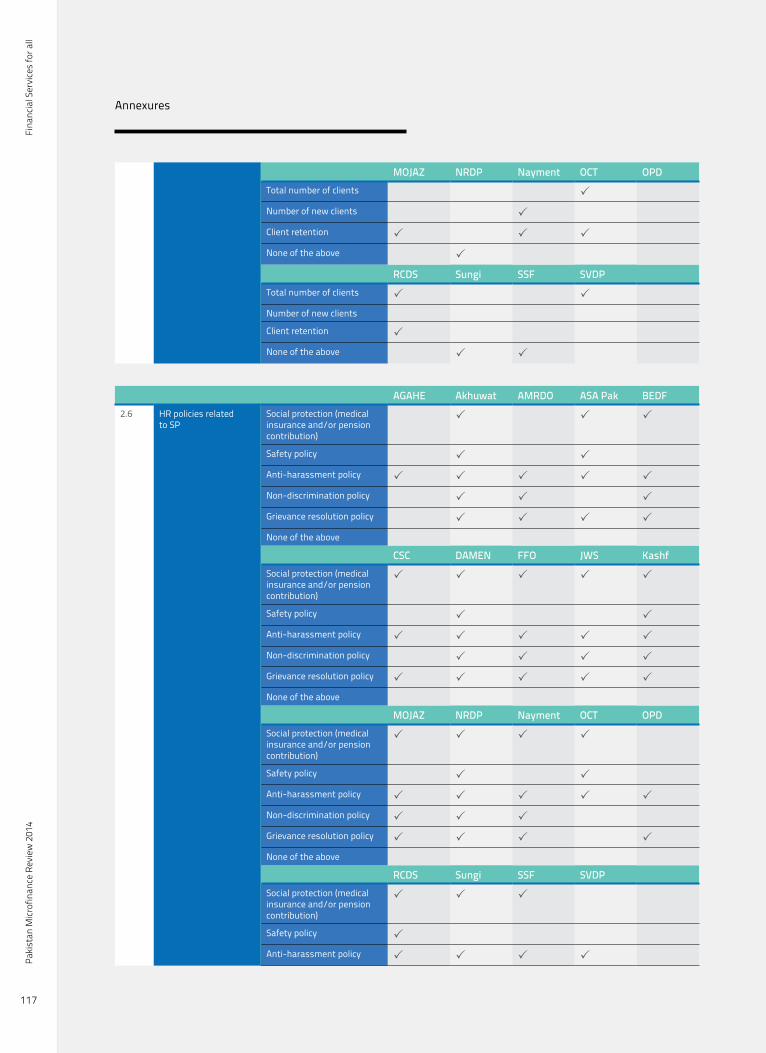
Fina
ncia
l Ser
vice
s fo
r all
Paki
stan
Micr
ofin
ance
Rev
iew
201
4
117
Annexures
MOJAZ NRDP Nayment OCT OPDTotal number of clients P
Number of new clients P
Client retention P P P
None of the above P
RCDS Sungi SSF SVDPTotal number of clients P P
Number of new clients
Client retention P
None of the above P P
AGAHE Akhuwat AMRDO ASA Pak BEDF2.6 HR policies related
to SPSocial protection (medical insurance and/or pension contribution)
P P P
Safety policy P P
Anti-harassment policy P P P P P
Non-discrimination policy P P P
Grievance resolution policy P P P P
None of the above
CSC DAMEN FFO JWS KashfSocial protection (medical insurance and/or pension contribution)
P P P P P
Safety policy P P
Anti-harassment policy P P P P P
Non-discrimination policy P P P P
Grievance resolution policy P P P P P
None of the above
MOJAZ NRDP Nayment OCT OPDSocial protection (medical insurance and/or pension contribution)
P P P P
Safety policy P P
Anti-harassment policy P P P P P
Non-discrimination policy P P P
Grievance resolution policy P P P P
None of the above
RCDS Sungi SSF SVDPSocial protection (medical insurance and/or pension contribution)
P P P
Safety policy P
Anti-harassment policy P P P P
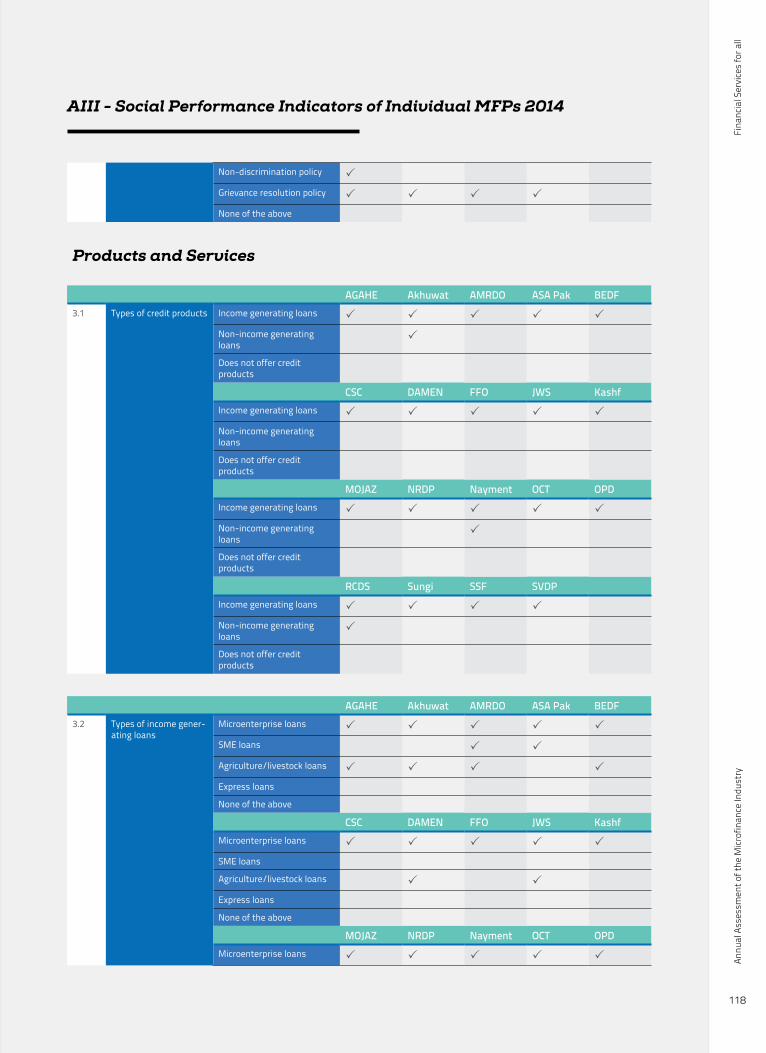
Fina
ncia
l Ser
vice
s fo
r all
Annu
al A
sses
smen
t of t
he M
icrof
inan
ce In
dust
ry
118
AIII - Social Performance Indicators of Individual MFPs 2014
Non-discrimination policy P
Grievance resolution policy P P P P
None of the above
Products and Services
AGAHE Akhuwat AMRDO ASA Pak BEDF3.1 Types of credit products Income generating loans P P P P P
Non-income generating loans
P
Does not offer credit products
CSC DAMEN FFO JWS KashfIncome generating loans P P P P P
Non-income generating loans
Does not offer credit products
MOJAZ NRDP Nayment OCT OPDIncome generating loans P P P P P
Non-income generating loans
P
Does not offer credit products
RCDS Sungi SSF SVDPIncome generating loans P P P P
Non-income generating loans
P
Does not offer credit products
AGAHE Akhuwat AMRDO ASA Pak BEDF3.2 Types of income gener-
ating loansMicroenterprise loans P P P P P
SME loans P P
Agriculture/livestock loans P P P P
Express loans
None of the above
CSC DAMEN FFO JWS KashfMicroenterprise loans P P P P P
SME loans
Agriculture/livestock loans P P
Express loans
None of the above
MOJAZ NRDP Nayment OCT OPDMicroenterprise loans P P P P P

Fina
ncia
l Ser
vice
s fo
r all
Paki
stan
Micr
ofin
ance
Rev
iew
201
4
119
Annexures
SME loans P P P
Agriculture/livestock loans P P P P
Express loans
None of the above
RCDS Sungi SSF SVDPMicroenterprise loans P P P P
SME loans P P
Agriculture/livestock loans P P P P
Express loans
None of the above
AGAHE Akhuwat AMRDO ASA Pak BEDF3.3 Types of non-income
generating loansEducation loans P
Emergency loans P
Housing loans P
Other household needs/consumption
None of the above P P P P
CSC DAMEN FFO JWS KashfEducation loans
Emergency loans
Housing loans
Other household needs/consumption
None of the above P P P P P
MOJAZ NRDP Nayment OCT OPDEducation loans P P P
Emergency loans P
Housing loans
Other household needs/consumption
P P
None of the above P P
RCDS Sungi SSF SVDPEducation loans P
Emergency loans P
Housing loans
Other household needs/consumption
None of the above P P
AGAHE Akhuwat AMRDO ASA Pak BEDF3.4 Types of savings
productsCompulsory savings accounts
Voluntary savings accounts

Fina
ncia
l Ser
vice
s fo
r all
Annu
al A
sses
smen
t of t
he M
icrof
inan
ce In
dust
ry
120
AIII - Social Performance Indicators of Individual MFPs 2014
Does not offer savings accounts
P P P P P
CSC DAMEN FFO JWS KashfCompulsory savings accounts
P
Voluntary savings accounts P
Does not offer savings accounts
P P P P
MOJAZ NRDP Nayment OCT OPDCompulsory savings accounts
Voluntary savings accounts P
Does not offer savings accounts
P P P P
RCDS Sungi SSF SVDPCompulsory savings accounts
Voluntary savings accounts P
Does not offer savings accounts
P P P
AGAHE Akhuwat AMRDO ASA Pak BEDF3.5 Types of voluntary
savings productsDemand deposit accounts
Time deposit accounts
None of the above P P P P P
CSC DAMEN FFO JWS KashfDemand deposit accounts
Time deposit accounts P
None of the above P P P P
MOJAZ NRDP Nayment OCT OPDDemand deposit accounts
Time deposit accounts
None of the above P P P P P
RCDS Sungi SSF SVDPDemand deposit accounts
Time deposit accounts
None of the above P P P P
AGAHE Akhuwat AMRDO ASA Pak BEDF3.6 Compulory insurance
requiredYes P P
No P P P
Unknown
CSC DAMEN FFO JWS KashfYes P P P P P
No
Unknown
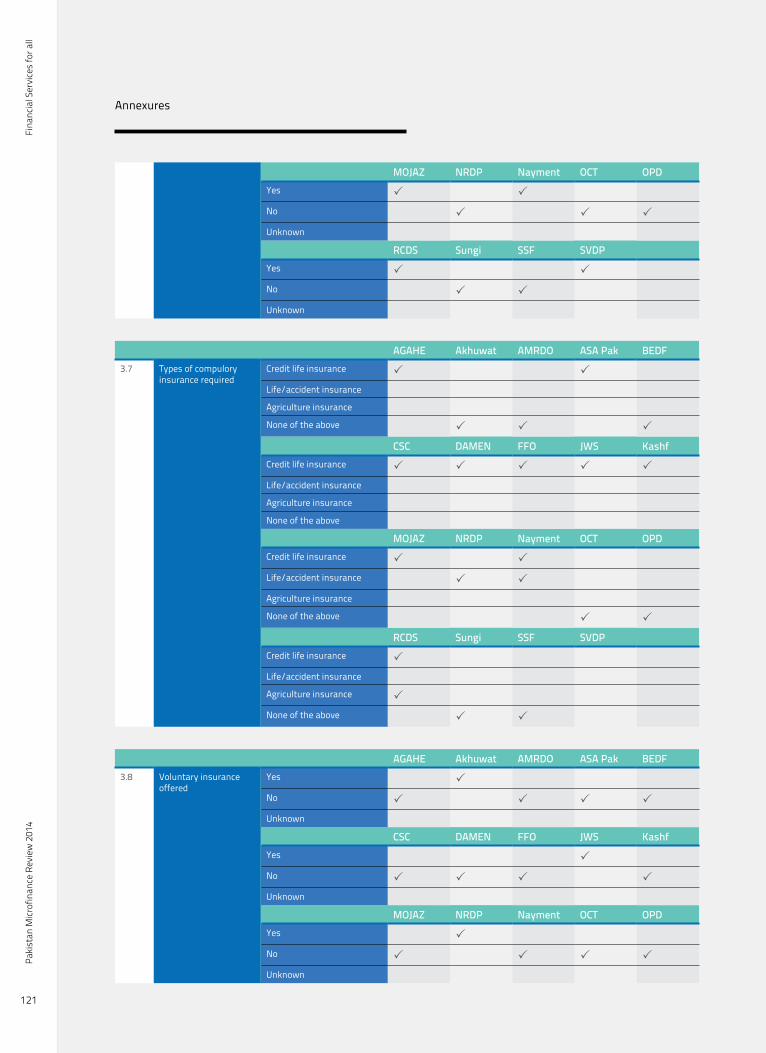
Fina
ncia
l Ser
vice
s fo
r all
Paki
stan
Micr
ofin
ance
Rev
iew
201
4
121
Annexures
MOJAZ NRDP Nayment OCT OPDYes P P
No P P P
Unknown
RCDS Sungi SSF SVDPYes P P
No P P
Unknown
AGAHE Akhuwat AMRDO ASA Pak BEDF3.7 Types of compulory
insurance requiredCredit life insurance P P
Life/accident insurance
Agriculture insurance
None of the above P P P
CSC DAMEN FFO JWS KashfCredit life insurance P P P P P
Life/accident insurance
Agriculture insurance
None of the above
MOJAZ NRDP Nayment OCT OPDCredit life insurance P P
Life/accident insurance P P
Agriculture insurance
None of the above P P
RCDS Sungi SSF SVDPCredit life insurance P
Life/accident insurance
Agriculture insurance P
None of the above P P
AGAHE Akhuwat AMRDO ASA Pak BEDF3.8 Voluntary insurance
offeredYes P
No P P P P
Unknown
CSC DAMEN FFO JWS KashfYes P
No P P P P
Unknown
MOJAZ NRDP Nayment OCT OPDYes P
No P P P P
Unknown
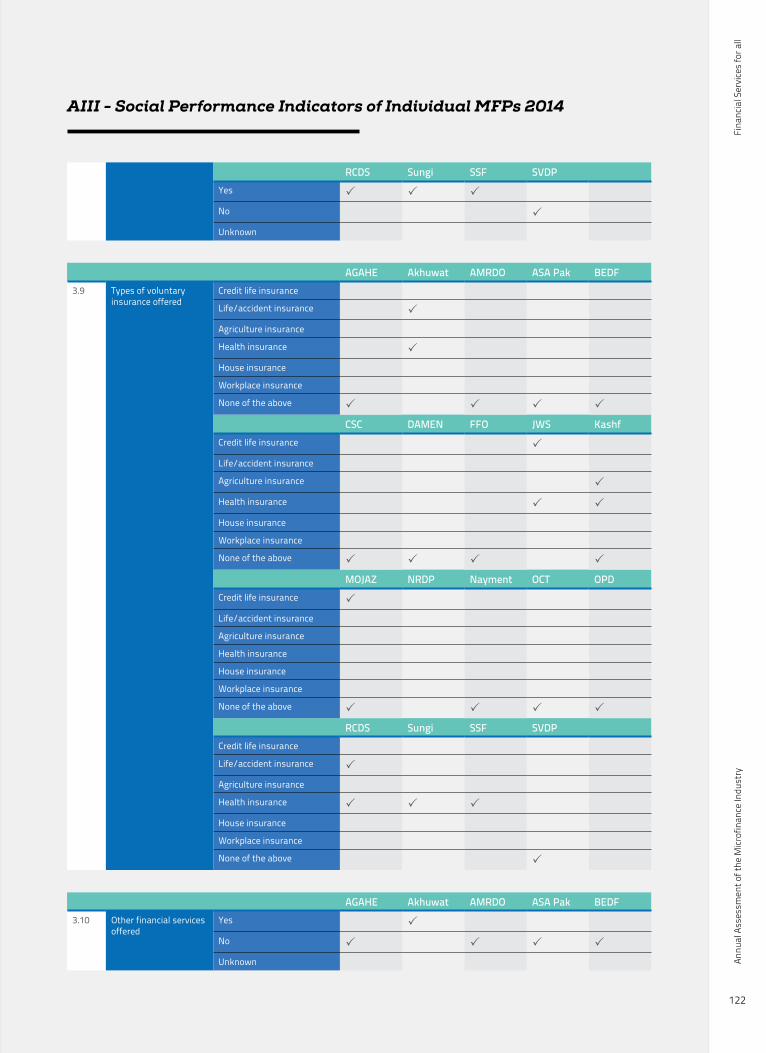
Fina
ncia
l Ser
vice
s fo
r all
Annu
al A
sses
smen
t of t
he M
icrof
inan
ce In
dust
ry
122
AIII - Social Performance Indicators of Individual MFPs 2014
RCDS Sungi SSF SVDPYes P P P
No P
Unknown
AGAHE Akhuwat AMRDO ASA Pak BEDF3.9 Types of voluntary
insurance offeredCredit life insurance
Life/accident insurance P
Agriculture insurance
Health insurance P
House insurance
Workplace insurance
None of the above P P P P
CSC DAMEN FFO JWS KashfCredit life insurance P
Life/accident insurance
Agriculture insurance P
Health insurance P P
House insurance
Workplace insurance
None of the above P P P P
MOJAZ NRDP Nayment OCT OPDCredit life insurance P
Life/accident insurance
Agriculture insurance
Health insurance
House insurance
Workplace insurance
None of the above P P P P
RCDS Sungi SSF SVDPCredit life insurance
Life/accident insurance P
Agriculture insurance
Health insurance P P P
House insurance
Workplace insurance
None of the above P
AGAHE Akhuwat AMRDO ASA Pak BEDF3.10 Other financial services
offeredYes P
No P P P P
Unknown
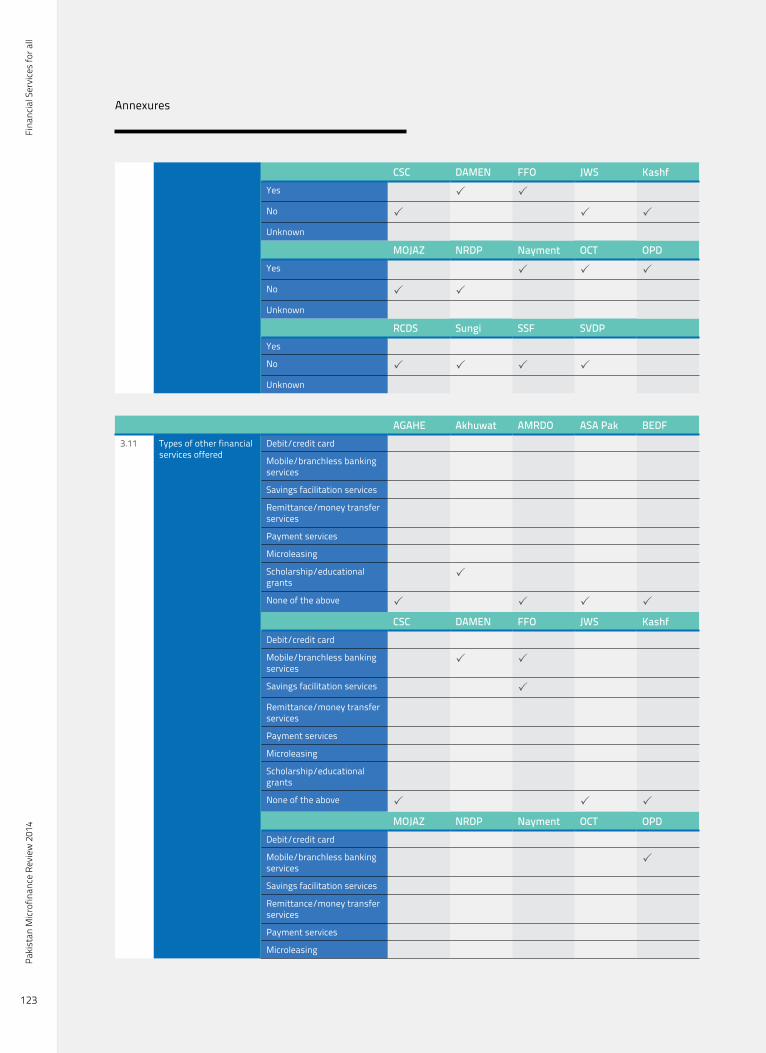
Fina
ncia
l Ser
vice
s fo
r all
Paki
stan
Micr
ofin
ance
Rev
iew
201
4
123
Annexures
CSC DAMEN FFO JWS KashfYes P P
No P P P
Unknown
MOJAZ NRDP Nayment OCT OPDYes P P P
No P P
Unknown
RCDS Sungi SSF SVDPYes
No P P P P
Unknown
AGAHE Akhuwat AMRDO ASA Pak BEDF3.11 Types of other financial
services offeredDebit/credit card
Mobile/branchless banking services
Savings facilitation services
Remittance/money transfer services
Payment services
Microleasing
Scholarship/educational grants
P
None of the above P P P P
CSC DAMEN FFO JWS KashfDebit/credit card
Mobile/branchless banking services
P P
Savings facilitation services P
Remittance/money transfer services
Payment services
Microleasing
Scholarship/educational grants
None of the above P P P
MOJAZ NRDP Nayment OCT OPDDebit/credit card
Mobile/branchless banking services
P
Savings facilitation services
Remittance/money transfer services
Payment services
Microleasing
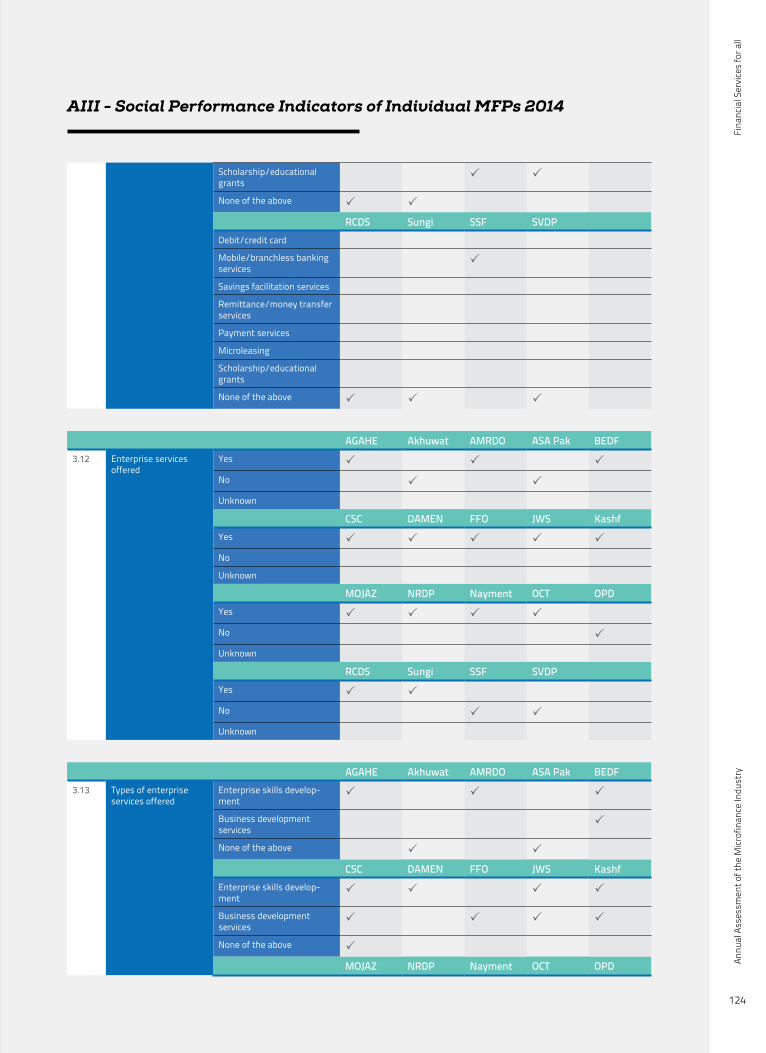
Fina
ncia
l Ser
vice
s fo
r all
Annu
al A
sses
smen
t of t
he M
icrof
inan
ce In
dust
ry
124
AIII - Social Performance Indicators of Individual MFPs 2014
Scholarship/educational grants
P P
None of the above P P
RCDS Sungi SSF SVDPDebit/credit card
Mobile/branchless banking services
P
Savings facilitation services
Remittance/money transfer services
Payment services
Microleasing
Scholarship/educational grants
None of the above P P P
AGAHE Akhuwat AMRDO ASA Pak BEDF3.12 Enterprise services
offeredYes P P P
No P P
Unknown
CSC DAMEN FFO JWS KashfYes P P P P P
No
Unknown
MOJAZ NRDP Nayment OCT OPDYes P P P P
No P
Unknown
RCDS Sungi SSF SVDPYes P P
No P P
Unknown
AGAHE Akhuwat AMRDO ASA Pak BEDF3.13 Types of enterprise
services offeredEnterprise skills develop-ment
P P P
Business development services
P
None of the above P P
CSC DAMEN FFO JWS KashfEnterprise skills develop-ment
P P P P
Business development services
P P P P
None of the above P
MOJAZ NRDP Nayment OCT OPD

Fina
ncia
l Ser
vice
s fo
r all
Paki
stan
Micr
ofin
ance
Rev
iew
201
4
125
Annexures
Enterprise skills develop-ment
P P P P
Business development services
P P
None of the above P
RCDS Sungi SSF SVDPEnterprise skills develop-ment
P P
Business development services
P
None of the above P P
AGAHE Akhuwat AMRDO ASA Pak BEDF3.14 Women’s enpowerment
servicesYes P P P
No P P
Unknown
CSC DAMEN FFO JWS KashfYes P P P P
No P
Unknown
MOJAZ NRDP Nayment OCT OPDYes P P P P
No P
Unknown
RCDS Sungi SSF SVDPYes P P
No P P
Unknown
AGAHE Akhuwat AMRDO ASA Pak BEDF3.15 Types of women’s
empowerment services offered
Leadership training for women
P P
Women's rights education/gender issues training
P P P
Counseling/legal services for female victims of voilence
None of the above P P
CSC DAMEN FFO JWS KashfLeadership training for women
P P P P
Women's rights education/gender issues training
P P P
Counseling/legal services for female victims of voilence
None of the above P
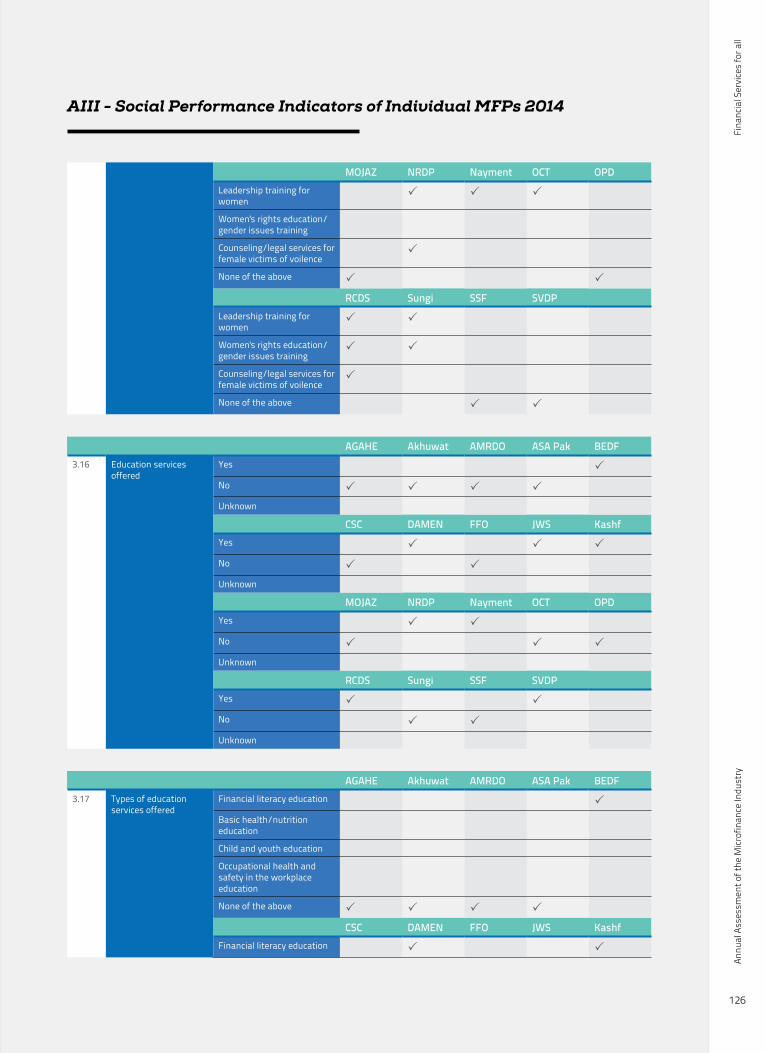
Fina
ncia
l Ser
vice
s fo
r all
Annu
al A
sses
smen
t of t
he M
icrof
inan
ce In
dust
ry
126
AIII - Social Performance Indicators of Individual MFPs 2014
MOJAZ NRDP Nayment OCT OPDLeadership training for women
P P P
Women's rights education/gender issues training
Counseling/legal services for female victims of voilence
P
None of the above P P
RCDS Sungi SSF SVDPLeadership training for women
P P
Women's rights education/gender issues training
P P
Counseling/legal services for female victims of voilence
P
None of the above P P
AGAHE Akhuwat AMRDO ASA Pak BEDF3.16 Education services
offeredYes P
No P P P P
Unknown
CSC DAMEN FFO JWS KashfYes P P P
No P P
Unknown
MOJAZ NRDP Nayment OCT OPDYes P P
No P P P
Unknown
RCDS Sungi SSF SVDPYes P P
No P P
Unknown
AGAHE Akhuwat AMRDO ASA Pak BEDF3.17 Types of education
services offeredFinancial literacy education P
Basic health/nutrition education
Child and youth education
Occupational health and safety in the workplace education
None of the above P P P P
CSC DAMEN FFO JWS KashfFinancial literacy education P P

Fina
ncia
l Ser
vice
s fo
r all
Paki
stan
Micr
ofin
ance
Rev
iew
201
4
127
Annexures
Basic health/nutrition education
P
Child and youth education
Occupational health and safety in the workplace education
None of the above P P
MOJAZ NRDP Nayment OCT OPDFinancial literacy education P
Basic health/nutrition education
P P
Child and youth education P
Occupational health and safety in the workplace education
None of the above P P P
RCDS Sungi SSF SVDPFinancial literacy education P P
Basic health/nutrition education
P
Child and youth education P
Occupational health and safety in the workplace education
P
None of the above P P
AGAHE Akhuwat AMRDO ASA Pak BEDF3.18 Health services offered Yes P
No P P P
Unknown P
CSC DAMEN FFO JWS KashfYes P
No P P P P
Unknown
MOJAZ NRDP Nayment OCT OPDYes P
No P P P P
Unknown
RCDS Sungi SSF SVDPYes P P P
No P
Unknown
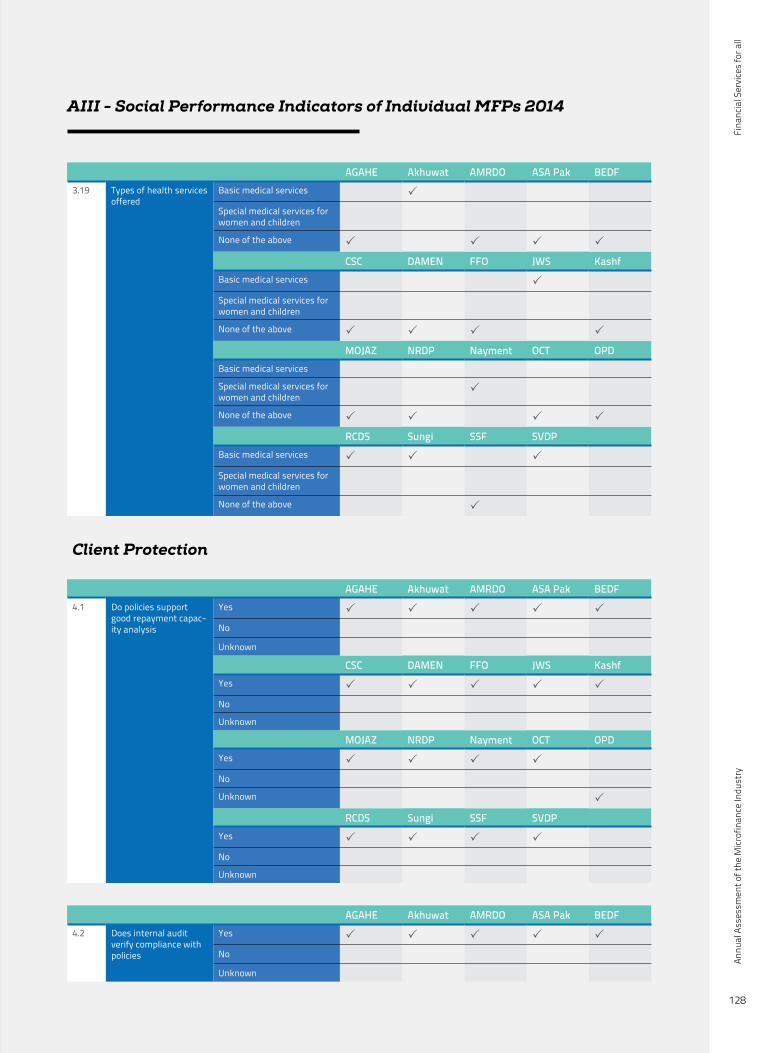
Fina
ncia
l Ser
vice
s fo
r all
Annu
al A
sses
smen
t of t
he M
icrof
inan
ce In
dust
ry
128
AIII - Social Performance Indicators of Individual MFPs 2014
AGAHE Akhuwat AMRDO ASA Pak BEDF3.19 Types of health services
offeredBasic medical services P
Special medical services for women and children
None of the above P P P P
CSC DAMEN FFO JWS KashfBasic medical services P
Special medical services for women and children
None of the above P P P P
MOJAZ NRDP Nayment OCT OPDBasic medical services
Special medical services for women and children
P
None of the above P P P P
RCDS Sungi SSF SVDPBasic medical services P P P
Special medical services for women and children
None of the above P
Client Protection
AGAHE Akhuwat AMRDO ASA Pak BEDF4.1 Do policies support
good repayment capac-ity analysis
Yes P P P P P
No
Unknown
CSC DAMEN FFO JWS KashfYes P P P P P
No
Unknown
MOJAZ NRDP Nayment OCT OPDYes P P P P
No
Unknown P
RCDS Sungi SSF SVDPYes P P P P
No
Unknown
AGAHE Akhuwat AMRDO ASA Pak BEDF4.2 Does internal audit
verify compliance with policies
Yes P P P P P
No
Unknown
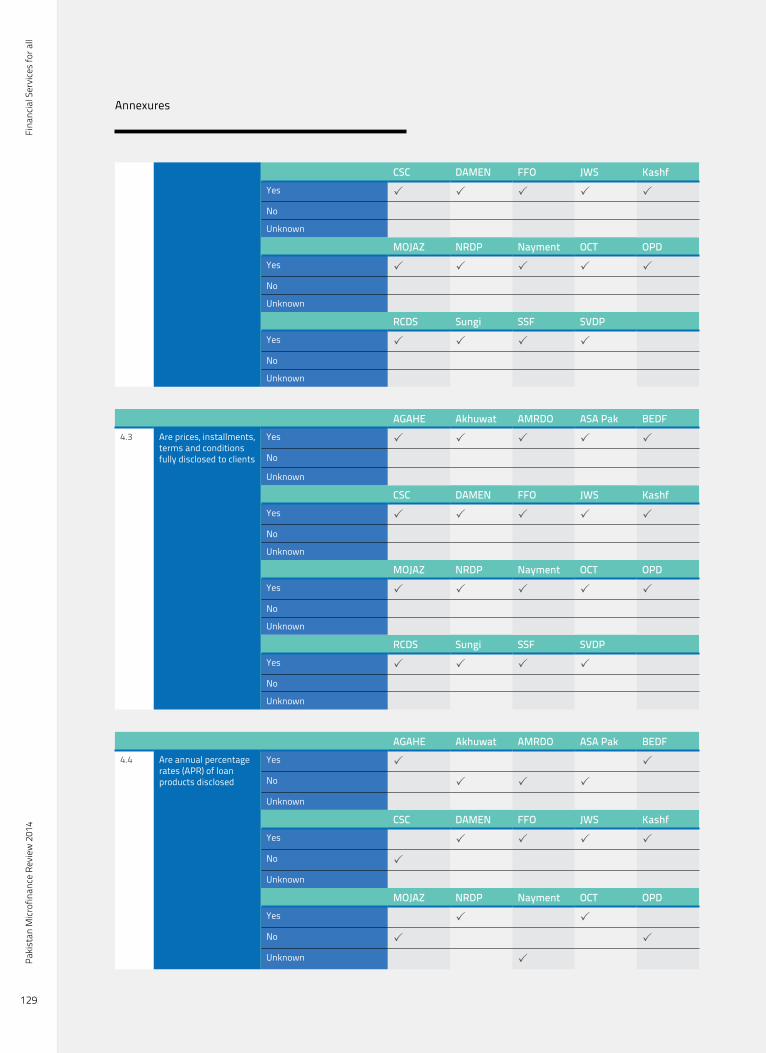
Fina
ncia
l Ser
vice
s fo
r all
Paki
stan
Micr
ofin
ance
Rev
iew
201
4
129
Annexures
CSC DAMEN FFO JWS KashfYes P P P P P
No
Unknown
MOJAZ NRDP Nayment OCT OPDYes P P P P P
No
Unknown
RCDS Sungi SSF SVDPYes P P P P
No
Unknown
AGAHE Akhuwat AMRDO ASA Pak BEDF4.3 Are prices, installments,
terms and conditions fully disclosed to clients
Yes P P P P P
No
Unknown
CSC DAMEN FFO JWS KashfYes P P P P P
No
Unknown
MOJAZ NRDP Nayment OCT OPDYes P P P P P
No
Unknown
RCDS Sungi SSF SVDPYes P P P P
No
Unknown
AGAHE Akhuwat AMRDO ASA Pak BEDF4.4 Are annual percentage
rates (APR) of loan products disclosed
Yes P P
No P P P
Unknown
CSC DAMEN FFO JWS KashfYes P P P P
No P
Unknown
MOJAZ NRDP Nayment OCT OPDYes P P
No P P
Unknown P
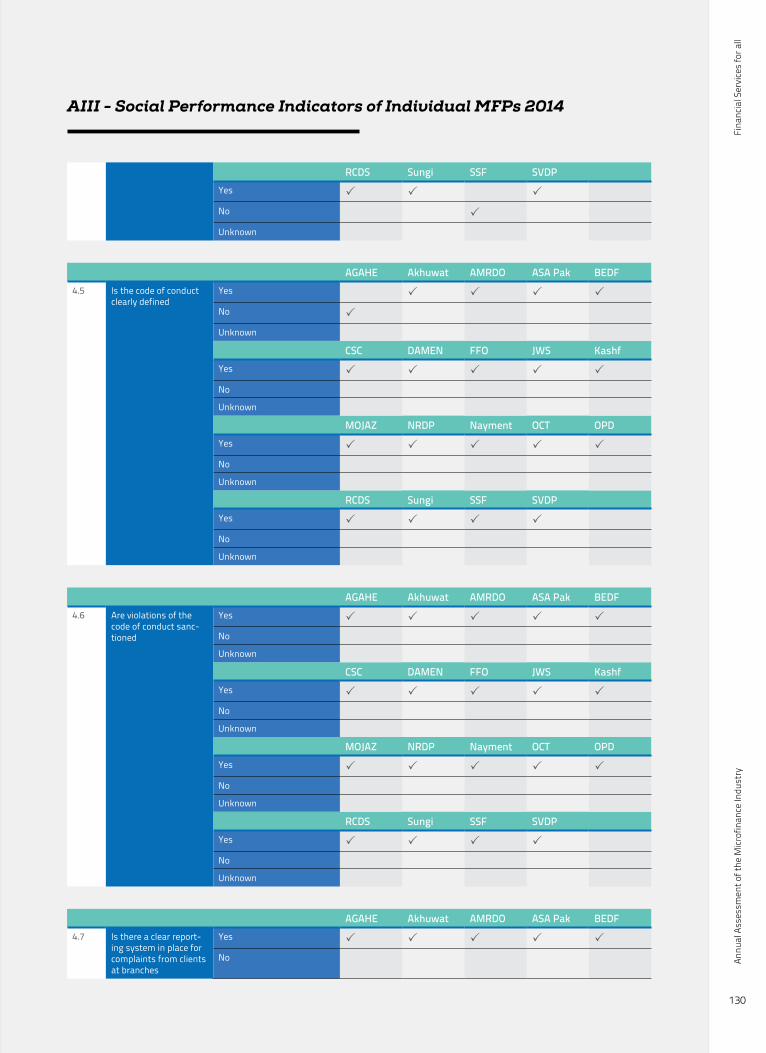
Fina
ncia
l Ser
vice
s fo
r all
Annu
al A
sses
smen
t of t
he M
icrof
inan
ce In
dust
ry
130
AIII - Social Performance Indicators of Individual MFPs 2014
RCDS Sungi SSF SVDPYes P P P
No P
Unknown
AGAHE Akhuwat AMRDO ASA Pak BEDF4.5 Is the code of conduct
clearly definedYes P P P P
No P
Unknown
CSC DAMEN FFO JWS KashfYes P P P P P
No
Unknown
MOJAZ NRDP Nayment OCT OPDYes P P P P P
No
Unknown
RCDS Sungi SSF SVDPYes P P P P
No
Unknown
AGAHE Akhuwat AMRDO ASA Pak BEDF4.6 Are violations of the
code of conduct sanc-tioned
Yes P P P P P
No
Unknown
CSC DAMEN FFO JWS KashfYes P P P P P
No
Unknown
MOJAZ NRDP Nayment OCT OPDYes P P P P P
No
Unknown
RCDS Sungi SSF SVDPYes P P P P
No
Unknown
AGAHE Akhuwat AMRDO ASA Pak BEDF4.7 Is there a clear report-
ing system in place for complaints from clients at branches
Yes P P P P P
No
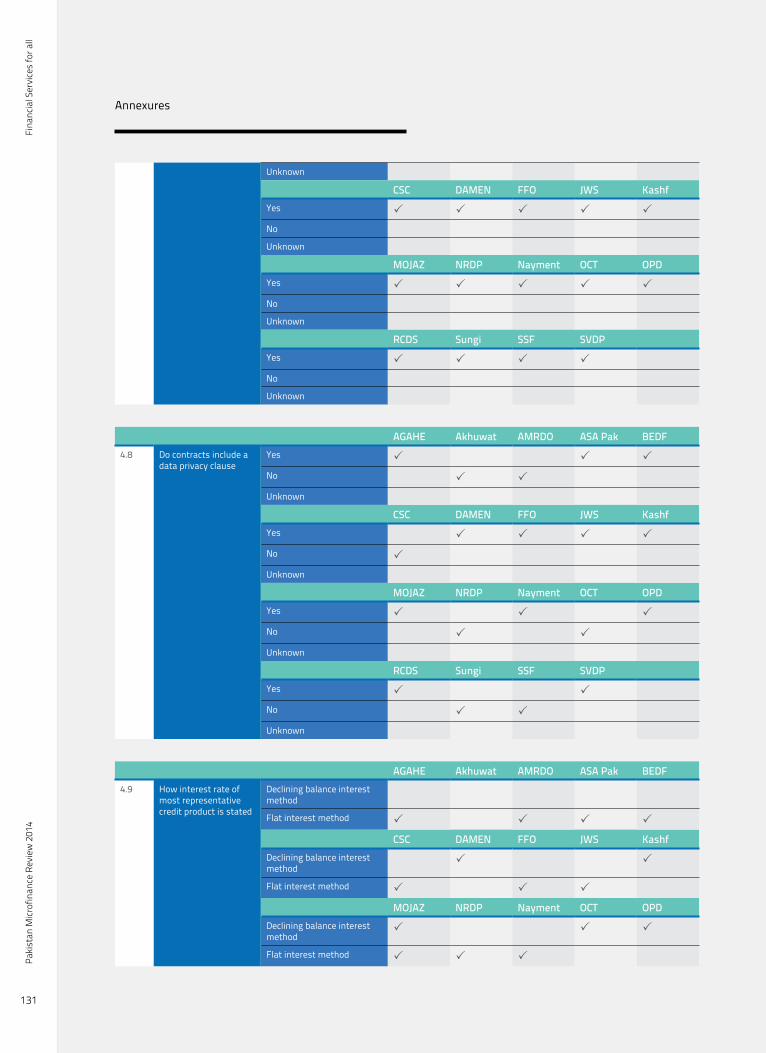
Fina
ncia
l Ser
vice
s fo
r all
Paki
stan
Micr
ofin
ance
Rev
iew
201
4
131
Annexures
Unknown
CSC DAMEN FFO JWS KashfYes P P P P P
No
Unknown
MOJAZ NRDP Nayment OCT OPDYes P P P P P
No
Unknown
RCDS Sungi SSF SVDPYes P P P P
No
Unknown
AGAHE Akhuwat AMRDO ASA Pak BEDF4.8 Do contracts include a
data privacy clauseYes P P P
No P P
Unknown
CSC DAMEN FFO JWS KashfYes P P P P
No P
Unknown
MOJAZ NRDP Nayment OCT OPDYes P P P
No P P
Unknown
RCDS Sungi SSF SVDPYes P P
No P P
Unknown
AGAHE Akhuwat AMRDO ASA Pak BEDF4.9 How interest rate of
most representative credit product is stated
Declining balance interest method
Flat interest method P P P P
CSC DAMEN FFO JWS KashfDeclining balance interest method
P P
Flat interest method P P P
MOJAZ NRDP Nayment OCT OPDDeclining balance interest method
P P P
Flat interest method P P P
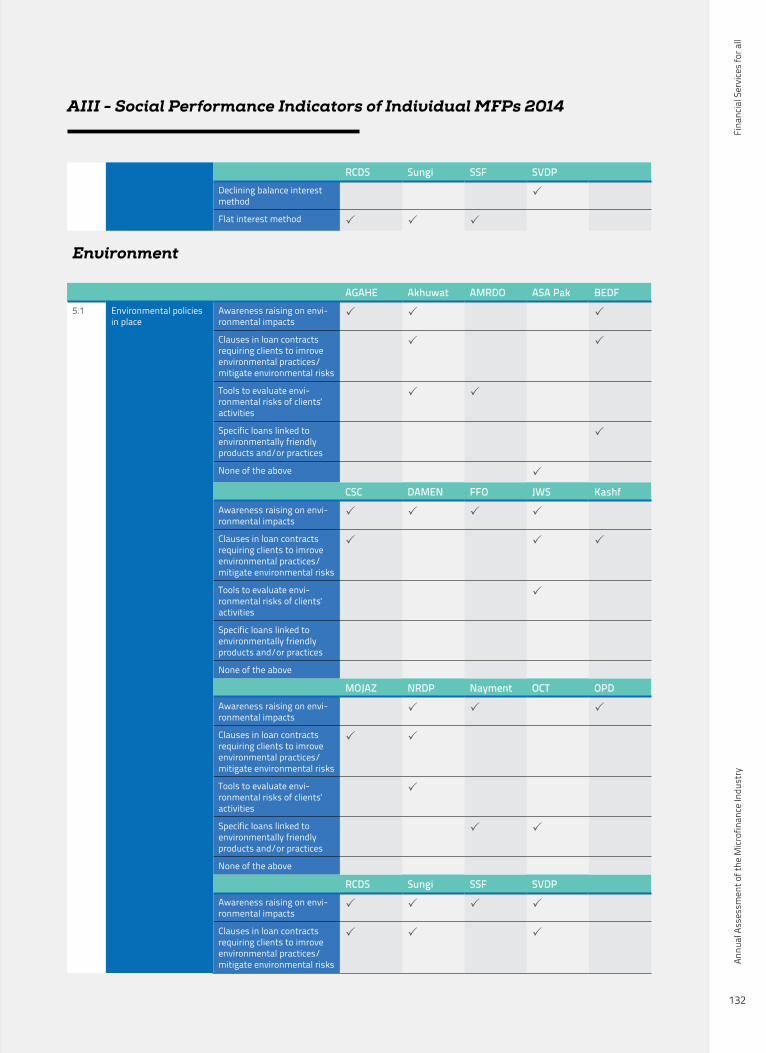
Fina
ncia
l Ser
vice
s fo
r all
Annu
al A
sses
smen
t of t
he M
icrof
inan
ce In
dust
ry
132
AIII - Social Performance Indicators of Individual MFPs 2014
RCDS Sungi SSF SVDPDeclining balance interest method
P
Flat interest method P P P
Environment
AGAHE Akhuwat AMRDO ASA Pak BEDF5.1 Environmental policies
in placeAwareness raising on envi-ronmental impacts
P P P
Clauses in loan contracts requiring clients to imrove environmental practices/mitigate environmental risks
P P
Tools to evaluate envi-ronmental risks of clients' activities
P P
Specific loans linked to environmentally friendly products and/or practices
P
None of the above P
CSC DAMEN FFO JWS KashfAwareness raising on envi-ronmental impacts
P P P P
Clauses in loan contracts requiring clients to imrove environmental practices/mitigate environmental risks
P P P
Tools to evaluate envi-ronmental risks of clients' activities
P
Specific loans linked to environmentally friendly products and/or practices
None of the above
MOJAZ NRDP Nayment OCT OPDAwareness raising on envi-ronmental impacts
P P P
Clauses in loan contracts requiring clients to imrove environmental practices/mitigate environmental risks
P P
Tools to evaluate envi-ronmental risks of clients' activities
P
Specific loans linked to environmentally friendly products and/or practices
P P
None of the above
RCDS Sungi SSF SVDPAwareness raising on envi-ronmental impacts
P P P P
Clauses in loan contracts requiring clients to imrove environmental practices/mitigate environmental risks
P P P
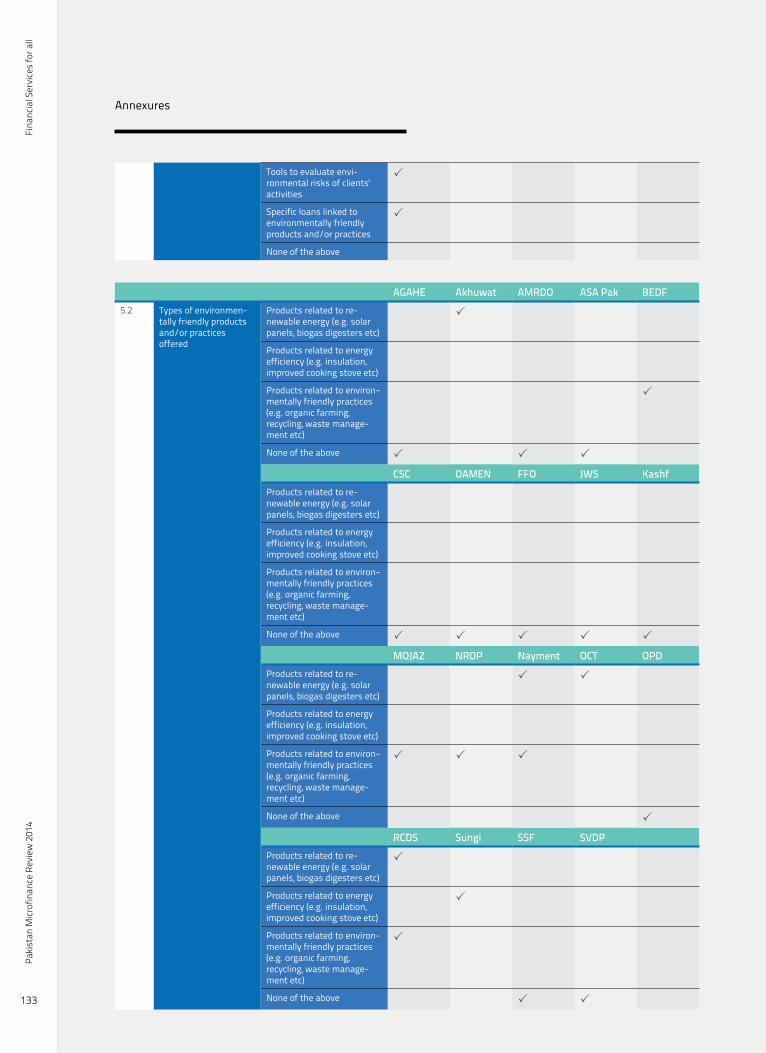
Fina
ncia
l Ser
vice
s fo
r all
Paki
stan
Micr
ofin
ance
Rev
iew
201
4
133
Annexures
Tools to evaluate envi-ronmental risks of clients' activities
P
Specific loans linked to environmentally friendly products and/or practices
P
None of the above
AGAHE Akhuwat AMRDO ASA Pak BEDF5.2 Types of environmen-
tally friendly products and/or practices offered
Products related to re-newable energy (e.g. solar panels, biogas digesters etc)
P
Products related to energy efficiency (e.g. insulation, improved cooking stove etc)
Products related to environ-mentally friendly practices (e.g. organic farming, recycling, waste manage-ment etc)
P
None of the above P P P
CSC DAMEN FFO JWS KashfProducts related to re-newable energy (e.g. solar panels, biogas digesters etc)
Products related to energy efficiency (e.g. insulation, improved cooking stove etc)
Products related to environ-mentally friendly practices (e.g. organic farming, recycling, waste manage-ment etc)
None of the above P P P P P
MOJAZ NRDP Nayment OCT OPDProducts related to re-newable energy (e.g. solar panels, biogas digesters etc)
P P
Products related to energy efficiency (e.g. insulation, improved cooking stove etc)
Products related to environ-mentally friendly practices (e.g. organic farming, recycling, waste manage-ment etc)
P P P
None of the above P
RCDS Sungi SSF SVDPProducts related to re-newable energy (e.g. solar panels, biogas digesters etc)
P
Products related to energy efficiency (e.g. insulation, improved cooking stove etc)
P
Products related to environ-mentally friendly practices (e.g. organic farming, recycling, waste manage-ment etc)
P
None of the above P P
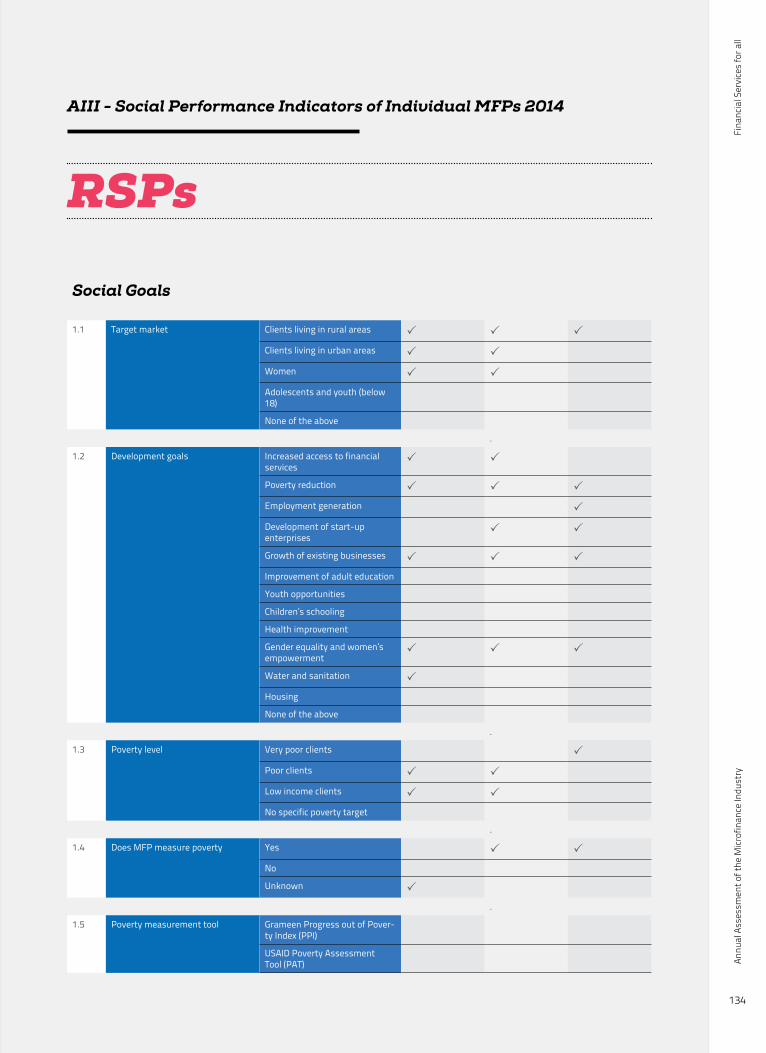
Fina
ncia
l Ser
vice
s fo
r all
Annu
al A
sses
smen
t of t
he M
icrof
inan
ce In
dust
ry
134
AIII - Social Performance Indicators of Individual MFPs 2014
Social Goals
1.1 Target market Clients living in rural areas P P P
Clients living in urban areas P P
Women P P
Adolescents and youth (below 18)
None of the above
.
1.2 Development goals Increased access to financial services
P P
Poverty reduction P P P
Employment generation P
Development of start-up enterprises
P P
Growth of existing businesses P P P
Improvement of adult education
Youth opportunities
Children’s schooling
Health improvement
Gender equality and women’s empowerment
P P P
Water and sanitation P
Housing
None of the above
.
1.3 Poverty level Very poor clients P
Poor clients P P
Low income clients P P
No specific poverty target
.
1.4 Does MFP measure poverty Yes P P
No
Unknown P
.
1.5 Poverty measurement tool Grameen Progress out of Pover-ty Index (PPI)
USAID Poverty Assessment Tool (PAT)
RSPs
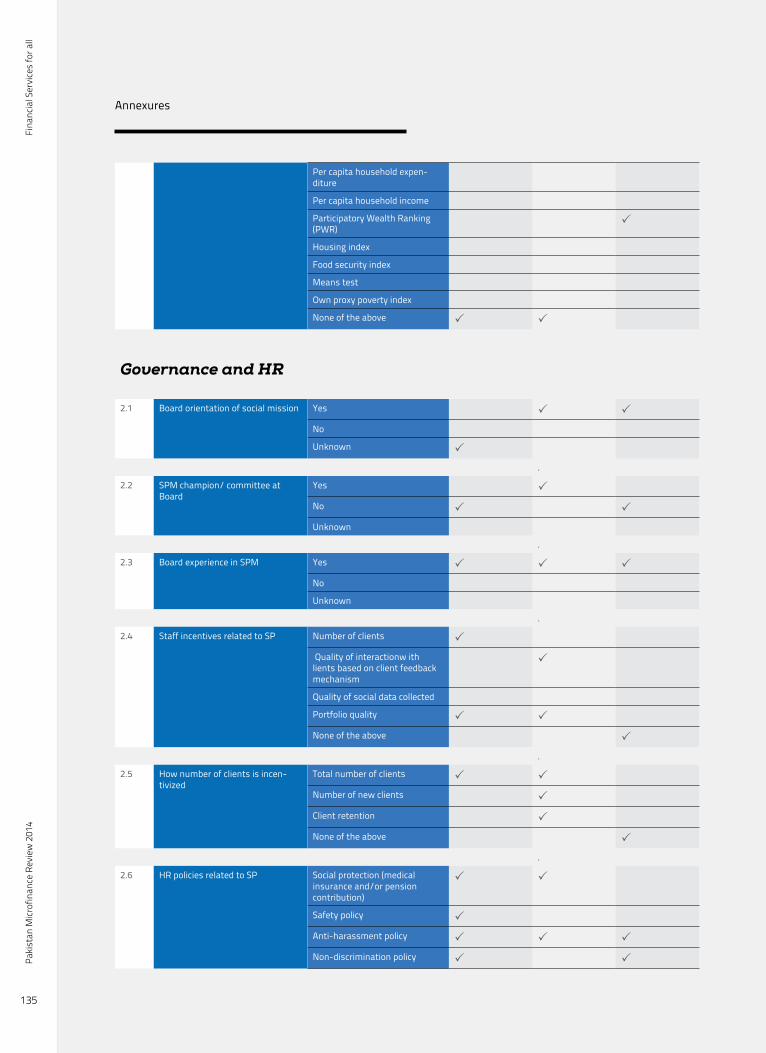
Fina
ncia
l Ser
vice
s fo
r all
Paki
stan
Micr
ofin
ance
Rev
iew
201
4
135
Annexures
Per capita household expen-diture
Per capita household income
Participatory Wealth Ranking (PWR)
P
Housing index
Food security index
Means test
Own proxy poverty index
None of the above P P
Governance and HR
2.1 Board orientation of social mission Yes P P
No
Unknown P
.
2.2 SPM champion/ committee at Board
Yes P
No P P
Unknown
.
2.3 Board experience in SPM Yes P P P
No
Unknown
.
2.4 Staff incentives related to SP Number of clients P
Quality of interactionw ith lients based on client feedback mechanism
P
Quality of social data collected
Portfolio quality P P
None of the above P
.
2.5 How number of clients is incen-tivized
Total number of clients P P
Number of new clients P
Client retention P
None of the above P
.
2.6 HR policies related to SP Social protection (medical insurance and/or pension contribution)
P P
Safety policy P
Anti-harassment policy P P P
Non-discrimination policy P P

Fina
ncia
l Ser
vice
s fo
r all
Annu
al A
sses
smen
t of t
he M
icrof
inan
ce In
dust
ry
136
AIII - Social Performance Indicators of Individual MFPs 2014
Grievance resolution policy P P P
None of the above
.
Products and Services
3.1 Types of credit products Income generating loans P P P
Non-income generating loans
Does not offer credit products
.
3.2 Types of income generating loans Microenterprise loans P P P
SME loans
Agriculture/livestock loans P P P
Express loans
None of the above
.
3.3 Types of non-income generating loans
Education loans P
Emergency loans P
Housing loans P
Other household needs/con-sumption
P
None of the above P P
.
3.4 Types of savings products Compulsory sacings accounts
Voluntary savings accounts P P
Does not offer savings accounts P
.
3.5 Types of voluntary savings products
Demand deposit accounts
Time deposit accounts
None of the above P P P
.
3.6 Compulory insurance required Yes P P P
No
Unknown
. .
3.7 Types of compulory insurance required
Credit life insurance P P
Life/accident insurance P P
Agriculture insurance P
None of the above
.
3.8 Voluntary insurance offered Yes
No P P P
Unknown
. .

Fina
ncia
l Ser
vice
s fo
r all
Paki
stan
Micr
ofin
ance
Rev
iew
201
4
137
Annexures
3.9 Types of voluntary insurance offered
Credit life insurance
Life/accident insurance
Agriculture insurance
Health insurance
House insurance
Workplace insurance
None of the above P P P
.
3.10 Other financial services offered Yes P
No P P
Unknown
. .
3.11 Types of other financial services offered
Debit/credit card
Mobile/branchless banking services
Savings facilitation services P
Remittance/money transfer services
Payment services
Microleasing
Scholarship/educational grants
None of the above P P
.
3.12 Enterprise services offered Yes P P
No P
Unknown
.
3.13 Types of enterprise services offered Enterprise skills development P P
Business development services P
None of the above P
.
3.14 Women’s enpowerment services Yes P P
No P
Unknown
.
3.15 Types of women’s empowerment services offered
Leadership training for women P
Women’s rights education/gen-der issues training
P P
Counseling/legal services for female victims of voilence
None of the above P
.
3.16 Education services offered Yes P P
No P
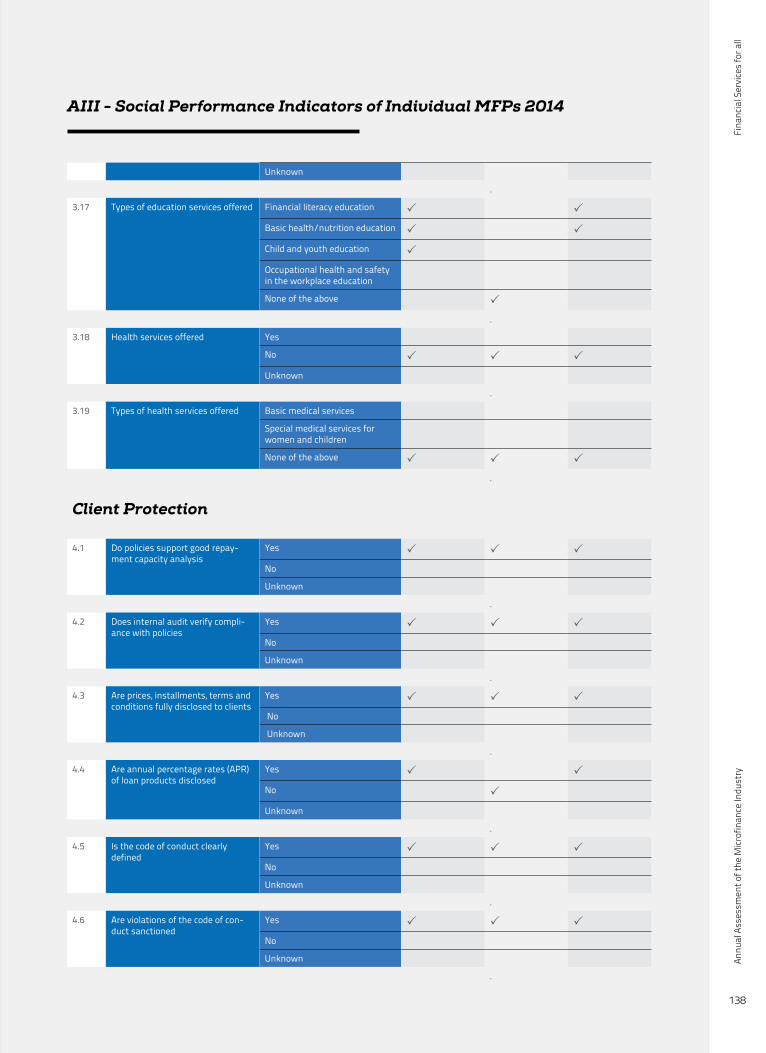
Fina
ncia
l Ser
vice
s fo
r all
Annu
al A
sses
smen
t of t
he M
icrof
inan
ce In
dust
ry
138
AIII - Social Performance Indicators of Individual MFPs 2014
Unknown
.
3.17 Types of education services offered Financial literacy education P P
Basic health/nutrition education P P
Child and youth education P
Occupational health and safety in the workplace education
None of the above P
.
3.18 Health services offered Yes
No P P P
Unknown
.
3.19 Types of health services offered Basic medical services
Special medical services for women and children
None of the above P P P
.
Client Protection
4.1 Do policies support good repay-ment capacity analysis
Yes P P P
No
Unknown
.
4.2 Does internal audit verify compli-ance with policies
Yes P P P
No
Unknown
.
4.3 Are prices, installments, terms and conditions fully disclosed to clients
Yes P P P
No
Unknown
.
4.4 Are annual percentage rates (APR) of loan products disclosed
Yes P P
No P
Unknown
.
4.5 Is the code of conduct clearly defined
Yes P P P
No
Unknown
.
4.6 Are violations of the code of con-duct sanctioned
Yes P P P
No
Unknown
.
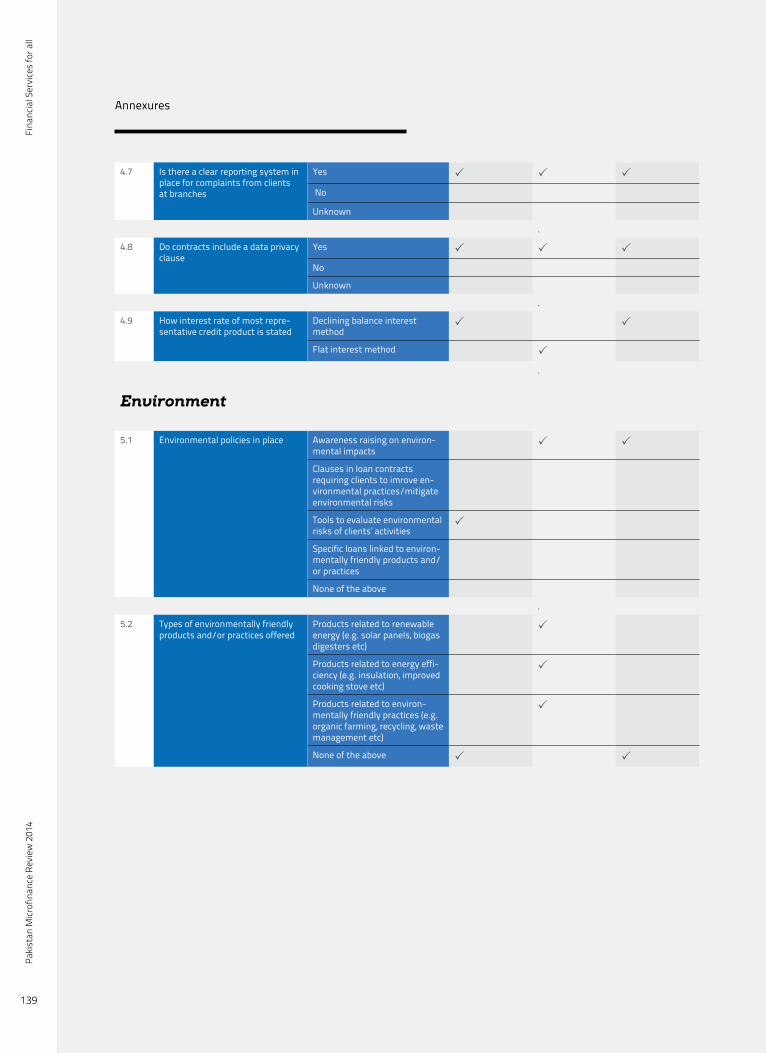
Fina
ncia
l Ser
vice
s fo
r all
Paki
stan
Micr
ofin
ance
Rev
iew
201
4
139
Annexures
4.7 Is there a clear reporting system in place for complaints from clients at branches
Yes P P P
No
Unknown
.
4.8 Do contracts include a data privacy clause
Yes P P P
No
Unknown
.
4.9 How interest rate of most repre-sentative credit product is stated
Declining balance interest method
P P
Flat interest method P
.
Environment
5.1 Environmental policies in place Awareness raising on environ-mental impacts
P P
Clauses in loan contracts requiring clients to imrove en-vironmental practices/mitigate environmental risks
Tools to evaluate environmental risks of clients’ activities
P
Specific loans linked to environ-mentally friendly products and/or practices
None of the above
.
5.2 Types of environmentally friendly products and/or practices offered
Products related to renewable energy (e.g. solar panels, biogas digesters etc)
P
Products related to energy effi-ciency (e.g. insulation, improved cooking stove etc)
P
Products related to environ-mentally friendly practices (e.g. organic farming, recycling, waste management etc)
P
None of the above P P
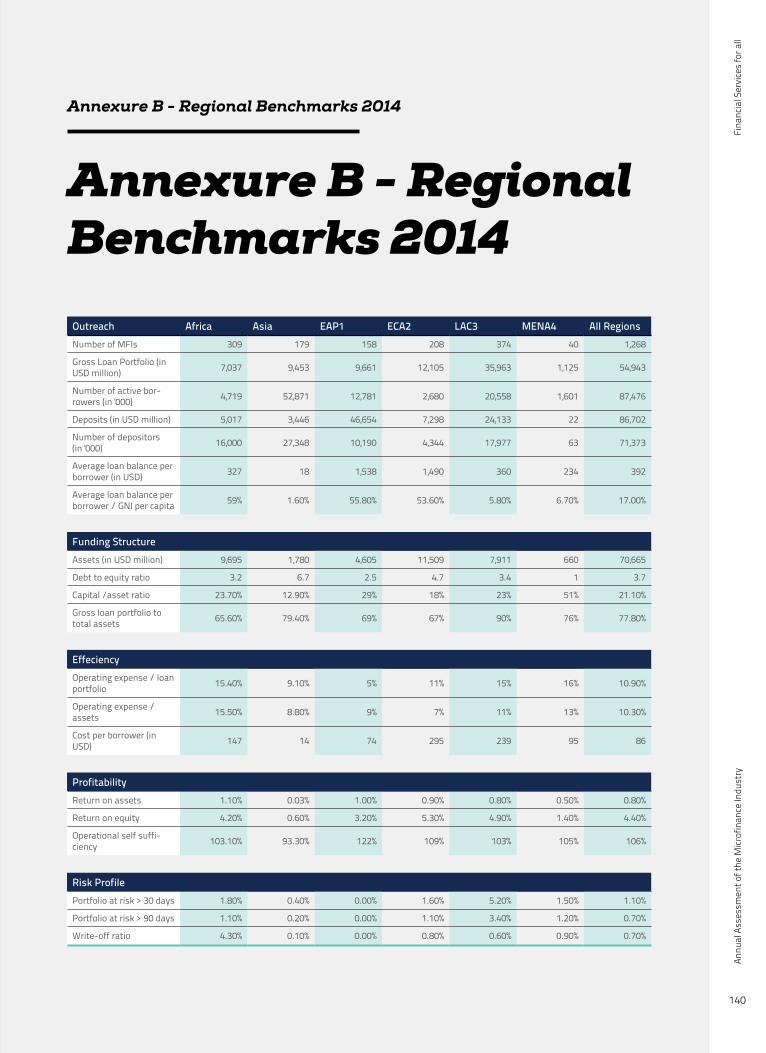
Fina
ncia
l Ser
vice
s fo
r all
Annu
al A
sses
smen
t of t
he M
icrof
inan
ce In
dust
ry
140
Annexure B - Regional Benchmarks 2014
Annexure B - Regional Benchmarks 2014
Outreach Africa Asia EAP1 ECA2 LAC3 MENA4 All RegionsNumber of MFIs 309 179 158 208 374 40 1,268
Gross Loan Portfolio (in USD million) 7,037 9,453 9,661 12,105 35,963 1,125 54,943
Number of active bor-rowers (in '000) 4,719 52,871 12,781 2,680 20,558 1,601 87,476
Deposits (in USD million) 5,017 3,446 46,654 7,298 24,133 22 86,702
Number of depositors (in '000) 16,000 27,348 10,190 4,344 17,977 63 71,373
Average loan balance per borrower (in USD) 327 18 1,538 1,490 360 234 392
Average loan balance per borrower / GNI per capita 59% 1.60% 55.80% 53.60% 5.80% 6.70% 17.00%
Funding StructureAssets (in USD million) 9,695 1,780 4,605 11,509 7,911 660 70,665
Debt to equity ratio 3.2 6.7 2.5 4.7 3.4 1 3.7
Capital /asset ratio 23.70% 12.90% 29% 18% 23% 51% 21.10%
Gross loan portfolio to total assets 65.60% 79.40% 69% 67% 90% 76% 77.80%
EffeciencyOperating expense / loan portfolio 15.40% 9.10% 5% 11% 15% 16% 10.90%
Operating expense / assets 15.50% 8.80% 9% 7% 11% 13% 10.30%
Cost per borrower (in USD) 147 14 74 295 239 95 86
ProfitabilityReturn on assets 1.10% 0.03% 1.00% 0.90% 0.80% 0.50% 0.80%
Return on equity 4.20% 0.60% 3.20% 5.30% 4.90% 1.40% 4.40%
Operational self suffi-ciency 103.10% 93.30% 122% 109% 103% 105% 106%
Risk ProfilePortfolio at risk > 30 days 1.80% 0.40% 0.00% 1.60% 5.20% 1.50% 1.10%
Portfolio at risk > 90 days 1.10% 0.20% 0.00% 1.10% 3.40% 1.20% 0.70%
Write-off ratio 4.30% 0.10% 0.00% 0.80% 0.60% 0.90% 0.70%
Fina
ncia
l Ser
vice
s fo
r all
Paki
stan
Micr
ofin
ance
Rev
iew
201
4
141
Annexures
Microfinance Banks (MFBs)
APNA Microfinance Bank Ltd (AMFB)
• AMFB provided PMN with its audited accounts. The numbers reported in the PMR match these reports. Riaz Ahmad and Co. audited the annual accounts of AMFB for the year ending at 31st December 2014.
• The financial statements have been presented as per the requirements of the State Bank of Pakistan.• The related party transactions have been properly disclosed in notes to the financial statements.• The grant income has been properly disclosed in financial statements and there is proper disclosure on grants
in notes to the financial statements.• The following numbers have been taken from AMFB’s MIS: i). rural-urban clients; ii). male-female clients; iii).
Number of staff; iv). Number of credit officers; and v). Number of branches (also available in audited accounts).
FINCA Microfinance Bank Ltd (FINCA)(Formerly Kashf Microfinance Bank Ltd)
• FINCA provided PMN with its audited accounts. The numbers reported in the PMR match these reports. M. Yossuf Adil Saleem and Co. audited the annual accounts of FINCA for the year ending at 31st December 2014.
• The financial statements have been presented as per the requirements of the State Bank of Pakistan.• The related party transactions have been properly disclosed in notes to the financial statements.• The grant income has been properly disclosed in financial statements and there is proper disclosure on grants
in notes to the financial statements.• The following numbers have been taken from FINCA’s MIS: i). rural-urban clients; ii). male-female clients; iii).
Number of staff; iv). Number of credit officers; and v). Number of branches (also available in audited accounts).
Khushhali Bank Ltd (KBL)
• KBL provided PMN with its audited accounts. The numbers reported in the PMR match these reports. A.F. Ferguson audited the annual accounts of KBL for the year ending at 31st December 2014.
• The financial statements have been presented as per the requirements of the State Bank of Pakistan.• The related party transactions have been properly disclosed in notes to the financial statements.• The grant income has been properly disclosed in financial statements and there is a proper disclosure on
grants in notes to the financial statements.• The following numbers have been taken from KBL’s MIS: i). rural-urban clients; ii). male-female clients; iii).
Portfolio aging; iv). Number of staff; v). Number of credit officers; and vi). Number of branches (also available in audited accounts).
Annexure C Sources of data (2014)

Fina
ncia
l Ser
vice
s fo
r all
Annu
al A
sses
smen
t of t
he M
icrof
inan
ce In
dust
ry
142
Annexure C Sources of data (2014)
The First Microfinance Bank Ltd (FMFBL) • FMFB provided PMN with its audited accounts. The numbers reported in the PMR match these reports. KPMG
audited the annual accounts of FMFBL for the year ending at 31st December 2014.• The financial statements have been presented as per the requirements of the State Bank of Pakistan.• The related party transactions have been properly disclosed in notes to the financial statements.• The grant income has been properly disclosed in financial statements and there is proper disclosure on grants
in notes to the financial statements.• The following numbers have been taken from the MIS: i). rural-urban clients; ii). male-female clients; iii). Port-
folio aging; iv). Number of staff; v). Number of credit officers; and vi). Number of branches (also available in audited accounts).
National Rural Support Programme Microfinance Bank (NRSP-B) • NRSP-B provided PMN with its audited accounts. The numbers reported in the PMR match these reports.
M. Yossuf Adil Saleem and Co. audited the annual accounts of NRSP-B for the year ending at 31st December 2014.
• The financial statements have been presented as per the requirements of the State Bank of Pakistan.• The related party transactions have been properly disclosed in notes to the financial statements.• The grant income has been properly disclosed in financial statements and there is proper disclosure on grants
in notes to the financial statements.• The following numbers have been taken from the MIS: i). rural-urban clients; ii). male-female clients; iii). Port-
folio aging; iv). Number of staff; v). Number of credit officers; and vi). Number of branches (also available in audited accounts).
Pak Oman Microfinance Bank Ltd (POMFB)
• POMFB reported its audited accounts in newspapers, from whence the accounts were obtained. The numbers reported in the PMR match these reports. M. Yossuf Adil Saleem and Co. audited the annual accounts of POM-FB for the year ending at 31st December 2014.
• The financial statements have been presented as per the requirements of the State Bank of Pakistan.• The related party transactions have been properly disclosed in notes to the financial statements.• The grant income has been properly disclosed in financial statements and there is proper disclosure on grants
in notes to the financial statements.• The following numbers have been taken from the MIS: i). rural-urban clients; ii). male-female clients; iii). Port-
folio aging; iv). Number of staff; v). Number of credit officers; and vi). Number of branches (also available in audited accounts).
Tameer Microfinance Bank Ltd (TMFB) • TMFB provided PMN with its audited accounts. The numbers reported in the PMR match these reports. Ernst
and Young Ford Rhodes Sidat Hyder and Co. audited the annual accounts of TMFB for the year ending at 31st December 2014.
• The financial statements have been presented as per the requirements of the State Bank of Pakistan.• The related party transactions have been properly disclosed in notes to the financial statements.• The grant income has been properly disclosed in financial statements and there is proper disclosure on grants
in notes to the financial statements.• The following numbers have been taken from the MIS: i). rural-urban clients; ii). male-female clients; iii). Port-
folio aging; iv). Number of staff; v). Number of credit officers; and vi). Number of branches (also available in audited accounts).
U Microfinance Bank Ltd (U-bank)
• U-bank provided PMN with its audited accounts. The numbers reported in the PMR match these reports. A.F. Ferguson audited the annual accounts of FINCA for the year ending at 31st December 2014.
• The financial statements have been presented as per the requirements of the State Bank of Pakistan.
Fina
ncia
l Ser
vice
s fo
r all
Paki
stan
Micr
ofin
ance
Rev
iew
201
4
143
Annexures
• The related party transactions have been properly disclosed in notes to the financial statements.• The grant income has been properly disclosed in financial statements and there is proper disclosure on grants
in notes to the financial statements.• The following numbers have been taken from the MIS: i). rural-urban clients; ii). male-female clients; iii). Port-
folio aging; iv). Number of staff; v). Number of credit officers; and vi). Number of branches (also available in audited accounts).
Waseela Microfinance Bank Ltd (WMFB) • Waseela provided PMN with its audited accounts. The numbers reported in the PMR match these reports.
KPMG audited the annual accounts of FINCA for the year ending at 31st December 2014.• The financial statements have been presented as per the requirements of the State Bank of Pakistan.• The related party transactions have been properly disclosed in notes to the financial statements.• The grant income has been properly disclosed in financial statements there is proper disclosure on grants in
notes to the financial statements.• The following numbers have been taken from the MIS: i). rural-urban clients; ii). male-female clients; iii). Port-
folio aging; iv). Number of staff; v). Number of credit officers; and vi). Number of branches (also available in audited accounts).
Microfinance Institution (MFI)
ASA Pakistan limited (ASA-P)
• ASA-P provided PMN with its audited accounts. The numbers reported in the PMR match these reports. Ernst and Young Ford Rhodes Sidat Hyder and Co has audited the annual accounts of ASA-P for the year ending at 31st December 2014.
• ASA-P prepares its financial statements under the historical cost convention and in conformity with accepted accounting practices.
• Adjustments were not made to loan loss provisioning expense as ASA-P is aggressive in its policies.• The following numbers have been taken from the organization’s MIS: i). rural-urban clients; and ii). male-fe-
male clients; • There is proper disclosure on the balance sheet of loan portfolio, and loan loss provision; expense charged
during the year is disclosed on the income statement.• The related party transactions have been properly disclosed in notes to the financial statements.
Agahe
• Agahe provided PMN with its audited accounts. The numbers reported in the PMR match these reports. Uzair Hammad Faisal & Co. has audited the annual accounts of Agahe for the year ending at 31st December 2014.
• Agahe prepares its financial statements under the historical cost convention, in conformity with accepted accounting practices.
• All necessary adjustments to Agahe data have been made in order to remove subsidies. No adjustment was made to loan loss provisioning expense as Agahe is aggressive in its policies.
• The related party transactions have been properly disclosed in notes to the financial statements.• The grant income has been properly disclosed in financial statements. Additionally, there is proper disclosure
on grants in notes to the financial statements.
Akhuwat
• Akhuwat provided PMN with its audited accounts. The numbers reported in the PMR match these reports. M. Yossuf Adil Saleem and Co. has audited the annual accounts of ASA-P for the year ending at 30th June 2014.
• Akhuwat prepares its financial statements under the historical cost convention and in conformity with ac-cepted accounting practices.
• All necessary adjustments to data have been made in order to remove subsidies. No adjustment was made to
Fina
ncia
l Ser
vice
s fo
r all
Annu
al A
sses
smen
t of t
he M
icrof
inan
ce In
dust
ry
144
Annexure C Sources of data (2014)
loan loss provisioning expense as the institute is aggressive in its policies.• The following numbers have been taken from the organization’s MIS: i). rural-urban clients; and ii). male-fe-
male clients; • The grant income has been properly disclosed in financial statements and there is proper disclosure on grants
in notes to the financial statements.
Al-Mehran Rural Development Organization (AMRDO)
• AMRDO provided PMN with its audited accounts. The numbers reported in the PMR match these reports. Hafizullah & Co. has audited the annual accounts of AMRDO for the year ending at 30th June 2014.
• AMRDO prepares its financial statements under the historical cost convention, in conformity with accepted accounting practices.
• All necessary adjustments to data have been made in order to remove subsidies. No adjustment was made to loan loss provisioning expense as the institute is aggressive in its policies.
• The related party transactions have been properly disclosed in notes to the financial statements.• The grant income has been properly disclosed in financial statements. Additionally, there is proper disclosure
on grants in notes to the financial statements.
BRAC-Pakistan
• BRAC-Pakistan provided PMN with its audited accounts. The numbers reported in the PMR match these re-ports. KPMG (Taseer Hadi and Co) has audited the annual accounts of BRAC-Pakistan for the year ending at 31st December 2014.
• BRAC prepares its financial statements under the historical cost convention and in conformity with accepted accounting policies.
• BRAC is an integrated program and, therefore, prepares separate financial accounts for all its programs. The audit is done and a consolidated audit report is prepared with clear differentiations of both revenue and costs for each program in light of accounting standards.
Baidarie
• Baidarie provided PMN with its audited accounts. The numbers reported in the PMR match these reports. Ale Imran & Co. audited the annual accounts of Baidarie for the year ending at 30th June 2014.
• All necessary adjustments to Baidarie data have been made in order to remove subsidies. No adjustment was made to loan loss provisioning expense as CSC is aggressive in its policies.
• The following numbers have been taken from the organization’s MIS: i). rural-urban clients; ii). male-female clients; iii). Aging on number of loans and value of portfolio (verifiable from audited accounts); iv). Number of staff; v). Number of credit officers; and vi). Number of offices.
• The grant income has been properly disclosed in financial statements and there is proper disclosure on grants in notes to the financial statements.
Community Support Concern (CSC)
• CSC provided PMN with its audited accounts. The numbers reported in the PMR match these reports. Riaz Ahmad & Co. audited the annual accounts of CSC for the year ending at 30th June 2014.
• All necessary adjustments to CSC data have been made in order to remove subsidies. No adjustment was made to loan loss provisioning expense as CSC is aggressive in its policies.
• CSC prepares its financial statements under the historical cost convention and in conformity with accepted accounting practices.
• The following numbers have been taken from the organization’s MIS: i). rural-urban clients; ii). male-female clients; iii). Aging on number of loans and value of portfolio (verifiable from audited accounts); iv). Number of staff; v). Number of credit officers; and vi). Number of offices.
• The grant income has been properly disclosed in financial statements and there is proper disclosure on grants in notes to the financial statements.
Fina
ncia
l Ser
vice
s fo
r all
Paki
stan
Micr
ofin
ance
Rev
iew
201
4
145
Annexures
Farmers Friend Organization (FFO)
• FFO provided PMN with its audited accounts. The numbers reported in the PMR match these reports. Tariq Abdul Ghani Maqbool & Co audited the annual accounts for FFO for the year ending at 30th June 2014.
• All necessary adjustments to FFO data have been made in order to remove subsidies. There is no adjustment on loan loss provisioning expense as FFO is aggressive in its policies.
• FFO prepares its financial statements under the historical cost convention and in conformity with accepted accounting practices.
• The following numbers have been taken from the organization’s MIS: i). rural-urban clients; ii). male-female clients; iii). Aging on number of loans and value of portfolio iv). Number of staff; v). Number of credit officers; and vi). Number of offices.
• The grant income has been properly disclosed in financial statements. Additionally, there is proper disclosure on grants in notes to the financial statements.
DEEP Foundation (DEEP)
• DEEP provided PMN with its audited accounts. The numbers reported in the PMR match these reports. Sal-man Arshad audited the annual accounts for DEEP for the year ending at 30th June 2014.
• DEEP prepares its financial statements under the historical cost convention and in conformity with accepted accounting practices.
• The following numbers have been taken from the organization’s MIS: i). rural-urban clients; ii). male-female clients; iii). Aging on number of loans and value of portfolio iv). Number of staff; v). Number of credit officers; and vi). Number of offices.
• The grant income has been properly disclosed in financial statements. Additionally, there is proper disclosure on grants in notes to the financial statements.
Development Action for Mobilization and Emancipation (DAMEN)
• DAMEN provided PMN with its audited accounts. The numbers reported in the PMR match these reports. Grant Thornton (Anjum Asim Shahid Rehman) audited the annual accounts for DAMEN for the year ending at 31st December 2014.
• As DAMEN is a multi-dimensional development organization accounts for its microfinance function are kept separate.
• There is no adjustment on cost of borrowing since DAMEN’s actual cost is higher than the adjusted cost. Sim-ilarly, no adjustment was made to loan loss provisioning expense; DAMEN is aggressive in its policies.
• DAMEN prepares its financial statements under the historical cost convention and in conformity with accept-ed accounting practices.
• The grant income has been properly disclosed in financial statements. Additionally, there is proper disclosure on grants in notes to the financial statements.
• The following numbers have been taken from the organization’s MIS: i). rural-urban clients; ii). male-female clients; iii). Aging on number of loans and value of portfolio (verifiable from audited accounts); iv). Breakup for the number of loans doubtful; v). Number of staff; vi). Number of credit officers
Kashf Foundation (KF)
• KF provided PMN with its audited accounts. The numbers reported in the PMR match these reports. KPMG (Taseer Hadi and Co) audited the annual accounts for KF for the year ending at 30th June 2014.
• The financial statements have been presented as per the requirements of the State Bank of Pakistan.• All necessary adjustments to KF data have been made in order to remove subsidies. Adjustments were not
made for loan loss provisioning expense, since KF is aggressive in its policies. Adjustment for cost of borrow-ing was not made since it was entirely commercial borrowing. KF prepares accounts on historical cost basis using the accrual system of accounting.
• The related party transactions have been properly disclosed in notes to the financial statements.• The grant income has been properly disclosed in financial statements and there is a proper disclosure on
grants in notes to the financial statements.• The following numbers have been taken from KF’s MIS: i). rural-urban clients; ii). male-female clients; iii).
Fina
ncia
l Ser
vice
s fo
r all
Annu
al A
sses
smen
t of t
he M
icrof
inan
ce In
dust
ry
146
Annexure C Sources of data (2014)
Number of staff; iv). Number of credit officers; and v). Number of branches (also available in audited accounts).
Ghazi Barotha Taraqiati Idara (GBTI)
• GBTI provided PMN with its audited accounts. The numbers reported in the PMR match these reports. • KPMG (Taseer Hadi and Co) audited the annual accounts for GBTI for the year ending at 30th June 2014.• GBTI prepares its financial statements under the historical cost convention and in conformity with accepted
accounting practices. Revenue is recognized on receipt basis.• The following numbers have been taken from the organization’s MIS: i). rural-urban clients; ii). male-female
clients; iii). Aging on number of loans and value of portfolio (not verifiable from audited accounts); iv). Number of staff; v). Number of credit officers; and vi). Number of offices.
• There is proper disclosure on the balance sheet of loan portfolio, and loan loss provision; expense charged during the year is disclosed on the income statement.
• The grant income has been properly disclosed in financial statements. Additionally, there is proper disclosure on grants in notes to the financial statements.
• The related party transactions should be presented in notes to the financial statements.
Jinnah Welfare Society (JWS)
• JWS provided PMN with its audited accounts. The numbers reported in the PMR match these reports. Tariq Abdul Ghani Maqbool & Co. audited the annual accounts for JWS for the year ending at 30th June 2014.
• JWS prepares its financial statements under the historical cost convention and in conformity with accepted accounting practices. Revenue is recognized on receipt basis.
• The following numbers have been taken from the organization’s MIS: i). rural-urban clients; ii). male-female clients; iii). Aging on number of loans and value of portfolio (verified from audited accounts); iv). Number of staff; v). Number of credit officers; and vi). Number of branches (also available in audited accounts).
• The related party transactions have been properly disclosed in notes to financial statements.
Micro Options (MO)
• MO provided PMN with its audited accounts. The numbers reported in the PMR match these reports. Baker Tilly Mehmood Idrees Qamar has audited the annual accounts of MO for the year ending at 31st December 2014.
• MO prepares its financial statements under the historical cost convention, in conformity with accepted ac-counting practices.
• All necessary adjustments to data have been made in order to remove subsidies. No adjustment was made to loan loss provisioning expense as the institute is aggressive in its policies.
• The related party transactions have been properly disclosed in notes to the financial statements.• The grant income has been properly disclosed in financial statements. Additionally, there is proper disclosure
on grants in notes to the financial statements.
Mojaz Foundation (Mojaz)
• Mojaz provided PMN with its audited accounts. The numbers reported in the PMR match these reports. Ibra-him, Shaikh & Co has audited the annual accounts of Mojaz for the year ending at 30th June 2014.
• Mojaz prepares its financial statements under the historical cost convention, in conformity with accepted accounting practices.
• All necessary adjustments to data have been made in order to remove subsidies. No adjustment was made to loan loss provisioning expense as the institute is aggressive in its policies.
• The related party transactions have been properly disclosed in notes to the financial statements.• The grant income has been properly disclosed in financial statements. Additionally, there is proper disclosure
on grants in notes to the financial statements.
Fina
ncia
l Ser
vice
s fo
r all
Paki
stan
Micr
ofin
ance
Rev
iew
201
4
147
Annexures
Naymet Trust (Naymet)
• Naymet provided PMN with its audited accounts. The numbers reported in the PMR match these reports. Izhar & Co has audited the annual accounts of Naymet for the year ending at 30th June 2014.
• Naymet prepares its financial statements under the historical cost convention, in conformity with accepted accounting practices.
• All necessary adjustments to data have been made in order to remove subsidies. No adjustment was made to loan loss provisioning expense as the institute is aggressive in its policies.
• The related party transactions have been properly disclosed in notes to the financial statements.• The grant income has been properly disclosed in financial statements. Additionally, there is proper disclosure
on grants in notes to the financial statements.
National Rural Development Program (NRDP)
• NRDP provided PMN with its audited accounts. The numbers reported in the PMR match these reports. Izhar & Co has audited the annual accounts of NRDP for the year ending at 30th June 2014.
• NRDP prepares its financial statements under the historical cost convention, in conformity with accepted accounting practices.
• All necessary adjustments to data have been made in order to remove subsidies. No adjustment was made to loan loss provisioning expense as the institute is aggressive in its policies.
• The related party transactions have been properly disclosed in notes to the financial statements.• The grant income has been properly disclosed in financial statements. Additionally, there is proper disclosure
on grants in notes to the financial statements.
Organization for Participatory Development (OPD)
• OPD provided PMN with its audited accounts. The numbers reported in the PMR match these reports. Izhar & Co has audited the annual accounts of OPD for the year ending at 30th June 2014.
• OPD prepares its financial statements under the historical cost convention, in conformity with accepted ac-counting practices.
• All necessary adjustments to data have been made in order to remove subsidies. No adjustment was made to loan loss provisioning expense as the institute is aggressive in its policies.
• The related party transactions have been properly disclosed in notes to the financial statements.• The grant income has been properly disclosed in financial statements. Additionally, there is proper disclosure
on grants in notes to the financial statements.
Orangi Charitable Trust (OCT)
• OCT provided PMN with its audited accounts. The numbers reported in the PMR match these reports. Tan-zeem & Co. has audited the annual accounts of OCT for the year ending at 30th June 2014.
• OCT prepares its financial statements under the historical cost convention, in conformity with accepted ac-counting practices.
• All necessary adjustments to data have been made in order to remove subsidies. No adjustment was made to loan loss provisioning expense as the institute is aggressive in its policies.
• The related party transactions have been properly disclosed in notes to the financial statements.• The grant income has been properly disclosed in financial statements. Additionally, there is proper disclosure
on grants in notes to the financial statements.
Orix Leasing Pakistan Ltd. (OLP)
• OLP has provided its audited accounts for the reporting period to PMN. • However, given that OLP’s audited accounts do not disclose figures related to its Microfinance Division (MFD),
the data reported in the PMR is not verifiable with audited accounts.• OLP has separate staff and offices for microfinance. OLP’s MFD has provided data specific to its microfinance
operations. • OLP prepares its financial statements under the historical cost convention in using accrual system of ac-
Fina
ncia
l Ser
vice
s fo
r all
Annu
al A
sses
smen
t of t
he M
icrof
inan
ce In
dust
ry
148
Annexure C Sources of data (2014)
counting. • Adjustments to the data have been made as per the PMN’s adjustment policies. These adjustments are in line
with international practices being followed by The MIX.
Rural Community Development Society (RCDS)
• RCDS provided PMN with its audited accounts. The numbers reported in the PMR match these reports. Ijaz Tabassum & Co. audited the annual accounts for RCDS for the year ending at 30th June 2014.
• RCDS prepares its financial statements under the historical cost convention and in conformity with accepted accounting practices. Revenue is recognized on receipt basis.
• The following numbers have been taken from the organization’s MIS: i). rural-urban clients; ii). male-female clients; iii). Aging on number of loans and value of portfolio (verified from audited accounts); iv). Number of staff; v). Number of credit officers; and vi). Number of branches (also available in audited accounts).
• The related party transactions have been properly disclosed in notes to financial statements.
SAFCO Support Fund (SAFCO)
• SAFCO provided PMN with its audited accounts. The numbers reported in the PMR match these reports. Grant Thornton (Anjum Asim Shahid Rehman) audited the annual accounts for SAFCO for the year ending at 30th June 2014.
• Income and expense are booked on an accrual basis.• All necessary adjustments to SAFCO data have been made in order to remove subsidies. • SAFCO prepares its financial statements under the historical cost convention and in conformity with accepted
accounting practices using the principles of fund accounting.• The following numbers have been taken from the organization’s MIS: i). rural-urban clients; ii). male-female
clients; iii). Aging on number of loans and value of portfolio (not verifiable from audited accounts); iv). Number of staff; and v). Number of credit officers.
• The grant income has been properly disclosed in financial statements. Additionally, there is proper disclosure on grants in notes to the financial statements.
Saath Development Society (SDS)
• SDS provided PMN with its audited accounts. The numbers reported in the PMR match these reports. Tanwir Arif & Co. has audited the annual accounts of OCT for the year ending at 30th June 2014.
• SDS prepares its financial statements under the historical cost convention, in conformity with accepted ac-counting practices.
• All necessary adjustments to data have been made in order to remove subsidies. No adjustment was made to loan loss provisioning expense as the institute is aggressive in its policies.
• The related party transactions have been properly disclosed in notes to the financial statements.• The grant income has been properly disclosed in financial statements. Additionally, there is proper disclosure
on grants in notes to the financial statements.
Shadab Rural Development Organization (SRDO)
• SRDO provided PMN with its audited accounts. The numbers reported in the PMR match these reports. Tanwir Arif & Co. has audited the annual accounts of SRDO for the year ending at 30th June 2014.
• SRDO prepares its financial statements under the historical cost convention, in conformity with accepted accounting practices.
• All necessary adjustments to data have been made in order to remove subsidies. No adjustment was made to loan loss provisioning expense as the institute is aggressive in its policies.
• The related party transactions have been properly disclosed in notes to the financial statements.• The grant income has been properly disclosed in financial statements. Additionally, there is proper disclosure
on grants in notes to the financial statements.
Fina
ncia
l Ser
vice
s fo
r all
Paki
stan
Micr
ofin
ance
Rev
iew
201
4
149
Annexures
Soon Valley Development Program (SVDP)
• SVDP provided PMN with its audited accounts. The numbers reported in the PMR match these reports. Zahid Jamil & Co. has audited the annual accounts of SVDP for the year ending at 30th June 2014.
• SVDP prepares its financial statements under the historical cost convention, in conformity with accepted accounting practices.
• All necessary adjustments to data have been made in order to remove subsidies. No adjustment was made to loan loss provisioning expense as the institute is aggressive in its policies.
• The related party transactions have been properly disclosed in notes to the financial statements.• The grant income has been properly disclosed in financial statements. Additionally, there is proper disclosure
on grants in notes to the financial statements.
Villagers Development Organization (VDO)
• VDO provided PMN with its audited accounts. The numbers reported in the PMR match these reports. Tanwir Arif & Co. has audited the annual accounts of VDO for the year ending at 30th June 2014.
• VDO prepares its financial statements under the historical cost convention, in conformity with accepted ac-counting practices.
• All necessary adjustments to data have been made in order to remove subsidies. No adjustment was made to loan loss provisioning expense as the institute is aggressive in its policies.
• The related party transactions have been properly disclosed in notes to the financial statements.• The grant income has been properly disclosed in financial statements. Additionally, there is proper disclosure
on grants in notes to the financial statements.
Wasil Foundation (Wasil)
• Wasil provided PMN with its audited accounts. The numbers reported in the PMR match these reports. Grant Thornton (Anjum Asim Shahid Rehman) has audited the annual accounts of VDO for the year ending at 30th June 2014.
• VDO prepares its financial statements under the historical cost convention, in conformity with accepted ac-counting practices.
• All necessary adjustments to data have been made in order to remove subsidies. No adjustment was made to loan loss provisioning expense as the institute is aggressive in its policies.
• The related party transactions have been properly disclosed in notes to the financial statements.• The grant income has been properly disclosed in financial statements. Additionally, there is proper disclosure
on grants in notes to the financial statements.
Rural Support Programme (RSP)
National Rural Support Programme (NRSP)
• NRSP has provided its audited accounts for the reporting period to PMN and the figures tally with the report-ed data. Ernst & Young Ford Rhodes Sidat Hyder and Co. audited the annual accounts for NRSP for the year ending at 30th June 2014.
• All necessary adjustments to NRSP data have been made in order to remove subsidies. Adjustment for cost of borrowing was not made since it was entirely commercial borrowing. Similarly, there is no adjustment on loan loss provisioning expense, since NRSP is aggressive in its policies and all loans > 90 days past due are 100% provisioned for.
• NRSP prepares its financial statements under the historical cost convention, in conformity with accepted accounting practices.
• Data on distribution of clients in terms of the urban-rural mix is not provided in the disclosures. However, given that NRSP has a separate program for urban areas and rural areas and their information is available separately, the disaggregation can be made quite accurately. The data on gender segregation was taken from the MIS and is not available in notes to the accounts.
• Data on the number of total staff, loan officers and branches has been drawn from audited accounts.
Fina
ncia
l Ser
vice
s fo
r all
Annu
al A
sses
smen
t of t
he M
icrof
inan
ce In
dust
ry
150
Annexure C Sources of data (2014)
• The related party transactions have been properly disclosed in notes to financial statements.• As per the CGAP requirements, portfolio quality, sustainability/profitability and asset/liability management
ratios are presented in the notes to financial statements.
Punjab Rural Support Programme (PRSP)
• PRSP has provided its audited accounts for the reporting period to PMN. Ernst & Young Ford Rhodes Sidat Hyder and Co. audited the annual accounts for PRSP for the year ending at 30th June 2014.
• Since PRSP is an integrated programme, the following resource allocation process was followed:1. The identified accounts for credit and non-credit functions were directly transferred to the respective
programs.2. All other accounts that were common to the institution were transferred in the ratio of 60% to credit and
40% to non-credit functions.3. 60% of PRSP’s investment income was credited to its credit operations
• All necessary adjustments to PRSP data have been made in order to remove subsidies. Adjustment for cost of borrowing was not made since it was entirely commercial borrowing. Similarly, there is no adjustment on loan loss provisioning expense, since PRSP is aggressive in its provisioning policies.
• PRSP prepares its financial statements under the historical cost convention, in conformity with accepted accounting practices.
• Data on distribution of clients in terms of the urban-rural mix is not provided in the disclosures. However, given that PRSP only works in rural Punjab the information can be accurately deduced. The data on gender segregation was taken from the MIS and is not available in notes to the accounts.
• Data on number of staff for PRSP as a whole is available. These numbers have been allocated between credit and non-credit functions of PRSP on the basis mentioned above. Data for credit officers has been obtained from the organization’s MIS.
• The grant income has been properly disclosed in financial statements and there is a proper disclosure on grants in notes to the financial statements.
• The related party transactions have been properly disclosed in notes to financial statements.
Sarhad Rural Support Programme (SRSP)
• SRSP has provided its audited accounts for the reporting period to PMN. KPMG (Taseer Hadi and Co) audited the annual accounts for SRSP for the year ending at 30th June 2014.
• SRSP is a multi-dimensional development organization. It has provided its integrated audited accounts for the reporting period to PMN and has also extracted accounts for its microfinance operations from the consol-idated audited statements.
• All necessary adjustments to SRSP data have been made in order to remove subsidies. There is no adjustment on loan loss provisioning expense, since SRSP is aggressive in its policies and all loans > 90 days past due are 100% provisioned for.
• SRSP prepares its financial statements under the historical cost convention in conformity with accepted ac-counting practices.
• The ageing of portfolio in rupee value is not verifiable from audited accounts. Both ageing on number of loans and value of portfolio was obtained from the MIS. However, there is proper disclosure on the movement in portfolio and write-offs. It will be valuable if SRSP could provide separate disclosure on movement in provi-sioning of portfolio as suggested previously.
• Data on the number of total staff, loan officers and branches has been drawn from audited accounts.
Thardeep Rural Development Programme (TRDP)
• TRDP has provided its audited accounts for the microfinance program (inclusive of credit and non-credit func-tions). Grant Thornton (Anjum Asim Shahid Rehman) audited the annual accounts for TRDP for the year end-ing at 30th June 2014.
• All necessary adjustments to TRDP data have been made in order to remove subsidies. • TRDP prepares its financial statements under the historical cost convention in conformity with accepted ac-
counting practices.• The following numbers have been taken from the organization’s MIS: i). rural-urban clients; ii). male-female

Fina
ncia
l Ser
vice
s fo
r all
Paki
stan
Micr
ofin
ance
Rev
iew
201
4
151
Annexures
clients; iii). Number of staff; and iv). Number of credit officers. • The ageing of portfolio (in rupee value and number of loans) is taken from audited accounts.
Sindh Rural Support Organization (SRSO)
• SRSO has provided its audited accounts for the microfinance program (inclusive of credit and non-credit func-tions). Ernst & Young Ford Rhodes Sidat Hyder and Co. audited the annual accounts for SRSO for the year ending at 30th June 2014.
• All necessary adjustments to PRSP data have been made in order to remove subsidies. There is no adjust-ment on loan loss provisioning expense, since PRSP is aggressive in its provisioning policies.
• SRSO prepares its financial statements under the historical cost convention in conformity with accepted ac-counting practices.
• The following numbers have been taken from the organization’s MIS: i). rural-urban clients; ii). male-female clients; iii). Number of staff; and iv). Number of credit officers.
• The ageing of portfolio (in rupee value and number of loans) is taken from audited accounts.
Fina
ncia
l Ser
vice
s fo
r all
Annu
al A
sses
smen
t of t
he M
icrof
inan
ce In
dust
ry
152
Annex D Adjustments to Financial Data
Rationale
Adjustments to financial statements are made when doing benchmark analysis. Adjustments are made for two primary reasons:
• To give an institution a more accurate picture of its financial position, by accounting for factors unique to an MFP including the predominance of below-market-rate funding sources. Such factors distort an MFP’s on-going performance.
• To make the data of various MFPs comparable. Thus, adjustments are made in order to bring organizations operating under varying conditions and with varying levels of subsidy onto a level playing field.
The following adjustments are made to data used for the PMR:
A. Inflation Adjustment
Inflation adjustment adjusts for the effect of inflation on an MFP’s equity and non-monetary assets i.e., fixed assets. Inflation decreases the real value of an MFP’s equity. Fixed assets are capable of tracking the increase in price levels; their monetary value is increased. The net loss (or gain) is considered to be a cost of funds, and results in a decrease (or increase) in net operating income.
Calculation of inflation adjustment
Inflation adjustment revenueNet Fixed Assets (Prior Year) X Average Annual Inflation Rate (Current Financial Year)
Inflation adjustment expenseEquity (Prior Year) X Average Annual Inflation Rate (Current Year)
Net inflation adjustment expenseInflation Adjusted Revenue – Inflation Adjusted Expense
B. Subsidies adjustment
Adjustments for three types of subsidies are made:• A cost-of-funds subsidy from loans at below-market rates
Annex D Adjustments to Financial Data

Fina
ncia
l Ser
vice
s fo
r all
Paki
stan
Micr
ofin
ance
Rev
iew
201
4
153
Annexures
• Current year cash donations to fund portfolio and cover expenses• In-kind subsidies, such as rent-free office space or the services of personnel not paid by the MFP and thus not
reflected on its income statement.
Additionally, for multipurpose MFPs, an attempt to isolate the performance of the financial services program is made by removing the effect of any cross-subsidization. Cash donations flowing through the income statement are accounted for by reclassifying them below net operating income on the income statement. Thus, adjustments for cash donations are not made since these are handled through a direct reclassification on the income state-ment. This year no MFP has disclosed receipt of in-kind subsidy.
B.1 Cost-of-funds subsidy
The cost-of-funds adjustment reflects the impact of soft loans on the financial performance of an MFP. The an-alyst needs to calculate the difference between what an MFP actually paid in interest on its subsidized liabilities and a shadow market rate for each country. This difference represents the value of the subsidy, considered an ad-ditional financial expense. Only funds received as loans need to be adjusted. Client deposits are not adjusted. Only loans that have a finite (1-5 years) term length are adjusted. Subordinated debt and other quasi-equity accounts are reclassified as ‘other equity’ on the balance sheet.
Care is taken in the choice of an appropriate shadow rate thus, PMN has used the KIBOR rate on outstanding loans as reported by the State Bank of Pakistan on its website (12.5%) to make this adjustment.
Calculation of cost-of-funds subsidy
1. Calculate average balance for all borrowings. Borrowings do not include deposits or “other liabilities”. If an MFI has given an average balance, see if this is more appropriate to use; if not, calculate average from last year’s ending balance.
2. Multiply the average balance by the shadow market rate3. Compare with the amount actually paid in interest and fees. If less “market” rate, impute the difference (mar-
ket price minus Financial Expense paid on Borrowings) to the Subsidized Cost of Funds Adjustment Expense
B.2 Cash donations
Funds donated to cover operational costs constitute a direct subsidy to an MFP. The value of the subsidy is there-fore, equal to the amount donated to cover expenses incurred in the period reported. Some donations are provided to cover operating shortfall over a period greater than one year. Only the amount spent in the year is recorded on the income statement as revenue. Any amount still to be used in subsequent years appears as a liability on the balance sheet (deferred revenue). This occurs because theoretically, if an MFP stopped operations in the middle of a multi-year operating grant, it would have to return the unused portion of the grant to the donor. The unused amount is therefore, considered as a liability.
Funds donated to pay for operations should be reported on the income statement separately from the revenue generated by lending and investment activities. This practice is meant for accurately reporting the earned revenue of an MFP. Donated funds are deducted from revenue or net income prior to any financial performance analysis because they do not represent revenue earned from operations.Note: Costs incurred to obtain donor funds (fundraising costs) should also be separated from operating expenses, because the benefit of receiving the funds is not included.
B.3 In-kind subsidy
Imputed cost (book value) of donated/loaned-out vehicles, machinery and buildings need to be included in operat-ing expenses. Expatriate staff salaries paid by donor or parent company, or other technical assistance, need to be accounted for. Here, imputed salaries are used instead of salaries actually received by them i.e., the salary range that a local hire would get for the same level of work-load/position is used.Note: The analyst must use his/her judgment in deciding whether or not the in-kind donation represents a key input to the on-going operations of the MFP. An appropriate basis for valuation is important. This could include

Fina
ncia
l Ser
vice
s fo
r all
Annu
al A
sses
smen
t of t
he M
icrof
inan
ce In
dust
ry
154
Annex D Adjustments to Financial Data
selecting a percentage of the total cost and attributing it to program expense. The percentage may be selected on the basis of sales proportion, management input, etc.
Calculation of in-kind subsidy
Sum of in-kind subsidies by operating expense account, added to unadjusted numbers for each account.
C. Loan loss provisioning
PMN standardizes loan loss provisioning for MFPs to a minimum threshold or risk. MFPs vary tremendously in ac-counting for loan delinquency. Some count the entire loan balance as overdue the day a payment is missed. Others do not consider a loan delinquent until its full term has expired. Some MFPs write off bad debt within one year of the initial delinquency, while others never write off bad loans, thus carrying forward a default that they have little chance of ever recovering.
The analyst applies a standard loan loss provisioning to all MFPs and adjusts, where necessary, to bring them to the minimum threshold. In some cases, these adjustments may not be precise. Portfolio aging information may only be available on different aging scales.
Calculation of loan loss provisioning
Step 1:Multiply the PAR age categories by the following reserve factors:PAR up to 89 days no provisioningPAR 91 – 180 x 0.50PAR 181 – 360 x 1.00Renegotiated loans x 0.50
Step 2:Sum above reserve calculations. If sum is more than current reserves make calculated reserve new Loan Loss Reserve. If not, keep current reserves.
Step 3:Add the Unadjusted Loan Loss Provision Expense to the difference between the Adjusted Net Loan Portfolio and the Unadjusted Net Loan Portfolio. This is the Adjusted Loan Loss Provision Expense.
Fina
ncia
l Ser
vice
s fo
r all
Paki
stan
Micr
ofin
ance
Rev
iew
201
4
155
Annexures
AgeNumber of years an organization has been functioning as a microfinance provider (MFP).
Active Saving Account BalanceIt is the average balance of savings per account (not per depositor).
Adjustment ExpenseTotal adjustment cost related to inflation, subsidized cost of borrowing, loan loss provisioning and in-kind subsi-dies.
Adjusted Financial Expense RatioIt is calculated by using standardized ageing-of-portfolio technique. The principle of conservatism is used which is why loan loss provision in audited accounts is greater than the amount computed by the analyst.
Adjusted Loan Loss ReserveFormula:Adjusted Financial ExpenseAdjusted Average Total Assets
Adjusted Operating ExpenseAlso included in operating expense:• Imputed cost (book value) of donated/loaned vehicles, machinery and buildings• Expatriate staff salaries paid by donor or parent company• Other technical assistance paid for with donations
NOTE: Imputed salaries should be used instead of salaries actually received by such persons, thus salary range that a local hire would get for the same level of work-load/position should be used. Judgment is used to decide whether or not the in-kind donation represents a key input to the on-going operations of the MFPFormula:Personnel Expense + Administrative Expense
Adjusted Operating Expense RatioFormula:Adjusted Operating ExpenseAdjusted Average Total Assets
Annex E - Terms and Definitions

Fina
ncia
l Ser
vice
s fo
r all
Annu
al A
sses
smen
t of t
he M
icrof
inan
ce In
dust
ry
156
Annex E - Terms and Definitions
Adjusted Portfolio at Risk > (30, 60, 90 Days)Indicates the credit risk of a borrower above the specified number of days (30, 60, 90) past his/her due date for installment payment.Formula:Outstanding balance less loans overdue > (30 or 60 or 90) DaysAdjusted Gross Loan Portfolio
Adjusted Cost per BorrowerIn accounts for loan size differentials, generally operating expense ratio is lower (more efficient) for institutions with higher loan sizes, ceteris paribus. This indicator discounts the effect of loan size on efficient management of loan portfolio.Formula:Adjusted Operating ExpenseAverage Number of Active Borrowers
Adjusted Cost per LoanFormula:Adjusted Operating ExpenseAverage Number of Active Loans
Adjusted Financial ExpenseIt includes actual cost of borrowing and shadow cost of subsidized funding.
Adjusted Financial Expense on BorrowingThe cost-of-funds adjustment reflects the impact of soft loans on the financial performance of the institution. The analyst calculates the difference between what the MFP actually paid in interest on its subsidized liabilities and what it would have paid at a shadow market rate for each country. This difference represents the value of the subsidy, considered an additional financial expense.
Adjusted Loan Loss Provision Expense RatioFormula:Adjusted Net Loan Loss Provision ExpenseAdjusted Average Total Assets
Adjusted Loan Loss Provision ExpenseLoan loss provision expense calculated with standardized ageing-of-portfolio technique. It is however ensured that if the actual loan loss provision expense is higher than the adjusted then the conservatism principle is fol-lowed.
Adjusted Operating ExpenseIt includes actual operational expenses and in-kind subsidy adjustments.
Adjusted Operating Expense RatioIt indicates efficiency of an MFP’s loan portfolio.Formula:Adjusted Operating ExpenseAverage Gross Loan Portfolio
Adjusted Personnel ExpenseIncludes actual personnel expenses (salaries and benefits), and in-kind subsidy adjustments.
Adjusted Personnel Expense RatioFormula:Adjusted Personnel ExpenseAverage Gross Loan Portfolio
Fina
ncia
l Ser
vice
s fo
r all
Paki
stan
Micr
ofin
ance
Rev
iew
201
4
157
Annexures
Adjusted Profit MarginFormula:Adjusted Net Operating IncomeAdjusted Financial Revenue
Adjusted Return on AssetsFormula:Adjusted Net Operating Income, net of taxesAverage Total Assets
Adjusted Return on EquityFormula:Adjusted Net Operating Income, net of taxesAverage Total Equity
Adjusted Total ExpenseIncludes all actual and adjusted expenses related to operations, cost of borrowings, loan losses and inflation ad-justment.
Adjusted Total Expense RatioFormula:Adjusted (Financial Expense + Net Loan Loss Provision Expense + Operating Expense) Cost Average Total Assets
Average Gross Loan PortfolioAverage of opening and closing balance of Gross Loan Portfolio (GLP).
Average Loan Balance per Active BorrowerIndicates average loan balance outstanding.
Average Loan Balance per Active Borrower to Per Capita IncomeUsed to measure depth of outreach. The lower the ratio the more poverty-focused the MFP.
Average Number of Active BorrowersIt is average of opening and closing balance of active borrowers.Formula:[Active Borrowers (Opening Balance) + Active Borrowers (Closing Balance)]2
Average Number of Active LoansAverage of opening and closing balance of active loans
Average Outstanding BalanceIt indicates the average balance of loans outstanding.Formula:Adjusted Gross Loan PortfolioAdjusted Number of Loans Outstanding
Average Outstanding Balance to Per Capita IncomeIt measure of depth of outreach. The lower the ratio the more poverty-focused the MFP.Formula:Average Outstanding BalancePer Capita Income
Fina
ncia
l Ser
vice
s fo
r all
Annu
al A
sses
smen
t of t
he M
icrof
inan
ce In
dust
ry
158
Annex E - Terms and Definitions
Average Saving Balance per SaverIt indicates average amount of saving balance per saver.
Average Total AssetsIt is average of opening and closing balance of total assets.
Average Total EquityIt is average of opening and closing balance of total equity.
Borrowers per Loan OfficerIt measure of loan officer productivity. It indicates the number of borrowers managed by a loan officer.Formula:Number of Active BorrowersNumber of Loan Officers
Borrowers per StaffIt measure of staff productivity. It indicates the number of borrowers managed by the staff on average.Formula:Number of Active BorrowersNumber of Total Personnel
Commercial LiabilitiesIt is principal balance of all borrowings, including overdraft accounts, for which the organization pays a nominal rate of interest that may be greater than or equal to the local commercial interest rate.
Commercial Liabilities-to-Gross Loan Portfolio RatioIt indicates efficiency of an MFP’s loan portfolio.Formula:All liabilities with “market” priceGross Loan Portfolio
Deposits Demand deposits from the general public and members (clients) held with the institution. These deposits are not conditional to accessing a current or future loan from the MFP and include certificates of deposit or other fixed term deposits.
Deposit-to-Gross Loan Portfolio RatioIt is inverse of the advance-to-deposit ratio.Formula:DepositsGross Loan Portfolio
Deposit-to-Total Asset RatioIndicates the percentage of assets financed through deposits.Formula:DepositsTotal Assets
Equity-to-Asset RatioThis is a simple version of the capital adequacy ratio as it does not take in to account risk weighted assets. This ratio indicates the proportion of a company’s equity that is accounted for by assets.Formula:Total EquityTotal Assets
Fina
ncia
l Ser
vice
s fo
r all
Paki
stan
Micr
ofin
ance
Rev
iew
201
4
159
Annexures
Financial ExpenseThis is total of financial expense on liabilities and deposits.
Financial RevenueThis is the total revenue from loan portfolio and other financial assets, as well as other financial revenue from financial services.
Financial Revenue from Other Financial AssetsThis is net gains on other financial assets.
Financial Revenue from Loan PortfolioThis is total interest, fees and commission on loan portfolio.
Financial Revenue RatioIndicates the efficiency with which an MFP is utilizing its assets to earn income from them.Formula:Financial RevenueAverage Total Assets
Financial Self-SufficiencyFormula:Financial RevenueAdjusted (Financial Expense + Net Loan Loss Provision Expense + Operating Expense + Inflation Adjustment)
Gross Loan PortfolioIt is the outstanding principal for all outstanding client loans, including current, delinquent and restructured loans. It does not include:• Loans that have been written-off• Interest receivable• Employee loansFor accounting purposes GLP is categorized as an asset.
Gross Loan Portfolio-to-Total Asset RatioIndicates the efficiency of assets deployed in high yield instruments and core business of an MFP.Formula:Gross Loan PortfolioTotal Assets
Inflation Adjustment Expense Inflation decreases the real value of an MFP’s equity. Fixed assets are considered to track the increase in price levels, and their value is considered increased. The net loss (or gain) is treated as a cost of funds, is disclosed on the income statement, and decreases net operating income.
Inflation RateLatest annualized consumer price index (CPI) as reported by the State Bank of Pakistan.
Liabilities-to-Equity Ratio (debt-equity ratio)
Formula:Total LiabilitiesTotal Equity
Fina
ncia
l Ser
vice
s fo
r all
Annu
al A
sses
smen
t of t
he M
icrof
inan
ce In
dust
ry
160
Annex E - Terms and Definitions
Loan Loss Provision ExpenseIt is the sum of loan loss provision expense and recovery on loan loss provision.
Loans per Loan OfficerFormula:Number of Active LoansNumber of Loan Officers
Loans per StaffFormula:Number of Active LoansNumber of Personnel
Net Adjusted Loan Loss Provision Expense It is the sum of loan loss provision expense and recovery on loan loss provision. MFPs vary tremendously in ac-counting for loan delinquency. Some count the entire loan balance as overdue the day a payment is missed. Others do not consider a loan delinquent until its full term has expired. Some MFPs write off bad debt within one year of the initial delinquency, while others never write off bad loans, thus carrying forward a defaulting loan that they have little chance of ever recovering.
Number of Active BorrowersNumber of borrowers with loan amount outstanding.
Number of Active LoansThe number of loans that have been neither fully repaid nor written off, and thus that are part of the MFP’s gross loan portfolio.
Number of Active Women BorrowersNumber of women borrowers with loan amount outstanding.
Number of Active Women Borrowers to total Active BorrowersIt indicates percentage of women borrower to total active borrowers.
Number of Loans OutstandingIt is the number of loans outstanding at the end of the reporting period. Depending upon the policy of an MFP one borrower can have two loans outstanding; hence, the number of loans could be more than the number of borrow-ers.
Number of SaversIt is the number of depositors maintaining voluntary demand deposit and time deposit accounts with an MFP.
Number of Saving AccountsOne depositor can have more than two deposit accounts. Hence, the number of deposit accounts could be more than the number of depositors.
Number of Women SaversIt is the number of women savers with voluntary demand deposit and time deposit accounts.
OfficesThe total number of staffed points of service (POS) and administrative sites (including head office) used to deliver or support the delivery of financial services to microfinance clients.
Operating ExpenseIt is total of Personnel Expense and Administrative Expense.

Fina
ncia
l Ser
vice
s fo
r all
Paki
stan
Micr
ofin
ance
Rev
iew
201
4
161
Annexures
Operational Self-SufficiencyFormula:Financial Revenue(Financial Expense + Net Loan Loss Provision Expense + Operating Expense)
Per Capita IncomeIt is average income per person.
Percentage of Women Savers to Total SaversIt indicates the percentage of women in the total saving portfolio.
PersonnelIt is the number of individuals actively employed by an MFP. This number includes contract employees and advi-sors who dedicate the majority of their time to the organization, even if they are not on the MFP’s roster of em-ployees. This number is expressed as a full-time equivalent, such that an advisor who spends 2/3 of his/her time with the MFP is accounted for as 2/3 of a full-time employee.
Personnel Allocation RatioThe higher the indicator the more lean the head office structure of the organization. This indictor is used to mea-sure organizational efficiency.Formula:Loan OfficersTotal Staff
Risk Coverage RatioIndicates the provision created by an MFP against its credit risk.Formula:Adjusted Loan Loss ReservePAR > 30 Days
Saving OutstandingTotal value of demand deposit and time deposit accounts.
Savers per StaffFormula:Number of SaversNumber of Personnel
Loan Loss Provision ExpenseIt is the sum of loan loss provision expense and recovery on loan loss provision.
Loans per Loan OfficerFormula:Adjusted Loan Loss ReservePAR > 30 Days
Total AssetsTotal net asset accounts i.e., all asset accounts net of any allowance. The one exception to this is the separate disclosure of the gross loan portfolio and loan loss reserve.
Total EquityEquity represents the worth of an organization net of what it owes (liabilities). Equity accounts are presented net of distributions, such as dividends.Formula:Total Assets – Total Liabilities
Fina
ncia
l Ser
vice
s fo
r all
Annu
al A
sses
smen
t of t
he M
icrof
inan
ce In
dust
ry
162
Annex E - Terms and Definitions
Total LiabilitiesLiabilities represent the borrowings of an organization i.e., the amount owed. Examples of liabilities include loans, and deposits. This number includes both interest and non-interest bearing liabilities of an MFP.
Total Number of Loan OfficersThe number of staff members who dedicate the majority of their time to direct client contact. Front office staff include more than those typically qualified as credit or loan officers. They may also include tellers, personnel who open and maintain accounts—such as savings accounts—for clients, delinquent loan recovery officers, and others whose primary responsibilities bring them in direct contact with microfinance clients.
Loan Written Off during YearIt is the value of loans written off during the year.
Write-Off RateFormula:Loans written off during the yearAverage Gross Loan Portfolio
Yield on Gross Portfolio (Nominal)Indicates the yield on an MFPs loan portfolio and is usually used as a proxy to look at MFPs (realized) effective interest rate.Formula:Financial Revenue from Loan PortfolioAverage Gross Loan Portfolio
Yield on Gross Portfolio (Real)It is the number of depositors maintaining voluntary demand deposit and time deposit accounts with an MFP.Formula:(Yield on Gross Portfolio (nominal) - Inflation Rate)(1 + Inflation Rate)


F I N A N C I A L S E R V I C E S F O R A L L
Pakistan Microfinance Network
Third Floor, Plot No. 12-3/2, Mandir Square, G-8/1 Markaz, IslamabadTel: +92 51 2266214-17, Fax: +92 51 2266218
www.pmn.org.pk