page the stern stewart institute periodical #11 · pdf file2003 2004 2005 2006 2007 2008 2009...
TRANSCRIPT

P A G E
8
T H E S T E R N S T E W A R T I N S T I T U T E P E R I O D I C A L # 1 1
P R O F . D R . S T E V E H . H A N K E : W E L C O M E T O T H E W O R L D O F V O L A T I L I T Y
T H E A U T H O R
Prof. Dr. Steve H. Hanke Board MemberThe Stern Stewart InstituteEconomistThe Johns Hopkins University
P A G E
9
In the past month, markets have become very volatile. Equity and oil markets are the most notable. Why? Well, regime uncertainty continues to be ramped up. Indeed, Berlin-bashing by Paris and Rome over fiscal austerity has become the latest political rage. On top of that, weak eco-nomic data from the Continent and a spat of surprisingly
weak US data moved the world’s stock markets. If that wasn’t enough, there were some so-called mixed economic signals emitted from China. We must not forget the International Monetary Fund’s (IMF) World Economic Outlook report that was unveiled at the World Bank – IMF meetings in Washington, D.C. The report contained a
Welcome to the Worldof Volatility
35
30
25
20
15
10
5
0
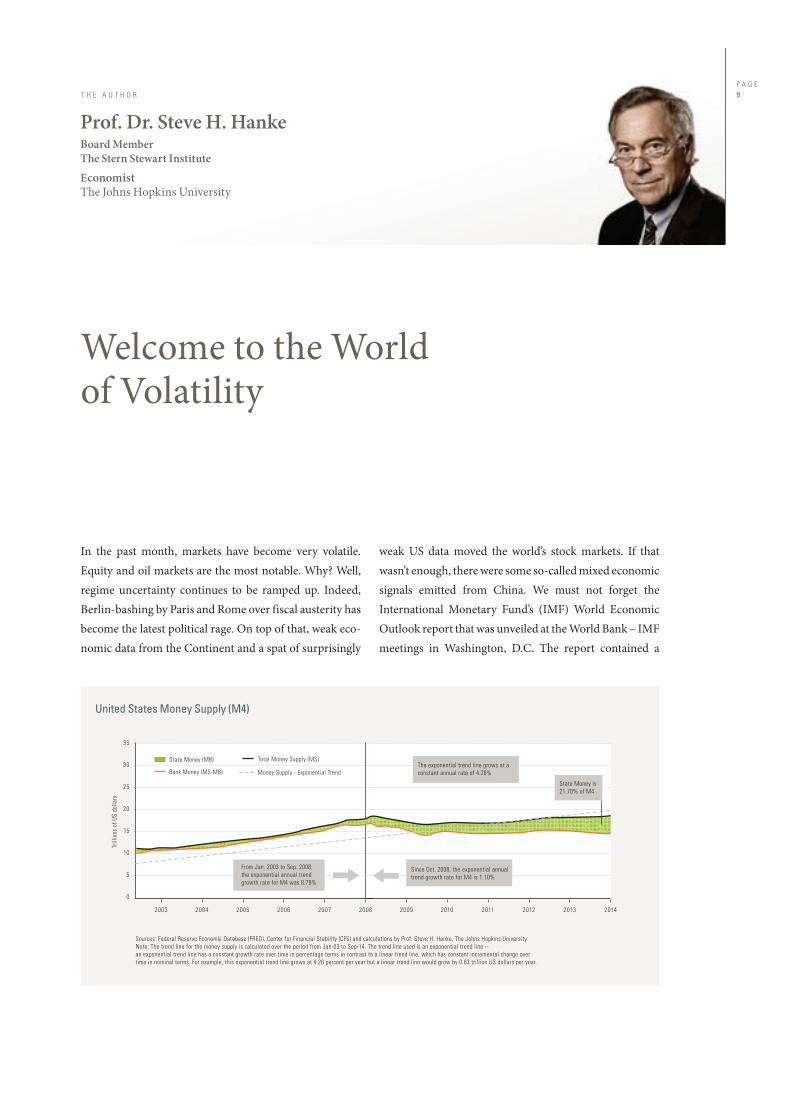
United States Money Supply (M4)
Sources: Federal Reserve Economic Database (FRED), Center for Financial Stability (CFS) and calculations by Prof. Steve H. Hanke, The Johns Hopkins University.
Note: The trend line for the money supply is calculated over the period from Jan-03 to Sep-14. The trend line used is an exponential trend line --
an exponential trend line has a constant growth rate over time in percentage terms in contrast to a linear trend line, which has constant incremental change over
time in nominal terms. For example, this exponential trend line grows at 4.26 percent per year but a linear trend line would grow by 0.63 trillion US dollars per year.
2003 2004 2005 2006 2007 2008 2009 2010 2011 2012 2013 2014
Tril
lion
s of
US
dol
lars
State Money (MB)
Bank Money (MS-MB)
Total Money Supply (MS)
Money Supply - Exponential Trend
Since Oct. 2008, the exponential annual
trend growth rate for M4 is 1.10%
The exponential trend line grows at a
constant annual rate of 4.26%
State Money is
21.70% of M4
From Jan. 2003 to Sep. 2008,
the exponential annual trend
growth rate for M4 was 8.79%
major policy flip-flop, switching mantras from fiscal austerity to fiscal stimulus. The volatility mixer was stirred further when the Saudis clarified that they would not cut back on oil production to prop up crude prices. The Kingdom wants to retain, or increase, its market share. To top it off, Ebola has reared its ugly head. All of this con-firms what I call the School Boy’s Theory of History: it’s just one damn thing after another.Let’s examine some of these factors to see just how they contribute to the world of volatility. The relatively weak US economic data are no surprise. The best proxy for nominal aggregate demand is measured by final sales to domestic purchasers (FSDP). Nominal FSDP has never recovered its long-run trend of 5 percent since the crisis of 2009.
Indeed, aggregate demand is growing at an anemic year-over-year rate of only 3.9 percent.Anyone who is properly informed about the economics of money and banking knows why nominal aggregate demand has not bounced back to a trend rate of growth. The money supply, correctly measured by Prof. William A. Barnett’s Divisia M4, is only growing at a year-over-year rate of 2.0 percent. Money fuels the economy and without fuel, the economy eventually stalls. In the US, bank regulations since the collapse of Lehman Brothers have been ill-conceived, draconian, and pro- cyclical. In consequence, bank money has shrunk in both relative and absolute terms since 2009 (see the accompany-ing chart). This has forced the Federal Reserve to engage in
P A G E
1 0
T H E S T E R N S T E W A R T I N S T I T U T E P E R I O D I C A L # 1 1
P R O F . D R . S T E V E H . H A N K E : W E L C O M E T O T H E W O R L D O F V O L A T I L I T Y
a massive quantitative easing program. As the chart shows, the state money produced by the central bank has exploded, growing from less than 10 percent of M4 to 21.7 percent. However, since bank money is the elephant in the room, the growth in total broad money has been slow. Therefore, it is predictable that there will be weak nominal growth and a very low inflation rate in the US.
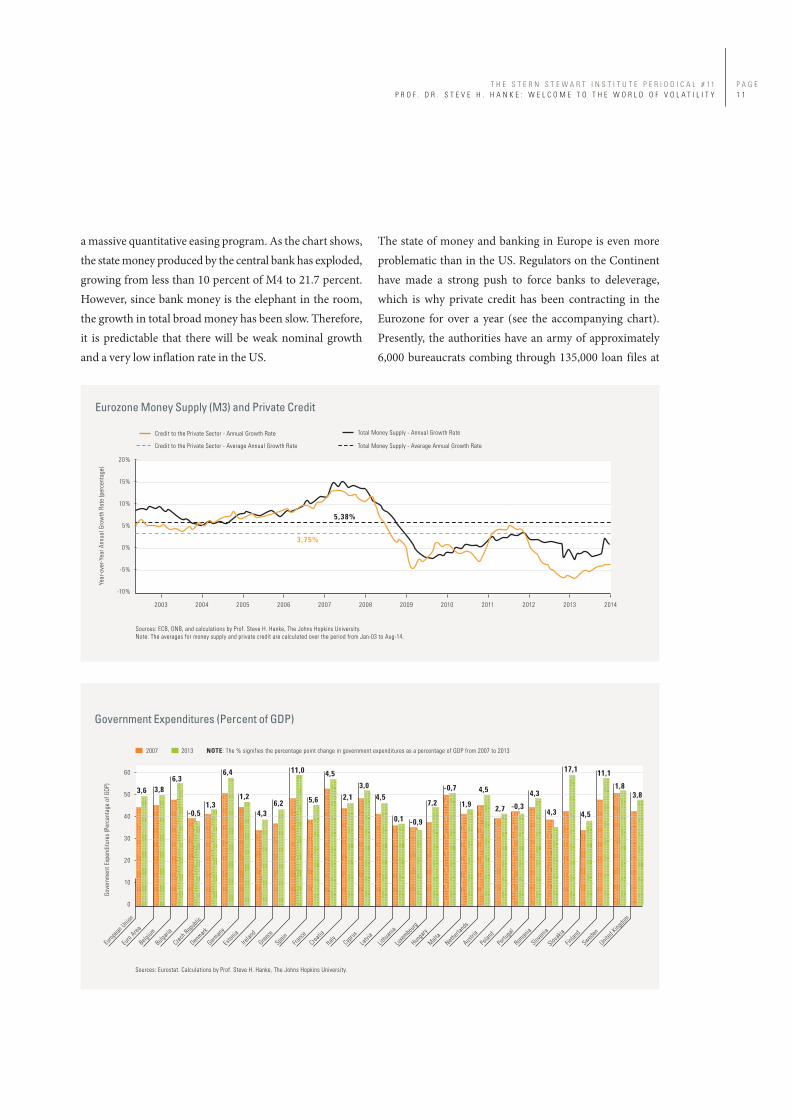
The state of money and banking in Europe is even more problematic than in the US. Regulators on the Continent have made a strong push to force banks to deleverage, which is why private credit has been contracting in the Eurozone for over a year (see the accompanying chart). Presently, the authorities have an army of approximately 6,000 bureaucrats combing through 135,000 loan files at
P A G E
1 1
T H E S T E R N S T E W A R T I N S T I T U T E P E R I O D I C A L # 1 1
P R O F . D R . S T E V E H . H A N K E : W E L C O M E T O T H E W O R L D O F V O L A T I L I T Y
20%
15%
10%
5%
0%
-5%
-10%
Eurozone Money Supply (M3) and Private Credit
Sources: ECB, ONB, and calculations by Prof. Steve H. Hanke, The Johns Hopkins University.
Note: The averages for money supply and private credit are calculated over the period from Jan-03 to Aug-14.
2003 2004 2005 2006 2007 2008 2009 2010 2011 2012 2013 2014
Year
-ove
r-Ye
ar A
nnua
l G
row
th R
ate
(per
cent
age)
Total Money Supply - Annual Growth Rate
Total Money Supply - Average Annual Growth Rate
Credit to the Private Sector - Annual Growth Rate
Credit to the Private Sector - Average Annual Growth Rate
5 ,38%
3,75%
60
50
40
30
20
10
0
Government Expenditures (Percent of GDP)
Sources: Eurostat. Calculations by Prof. Steve H. Hanke, The Johns Hopkins University.
Gov
ernm
ent
Expe
ndit
ures
(Pe
rcan
tage
of
GD
P)
3,6 3,86,3
1,3-0,5
European U
nion
Euro A
rea
Belgiu
m
Bulgaria
Czech
Republic
Denmark
Germany
Estonia
Irela
nd
Greece
SpainFr
ance
Croatia
Italy
Cypru
s
Latv
ia
Lithuania
Luxe
mbourg
Hungary
Malta
Netherla
nds
Austria
Poland
Portugal
Romania
Slove
nia
Slova
kia
Finla
nd
Sweden
United K
ingdom
6,4
1,2
4,36,2
11,0
5,6
4,5
2,13,0
4,5
0,1 -0,9
7,2 1,9
4,5
2,7 -0,3
4,3
4,3
17,1
4,5
11,1
3,81,8-0,7
20132007 NOTE: The % signifies the percentage point change in government expenditures as a percentage of GDP from 2007 to 2013
130 of Europe’s largest banks. This is all part of Europe’s stress test exercise. The main goal is to make Europe “safe” from bankers and banks. Bankers who have been covering up bad loans will be discovered and taken to the wood-shed; zombie banks will be liquidated or recapitalized. If that is not enough, the Single Supervisory Mechanism, a pan-European bank regulator, will be unveiled, on
November 4. This will usher in stress tests as far as the eye can see (Read: tight bank money). There has been a great deal of non sense coming from the Continent, too. French President Hollande and Italian Prime Minister Renzi, as well as their followers, have been shouting from the rooftops that Europe has had enough fiscal austerity. They claim that austerity is killing eco-nomic growth. Most of their rhetoric is aimed at Germany, a country in which fiscal austerity is a hallmark. Well, the anti-austerity rhetoric does not match reality. The accompanying chart shows that government expendi-tures in all but five of the countries in the European Union have seen their government expenditures as a percent of
P A G E
1 2
T H E S T E R N S T E W A R T I N S T I T U T E P E R I O D I C A L # 1 1
P R O F . D R . S T E V E H . H A N K E : W E L C O M E T O T H E W O R L D O F V O L A T I L I T Y
the GDP rise since 2007. It is interesting that all of the countries that witnessed real fiscal austerity were former communist states. And two of them (Bulgaria and Lithuania) were countries in which I installed currency boards to discipline monetary and fiscal operations. So, where is all the austerity that Messrs. Hollande, Renzi, and company are screaming about?
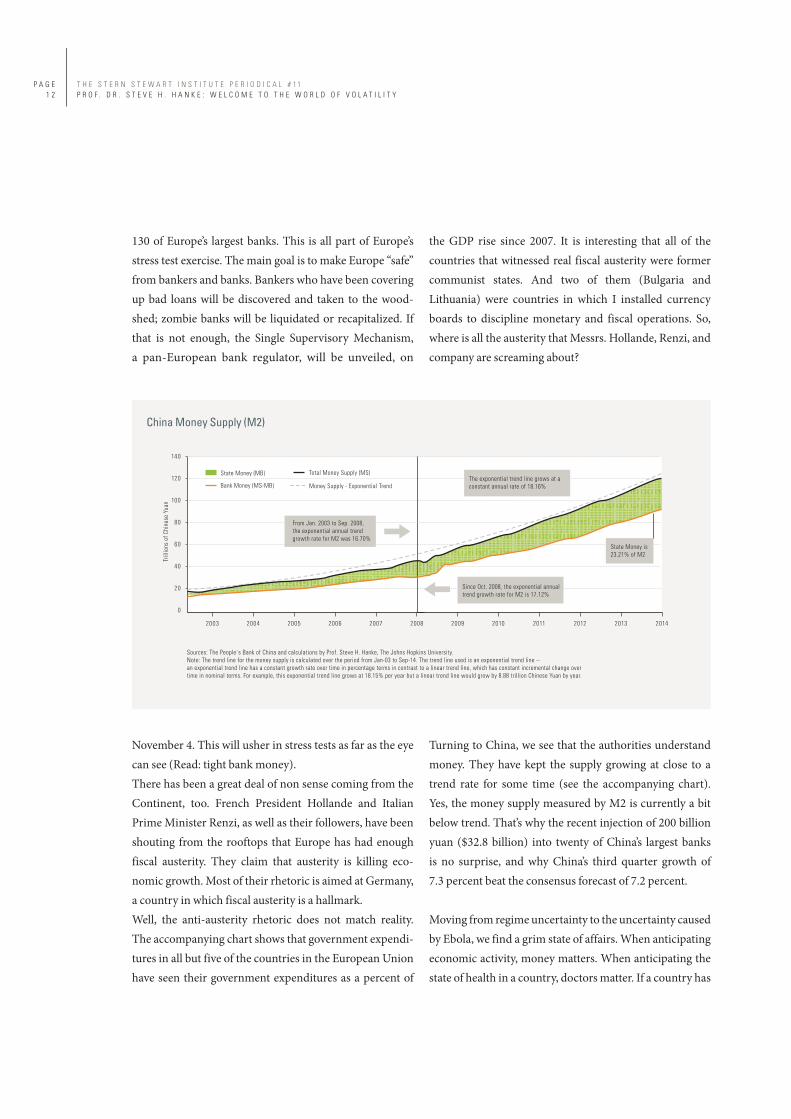
Turning to China, we see that the authorities understand money. They have kept the supply growing at close to a trend rate for some time (see the accompanying chart). Yes, the money supply measured by M2 is currently a bit below trend. That’s why the recent injection of 200 billion yuan ($32.8 billion) into twenty of China’s largest banks is no surprise, and why China’s third quarter growth of 7.3 percent beat the consensus forecast of 7.2 percent. Moving from regime uncertainty to the uncertainty caused by Ebola, we find a grim state of affairs. When anticipating economic activity, money matters. When anticipating the state of health in a country, doctors matter. If a country has
140
120
100
80
60
40
20
0
China Money Supply (M2)
Sources: The People`s Bank of China and calculations by Prof. Steve H. Hanke, The Johns Hopkins University.
Note: The trend line for the money supply is calculated over the period from Jan-03 to Sep-14. The trend line used is an exponential trend line --
an exponential trend line has a constant growth rate over time in percentage terms in contrast to a linear trend line, which has constant incremental change over
time in nominal terms. For example, this exponential trend line grows at 18.15% per year but a linear trend line would grow by 8.88 trillion Chinese Yuan by year.
2003 2004 2005 2006 2007 2008 2009 2010 2011 2012 2013 2014
Tril
lion
s of
Chi
nese
Yua
n
State Money (MB)
Bank Money (MS-MB)
Total Money Supply (MS)
Money Supply - Exponential Trend
Since Oct. 2008, the exponential annual
trend growth rate for M2 is 17.12%
The exponential trend line grows at a
constant annual rate of 18.16%
State Money is
23.21% of M2
From Jan. 2003 to Sep. 2008,
the exponential annual trend
growth rate for M2 was 16.70%
P A G E
1 3
T H E S T E R N S T E W A R T I N S T I T U T E P E R I O D I C A L # 1 1
P R O F . D R . S T E V E H . H A N K E : W E L C O M E T O T H E W O R L D O F V O L A T I L I T Y
250.00
200.00
150.00
100.00
50.00
0.00
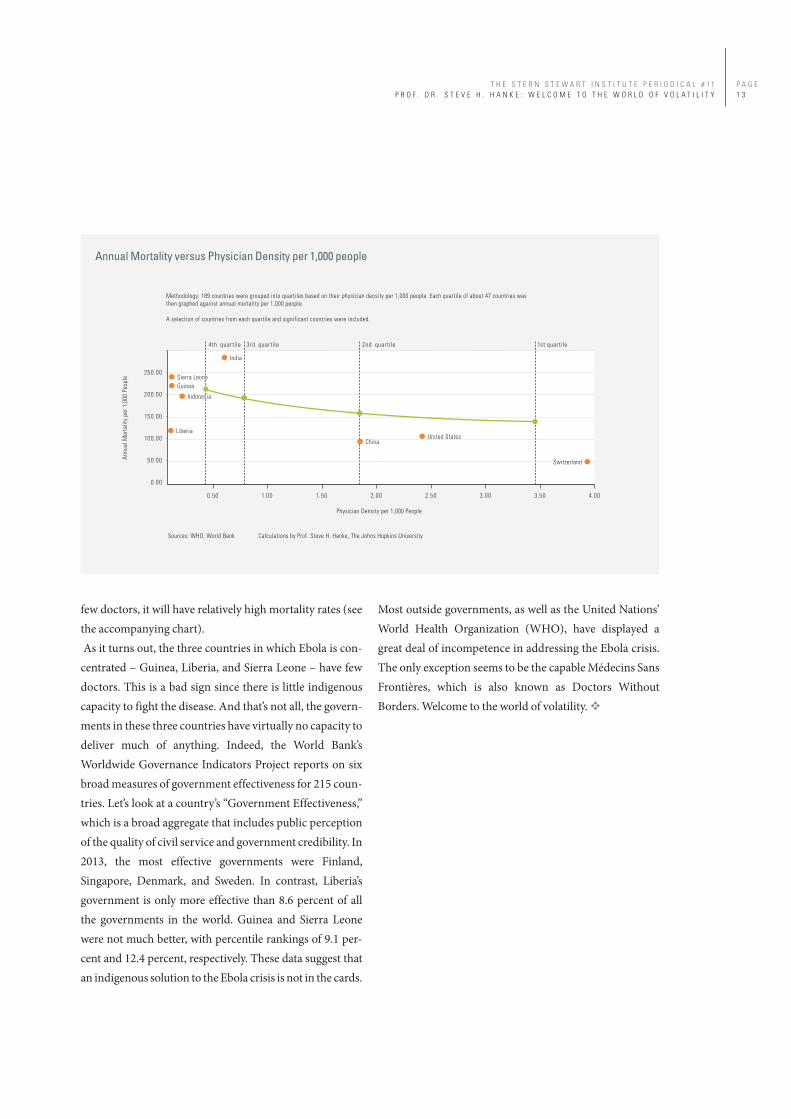
Annual Mortality versus Physician Density per 1,000 people
Sources: WHO, World Bank Calculations by Prof. Steve H. Hanke, The Johns Hopkins University
0.50 1.00 1.50 2.00 2.50 3.00 3.50 4.00
Ann
ual
Mor
tali
ty p
er 1
,000
Peo
ple
Physician Density per 1,000 People
United States
Switzerland
China
Liberia
Indonesia
Guinea
Sierra Leone
India
Methodology: 189 countries were grouped into quartiles based on their physician density per 1,000 people. Each quartile of about 47 countries was
then graphed against annual mortality per 1,000 people.
A selection of countries from each quartile and significant countries were included.
1st quartile2nd quartile3rd quartile4th quartile
few doctors, it will have relatively high mortality rates (see the accompanying chart). As it turns out, the three countries in which Ebola is con-centrated – Guinea, Liberia, and Sierra Leone – have few doctors. This is a bad sign since there is little indigenous capacity to fight the disease. And that’s not all, the govern-ments in these three countries have virtually no capacity to deliver much of anything. Indeed, the World Bank’s Worldwide Governance Indicators Project reports on six broad measures of government effectiveness for 215 coun-tries. Let’s look at a country’s “Government Effectiveness,” which is a broad aggregate that includes public perception of the quality of civil service and government credibility. In 2013, the most effective governments were Finland, Singapore, Denmark, and Sweden. In contrast, Liberia’s government is only more effective than 8.6 percent of all the governments in the world. Guinea and Sierra Leone were not much better, with percentile rankings of 9.1 per-cent and 12.4 percent, respectively. These data suggest that an indigenous solution to the Ebola crisis is not in the cards.
Most outside governments, as well as the United Nations’ World Health Organization (WHO), have displayed a great deal of incompetence in addressing the Ebola crisis. The only exception seems to be the capable Médecins Sans Frontières, which is also known as Doctors Without Borders. Welcome to the world of volatility.