page of analysing learners literacy and numeracy … · willfred greyling centre for foundation...
TRANSCRIPT
Page 1 of 22
Analysing learners’ literacy and numeracy progress at Waikato Institute of Technology (Wintec) for the period 2012-2014 Willfred Greyling Centre for Foundation Studies Waikato Institute of Technology (Wintec) Hamilton e-mail: [email protected] August 2015
SUMMARY OF RESULTS
1. INTRODUCTION 1.1 This report outlines the main findings of a research project which, initiated at Waikato Institute of
Technology (Wintec), was subsequently supported by Tertiary Education Commission (TEC) funding1.
1.2 The full report comprises four sub-reports, illustrating Literacy and Numeracy Assessment Tool
(LNAT) functionality which, in our view, would be useful to stakeholders who are required to track learners’ LN performance on reading and numeracy assessments.
1.3 We initiated the project because, increasingly, as the methodology of LNAT use evolved and the
sequence concept became relevant (TEC, 2015b; TEC, 2012), we were required to match data from separate sources: the institute’s Student Data Returns (SDR) for successive years and data-extraction files from the LNAT website.2
1.4 Our initial response to these challenges was to develop tracking capability based on Tableau
Software which allows worksheets from multiple sources to be joined and matched (Tableau, 2015).
1.5 Our tracking processes became challenging for several reasons:
1.5.1 the sequence concept (TEC, 2012),3 very clearly outlined in the TEC tool use manual (TEC, 2015a), proved difficult to apply, especially when enrolment data from other organisations were not available in either the institute’s SDR data or LNAT data-extraction files;
1.5.2 the LNAT assessment naming conventions for learner assessment scores achieved at other
organisations were non-distinguishing with these scores labelled as “Reading assessment” and “Numeracy assessment”;
1.5.3 scale scores (and steps) appeared in the same column in the data-extraction file; and
1.5.4 the time required to process and disseminate tracking data within the institute had become too long4.
Page 2 of 22
2. MAIN AIM AND OBJECTIVES 2.1 This report has a two-fold aim, namely, to
2.1.1 report on the data-processing challenges we encountered in developing capability to track learners’ LN performance for programmes across the institute, with specific emphasis on ethnicity, gender, English as a first language, threshold exemptions, learner progress and module completions.
2.1.2 show how changes in functionality and data-extraction layout could enable tertiary providers
to access LNAT data more readily in their quest to improve their ability to track LN performance at the institutional level.
2.2 Our objectives were to
2.2.1 illustrate how the functionality within the LNAT limited our ability to track LN performance.
2.2.2 describe data-coding and data-restructuring requirements which would enable institutions to engage LN performance data more easily than was currently the case; specifically we analysed the variables listed in 2.1.1. directly above.
2.2.3 explore a series of research questions, related to imperatives in the Tertiary Education Strategy (2014-2019), showing the challenges posed by the layout of the data-extraction file, as well as the value that can be unlocked if data-extraction file layout was improved.
3. RESEARCH QUESTIONS 3.1 As stated above, our main aim was to explore ways of improving our ability to track learners’ LN
performance across the institute. In exploring the three research questions outlined below, we consistently faced data-processing issues which exposed the limitations of the LNAT data-extraction file layout.
3.2 We explored three research questions which we outline below.
3.2.1 Research question 1: How do literacy and numeracy assessment tool (LNAT) scores for Māori, Pasifika, New Zealand Pākeha and Other ethnicities compare from inception in 2010 to December 2014? This question is addressed in Sub-report 1 (Greyling, 2015a).
3.2.2 Research question 2: How would a change (i.e. introducing a time factor) to the third formula
used in calculating the statistical significance of gain scores (TEC, 2012) impact on progress calculations for the period 2012 to 2014? This question is addressed in Sub-report 2 (Greyling, 2015b).
3.2.3 Research question 3: How could we link LN performance and course completions reported in
the institute’s official Student Data Return files submitted to TEC? This question is dealt with in Sub-reports 3 (Greyling, 2015c) and 4 (Greyling, 2015d).

Page 3 of 22
4. STRUCTURE OF THE FULL REPORT 4.1 The executive summary outlines the main research aim, research questions, research methodology
and methods, the main findings, a discussion and a conclusion, followed by a brief outline of our recommendations. Each research question is dealt with in a separate sub-report.
4.2 The sub-reports, included in the reference section under the author’s details, are the following:
Sub-report 1: Describing reading and numeracy assessments captured at a tertiary institute – Patterns of use for ethnicities, gender, as well as mother-tongue and non-mother-tongue speakers of English (2011-2014) (Greyling, 2015a)
Sub-report 2: Reflecting on literacy and numeracy progress measures for Māori, Pasifika, New Zealand Pākeha and other ethnicities at Waikato Institute of Technology (Wintec) for the period 2012-2014 (Greyling, 2015b)
Sub-report 3: Exploring the link between Literacy and Numeracy Assessment Tool (LNAT) performance and module completion, with specific reference to Māori, Pasifika, New Zealand Pākeha and other ethnicities (Greyling, 2015c)
Sub-report 4: Using LNAT data-extraction file variables in a binary logistic regression to predict module completion (Greyling, 2015d)
4.3 Each sub-report consists of the following components: An introduction linking the section to the
overall aim of improving tracking ability, as well as the institution-level focus on the LN performance of four ethnicities at the institute; the research question; the research methodology and research methods; the main findings; a brief discussion; a conclusion; and recommendations.
4.4 We use appendices to list statistical findings, mainly in clustered bar charts and layered cross-
tabulations. Where we were required to re-process data-extraction files, we provide additional information about data processing and cross-validation strategies.5
4.5 We also include a reference section. 5. RESEARCH METHODOLOGY AND RESEARCH METHODS 5.1 We adopted quantitative research methodology for this study. 5.2 Limitations of the data-extraction files: We noticed from the start that the LNAT data-extraction
files had the following limitations:
5.2.1 For any given data-extraction period, the assessment scores for all assessments (i.e. reading, vocabulary, numeracy and writing) appeared in the same column in the csv Excel file.
5.2.2 Applying the (TEC, 2014; 2012) guide-lines for identifying sequences of learner data (the so-
called sequence concept) meant that we could not ignore scores that had been obtained either at other organisations or within Wintec in the preceding years.
Page 4 of 22
5.2.3 The sequence concept proved to be unworkable, especially when learner scores obtained
from other organisations were considered – it was unknown whether these LN scores were relevant or not as there was no way that we could establish whether the three-month requirement had been met or not.
5.2.4 Filtering the data by Assessment Strand was useful to separate reading and numeracy scores, but each subset of data often had multiple scores per student, some of which had been obtained prior to the TEC’s most recent changes in exemption rules. Under the less stringent new rules (i.e. exemptions pegged at step 4 in reading and step 5 in numeracy), students who had previously not met the earlier exemption rules (i.e. step 5 in reading and step 6 in numeracy) had achieved exemption level scores on several occasions.6
5.2.5 The LNAT data-extraction files do not follow the requirements of multivariate layout.7 5.2.6 This led to our first finding: the LNAT data-extraction files required laborious manual coding
and restructuring to be useful in our search for a data-management system that not only allowed us to track LN performance for organizational and educational purposes, but also simplified our efforts to cross-validate TEC and Ministry of Education claims about LN progress at the institute.
5.2.7 More importantly, we believe that tertiary providers should have access to easily usable data
to cross-validate any TEC judgements about institutional LN performance which have funding implications.
5.3 Coding and restructuring the data set in generating multiple data sets: We approached the
process of coding and restructuring the data as follows:
5.3.1 To address research question 1, we downloaded all LNAT scores obtained by learners from inception to December 2014. We then filtered the data output file, isolating all reading and numeracy scores, and discarding scores for other strands. We then created two data sets, one for reading and another for numeracy. For each data set, we added two coding categories to be able to distinguish among the scores in the data set. For each learner, we entered the following coding labels (5.3.2 and 5.3.3) in separate columns in each csv Excel file.
5.3.2 Exemption-level categories:
o Category 1 score = initial score at exemption level o Category 2 score = initial score, below exemption level o Category 3 score = progress score at exemption level o Category 4 score = progress score, below exemption level
5.3.3 Pre/post progress score categories:
o Category 1 score = initial score as baseline o Category 2 score = next highest score
Page 5 of 22
o Category 3 scores = redundant next scores (single scores in the data set, as well as scores lower than the category 2 score)
5.4 Matching LNAT data-extraction files and SDR data: For research questions 2, we developed
separate data sets in the following ways:
5.4.1 For research question 2, we sorted the reading and numeracy data sets generated for research question 1 in terms of the pre/post progress score categories. We eliminated all category 3 scores, which left us with pairs of initial and progress scores per student. We then sorted the scores by pre/post progress score categories, followed by our placing the category 2 block of scores alongside the category 1 scores. We next checked category 1 and category 2 scores, per learner, to ensure they were aligned and matched as required by a multivariate layout. We developed two primary data sets, one for reading and another for numeracy.
5.4.2 For research question 2, we next prepared four copies of each /matched data set to calculate
gain for three scenarios.8 Data set 1 replicated the TEC’s (2012) methodology. For data sets 2, 3 and 4, we argued that Reder’s (2012) view that literacy development is a slow process requiring 5-6 years to show significant gain,9 was adequate evidence that we could explore the impact of time on LN development. We explored base periods of gain for two periods within the 5-6 year period, and a third period a year beyond Reder’s period (i.e. 6 years + 1).10
5.5 Creating categories of completion from SDR data – binary variables: For research question 3, dealt with in Sub-reports 3 and 4, we reasoned that we could explore how the level of LN performance was associated with course (module) completions. We viewed module completions as a potential classification variable in our data sets. By classification variable, we mean learner course completions. 5.5.1 Pass (=1) meant that a learner had successfully completed all modules for the period of
analysis (in our case, 2012-2014). 5.5.2 Fail (=0) meant that a learner was unsuccessful in one or more of the modules for the period
of analysis (2012-2014).
5.6 Creating a multinomial classification variable: When we processed the SDR data, we soon realized that a more differentiated account of the results was needed and we then created the following categories to capture different levels of successful module completions (as a column of codes in the csv Excel file):
o Category 6 Completion: 100% completion of modules o Category 5 completion: >or= 70%, but less than 100% completion o Category 4 completion: : >or=50%, but less than 70% completion o Category 3 completion: >or=30%, but less than 50% completion o Category 2 completion: >or= 0%, but less than 30% completion o Category 1 completion: No completions
5.7 Research methods: We applied the following research methods to make sense of the data and generate findings that would allow us to respond to the research questions:
Page 6 of 22
5.7.1 Layered cross-tabulations and clustered bar charts were used to show the category membership for several interacting variables (i.e. two or more) in the same graphic or tabular layout.11 Cross-tabulations (also known as contingency or pivot tables) therefore allow us to show how the frequencies for two or more variables are distributed in relation to each other. For example, we may want to know how many female learners (i.e. gender variable) of Maori origin (i.e. the ethnicity variable) obtained a step 6 (the initial reading score variable). Cross-tabulations allow us to explore how these variables are distributed.
5.7.2 Excel functions were used to replicate the TEC progress measure algorithm (TEC, 2012). We used Excel functions to replicate the steps in the formulae (formulae 1 to 3). We also used if-then-else statements to label the statistically significant gain categories (yes = 1 and no=0) in the csv file.
5.7.3 Descriptive statistics were calculated for different variables, including frequencies of categorical data in cross-tabulations and clustered bar charts. For scale scores for both reading and numeracy, we calculated means and standard deviations, where relevant.
5.7.4 Chi-square analysis was used to explore the level of association between LN step level and module completion categories, both for a binary classification variable (Pass/Fail levels of module completion) and a multinomial classification variable (Six levels of module completion).
5.7.5 Binary logistic regression was used to explore whether ethnicity, gender, English as a first language and LN scale score could be used as predictors of course category completions. We adhered to the statistical assumptions for this kind of multivariate analysis, interpreting our findings with caution. Our purpose was to establish what the efficiency was of the categorical variables in predicting membership of the Pass/Fail levels of the module completion category.
5.7.6 Multinomial logistic regression was used to explore whether ethnicity, gender, English as a first language and LN scale score could be used as predictors of the six levels of course category completions. Sample size prompted us to abandon this analysis.
5.8 Data sets: For this research project we collated and processed the following data sets:
5.8.1 Data set 1 Research question 1: Reading assessments, including re-coded data as outlined in 5.3.2 and 5.3.3 above. The data set covered reading assessments obtained at the institute from inception to December 2014.
5.8.2 Data set 2 Research question 1: Numeracy assessments, including re-coded data as outlined in 5.3.2 and 5.3.3 above. The data set covered numeracy assessments obtained at the institute from inception to December 2014.
5.8.3 Data set 3 Research question 2: Matched pre/post reading assessment scores for learners, targeted in the institute’s SDR files for the period 2012 to 2014.
5.8.4 Data set 4 Research question 2: Matched pre/post numeracy assessment scores for learners, targeted in the institute’s SDR files for the period 2012 to 2014.

Page 7 of 22
5.8.5 Data set 5 Research question 3: A sample of 1000 learners, randomly selected from all ethnicities and step categories, taken from Data set 3 above, with Completion categories added, as outlined in 5.5 and 5.6 above.
5.8.6 Data set 6 Research question 3: A sample of 1000 learners, randomly selected from all ethnicities and step categories, taken from Data set 4 above, with Completion categories added, as outlined in 5.5 and 5.6 above.
6. FINDINGS & DISCUSSION PER RESEARCH QUESTION 6.1 Reporting our findings: We outline our findings with two focal points in mind.
6.1.1 First, we refer to how the functionality of the LNAT may be changed to enable the tertiary
sector to unlock the considerable value in LN performance data. 6.1.2 Second, we deal with the findings related to the research question. Each of these questions,
we reasoned, was important to the institute as we were interested in tracking the LN performance of vulnerable and non-vulnerable groups alike. The institute is committed to pursuing the imperatives of the Tertiary Education Strategy (2014-2019), with specific reference to boosting achievement for Māori and Pasifika learners (strategic priority 3), improving literacy and numeracy skills for adults (strategic priority 4) and building research-informed capability at the institute (strategic priority 5).
6.2 Findings for research question 1: Reading assessments from inception to December 2014: In the
report so far, we have referred to the functionality in the LN assessment tool. Our observations have related to the challenges we faced in data management and data processing. We go directly to these points in the discussion.
6.2.1 Frequency of use & threshold exemptions achieved (from 2010-2014): We focused on threshold exemptions, showing how these scores were distributed for our target populations.
o Comparing Gender x Ethnicity and Threshold Exemption (Sub-report 1 [Greyling, 2015a],
Appendix A): These findings capture the number of assessments completed at the institute and include multiple assessment scores per learner. Threshold exemptions were coded as 1 and non-exemptions as 0.12
Reading (See Sub-report 1 [Greyling, 2015a], Appendix B, Table 1, as well as Figures 1[a] and 1[b]): Comparing the percentages per ethnicity, we found that
o Pākeha males and females achieved more threshold exemptions than non-exemptions.
o Māori, Pasifika and Other ethnicities (males and females) obtained fewer threshold exemptions than non-exemptions.

Page 8 of 22
o Pākehā and Māori females outperformed their male counterparts, obtaining 5% and 8.9% more threshold exemptions respectively.
o Pasifika and Other ethnicities (males) outperformed their female counterparts, obtaining 1.7% (marginal) and 7.8% more threshold scores respectively.
Numeracy (See Sub-report 1 [Greyling, 2015a], Appendix B, Table 2, as well as Figure 2[a] and 2[b]): Comparing percentages per ethnicity, we found that
o Pākehā and Other ethnicities (males) achieved more threshold exemptions than non-exemptions.
o Pākehā females, Māori (males and females), Pasifika (males and females) and Other Ethnicities (females) achieved fewer threshold exemptions than non-exemptions.
o Pākehā females are less at risk than Māori and Pasifika learners (both genders). o Māori and Pasifika females are significantly more at risk than their male
counterparts, producing more than 12% fewer threshold exemptions in numeracy.
o Comparing English as a First Language x Ethnicity x Threshold exemption: Here we have to note Lane’s (2014) observations about the variability in the 2011, 2012 and 2013 data sets for English as a first language. We echo his caution in this section13.
Reading [See Sub-report 1 [Greyling, 2015a], Appendix C, Table 1, as well as Figures 1[a] and 1[b]): Comparing percentages for ethnicities, we found that
o Pākehā learners who were either mother-tongue or non-mother tongue speakers, outperformed all groups on threshold exemptions.
o Of the Pākehā group, more than 60% who were categorised as either non-mother-tongue or mother-tongue speakers of English, achieved threshold exemptions.
o Māori, Pasifika and Other Ethnicities who were either mother-tongue or non-mother-tongue speakers of English, achieved fewer threshold exemptions than non-exemptions.
o Māori, Pasifika and Other Ethnicities recorded as mother-tongue speakers of English achieved more threshold exemptions than their non-mother-tongue counterparts.
Numeracy (See Sub-report 1 [Greyling, 2015a], Appendix C, Table 2, as well as Figures 2[a] and 2[b]): Comparing percentages for ethnicities, we found that
o Pākehā and Other ethnicities who indicated that they were either mother-tongue or non-mother-tongue speakers of English recorded a significantly larger number of threshold level exemptions than either Māori or Pasifika learners.
o Comparing Threshold Exemptions x Ethnicity x Score Categories
Reading (Sub-report 1 [Greyling, 2015a], Appendix D, Table 1, as well as Figure 1[a] and 1 [b]): Comparing percentages per ethnicity, we found that threshold level exemptions were achieved in
o 41.7% of assessments completed by Māori learners o 32.9% of assessments completed by Pasifika learners o 61.3% of assessments completed by New Zealand Pākehā learners o 37.1% of assessments completed by Other ethnicity learners
Page 9 of 22
Numeracy (Sub-report 1 [Greyling, 2015a], Appendix D, Table 2, as well as Figure 2[a] and 2[b]): Comparing percentages per ethnicity, we found that threshold level exemptions were achieved in
o 36.9% of assessments completed by Māori learners o 36.7% of assessments completed by Pasifika learners o 55.4% of assessments completed by Pākehā learners o 50% of assessments completed by Other ethnicity learners
o Comparing Pre/Post Scores, Ethnicity and Threshold Exemptions o Our primary aim in introducing the Pre/Post category was to identify the matched
pairs of scores in the reading and numeracy data sets for 2012 to 2014. The sequence concept then reminded us that scores obtained earlier than 2012 could still be relevant.
o Two perspectives seemed to be relevant. On the one hand, we could view the LNAT as a developmental tracking tool to be used at regular intervals to gauge learner progress. This would explain the significant number of redundant non-exemption category 3 scores in the data set. On the other hand, we could also see category 3 scores as evidence of inefficiency and over-assessment, or the result of changes in threshold exemption rules.
o The redundant assessment category 3 scores also included learners who obtained exemption level scores and who were assessed only once. More research would be required to make sense of this significant number of redundant assessments (with approximately 25% of the total assessed when not required).
6.3 Discussion
6.3.1 Data-processing challenges: As stated earlier, our overall aim was to improve our tracking capability. We realized in responding to research question 1 that the process was challenging. We adopted the following views:
o To make sense of, and retain all data in the data set, we systematically had to code the assessment scores so that these labels could distinguish among different assessments for each individual.
o To identify start and finish assessments within the data sets, we developed a coding
system that allowed us to label the status of any given assessment score. We had to follow this procedure to re-order and re-structure the data to follow a multivariate layout (See 5.3.2 and 5.3.3, as well as 5.5 and 5.6 above).
o Developing and implementing the coding system required a significant amount of
time to be allocated to line-by-line coding and cross-validation of the accuracy of the coding; thus, we soon realized that we were unable systematically to process LN assessment data in the current data-extraction file layout because the functionality

Page 10 of 22
was not available within the LN assessment tool, nor did the data-extraction file layout meet data-layout requirements.
o To render data sets usable, users currently have to restructure and manually code
data. o The data layout and labelling probably represent the biggest challenge: all scores,
whether start, progress or otherwise, are listed in one column in the data file, and if multiple assessments, completed by a learner at another organization, are marked as “Reading Assessment” and “Numeracy Assessment”, re-coding is required to distinguish different instances of the same assessment strand for that student. These scores are relevant for two reasons, to avoid over-assessment, and to apply the sequence concept.
o The data-extraction file does not follow a multivariate layout, which means that start
and progress assessment scores in the file have not been assigned to separate columns in the csv Excel file, nor are data per student confined to a single row in the csv Excel file.
o The implication is that the kinds of analyses we have performed on the full data set
(LN data from inception to December 2014) could only be performed once we had created and applied significant data coding.
o Institutes wanting to track their learners’ performance are required to engage in a
manual coding process to set up data sets for checking on learners’ performance. o Highest second score was not always the most recent instance (especially for learners
who had been assessed more than 10 times). o Checking on threshold exemptions remained a manual process – once a student
achieved a threshold exemption level score, the LNAT did not warn the user that the student was exempt.
6.3.2 Research question 1: Discussion of findings
o Our purpose was to develop tracking capability which would be immediate at any given moment when a data-extraction file was downloaded from the LNAT website. The reason for this institutional need was, and remains, that LN performance is high stakes for tertiary providers. If we are unable to generate tracking data within a short period of time, our responses are delayed and our responsiveness to learner needs and TES imperatives impaired.
o In Sub-report 1, we illustrate the capability we would like to see available at a
moment’s notice. The current data-extraction file layout does not allow quick processing.

Page 11 of 22
o Although our findings confirm national trends, according to one of the reviewers of this research, we are not aware of any such research for individual tertiary providers in the tertiary sector. Even if we know the national trends (Lane, 2014; 2012), we are unable to confirm whether those are reflected in our local student population. An institute-level perspective could be most useful in responding to trends that reflect or are contrary to national trends.
o It is useful for the institute, for example, to confirm that, for its population of
students, o Māori and Pasifika students (male and female) achieved fewer threshold
exemptions in both reading and numeracy than their New Zealand Pākeha counterparts;
o New Zealand Pākeha and Māori female learners outperformed their male counterparts in reading; and
o Māori and Pasifika female learners are more at risk than their male counter-parts, producing 12% fewer threshold exemptions.
o We have illustrated how cross-tabulations for gender, ethnicity, English as a first
language and threshold exemptions may allow us to explore how these variables are related.
6.3.3. Findings for research question 2: Reflecting on progress measures for Māori, Pasifika, New Zealand Pākeha and other ethnicities for the period 2012-2014 – Introducing a time variable
o Introducing a time-lapse variable. Our key findings were that
o If formula 3 of the gain calculation algorithm for calculating statistically significant gain (TEC, August 2012, 21) were modified to include a time factor as indicated below, a more positive – and more motivating – picture of tertiary learners’ LN performance would be generated.
o We propose a change to formula 3:
o Formula 3: Calculation of the statistical significance of the gain score
o Gain is statistically significant when gain score is positive and Gain score > Gain Score error x 1.645 x time factor (expressed as a proportion). [Our addition in bold]
o the time-lapse variable is calculated as the number of days between
assessments (numerator) divided by the number of days for the base year (denominator), which meant one of the following: a four-, five- or seven-year period.
o The three scenarios yielded the following results:
Page 12 of 22
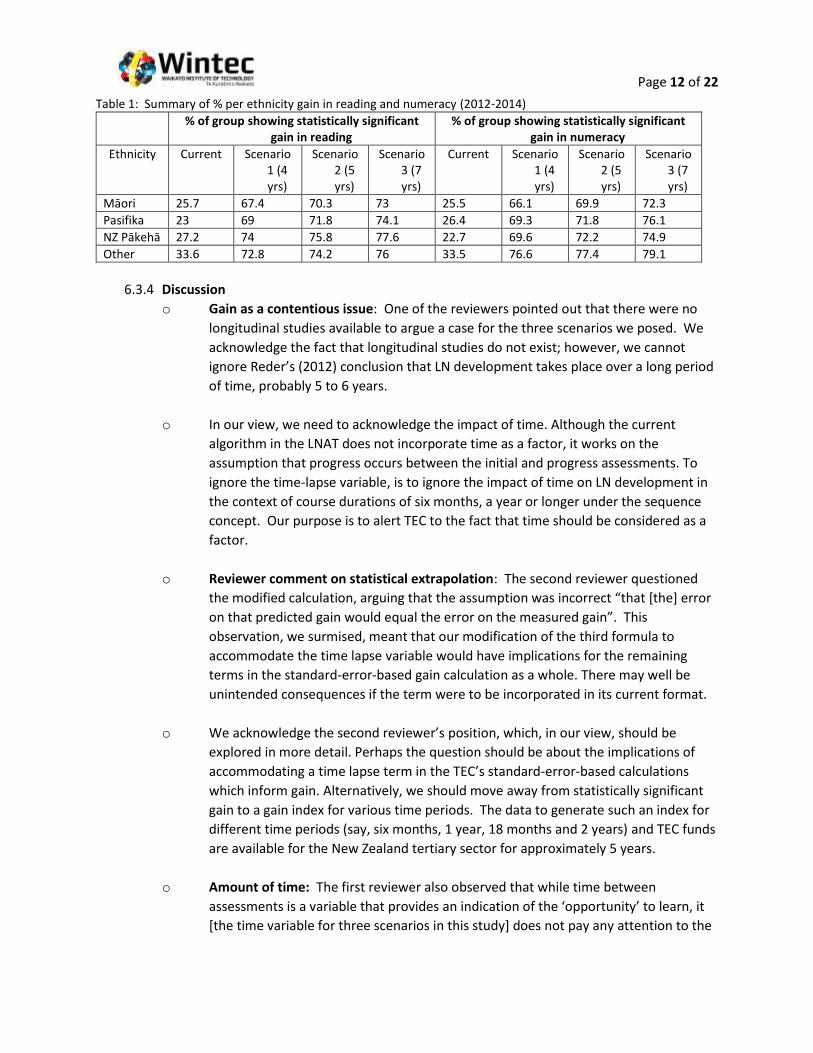
Table 1: Summary of % per ethnicity gain in reading and numeracy (2012-2014)
% of group showing statistically significant gain in reading
% of group showing statistically significant gain in numeracy
Ethnicity Current Scenario 1 (4 yrs)
Scenario 2 (5 yrs)
Scenario 3 (7 yrs)
Current Scenario 1 (4 yrs)
Scenario 2 (5 yrs)
Scenario 3 (7 yrs)
Māori 25.7 67.4 70.3 73 25.5 66.1 69.9 72.3
Pasifika 23 69 71.8 74.1 26.4 69.3 71.8 76.1
NZ Pākehā 27.2 74 75.8 77.6 22.7 69.6 72.2 74.9
Other 33.6 72.8 74.2 76 33.5 76.6 77.4 79.1
6.3.4 Discussion
o Gain as a contentious issue: One of the reviewers pointed out that there were no
longitudinal studies available to argue a case for the three scenarios we posed. We
acknowledge the fact that longitudinal studies do not exist; however, we cannot
ignore Reder’s (2012) conclusion that LN development takes place over a long period
of time, probably 5 to 6 years.
o In our view, we need to acknowledge the impact of time. Although the current
algorithm in the LNAT does not incorporate time as a factor, it works on the
assumption that progress occurs between the initial and progress assessments. To
ignore the time-lapse variable, is to ignore the impact of time on LN development in
the context of course durations of six months, a year or longer under the sequence
concept. Our purpose is to alert TEC to the fact that time should be considered as a
factor.
o Reviewer comment on statistical extrapolation: The second reviewer questioned
the modified calculation, arguing that the assumption was incorrect “that [the] error
on that predicted gain would equal the error on the measured gain”. This
observation, we surmised, meant that our modification of the third formula to
accommodate the time lapse variable would have implications for the remaining
terms in the standard-error-based gain calculation as a whole. There may well be
unintended consequences if the term were to be incorporated in its current format.
o We acknowledge the second reviewer’s position, which, in our view, should be
explored in more detail. Perhaps the question should be about the implications of
accommodating a time lapse term in the TEC’s standard-error-based calculations
which inform gain. Alternatively, we should move away from statistically significant
gain to a gain index for various time periods. The data to generate such an index for
different time periods (say, six months, 1 year, 18 months and 2 years) and TEC funds
are available for the New Zealand tertiary sector for approximately 5 years.
o Amount of time: The first reviewer also observed that while time between
assessments is a variable that provides an indication of the ‘opportunity’ to learn, it
[the time variable for three scenarios in this study] does not pay any attention to the
Page 13 of 22
‘amount of time’ that the learner spent on the programme. For example, was it a
part-time or full-time programme?
o Our response is that the reviewer is correct. The reviewer’s observation reinforces
our argument. The current TEC algorithm does not explicitly take time into account at
all; however, it measures LN progress nonetheless (for specific time frames of
courses). The proposal we are tabling is an attempt to accommodate the time-lapse
variable. How we reliably measure what the first reviewer refers to as the “amount of
time spent on LN” on a programme is indeed a question we should be asking.
o In our data collection, we worked with data available within the institute’s official
data sets (SDR and LNAT) – we did not work outside them. For example, the time
lapse variable can be calculated by considering assessment completion dates.
o Prompted by recent publications on tracking learner performance (Coolbear and
associates, 2012), and doing better for both Māori (TEC, 2013) and Pasifika (TEC,
2014a), we believe we should take a far more holistic view which allows us to
consider a much wider range of variables that impact on LN progress and course
completions. These variables should perhaps include culture-specific variables,
significant life events, high-risk life styles and socio-economic status. We note in sub-
report 4 that gender, ethnicity, English as a first language, and Reading or
Numeracy scale score explain a very modest 6% to 10% of the variability on the
binary Pass/Fail module completion variable.14
o Progress at institute level: The first reviewer also observed that “if you assume that
learning continues post program [sic] then you must also assume that many learners
entering the TEO will still be making ‘gains’ from previous programmes (at school or
other TEOs).” Our response is that this is indeed the case. Current learning, in our
view, is the launch-pad for future LN development, while past learning was the
launch-pad that got us where we are now; hence, our belief that the first score in the
LNAT data base should be used as the baseline and the next highest score as progress
assessment.
o Progress calculations are contentious: The main argument against pre-post
research designs is that one cannot unequivocally attribute statistically significant
gain to a specific intervention such as embedded literacy and numeracy teaching. A
host of other factors, including natural growth, might have had an effect. For this
reason, we strongly support Lane (2014) when he identifies “careful statistical
modelling” as “anticipated … [and] … an important part of future research in the
Ministry’s work on literacy, language and numeracy” (Lane, 2014, 11). This is a
much-needed research focus.
o Our assumption is that a range of variables underpin LN development and LN
performance. By implication, any pre-post-course LN progress calculation will be an
Page 14 of 22
oversimplification of a host of interacting variables that impact on literacy
development.
6.3.5 Findings for research question 3: Linking literacy and numeracy performance and course
completions
o Linking initial steps, scale scores and module outcomes: Our key findings in Sub-
reports 3 (Greyling, 2015c) and 4 (Greyling, 2015d) were that
o the absence of an interface between the institute’s student management system and the TEC’s LNAT website makes data-matching between Student Data Return (SDR) data and LNAT performance data challenging.
o the format of SDR completion data for the targeted students15 showed that
various levels of completion were present; hence, our creating a Module Completion variable consisting of six levels of completion (1= zero module completions; 2= >1%<30%; 3= 30%-49%; 4= 50%-69%; 5=70%-99%; 6= 100% completions).
o all learners’ academic performance should be tracked because a significant
number of learners who had achieved threshold-level exemptions in reading and numeracy did not complete their modules.
o a diversified view of module completions (six levels referred to above), cross-
tabulated with initial step level scores, raised our awareness that both at-risk non-threshold-level students (at steps 1, 2 and 3 in reading and steps 1, 2, 3, and 4 in numeracy), and ostensibly not-at-risk threshold exemption learners should be tracked.
o layered cross-tabulations and clustered bar charts provided useful information
about learners’ initial step levels and module completion; however, to be able to track these, the functionality of the LNAT requires change, and/or data-extraction files have to follow a multivariate layout to allow LNAT users to analyse the data more easily, and/or an appropriate interface between LNAT users’ student management systems and the LNAT website has to be designed which incorporates such functionality.
o a focus on at-risk students, typical of a deficit model, should be resisted; a
comprehensive module-completion tracking plan for ALL students is needed for the institute.
o a chi-square analysis16 of the Module Completion variable (6 levels), cross-
tabulated with initial step score, showed a statistically significant level of association between the assessment strand and module completion category for both the reading (n=1000) and numeracy samples (n=1000).
Page 15 of 22
o in preparing for a multinomial logistic regression17 (with the classification variable the six-level Module Completion variable), we cross-tabulated the variable with gender (2 levels) and ethnicity (4 levels) – the chi-square analysis yielded a warning that a significant number of cells in the table (more than 20%) had either too few or no observations. This prompted us to abandon a multinomial regression for a binary logistic regression18 (with Module completion 1 = 100% completed; and all others = 0).
o for the binary logistic regression (using a dichotomous module completion
variable, 1= complete; and 2= incomplete), we found that although the categorical variables, Gender and Ethnicity, and the continuous variable, Initial Scale Score, had low probabilities, the Cox and Snell R2 and the Nagelkerke R2 values showed that the model for reading improved the prediction model by 7% to 9.4%, while the model for numeracy improved by 7.7%-10.3%19.
o sample size and low Cox and Snell R2 and the Nagelkerke R2 values prompted
us to view these findings with caution. o larger sample sizes than the reading sample (n=1000) and the numeracy
sample (n=1000) were needed.
o richer data sets, as suggested by our second reviewer, were needed to build multivariate statistical models.
7. CONCLUSIONS
We concluded that
o To unlock the educational value of the LNAT, TEC would have to conduct a comprehensive review of its functionality and the data-extraction file layout.
o We showed that the current data, once unlocked, can provide detailed findings that may be
used by institutes to build their responsiveness to at least three strategic priorities in the Tertiary Education Strategy (2014-2019), namely strategic priorities 3, 4 and 5.
o The current LNAT data-extraction file layout is a barrier to the tertiary sector’s use of LNAT collected LN performance data, and therefore inhibits the sector’s responsiveness to strategic priorities in the Tertiary Education Strategy (2014-2019).
o The current LNAT functionality, the LNAT data-extraction file layout, variable labelling in the LNAT data-extraction files, and lack of enrolment data from other organisations are barriers to tracking LN performance at ITP level.
o On further reflection and the reviewers’ comments on the contentiousness of statistical extrapolation, we reasoned that a Gain Index for different course durations and TEC funds could be considered based on 5 years of longitudinal LNAT data.
Page 16 of 22
o The usefulness of these findings are illustrated in the detailed appendices of four Sub-reports attached to this Executive Summary (Greyling, 2015a, b, c and d).
8. RECOMMENDATIONS Our recommendations are outlined below:
8.1 Recommendations based on Sub-report 1 (Greyling, 2015a) o Review the data-extraction file layout: We recommend a review of the LNAT data-extraction
file layout, taking the following options into account:
o Option 1 - Develop a multivariate layout for LNAT data-extraction files: By this we mean that only two scores appear in any data-extraction file: initial score and highest next score. We could add a third set, most recent score, as a comparison. This layout would have any given learner’s data displayed in a single row, with LN scores allocated to separate columns in the csv file. The advantages would be the following:
The data set would be far more accessible than is currently the case. LN performance tracking would be much easier and quicker. These analyses could be performed with pivot-table functions in Excel which is
available to the large majority of providers. Developing this functionality would imply (potentially) that the sequence
concept is not applied as stringently as outlined in the TEC guidelines (TEC, 2014; 2012).
Data management is simplified, allowing us to focus on the most positive account of LN performance. Selecting the next highest score to calculate progress errs on the side of providers, given that the low-stakes status of the LNAT may have a negative impact on student LN performance.
Tracking and validating LN performance become much easier, allowing both TEC and providers to be precise when LN-funding is tracked.
o Option 2 - Retain all data, but add coding categories for processing multiple scores:
This less desirable option would mean that the current layout is retained, but for any given learner scores would be labelled as Initial score, Next Highest Score and Exemption/Non-exemption Score. Although we are retaining all data, we would still have to unscramble multiple scores per learner, having to re-arrange data so that for any given learner all data appeared in the same row in the Excel file.
o Make SDR data (from other providers) available for learners who have been assessed elsewhere o To track students and to cross-validate TEC claims about providers’ performance all
relevant SDR data for any given learner should be accessible to the organisation at which such a student is currently enrolled.
o Rationale:
o Cascading impact on resources in the sector: We see the review of the LNAT
functionality as urgent. In the current format of the data-extraction file, tertiary

Page 17 of 22
providers have to perform coding and restructuring of data for tracking purposes. The implication is that significant resources are used in the sector (in multiple sites) to perform a data-management task that could be dealt with at the source. This resource demand, posed by the data-extraction file layout, cascades through the sector. Why would one incur a cost in multiple settings if a once-off review and change to the data-extraction file would make the data more usable?
o Tracking and responsiveness to learner needs will be enhanced: To enable tertiary
providers to address the imperatives of the Tertiary Education Strategy (2014-2019) more effectively and efficiently, we believe that a review of the functionality of the LN assessment tool and its data-extraction file layout is urgently required.
8.2 Recommendations based on Sub-report 2 (Greyling, 2015b) o Consider the impact of time on LN development: Although the second reviewer of this
research has taken the view that the formula used is a contentious form of statistical extrapolation, we recommend that the shortest base period (say, 3 or 4 years) be considered to accommodate time as a variable. Or alternatively, that the impact of the time variable (whether time lapse and/or time spent on LN on a course) be accommodated in the calculation of gain.
o Consider a gain index based on longitudinal data: The second reviewer’s comments about statistical extrapolation prompted our reflecting on the usefulness of replacing the statistically significant gain calculation (TEC, 2012) with a gain index for different time periods based on longitudinal data for different course durations and funds.
o Consider other variables for progress calculations: We have noticed anecdotally that other
variables such as culture-specific variables, significant life events, socio-economic status, perceptions of self-efficacy and high-risk life styles impact on learner performance. These would also include the first reviewer’s “time spent on LN in a programmme”.
8.3 Recommendations based on Sub-reports 3 (Greyling, 2015c) and 4 (Greyling, 2015d)
o Consider reviewing the functionality within the LNAT, as well as its data-extraction file layout,
as described above.20 o Establish an interface between the LNAT website and institutes’ student management
systems: Such an interface would make data matching easier than is currently the case. o Create levels of course completions in SDR data: If (1) an interface were to be created between
the LNAT website and institutes’ student management systems, and (2) module completion data could be allocated to six levels of completion, institutes would be able to pursue comprehensive tracking of module completions against LNAT performance. Once an SDR file is submitted, institutes should be able to cross-tabulate course completions (referred to as module completions in this report) and LNAT performance data.
o Consider a multivariate layout and build functionality for multivariate analysis of LNAT data to
be accessed by the sector. Lane (2014) refers to this as a TEC and Ministry of Education priority.

Page 18 of 22
Anecdotally, we sense that additional data such as significant life events, high-risk lifestyles, perceptions of self-efficacy and socio-economic status would most likely allow the sector to track and respond more effectively to learner-related variables that impact on their and institutes’ performance.

Page 19 of 22
REFERENCES
Coolbear, P. & associates (2012).Lifting our game: Achieving greater success for learners in foundational tertiary education. Report of the Priority Learners Educational Attainment Working Group. Ako Aotearoa National Centre for Tertiary Teaching Excellence: Wellington.
Field, A. (2005). Discovering statistics using SPSS. Sage Publications: London. Greyling, W.J. (2015a). Sub-report 1 - Describing reading and numeracy assessments captured at a
tertiary institute – Patterns of use for ethnicities, gender, as well as mother-tongue and non-mother-tongue speakers of English (2011-2014).
Greyling, W.J. (2015b). Sub-report 2 - Reflecting on literacy and numeracy progress measures for Māori, Pasifika, New Zealand Pākeha and other ethnicities at Waikato Institute of Technology (Wintec) for the period 2012-2014
Greyling, W.J. (2015c). Sub-report 3: Exploring the link between Literacy and Numeracy Assessment Tool (LNAT) performance and module completion, with specific reference to Māori, Pasifika, New Zealand Pākeha and other ethnicities
Greyling, W.J. (2015d). Sub-report 4: Using LNAT data-extraction file variables in a binary logistic regression to predict module completion
IBM SPSS (Version 22) (2014). Retrieved from http://www-01.ibm.com/software/analytics/spss/products/statistics/upgrade.html
Lane, C (2014). Literacy and numeracy assessments of adult English language learners. Ministry of
Education. Retrieved on 09 February 2015 from the following URL: http://www.educationcounts.govt.nz/publications/literacy/literacy-and-numeracy-assessments-of-adult-english-language-learners
Lane, C. (2012). Assessing skills of learners in 2011. Ministry of Education, NZ. Retrieved on 09
February 2015 from the following URL: http://www.educationcounts.govt.nz/publications/literacy/assessing-skills-of-adult-learners-2011
Ministry of Education (MoE)(2014). Tertiary Education Strategy: 2014-2019, retrieved from
http://www.education.govt.nz/further-education/policies-and-strategies/tertiary-education-strategy/
Reder, S., 2012. Research brief. The longitudinal study of adult learning: Challenging assumptions. Montreal: The Centre for Literacy/Le centre d’alphabétisation. http://www.centreforliteracy.qc.ca/publications/researchbriefs
Tableau Software (Version 9) (2015), available at URL: www.tableau.com.
Tertiary Education Commission (Draft Consultation) (TEC) (2015a) Literacy and numeracy implementation strategy 2015-2019. Retrieved from http://www.tec.govt.nz/Tertiary-Sector/Reviews-and-consultation/Literacy-and-Numeracy-Implementation-Strategy-update/
Tertiary Education Commission (TEC) (2012).Indicators for literacy and numeracy provision and gain. Version 0.4, August 2012. Retrieved on 10 February 2015 from
Page 20 of 22
http://www.bing.com/search?q=Indicators+for+literacy+andnumeracy+provision&form=IE10TR&src=IE10TR&pc=HPNTDFJS
Tertiary Education Commission (TEC) (2013) Doing Better for Māori. Retrieved from http://maori-lit-review-2013.publications.tec.govt.nz/
Tertiary Education Commission (TEC) (2014a) DB4P Doing better for Pasifika. TEC National Office: Wellington, New Zealand.
Tertiary Education Commission (TEC) (2014b). Methodology for assessment tool usage. Version 1.0. October 2014. TEC National Office: Wellington, New Zealand.
Tertiary Education Commission (TEC) (Version 3.0) (2015b). Methodology for assessment tool usage for
Student Achievement Component, Intensive Literacy and Numeracy, Workplace Literacy and Youth
Guarantee.
Tredoux, C. (2002). Repeated measures analysis of variance. In Tredoux, C. & Durrheim, K. (eds) (2002).
Numbers, hypotheses & conclusions. A course in statistics for the Social Sciences. UCT Press: Cape
Town.
1 . Wintec would like to thank the Tertiary Education Commission (TEC) for financial support to complete this research project. Specifically, we express gratitude to Aroha Puketapu and David Do of TEC for their assistance. We would also like to thank the two external reviewers for their comments. These have been taken into account in finalising both the detailed sub-reports and the final report. We would also like to acknowledge mathematics colleague, Ken Louie, for his review of our reasoning in introducing a term into the third formula in TEC’s outline of how LN gain should be calculated. The main author would also like to thank the Director of the Centre for Foundation Studies, Margaret Naufahu, for advice on the structure and presentation of the report. However, the main author accepts full responsibility for the views expressed in this report.
2 . One of the external reviewers argued that this particular need was probably specific to the institute at which the research was conducted and that other providers would most likely have different needs; hence, a consultative process would have to be launched to establish what these diverse needs were. We want to clarify our view: data-extraction file layout and variable labelling are data-management issues which should be in the hands of data-management experts, computer programmers and research analysts at the Tertiary Education Commission (TEC) who take the primary responsibility for the tool as a high-stakes instrument (backed by reliability analyses and calibration studies) whose outputs are used in judging the sector’s performance and making funding decisions. The question is whether the sector has to be consulted if the LNAT data-extraction file layout clearly does not adhere to best practice in data management. Data requirements for repeated measures analyses are outlined in manuals for statistical analysis systems (Kinnear & Gray, 2011: 22-23) and quantitative research textbooks (Tredoux, 2002: 317).
3 The sequence concept (TEC, 2014; 2012) allows for LN progress assessments to occur across academic years and enrolments, provided that the time in between programme conclusion and next enrolment does not exceed the 90-day threshold period. This poses a significant tracking challenge, requiring tertiary providers not only to reach back into past enrolments and assessments, but also to anticipate that some learners’ statuses on progress assessments will only become known in future.
4 . Joining worksheets from the student management system and LNAT data-extraction files generated as many columns of data as there were assessment opportunities for any given student. These output files were unwieldy and unusable. Our challenge was to decide on initial assessment score and relevant next progress score. We eventually settled on first score as initial score and highest next score as progress measure.
5 . We include the details of the analysis for the sake of replicability. One of our concerns with data recoding was error. One of the benefits of cross-tabulations was that incorrectly coded categorical data showed up
Page 21 of 22
rather prominently in these analyses. We describe our data-validation strategy in Appendix A of Sub-report 1 (Greyling, 2015a).
6 . We worked with reading and numeracy scores only. We have misgivings about writing assessment scores, especially their reliability. One would expect somehow to develop a system where multiple markers independently assess the same written work so that interrater reliability coefficients can be calculated. The implication is that at least two raters should assess each writing assessment. Inter-rater reliability indices offer evidence of the level of agreement between raters, as well as the reliability of markers’ average ratings. As Kinnear and Gray (2011: 441-442) point out, such intra-class correlations are measures of reliability equivalent to alpha coefficient analyses.
7 . One of the reviewers questioned this particular view. To clarify, a multivariate layout refers to allocating the variables that are measured to separate columns in a data-output file. For example, all initial LNAT reading scores have to appear in the same column in the csv Excel file. The relevant LNAT progress scores should then appear in a separate column. In addition, each row in the data set should capture a single learner’s initial and progress scores. Whether in Excel or any other statistical software package, this layout is required to be able to perform statistical analyses associated with repeated measures (Kinnear & Gray, 2011: 22-23; Tredoux, 2002:317). Thus, the current layout is a barrier to tertiary providers who want to cross-validate TEC judgements about LN progress at the institute, or who may want to compare trends that are captured in Ministry of Education research reports.
8 . We argued that Reder’s (2012) research showed that literacy development, neither linear nor continuous, occurs over time. Indeed, the TEC (2012) methodology is based on the assumption that from the start to the end of a course, one would expect progress. We accept the assumption that progress is measured over time. There are several time-related requirements for initial and progress assessments in TEC LNAT use methodology (TEC, 2015b). We deem the time lapse variable as easy to implement: assessment submission dates and times are already in the LNAT data-extraction file, unlike the time spent on LN on a programme, as suggested by one of the reviewers, which would require additional data input. We nonetheless acknowledge the reviewer’s perspective as useful.
9. One of the reviewers observed that introducing a time factor was contentious, with no evidence from longitudinal studies to support our reasoning for the three time periods we selected. We concede that this is the case; however, do we then disregard time as a factor? Our argument is simple: if time is a factor, let’s experiment with three scenarios. Two of the time periods (i.e. 4 and 5 years) were placed within the 5-6 year period referred to by Reder (2012), while the seven-year period took the base period as 6 years + 1.
10 . One of the reviewers argued that our progress experiment was a contentious form of statistical extrapolation. Our reasoning was that if period X = the time required to achieve gain, in this case the 5-6-year period referred to by Reder (2012), then the time lapse between initial and progress assessments could be expressed as a proportion. That proportion would then be the amount of gain we would expect for a proportion of the base period. We viewed a 4-year or 5-year period as well within Reder’s position. Our purpose was to illustrate that time lapse could be used in such an analysis. Interestingly, TEC have set LN progress targets of 25% for targeted non-exempted targeted learners (TEC, 2015a). To speculate, it would seem to us that if, say, 60% of learners are in the non-exempted level, then 25% of those would in fact represent 15% of the full population of targeted learners. That would then be well within current levels of LN performance. It would be interesting to know how this progress measure was derived, and whether the target was based on a pragmatic view of current LN performance. We acknowledge the second reviewer’s criticism that introducing a time lapse term could have unintended implications for the formulae in the gain calculation as a whole.
11 . Using cross-tabulations, one is in a position to explore the significance of levels of association between the targeted variables. Several statistical tests may be computed, which, if significant, allow us to generalise findings to the target population. Descriptive statistics (either frequencies for categorical data, or means and standard deviations for continuous data) might seem to be significant for one’s data set; however, to test whether levels of association are typical of the population or are statistically significant, one has to compute additional statistical tests such as chi-square analysis (for categorical data) (Field, 2005).
12 . All biographical variables were coded in columns adjacent to each string variable. These were easy to code using Sort functions. For example, Ethnicities were coded as Māori = 1; Pasifika = 2; New Zealand
Page 22 of 22
Pākeha = 3; and Other ethnicities = 4. Likewise, we coded gender (Female = 1; Male = 0) and English as a first language (Yes = 1; No = 0). We also coded threshold level status on reading and numeracy similarly (Achieved = 1; Not achieved = 0) using current threshold exemption rules.
13 . Lane (2014) discusses the variability encountered when he compared first language status for learners. He cautions that his (and anyone else’s) data sets might contain errors. Where we encountered codings such as “Unstated” or found inconsistencies in the “English as a first language” variable, we returned to enrolment data sets in the institute’s student data management system to make a choice. However, it has to be noted that this does not address Lane’s concern. We therefore echo his warning that our data too might suffer from the same limitations.
14 . There could be several reasons for this low percentage. For example, learners who failed 5% and 95% of their courses, were put into the fail level. We considered a six-level module completion category, but this prompted us to increase the sample size (which was not possible as we had run out of learners for various levels). We agree with our second reviewer, who accepted the research process and analyses we had adopted, but recommended that a richer data set (capturing more variables) be collected and a much larger sample size used. By implication, the reviewer agrees that reading and numeracy variables do not explain a significant proportion of the variance on the pass/fail classification variable.
15 . Targeted students in this context refer to students who obtained scores below the threshold levels in reading (step 4) and numeracy (step 5).
16 . Chi-square analyses are used to explore the extent to which categories of data, say ethnicity and module completion category, are related and whether the association can be generalised to the population.
17 . Multinomial logistic regression refers to a statistical procedure which computes the efficiency of a set of variables (categorical and/or continuous) to predict learners’ membership of various levels of a classification variable (as in this case, 6 levels of the module completion variable).
18 . Binary logistic regression is similar to a multinomial logistic regression, but for one difference: the classification variable has only two levels. In this study, we predicted membership of the Pass (=1) and Fail (=0) levels of the module completion category.
19 . These are statistical test values that relate to the efficiency of a set of variables to explain the variability on a classification variable, in our case, the two categories of Module Completion.
20 . A recommendation we made in the pre-final report, but omitted here, was that anyone achieving threshold competence (step 4 in Reading and step 5 in Numeracy) should be automatically excluded from further assessment. Our first reviewer rightly pointed out that some tertiary providers might want to track learner progress at these levels. The downside of the reviewer’s argument is that margins of error are usually much higher at the lower and upper ends of the reading and numeracy scales so that tracking progress for students who have been exempted is probably contentious from the point of view of the accuracy and reliability of gains at these levels. Our motivation for this recommendation was that we could avoid over-assessment if this functionality was available. It would also bring efficiency to the progress assessment process at the institute.